How to write a great paper in agricultural development and get it
22
AfJARE Vol 6 No 2 September 2011 Hugo De Groote 194 How to write a great paper in agricultural development and get it published HUGO DE GROOTE International Maize and Wheat Improvement Centre (CIMMYT), Nairobi, Kenya Research in agriculture, agricultural economics and rural development is essential if we are to find ways to feed the increasing population and reduce poverty. Yet much of this research goes unpublished. This paper proposes an effective way to increase publication productivity, based on regularly scheduled writing and a systematic method. It first explains how to schedule 25% of your working time for writing. It then describes the method, breaking down the writing task into five practical steps: develop a story line to describe new and important research; mold the story into a short outline, according to the basic structure of a scientific paper; assemble the evidence for a convincing case in relevant and well-organized tables and figures; write the first draft of the story; and, finally, rewrite and edit the draft for style and language. With careful targeting of good journals, and some luck in the reviewing process, the proposed method should lead to several publications each year. Keywords: research publishing; writing style La recherche dans les domaines de l’agriculture, de l’économie agricole et du développement rural est essentielle pour que nous trouvions des moyens de nourrir une population croissante et pour réduire la pauvreté. Cependant, une grande partie de cette recherche n’est pas publiée. Cet article propose un moyen efficace d’accroître la productivité en matière de publication, en se basant sur une écriture régulière et sur une méthode systématique. Il explique tout d’abord comment consacrer 25% de son temps de travail à l’écriture. Ensuite, il décrit la méthode en réduisant le travail d’écriture à cinq étapes pratiques : développer une trame pour décrire la recherche nouvelle et importante ; présenter l’histoire sous forme de plan clair et concis, selon la structure basique d’un article scientifique ; réunir les preuves pour une argumentation solide sous forme de tableaux et de figures appropriés et bien organisés ; écrire un premier brouillon de l’article ; et pour terminer, réécrire et reviser le brouillon pour corriger le style et le langage. En ciblant soigneusement les journaux de qualité, et avec un peu de chance dans le processus d’évaluation par les pairs, la méthode proposée devrait conduire à plusieurs publications par an. Mots-clés : publication de la recherche ; style d’écriture Correspondence: [email protected]
Transcript of How to write a great paper in agricultural development and get it

AfJARE Vol 6 No 2 September 2011 Hugo De Groote
194
How to write a great paper in agricultural development and get it published
HUGO DE GROOTE
International Maize and Wheat Improvement Centre (CIMMYT), Nairobi, Kenya
Research in agriculture, agricultural economics and rural development is essential if we are to find ways to feed the increasing population and reduce poverty. Yet much of this research goes unpublished. This paper proposes an effective way to increase publication productivity, based on regularly scheduled writing and a systematic method. It first explains how to schedule 25% of your working time for writing. It then describes the method, breaking down the writing task into five practical steps: develop a story line to describe new and important research; mold the story into a short outline, according to the basic structure of a scientific paper; assemble the evidence for a convincing case in relevant and well-organized tables and figures; write the first draft of the story; and, finally, rewrite and edit the draft for style and language. With careful targeting of good journals, and some luck in the reviewing process, the proposed method should lead to several publications each year.
Keywords: research publishing; writing style
La recherche dans les domaines de l’agriculture, de l’économie agricole et du développement rural est essentielle pour que nous trouvions des moyens de nourrir une population croissante et pour réduire la pauvreté. Cependant, une grande partie de cette recherche n’est pas publiée. Cet article propose un moyen efficace d’accroître la productivité en matière de publication, en se basant sur une écriture régulière et sur une méthode systématique. Il explique tout d’abord comment consacrer 25% de son temps de travail à l’écriture. Ensuite, il décrit la méthode en réduisant le travail d’écriture à cinq étapes pratiques : développer une trame pour décrire la recherche nouvelle et importante ; présenter l’histoire sous forme de plan clair et concis, selon la structure basique d’un article scientifique ; réunir les preuves pour une argumentation solide sous forme de tableaux et de figures appropriés et bien organisés ; écrire un premier brouillon de l’article ; et pour terminer, réécrire et reviser le brouillon pour corriger le style et le langage. En ciblant soigneusement les journaux de qualité, et avec un peu de chance dans le processus d’évaluation par les pairs, la méthode proposée devrait conduire à plusieurs publications par an.
Mots-clés : publication de la recherche ; style d’écriture
Correspondence: [email protected]
AfJARE Vol 6 No 2 September 2011 Hugo De Groote
195
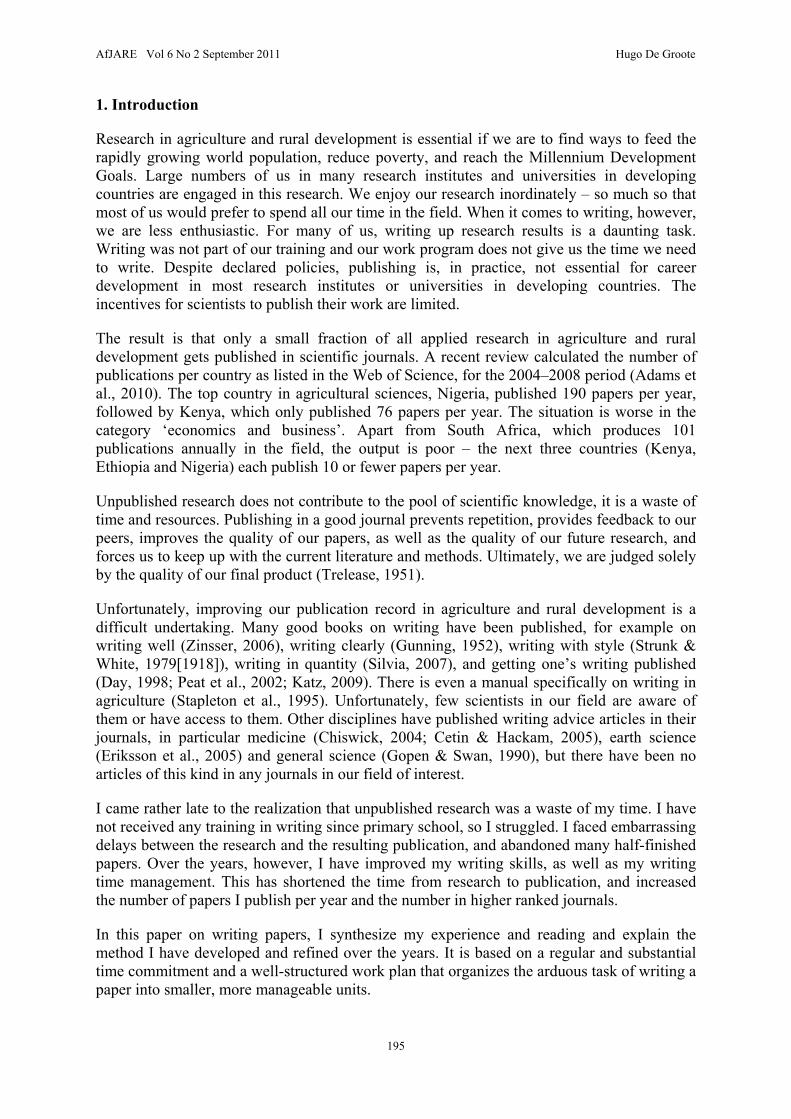
1. Introduction
Research in agriculture and rural development is essential if we are to find ways to feed the rapidly growing world population, reduce poverty, and reach the Millennium Development Goals. Large numbers of us in many research institutes and universities in developing countries are engaged in this research. We enjoy our research inordinately – so much so that most of us would prefer to spend all our time in the field. When it comes to writing, however, we are less enthusiastic. For many of us, writing up research results is a daunting task. Writing was not part of our training and our work program does not give us the time we need to write. Despite declared policies, publishing is, in practice, not essential for career development in most research institutes or universities in developing countries. The incentives for scientists to publish their work are limited.
The result is that only a small fraction of all applied research in agriculture and rural development gets published in scientific journals. A recent review calculated the number of publications per country as listed in the Web of Science, for the 2004–2008 period (Adams et al., 2010). The top country in agricultural sciences, Nigeria, published 190 papers per year, followed by Kenya, which only published 76 papers per year. The situation is worse in the category ‘economics and business’. Apart from South Africa, which produces 101 publications annually in the field, the output is poor – the next three countries (Kenya, Ethiopia and Nigeria) each publish 10 or fewer papers per year.
Unpublished research does not contribute to the pool of scientific knowledge, it is a waste of time and resources. Publishing in a good journal prevents repetition, provides feedback to our peers, improves the quality of our papers, as well as the quality of our future research, and forces us to keep up with the current literature and methods. Ultimately, we are judged solely by the quality of our final product (Trelease, 1951).
Unfortunately, improving our publication record in agriculture and rural development is a difficult undertaking. Many good books on writing have been published, for example on writing well (Zinsser, 2006), writing clearly (Gunning, 1952), writing with style (Strunk & White, 1979[1918]), writing in quantity (Silvia, 2007), and getting one’s writing published (Day, 1998; Peat et al., 2002; Katz, 2009). There is even a manual specifically on writing in agriculture (Stapleton et al., 1995). Unfortunately, few scientists in our field are aware of them or have access to them. Other disciplines have published writing advice articles in their journals, in particular medicine (Chiswick, 2004; Cetin & Hackam, 2005), earth science (Eriksson et al., 2005) and general science (Gopen & Swan, 1990), but there have been no articles of this kind in any journals in our field of interest.
I came rather late to the realization that unpublished research was a waste of my time. I have not received any training in writing since primary school, so I struggled. I faced embarrassing delays between the research and the resulting publication, and abandoned many half-finished papers. Over the years, however, I have improved my writing skills, as well as my writing time management. This has shortened the time from research to publication, and increased the number of papers I publish per year and the number in higher ranked journals.
In this paper on writing papers, I synthesize my experience and reading and explain the method I have developed and refined over the years. It is based on a regular and substantial time commitment and a well-structured work plan that organizes the arduous task of writing a paper into smaller, more manageable units.

AfJARE Vol 6 No 2 September 2011 Hugo De Groote
196
2. Overview: A systematic approach to scientific writing
The goal of scientific writing is to document your work for other scientists. To be noticed, your paper needs to be published in a good journal. Editors of scientific journals judge submissions on whether the content is new and interesting, whether correct methods are used, and whether the paper is well structured and well written. The main requirements for effective science writing are clear thinking, good organization, the appropriate use of tables and figures, and good style (Peat et al., 2002:8; Bourne, 2005). Fortunately, scientific writing is a well-defined technique rather than a creative art. It can be studied and improved though practice and feedback, but a systematic approach is needed. The essentials of a good writing strategy are regularly planned writing time and a systematic writing method.
For most of us, writing is hard work that takes time, and writing well takes even more time. Our professional lives are filled with field work, meetings, proposals, reports, students, and many petty distractions. We tend to spend our time first on urgent and important business, followed by urgent but not important business (Covey et al., 1995), postponing the important but not urgent business of scientific writing (Peat et al., 2002). Adequate writing time therefore needs to be planned as a regular routine – waiting for the moment when time will become available is futile. So, at the beginning of the work week, take your calendar and block out writing time, during working hours. Do not put off writing until the evening, weekend, or – worse – vacation. That time is reserved for more important things like family, friends and playing music.
Writing time needs to be regular, every week, even if the periods set aside are short. Studies have shown that regular periods of writing are more productive than ‘binge writing’ and also generate more fresh ideas (Silvia, 2007). So find times that work for you, and do not allow yourself to be distracted. Switch off the internet, leave your email offline, and avoid meetings and visitors. Your time is booked for an important activity and people should respect that, as they respect it when you are in a meeting.
Because of the distractions, a busy office may not be the best place for writing. Many productive authors write at home, often with very regular schedules, such as 8 to 10 every morning (Silvia, 2007). For scientists in agricultural development, with a lot of field work and travel, such a strict schedule might not be feasible. I travel to the field and attend meetings about half of my time, leaving the other half for office work. My mornings are the most productive, so I book most mornings for three to four hours’ writing time. Afternoons can then be used for email, phone calls and administration. I do not open my email in the morning, and I schedule all meetings in the afternoon. That way I can use about a quarter of my working time for writing.
Developing a routine fosters writing, but breaking the routine disrupts it. The stream of thought runs dry, you lose your place. Therefore even when traveling or attending a conference I try to keep up with my latest paper, writing in the hotel room, on the plane or even in the taxi.
The second factor in an effective and productive writing strategy is a systematic and well-structured work plan. This plan divides the work into manageable chunks that are logically connected. The satisfaction of finishing a clearly defined section in a reasonable amount of time provides the motivation to move on to the next section. Writing starts when the data have been collected and cleaned, the preliminary analysis has provided the basic answers to your research questions, preliminary results have been organized into graphs and tables, some

AfJARE Vol 6 No 2 September 2011 Hugo De Groote
197
slides have been developed for presentations, and some reports or conference papers have been drafted. (I assume here that the literature was thoroughly reviewed and the experiment or survey was well designed, without purposive sampling or other shortcuts to the scientific method.)
Now begins the real writing that will result in a great paper published in a good journal. This writing can be conveniently organized into five steps: 1) plan the story line, 2) develop the scientific outline, 3) document your story with tables and figures, 4) write the first, highly structured, draft, and 5) rewrite the draft for style (Table 1).
De Groote – How to write a great paper in agricultural development and get it published – AfJARE 6(2)
Table 1: Steps in writing a great paper and getting it published
Step Topic Action 1 Story Develop good story line on important topic. 2 Outline Develop short outline to tell story in standard scientific format. 3 Documentation Prepare tables and graphs to document story. 4 Draft for structure Write structured draft, with emphasis on content and structure. 5 Rewrite for style Edit full text, with emphasis on style.
3. The story
3.1 The elements of story
At the heart of each great paper lies a great story, with a strong plot and a new message. A strong plot or story line stays focused without digressing into side stories, it unfolds quickly and logically, and it leads to an interesting conclusion. Unlike a research or project report, which necessarily covers all activities as defined in the funded proposal, a good paper has only one message and one major point, not two or three. Write your report first, according to the requirements, respecting the deadline, but do not try to squeeze it into a journal article. Rather, think about what part of the report would make a good story, and which tables and graphs would support that story.
Our research deals mainly with the problems of rural households, whether in agricultural production or in other aspects of their livelihoods. We assess these problems, develop and compare technologies to solve them, analyze policies or institutional arrangements to mitigate them, and evaluate the impact of different interventions. Most of our research papers therefore follow a similar story line. A typical paper first draws attention to the problem, for example by estimating the number of households or the size of the area affected. It then reviews the research in the field to date, so as to identify a gap in our knowledge. Next it explains how it will fill this gap, ideally using a novel approach. It then summarizes its findings, compares them against the knowledge gap, and concludes by explaining how the findings will help to solve the problem.
AfJARE Vol 6 No 2 September 2011 Hugo De Groote
198
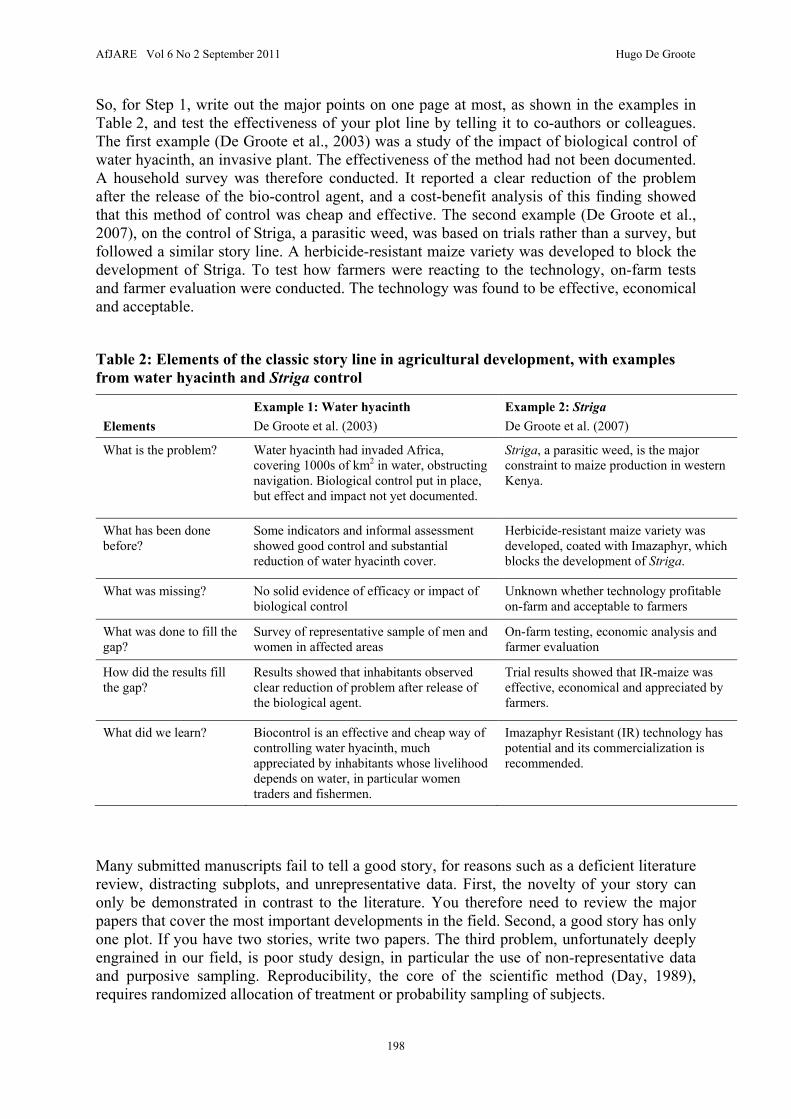
So, for Step 1, write out the major points on one page at most, as shown in the examples in Table 2, and test the effectiveness of your plot line by telling it to co-authors or colleagues. The first example (De Groote et al., 2003) was a study of the impact of biological control of water hyacinth, an invasive plant. The effectiveness of the method had not been documented. A household survey was therefore conducted. It reported a clear reduction of the problem after the release of the bio-control agent, and a cost-benefit analysis of this finding showed that this method of control was cheap and effective. The second example (De Groote et al., 2007), on the control of Striga, a parasitic weed, was based on trials rather than a survey, but followed a similar story line. A herbicide-resistant maize variety was developed to block the development of Striga. To test how farmers were reacting to the technology, on-farm tests and farmer evaluation were conducted. The technology was found to be effective, economical and acceptable.
Table 2: Elements of the classic story line in agricultural development, with examples from water hyacinth and Striga control
Elements
Example 1: Water hyacinth
De Groote et al. (2003)
Example 2: Striga
De Groote et al. (2007)
What is the problem? Water hyacinth had invaded Africa, covering 1000s of km2 in water, obstructing navigation. Biological control put in place, but effect and impact not yet documented.
Striga, a parasitic weed, is the major constraint to maize production in western Kenya.
What has been done before?
Some indicators and informal assessment showed good control and substantial reduction of water hyacinth cover.
Herbicide-resistant maize variety was developed, coated with Imazaphyr, which blocks the development of Striga.
What was missing? No solid evidence of efficacy or impact of biological control
Unknown whether technology profitable on-farm and acceptable to farmers
What was done to fill the gap?
Survey of representative sample of men and women in affected areas
On-farm testing, economic analysis and farmer evaluation
How did the results fill the gap?
Results showed that inhabitants observed clear reduction of problem after release of the biological agent.
Trial results showed that IR-maize was effective, economical and appreciated by farmers.
What did we learn? Biocontrol is an effective and cheap way of controlling water hyacinth, much appreciated by inhabitants whose livelihood depends on water, in particular women traders and fishermen.
Imazaphyr Resistant (IR) technology has potential and its commercialization is recommended.
Many submitted manuscripts fail to tell a good story, for reasons such as a deficient literature review, distracting subplots, and unrepresentative data. First, the novelty of your story can only be demonstrated in contrast to the literature. You therefore need to review the major papers that cover the most important developments in the field. Second, a good story has only one plot. If you have two stories, write two papers. The third problem, unfortunately deeply engrained in our field, is poor study design, in particular the use of non-representative data and purposive sampling. Reproducibility, the core of the scientific method (Day, 1989), requires randomized allocation of treatment or probability sampling of subjects.

AfJARE Vol 6 No 2 September 2011 Hugo De Groote
199
3.2 Aiming your story to a journal
Once you have a good story, work out the title, decide on the co-authors and choose your target journal. A good title is important: it is the first, and sometimes the only, part the reader sees. It needs to be short and to the point, while containing the major information about the paper’s topic.
Next, agree on the co-authors. Authors should include those, and only those, who actively and significantly contributed to the overall design and execution of the research (see Day & Gastel, 2006). More detailed rules, accepted by most journals and research institutes, have been developed by the International Committee of Medical Journal Editors (ICMJE, 2009). To be named as an author, a person must meet all of the following four criteria. He or she must have 1) made substantial, direct intellectual contributions to the design of the study or the acquisition, analysis and interpretation of data, 2) drafted the article or revised it critically for important intellectual content, 3) given final approval of the version to be published, and 4) participated sufficiently in the conception or conduct of the research, the acquisition of data, the interpretation of results, or the writing to take public responsibility for appropriate portions of the content. Clearly, activities such as survey organization, trial management, project or program administration, data collection, and even supervising a thesis, do not by themselves constitute sufficient intellectual contribution. Honorary or gift co-authorship is, therefore, strongly discouraged. People who have contributed intellectually to the research effort, on the other hand, should always be invited to contribute to the paper, preferably with a specific task in the writing or analysis.
Finally, think of suitable journals for your submission. You will usually identify the most relevant journals in our field when you are doing the literature review. Verify whether they are listed in the Thomson Reuters master journal list (Thomson Reuters, 2011), an important quality indicator, and check their impact factor. This number, calculated by Thomson Reuters, represents the average number of times an article in the particular journal has been quoted over the last two years in other articles in journals in the list. Top journals such as Nature or Science have an impact factor of about 30, while for journals in agriculture and related fields an impact factor of one is considered respectable, and two is good (see Table 3 for more examples). If you have a good story, do not waste it on a minor journal. Try at least twice to submit your paper to journals in the list before considering others.

AfJARE Vol 6 No 2 September 2011 Hugo De Groote
200
Table 3: Important journals for agricultural and rural development research in developing countries (a personal selection)
Field Journal Impact factor 2009
General science Science 29.7
Agricultural and resource economics
Ecological Economics 2.42
Journal of Agricultural Economics 1.16
American Journal of Agricultural Economics 1.05
Agricultural Economics 0.67
Rural development Food Policy 1.61
World Development 1.22
Agriculture and Human Values 1.12
Economic Development and Cultural Change 0.86
Agronomy and breeding Field Crops Research 2.34
Crop Science 1.74
Agronomy Journal 1.53
Euphytica 1.40
Experimental Agriculture 0.63
African Journal of Agricultural Research 0.08
Systems, ecology, multidisciplinary
Agriculture, Ecosystems and Environment 3.13
Agricultural Systems 2.11
Economic Botany 0.89
Outlook on Agriculture 0.38
Food and nutrition Journal of Nutrition 3.77
Food and Nutrition Bulletin 1.59
Journal of the Science of Food and Agriculture 1.39
Journal of the Ecology of Food and Nutrition 0.31
Crop protection Crop Protection 1.33
Journal of Stored Products Research 1.25
International Journal of Pest Management 0.60
Biotechnology African Journal of Biotechnology 0.46
4. The outline
4.1 Organization
While trying to tell a good story, our main goal is to communicate the message efficiently and accurately to as wide a readership as possible. The outline organizes the argument and makes for a tighter, more comprehensible paper (O’Connor, 1991:14). It creates the structure of the paper, the skeleton on which it is built, gives the paper a logical, natural flow and prevents duplication of the same point in different sections. The conventional structure is known as IMRAD: introduction, methods, results and discussion (Day, 1989).
The standard introduction to a scientific paper covers the first three points of the story line: what the problem is, what has been accomplished to date, and what is still lacking. This leads

AfJARE Vol 6 No 2 September 2011 Hugo De Groote
201
logically to how the paper will help fill that gap, and what its objectives are. A good introduction analyzes the past research so as to explain what needs to be done. It demonstrates a good grasp of the most important extant literature and the latest developments.
The section which follows must explain the methods sufficiently well to allow other scientists to repeat the research and arrive at the same results. This requires the use of appropriate methods with proper randomization. To assure nothing is forgotten, follow a check list (see Table 4). But remember that you are writing a paper for interested colleagues, not a thesis for examination. Do not go into exhaustive detail of methodology that is standard in your field. Sum up briefly. Explain in detail only when your methods are innovative.
Table 4: Structure of the methodology Subsection Check list
1. Conceptual framework Identification of main concepts for problem at hand and possible solutions
Hypothesized relationship
2. Empirical framework Variables to approximate and measure concepts
Functional form of relationships between variables
3. Study design Design of survey or trial
Randomization procedure
Target population
Size of sample or replicates
4. Implementation of study/ data collection
Study area
Period of the study
People who organized the study and collected data
Data collected, variables measured
Instruments used to measure variables
Ethical clearance of study
5. Analysis Methods of analysis for different objectives
The results section presents the key results that support the story. Present only those that fit the story line and then only the most important ones. Authors have more leeway to structure the results section than they do the other sections, but the results should still be presented in a clear, logical order so the reader can understand them easily. A common structure is first to present the one-variable analysis, such as the descriptive statistics of the key variables, then the two-way interactions, usually as graphs, and finally the multivariate analysis, such as regressions, usually in tables. This order was followed in the water hyacinth study. Alternatively, the research can be presented in chronological order, from laboratory or on-station trials to on-farm and participatory evaluation. This order was followed in the Striga study.
The discussion is the last section of the paper’s main body and is typically organized into four subsections. First, a synthesis is presented to compare the results to the objectives and discuss how they answer the research question. In the biophysical sciences, the next subsection compares the results to previous studies. The third subsection discusses the limitations of the research and problems encountered, and offers insights into the methods used. The final subsection considers how the research contributed to solving the problems, and what its implications are for further research, development action, and policy.

AfJARE Vol 6 No 2 September 2011 Hugo De Groote
202
The readability of the paper will be substantially improved if you use parallel structures in the different sections. Ideally, your methods and discussion sections will deal with the objectives in the same order in which you set them out in the introduction.
4.2 Writing the outline
Step 2 of the writing process is to organize your story into the IMRAD structure, in an outline of two to three pages. For scientific papers, the four common levels in the outline are headings, subheadings, paragraphs and sentences. The following list is a generic outline of a paper in IMRAD format, showing the first two levels.
Introduction o The problem o What has been done so far o How this paper fills the gap o Objectives of the paper
Methodology o Conceptual framework o Empirical framework o Study design o Data collection o Data analysis
Results o One-way analysis (descriptives) / Laboratory or on-station trials o Two-way analysis (graphs) / On-farm researcher-managed trials o Multi-variable analysis (tables) / On-farm farmer-managed trials
Discussion and conclusion o Synthesis of results – comparison with the objectives o Comparison of results with the literature o Limitations to the outcome o Conclusion: The way forward (policy, extension, further research).
The first level of the outline represents the main sections with their headings, and they follow the typical IMRAD structure. The second level represents subsections, often with subheadings. Subheadings are commonly used in the methodology and results sections, but not commonly in the introduction and discussion. The third level represents major points or issues, which will later become paragraphs. The fourth level, finally, represents the finer details that make up your major points. They become sentences, or clauses in composite sentences.
While drafting the outline, make a list of the relevant references from the literature to back up your story and support your claim to novelty, and note where they should be inserted. Decide which are the best tables or graphs to support the story, and where they would fit best. Note their place in the outline with a number and preliminary caption.
The outline provides the structure of the paper, so organize your arguments logically. Do not worry, at this stage, about the proper style or the correct word: this will only slow you down. Keep the outline short, but spend your time reading, thinking and discussing it with your co-authors. Ensure that they all concur with each part of the proposed paper, and confirm who will be responsible for which sections.
AfJARE Vol 6 No 2 September 2011 Hugo De Groote
203
Common mistakes in the structure of papers are repetition of material and arguments in the wrong order. Trim down your material to the essential story, and prune anything unimportant. Put things in the right place: provide only the gist of the methods in the introduction, not the details, do not put results in the introduction or methodology sections, or discussions in the results section.
5. Support your story with tables and figures
5.1 Organization
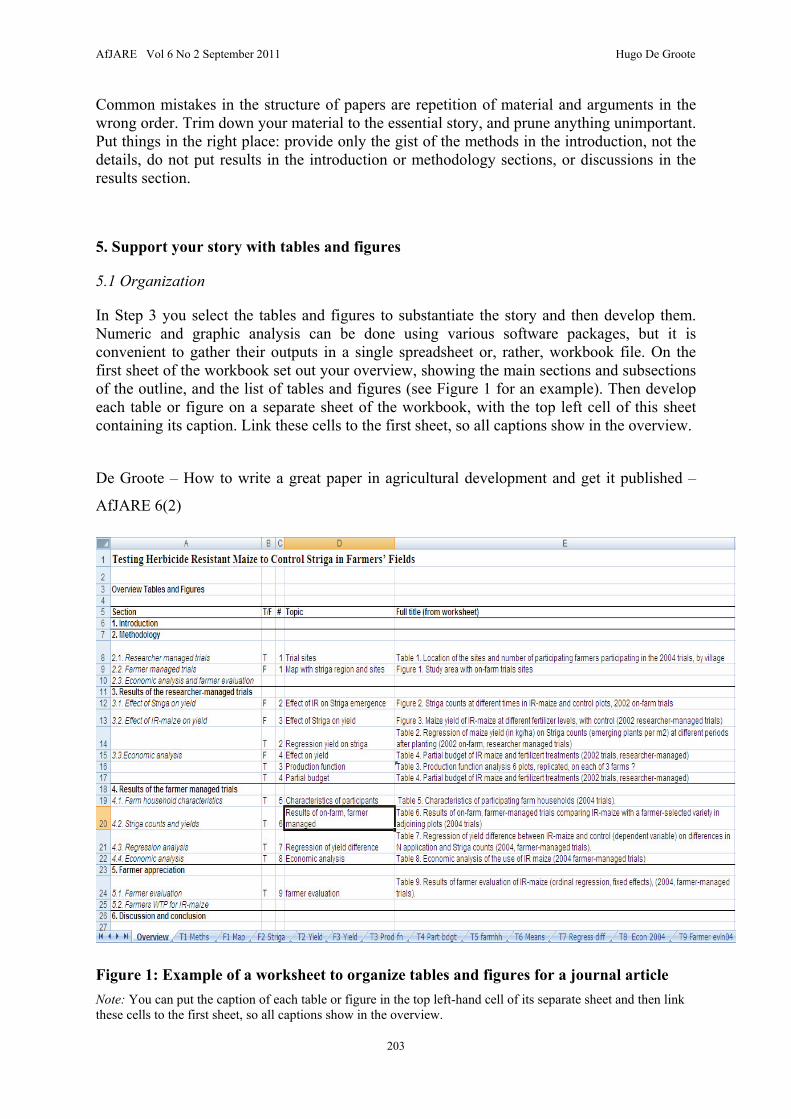
In Step 3 you select the tables and figures to substantiate the story and then develop them. Numeric and graphic analysis can be done using various software packages, but it is convenient to gather their outputs in a single spreadsheet or, rather, workbook file. On the first sheet of the workbook set out your overview, showing the main sections and subsections of the outline, and the list of tables and figures (see Figure 1 for an example). Then develop each table or figure on a separate sheet of the workbook, with the top left cell of this sheet containing its caption. Link these cells to the first sheet, so all captions show in the overview.
De Groote – How to write a great paper in agricultural development and get it published –
AfJARE 6(2)
Figure 1: Example of a worksheet to organize tables and figures for a journal article
Note: You can put the caption of each table or figure in the top left-hand cell of its separate sheet and then link these cells to the first sheet, so all captions show in the overview.
AfJARE Vol 6 No 2 September 2011 Hugo De Groote
204
Quantitative research typically generates many tables and figures, so they need to be reduced to those that contribute most to the story and contain the most important results. Evaluate every number, row and column for its contribution to the story. If, after trimming, you find your graph has only three bars left, or your table has only four cells, then the information can be conveyed more succinctly in a sentence and the table or graph can be omitted.
Often, the same data can be presented in either a table or graph. First try the graphs: they are easier to understand and particularly useful to show relationships. Bar graphs, for example, can show trends over time or compare characteristics of different categories. Choose tables to present numbers that are particularly important to the story, or to present many numbers that have little structure or complicated structures like multivariate analysis.
Each table or graph needs to stand alone, and should be understandable independently of the text. Each number and line should be clearly defined by the caption (the title of the table or figure), the column headings, the axis labels or the legend. Footnotes can be used for specific details.
5.2 Graphs
Organize the required data in a separate sheet of the workbook to develop the graph. Keep it simple and only present the relationship between a few variables, using black and white only. Many styles and formats are available, so study the graphs in a recent copy of the targeted journal and read relevant handbooks (Stapleton et al., 1995; Day & Gastel, 2006).
Key elements include a line around the central part of the graph, with gradations on both axes, and horizontal dashed gridlines to allow extrapolation. Label axes and categories clearly. In bar graphs, distinguish series with different hatching styles or shades of grey. In line graphs, use full lines and distinguish series by markers, in particular open circles, triangles and squares, followed by the same markers filled, which provides for six different lines. More lines would clutter, so split the data over two graphs. Do not include the caption inside the box containing the graph, but write it out in the top left cell of the sheet, linked to the overview. In bar graphs, error bars representing standard errors show whether the means of two groups are statistically different or not.
5.3 Tables
Most scientific journals have a house style for tables, so check your target journal. A typical table contains only horizontal lines, no vertical lines. Two columns can be linked by a horizontal line above them, and a common column heading above that line, with the individual column headings below it. Lines can easily be split by inserting a narrow empty column in the spread sheet.
Columns that have the same units are easier to understand. So present different categories such as treatments or regions in different rows, with the columns containing different variables, each with the same unit defined in the heading. If many variables are presented, each can be given a separate row, but then the definition and the unit need to be presented in the first column, followed by mean and standard deviation in the next two columns.
Information in rows and columns should indicate a logical order: for example from the most important to the least, from east to west, or from large to small. Trying organizing the rows by topic, split by a line. Where possible, use the same order in all your tables and in the text.

AfJARE Vol 6 No 2 September 2011 Hugo De Groote
205
Present percentages rather than numbers of cases, but include the sample size so the numbers can be derived if needed. If a variable has only two categories (yes/no, male/female), only one needs to be presented. The first letter of the text in each cell is usually capitalized. Do not capitalize headings or use bold or italics. Headings can be left aligned or centered, while the first column and other text are usually left aligned, and the numbers aligned on the right.
When presenting a regression, specify the model and the dependent variable in the caption. Columns typically include the names of the variables, the parameter estimates, their standard error and either P-value or asterisks. The bottom part of the regression table includes the parameters of fit, such as R2 and the standard deviation for linear regression, and the log likelihood or χ2 for maximum likelihood regression, and the sample size.
Present statistics for both central tendency and deviation, and the sample size or number of repetitions. For one-way analysis of variables, present descriptive statistics, such as mean and standard deviation. For two-way analysis, present correlation coefficients and differences between means, with indicators of significance. Conventionally, *** stands for P<0.001, ** for P<0.01 and * for P<0.05. For multivariate regression analysis, standard errors of the coefficients are usually presented, with either a P-value or asterisks. Avoid presenting information that can be derived from other numbers, such as both categories of a binary variable, variance and standard deviation, numbers and percentages, and so forth.
5.4 Synthesis of main points
When your table or graph is complete, and the information still fresh, reflect on its main points and select those to be presented in the text. Write them in a separate column on the same sheet as the table or graph. Indicate which variables were significant, which groups were different, which relationships clearly emerged, and so forth. Put the points in a logical order that fits the story.
Similarly, when all graphs and tables are completed, add a sheet at the end of the workbook, to gather the major points of the analysis to be carried over into the conclusion. This is where you indicate where and how the analysis supports your hypothesis, which results were unexpected, and what your major conclusions and implications are.
6. Writing the first draft for structure
6.1 Overview
Now you have the outline of the paper, the tables and the figures, their individual points to go in the text, and the overall points to go in the conclusion. It is now time to write the text: Step 4. This is usually the most difficult step, but the previous steps should have you well prepared, so it should be straightforward as long as the basic rules are followed. The main concerns when writing the first draft are structure, consistency and flow. Make your points and observations in a logical order and in the appropriate structure. Do not worry about style, which would only slow you down and make you lose the story line. Make sure the different sections are well connected: the introduction leads to the objectives, and the conclusion refers to these objectives. The conclusion is derived from the results, and the results were obtained using the methods. Check the target journal’s instructions for authors for its requirements as to structure, style, maximum length, and so forth.

AfJARE Vol 6 No 2 September 2011 Hugo De Groote
206
Well-structured writing proceeds in a logical order. This is often from the general to the specific, and from the most important to the least important. The order can also be chronological or geographical, or a cause followed by an effect. Often the same elements return in the different sections, especially in methods and results or in introduction and conclusion. Use the same order in the different sections to improve clarity, and present elements in the text in the same order as they appear in tables and graphs.
6.2 Introduction
The first sentence of the introduction is the most important sentence of the paper. It is the hook to grab your reader’s attention. In the rest of the paragraph, cast the problem in an interesting way and convince the reader of its importance. After the problem statement, review the previous research, but now in more detail than in Step 2.
Review the literature, identify the relevant papers, and store the important information. Search bibliographic databases such as Google Scholar, JSTOR, and Sciencedirect, using keywords, important authors and references from other papers. Most journals can now be searched online and they allow you to export the citations, so you can assemble your electronic library. Download each paper, or request an electronic copy from the authors, and name the file by first author, date, short title of the article and abbreviation of the journal’s title, so you can retrieve it easily. Read the papers and include the abstracts as well as other important information in your library, adding a keyword where necessary to retrieve them quickly.
To gauge the importance of a paper, check Google Scholar for its number of citations, and select those that have been cited 10 to 20 times or more. Select the papers that fit your story well, either by supporting its importance, its methods or main arguments, or by providing interesting contrasts. Do not ignore alternative points of view – good reviewers will know them – but counter them. Organize references to the selected papers and their information in a logical way in your introduction: chronological, grouped by contrasting schools of thought, by methodological approaches, and so on. Indicate the main point(s) of each paper, and insert each reference with your software after the citation, which usually goes at the end of the sentence. Be specific; avoid general statements with many references. The list of references is automatically generated at the bottom of your paper, approximately in the style specified (you will need to check the list when making your final submission, to ensure that you have complied with the target journal’s style requirements).
Now build on your assessment of the problem’s importance and your synthesis of past research from the literature, to argue what is still needed to solve the problem. You now demonstrate the novelty of your research by contrasting it with previous research, and show how it fills the gap. Finally, the introduction ends by stating the objectives in a clear, scientific form. Often there is a general objective, followed by a few specific objectives. For cohesion, make sure the objectives fit the results you have presented in your tables and figures and vice versa and correspond to the points in the conclusion on your spreadsheet.
6.3 Methods
The methods need to be explained in sufficient detail for other scientists to repeat the experiment or survey and achieve the same results, within the error margin. However, it is easy to forget important details, so be systematic and follow a plan and a check list (Table 4).
AfJARE Vol 6 No 2 September 2011 Hugo De Groote
207
If possible, have a knowledgeable colleague read the methods section to see if the points can be followed by the reader.
The first subsection of the methods is the conceptual framework. Most research in our field is empirical: we study the relationships of key drivers in rural development, such as the effect of a new technology or climate change on food security or poverty. These drivers are the concepts – the general ideas. We use them to speculate about what happens in the world. In the conceptual model, we identify the major concepts and hypothesize how they can be linked in a model, based on theory, deduction or empirical evidence. In biophysical papers, this part is often skipped, especially when the concepts are easily identified and measured. Still, explicitly stating the conceptual framework contributes to rigorous scientific thinking.
The second subsection contains the empirical framework. Here, the variables used to approximate and measure the concepts are identified. For applied research with limited resources, cost-efficient indicators of complex concepts need to be derived and justified. Similarly, an empirical model needs to be developed to quantify and test the relationship between these variables, in line with the hypotheses and objectives of the paper. This can be a simple comparison of groups, or a multivariate regression, or a complex set of equations, depending on the type of dependent and independent variables and their hypothesized relationships. For standard models, you can present the mathematical formula and the reference, but not the derivation. If something new was added, argue for the changes with a theoretical or mathematical development.
The third subsection describes the design of the trial or survey you carried out to measure the variables of the previous subsection. To allow readers to extrapolate the results and judge the conclusions, you need to justify the selection of the target population and study area, and explain the randomization process in detail. The fourth subsection describes the actual implementation of the study, including the study period, the variables collected, the people who collected the data, and the instruments they used. In nutrition and medical research, ethical clearance is often required, so you must state when and how it was obtained. The last subsection of the methodology usually explains the data analysis, how the models were estimated, and which software and statistical tools were used.
6.4 Results
The structure of the results section depends on the actual results and the story line, but it always needs a logical order. Usually the results are organized into subsections, with each subsection illustrated by a table or graph. The structure is therefore largely determined by your tables and graphs. Refer to each of them in the text, and mark their place in the text, right after the first paragraph in which they are mentioned. Note that the typesetter will fit in the tables and graphs to make best use of the space in the print version of the journal, so always refer to them by number, i.e. ‘see Table 1’, not ‘see the table below’.
A common procedure is to start with a one-way analysis of the key variables (Table 4). The first table often presents the key variables with their descriptive statistics. Next are two-way analyses exploring links between those variables, in particular comparing the outcome of different treatments. Many scientists skip this step – it looks too simple. What they do not realize is that this presentation is much easier to understand and therefore much more convincing. The last step in this order is the multivariate analysis such as regression and ANOVA, typically presented in tables with statistical analysis. If the paper presents a set of trials, the results are usually presented chronologically. In farming systems research, trials
AfJARE Vol 6 No 2 September 2011 Hugo De Groote
208
often start in the laboratory or on-station, followed by on-farm trials under researcher management, and ending with trials under farmer conditions and farmer management. Review the order of the tables and graphs so they fit the story well. Then review the order and relevance of the points you made for each, and copy them into the text of the results section.
The background information on the study area, the research project, or technology under consideration is sometimes hard to place. It is too long for the introduction, but it is not a result of the research. Therefore, try to summarize it and slot it into the first subsection of the results or, if it is too long, insert a separate background section between the introduction and the methodology.
6.5 Discussion and conclusion
The last section of the IMRAD structure is the discussion, where you interpret the results and discuss their meaning. A typical discussion first synthesizes the results, and then compares them to the objectives, to evaluate whether those objectives were achieved. In articles in biophysical journals, the results are then compared to those of other studies. This can be difficult to handle without repetition, since the literature has already been reviewed in the introduction. Articles in the social sciences will not usually return to the literature in the discussion, but will rather link the results to the hypotheses from the introduction, which were based on the literature cited there.
Next, the limitations of the results are discussed. Some results were probably unexpected, but they can be explained with hindsight. Sometimes the results apply only to a particular area, which should be clearly defined here, as should other limitations to the extrapolation. This is the place to explain where improvements to the methodology can be suggested.
The concluding section explains how your results help to solve the problem at hand. Only include conclusions that derive from the results, and avoid speculation or conclusions derived from other sources. The paper ends by formulating recommendations for different stakeholders, not only for further research but also for extension and development projects, and for policy makers.
6.6 Abstract
Although the abstract goes at the beginning of the paper, you need to compose it when you have finished writing the first draft, i.e. when you are sure of all the components of your story. Build up your abstract in the standard IMRAD structure: explain what problem is being addressed, how this research tackles it, and summarize the key results and conclusions. Check the journal’s instructions for style and length. Some journals ask for headings within the abstract, but most do not. The maximum permitted length varies from 100 to 400 words, which makes a big difference to how much detail you can include. Ensure that your abstract summarizes the whole of your paper, including your conclusions and recommendations.
The importance of a good abstract cannot be emphasized too strongly. Write and rewrite your abstract until it is as good as you can make it. It needs to make sense independently of your text. The language must be simple and straightforward, so a busy reader – and the reviewers – can get the gist quickly. It must also flow well. Remember that this may be the only part of your paper that some readers will read, so it needs to encapsulate your story perfectly.

AfJARE Vol 6 No 2 September 2011 Hugo De Groote
209
7. Rewrite the draft for style
After you have developed the content of your story, and it is well structured and logically organized, with all the points from tables and graphs presented in the text, you can move to Step 5. Here, you rewrite the draft for style, so it reads smoothly and is clear and easy to understand. To improve your writing skills, read the classics on the elements of style (Strunk & White, 1979[1918]) and on writing well (Zinsser, 2006). Use plain but formal language, and avoid colloquial or spoken language, and contractions such as don’t, isn’t, etc.
Rewriting for style means tinkering with the words, to rephrase and trim the sentences, and to group them into logical paragraphs. Choose the right words and use only those needed. When in doubt, look up a word in a dictionary and check for alternatives in a thesaurus, on your word processor, or online. Words should be clear and precise. Replace all vague words like this concerns, involves, or relates to with this reviews, discusses, includes, supports or contradicts. Cut vague qualifiers such as a bit, somewhat, somehow.
Replace long words like pressurize and utilize with shorter alternatives like pressure and use. Replace Latin-derived words with their English counterparts, for example prioritize with rank, or the majority of with most. English words are usually shorter and clearer. Consider each sentence separately for sense and wordiness, then delete all unnecessary words. Avoid clutter, check the necessity of each word, especially some, very, as to, respectively, also, and so on.
A good sentence is clear and precise, and makes its point in the shortest possible way. It follows the basic structure (subject, verb, object), and is short, active and positive. The average sentence length strongly affects a text’s readability. So shorten or split sentences when they are longer than two lines or have more than 20 words. But be aware that a succession of short sentences can be tedious to read. Good style varies the length of sentences. Consider rephrasing sentences that use the passive voice if the active will make the explanation clearer.
The use of the first person is not common in scientific writing, although it is increasing. Do use it when necessary or when you cannot find an elegant, active alternative. Positive sentences are clearer than negative sentences. Be consistent in the tense of your sentences. Current facts and well-established realities are presented in the present tense; specific studies in the past tense. Results are written in the past tense, and the way forward in the present or future tense.
Paragraphs group related sentences. We have already grouped and ordered sentences in the structured draft, so here we decide on the paragraph divisions. Paragraphs provide rhythm in the reading, visual breathers, and indicate changes in topic. Well-structured paragraphs improve the ease of reading and the understanding of the text. A paragraphs often starts with an opening sentence explaining the topic, called the topic sentence. It introduces the elements of the sentences that follow. Link the rest of the sentences in the paragraph wherever possible by pointing out similarity (similarly, again, as in the first case) or contrast (however, but, while) between the ideas. Always indicate cause and effect (therefore, because), writing the cause before the effect, as it is easier to follow. Avoid using since in the meaning of because, because it also means from the time when.
If a paragraph discusses points from a list, list the points in the first sentence. Avoid long lists of eight or more elements, but regroup them. List the positive and negative factors in

AfJARE Vol 6 No 2 September 2011 Hugo De Groote
210
different sentences, or split the important and less important factors. Paragraphs with consecutive sentences that use parallel structures are easier to read. Avoid paragraphs with fewer than three sentences or more than six or seven.
When you have carefully gone over the words, sentences and paragraphs of a whole section, re-read it to check for clarity, consistency and flow, and use your spellchecker. Analyze its readability in the word processor or online. Readability analyses provide scores based on indicators such as the average length of words and sentences, usually in a grade-equivalent scale. A text with a score of grade equivalent 13 (freshman or first-year student) or more runs the danger of being misunderstood, so aim for a score grade equivalent of 12 or less (Gunning, 1952:39). However, these scores only take into account word and sentence length, not the content or scientific concepts. Help your readers by sticking to one term for one concept and not using synonyms. For example, if you start by calling something an ‘attribute’, do not later call it an ‘aspect’, ‘factor’ or ‘domain’. The reader, especially if not a first language speaker of English, will wonder whether you are now referring to something different and lose the thread of your argument.
After finishing the last section, either add the tables and figures to end of your text document or submit them in a separate file, depending on the target journal’s requirements. Mark the places in the text where you want them inserted. Send the document to your co-authors for comments and suggestions. After incorporating these, have the paper edited by a professional editor or ask a colleague with good writing skills who was not involved in the research to proofread it. Colleagues are able to take a more objective look at the whole paper and can predict likely comments of reviewers.
8. Submission of the manuscript and the review process
8.1 Preparations
After incorporating the comments of co-authors and colleagues, assemble all the elements needed for submission to the targeted journal. The main goal now is to get it past the editor and the reviewers. Make their life easy with a neat and pleasant looking manuscript. But do not use any fancy formatting. Use absolutely basic MSWord formatting. The typesetter will apply the journal’s house style. Prepare yourself for a quick reaction in case of rejection, by selecting an alternative journal in case of need.
Review the journal’s instructions to authors and check a recent copy of the journal for their style. Check the page or word limit and prepare the manuscript according to instructions on size A4 paper or letter size, with margins of one inch (2.54 cm) on all sides. The recommended font is Times New Roman, 12 point, 1.5 or double spaced, and left aligned. Apart from the referencing, do not use any automatic features, such as automatically generated headings, table of contents, or links to tables and figures.
8.2 Assembling the submission
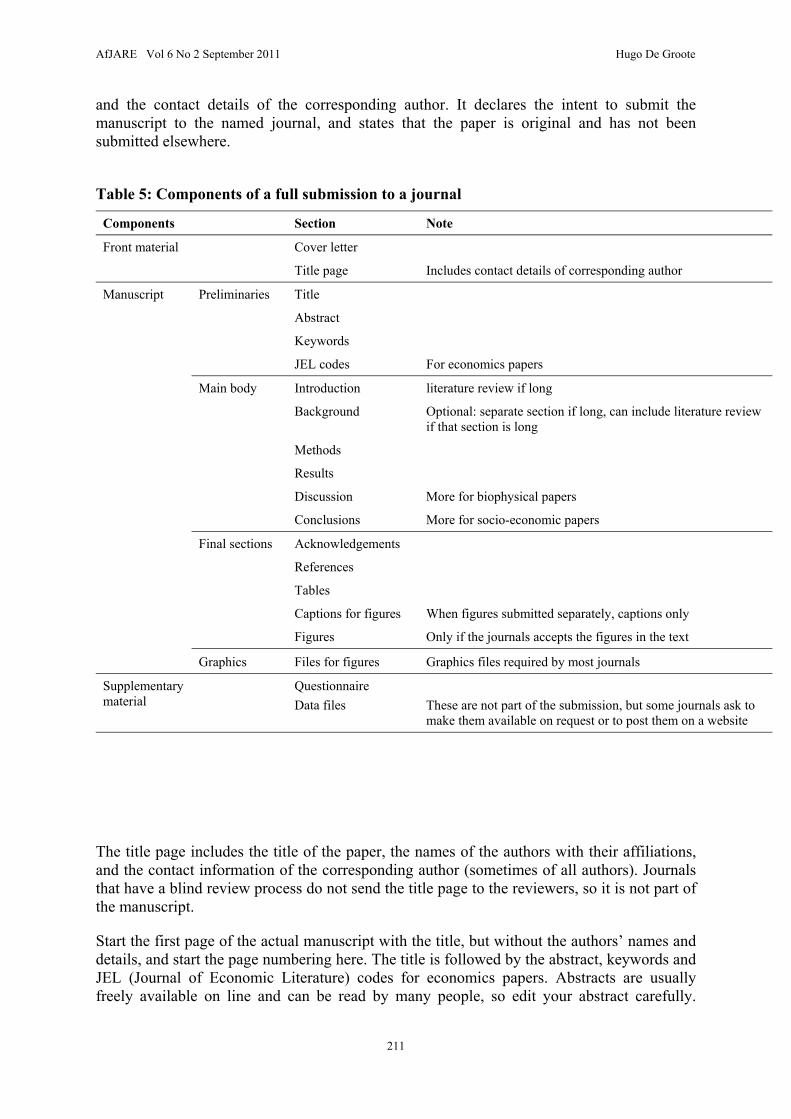
A submission to a journal consists of a cover letter, the title page and the manuscript. The manuscript includes preliminaries, the main text, and final sections (see Table 5). The cover letter is addressed to the journal editor, whose name and contact details can be found on the journal’s website. The letter should include the title of the paper, the names of the authors,
AfJARE Vol 6 No 2 September 2011 Hugo De Groote
211
and the contact details of the corresponding author. It declares the intent to submit the manuscript to the named journal, and states that the paper is original and has not been submitted elsewhere.
Table 5: Components of a full submission to a journal
Components Section Note
Front material Cover letter
Title page Includes contact details of corresponding author
Manuscript Preliminaries Title
Abstract
Keywords
JEL codes For economics papers
Main body Introduction literature review if long
Background Optional: separate section if long, can include literature review
if that section is long
Methods
Results
Discussion More for biophysical papers
Conclusions More for socio-economic papers
Final sections Acknowledgements
References
Tables
Captions for figures When figures submitted separately, captions only
Figures Only if the journals accepts the figures in the text
Graphics Files for figures Graphics files required by most journals
Supplementary material
Questionnaire
These are not part of the submission, but some journals ask to make them available on request or to post them on a website
Data files
The title page includes the title of the paper, the names of the authors with their affiliations, and the contact information of the corresponding author (sometimes of all authors). Journals that have a blind review process do not send the title page to the reviewers, so it is not part of the manuscript.
Start the first page of the actual manuscript with the title, but without the authors’ names and details, and start the page numbering here. The title is followed by the abstract, keywords and JEL (Journal of Economic Literature) codes for economics papers. Abstracts are usually freely available on line and can be read by many people, so edit your abstract carefully.
AfJARE Vol 6 No 2 September 2011 Hugo De Groote
212
Follow the basic IMRAD structure but, for most journals, without the headings. Briefly state the problem and the methods used, and emphasize the results and conclusions.
After the preliminaries, add the main body of the text, consisting of the IMRAD sections, as prepared in Step 5. Add the acknowledgements, with thanks to donors, collaborators who are not co-authors, and the administrative and technical help. This is followed by the list of references, generated by the software. If you cannot find the exact style, use a similar one.
Finally, insert the tables from your spreadsheet in the manuscript, one per page, and edit as needed for a neat presentation. While most journals request double-spaced tables, it is often more convenient to the reviewer to reduce the line spacing, to keep each table on one page. Present the tables in a separate file instead of in the text if the journal requires this. For most electronic submissions, the figures are uploaded as separate files, but the list of figure captions is added in the text.
8.3 The submission process
For a hard copy submission, print everything in black ink, on one side of the paper only. Print the figures separately, one per page. Make the required copies and send it off by registered mail.
For electronic submissions, check the journal’s website for requirements and prepare the files accordingly. Most journals accept word processor files, but some require pdf files. Go to the journal’s submission website and enter title, abstract and keywords in the spaces provided, or follow the journal’s instructions for submissions if they differ from this. Upload the cover letter, title page and manuscript with tables and figure captions as three separate files. Graphics are usually submitted as separate, high definition files. Export them from your software in a graphics format, or capture them from the screen using graphics software. Save figures as a high quality *.gif or *.bmp file. Avoid the *.jpg format, which has a tendency to smudge.
8.4 The review process
Usually you will receive a reply from the journal editor within a few months, after your paper has been returned by the reviewers and the editor has made a decision on the basis of their reports. The reply is either 1) rejection, 2) acceptance with major changes or invitation to resubmit, or 3) acceptance with minor changes. If your paper is rejected, immediately reformat the manuscript for the second journal on your list. Use the reviewers’ comments to improve the paper and resubmit as soon as possible to the second journal.
If your paper is accepted on condition you make major changes, the task may look daunting. Get to work immediately and systematically respond to each of the reviewers’ comments. Start with the easy ones to get you going. Reviewers are busy people, so make it easy for them to accept your second submission. Copy their comments into a text file and arrange them into the points to be addressed. For each point, make the requested changes in your manuscript, and explain the changes in italics in a reply to each reviewer, point by point. Send this in a file separate from the manuscript, addressed to the editor. Do not add your comments in the text of the manuscript. Do not argue with the reviewers or the editor. Unless they are clearly mistaken, or the change would significantly alter your story, do as they suggest and thank them for their insightful comments.
AfJARE Vol 6 No 2 September 2011 Hugo De Groote
213
If you choose not to change the manuscript, explain why. Concede that maybe your point was not very clear in the first submission, so you have added some references to defend your position and some sentences to clarify your argument. At least show that you made an effort.
Then resubmit the paper, with a new cover letter to the editor, explaining that this is the second submission, and that changes have been made according to the reviewers’ comments, and an elaborate reply to each of the reviewers. Finally, add the title page and the revised manuscript with the same elements and in the same order as the first submission. Ensure that you have used the target journal’s required style for the reference list, having consulted the journal’s instructions and looked at the lists in a recent copy of the journal.
9. Concluding remarks
In this paper I present a well-tested method for writing and publishing papers on research in agriculture and rural development. It is based on two principles: systematically setting aside time for writing, and using that time efficiently with a structured five-step writing method.
Regularly scheduled writing time is essential for good writing and regular publishing. Plan it during working hours, and in sufficiently long blocks to achieve at least one section. Do not deviate from your plan and do not be distracted by e-mail, phone calls and meetings.
The systematic method presented in this paper will help you use that time efficiently. It splits the task into five well-defined, manageable, logically ordered steps, in a logical order. In Step 1, you develop a great story, about something important and interesting that has not been done before. In Step 2, you outline that story according to the scientific IMRAD convention. In Step 3, you assemble the evidence, your tables and figures showing your results, to argue a convincing case. In Step 4, you write the first draft of the story in detail, section by section, building from the problem and leading to the conclusion in a logically structured way. In Step 5, finally, you rewrite the draft, now editing for language and style, using the right words in clear, tight sentences, organized into easy-to-read paragraphs.
This method takes time and effort. I usually manage Step 1 in one writing session, although I often need another session to check the relevant literature. Step 2 usually takes only one session. In Step 3 I create several tables or graphs in each session, so the time needed depends on their number. Step 4 is the hardest and takes the longest time. For the introduction I need several sessions, because it requires revisiting the literature thoroughly. The methods and discussion sections are straightforward and each can usually be done in one session. For the results, I usually write one subsection per session. In Step 5, I usually edit one section per session. The abstract, finally, also often takes one session. So, even with 25% of my working time budgeted for writing, writing one paper still takes several months.
Monitoring your writing can help to motivate you during those months (Silvia, 2007). For empirical scientists, a spreadsheet or SPSS database is convenient for marking the number of days and hours you planned to write, the number of hours you managed to write, and the number of words you wrote. For more inspiration, try reading one of the many handbooks on scientific writing and publishing (for example, Day, 1998; Peat et al., 2002; Katz, 2009). Scheduling regular writing time and following a systematic writing method will allow you to write and submit several papers each year. By targeting the right journals, and with some luck in the review process, you should be able to publish two papers each year.

AfJARE Vol 6 No 2 September 2011 Hugo De Groote
214
Acknowledgments
I wish to thank my colleagues, Bernard Vanlauwe, Paul Stapleton and Yoseph Beyene for their suggestions and contributions, the Frosty Hill Foundation for financial support, Professor Chris Barrett and Erin Lentz for hosting me during my sabbatical, Mann Library at Cornell University for access to their collections and the assistance of their dedicated staff, and finally my editor Kathleen Sinclair for her help and critical support over the years.
References
Adams, J, King, C & Hook, D, 2010. Global Research Report Africa. Evidence & Thomson Reuters, Leeds, UK.
Bourne, PE, 2005. Ten Simple Rules for Getting Published. Public Library of Science Computational Biology 1(5), e57.
Cetin, S & Hackam, DJ, 2005. An Approach to the Writing of a Scientific Manuscript. Journal of Surgical Research 128(2), 165–7.
Chiswick, M, 2004. Writing a research paper. Current Paediatrics 14(6), 513–18. Covey, S, Merrill, A & Merrill, R, 1995. First Things First: To Live, to Love, to Learn, to
Leave a Legacy. First Fireside Edition, Simon & Schuster, London. Day, RA, 1989. The Origins of the Scientific Paper: The IMRAD Format. Journal of the
American Medical Writers Association 4(2), 16–18. Day, RA, 1998. How To Write and Publish a Scientific Paper. Oryx, Phoenix, AZ. Day, RA & Gastel, B, 2006. How to Write and Publish a Scientific Paper. Greenport,
Westport, CT. De Groote, H, Ajuonu, O, Attignon, S, Djessou, R & Neuenschwander, P, 2003. Economic
impact of biological control of water hyacinth in southern Benin. Ecological Economics 45, 105–17.
De Groote, H, Wangare, L & Kanampiu, F, 2007. Evaluating the use of herbicide-coated imidazolinone-resistant (IR) maize seeds to control Striga in farmers’ fields in Kenya. Crop Protection 26, 1496–506.
Eriksson P, Altermann, W & Catuneanu, O, 2005. Some general advice for writing a scientific paper. Journal of African Earth Sciences 41(4), 285–8.
Gopen, G & Swan, J, 1990. The Science of Scientific Writing. American Scientist 78, 550–8. Gunning, R, 1952. The Technique of Clear Writing. McGraw-Hill, New York. ICMJE (International Committee of Medical Journal Editors), 2009. Uniform Requirements
for Manuscripts Submitted to Biomedical Journals: Ethical Considerations in the Conduct and Reporting of Research. www.icmje.org/ethical_1author.html Accessed 5 November 2011.
Katz, MJ, 2009. From Research to Manuscript: A Guide to Scientific Writing. Springer Science, Dordrecht, The Netherlands.
O’Connor, M, 1991. Writing Successfully in Science. Harper Collins Academic, London. Peat, J, Elliott, E, Baur, L & Keena, V, 2002. Scientific Writing: Easy When You Know
How. BMJ Books, London. Silvia, PJ, 2007. How to Write a Lot: A Practical Guide to Productive Academic Writing.
American Psychological Association, Washington, DC.

AfJARE Vol 6 No 2 September 2011 Hugo De Groote
215
Stapleton, P, Youdeowei, H, Mukanyange, J & Van Houten, H, 1995. Scientific writing for agricultural research scientists: A training reference manual. West Africa Rice Development Association, Bouake, Côte d’Ivoire.
Strunk, WJ & White, EB, 1979[1918]. The Elements of Style. Revised. Macmillan, New York.
Thomson Reuters, 2011. Master Journal List. http://science.thomsonreuters.com/mjl/ Accessed 21 October 2011.
Trelease, SF, 1951. The Scientific Paper: How to Prepare It, How to Write It. The Williams & Wilkins Company, Baltimore, MD.
Zinsser, WK, 2006. On Writing Well: The Classic Guide to Writing Nonfiction. HarperCollins, New York.