How To Value Your Business Presented to the 43rd Annual Business Administration Conference NRMCA...
21
How To Value Your How To Value Your Business Business Presented to the 43rd Annual Business Administration Conference NRMCA October 24,2001 New Orleans
-
Upload
dorothy-edwina-williamson -
Category
Documents
-
view
224 -
download
2
Transcript of How To Value Your Business Presented to the 43rd Annual Business Administration Conference NRMCA...
How To Value Your How To Value Your BusinessBusiness
Presented to the 43rd Annual Business Administration Conference
NRMCA
October 24,2001
New Orleans
How To Value Your BusinessHow To Value Your Business
What is Value?
“Everything is worth what its purchaser will pay for it”
Publius, 1st century BC
Appraised Value Market Value These are two different numbers - affected by
timing and the nature of the transaction The “house next door” story
How To Value Your BusinessHow To Value Your Business
Why are Businesses Valued? Financing Internal sale
Divorce/Stockholder suit
Estate-planning purposes Tax purposes
Property/Estate taxes
Loss of management Buy-sell agreements ESOP Condemnation
How To Value Your BusinessHow To Value Your Business
Appraised Valuation Methods
Multiples of Earnings Before Interest, Taxes, Depreciation & Amortization (EBITDA)
Discounted Free Cash Flow Method Cost to Recreate (asset value approach) Price per annual production yard
How To Value Your BusinessHow To Value Your Business
Appraised Valuation Methods: Multiples of EBITDA
EBITDA is defined as Earnings Before Interest, Taxes, Depreciation and Amortization
It defines, in any single period, the amount of cash the business generates to pay principle, interest, taxes, and capital expenditures
It is the single most reliable tool used today to measure the performance of a business
How To Value Your BusinessHow To Value Your Business
Appraised Valuation Methods: Multiples of EBITDA
What period? Last 12 months? Average of the last three years?
Two ways to examine EBITDA Actual Recast
The results will be in a high-low range
How To Value Your BusinessHow To Value Your Business
Appraised Valuation Methods: Multiples of EBITDA
Recast EBITDA will translate into these values:
3.5 to 5 times for ready mixed and concrete products operations
5 to 9 times aggregate operations (maybe more?)
How To Value Your BusinessHow To Value Your Business
Appraised Valuation Methods: Discounted Free Cash Flow Method
Defined as the future cash flows earned by the Company’s assets, discounted to present value
Or, “the cash that is left after all expenses to service principle and interest”.
How To Value Your BusinessHow To Value Your Business
Appraised Valuation Methods: Discounted Free Cash Flow Method
Approaches: Free Cash Flows - defined as earnings before
interest and after taxes (EBIAT), plus depreciation, less capital expenditures and changes in working capital.
This is calculated over ten years...or as long as possible
Add the terminal value at the end of the projection period
How To Value Your BusinessHow To Value Your Business
Appraised Valuation Methods: Discounted Free Cash Flow Method
Results are then discounted A discount rate range is applied, based on current
market conditions (inflation rates are key) The net numbers based on these discount rates
establishes a range of values called the Weighted Average Cost of Capital (“WACC”)
This determines the total enterprise value - after deducting debt, it established the equity value to the owners.
How To Value Your BusinessHow To Value Your Business
Appraised Valuation Methods: Cost to Recreate (asset value approach)
Examine price of both new and used equipment, in place:
cost of land/cost of erection working capital permitting period (and impact of opportunity cost) start-up losses
Compare to actual market value of existing assets Not looking at appraised values (orderly/forced
liquidation approaches.) Looking strictly at the market
How To Value Your BusinessHow To Value Your Business
Appraised Valuation Methods: Price Per Production Yard
All methods combined lead to a range of “appraised value”
This is compared to a rule of thumb value approach: price per annual production yard
This may range from $25 - $50
How To Value Your BusinessHow To Value Your Business
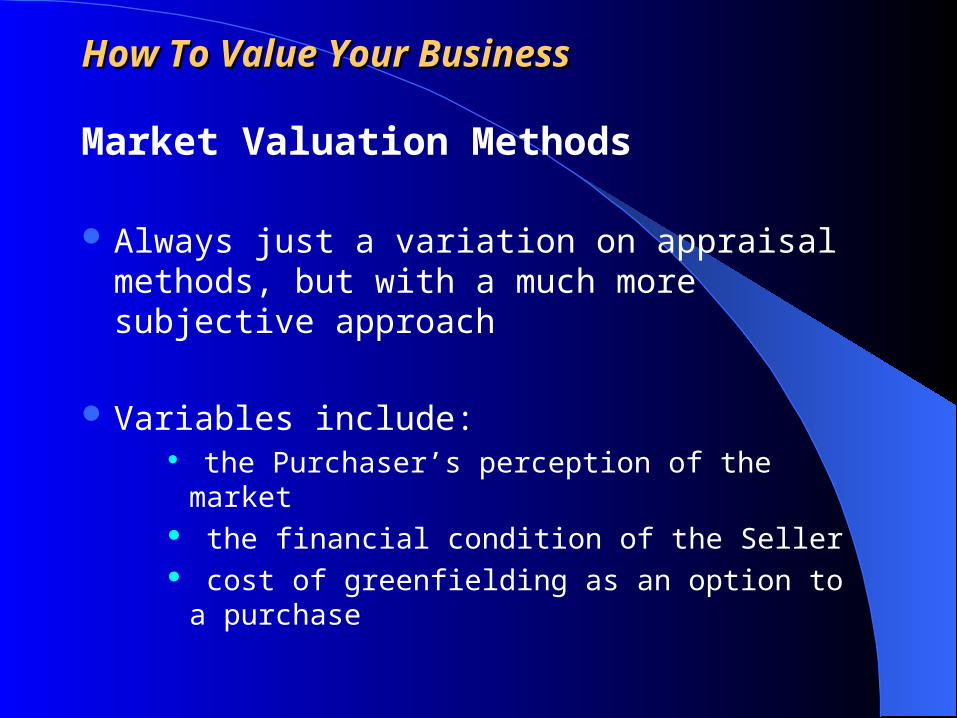
Market Valuation Methods
Always just a variation on appraisal methods, but with a much more subjective approach
Variables include: the Purchaser’s perception of the market the financial condition of the Seller cost of greenfielding as an option to a purchase
How To Value Your BusinessHow To Value Your Business
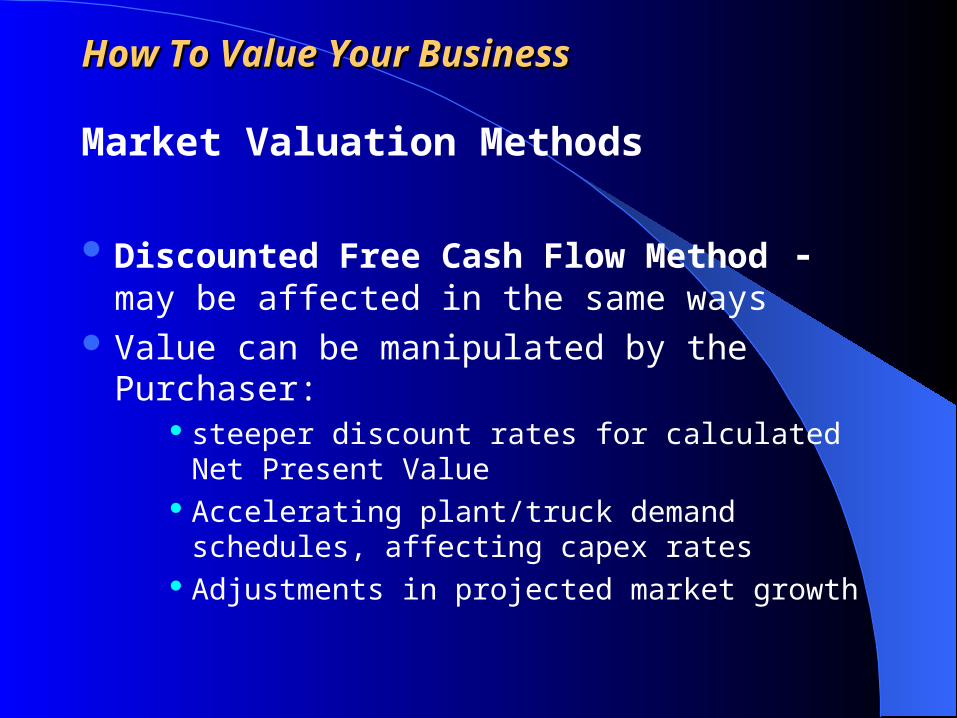
Market Valuation Methods
Discounted Free Cash Flow Method - may be affected in the same ways
Value can be manipulated by the Purchaser: steeper discount rates for calculated Net Present
Value Accelerating plant/truck demand schedules,
affecting capex rates Adjustments in projected market growth
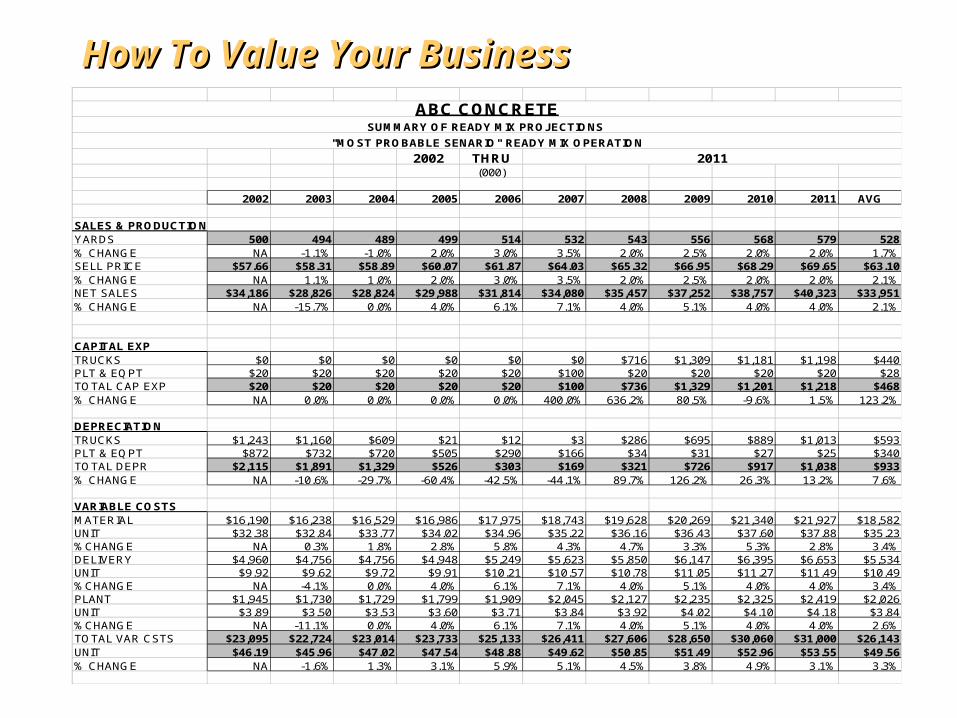
How To Value Your BusinessHow To Value Your BusinessABC CONCRETE
SUMMARY OF READY MIX PROJECTIONS
"MOST PROBABLE SENARIO" READY MIX OPERATION
2002 THRU 2011(000)
2002 2003 2004 2005 2006 2007 2008 2009 2010 2011 AVG
SALES & PRODUCTIONYARDS 500 494 489 499 514 532 543 556 568 579 528% CHANGE NA -1.1% -1.0% 2.0% 3.0% 3.5% 2.0% 2.5% 2.0% 2.0% 1.7%SELL PRICE $57.66 $58.31 $58.89 $60.07 $61.87 $64.03 $65.32 $66.95 $68.29 $69.65 $63.10% CHANGE NA 1.1% 1.0% 2.0% 3.0% 3.5% 2.0% 2.5% 2.0% 2.0% 2.1%NET SALES $34,186 $28,826 $28,824 $29,988 $31,814 $34,080 $35,457 $37,252 $38,757 $40,323 $33,951% CHANGE NA -15.7% 0.0% 4.0% 6.1% 7.1% 4.0% 5.1% 4.0% 4.0% 2.1%
CAPITAL EXPTRUCKS $0 $0 $0 $0 $0 $0 $716 $1,309 $1,181 $1,198 $440PLT & EQPT $20 $20 $20 $20 $20 $100 $20 $20 $20 $20 $28TOTAL CAP EXP $20 $20 $20 $20 $20 $100 $736 $1,329 $1,201 $1,218 $468% CHANGE NA 0.0% 0.0% 0.0% 0.0% 400.0% 636.2% 80.5% -9.6% 1.5% 123.2%
DEPRECIATIONTRUCKS $1,243 $1,160 $609 $21 $12 $3 $286 $695 $889 $1,013 $593PLT & EQPT $872 $732 $720 $505 $290 $166 $34 $31 $27 $25 $340TOTAL DEPR $2,115 $1,891 $1,329 $526 $303 $169 $321 $726 $917 $1,038 $933% CHANGE NA -10.6% -29.7% -60.4% -42.5% -44.1% 89.7% 126.2% 26.3% 13.2% 7.6%
VARIABLE COSTSMATERIAL $16,190 $16,238 $16,529 $16,986 $17,975 $18,743 $19,628 $20,269 $21,340 $21,927 $18,582UNIT $32.38 $32.84 $33.77 $34.02 $34.96 $35.22 $36.16 $36.43 $37.60 $37.88 $35.23%CHANGE NA 0.3% 1.8% 2.8% 5.8% 4.3% 4.7% 3.3% 5.3% 2.8% 3.4%DELIVERY $4,960 $4,756 $4,756 $4,948 $5,249 $5,623 $5,850 $6,147 $6,395 $6,653 $5,534UNIT $9.92 $9.62 $9.72 $9.91 $10.21 $10.57 $10.78 $11.05 $11.27 $11.49 $10.49%CHANGE NA -4.1% 0.0% 4.0% 6.1% 7.1% 4.0% 5.1% 4.0% 4.0% 3.4%PLANT $1,945 $1,730 $1,729 $1,799 $1,909 $2,045 $2,127 $2,235 $2,325 $2,419 $2,026UNIT $3.89 $3.50 $3.53 $3.60 $3.71 $3.84 $3.92 $4.02 $4.10 $4.18 $3.84%CHANGE NA -11.1% 0.0% 4.0% 6.1% 7.1% 4.0% 5.1% 4.0% 4.0% 2.6%TOTAL VAR CSTS $23,095 $22,724 $23,014 $23,733 $25,133 $26,411 $27,606 $28,650 $30,060 $31,000 $26,143UNIT $46.19 $45.96 $47.02 $47.54 $48.88 $49.62 $50.85 $51.49 $52.96 $53.55 $49.56% CHANGE NA -1.6% 1.3% 3.1% 5.9% 5.1% 4.5% 3.8% 4.9% 3.1% 3.3%
How To Value Your BusinessHow To Value Your Business
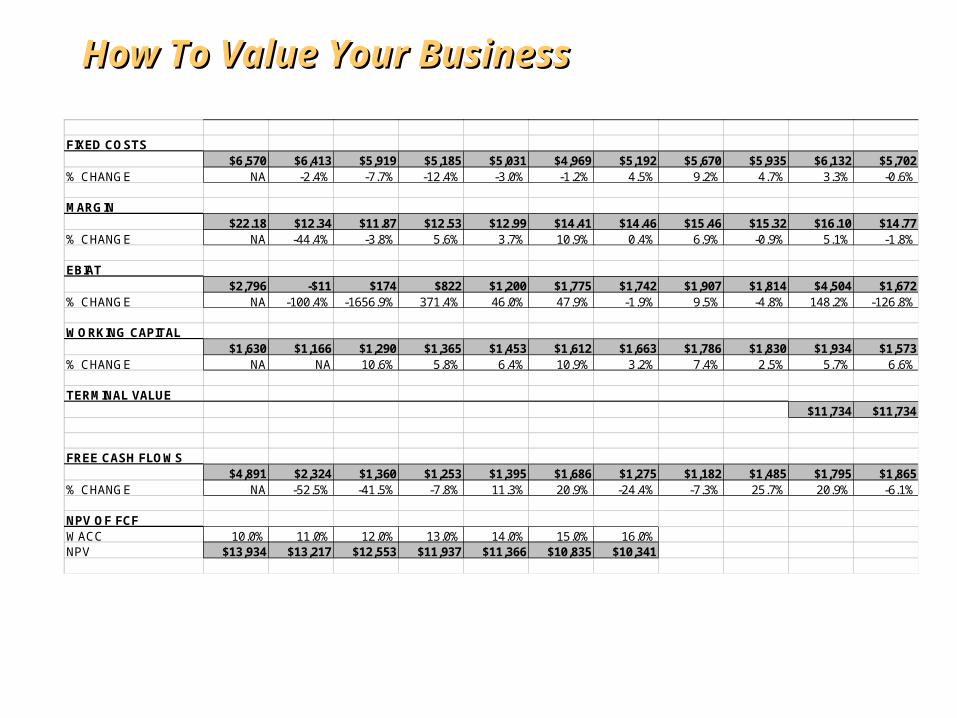
FIXED COSTS$6,570 $6,413 $5,919 $5,185 $5,031 $4,969 $5,192 $5,670 $5,935 $6,132 $5,702
% CHANGE NA -2.4% -7.7% -12.4% -3.0% -1.2% 4.5% 9.2% 4.7% 3.3% -0.6%
MARGIN$22.18 $12.34 $11.87 $12.53 $12.99 $14.41 $14.46 $15.46 $15.32 $16.10 $14.77
% CHANGE NA -44.4% -3.8% 5.6% 3.7% 10.9% 0.4% 6.9% -0.9% 5.1% -1.8%
EBIAT$2,796 -$11 $174 $822 $1,200 $1,775 $1,742 $1,907 $1,814 $4,504 $1,672
% CHANGE NA -100.4% -1656.9% 371.4% 46.0% 47.9% -1.9% 9.5% -4.8% 148.2% -126.8%
WORKING CAPITAL$1,630 $1,166 $1,290 $1,365 $1,453 $1,612 $1,663 $1,786 $1,830 $1,934 $1,573
% CHANGE NA NA 10.6% 5.8% 6.4% 10.9% 3.2% 7.4% 2.5% 5.7% 6.6%
TERMINAL VALUE$11,734 $11,734
FREE CASH FLOWS$4,891 $2,324 $1,360 $1,253 $1,395 $1,686 $1,275 $1,182 $1,485 $1,795 $1,865
% CHANGE NA -52.5% -41.5% -7.8% 11.3% 20.9% -24.4% -7.3% 25.7% 20.9% -6.1%
NPV OF FCFWACC 10.0% 11.0% 12.0% 13.0% 14.0% 15.0% 16.0%NPV $13,934 $13,217 $12,553 $11,937 $11,366 $10,835 $10,341
How To Value Your BusinessHow To Value Your Business
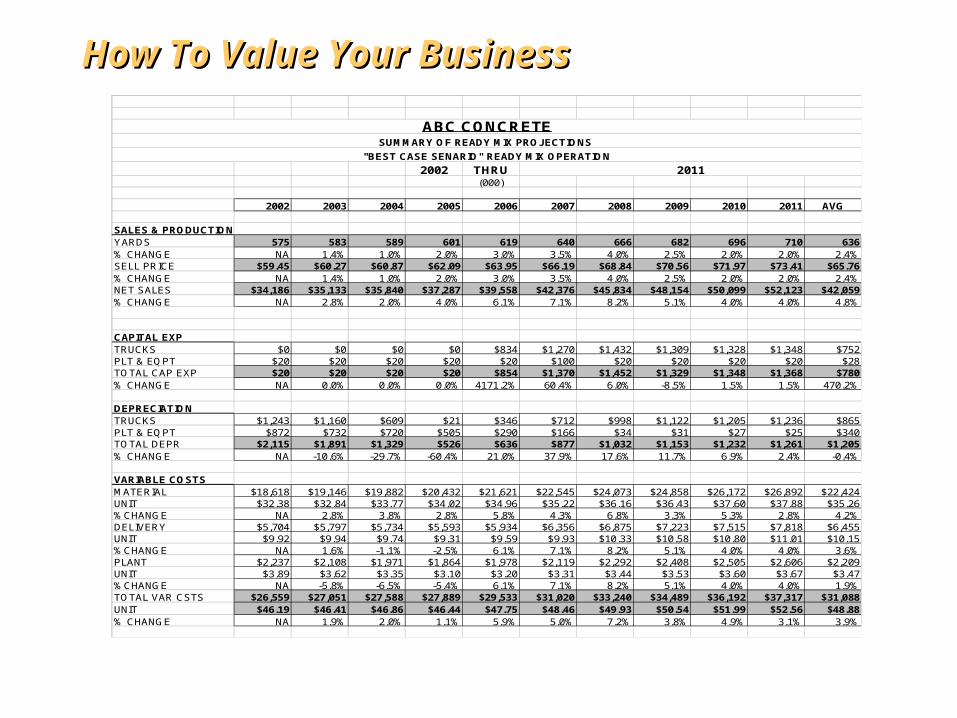
ABC CONCRETESUMMARY OF READY MIX PROJECTIONS
"BEST CASE SENARIO" READY MIX OPERATION
2002 THRU 2011(000)
2002 2003 2004 2005 2006 2007 2008 2009 2010 2011 AVG
SALES & PRODUCTIONYARDS 575 583 589 601 619 640 666 682 696 710 636% CHANGE NA 1.4% 1.0% 2.0% 3.0% 3.5% 4.0% 2.5% 2.0% 2.0% 2.4%SELL PRICE $59.45 $60.27 $60.87 $62.09 $63.95 $66.19 $68.84 $70.56 $71.97 $73.41 $65.76% CHANGE NA 1.4% 1.0% 2.0% 3.0% 3.5% 4.0% 2.5% 2.0% 2.0% 2.4%NET SALES $34,186 $35,133 $35,840 $37,287 $39,558 $42,376 $45,834 $48,154 $50,099 $52,123 $42,059% CHANGE NA 2.8% 2.0% 4.0% 6.1% 7.1% 8.2% 5.1% 4.0% 4.0% 4.8%
CAPITAL EXPTRUCKS $0 $0 $0 $0 $834 $1,270 $1,432 $1,309 $1,328 $1,348 $752PLT & EQPT $20 $20 $20 $20 $20 $100 $20 $20 $20 $20 $28TOTAL CAP EXP $20 $20 $20 $20 $854 $1,370 $1,452 $1,329 $1,348 $1,368 $780% CHANGE NA 0.0% 0.0% 0.0% 4171.2% 60.4% 6.0% -8.5% 1.5% 1.5% 470.2%
DEPRECIATIONTRUCKS $1,243 $1,160 $609 $21 $346 $712 $998 $1,122 $1,205 $1,236 $865PLT & EQPT $872 $732 $720 $505 $290 $166 $34 $31 $27 $25 $340TOTAL DEPR $2,115 $1,891 $1,329 $526 $636 $877 $1,032 $1,153 $1,232 $1,261 $1,205% CHANGE NA -10.6% -29.7% -60.4% 21.0% 37.9% 17.6% 11.7% 6.9% 2.4% -0.4%
VARIABLE COSTSMATERIAL $18,618 $19,146 $19,882 $20,432 $21,621 $22,545 $24,073 $24,858 $26,172 $26,892 $22,424UNIT $32.38 $32.84 $33.77 $34.02 $34.96 $35.22 $36.16 $36.43 $37.60 $37.88 $35.26%CHANGE NA 2.8% 3.8% 2.8% 5.8% 4.3% 6.8% 3.3% 5.3% 2.8% 4.2%DELIVERY $5,704 $5,797 $5,734 $5,593 $5,934 $6,356 $6,875 $7,223 $7,515 $7,818 $6,455UNIT $9.92 $9.94 $9.74 $9.31 $9.59 $9.93 $10.33 $10.58 $10.80 $11.01 $10.15%CHANGE NA 1.6% -1.1% -2.5% 6.1% 7.1% 8.2% 5.1% 4.0% 4.0% 3.6%PLANT $2,237 $2,108 $1,971 $1,864 $1,978 $2,119 $2,292 $2,408 $2,505 $2,606 $2,209UNIT $3.89 $3.62 $3.35 $3.10 $3.20 $3.31 $3.44 $3.53 $3.60 $3.67 $3.47%CHANGE NA -5.8% -6.5% -5.4% 6.1% 7.1% 8.2% 5.1% 4.0% 4.0% 1.9%TOTAL VAR CSTS $26,559 $27,051 $27,588 $27,889 $29,533 $31,020 $33,240 $34,489 $36,192 $37,317 $31,088UNIT $46.19 $46.41 $46.86 $46.44 $47.75 $48.46 $49.93 $50.54 $51.99 $52.56 $48.88% CHANGE NA 1.9% 2.0% 1.1% 5.9% 5.0% 7.2% 3.8% 4.9% 3.1% 3.9%
How To Value Your BusinessHow To Value Your Business
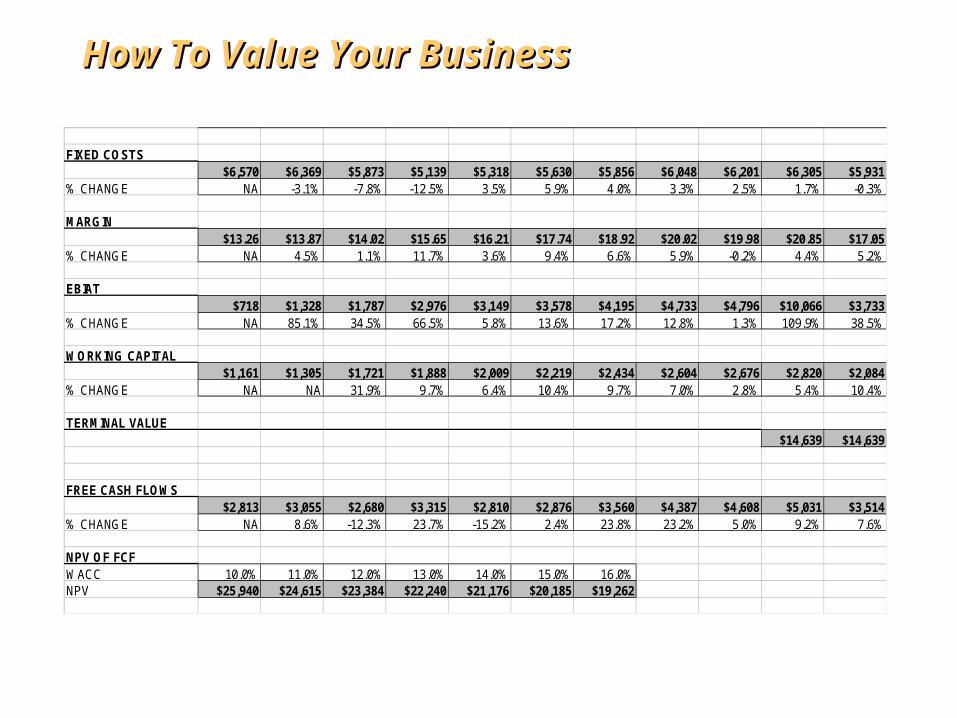
Market Valuation MethodsFIXED COSTS$6,570 $6,369 $5,873 $5,139 $5,318 $5,630 $5,856 $6,048 $6,201 $6,305 $5,931
% CHANGE NA -3.1% -7.8% -12.5% 3.5% 5.9% 4.0% 3.3% 2.5% 1.7% -0.3%
MARGIN$13.26 $13.87 $14.02 $15.65 $16.21 $17.74 $18.92 $20.02 $19.98 $20.85 $17.05
% CHANGE NA 4.5% 1.1% 11.7% 3.6% 9.4% 6.6% 5.9% -0.2% 4.4% 5.2%
EBIAT$718 $1,328 $1,787 $2,976 $3,149 $3,578 $4,195 $4,733 $4,796 $10,066 $3,733
% CHANGE NA 85.1% 34.5% 66.5% 5.8% 13.6% 17.2% 12.8% 1.3% 109.9% 38.5%
WORKING CAPITAL$1,161 $1,305 $1,721 $1,888 $2,009 $2,219 $2,434 $2,604 $2,676 $2,820 $2,084
% CHANGE NA NA 31.9% 9.7% 6.4% 10.4% 9.7% 7.0% 2.8% 5.4% 10.4%
TERMINAL VALUE$14,639 $14,639
FREE CASH FLOWS$2,813 $3,055 $2,680 $3,315 $2,810 $2,876 $3,560 $4,387 $4,608 $5,031 $3,514
% CHANGE NA 8.6% -12.3% 23.7% -15.2% 2.4% 23.8% 23.2% 5.0% 9.2% 7.6%
NPV OF FCFWACC 10.0% 11.0% 12.0% 13.0% 14.0% 15.0% 16.0%NPV $25,940 $24,615 $23,384 $22,240 $21,176 $20,185 $19,262
How To Value Your BusinessHow To Value Your Business
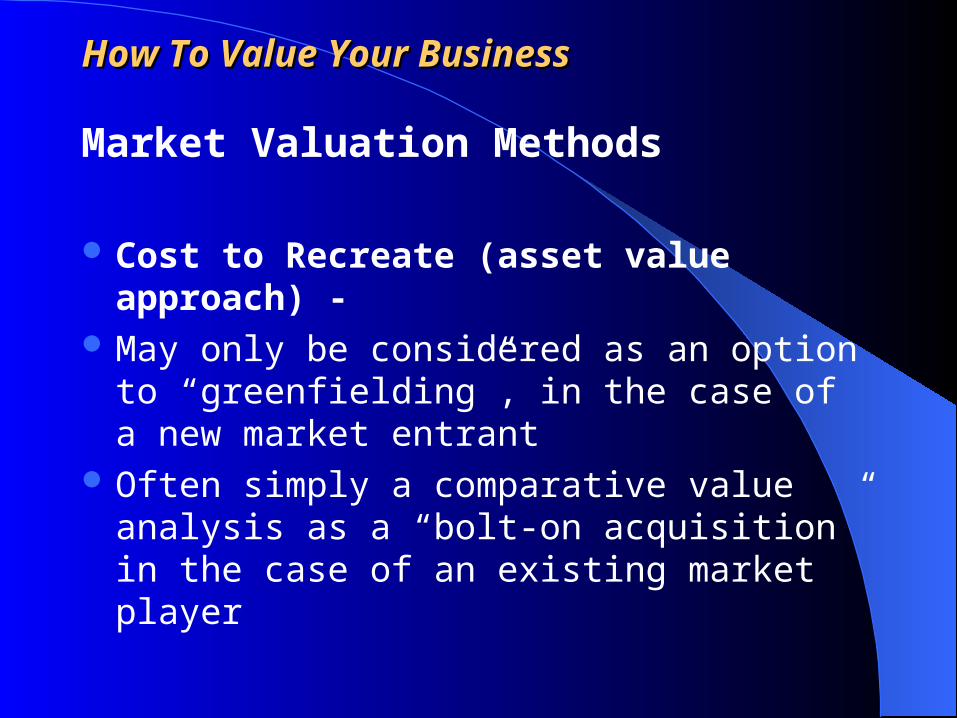
Market Valuation Methods
Cost to Recreate (asset value approach) - May only be considered as an option to
“greenfielding”, in the case of a new market entrant
Often simply a comparative value analysis as a “bolt-on acquisition” in the case of an existing market player
How To Value Your BusinessHow To Value Your Business
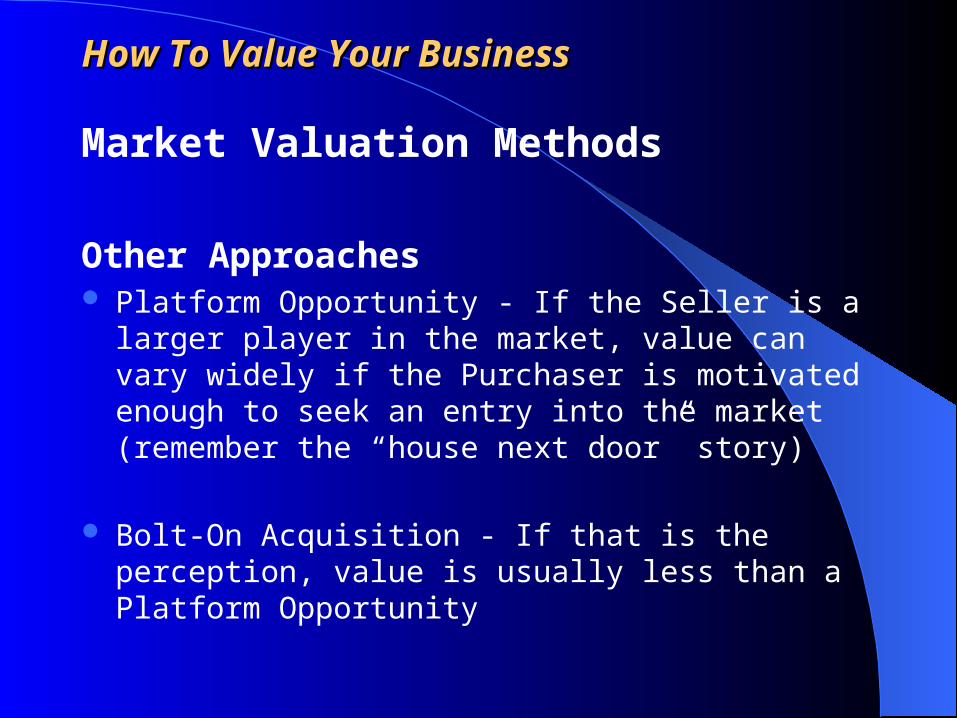
Market Valuation Methods
Other Approaches Platform Opportunity - If the Seller is a larger player in the
market, value can vary widely if the Purchaser is motivated enough to seek an entry into the market (remember the “house next door” story)
Bolt-On Acquisition - If that is the perception, value is usually less than a Platform Opportunity
How To Value Your BusinessHow To Value Your Business
Summary
There is a difference between appraisal and market value methods
Each has its own purpose and place in establishing how a business is valued
The two approaches do not always produce the same value equation, particularly in changing market conditions