
How to Use TNavigator
55
General description of tNavigator Training Tutorials 2014 Rock Flow Dynamics
-
Upload
muhammadmulyawan -
Category
Documents
-
view
441 -
download
25
description
Tutorial of Tnavigator, reservoir simulator
Transcript of How to Use TNavigator
7/17/2019 How to Use TNavigator
http://slidepdf.com/reader/full/how-to-use-tnavigator 1/55
General description of tNavigator
Training Tutorials 2014
Rock Flow Dynamics
7/17/2019 How to Use TNavigator
http://slidepdf.com/reader/full/how-to-use-tnavigator 2/55
2
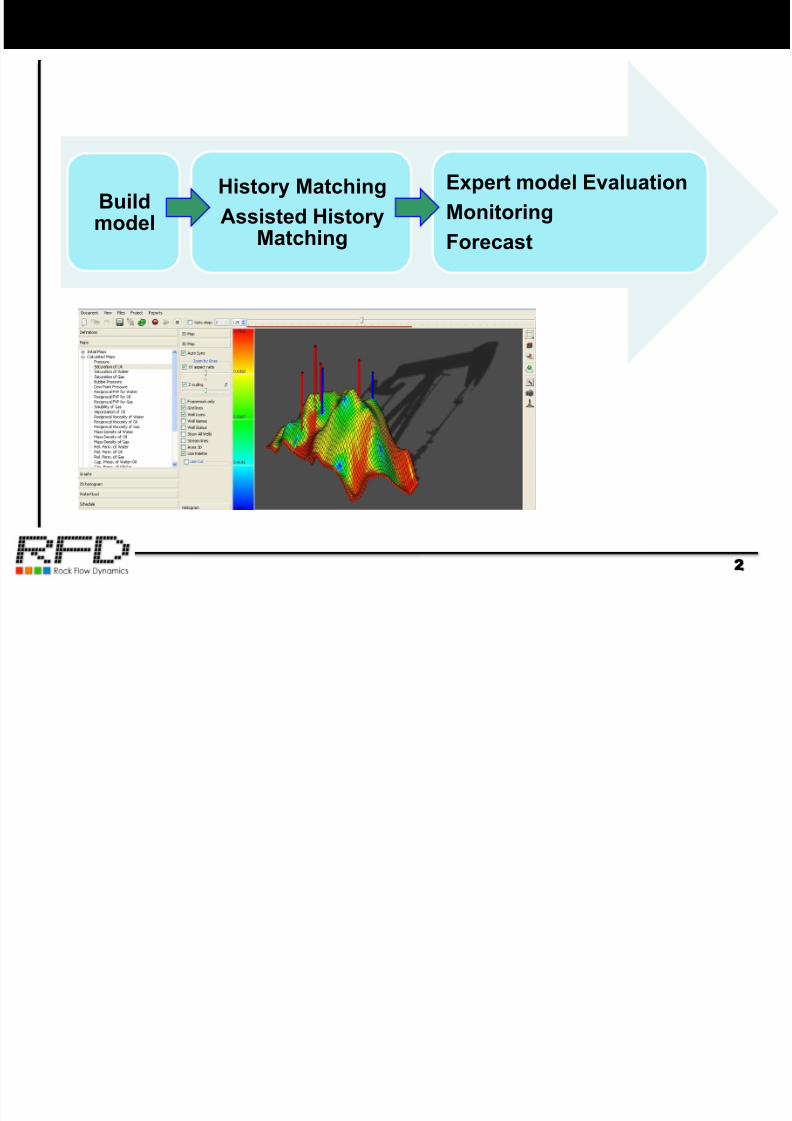
Reservoir simulation tasks
2
Buildmodel
History Matching
Assisted HistoryMatching
Expert model Evaluation
Monitoring
Forecast
7/17/2019 How to Use TNavigator
http://slidepdf.com/reader/full/how-to-use-tnavigator 3/55
3
tNavigator main window
3
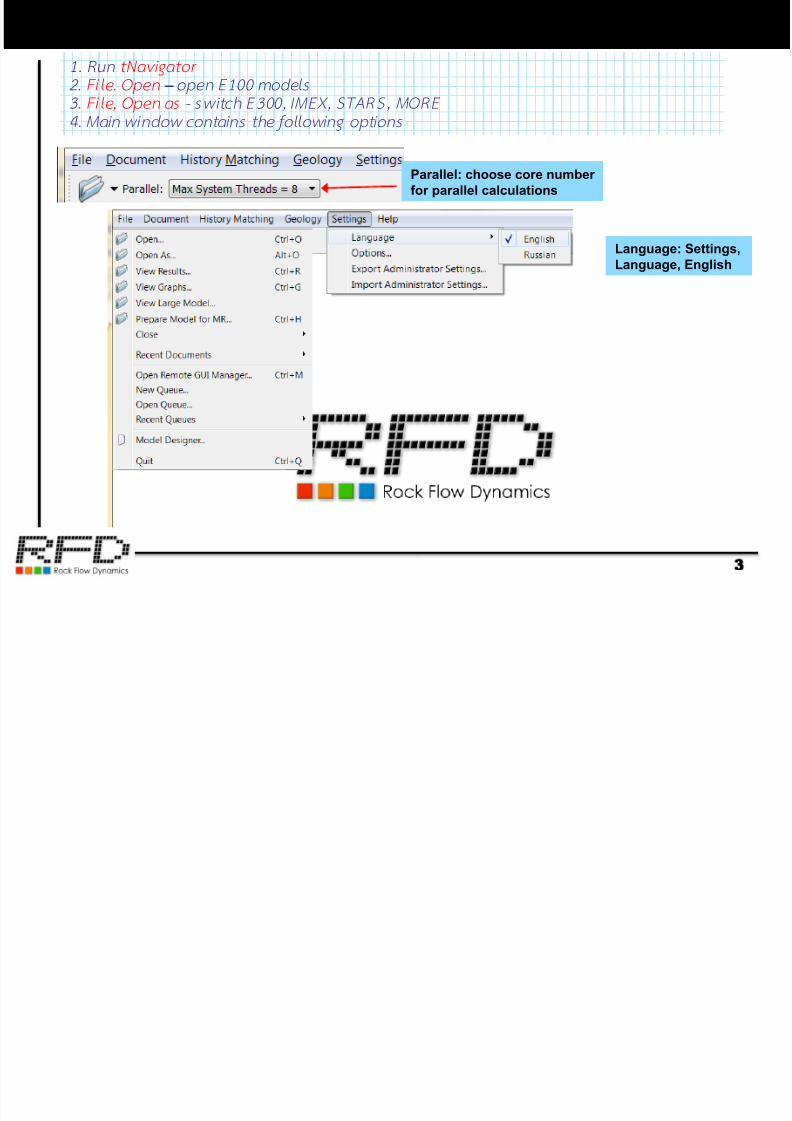
1. Run tNavigator
2. File. Open – open E100 models
3. File, Open as - sw itch E300, IMEX, STARS, MORE
4. Main w indow c ontains the fol lowing opt ions
Language: Settings,
Language, English
Parallel: choose core number
for parallel calculations
7/17/2019 How to Use TNavigator
http://slidepdf.com/reader/full/how-to-use-tnavigator 4/55
4
Open model
4
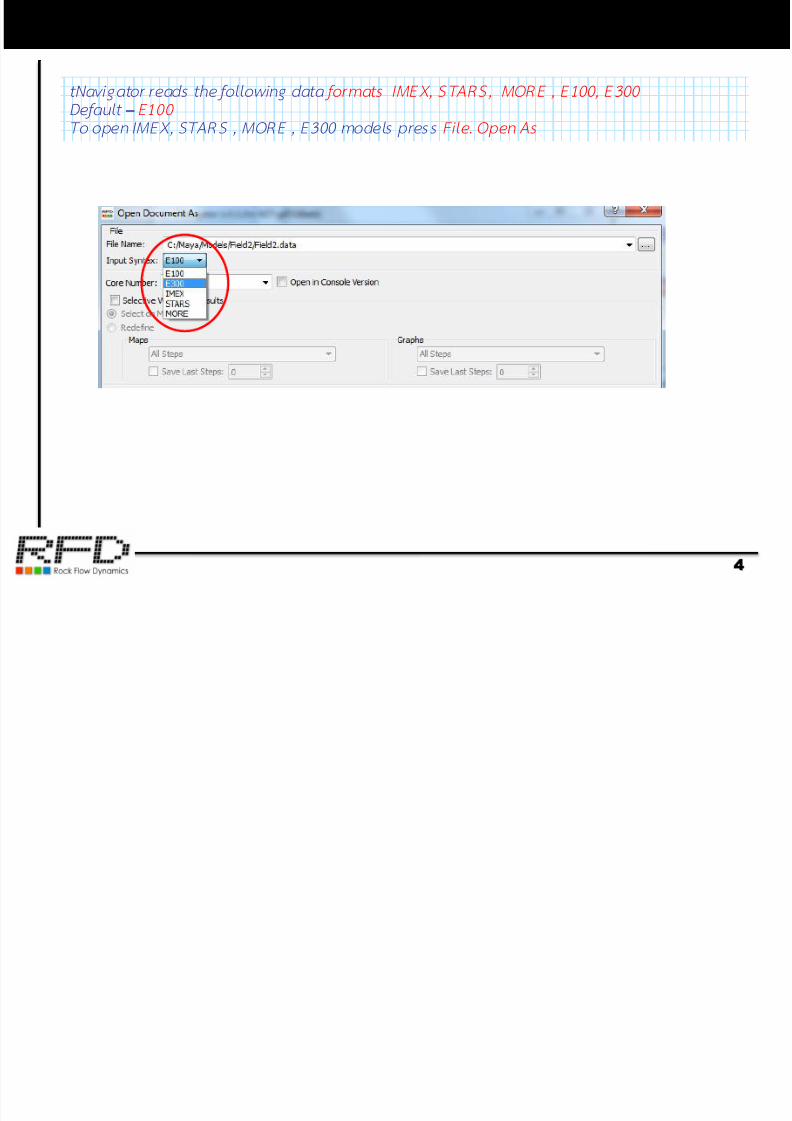
tNavigator reads the fol low ing data formats IMEX, STARS, MORE , E100, E300
Default – E100
To open IMEX, STARS , MORE , E300 mod els press Fi le. Open As
7/17/2019 How to Use TNavigator
http://slidepdf.com/reader/full/how-to-use-tnavigator 5/55
5
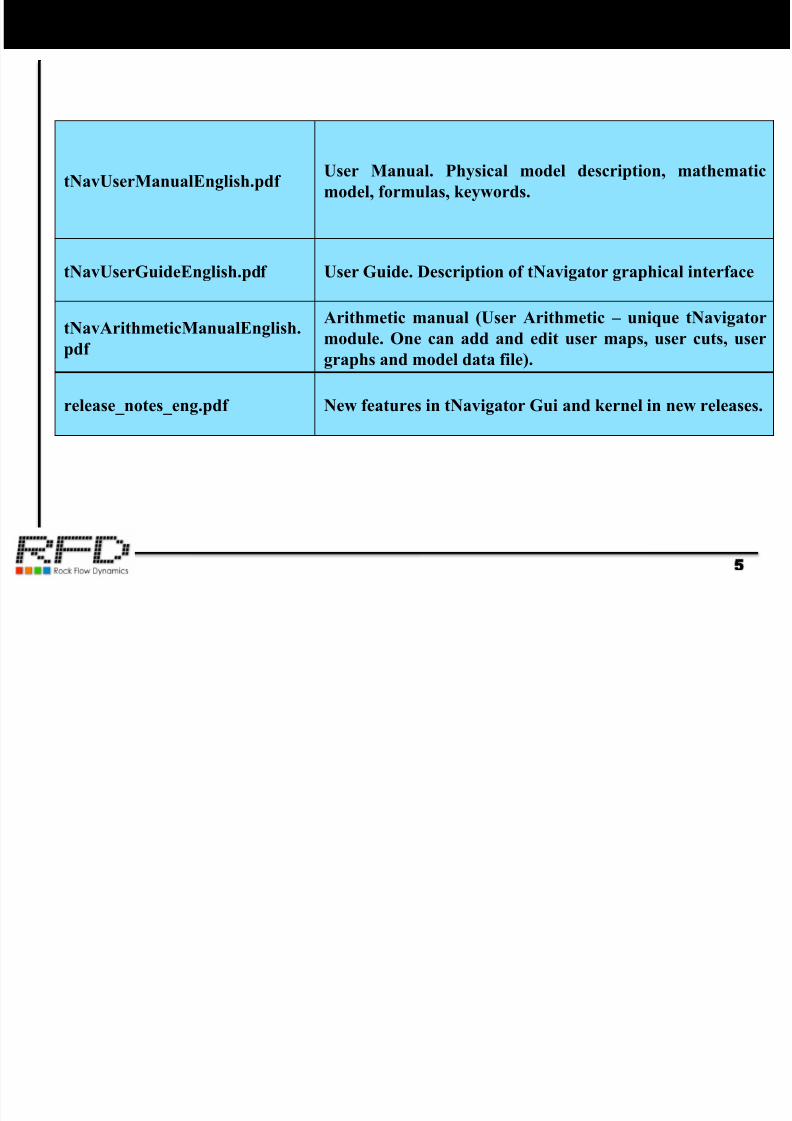
tNavigator documentation
5
tNavUserManualEnglish.pdfUser Manual. Physical model description, mathematic
model, formulas, keywords.
tNavUserGuideEnglish.pdf User Guide. Description of tNavigator graphical interface
tNavArithmeticManualEnglish.
Arithmetic manual (User Arithmetic – unique tNavigator
module. One can add and edit user maps, user cuts, user
graphs and model data file).
release_notes_eng.pdf New features in tNavigator Gui and kernel in new releases.
7/17/2019 How to Use TNavigator
http://slidepdf.com/reader/full/how-to-use-tnavigator 6/55
6
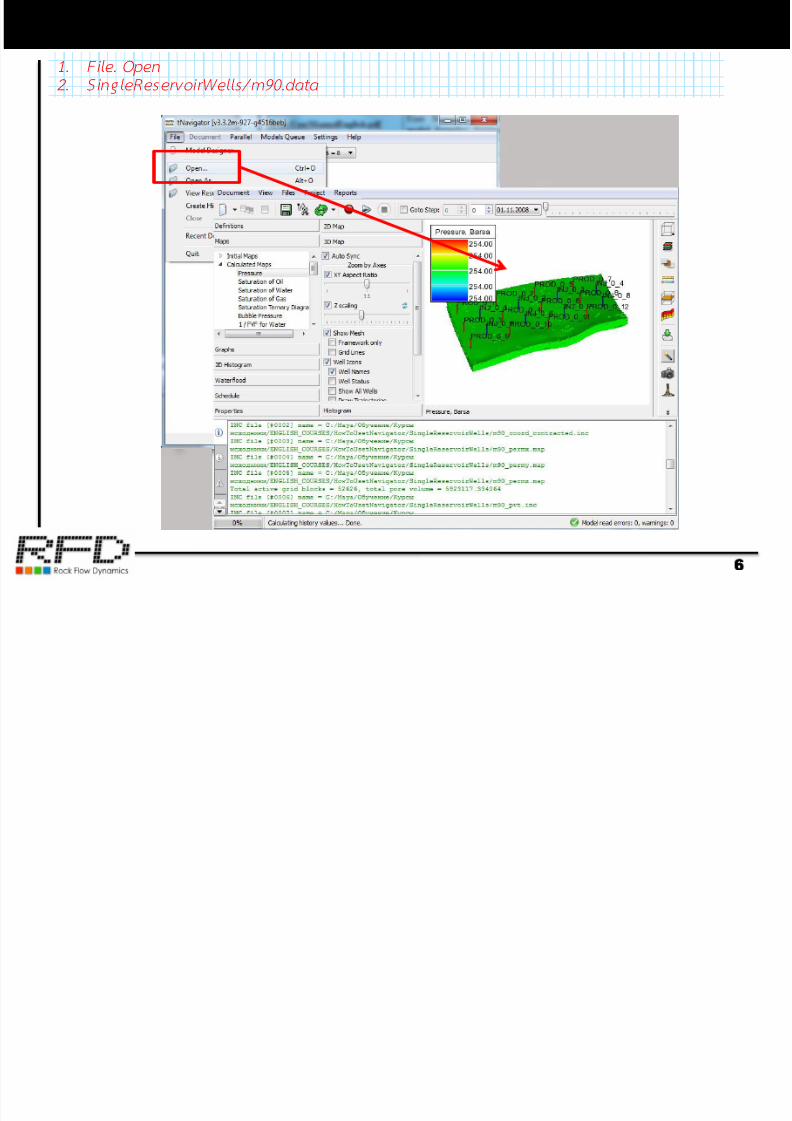
Open model
6
1. Fi le. Op en
2 . S ing leReservo irWe ll s / m90.da ta
7/17/2019 How to Use TNavigator
http://slidepdf.com/reader/full/how-to-use-tnavigator 7/55
73D visualization
7
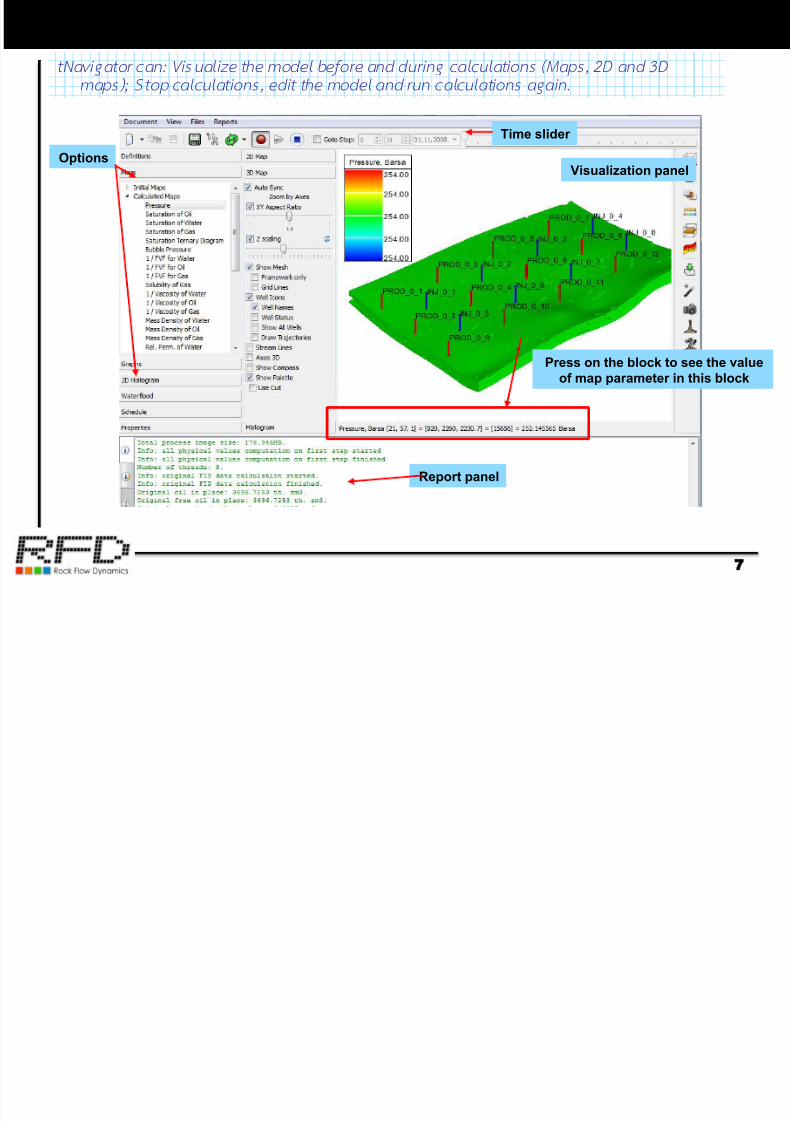
Visualization panelOptions
Report panel
Time slider
tNavigator can: Visual ize the mo del before and durin g calculat ion s (Maps, 2D and 3D
maps); Stop calculat ions, edi t the m odel and run calculat ions again.
Press on the block to see the value
of map parameter in this block
7/17/2019 How to Use TNavigator
http://slidepdf.com/reader/full/how-to-use-tnavigator 8/55
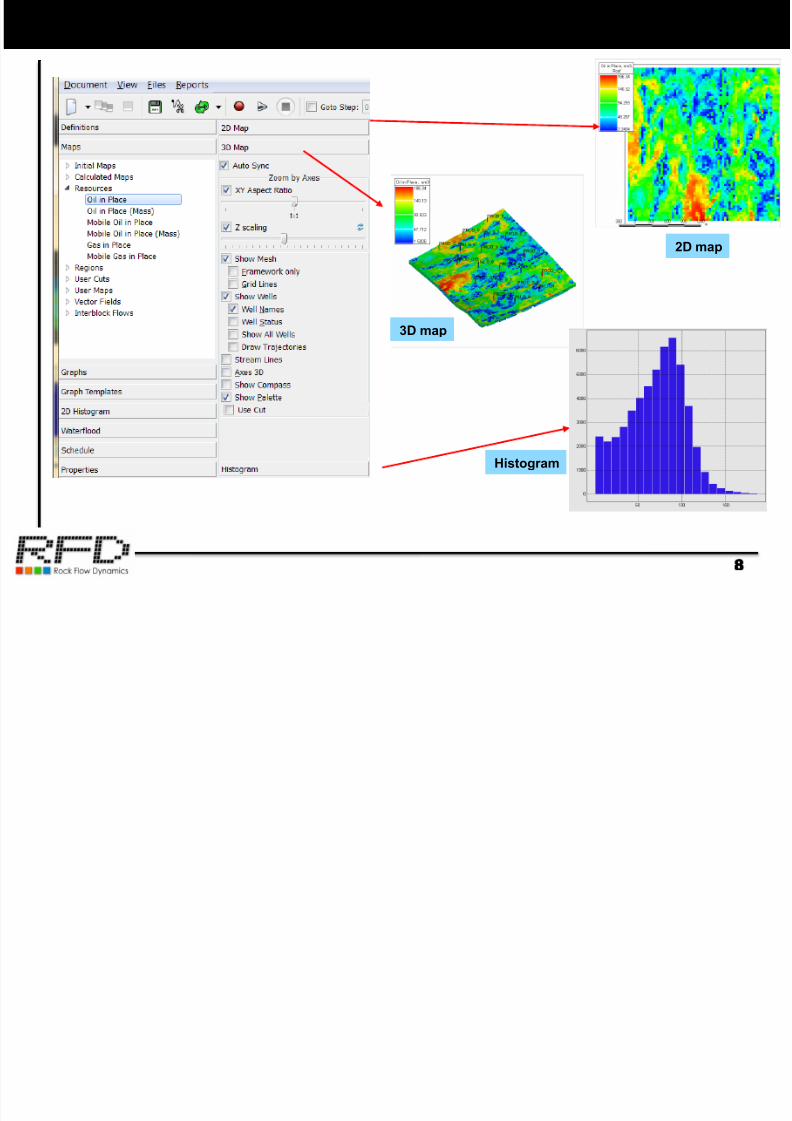
8Maps
8
2D map
Histogram
3D map
7/17/2019 How to Use TNavigator
http://slidepdf.com/reader/full/how-to-use-tnavigator 9/55
9Maps List
9
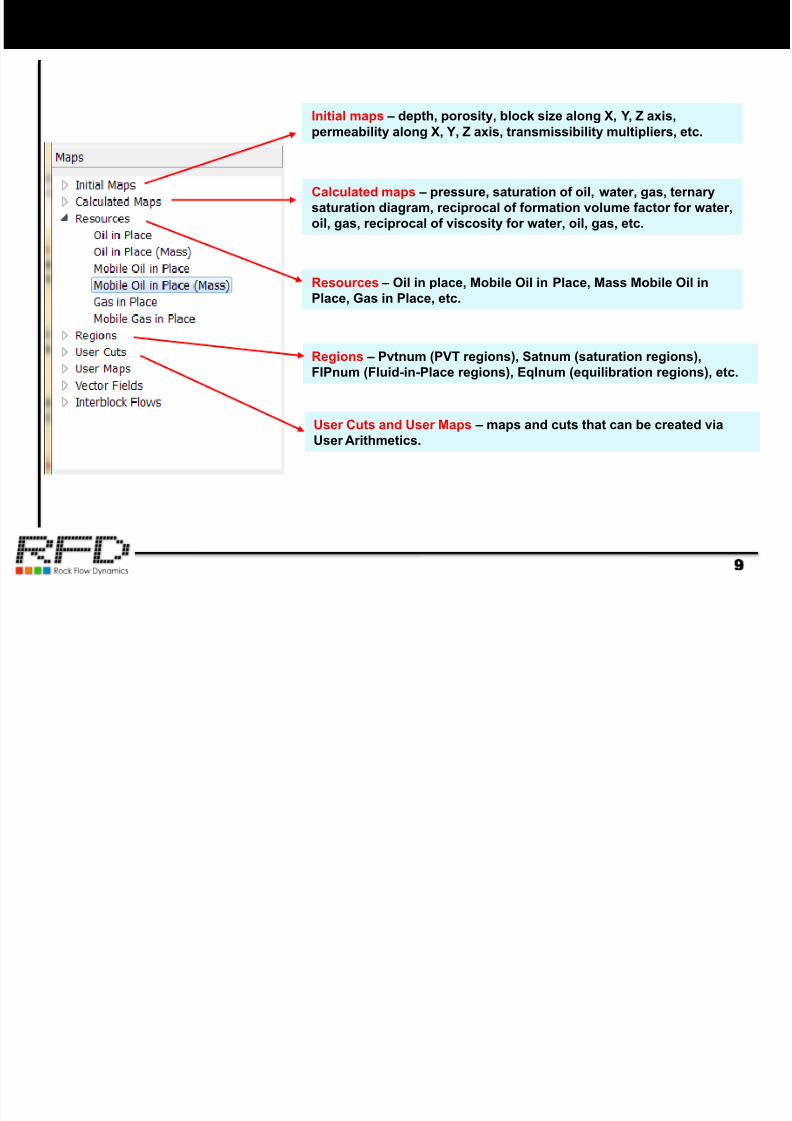
Initial maps – depth, porosity, block size along X, Y, Z axis,
permeability along X, Y, Z axis, transmissibility multipliers, etc.
Calculated maps – pressure, saturation of oil, water, gas, ternary
saturation diagram, reciprocal of formation volume factor for water,
oil, gas, reciprocal of viscosity for water, oil, gas, etc.
Resources – Oil in place, Mobile Oil in Place, Mass Mobile Oil in
Place, Gas in Place, etc.
Regions – Pvtnum (PVT regions), Satnum (saturation regions),
FIPnum (Fluid-in-Place regions), Eqlnum (equilibration regions), etc.
User Cuts and User Maps – maps and cuts that can be created via
User Arithmetics.
7/17/2019 How to Use TNavigator
http://slidepdf.com/reader/full/how-to-use-tnavigator 10/55
3D visualization
10
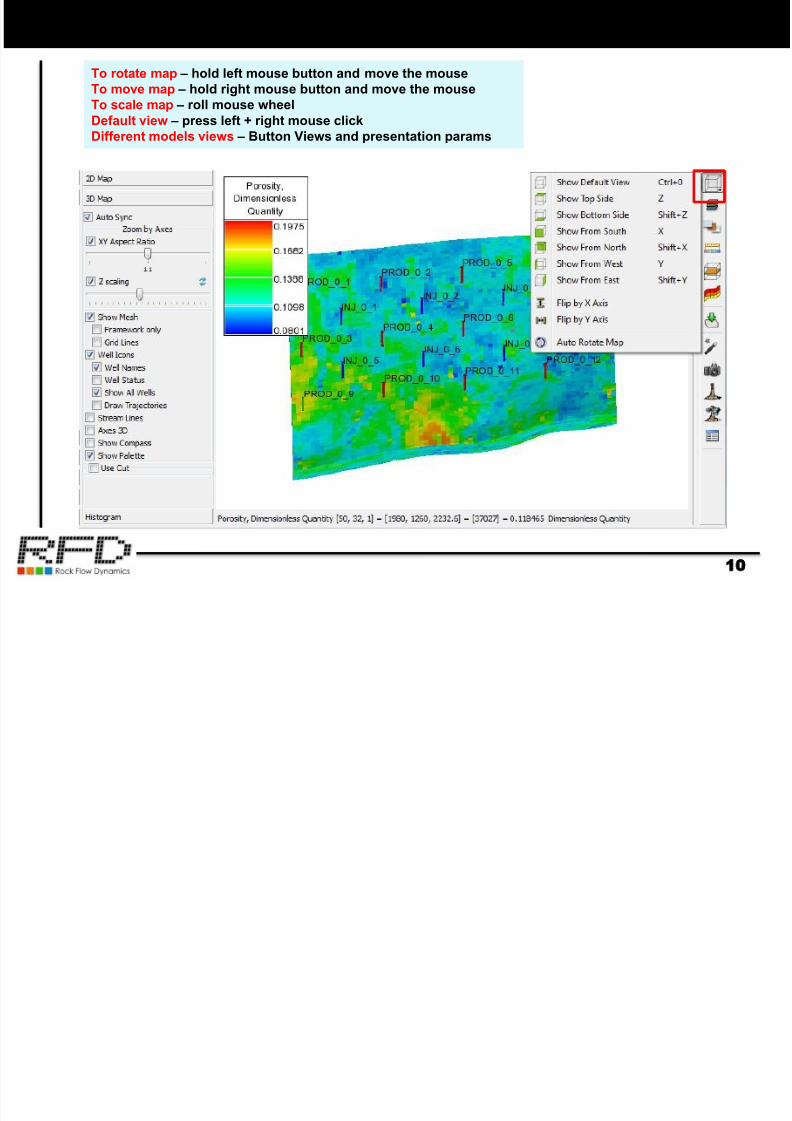
To rotate map – hold left mouse button and move the mouse
To move map – hold right mouse button and move the mouse
To scale map – roll mouse wheel
Default view – press left + right mouse click
Different models views – Button Views and presentation params
7/17/2019 How to Use TNavigator
http://slidepdf.com/reader/full/how-to-use-tnavigator 11/55
11Block statistics
11
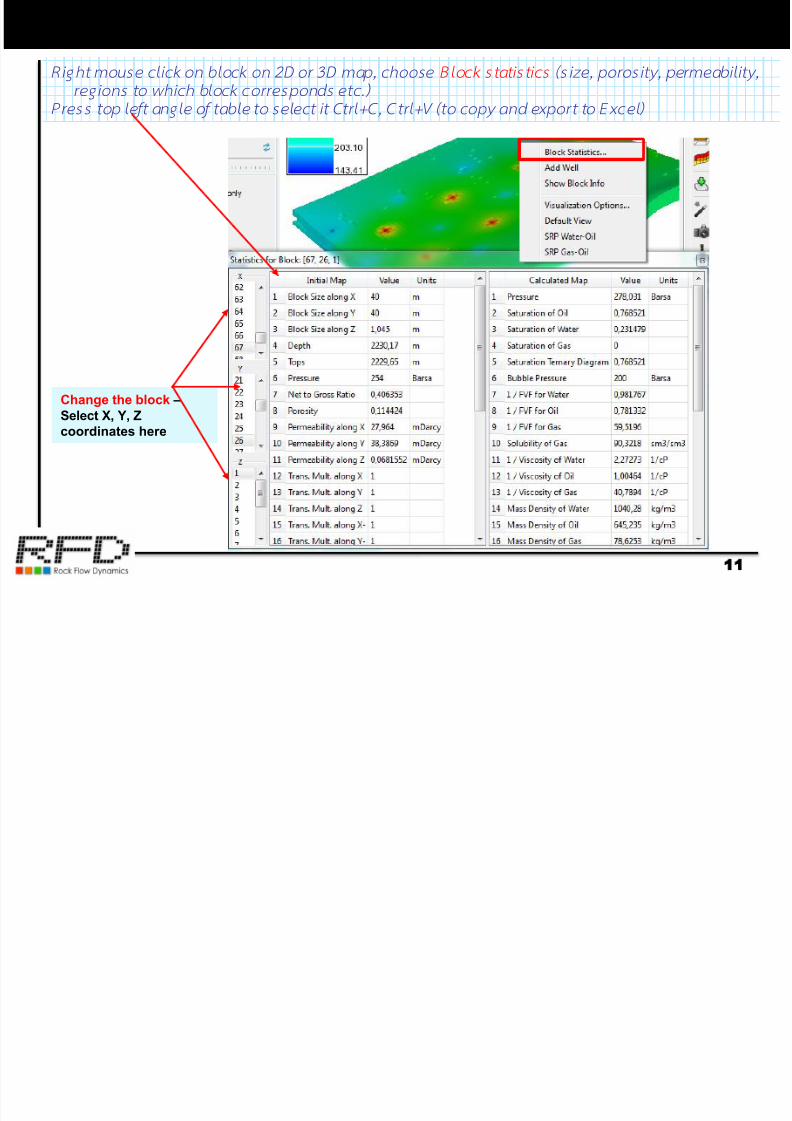
Right mous e cl ick on bloc k on 2D or 3D map, choos e Block s tat is t ics (size, por osity, p ermeabi l i ty,
regions to wh ich block correspon ds etc.)
Press top left angle of table to s elect i t Ctrl+C, Ctrl+V (to co py and expor t to Excel)
Change the block –
Select X, Y, Zcoordinates here
7/17/2019 How to Use TNavigator
http://slidepdf.com/reader/full/how-to-use-tnavigator 12/55
12Palette
12
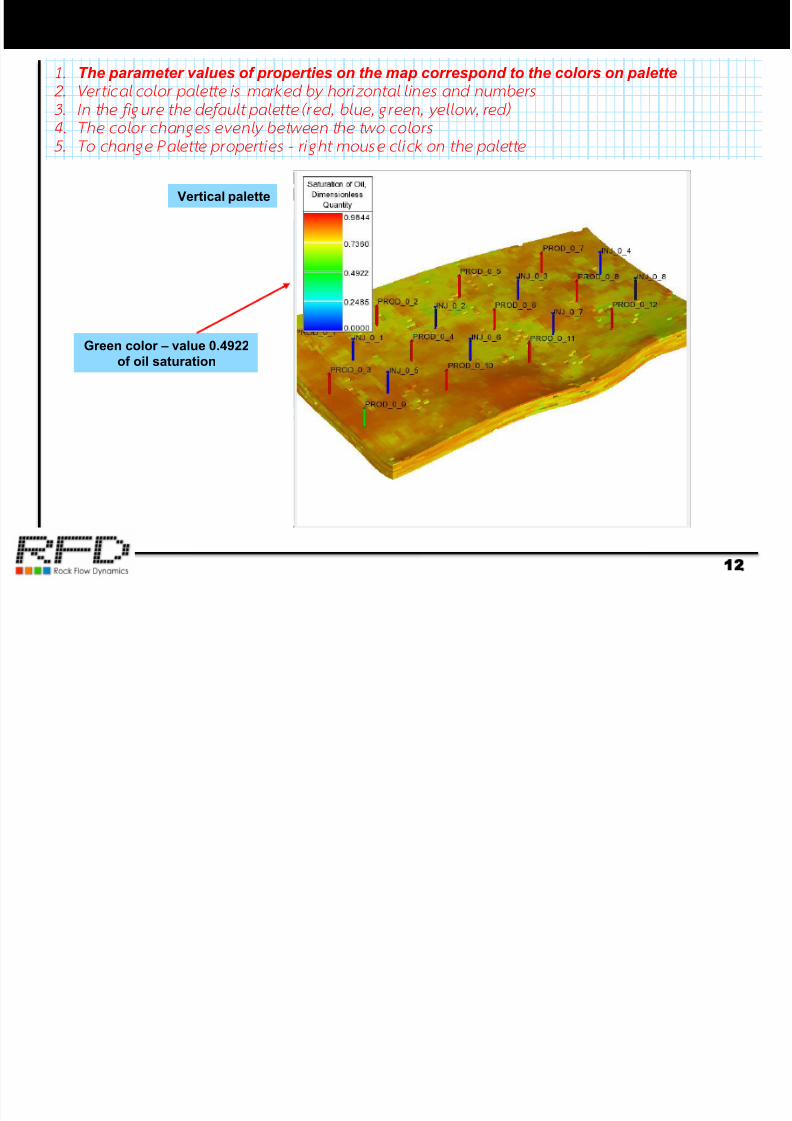
Vertical palette
1. The parameter values of properties on the map correspond to the colors on palette
2. Vert ical color palet te is marked by horizontal lines and num bers
3. In the f igure the defaul t palet te (red, blue, green, yel low, red)
4. The co lor changes evenly between the two co lors
5. To change Palet te propert ies - r ight mous e cl ick on the palet te
Green color – value 0.4922
of oil saturation
7/17/2019 How to Use TNavigator
http://slidepdf.com/reader/full/how-to-use-tnavigator 13/55
13Discrete palette
13
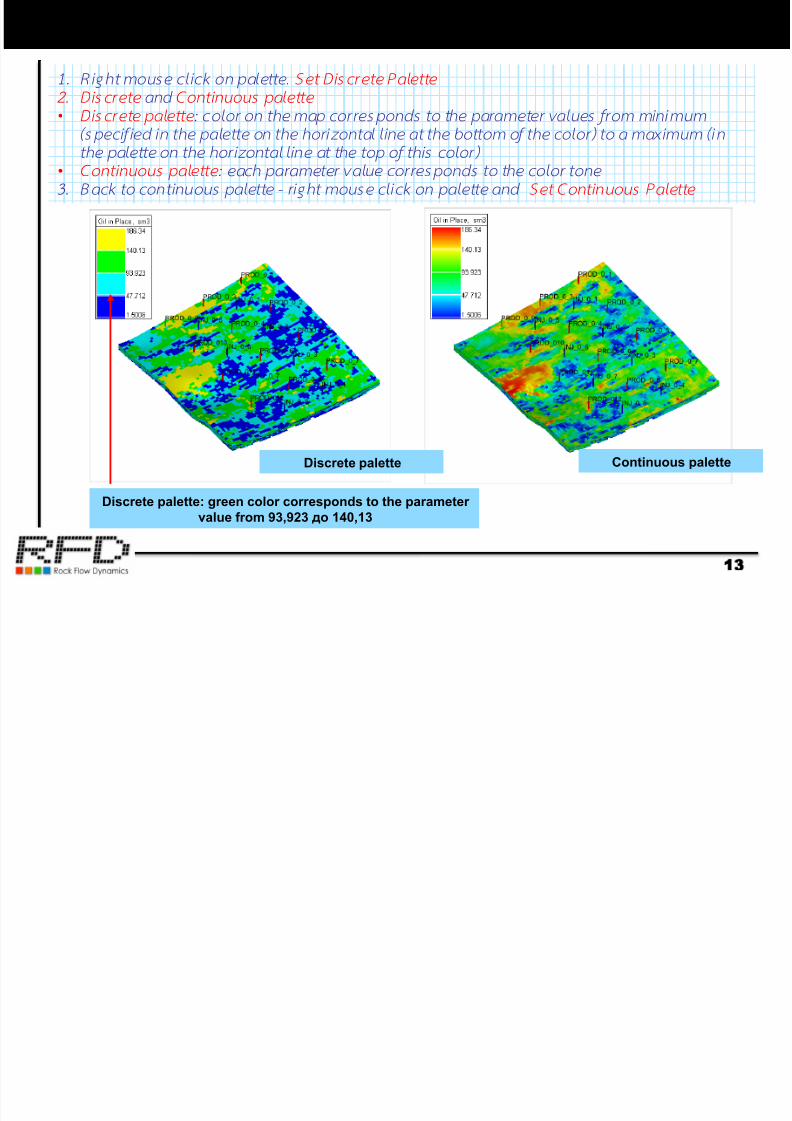
1. Right mouse c lick on pale tte. Set Discr ete Palette
2. Dis cr et e and Cont inuous palet te
• Discrete palette : color on the map correspond s to the parameter values from m inimum
(specif ied in the palet te on the horizontal l ine at the bottom of the co lor) to a maximum (inthe palette on th e horizontal l ine at the top of this color)
• Cont inuous palet te : each p arameter value corresponds to the color to ne
3. Back to cont inu ous palette - r ight mo use cl ick on palet te and Set Contin uou s Palette
Discrete palette Continuous palette
Discrete palette: green color corresponds to the parameter
value from 93,923 до 140,13
7/17/2019 How to Use TNavigator
http://slidepdf.com/reader/full/how-to-use-tnavigator 14/55
14Logarithmical palette
14
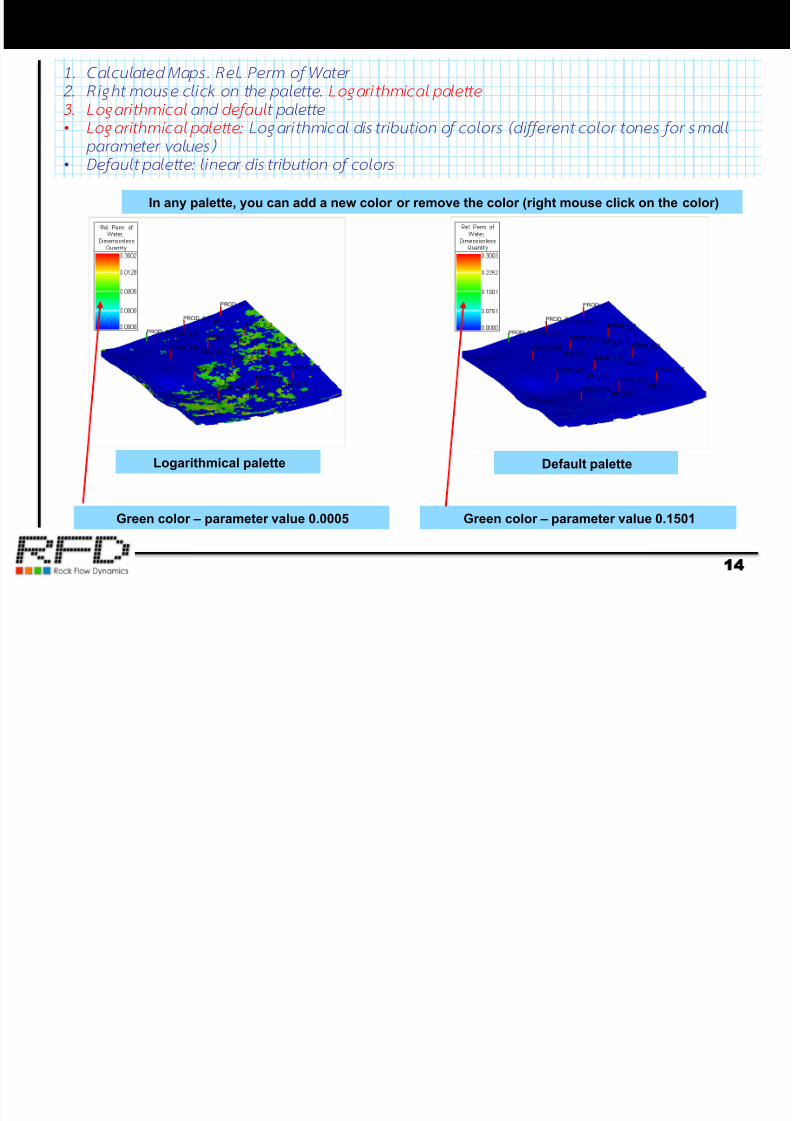
1. Calculated Maps. Rel. Perm of Water
2 . Right mouse c l ick on the pale tte . Log ari thm ical palette
3. Logar it hm i cal and defaul t p alette
• Log ari thm ical palette: Logari thmical dis tr ibut ion of co lors (di f ferent color tones for sm al l
parameter values)
• Default palette: l inear distribu tion of colo rs
Logarithmical palette Default palette
Green color – parameter value 0.0005 Green color – parameter value 0.1501
In any palette, you can add a new color or remove the color (right mouse click on the color)
7/17/2019 How to Use TNavigator
http://slidepdf.com/reader/full/how-to-use-tnavigator 15/55
15Distance between blocks
15
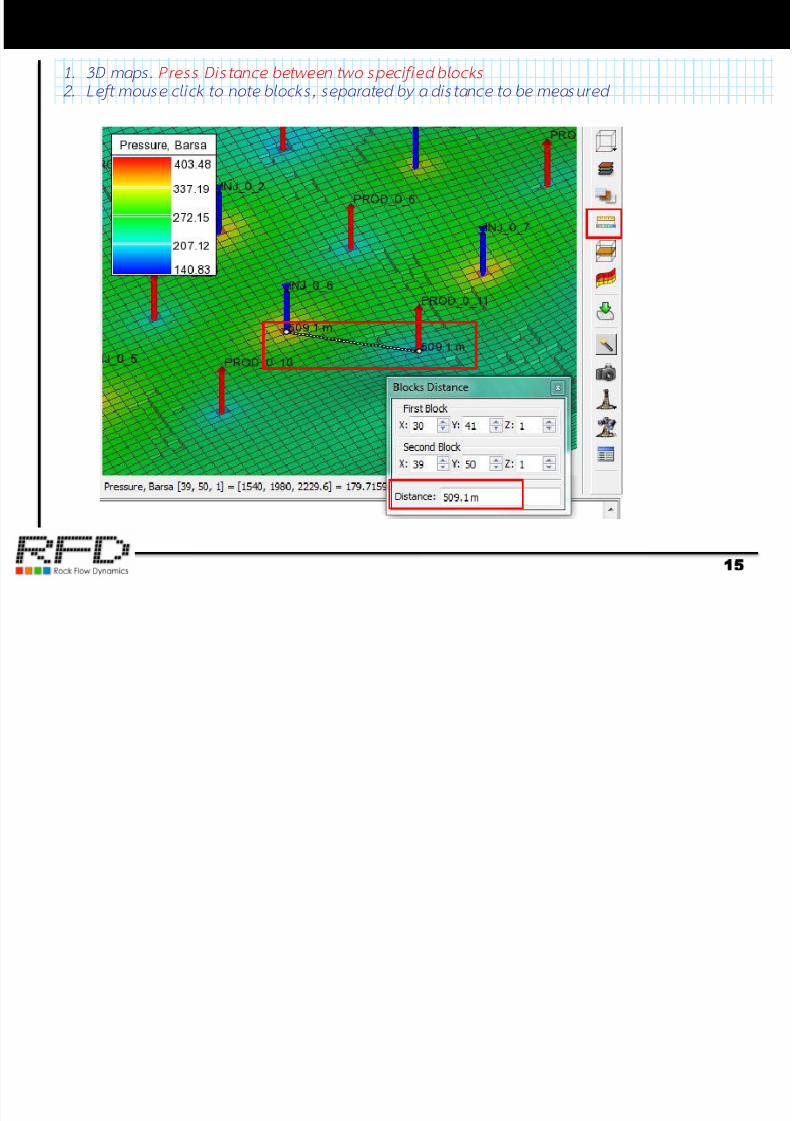
1. 3D map s. Press Distance between two speci f ied block s
2. Left mou se c l ick to note b locks , separated by a dis tance to be measured
7/17/2019 How to Use TNavigator
http://slidepdf.com/reader/full/how-to-use-tnavigator 16/55
16Map statistics
16
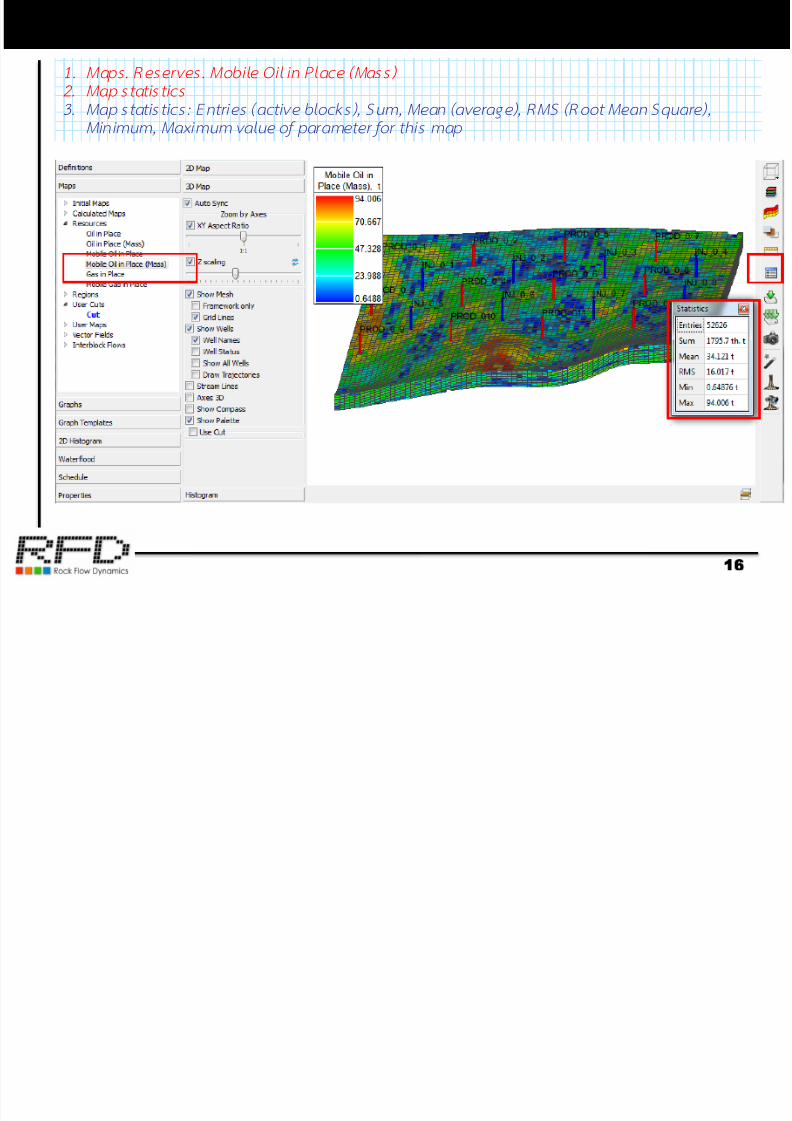
1. Maps. Reserves. Mobi le Oil in Place (Mass)
2. Map s tat is ti cs
3. Map statist ics: Entries (active block s), Sum , Mean (average), RMS (Root Mean Square),
Minimum , Maximum value of parameter for this m ap
7/17/2019 How to Use TNavigator
http://slidepdf.com/reader/full/how-to-use-tnavigator 17/55
17Cut to select reservoir top layers
17
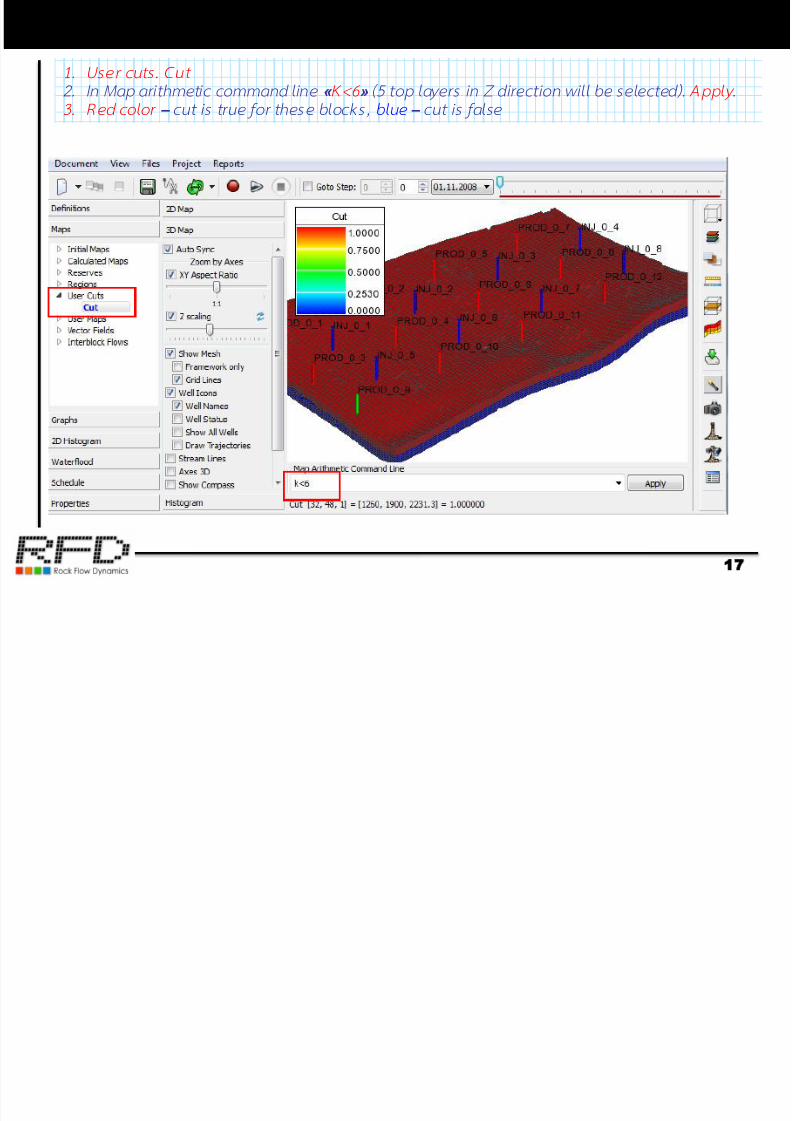
1. User cut s . Cut
2 . In Map ar i thmeti c command li ne « K<6 » (5 top layers in Z direction w il l be selected). Apply .
3. Red co lo r – cut is true for these blocks, blue – cut is false
7/17/2019 How to Use TNavigator
http://slidepdf.com/reader/full/how-to-use-tnavigator 18/55
18Map statistics with Cut
18
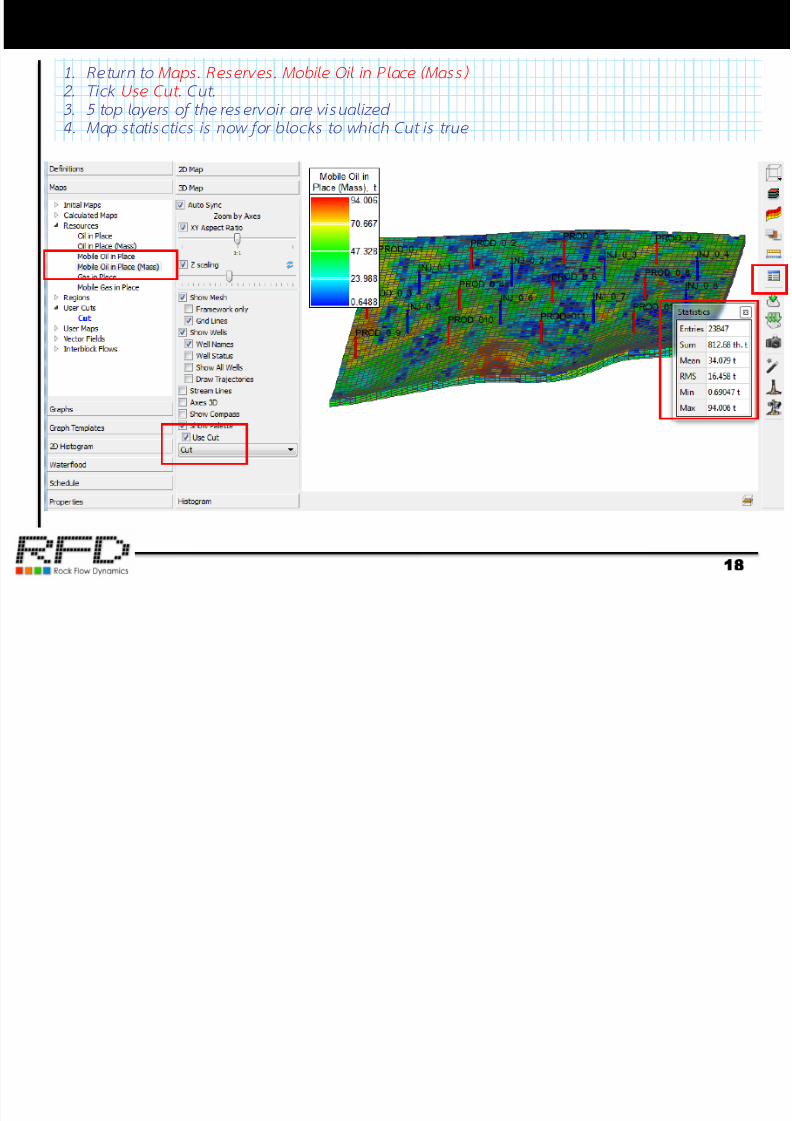
1. Retu rn to Maps. Reserves. Mobi le Oil in Place (Mass)
2. Tick Use Cut . Cut.
3 . 5 top layers of the reservo i r are v isual ized
4. Map stat isc tics is now for b locks to which Cut is t rue
O d l i l i d
7/17/2019 How to Use TNavigator
http://slidepdf.com/reader/full/how-to-use-tnavigator 19/55
19One model in several windows
19
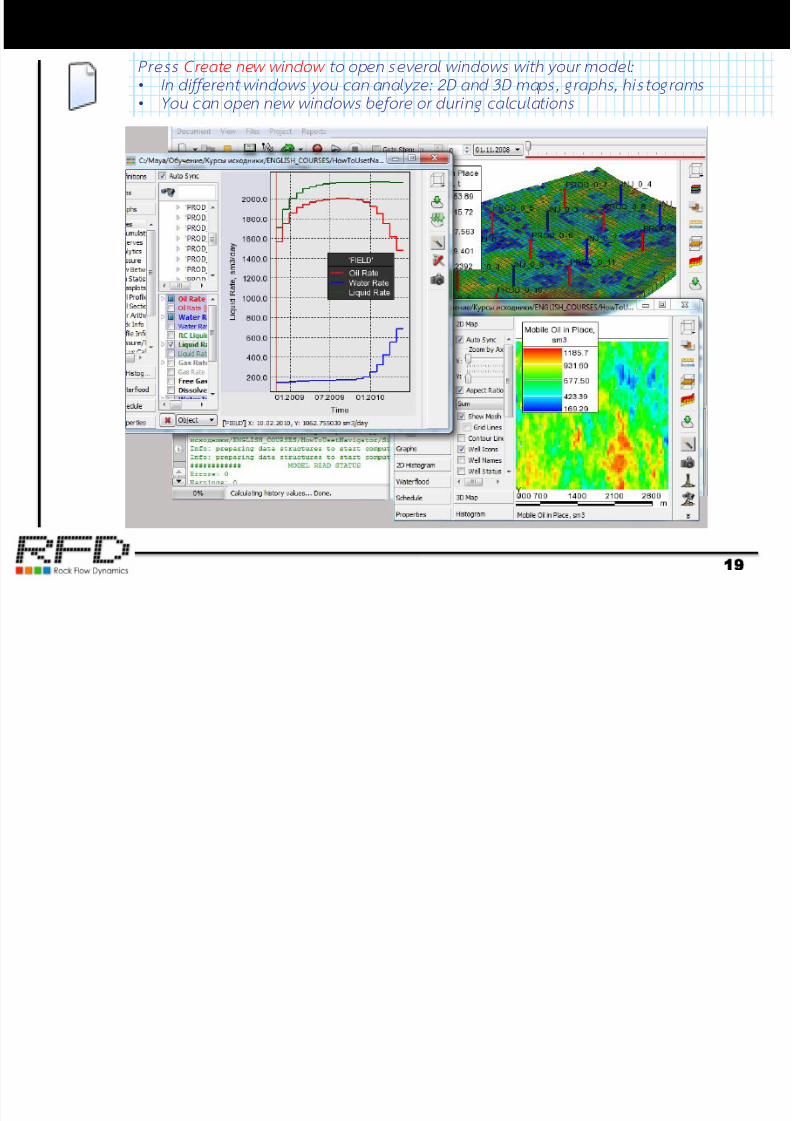
Press Create new window to open several windows w ith your mo del :
• In di f ferent window s you can analyze: 2D and 3D maps, graphs, his tograms
• You can open new w indow s before or durin g calculat ions
2D
7/17/2019 How to Use TNavigator
http://slidepdf.com/reader/full/how-to-use-tnavigator 20/55
202D maps
20
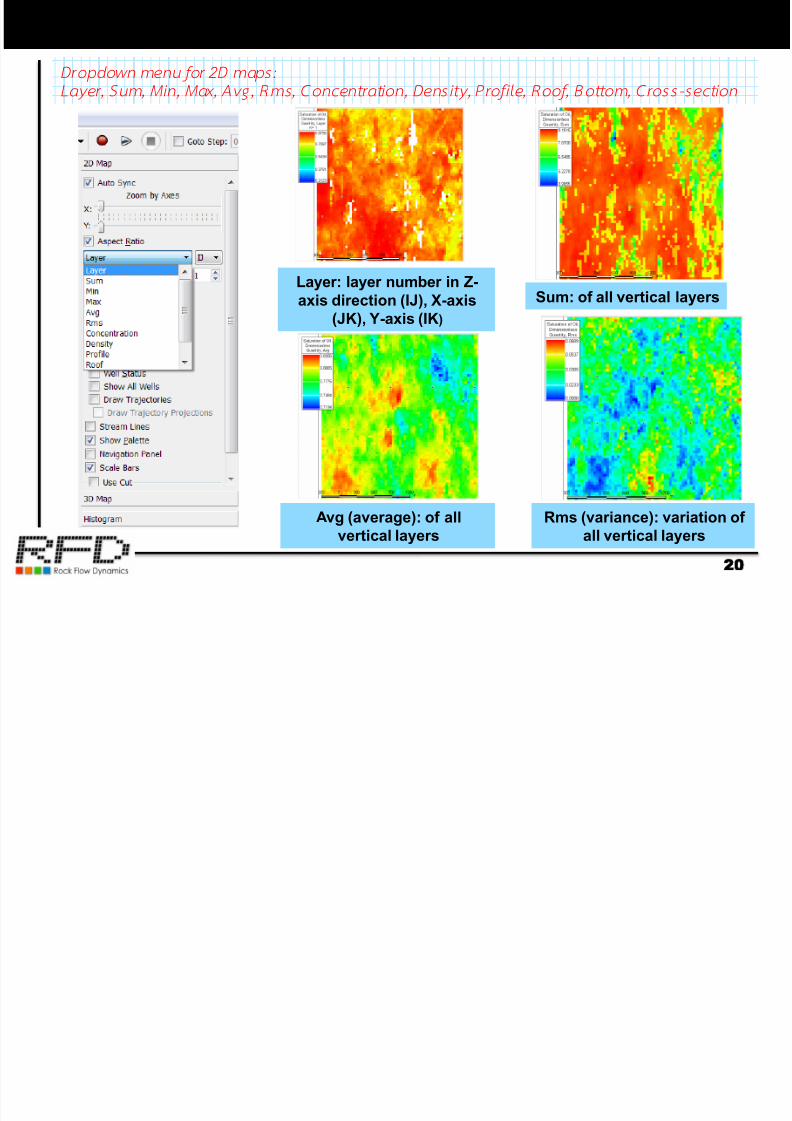
Layer: layer number in Z-axis direction (IJ), X-axis
(JK), Y-axis (IK)
Sum: of all vertical layers
Avg (average): of all
vertical layers
Rms (variance): variation of
all vertical layers
Dropdown m enu for 2D maps:
Layer, Sum , Min, Max, Avg , Rms, Concent rat ion, Density, Profi le, Roof, Bo ttom , Cross-section
2D D it
7/17/2019 How to Use TNavigator
http://slidepdf.com/reader/full/how-to-use-tnavigator 21/55
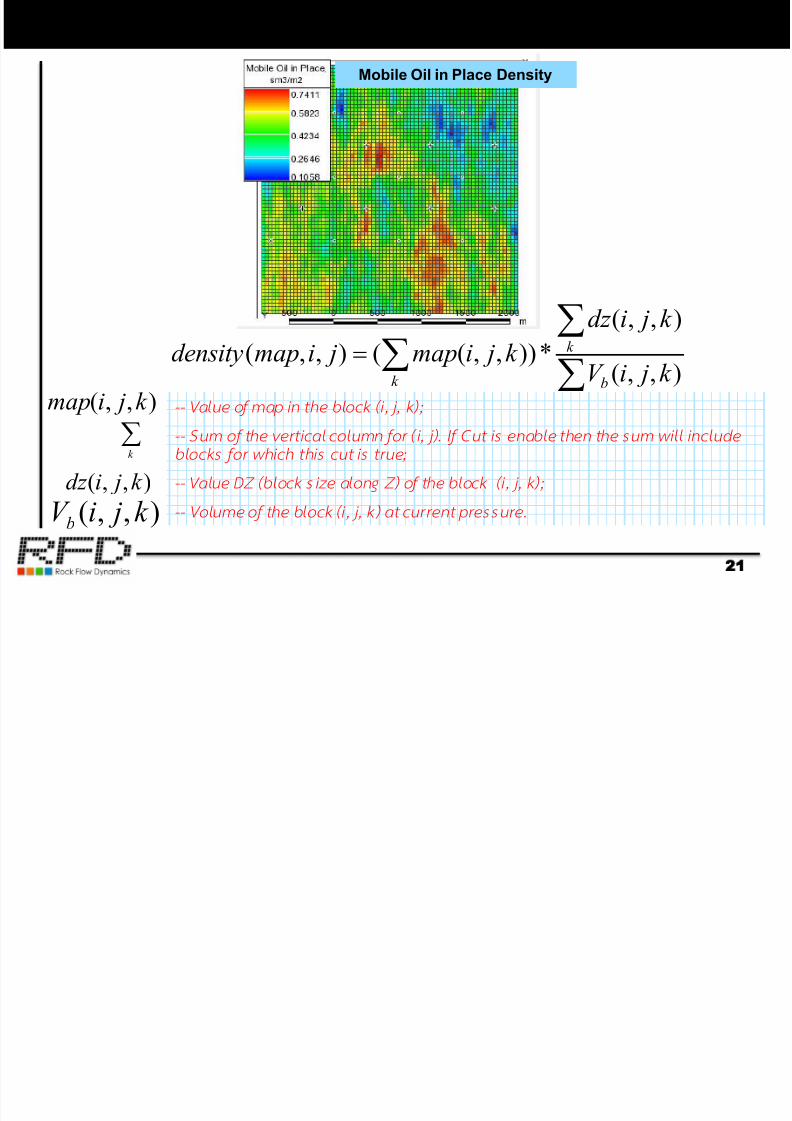
212D map Density
21
Mobile Oil in Place Density
k
b
k
k k jiV
k jidz
k jimap jimapdensity),,(
),,(
*)),,((),,(
),,( k jimap
k
),,( k jidz
),,( k jiV b
-- Value of map in th e bloc k (i , j , k);
-- Sum of the vert ical column for (i , j). If Cut is enable then the sum wil l inc lude
blocks for w hich this cut is true;
-- Value DZ (block size along Z) of th e block (i , j , k);
-- Volume o f the blo ck (i , j , k) at current p ressur e.
2D C t ti
7/17/2019 How to Use TNavigator
http://slidepdf.com/reader/full/how-to-use-tnavigator 22/55
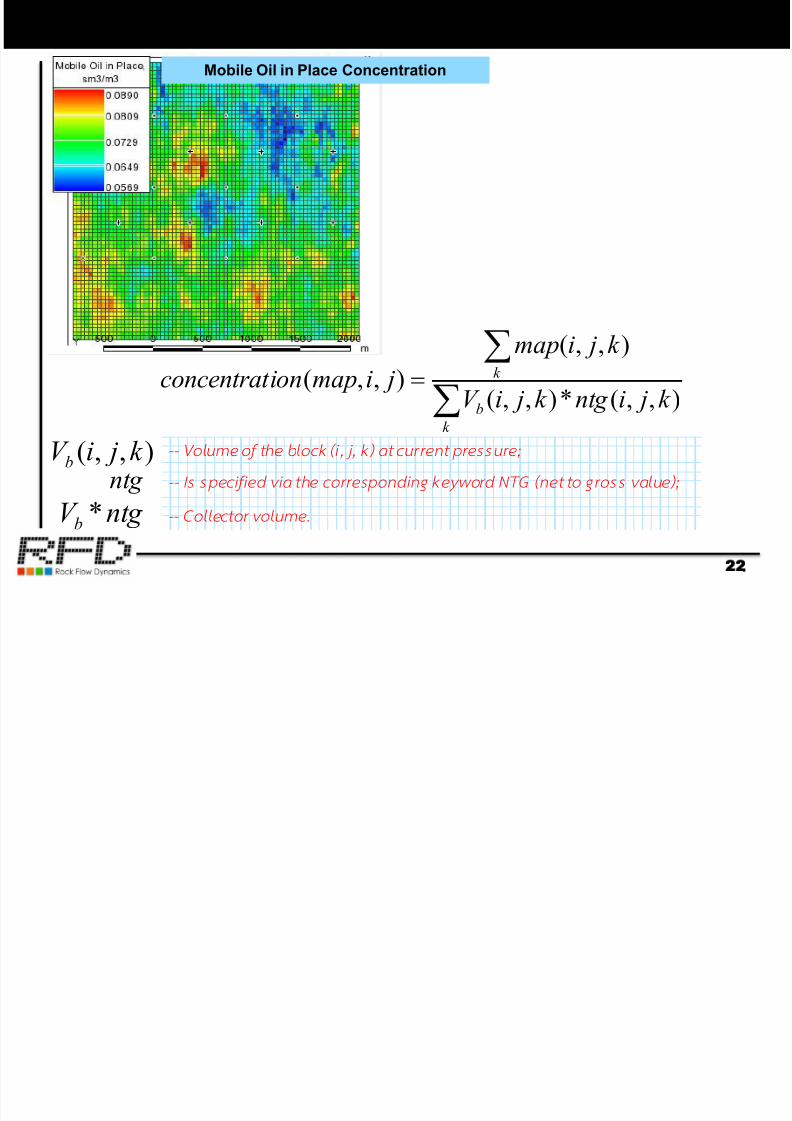
222D map Concentration
22
Mobile Oil in Place Concentration
k
b
k
k jintg k jiV
k jimap
jimapionconcentrat ),,(*),,(
),,(
),,(
),,( k jiV bntg
ntg V b *
-- Volume of th e block (i , j , k) at current press ure;
-- Is specif ied via the corr espon ding k eywo rd NTG (net to gro ss value);
-- Col lector vo lum e.
3D li i
7/17/2019 How to Use TNavigator
http://slidepdf.com/reader/full/how-to-use-tnavigator 23/55
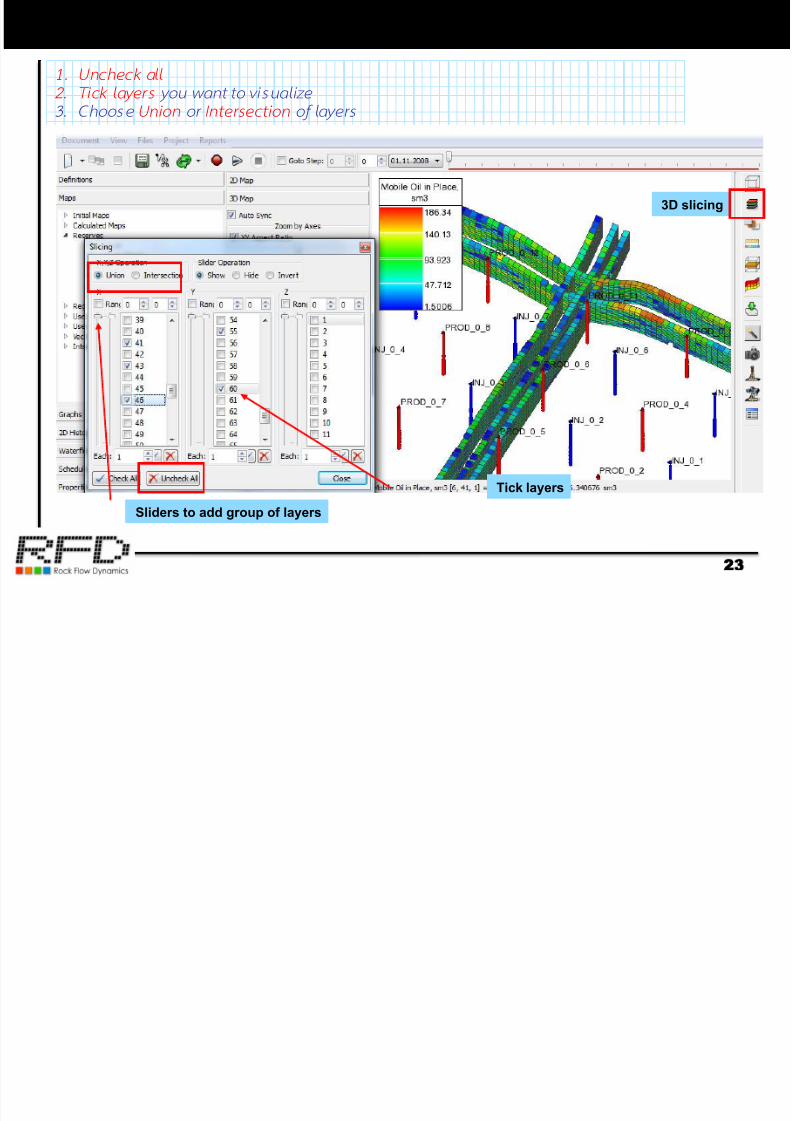
233D slicing
23
1. Unchec k al l
2. Ti ck l ayers you want to visual ize
3. Ch oo se Union or Intersection of layers
Tick layers
3D slicing
Sliders to add group of layers
Hi t
7/17/2019 How to Use TNavigator
http://slidepdf.com/reader/full/how-to-use-tnavigator 24/55
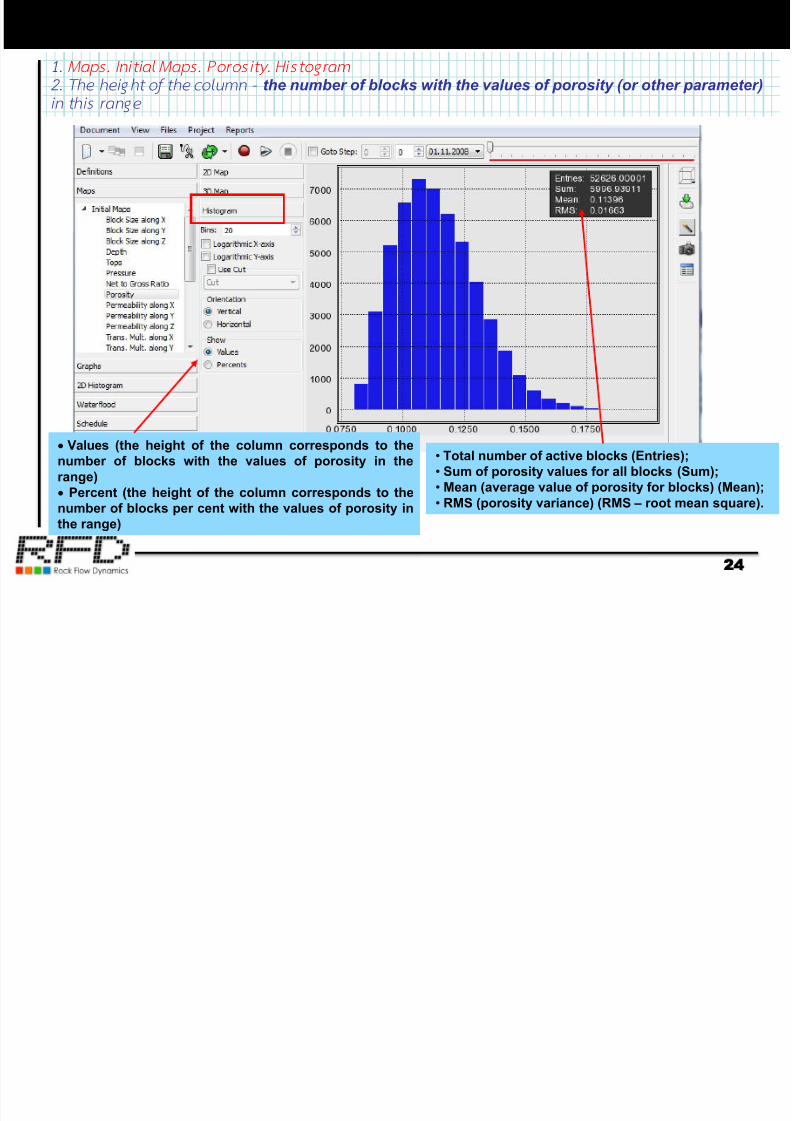
24Histogram
24
1. Maps. Ini t ial Maps. Poro sity. Histog ram
2. The height of the colum n - the number of blocks with the values of porosity (or other parameter)
in this range
• Total number of active blocks (Entries);
• Sum of porosity values for all blocks (Sum);
• Mean (average value of porosity for blocks) (Mean);
• RMS (porosity variance) (RMS – root mean square).
Values (the height of the column corresponds to the
number of blocks with the values of porosity in the
range)
Percent (the height of the column corresponds to the
number of blocks per cent with the values of porosity in
the range)
2D Hi t
7/17/2019 How to Use TNavigator
http://slidepdf.com/reader/full/how-to-use-tnavigator 25/55
252D Histogram
25
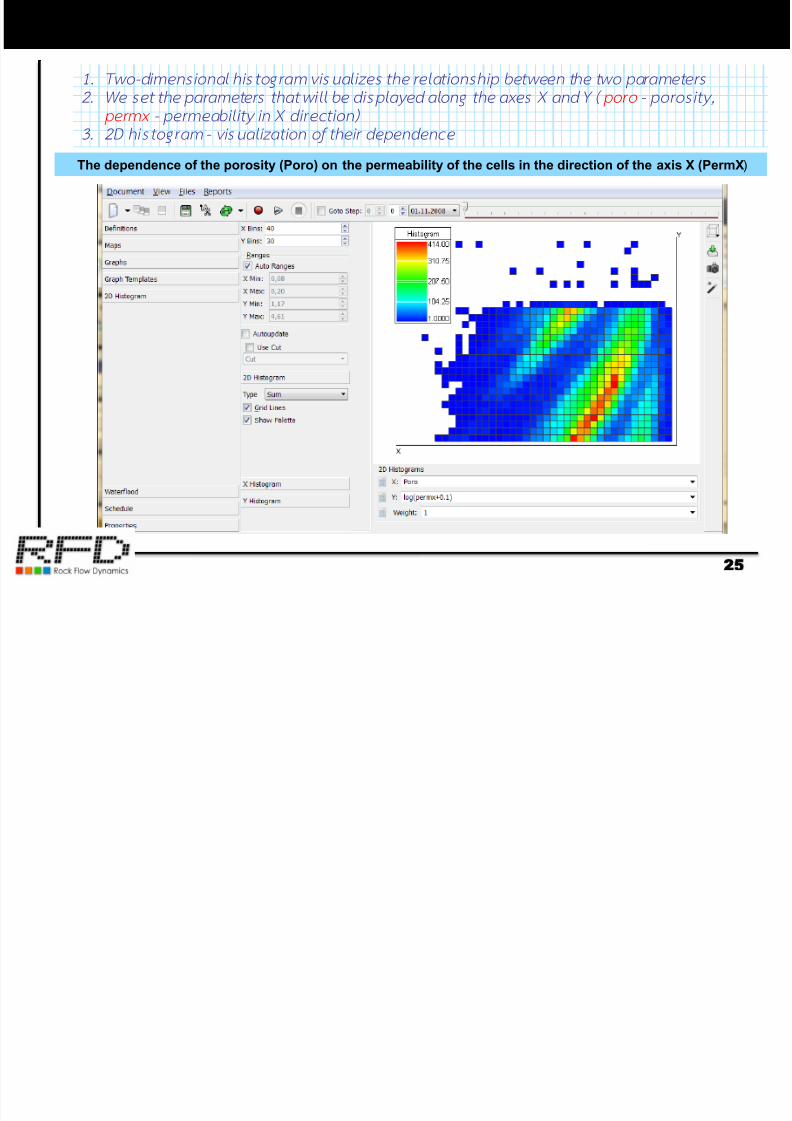
The dependence of the porosity (Poro) on the permeability of the cells in the direction of the axis X (PermX)
1. Two-dimensional his togram visual izes the relat ionship between the two parameters
2. We set the parameters that wi l l be displayed along the axes X and Y ( poro - poros ity,
permx - permeabi l i ty in X direction )
3 . 2D his togram - v isual izat ion of the ir dependence
Run and stop calculations
7/17/2019 How to Use TNavigator
http://slidepdf.com/reader/full/how-to-use-tnavigator 26/55
26Run and stop calculations
26
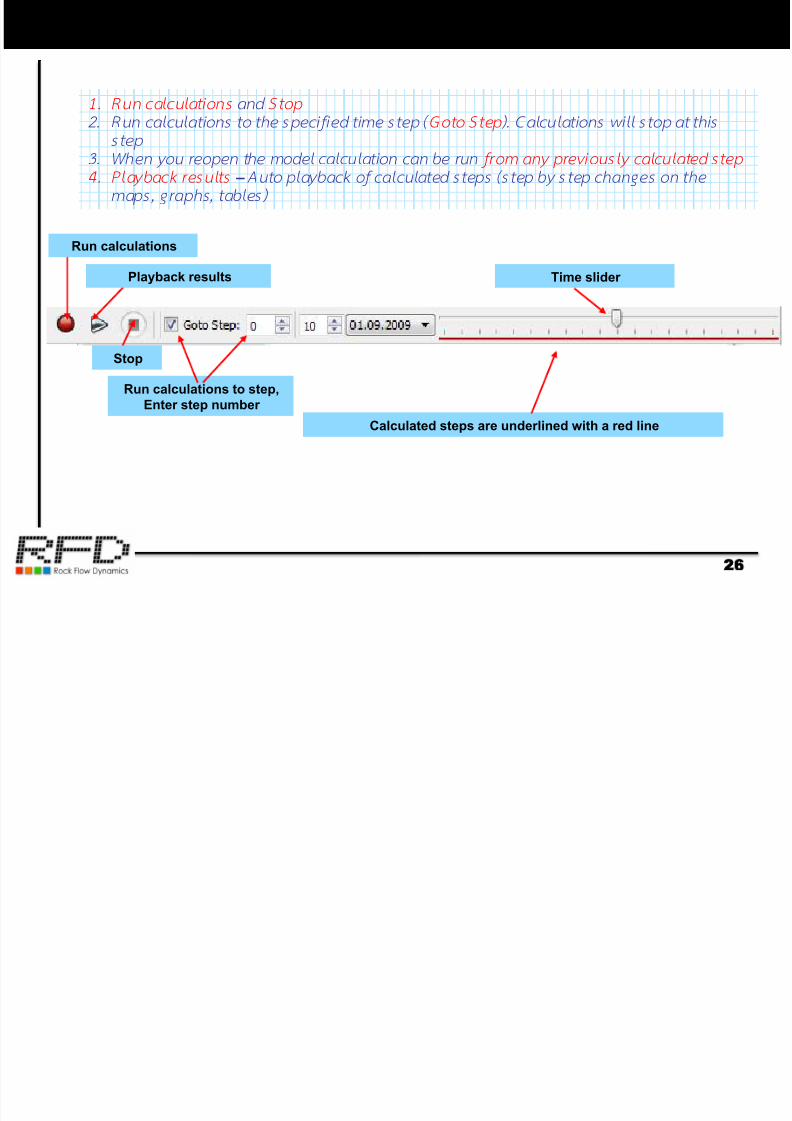
1. Run ca lcu lat ions and Stop
2. Run ca lcu lat ions to the spec i f ied time step ( Goto Step ). Cal cu lat ions w il l s top at th is
step3. When you reopen the model calcu lat ion can be run from any previously calculated step
4 . P layback resu l ts – Auto playback of calculated steps (step by step c hanges on the
map s, graphs, tables)
Run calculations to step,
Enter step number
Calculated steps are underlined with a red line
Time slider
Stop
Run calculations
Playback results
Calculations Easy restarts
7/17/2019 How to Use TNavigator
http://slidepdf.com/reader/full/how-to-use-tnavigator 27/55
27Calculations. Easy restarts
27
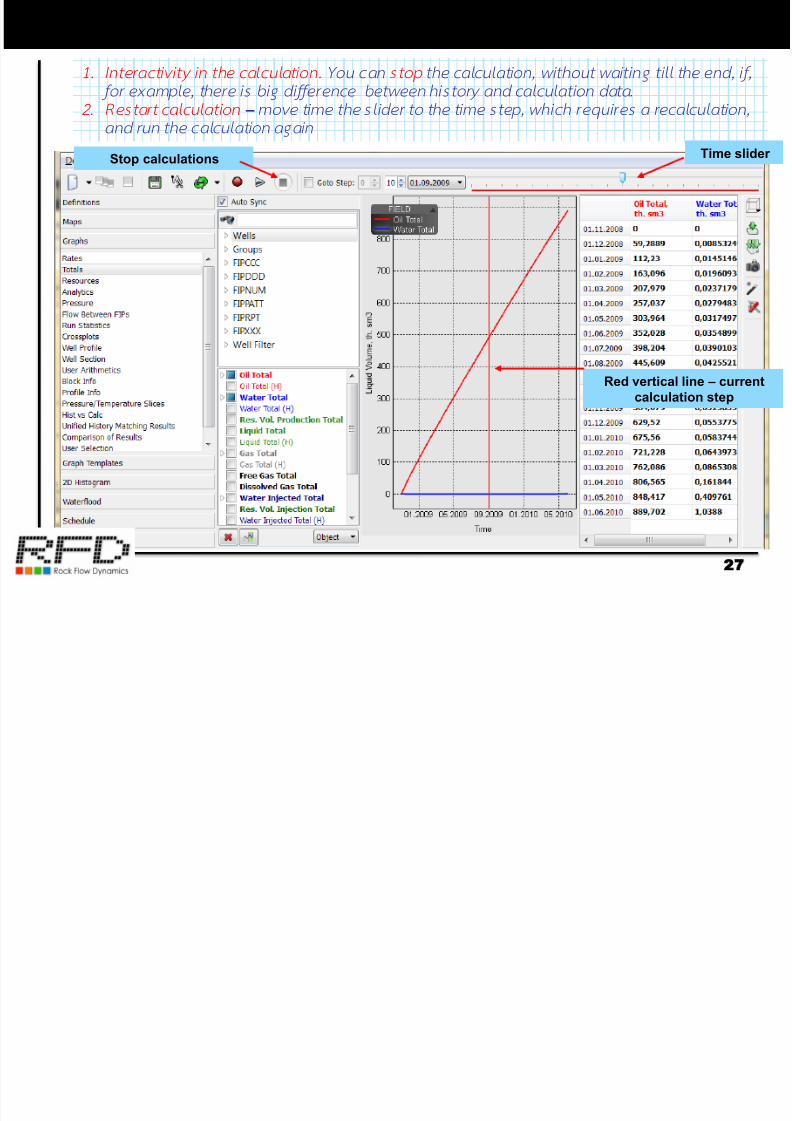
1. In terac tiv ity in the ca lcu la tion. You can stop the calculat ion, witho ut wait ing ti l l the end, if ,
for examp le, there is big difference between histor y and calculat ion data.
2. Res tar t cal cu la ti on – m ove t ime th e sl ider to the t im e step, which requires a recalculat ion,
and ru n the calculat ion again
Stop calculations Time slider
Red vertical line – current
calculation step
Create profile (vertical section)
7/17/2019 How to Use TNavigator
http://slidepdf.com/reader/full/how-to-use-tnavigator 28/55
28Create profile (vertical section)
28
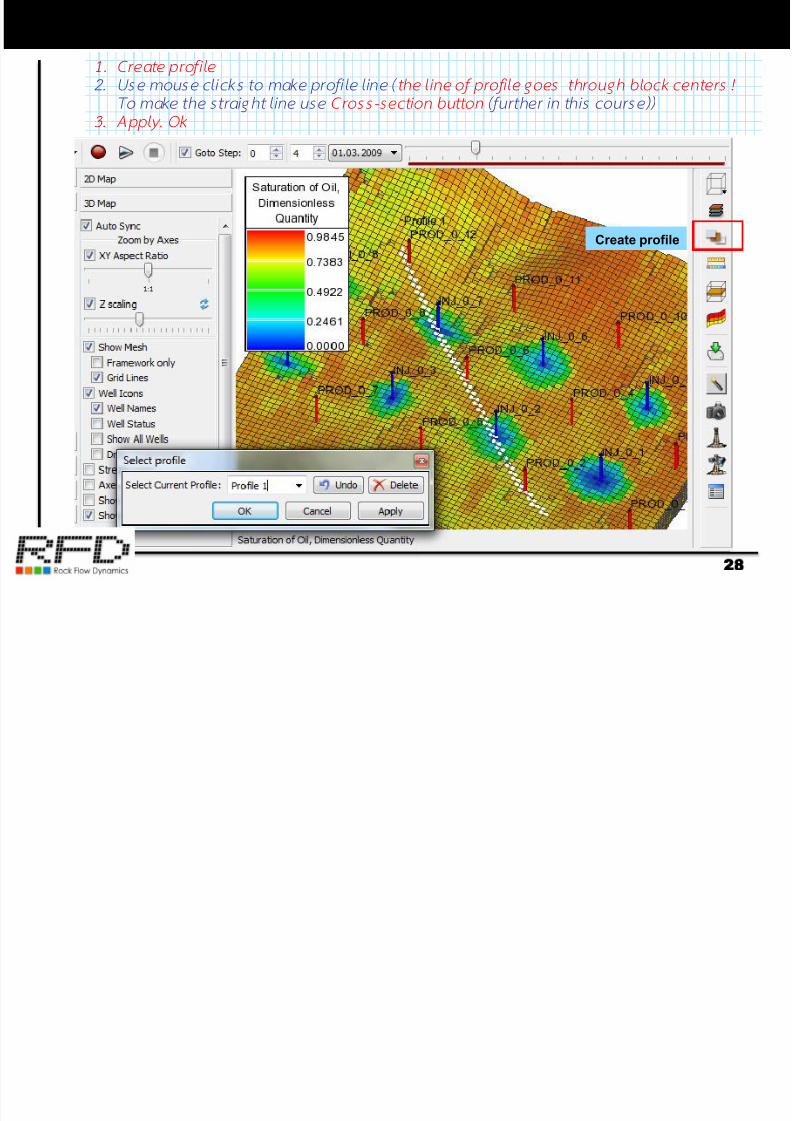
1 . Crea te pro f il e
2 . Use mouse c l icks to make prof i le l ine ( the line of prof i le goes throug h block centers !
To make the straight l ine use Cross-sect ion bu tton (further in this cou rse))
3. A pp ly. Ok
Create profile
Profile Bubble Maps
7/17/2019 How to Use TNavigator
http://slidepdf.com/reader/full/how-to-use-tnavigator 29/55
29Profile. Bubble Maps
29
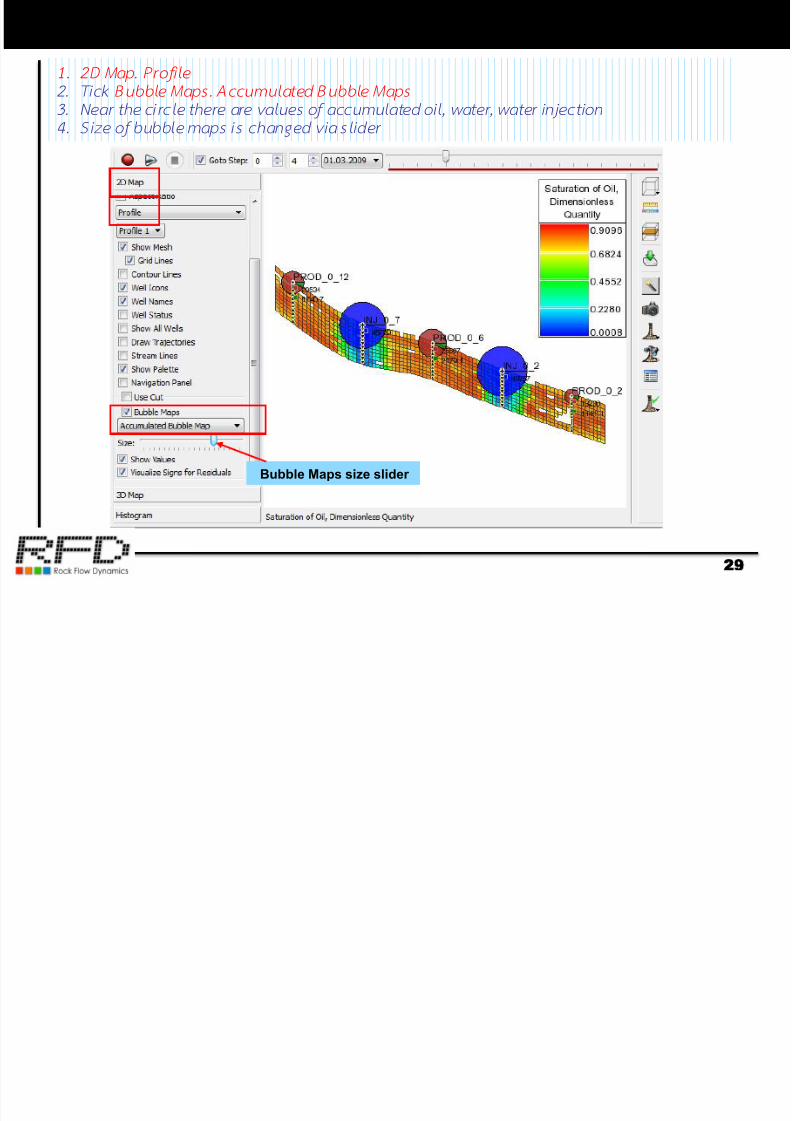
1 . 2D Map. Prof il e
2. Tick Bubb le Maps. Accumulated Bu bble Maps
3. Near the ci rc le there are values of accumu lated oi l , water, water in ject ion
4. S ize of bubble maps is changed v ia s l ider
Bubble Maps size slider
Profile Bubble Maps
7/17/2019 How to Use TNavigator
http://slidepdf.com/reader/full/how-to-use-tnavigator 30/55
30Profile. Bubble Maps
30
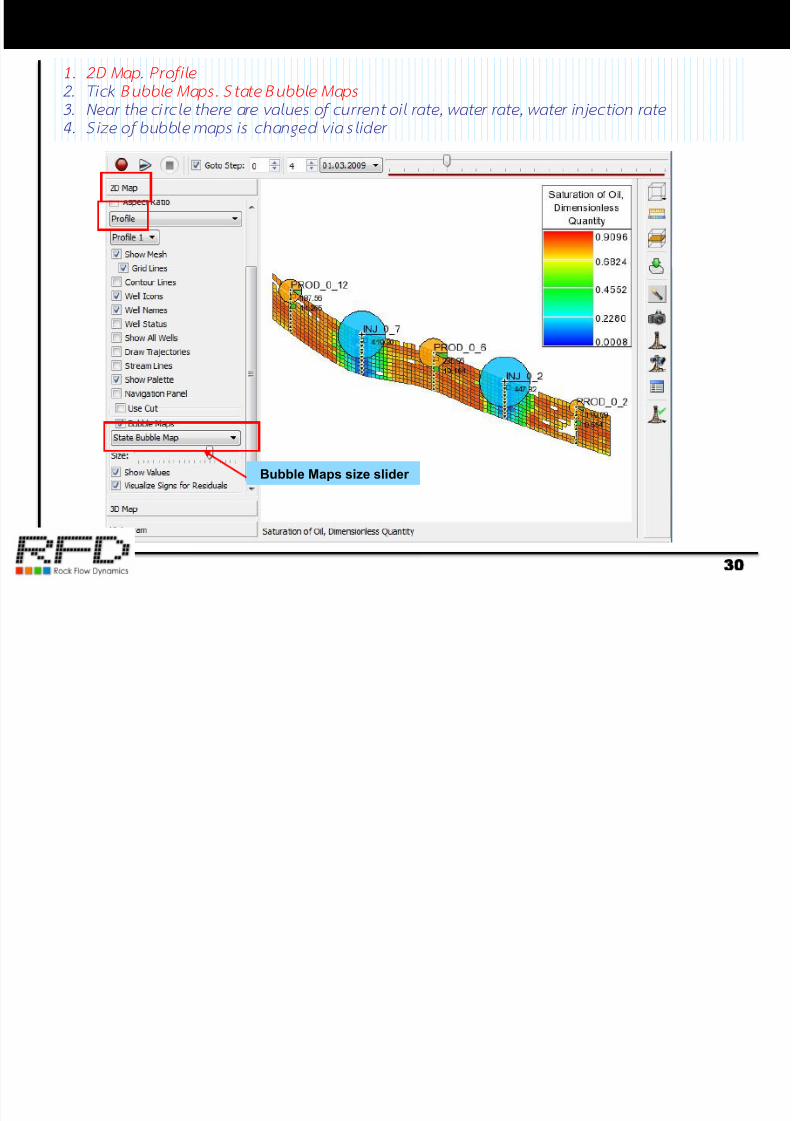
1 . 2D Map. Pro f il e
2. Tick Bub ble Maps. State Bubble Maps
3. Near the ci rc le there are values of current oi l rate, water rate, water in ject ion rate
4. S ize of bubble maps is changed v ia s l ider
Bubble Maps size slider
User Bubble Maps
7/17/2019 How to Use TNavigator
http://slidepdf.com/reader/full/how-to-use-tnavigator 31/55
31User Bubble Maps
31
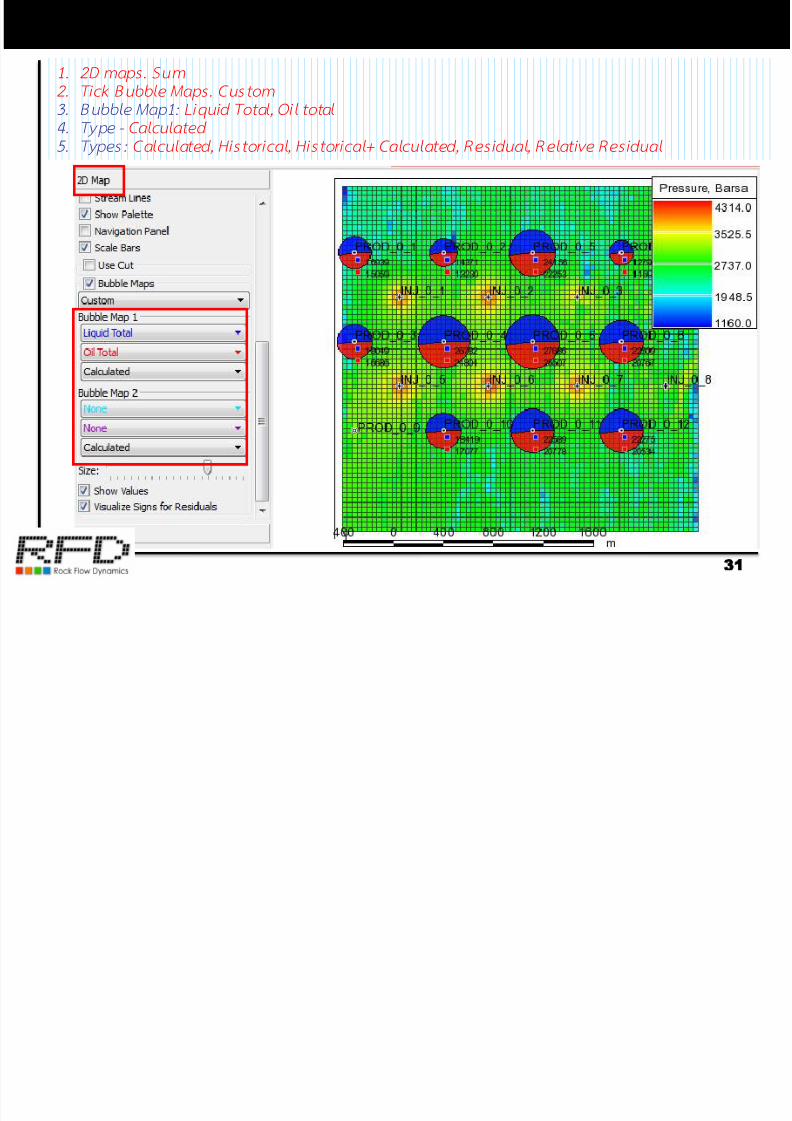
1. 2D maps. Sum
2. Tick Bubb le Maps . Cus tom
3. Bubbl e Map1: Liqu id Total, Oil total
4. Ty pe - Calculated
5. Ty pes : Calculated, Historical, Histor ical+ Calculated, Residual, Relat ive Residual
Grid properties along the profile
7/17/2019 How to Use TNavigator
http://slidepdf.com/reader/full/how-to-use-tnavigator 32/55
32Grid properties along the profile
32
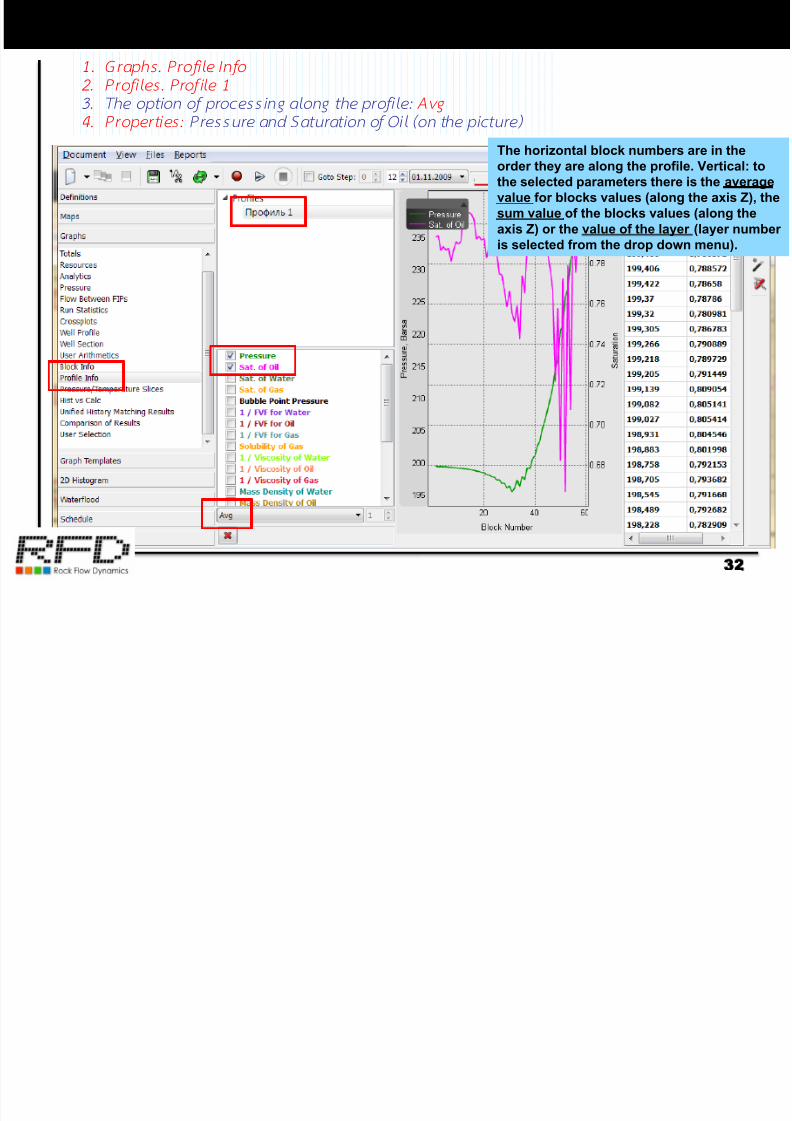
1 . Graphs . Pro f il e In fo
2. Prof iles . Prof ile 1
3. The opt ion of process ing along the prof i le : Avg
4. P roper ti es : Pressure and Saturation of Oil (on the pictu re)
The horizontal block numbers are in the
order they are along the profile. Vertical: to
the selected parameters there is the average
value for blocks values (along the axis Z), the
sum value of the blocks values (along the
axis Z) or the value of the layer (layer number
is selected from the drop down menu).
Cross-section (horizontal)
7/17/2019 How to Use TNavigator
http://slidepdf.com/reader/full/how-to-use-tnavigator 33/55
33Cross-section (horizontal)
33
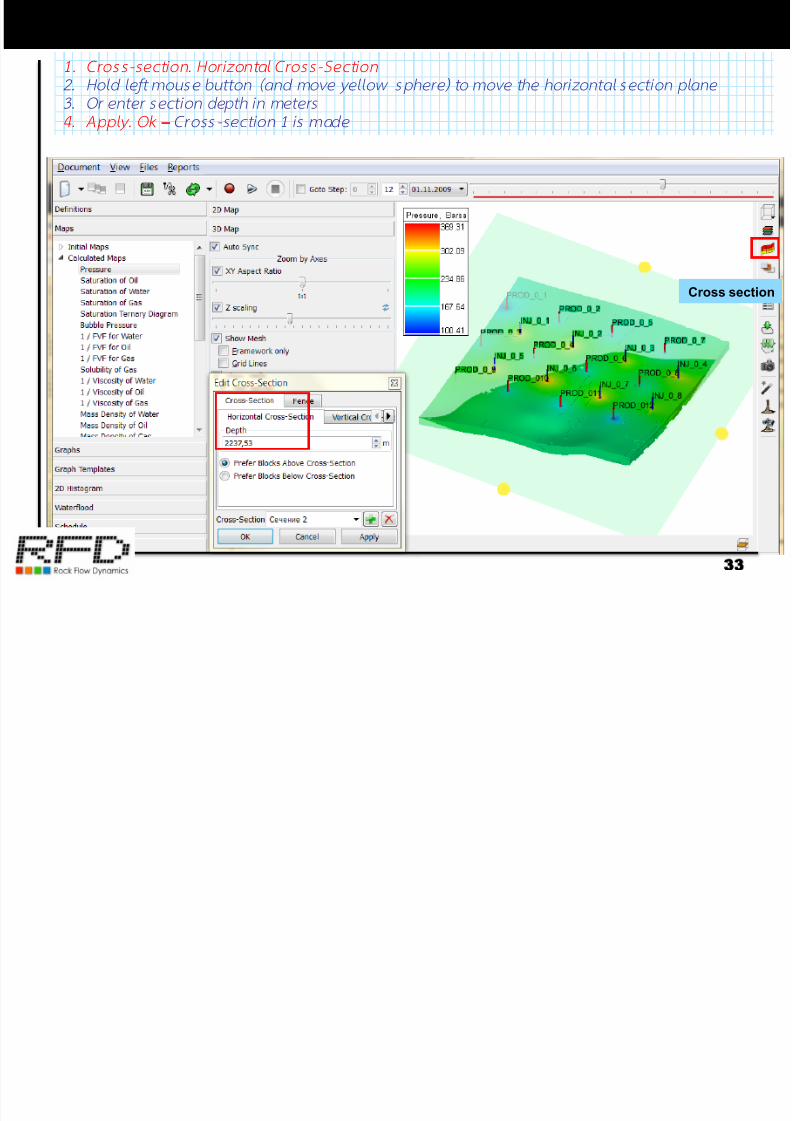
1. Cross-sec tion. Hor izonta l Cross-Sect ion
2. Hold le ft mouse but ton (and move yel low sphere) to move the hor izonta l sec tion p lane
3. Or enter sec t ion depth in meters
4. A pp ly. Ok – Cross-sect ion 1 is m ade
Cross section
Cross-section (horizontal) on 2D map
7/17/2019 How to Use TNavigator
http://slidepdf.com/reader/full/how-to-use-tnavigator 34/55
34Cross-section (horizontal) on 2D map
34
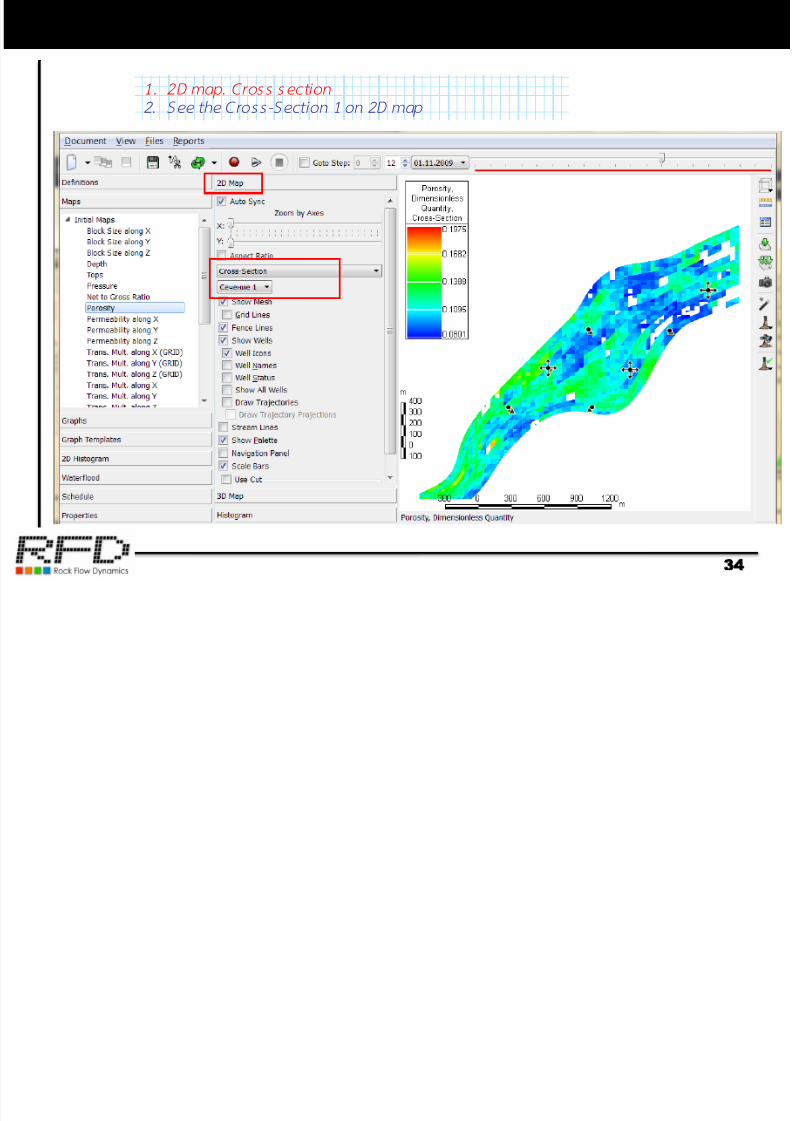
1 . 2D map. Cross sec t ion
2. See the Cross-Sect ion 1 on 2D map
Cross-section (vertical section – straight line)
7/17/2019 How to Use TNavigator
http://slidepdf.com/reader/full/how-to-use-tnavigator 35/55
35Cross-section (vertical section – straight line)
35
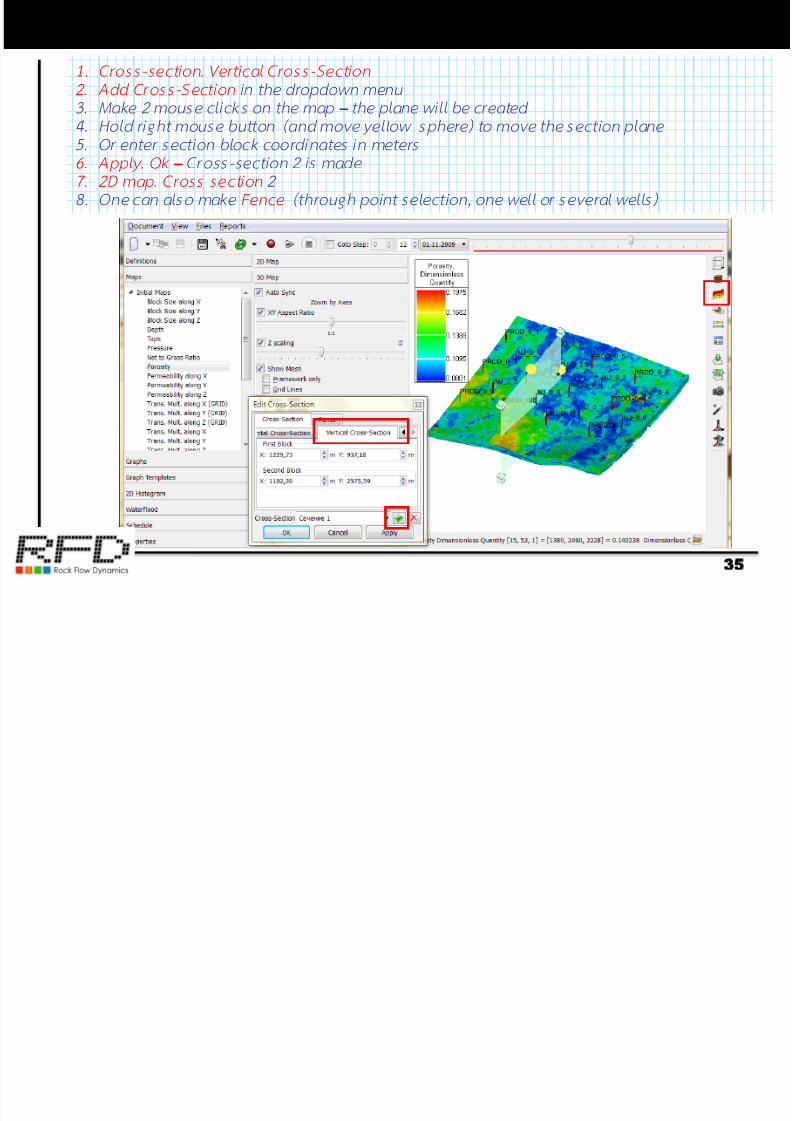
1. Cross-sec tion. Ver ti cal Cross-Sect ion
2. Add Cross -Sec ti on in the dropdown menu
3 . Make 2 mouse c li cks on the map – the plane wil l be created
4. Hold right mouse but ton (and move ye llow sphere) to move the sec t ion p lane
5. Or enter sec tion b lock coord inates in meters6. A pp ly. Ok – Cross-sect ion 2 is m ade
7 . 2D map. Cross sec t ion 2
8. One can a lso make Fence (through p oint select ion, one w el l or several wel ls)
Switch from well on map to well graphs
7/17/2019 How to Use TNavigator
http://slidepdf.com/reader/full/how-to-use-tnavigator 36/55
36Switch from well on map to well graphs
36
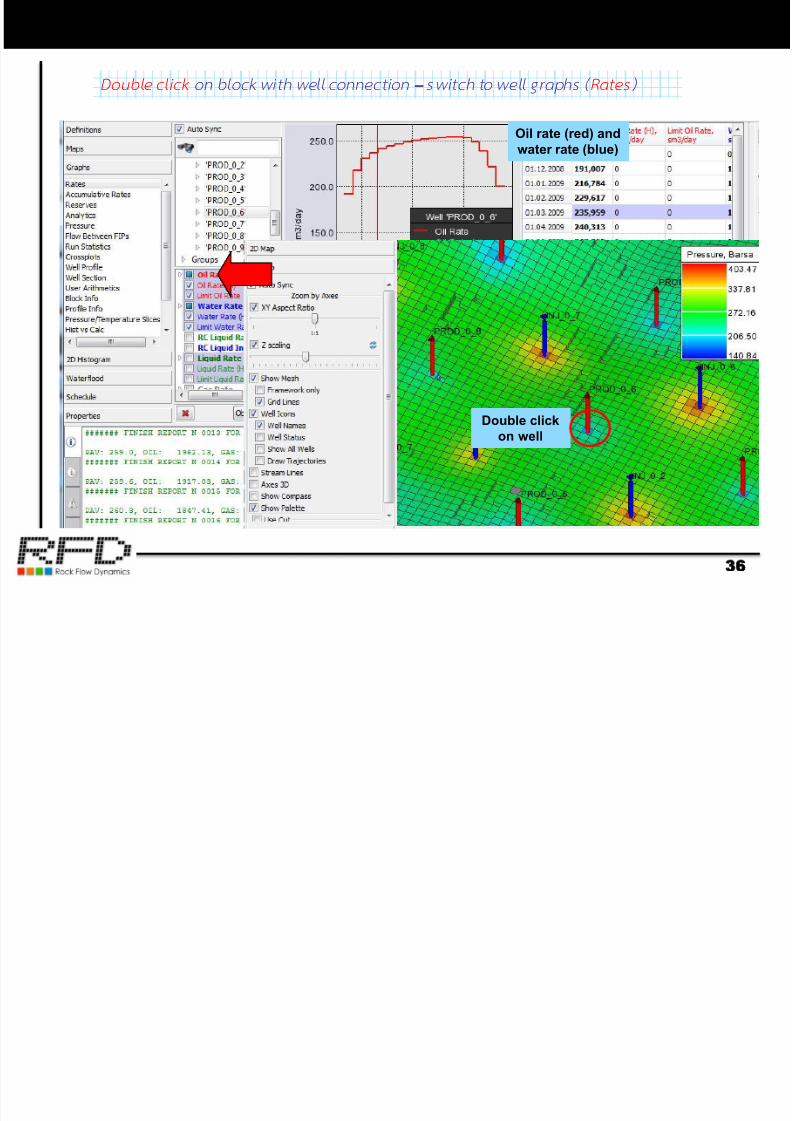
Double cl ick on block w i th wel l connect ion – swi tch to wel l graphs ( Rates )
Double clickon well
Oil rate (red) and
water rate (blue)
Well graphs Synchronization
7/17/2019 How to Use TNavigator
http://slidepdf.com/reader/full/how-to-use-tnavigator 37/55
37Well graphs Synchronization
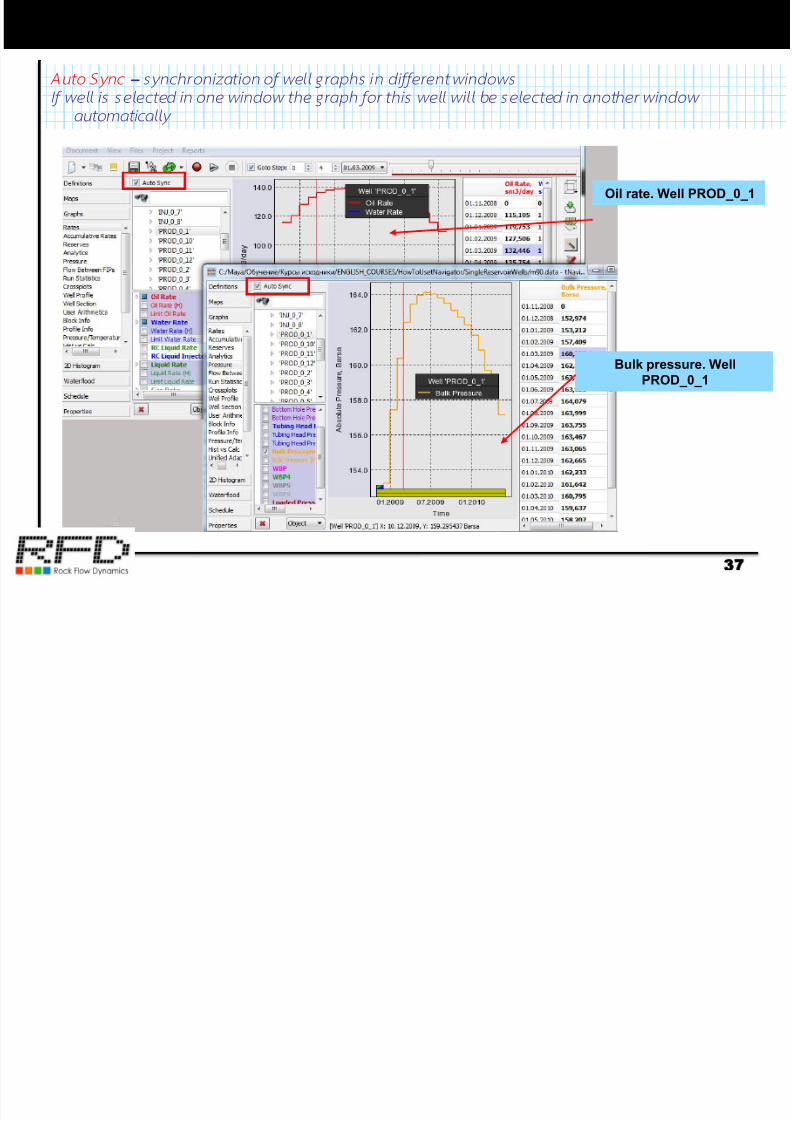
37
Auto Sync – synch ronization of wel l graphs in di f ferent windows
If well is selected in one wind ow the graph for this wel l wi l l be selected in another window
automatical ly
Oil rate. Well PROD_0_1
Bulk pressure. Well
PROD_0_1
Graphs in tNavigator
7/17/2019 How to Use TNavigator
http://slidepdf.com/reader/full/how-to-use-tnavigator 38/55
38Graphs in tNavigator
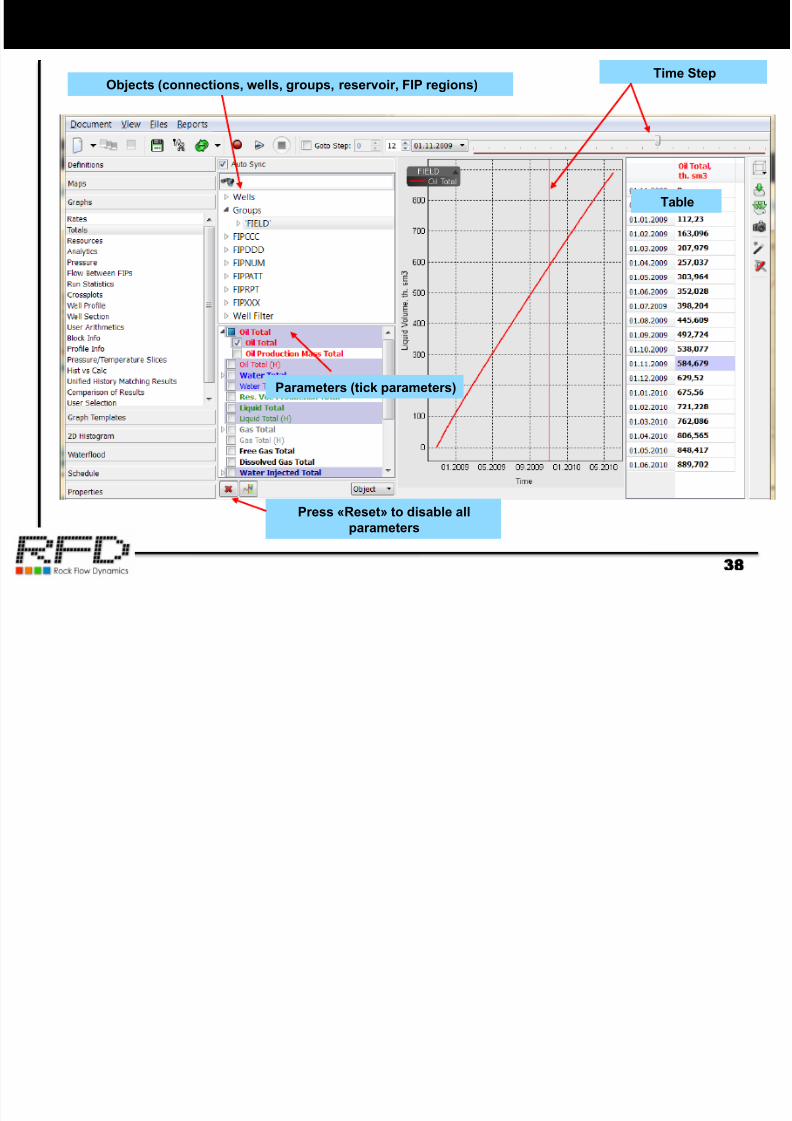
38
Table
Time Step
Press «Reset» to disable all
parameters
Objects (connections, wells, groups, reservoir, FIP regions)
Parameters (tick parameters)
Graphs Export to Excel
7/17/2019 How to Use TNavigator
http://slidepdf.com/reader/full/how-to-use-tnavigator 39/55
39Graphs. Export to Excel
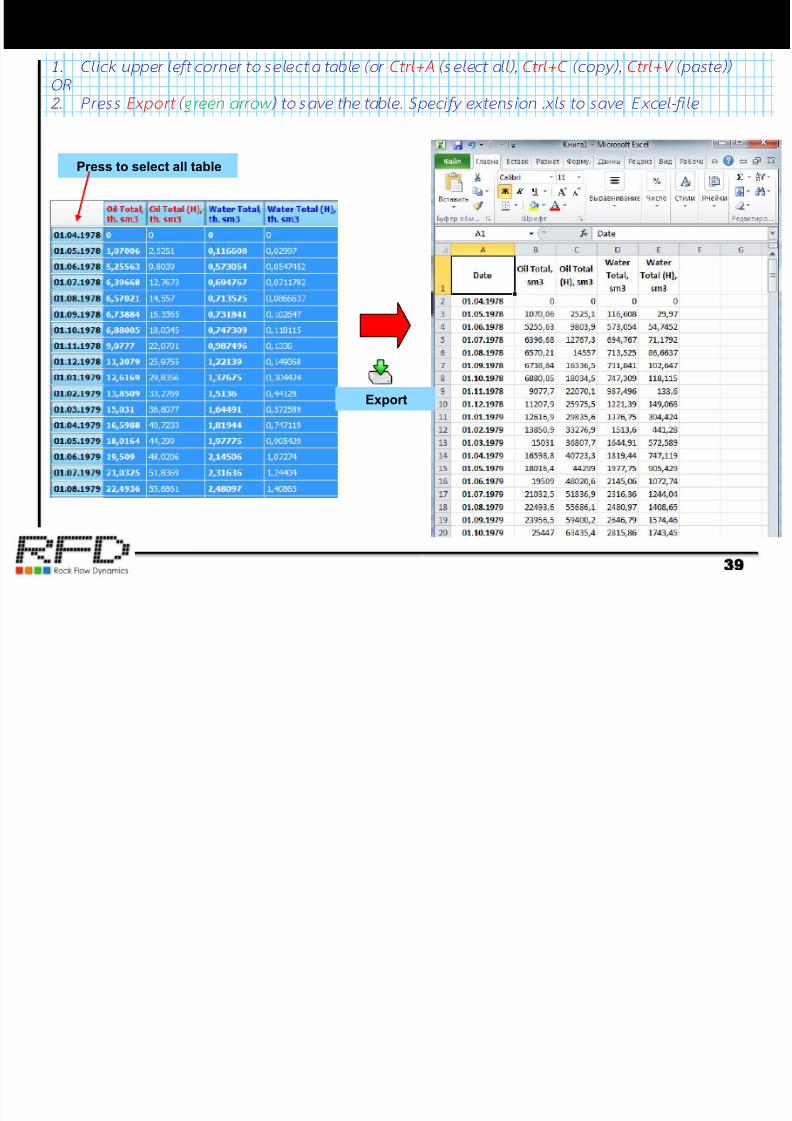
39
1 . C li ck upper le ft co rner to selec t a tab le (o r Ctrl+A (select all), Ctrl+C (copy ), Ctrl+V (paste))
OR
2. Press Export ( green arrow ) to sav e the tab le. Sp ec ify ex ten s ion .x ls to sav e Excel -f i le
Press to select all table
Export
Graphs list
7/17/2019 How to Use TNavigator
http://slidepdf.com/reader/full/how-to-use-tnavigator 40/55
40Graphs list
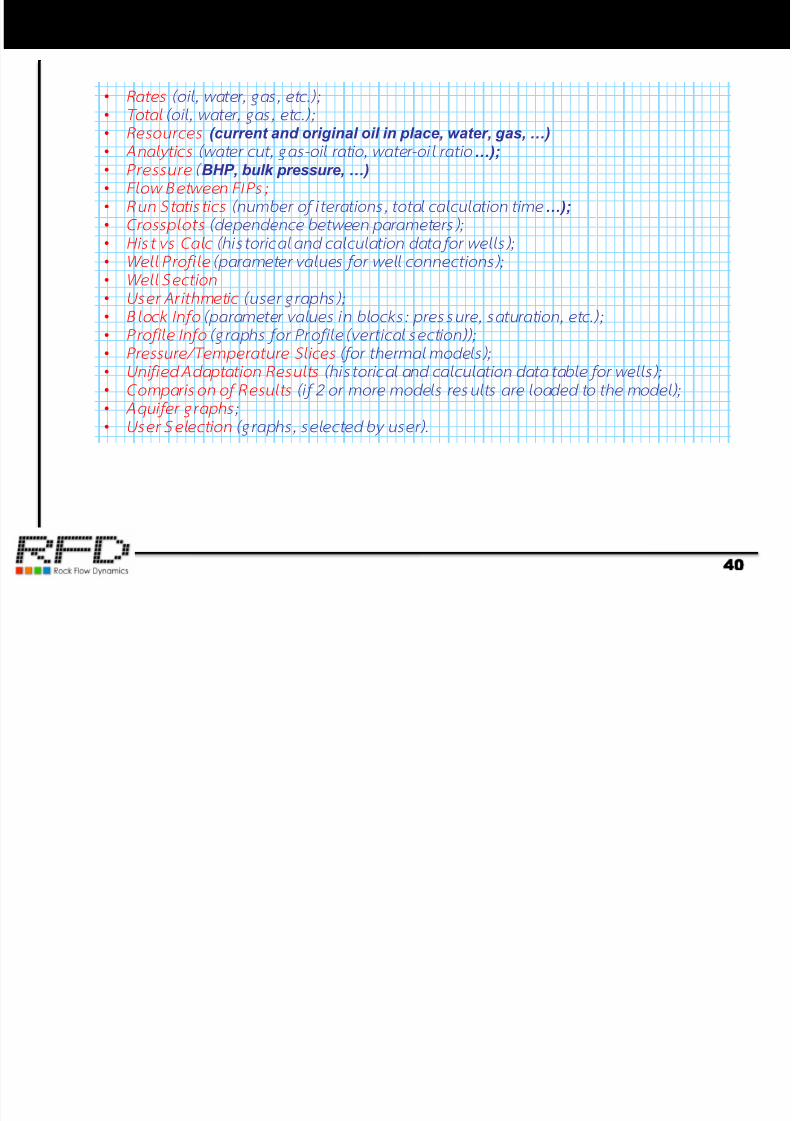
40
• Rates (oil, water, gas, etc.);
• Total (oil, water, gas, etc.);
• Resources (current and original oil in place, water, gas, …)
• Analyt ics (water cut, gas-oi l r at io, water-oi l rat io …);
• Pressure ( BHP, bulk pressure, …)
• Flow B etween FIPs;
• Run Statist ics (number of iterat ions, total calculat ion time …);
• Crossplots (dependence between parameters);
• Hist vs Calc (histo rical and c alculat ion data for wel ls);
• Well Profi le (parameter values fo r wel l con nect ions);
•Well Section
• User Ari thmet ic (user graphs);
• Block Info (parameter values in block s: press ure, saturation, etc.);
• Profi le Info (graphs fo r Profi le (vert ical section));
• Pressure/Temperatur e Slices (for thermal m odels);
• Uni f ied Adaptat ion Resul ts (historic al and calcu lat ion data table for w el ls);
• Comparison of Resul ts ( if 2 or mo re mod els resul ts are loaded to the m odel);
• Aqui fer graphs ;
• User Selection (graphs, selected by user).
Graph types
7/17/2019 How to Use TNavigator
http://slidepdf.com/reader/full/how-to-use-tnavigator 41/55
41Graph types
41
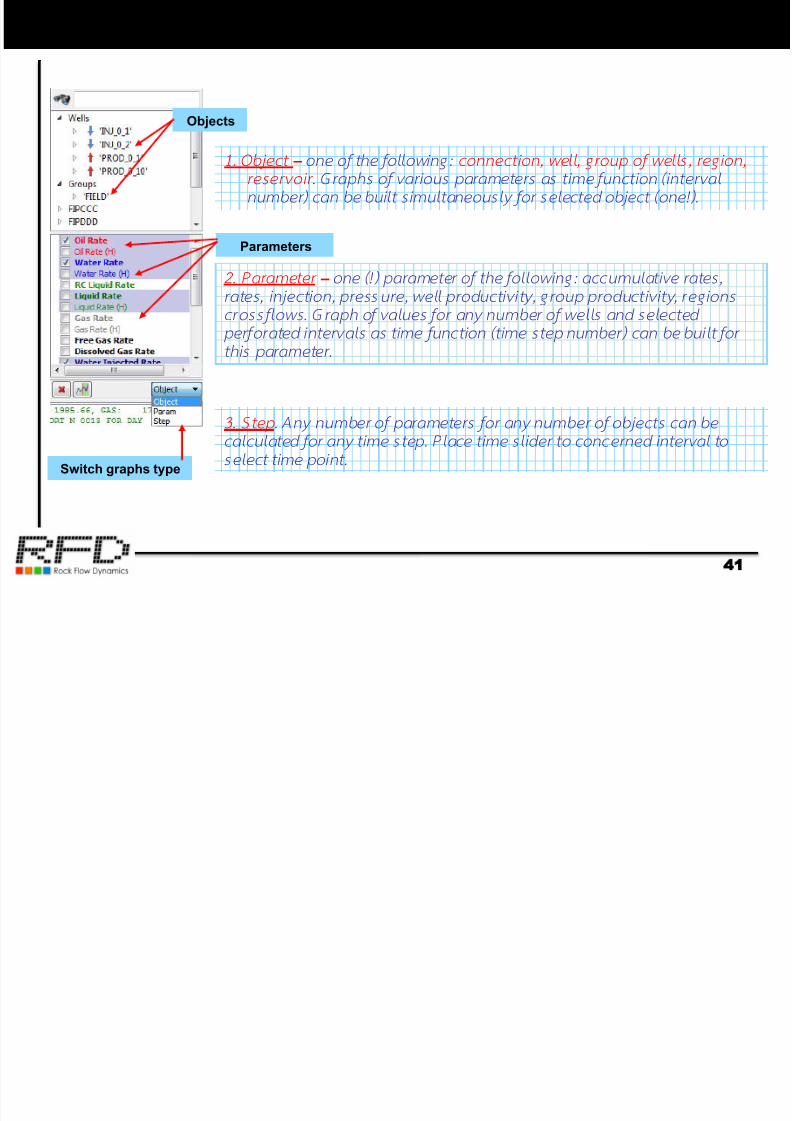
1. Object – one of the fol lowing: connect ion, wel l , group of w el ls , region,
reservoi r . Graphs of v arious parameters as t ime funct ion (interval
num ber) can be bui l t sim ultaneous ly for selected object (one!).
Objects
Parameters
Switch graphs type
2. Parameter – one (!) parameter of the fol low ing: accumu lative rates,rates, in ject ion, pressure, wel l produc t iv i ty, group produ ct iv i ty, regions
crossf low s. Graph of values for any num ber of w el ls and selected
perforated intervals as t ime fun ct ion (t ime step number) can be bui l t for
this parameter.
3. Step . Any num ber of parameters for any num ber of objects can becalculated for any tim e step. Place time sl ider to c onc erned interval to
select t ime point.
Object graph type

7/17/2019 How to Use TNavigator
http://slidepdf.com/reader/full/how-to-use-tnavigator 42/55
42Object graph type
42
Object – one of the fol lowing: connect ion, wel l , group of wel ls , region, reservoi r . Graphs o f
var ious parameters as t ime fun ct ion can b e bui l t s im ul taneously for selected object (one!).
Injector
Producer
Shut
Stop
Injector (previously - producer)
Switch well status:
historical\calculated
Parameter graph type
7/17/2019 How to Use TNavigator
http://slidepdf.com/reader/full/how-to-use-tnavigator 43/55
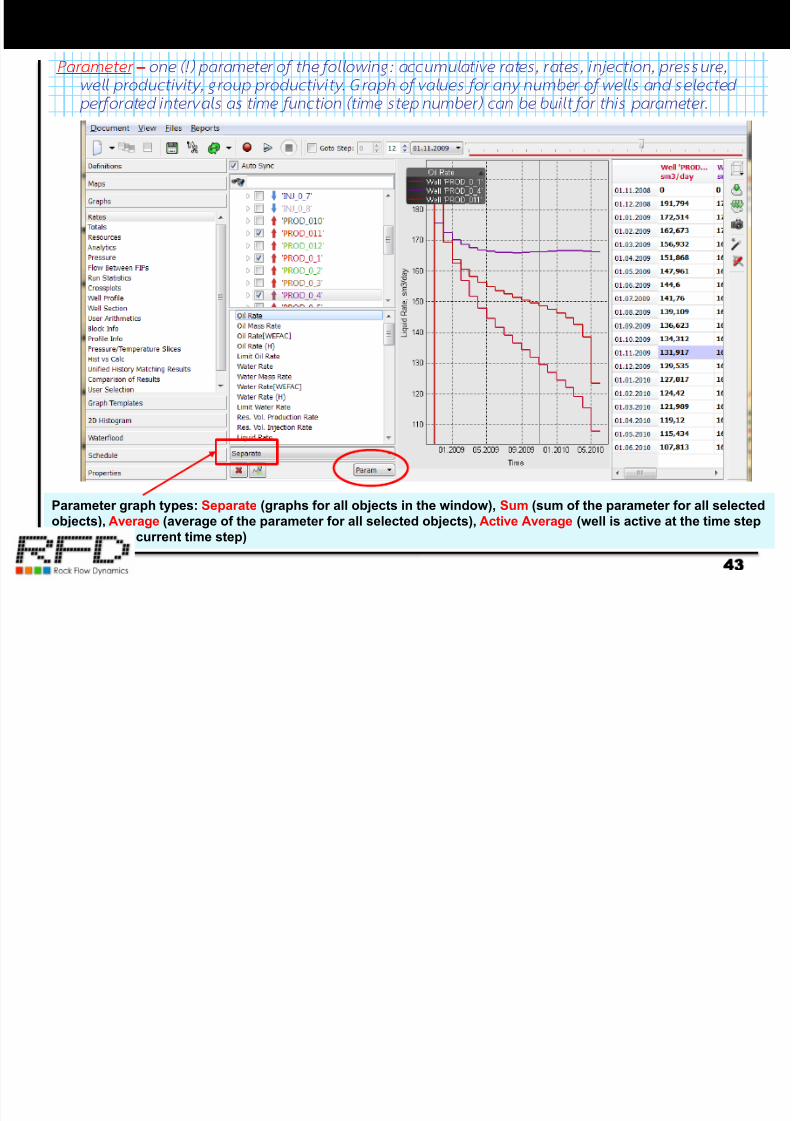
Parameter graph types: Separate (graphs for all objects in the window), Sum (sum of the parameter for all selected
objects), Average (average of the parameter for all selected objects), Active Average (well is active at the time step
if it works on current time step)
43Parameter graph type
43
Parameter – one (!) parameter of th e fol low ing: accumu lative rates, rates, inject ion, pressu re,
wel l produ ct iv i ty, group pro duct iv i ty . Graph of v alues for any num ber of w el ls and s elected
perforated intervals as t ime func t ion (t ime step num ber) can be bui l t for this parameter.
44
Step graph type
7/17/2019 How to Use TNavigator
http://slidepdf.com/reader/full/how-to-use-tnavigator 44/55
44Step graph type
44
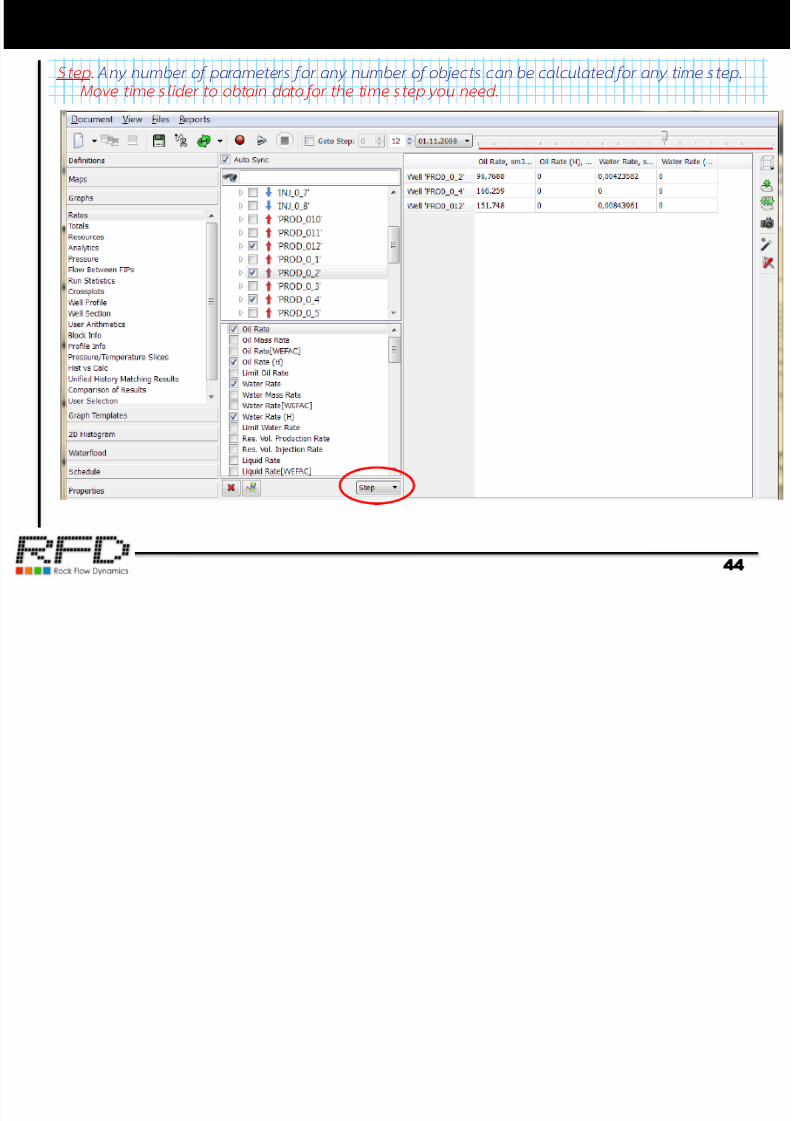
Step. Any num ber of parameters for any num ber of ob jects can be calculated for any t im e step.
Move t ime sl ider to ob tain data for th e t ime step you need.
45
User Selection
7/17/2019 How to Use TNavigator
http://slidepdf.com/reader/full/how-to-use-tnavigator 45/55
45
45
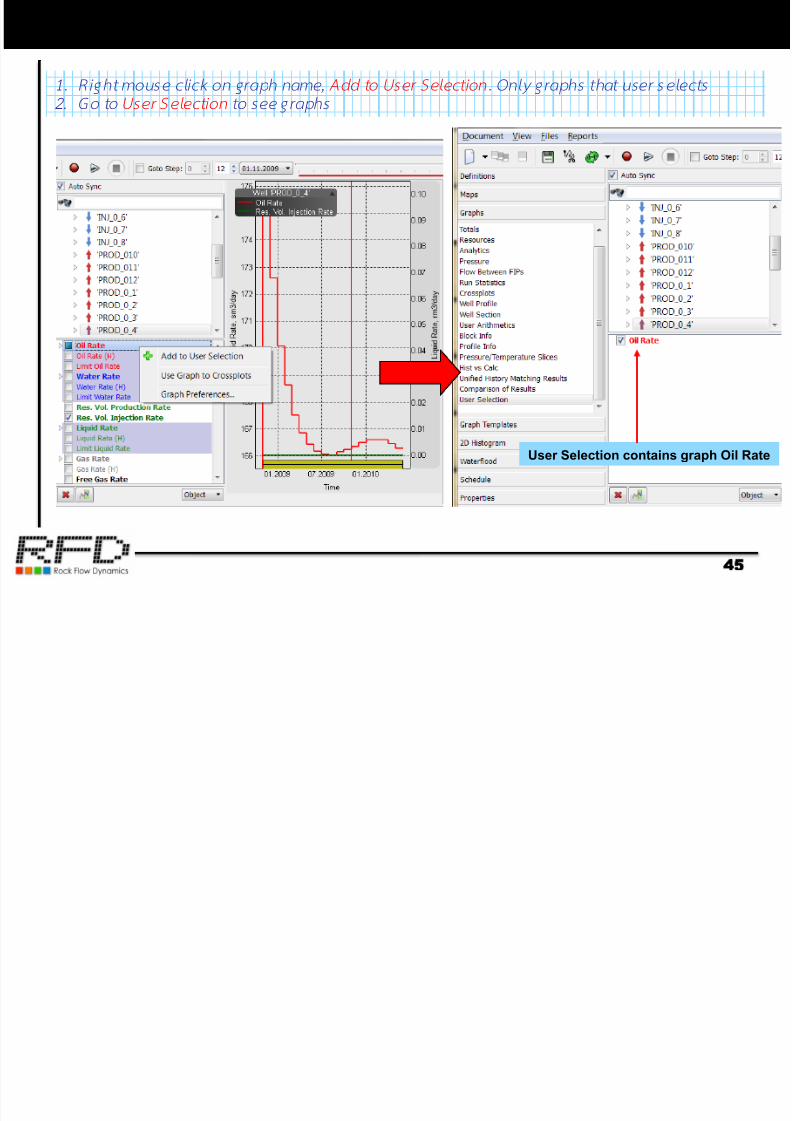
1 . R igh t mouse c l ick on graph name, Add to User Select ion . Only graph s that user selects
2. Go to User Selection to see graphs
User Selection contains graph Oil Rate
46
Well filter
7/17/2019 How to Use TNavigator
http://slidepdf.com/reader/full/how-to-use-tnavigator 46/55
46
46
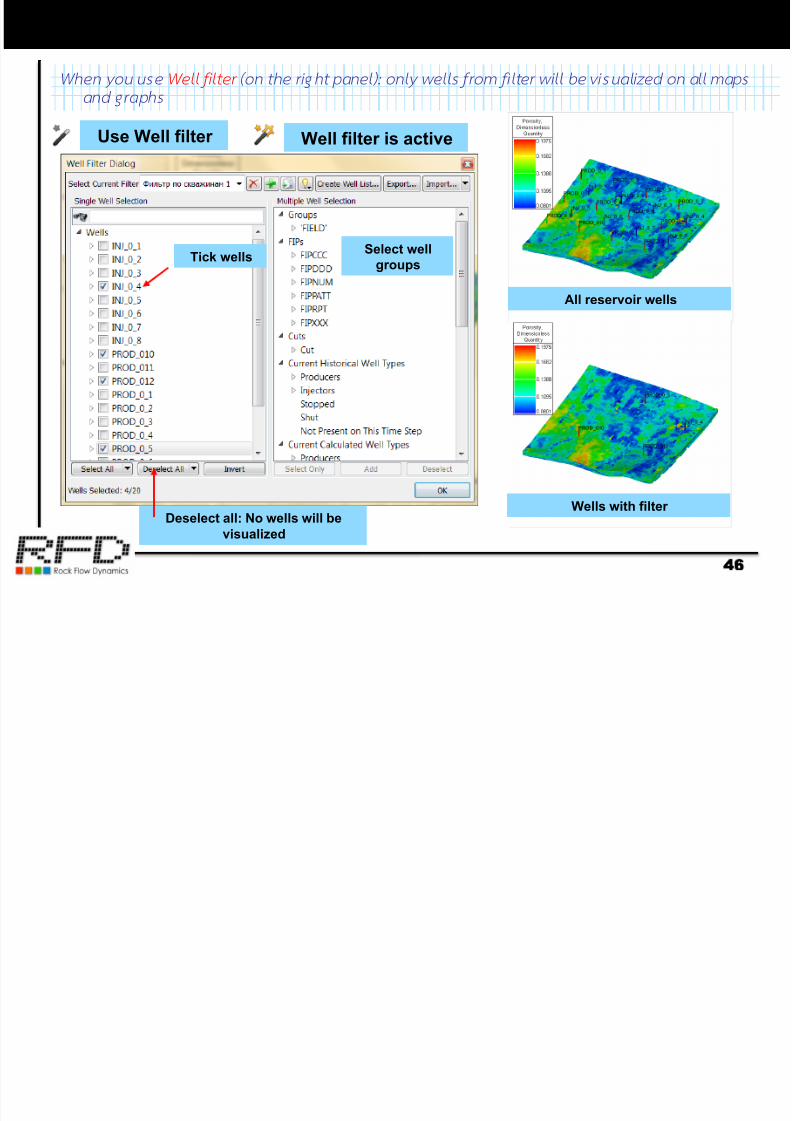
When you use Well f i l ter (on the right panel): only wel ls from f i l ter wi l l be visual ized on al l maps
and graphs
Tick wellsSelect well
groups
All reservoir wells
Wells with filter
Use Well filter
Deselect all: No wells will be
visualized
Well filter is active
47
tNavigator History Matching Tools
7/17/2019 How to Use TNavigator
http://slidepdf.com/reader/full/how-to-use-tnavigator 47/55
47g y g
47
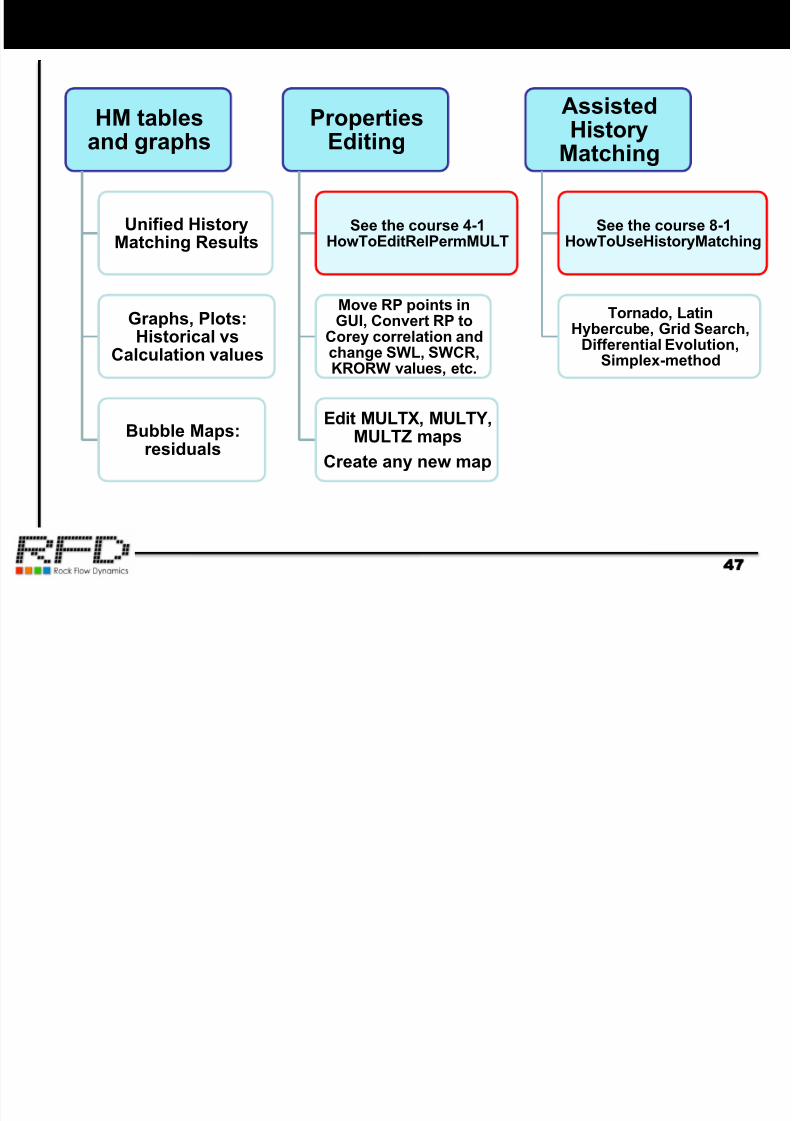
HM tables
and graphs
Unified HistoryMatching Results
Graphs, Plots:Historical vs
Calculation values
Bubble Maps:residuals
Properties
Editing
See the course 4-1HowToEditRelPermMULT
Move RP points inGUI, Convert RP to
Corey correlation andchange SWL, SWCR,KRORW values, etc.
Edit MULTX, MULTY,MULTZ maps
Create any new map
AssistedHistory
Matching
See the course 8-1HowToUseHistoryMatching
Tornado, LatinHybercube, Grid Search,
Differential Evolution,Simplex-method
48
Unified History Matching Table
7/17/2019 How to Use TNavigator
http://slidepdf.com/reader/full/how-to-use-tnavigator 48/55
48y g
48
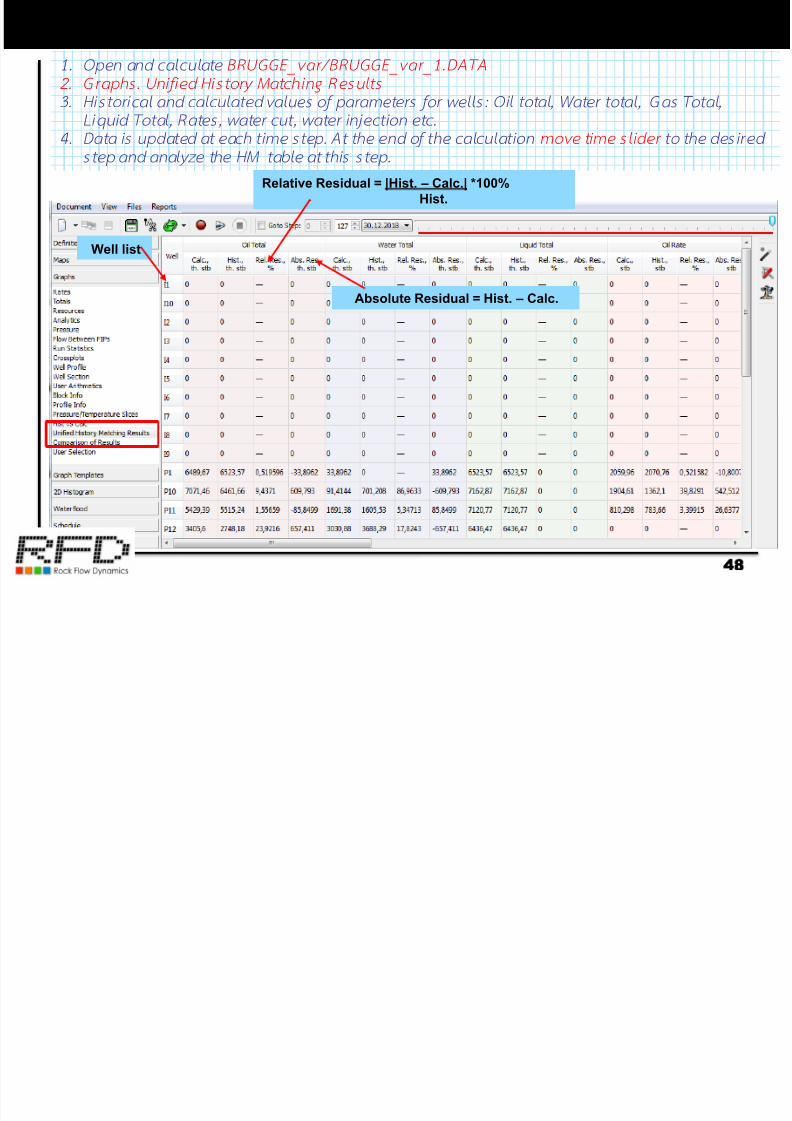
1 . Open and calcu late BRUGGE_var/BRUGGE_var_1.DATA
2. Graphs. Uni f ied His tory Match ing Results
3. Histor ical and calculated values of parameters for wel ls : Oi l total , Water total , Gas Total ,
Liqu id Total, Rates, water cu t, water inject ion etc.
4. Data is updated at each t ime step. At the end of the calculat ion mo ve t ime sl ider to the desi redstep and analyze the HM table at this step.
Absolute Residual = Hist. – Calc.
Relative Residual = |Hist. – Calc.| *100%
Hist.
Well list
49
Sorting History Matching table
7/17/2019 How to Use TNavigator
http://slidepdf.com/reader/full/how-to-use-tnavigator 49/55
49g y g
49
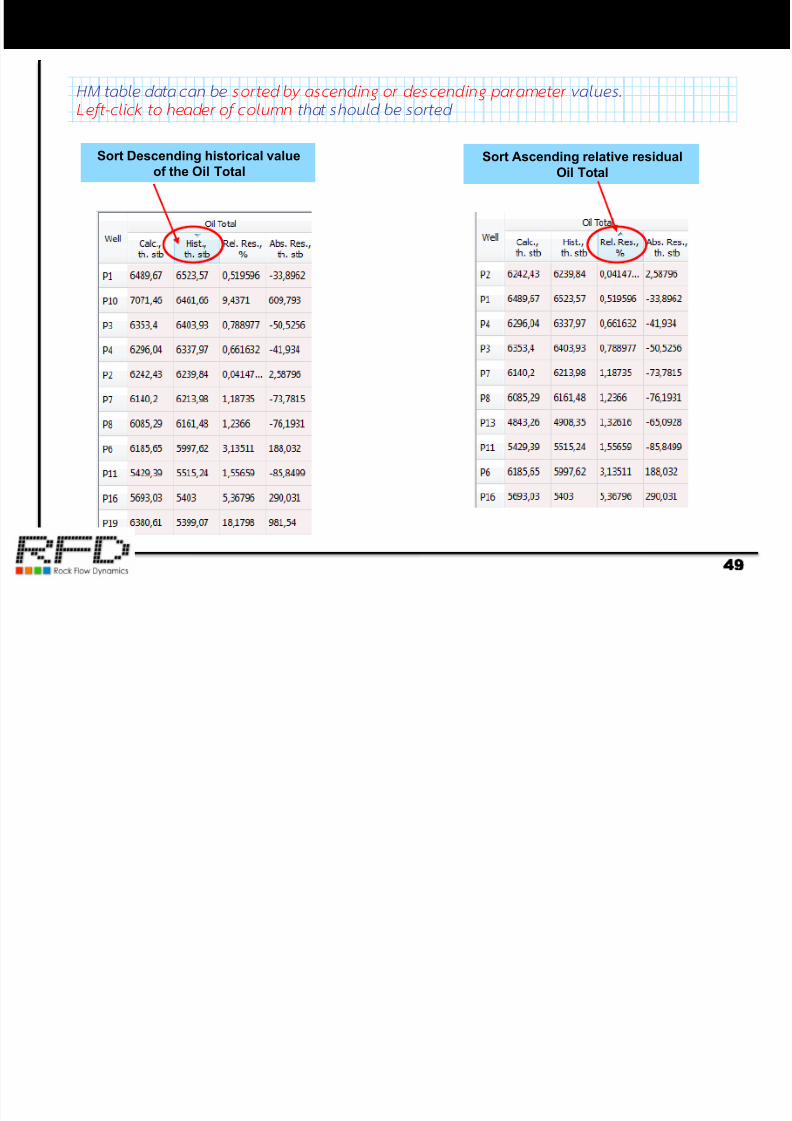
HM table data can be sorted by ascending or descending parameter values.
Lef t -c l ick to header of c olumn that should be sorted
Sort Descending historical value
of the Oil TotalSort Ascending relative residual
Oil Total
50
Graphs:
7/17/2019 How to Use TNavigator
http://slidepdf.com/reader/full/how-to-use-tnavigator 50/55
50p
50
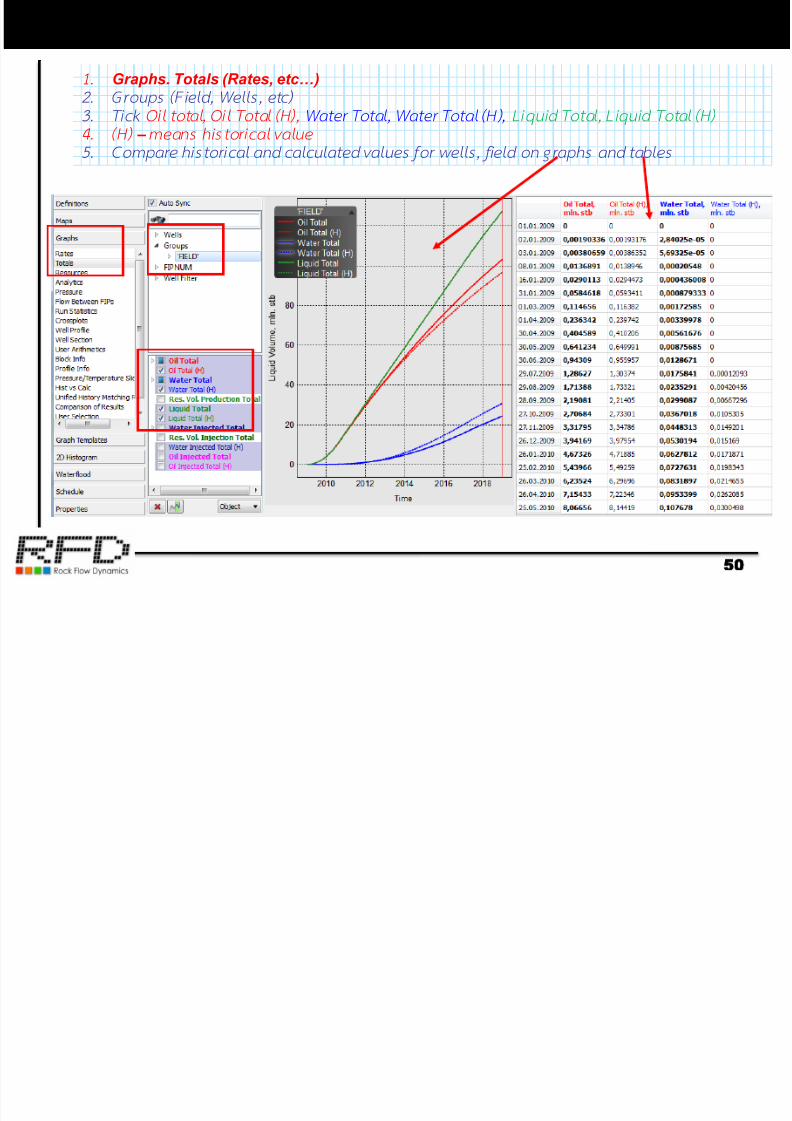
1. Graphs. Totals (Rates, etc…)
2. Groups (F ie ld , Wel ls , e tc )
3. Tick Oil to tal, Oil Total (H), Water Total, Water Total (H), Liqu id Total, Liquid Total (H)
4. (H) – m eans histor ical value
5. Compare his tor ica l and ca lcu lated va lues for wel ls , f ield on graphs and tab les
51
Graph: historical and calculated values
7/17/2019 How to Use TNavigator
http://slidepdf.com/reader/full/how-to-use-tnavigator 51/55
51p
51
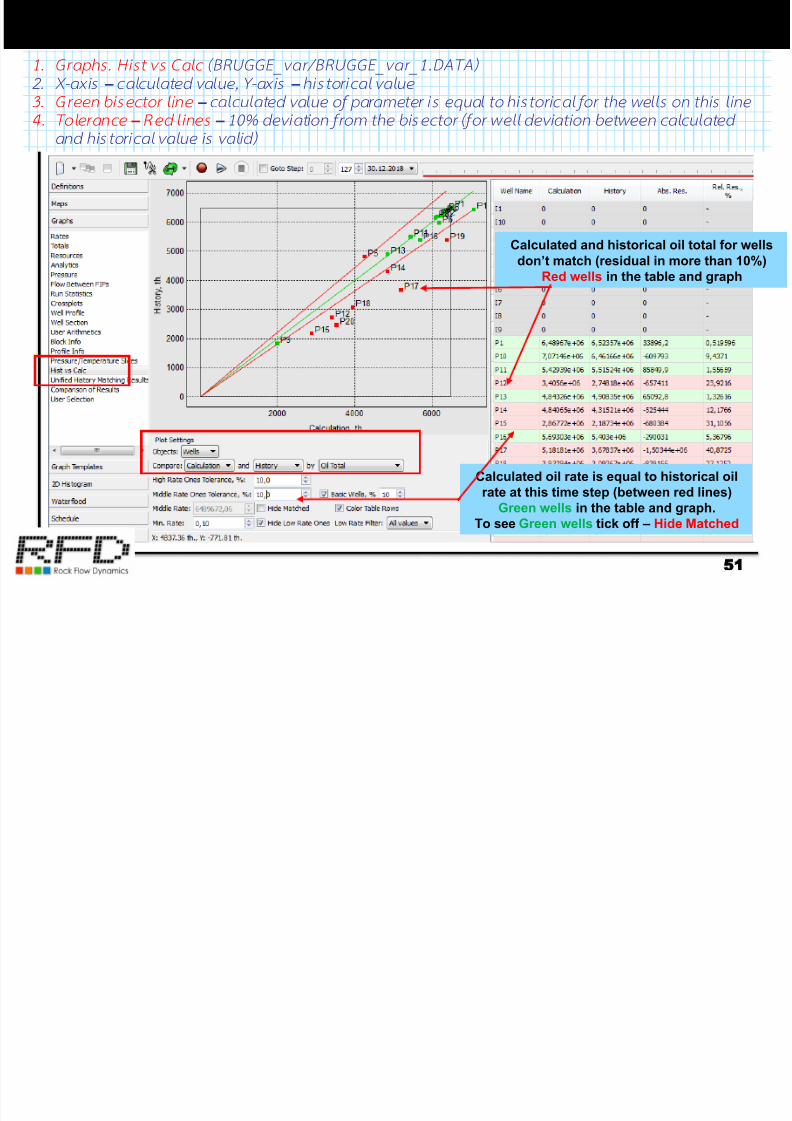
1 . Graphs . H is t vs Ca lc (BRUGGE_var/BRUGGE_var_1.DATA)
2. X-ax is – calcu lated value, Y-axis – histor ical value
3 . Green b isec to r l ine – calculated value of p arameter is equal to h istor ical for the wel ls on th is l ine
4. To lerance – Red l ines – 10% deviat ion from the bisector (for w el l deviat ion between calculated
and his torical value is val id)
Calculated and historical oil total for wells
don’t match (residual in more than 10%)
Red wells in the table and graph
Calculated oil rate is equal to historical oil
rate at this time step (between red lines)
Green wells in the table and graph.
To see Green wells tick off – Hide Matched
52
Graph: historical and calculated values
7/17/2019 How to Use TNavigator
http://slidepdf.com/reader/full/how-to-use-tnavigator 52/55
52
52
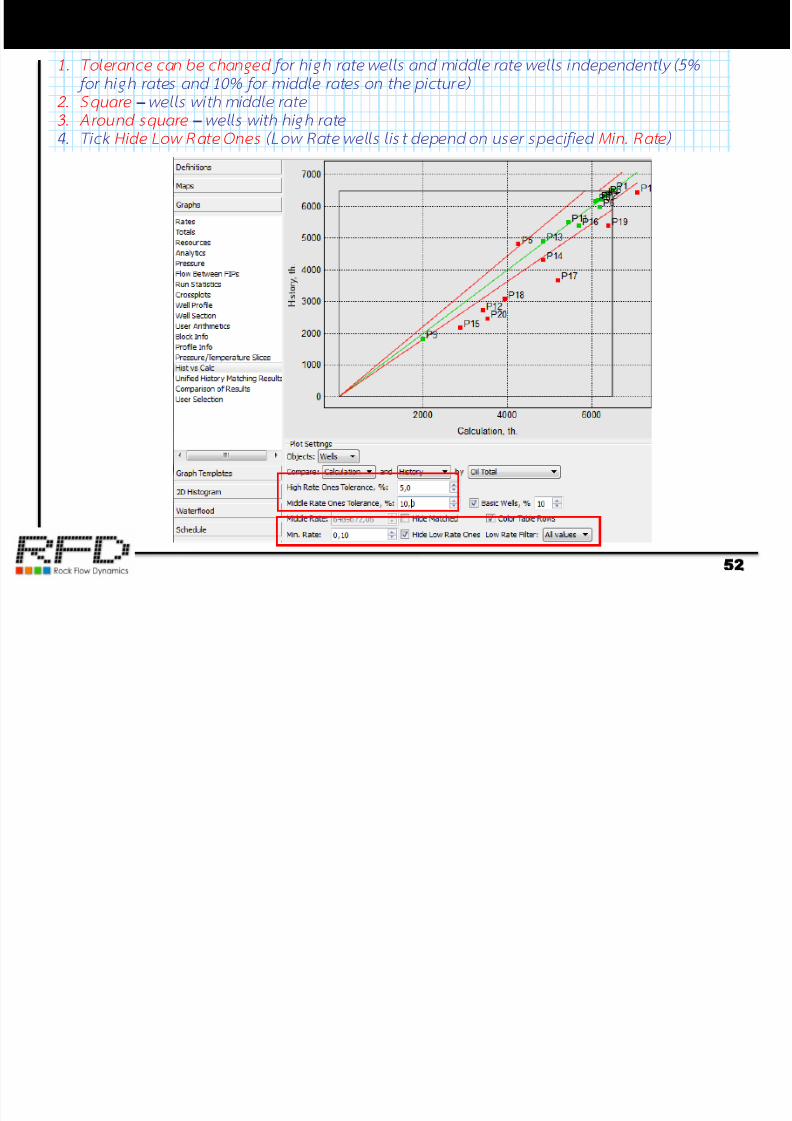
1 . To lerance can be changed for h igh r ate wel ls and middle rate wel ls independent ly (5%
for high rates and 10% for middle rates on the p icture)
2. Sq uare – wel ls wi th m iddle rate
3. A round square – wel ls wi th high r ate
4. Tick Hide Low Rate Ones (Low Rate wel ls l is t depend o n u ser speci f ied Min. Rate )
53
Residual Bubble Maps
7/17/2019 How to Use TNavigator
http://slidepdf.com/reader/full/how-to-use-tnavigator 53/55
53
53
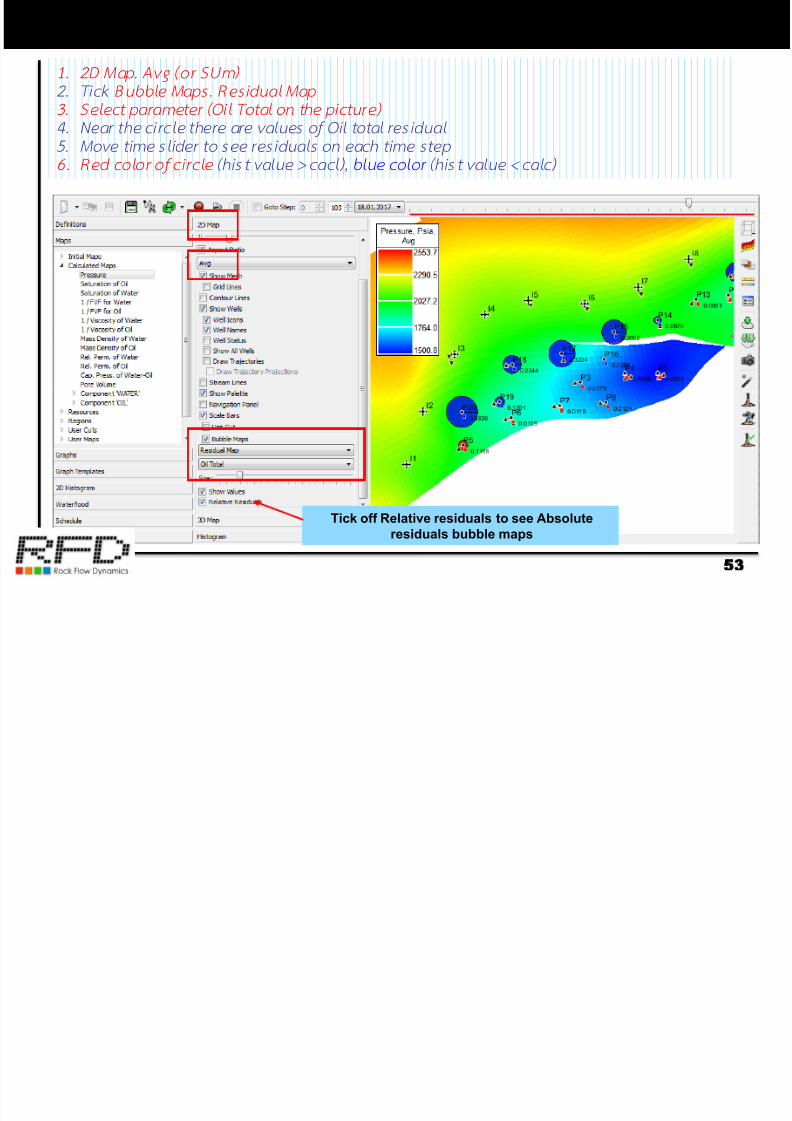
1 . 2D Map. Avg (o r SUm)
2. Tick Bub ble Maps. Residual Map
3. Select parameter (Oi l Total on the picture)
4. Near the ci rc le there are values of Oi l total res idual
5 . Move t ime s l ider to see res iduals on each t ime step6. Red co lo r o f ci rc le (hist v alue > cacl), b lue color (hist value < c alc)
Tick off Relative residuals to see Absolute
residuals bubble maps
54
Historical vs Calculated Bubble Maps
7/17/2019 How to Use TNavigator
http://slidepdf.com/reader/full/how-to-use-tnavigator 54/55
54
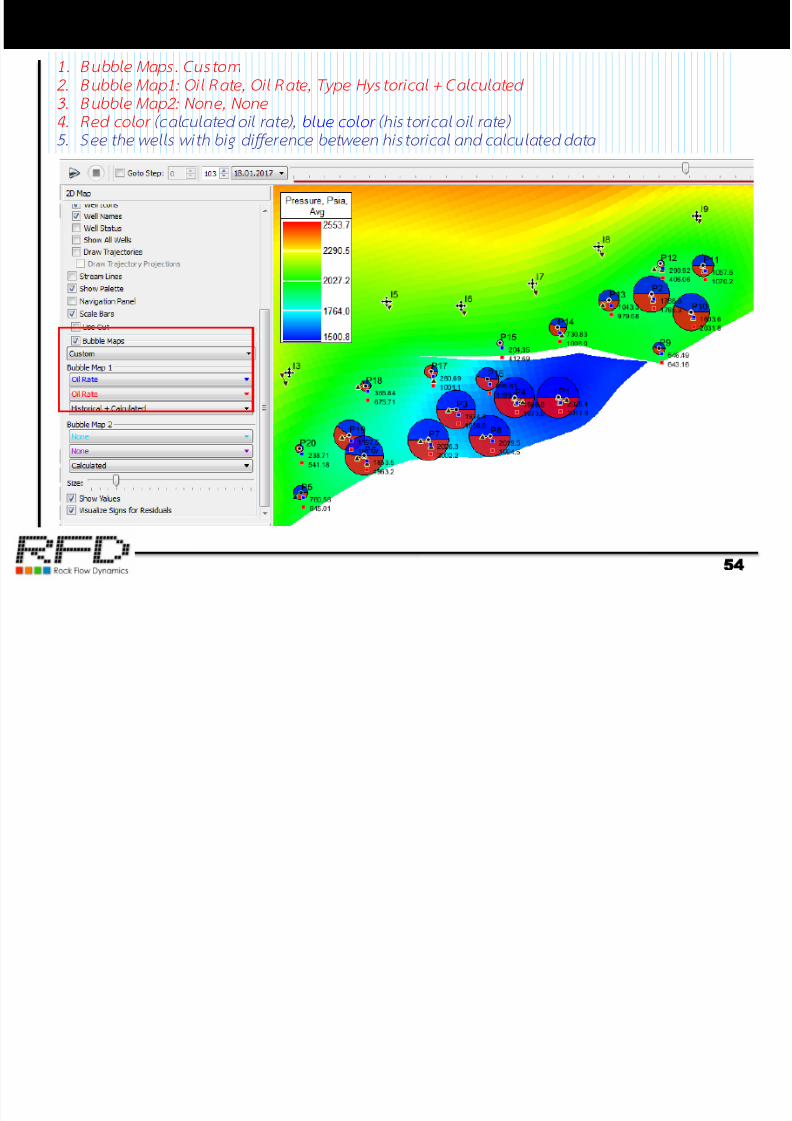
54
1. Bubbl e Maps . Cus tom
2. Bubb le Map1: Oi l Rate, Oi l Rate, Type Hystor ical + Calculated
3 . Bubb le Map2: None , None
4. Red co lo r (calcu lated oil rate), b lue color (historic al oi l rate)
5. See the wel ls wi th big d i f ference between histor ical and calculated data
7/17/2019 How to Use TNavigator
http://slidepdf.com/reader/full/how-to-use-tnavigator 55/55
Thank you for attention


