How to scale SQL Azure databases -...
43
Transcript of How to scale SQL Azure databases -...
How to scale SQL Azure databases
Edwin Cheung
Principal Program Manager
China Cloud Innovation Centre
Customer Advisory Team
Microsoft Asia-Pacific Research
and Development Group
4 |
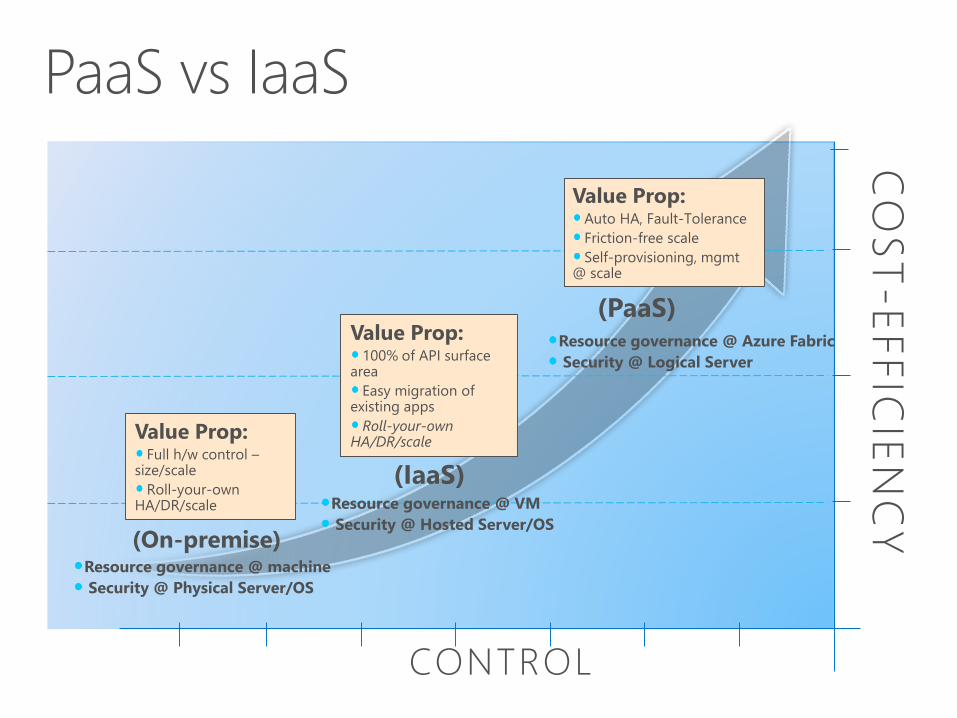
CONTROL
CO
ST
-E
FFIC
IEN
CY
(On-premise)
Value Prop:
Value Prop:
Roll-your-own HA/DR/scale
(IaaS)
Value Prop:
(PaaS)
6 |
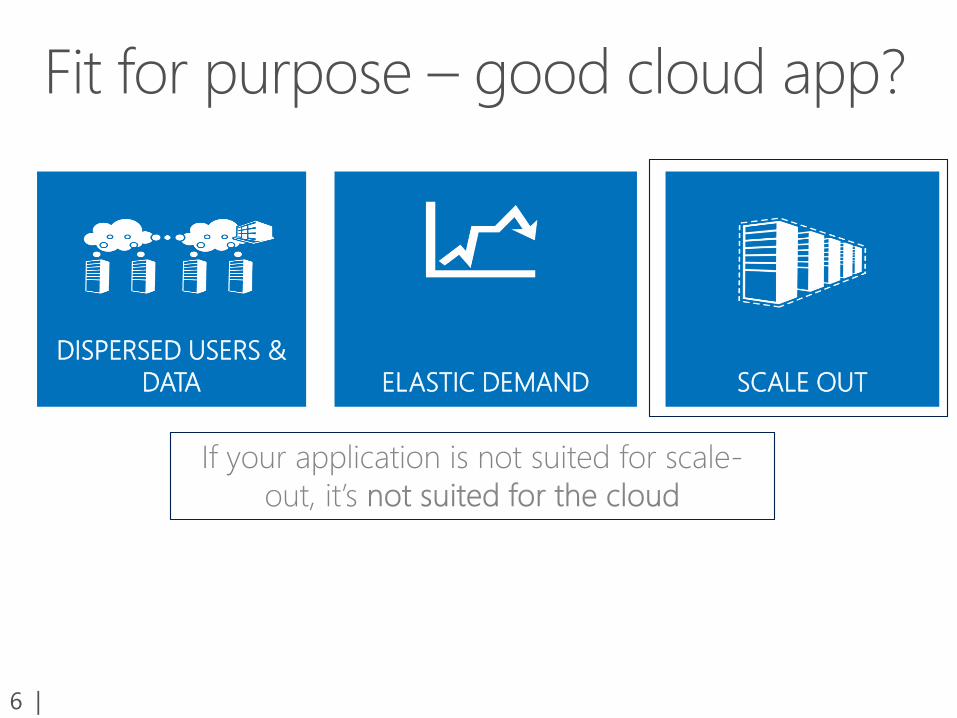
DISPERSED USERS &
DATA ELASTIC DEMAND SCALE OUT
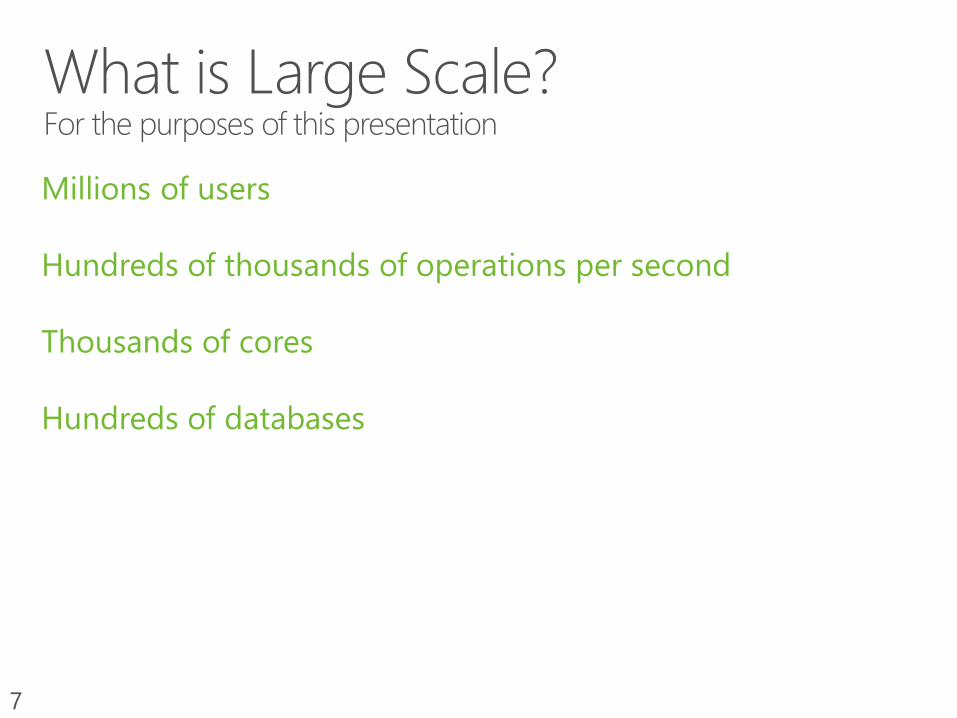
Millions of users
Hundreds of thousands of operations per second
Thousands of cores
Hundreds of databases
7
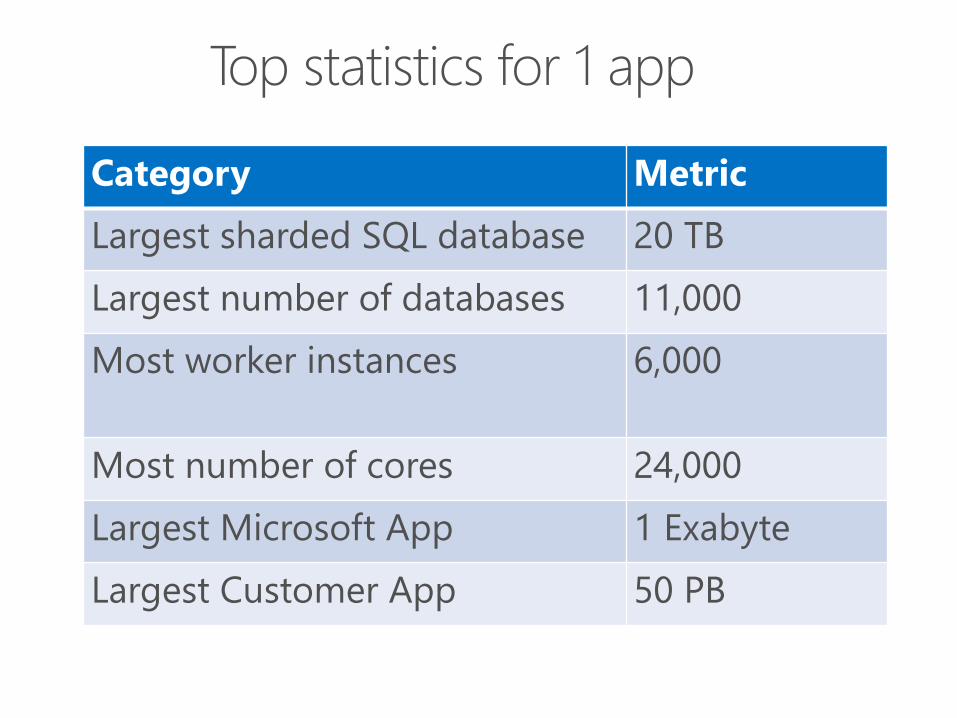
Category Metric
Largest sharded SQL database 20 TB
Largest number of databases 11,000
Most worker instances 6,000
Most number of cores 24,000
Largest Microsoft App 1 Exabyte
Largest Customer App 50 PB
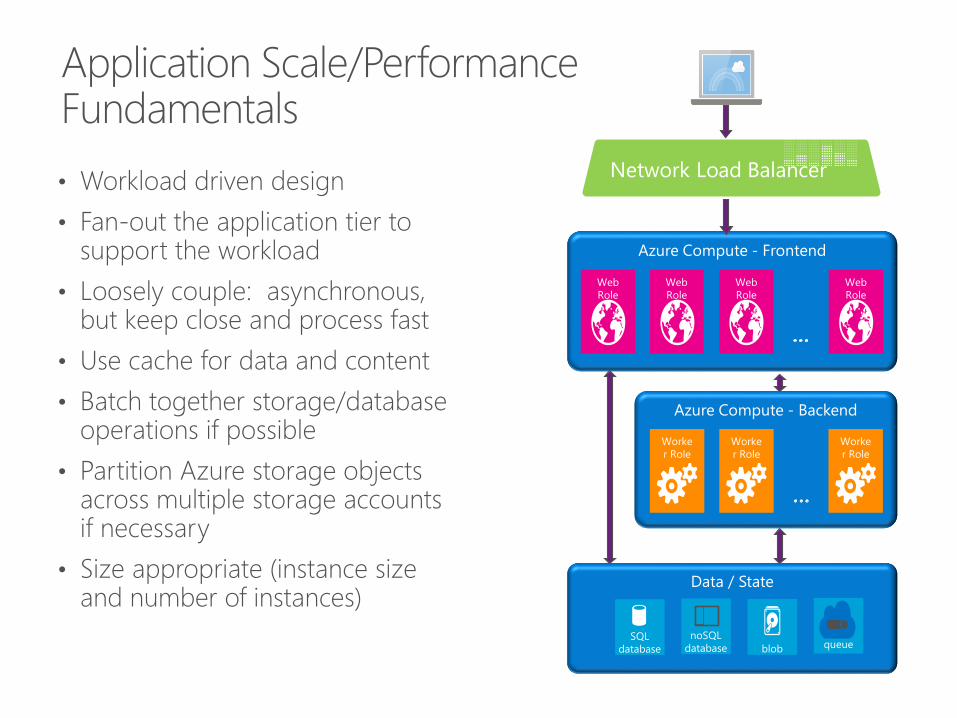
• Workload driven design
• Fan-out the application tier to support the workload
• Loosely couple: asynchronous, but keep close and process fast
• Use cache for data and content
• Batch together storage/database operations if possible
• Partition Azure storage objects across multiple storage accounts if necessary
• Size appropriate (instance size and number of instances)
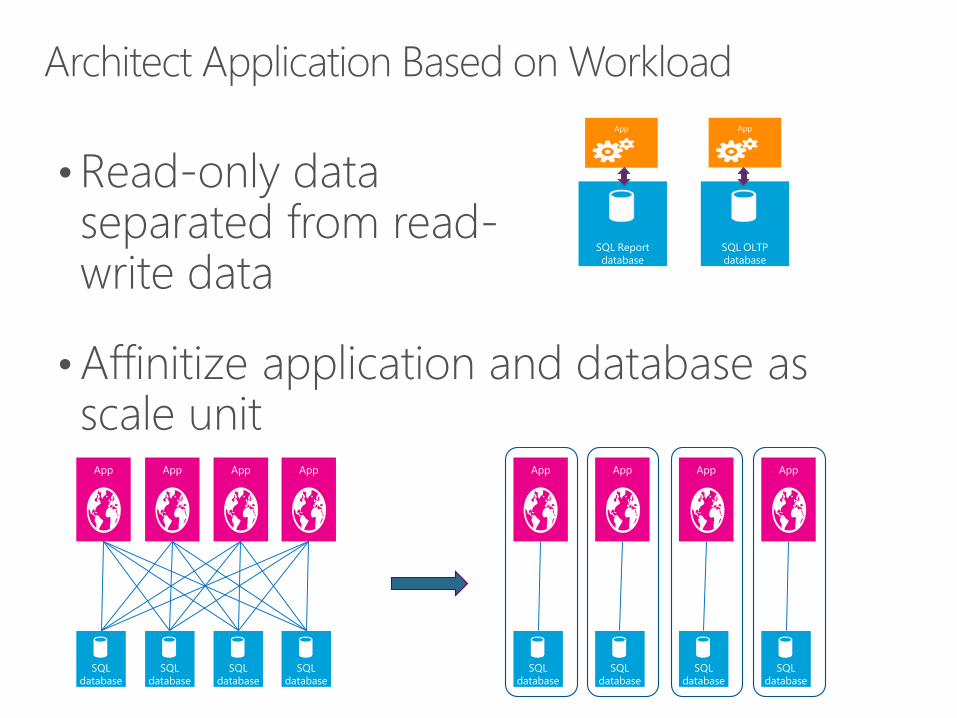
•Read-only data separated from read-write data
•Affinitize application and database as scale unit
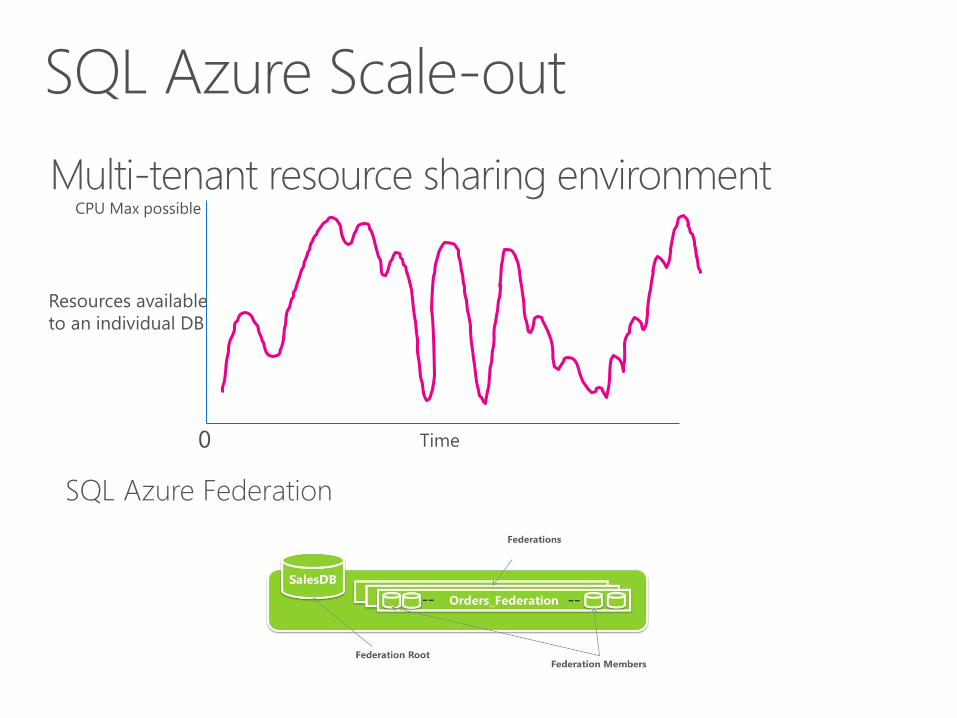
SQL Azure Federation
Time
Resources available
to an individual DB
0
CPU Max possible
Multi-tenant resource sharing environment
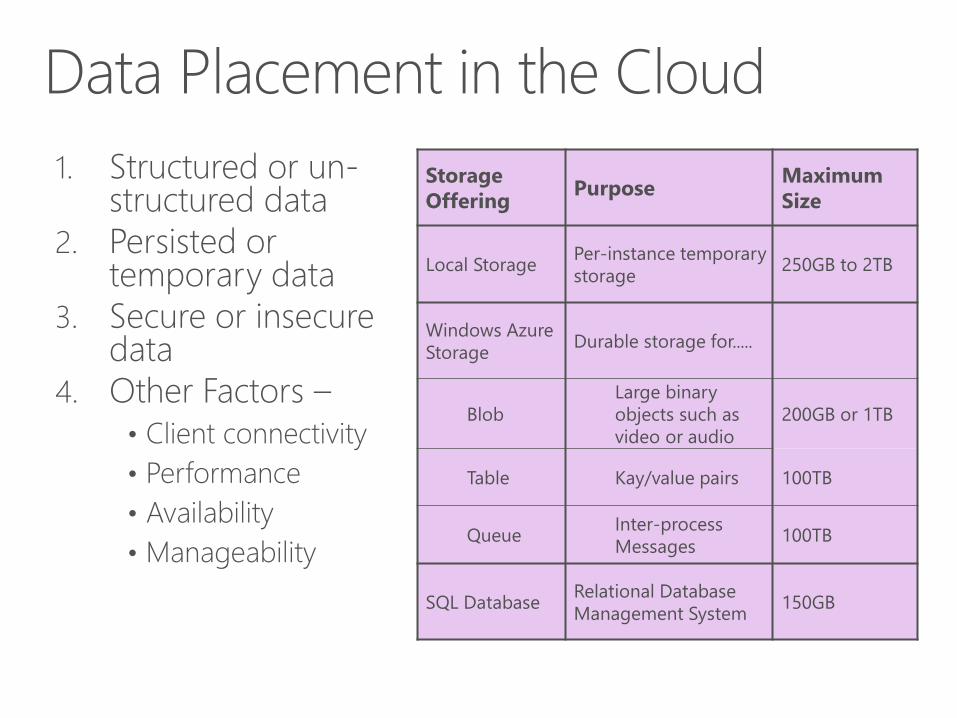
1. Structured or un-structured data
2. Persisted or temporary data
3. Secure or insecure data
4. Other Factors –
• Client connectivity
• Performance
• Availability
• Manageability
Storage
OfferingPurpose
Maximum
Size
Local StoragePer-instance temporary
storage250GB to 2TB
Windows Azure
StorageDurable storage for.....
Blob
Large binary
objects such as
video or audio
200GB or 1TB
Table Kay/value pairs 100TB
QueueInter-process
Messages100TB
SQL DatabaseRelational Database
Management System150GB
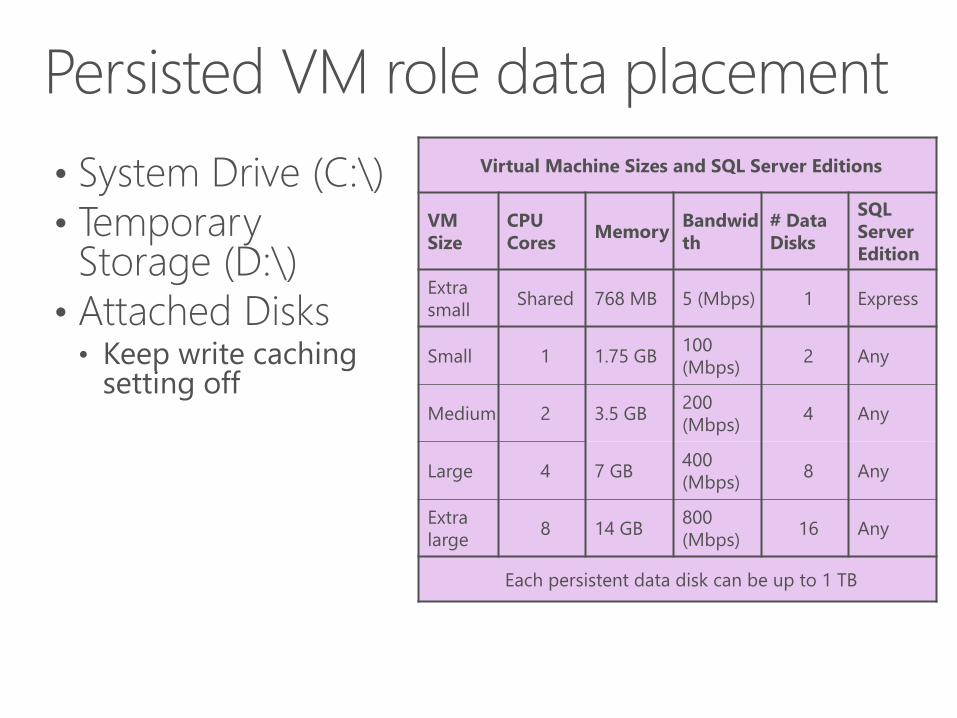
• System Drive (C:\)
• Temporary Storage (D:\)
• Attached Disks
Virtual Machine Sizes and SQL Server Editions
VM
Size
CPU
CoresMemory
Bandwid
th
# Data
Disks
SQL
Server
Edition
Extra
smallShared 768 MB 5 (Mbps) 1 Express
Small 1 1.75 GB100
(Mbps)2 Any
Medium 2 3.5 GB200
(Mbps)4 Any
Large 4 7 GB400
(Mbps)8 Any
Extra
large8 14 GB
800
(Mbps)16 Any
Each persistent data disk can be up to 1 TB
Data access implementation in Windows Azure and SQL Azure introduces additional complexity around two main areas
• Retry logic necessary to implement reliable communications between application and database server
between app tier and database tier on Azure is
higher compared to an on premises deployment• Firewalls, load balancers, gateways
• This amplifies the impact of chatty application behaviors
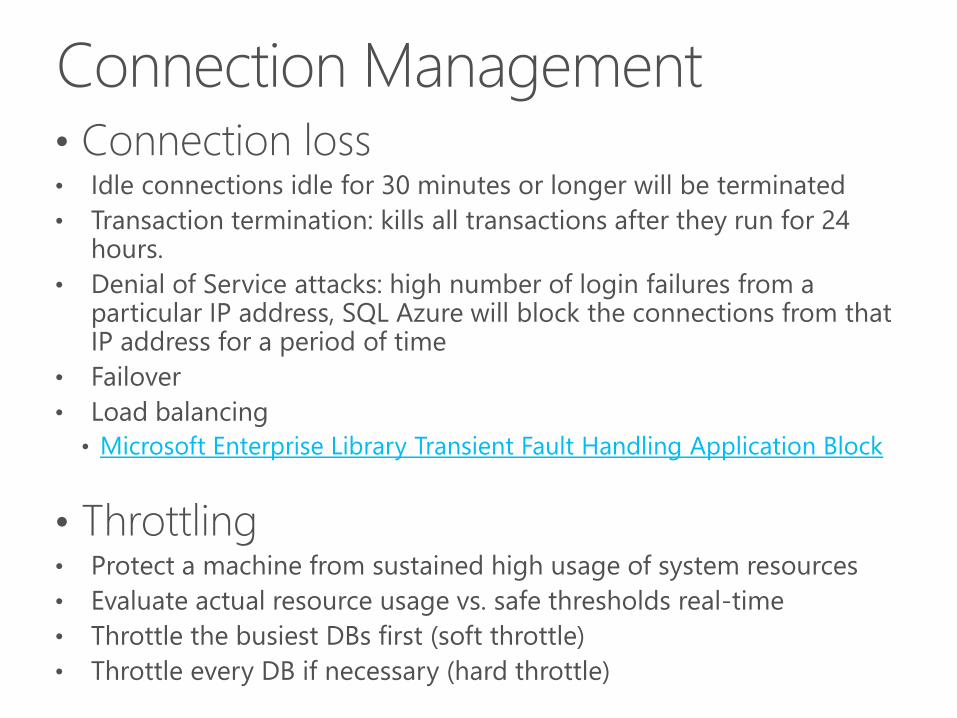
• Connection loss• Idle connections idle for 30 minutes or longer will be terminated
• Transaction termination: kills all transactions after they run for 24 hours.
• Denial of Service attacks: high number of login failures from a particular IP address, SQL Azure will block the connections from that IP address for a period of time
• Failover
• Load balancing
• Microsoft Enterprise Library Transient Fault Handling Application Block
• Throttling • Protect a machine from sustained high usage of system resources
• Evaluate actual resource usage vs. safe thresholds real-time
• Throttle the busiest DBs first (soft throttle)
• Throttle every DB if necessary (hard throttle)
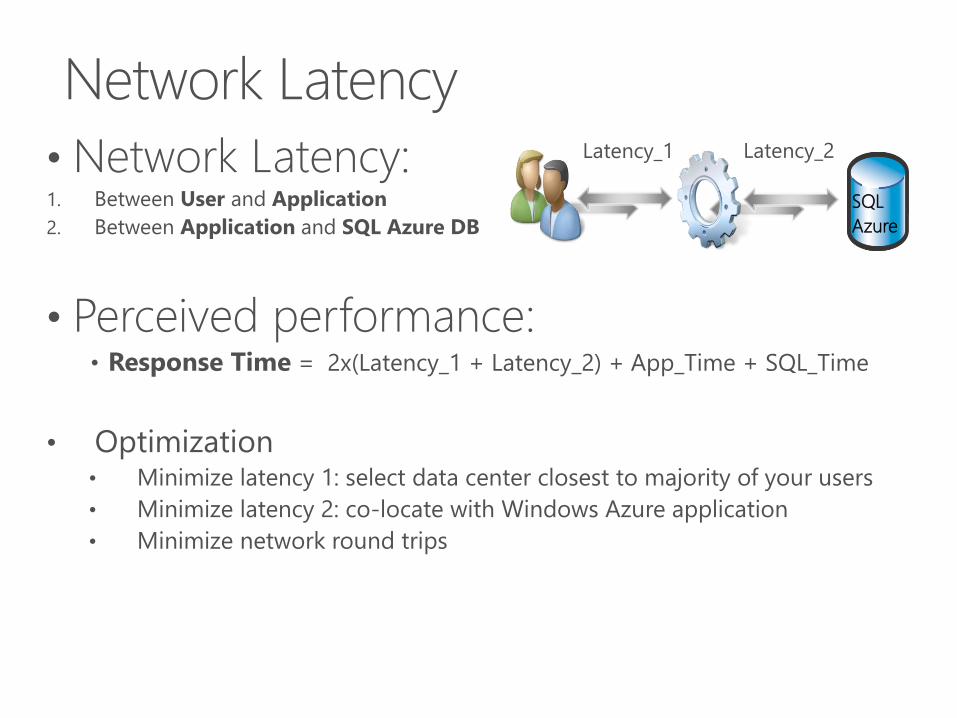
• Network Latency: 1. Between User and Application
2. Between Application and SQL Azure DB
• Perceived performance: • Response Time = 2x(Latency_1 + Latency_2) + App_Time + SQL_Time
• Optimization• Minimize latency 1: select data center closest to majority of your users
• Minimize latency 2: co-locate with Windows Azure application
• Minimize network round trips
SQL
Azure

Blog Post: Testing Client Latency to
SQL Azure
SQL
Azure
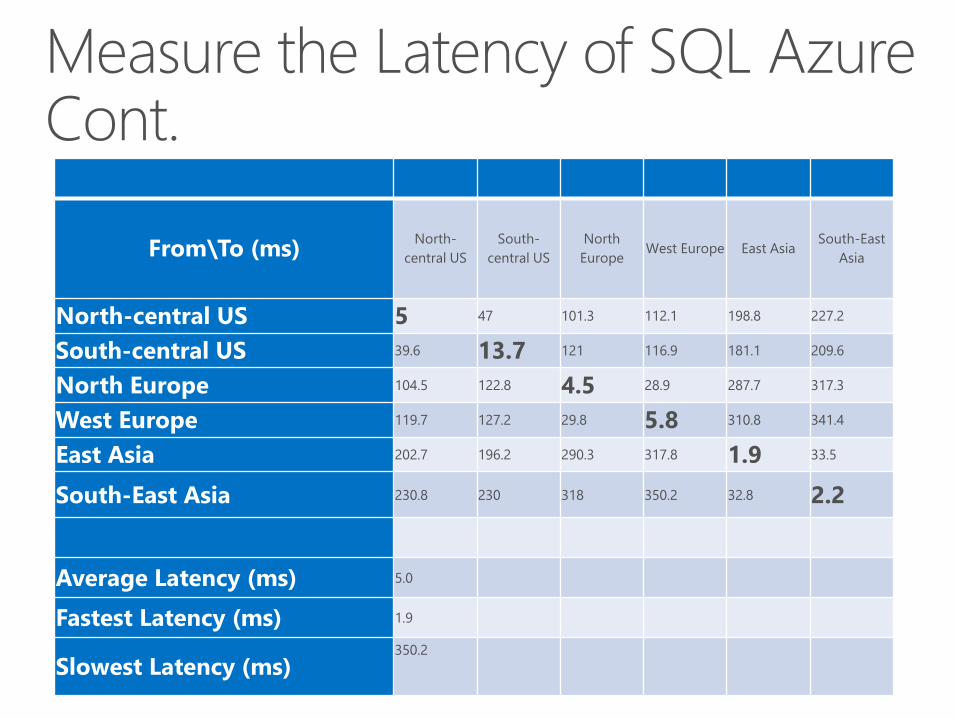
From\To (ms)North-
central US
South-
central US
North
EuropeWest Europe East Asia
South-East
Asia
North-central US 5 47 101.3 112.1 198.8 227.2
South-central US 39.6 13.7 121 116.9 181.1 209.6
North Europe 104.5 122.8 4.5 28.9 287.7 317.3
West Europe 119.7 127.2 29.8 5.8 310.8 341.4
East Asia 202.7 196.2 290.3 317.8 1.9 33.5
South-East Asia 230.8 230 318 350.2 32.8 2.2
Average Latency (ms) 5.0
Fastest Latency (ms) 1.9
Slowest Latency (ms)350.2
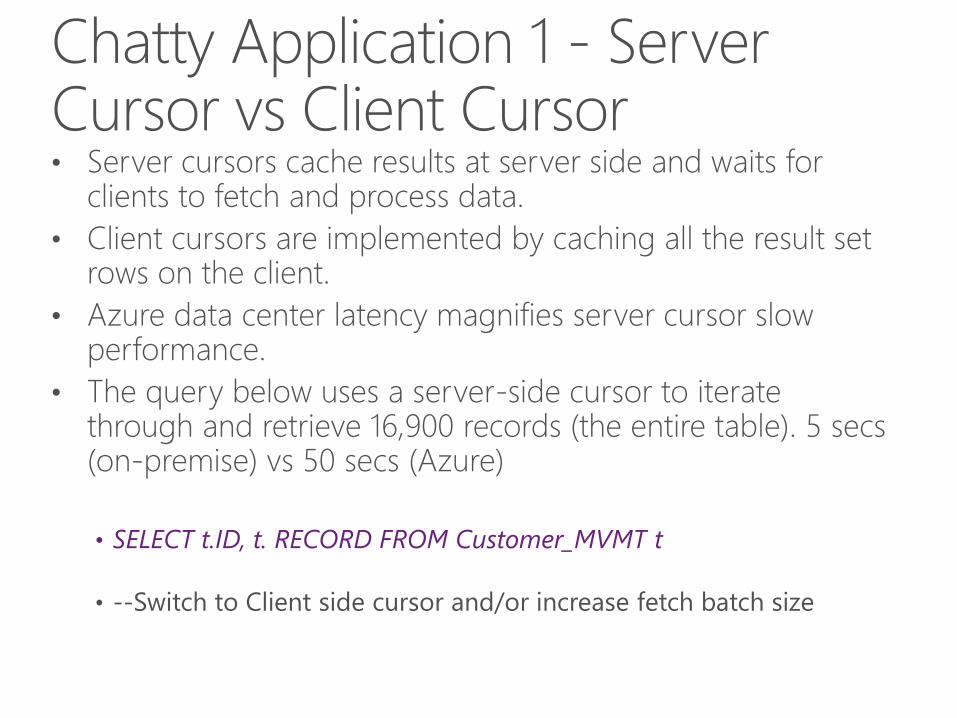
• Server cursors cache results at server side and waits for clients to fetch and process data.
• Client cursors are implemented by caching all the result set rows on the client.
• Azure data center latency magnifies server cursor slow performance.
• The query below uses a server-side cursor to iterate through and retrieve 16,900 records (the entire table). 5 secs(on-premise) vs 50 secs (Azure)
• SELECT t.ID, t. RECORD FROM Customer_MVMT t
• --Switch to Client side cursor and/or increase fetch batch size
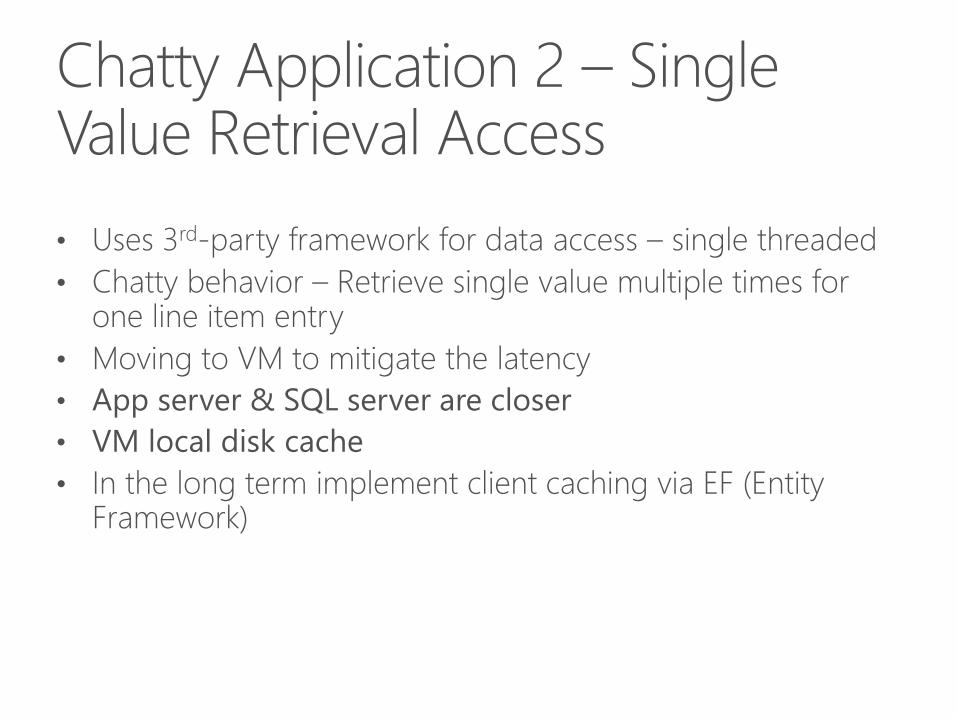
• Uses 3rd-party framework for data access – single threaded
• Chatty behavior – Retrieve single value multiple times for one line item entry
• Moving to VM to mitigate the latency
• App server & SQL server are closer
• VM local disk cache
• In the long term implement client caching via EF (Entity Framework)
Azure VM Azure Storage
App
ServerAttached
DiskSQL Server
Memory
Pool
Local Disk
Cache
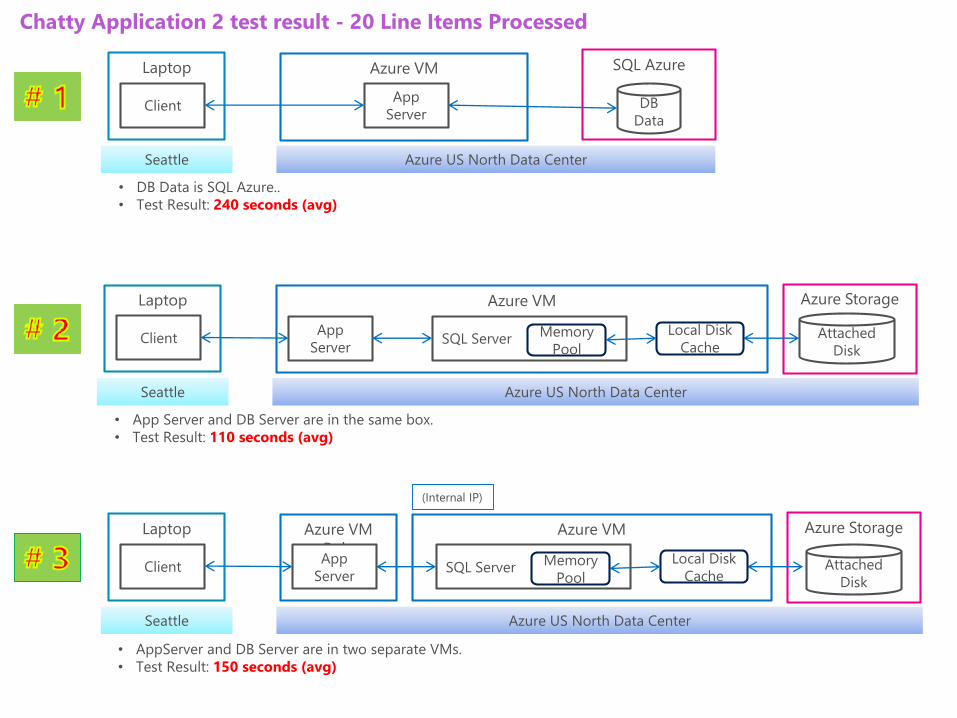
Chatty Application 2 test result - 20 Line Items Processed
Laptop
Client
Seattle Azure US North Data Center
Azure StorageAzure VM
RoleApp
Server
Azure VM
SQL ServerMemory
Pool
Local Disk
Cache
Laptop
Client
Seattle Azure US North Data Center
• App Server and DB Server are in the same box.
• Test Result: 110 seconds (avg)
• AppServer and DB Server are in two separate VMs.
• Test Result: 150 seconds (avg)
Azure VM SQL Azure
App
ServerDB
Data
Laptop
Client
Seattle Azure US North Data Center
• DB Data is SQL Azure..
• Test Result: 240 seconds (avg)
(Internal IP)
Attached
Disk
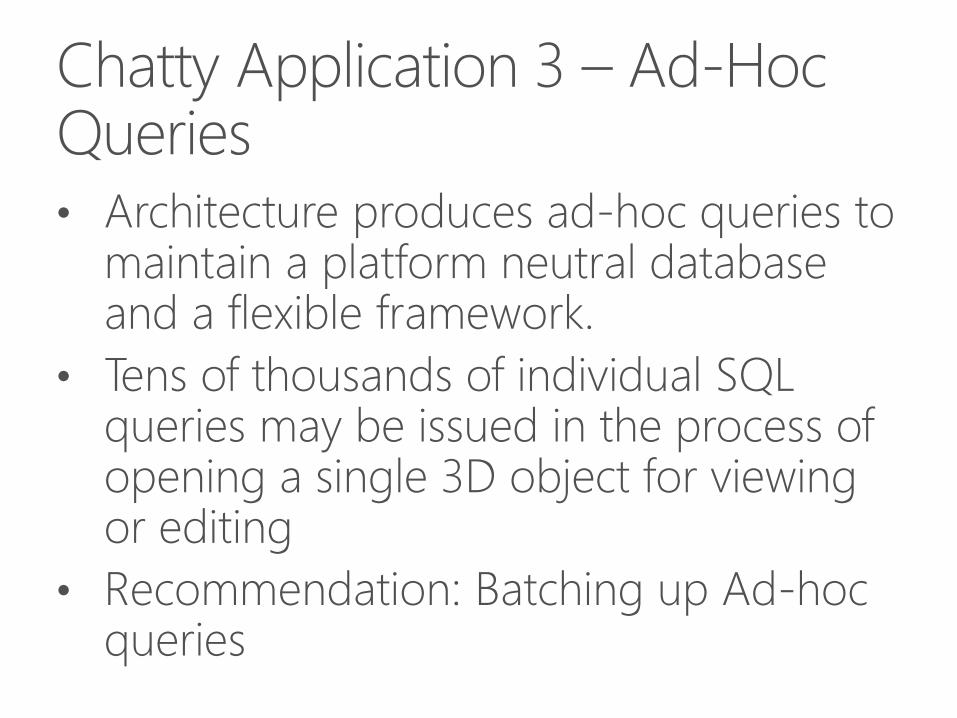
• Architecture produces ad-hoc queries to maintain a platform neutral database and a flexible framework.
• Tens of thousands of individual SQL queries may be issued in the process of opening a single 3D object for viewing or editing
• Recommendation: Batching up Ad-hoc queries
24
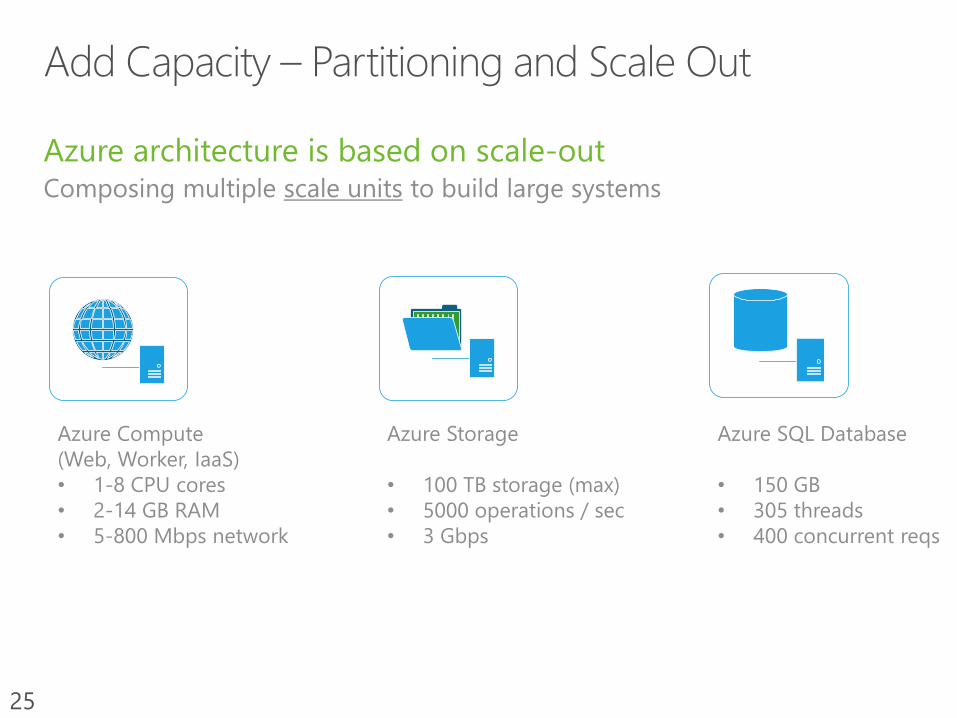
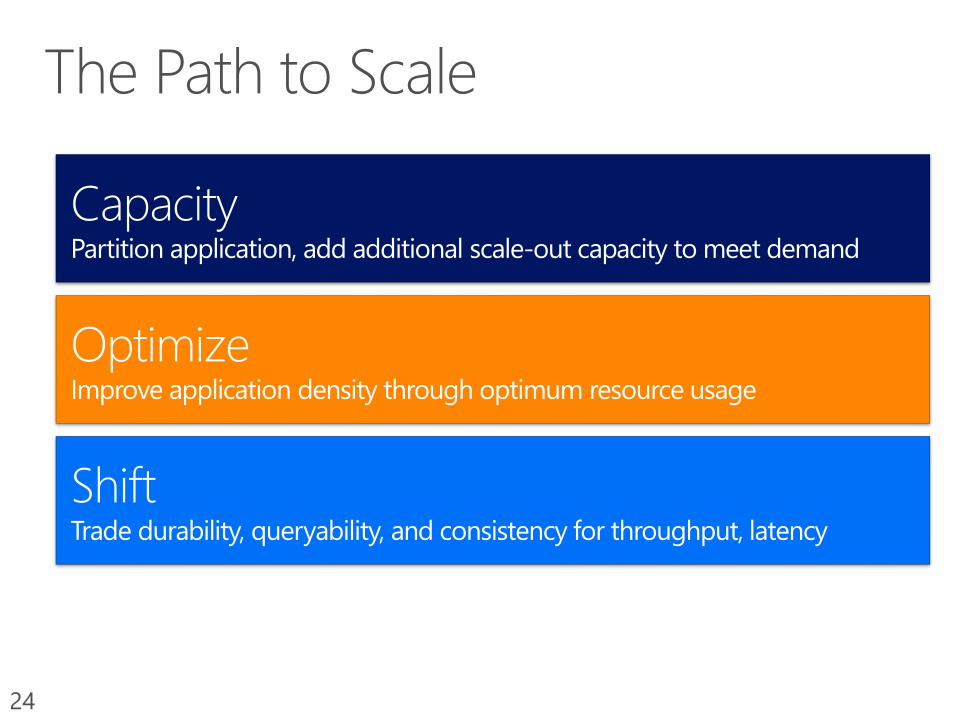
Azure architecture is based on scale-outComposing multiple scale units to build large systems
25
Azure Compute
(Web, Worker, IaaS)
• 1-8 CPU cores
• 2-14 GB RAM
• 5-800 Mbps network
Azure Storage
• 100 TB storage (max)
• 5000 operations / sec
• 3 Gbps
Azure SQL Database
• 150 GB
• 305 threads
• 400 concurrent reqs
Azure Cloud Service
Loa
d B
ala
nce
r
Windows
Azure SQL
Database
Web Role
Worker Role
26
Aspect Partitioning Capacity
Web role Low state
Automatic (via load
balancer)
Round-robin
Add more
instances (easy)
SQL
Database
High state
Manual (via app
code)
Choose
partitioning
function
Add more
databases
27
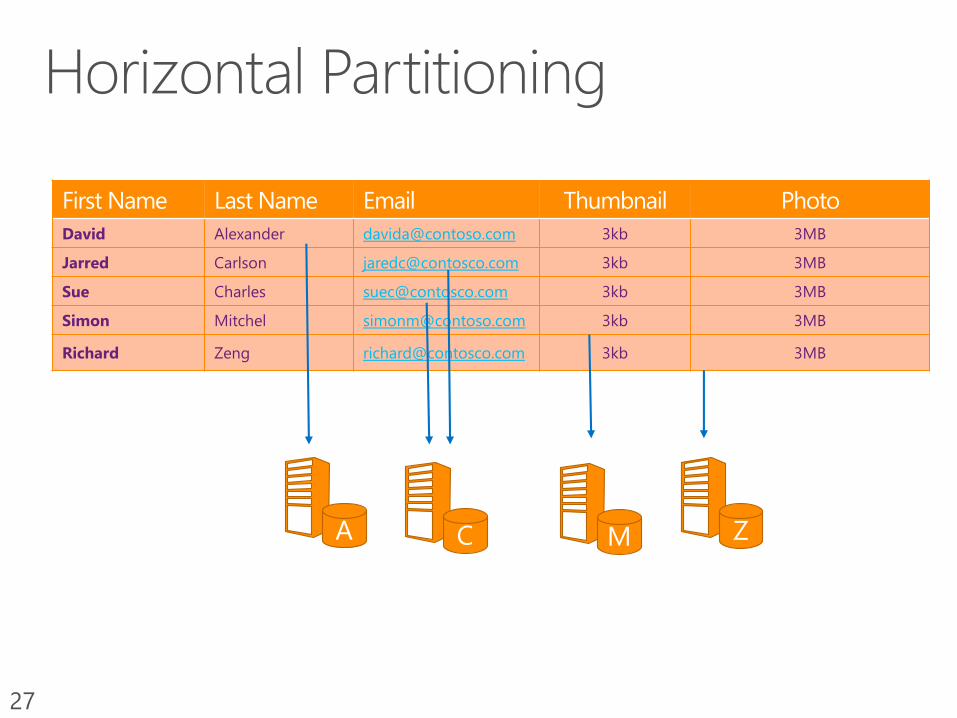
28
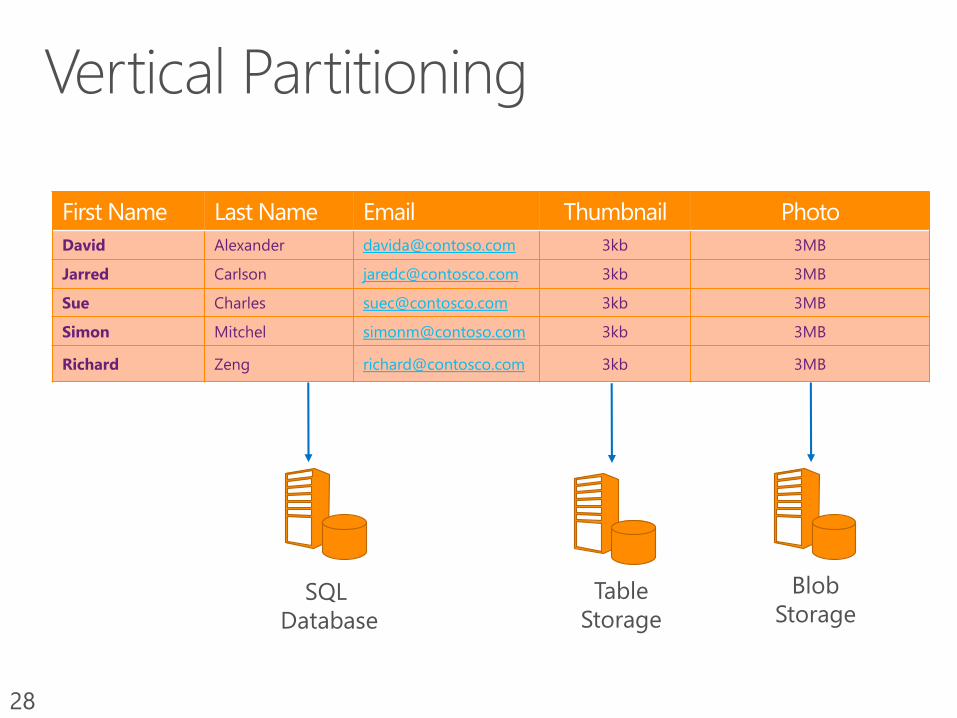
SQL
Database
Table
Storage
Blob
Storage
29
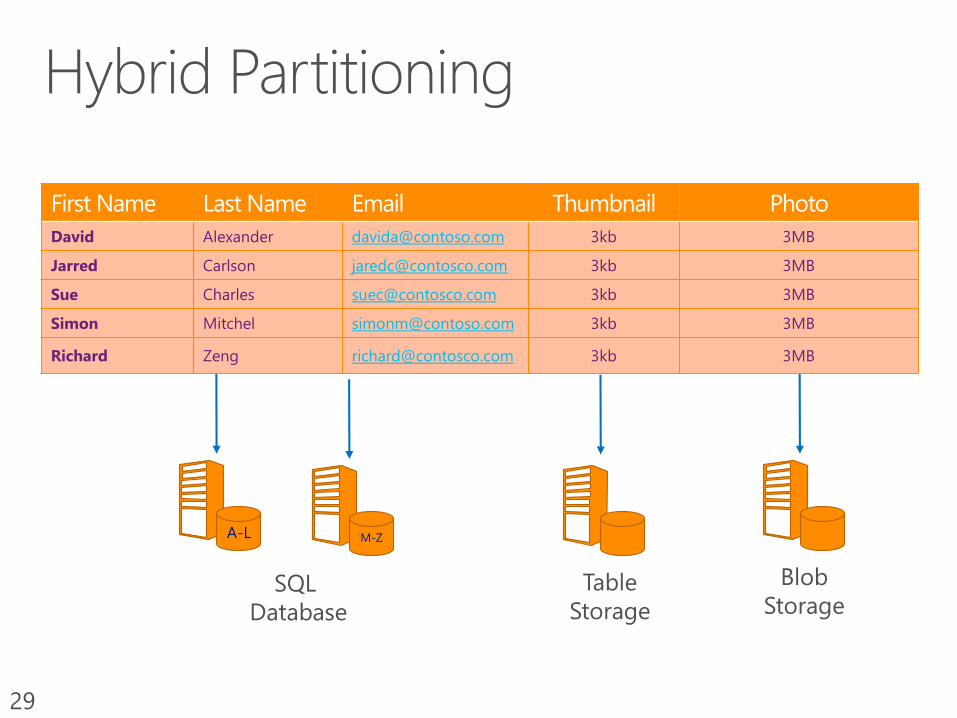
SQL
Database
Table
Storage
Blob
Storage
30
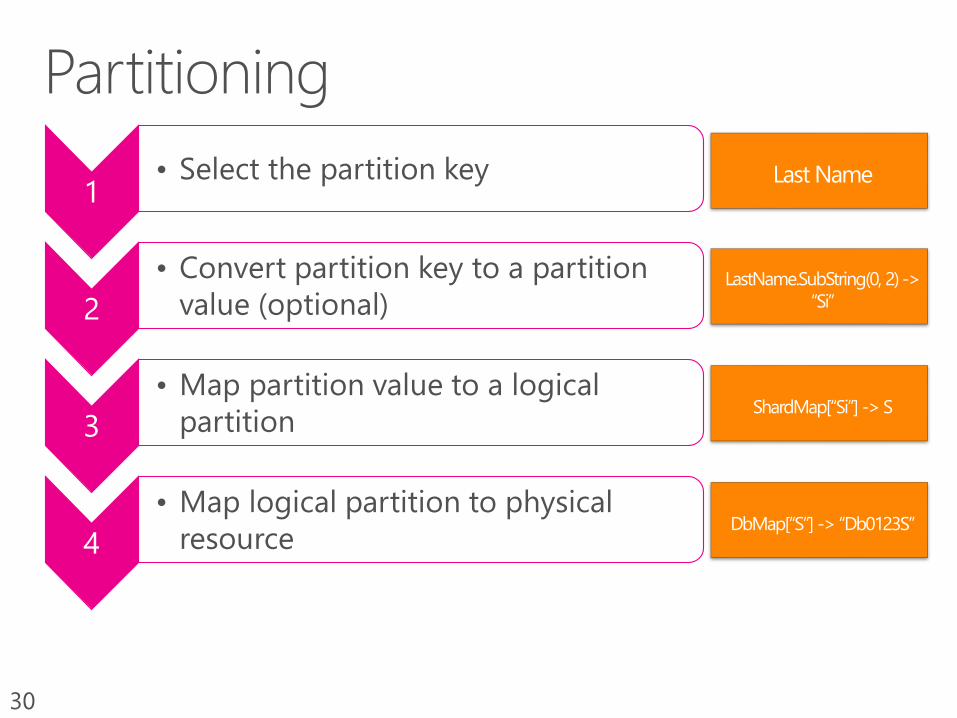
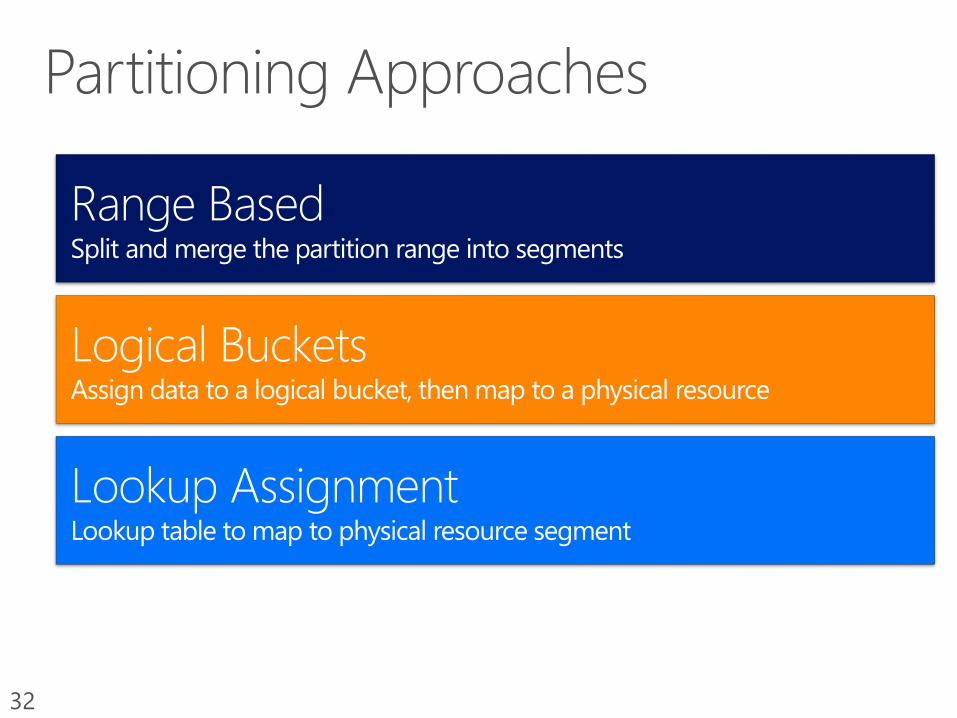
1• Select the partition key
2
• Convert partition key to a partition
value (optional)
3
• Map partition value to a logical
partition
4
• Map logical partition to physical
resource
31
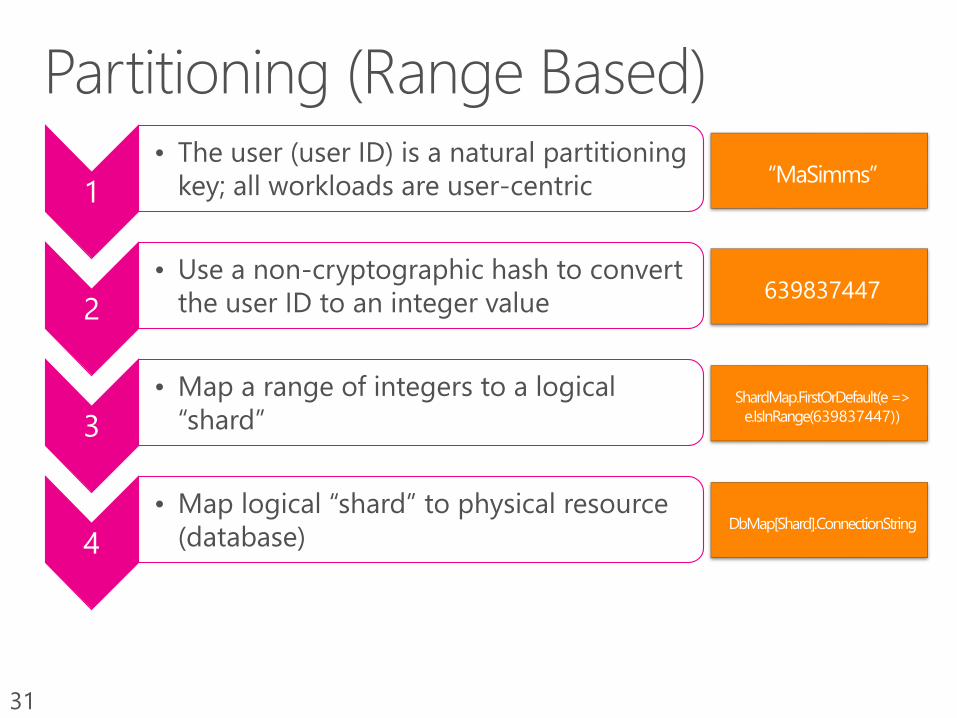
1
• The user (user ID) is a natural partitioning
key; all workloads are user-centric
2
• Use a non-cryptographic hash to convert
the user ID to an integer value
3
• Map a range of integers to a logical
“shard”
4
• Map logical “shard” to physical resource
(database)
639837447
639837447))
32
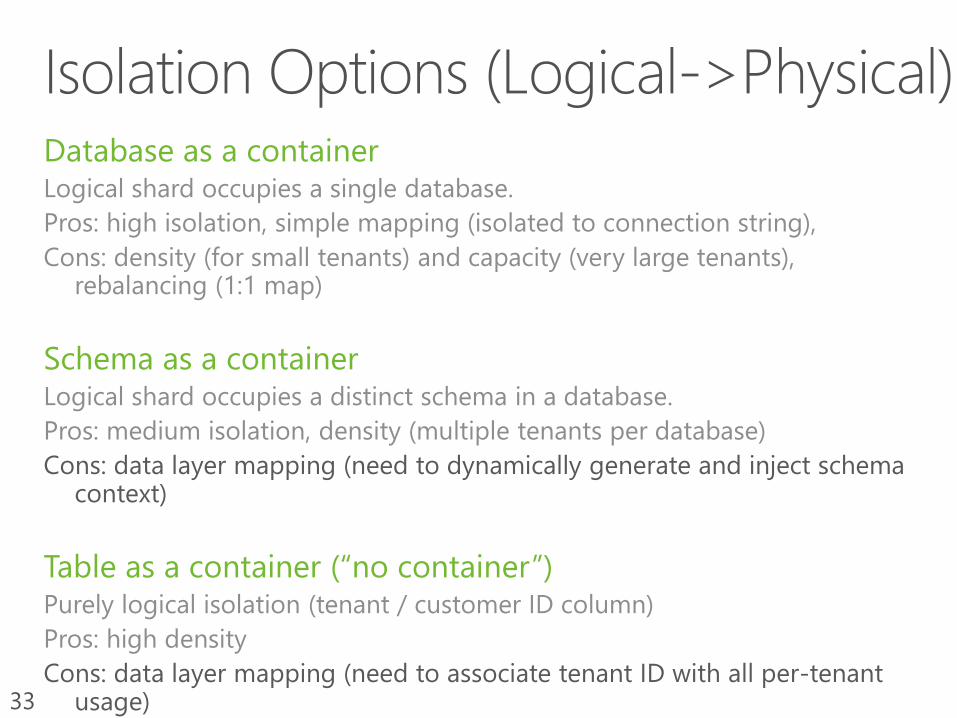
Database as a containerLogical shard occupies a single database.
Pros: high isolation, simple mapping (isolated to connection string),
Cons: density (for small tenants) and capacity (very large tenants), rebalancing (1:1 map)
Schema as a containerLogical shard occupies a distinct schema in a database.
Pros: medium isolation, density (multiple tenants per database)
Cons: data layer mapping (need to dynamically generate and inject schema context)
Table as a container (“no container”)Purely logical isolation (tenant / customer ID column)
Pros: high density
Cons: data layer mapping (need to associate tenant ID with all per-tenant usage)33
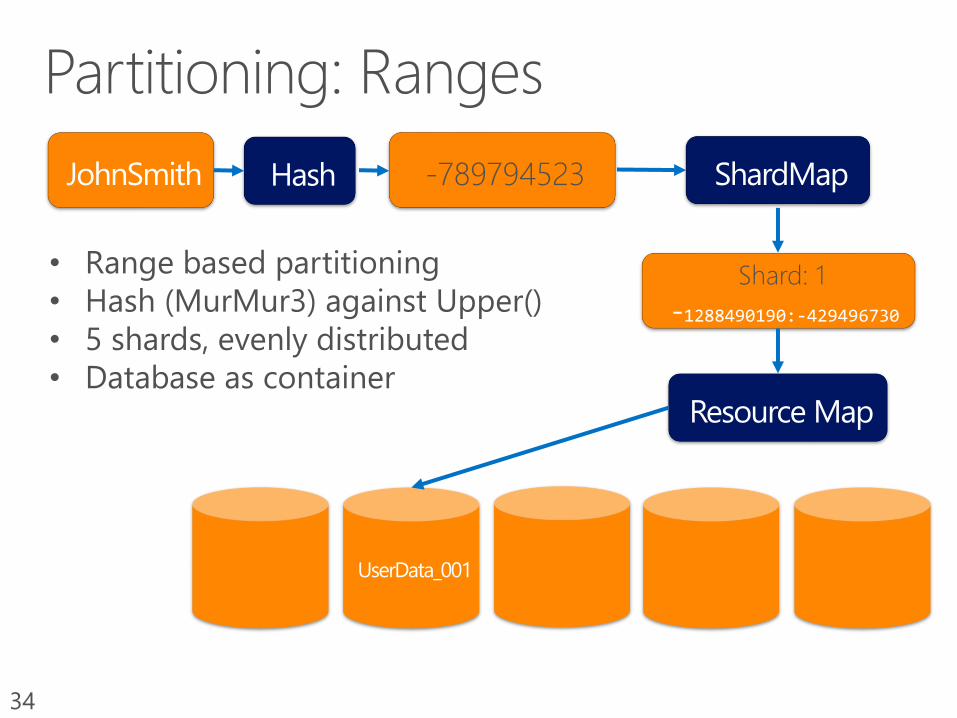
34
-789794523
Shard: 1
-1288490190:-429496730
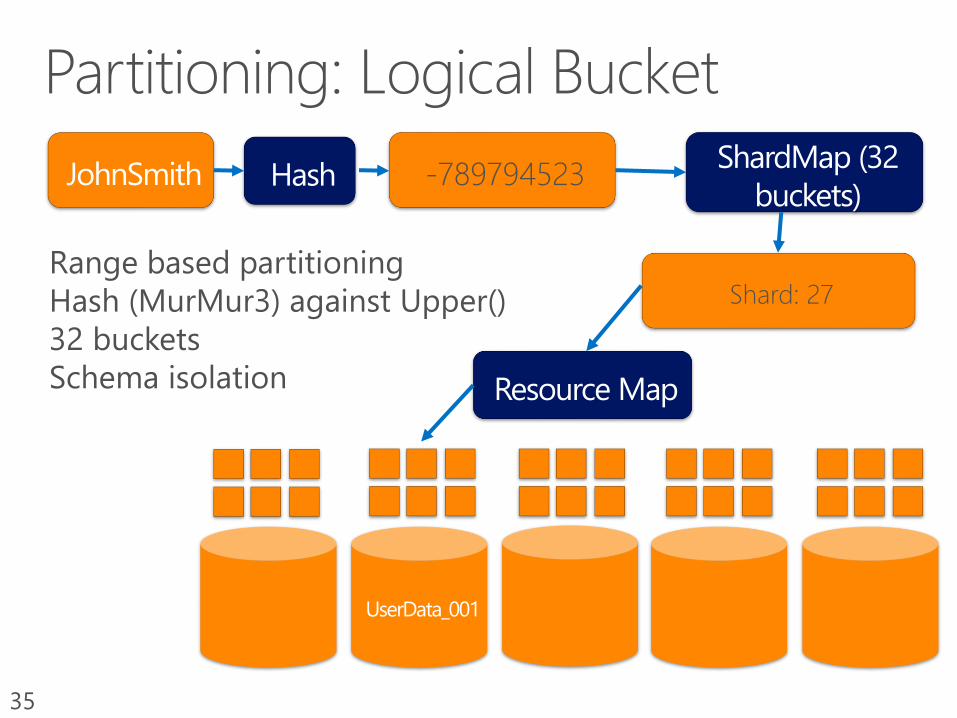
35
-789794523
Shard: 27
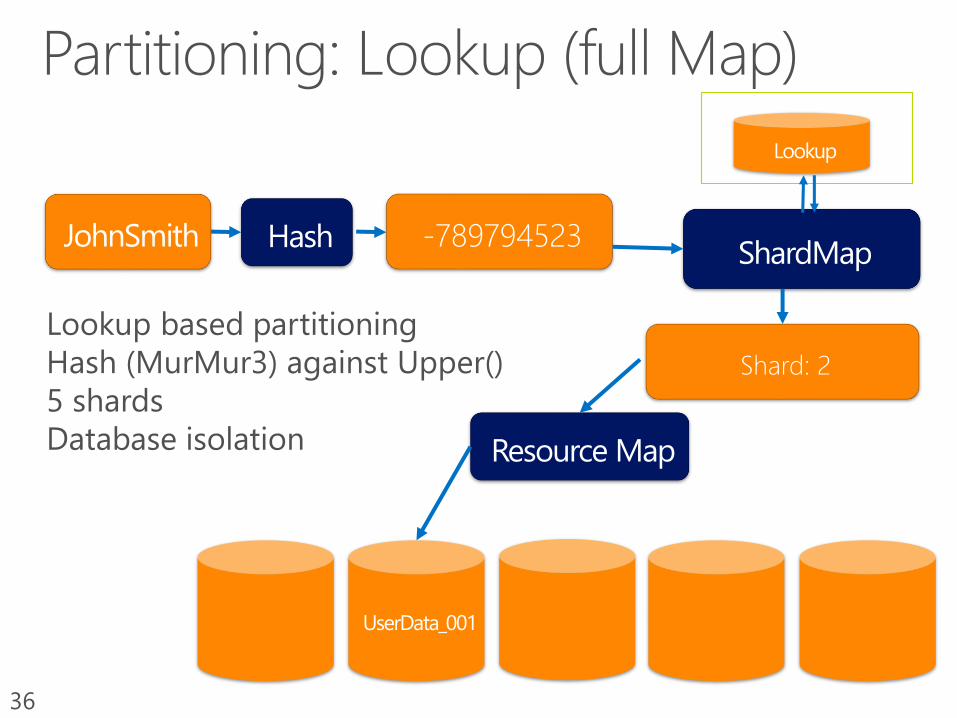
36
-789794523
Shard: 2
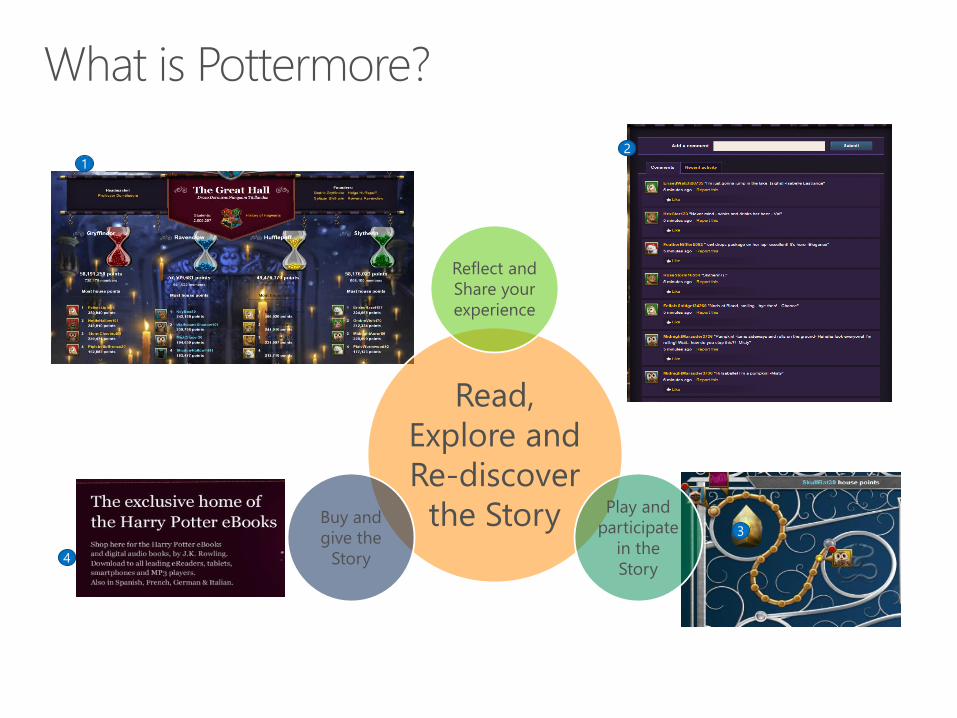
Read,
Explore and
Re-discover
the Story
Reflect and
Share your
experience
Play and
participate
in the
Story
Buy and
give the
Story
12
3
4
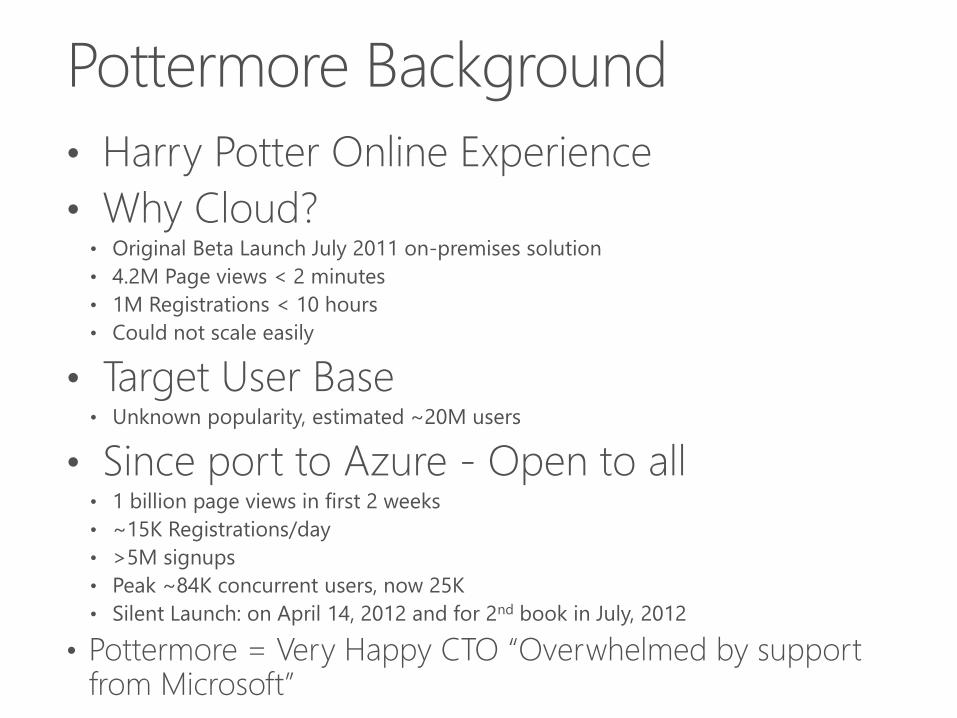
• Harry Potter Online Experience
• Why Cloud?• Original Beta Launch July 2011 on-premises solution
• 4.2M Page views < 2 minutes
• 1M Registrations < 10 hours
• Could not scale easily
• Target User Base• Unknown popularity, estimated ~20M users
• Since port to Azure - Open to all• 1 billion page views in first 2 weeks
• ~15K Registrations/day
• >5M signups
• Peak ~84K concurrent users, now 25K
• Silent Launch: on April 14, 2012 and for 2nd book in July, 2012
• Pottermore = Very Happy CTO “Overwhelmed by support from Microsoft”
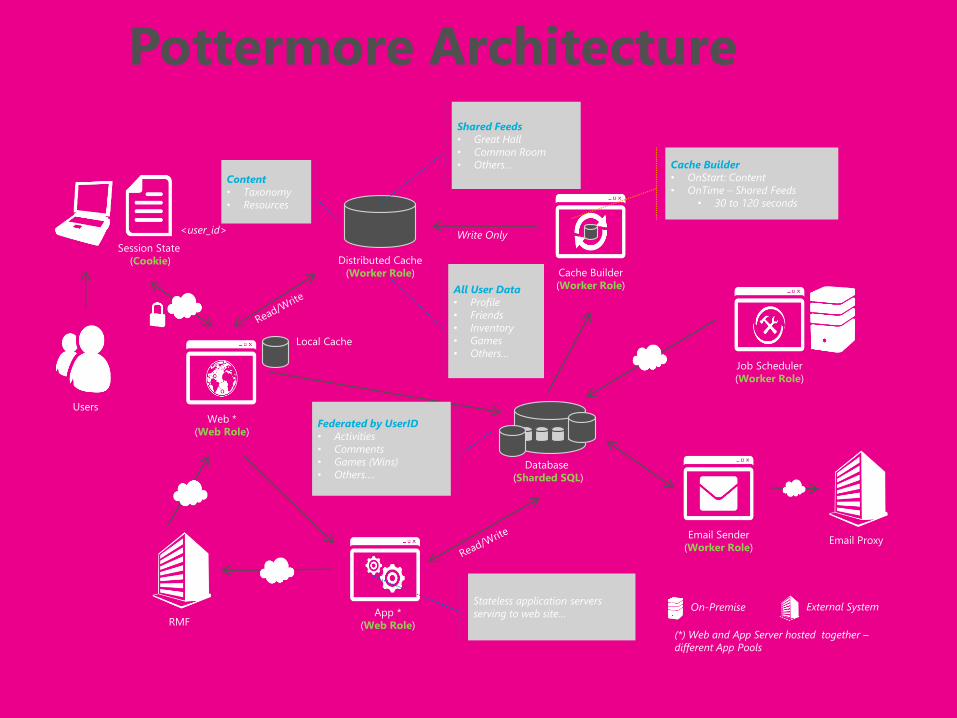
Web *
(Web Role)
App *
(Web Role)
Distributed Cache
(Worker Role) Cache Builder
(Worker Role)
Users
Federated by UserID
• Activities
• Comments
• Games (Wins)
• Others….
Shared Feeds
• Great Hall
• Common Room
• Others… Cache Builder
• OnStart: Content
• OnTime – Shared Feeds
• 30 to 120 seconds
Stateless application servers
serving to web site…
Email Sender
(Worker Role)
Job Scheduler
(Worker Role)
Email Proxy
RMF
Database
(Sharded SQL)
(*) Web and App Server hosted together –
different App Pools
All User Data
• Profile
• Friends
• Inventory
• Games
• Others…Local Cache
External SystemOn-Premise
Write Only
Content
• Taxonomy
• Resources
<user_id>
Session State
(Cookie)
Pottermore Architecture


![[Sprecher/Autor] [Titel] [Organisation][Kontaktinfos] Windows Azure Windows Azure SQL Databases.](https://static.fdocuments.us/doc/165x107/55204d8149795902118d3e71/sprecherautor-titel-organisationkontaktinfos-windows-azure-windows-azure-sql-databases.jpg)