How to quantify increasing exports induced by ... · How to quantify increasing exports induced by...
21
DIME International Conference “Innovation, sustainability and policy”, 11-13 September 2008, GREThA, University Montesquieu Bordeaux IV How to quantify increasing exports induced by sustainability policies: a system dynamics modelling approach for the case of wind energy technologies Rainer Walz, Nicki Helfrich and Alexander Enzmann, Fraunhofer Institute for System and Innovation Research, Breslauer Str. 48, 76139 Karlsruhe, Germany. E-mail: [email protected] Date: August 15 th 2008 Abstract The macroeconomic analysis of strategies to increase renewable energies requires that the effect of these strategies on the exports can be quantified. This paper de- scribes a first approach how to model the lead-market-based-export potential based on the heuristic of a system of innovation approach. For technology intensive goods, for- eign trade successes are also determined by quality competitiveness. Thus, interna- tional trade performance depends on technological capabilities in these sectors, vari- ous market factors which influence the chances of a country developing a lead-market position, an innovation-friendly regulation and the existence of internationally competi- tive complementary industry clusters. Various feedbacks mechanisms between these factors have to be taken into account, also accounting for knowledge spillover effects from the export success which leads to an erosion of a lead-market position over time. A system dynamics framework is used for a first implementation of the model for wind energy technologies from Germany. The empirical results should not be interpreted as forecasts for future export shares for Germany. Nevertheless, they show the expected dynamics of the system and underline the importance of the various feedback loops. Keywords: Renewable energy technologies, exports, lead markets, system dynamics
Transcript of How to quantify increasing exports induced by ... · How to quantify increasing exports induced by...

DIME International Conference “Innovation, sustainability and policy”, 11-13 September 2008, GREThA, University Montesquieu Bordeaux IV
How to quantify increasing exports induced by sustainability policies: a system dynamics modelling approach for the case
of wind energy technologies
Rainer Walz, Nicki Helfrich and Alexander Enzmann, Fraunhofer Institute for System and Innovation Research, Breslauer Str. 48, 76139 Karlsruhe, Germany. E-mail: [email protected]
Date: August 15th 2008
Abstract
The macroeconomic analysis of strategies to increase renewable energies requires that the effect of these strategies on the exports can be quantified. This paper de-scribes a first approach how to model the lead-market-based-export potential based on the heuristic of a system of innovation approach. For technology intensive goods, for-eign trade successes are also determined by quality competitiveness. Thus, interna-tional trade performance depends on technological capabilities in these sectors, vari-ous market factors which influence the chances of a country developing a lead-market position, an innovation-friendly regulation and the existence of internationally competi-tive complementary industry clusters. Various feedbacks mechanisms between these factors have to be taken into account, also accounting for knowledge spillover effects from the export success which leads to an erosion of a lead-market position over time. A system dynamics framework is used for a first implementation of the model for wind energy technologies from Germany. The empirical results should not be interpreted as forecasts for future export shares for Germany. Nevertheless, they show the expected dynamics of the system and underline the importance of the various feedback loops.
Keywords: Renewable energy technologies, exports, lead markets, system dynamics

1
1
1 Introduction
The idea of developing lead markets is very prominent in the political justifications of technology and innovation policies. This holds especially for renewable energy tech-nologies which are more costly than alternative technologies to generate electricity. It is argued that for renewable energy technologies, high international market shares de-pend on the innovation ability and the achieved learning effects of a national economy and its early market presence. If there is a national strategy to increase the share of renewable energy, the country tends to specialise early in the supply of the necessary technologies. If there is a subsequent expansion in the international demand for these technologies, these countries are then in a good position to dominate international competition due to their early specialisation in this field. Using the language of sectoral or technological innovation systems, this translates into the rationale that policies which improve the functioning of the system are also contributing to improving the chances for success on international markets.
Macroeconomic scenario analyses indeed show that additional exports are one key for positive employment effects of national policies increasing the use of renewable energy (Walz 2006). However, improving the reliability of these results requires that the effect of these policies on the exports can be quantified. So far the macroeconomic analysis uses only ad hoc assumptions on the export potential which are used as exogenous data input in the models. The objective of this paper is to come up with a first approach how to model the lead market based export potential empirically based on the heuristic of a system of innovation approach.
This paper will present the results of a first approach to develop such as model. The objective is not to come up with a reliable forecast, but rather to explore the methodo-logical and data problems in building such a model. In the first part of the paper, the factors which influence the establishment of a lead market are presented. In the sec-ond part of the paper, the concept for a pragmatic approach for modelling a lead mar-ket based export effect is presented, based on a system dynamics framework. The third part of the paper describes the operationalisation of such a model for the case of exports of wind energy technologies from Germany. The paper concludes with a critical reflection of the modelling exercise and some suggestions for future work.
2 Lead Market Paradigm
Besides price competitiveness, which is influenced by cost effects, foreign trade suc-cesses are also determined by quality competitiveness. Above all for technology-intensive goods, which include renewable energy technologies, high market shares

2
2
depend on the innovation ability and the achieved learning effects of a national econ-omy and its early market presence. If there is a forced national strategy to increase the share of renewable energy, these countries tend to specialise early in the supply of the necessary technologies. If there is a subsequent expansion in the international demand for these technologies, these countries are then in a good position to dominate interna-tional competition due to their early specialisation in this field (see Blümle 1994; Por-ter/van der Linde 1995; Taistra 2001).
Being able to realise these kinds of first-mover advantages requires other countries to follow suit. Given the growing demand for energy on the one hand and the pressure to push for non-fossil fuels on the other, there is a high probability of this scenario taking place. For first-mover advantages to be realised, however, the domestic suppliers of climate protection goods have to be competitive internationally so that they - and not foreign suppliers - meet the demand induced by the domestic pioneering role and so that they can actually profit from the demand in countries then following suit (Ekins/Speck 1998; Taistra 2001). Taking the globalisation of markets into account, this requires establishing competence clusters which are difficult to transfer to other coun-tries with lower production costs. These competence clusters must consist of high technological capabilities linked to a demand which is open to new innovations and horizontally and vertically integrated production structures (Meyer-Krahmer 2004).
The following factors have to be taken into account when assessing the potential of countries to become a lead market in a specific technology:
• Lead market capability
• Demand conditions in the country,
• Innovation friendly regulation in the country,
• Technological capability of the country,
• Competitiveness of related industry clusters in the country
It is necessary to look at the lead market capability of a technology first, because it is not possible for every good or technology to reach a lead-market position. One prereq-uisite is that competition is driven not by cost differentials alone, but also by quality aspects. This prerequisite is fulfilled especially for knowledge-intensive goods. In gen-eral, the technology intensity of renewable technologies can be judged as being above average or even (e.g. photovoltaics) high tech (see Grupp 1998). Other important fac-tors are intensive user-producer relationships and a high level of implicit knowledge. These factors are not easily accessible, difficult to transfer to other countries and bene-fit from local clustering (see Kline/Rosenberg 1986; Lundvall/Johnson 1994; Asheim/Gertler 2005). Two other important characteristics are high innovation dynam-

3
3
ics and high potential learning effects. They are the key to a country forging ahead technologically also to realize solutions which are cost competitive. An analysis of vari-ous technology forecasts, e.g. the latest Japanese Delphi study, reveals that above average learning effects are expected for renewable energy technologies. Furthermore, the patent dynamics for renewable energy also shows an impressive dynamics. This holds especially for wind energy, which has substantially higher patent growth rates than the average increase in patents (Figure 1).
Figure 1: Innovation dynamics for renewable energy technologies
0
50
100
150
200
250
1991 1992 1993 1994 1995 1996 1997 1998 1999 2000 2001 2002 2003 2004
year
200
0 =
100
all patent renewable energy Wind PVFraunhofer ISI
Source: calculations of Fraunhofer ISI
The importance of the demand side can be traced to the work of Linder (1961), von Hippel (1988), Porter (1990) or Dosi (1990). There are various market factors which influence the chances of a country developing a lead-market position. Beise 2004 and Beise/Cleff 2004 classify them in 5 categories, distinguishing demand and price advan-tage, market structure, and transfer and export advantage.
In general, a growing demand oriented towards innovations and readily supporting new technological solutions, benefits a country in developing a lead-market position. An-other factor is a market structure which facilitates competition. The export and transfer advantages are difficult to assess with indicators. However, it can be assumed that already existing export success also backs these two factors. Perhaps the export suc-cess in complementary technologies will provide this as well. The price advantage of

4
4
countries is also very important. Clearly it benefits countries which increase their de-mand fastest and thus are most able to realize economies of scale and learning. If one looks at the diffusion rate of the various forms of renewable energy in different coun-tries, it can be seen that European countries have been forging ahead recently. Fur-thermore, the political goals for the EU will bolster this advantage in future. Neverthe-less, there are also other countries which have recently increased their diffusion rates. If large markets, such as the U.S., China, India or Brazil, increase their use of renew-ables, this will cause a huge rise in absolute numbers which might strengthen their price advantage.
A lead market situation must also be supported by innovation-friendly regulation (Blind et al. 2004). This is especially true for sustainability innovations in infrastructure fields such as energy, water or transportation. In these fields, the innovation friendliness of the general regulatory regime, e.g. with regard to IPR or the supply of venture capital, must be accompanied by innovation-friendly sectoral and environmental regulation resulting in a triple regulatory challenge (Walz 2007). Other paradigms contribute to this approach, e.g. transaction and evolutionary economics, which emphasise that the decisions, e.g. with regard to financing renewable energy technologies, follow a differ-ent paradigm (e.g. other valuation of financial risks, bounded rationality with regard to alternative suppliers of electricity). Furthermore, the policy analysis approach of politi-cal scientists emphasises the long-term character of political goals for renewable en-ergy within the EU, or the comparatively important role of green policies for voters, which are key supportive context factors favouring innovations. There is a lot of addi-tional research necessary to develop a clear methodology on how to operationalise the innovation friendliness of regulation. One promising approach is a heterodox one which uses the sectoral systems of innovation approach as guiding heuristics and combines this with the outcome of regulatory and environmental economics and the policy analy-sis approach of political science. The first empirical case studies for renewable ener-gies show that a feed-in-tariff system might serve the functions of an innovation system well, especially if it supports a variety of technological solutions (Walz et al. 2008c).
Since the Leontief Paradox and subsequent theories such as the Technology Gap Theory (Posner 1961) or the Product Cycle Theory (Vernon 1966), it has become in-creasingly accepted that international trade performance depends on technological capabilities (see, e.g. the overview in Fagerberg 1995a and Wakelin 1997). This has been supported by recent empirical research (e.g. Grupp/Münt 1998; Fager-berg/Godinho 2005; Blind/Frietsch 2005) underlining the importance of technological capabilities for trade patterns and success. Thus, the ability of a country to develop a first-mover advantage also depends on its comparative technological capability. If a country has performed better in the past with regard to international trade than others,
5
5
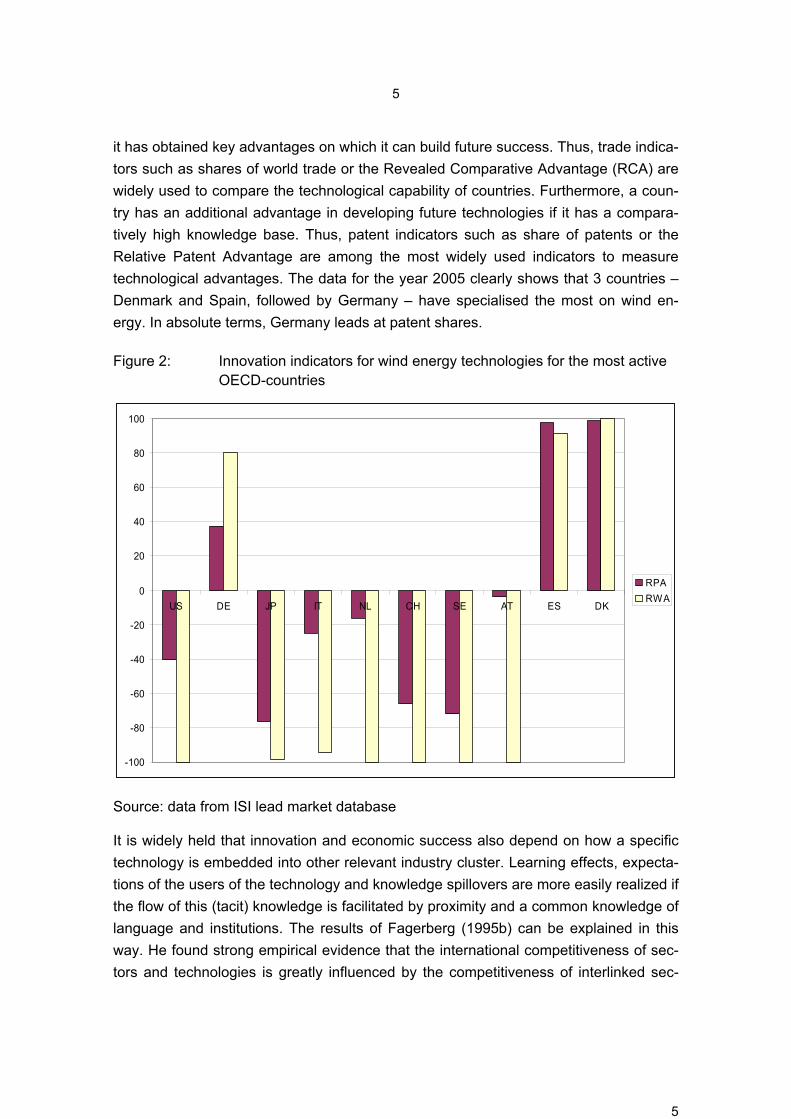
it has obtained key advantages on which it can build future success. Thus, trade indica-tors such as shares of world trade or the Revealed Comparative Advantage (RCA) are widely used to compare the technological capability of countries. Furthermore, a coun-try has an additional advantage in developing future technologies if it has a compara-tively high knowledge base. Thus, patent indicators such as share of patents or the Relative Patent Advantage are among the most widely used indicators to measure technological advantages. The data for the year 2005 clearly shows that 3 countries – Denmark and Spain, followed by Germany – have specialised the most on wind en-ergy. In absolute terms, Germany leads at patent shares.
Figure 2: Innovation indicators for wind energy technologies for the most active OECD-countries
-100
-80
-60
-40
-20
0
20
40
60
80
100
US DE JP IT NL CH SE AT ES DK
RPARWA
Source: data from ISI lead market database
It is widely held that innovation and economic success also depend on how a specific technology is embedded into other relevant industry cluster. Learning effects, expecta-tions of the users of the technology and knowledge spillovers are more easily realized if the flow of this (tacit) knowledge is facilitated by proximity and a common knowledge of language and institutions. The results of Fagerberg (1995b) can be explained in this way. He found strong empirical evidence that the international competitiveness of sec-tors and technologies is greatly influenced by the competitiveness of interlinked sec-

6
6
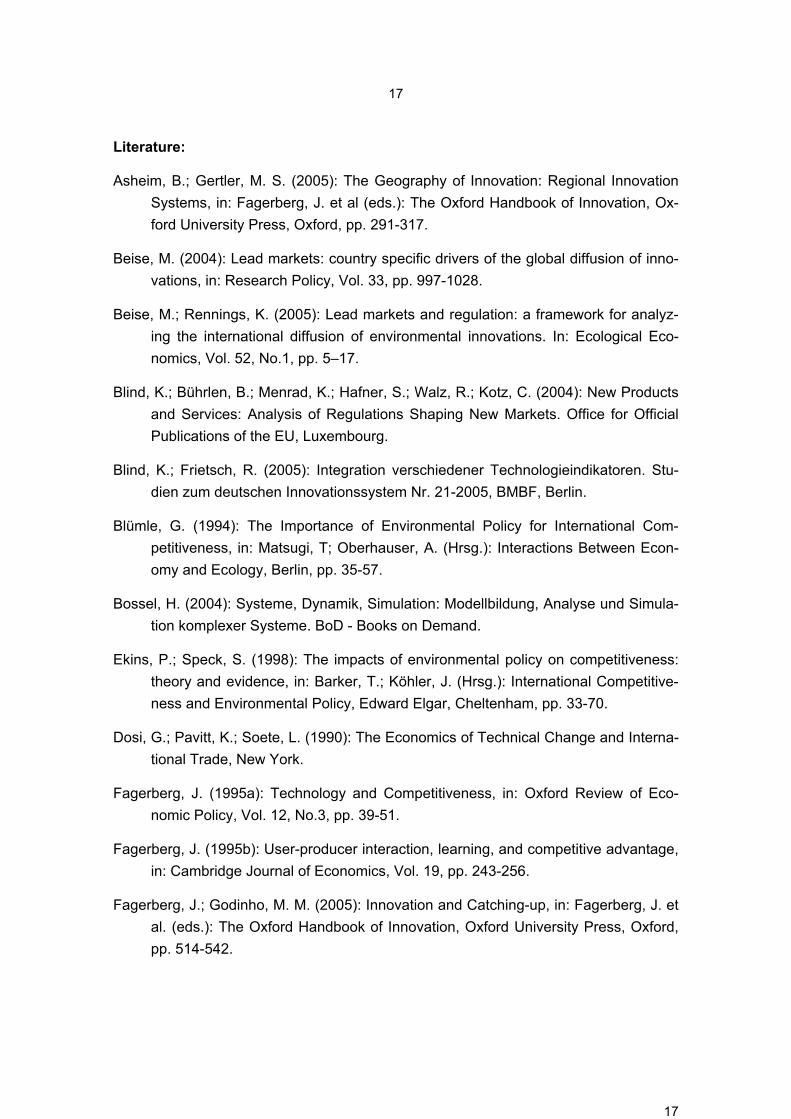
tors. By and large, renewable technologies have very close links to electronics and machinery. Thus, it can be argued that countries with strong production clusters in these two fields have a particularly good starting point for developing a first-mover ad-vantage for renewable energy technologies, especially because success in these clus-ters also contributes to an export and transfer advantage. For wind energy, especially the machinery sector is important. Furthermore, the success in a specific high tech industry also depends on the general attractiveness of the country in this field, e.g. availability of highly trained labour or venture capital. If there is such a supporting envi-ronment in a country, the obstacles for relocation of production facilities to another country are higher, and it becomes more likely that a lead-market position can be sus-tained.
Figure 3: Revealed Comparative Advantage (RCA) for machinery sector in 2005
RCA machinery
-40
-20
0
20
40
60
80
US DE JP IT NL CH SE AT ES DK
RCA
Source: data from ISI lead market database
There are also factors which work towards the erosion of a lead-market position. One
such approach is also implied by the product cycle theory. There it is argued that the
characteristics of a technology change over time, which makes the technology more
easily reproducible and hence more subject to price competition. Thus, in the context of
the product cycle theory, the erosion of a lead-market position is broad forward by a

7
7
change in the lead market ability of the technology. Another relevant mechanism is the
existence of knowledge spillovers from the export and installations of technologies in
the importing countries. The spillover of knowledge has been acknowledged as an im-
portant aspect (Griliches 1991). The knowledge embodied in patents, which are pub-
lished, becomes codified and accessible. The export of technologies means that the
knowledge embodied in the physical technology also becomes partially accessible to
the users. Furthermore, spatial proximity facilitates also user-producer communication
in the importing countries. Depending on the absorptive capacities and the emergence
of competing technology providers in these countries, the erosion of lead-market posi-
tions is facilitated.
3 Lead Market Factors in a System Dynamics Framework
It is characteristic for the factors introduced above that they influence each other. This is not surprising, given the interpretation that a lead-market position depends on a suc-cessful system of innovation. However, modelling such a system poses considerable challenges:
• the modelling approach must be able to account for the various feedbacks mecha-nisms,
• it must be able to model the development of the various factors over time, and
• it must be flexible and must allow to draw on different levels of data (e.g. quantitative established relationships, but also qualitative information).
System dynamics is a modelling approach which fulfils these requirements. It is a methodology designed to improve the understanding of complex systems over time. Its core elements are stocks and flows, with the flows determining the levels of the stocks. For example, the world population (=stock) in the year 2000 is increased by new born babies and decreased by all deceases (=flows), resulting in the population in 2001.
Essential to this methodology is the use of time delays and feedback loops (with feed-back loops being a consequence of time delays). This means that a level variable can directly or indirectly influence itself. For example the number of new born children as well as that of deceases depends on the population, thereby the population determines its own development over time, which would lead to exponential growth in the case of constant birth and mortality rates (for the case of birth > mortality rate). But if the grow-ing population would lead to a decreasing deer population, which in turn might reduce the birth rate due to a lack of food, this again could reduce the population, leading to the recovering of the deer stock.

8
8
Following the introduction to system dynamics given by Bossel (2004), a system can be defined as a set of elements and a set of relations between these elements. A sys-tem is called dynamic if it changes it state in a period defined as relevant by the ob-server. Furthermore, a model is a simplifying reproduction of reality, which makes the standard to work with for economists, since experiments in the real system are not possible naturally (and ethically).
The behaviour of a system is determined by its structure as well as by external influ-ences. External influences, by definition, are not affected by the system. These influ-ences are called exogenous. Internal behaviour, resulting from the structure of the sys-tem, is called endogenous. In the previous example, the amount of yearly newborn children would be endogenous, while the birth rate (=children per woman) would be exogenous at first. But after taking the deer population into account, the birth rate would be turned into an endogenous variable, determined by the human population and the supporting deer population.
The system dynamics methodology was initially developed by Forrester (1961). Nowa-days, it is widely applied in a large variety of fields according to the System Dynamics Society (http://www.systemdynamics.org/, 20. Aug. 2008). These include corporate planning and policy design, public management and policy, biological and medical mo-deling, energy and the environment, theory development in the natural and social sci-ences, dynamic decision-making as well as complex nonlinear dynamics.
System Dynamics is an appropriate methodology for explaining the shares of the world exports of renewable energy technologies mainly due to
• its capability to model behaviour over time and
• the possibility to include feedback loops.
The capability to model the behaviour over time is essential because there is a strong dependence of the export shares on the shares in previous years as can be shown in econometric analysis. Also, patent advantages affect the export success with some delay, just as spillovers do.
The possibility to include feedback loops offers the chance to directly and intuitively model postulated real phenomenon. The most important feedback loops between the identified lead market factors can be seen in Figure 4. This figure gives a qualitative overview on the assumed influences. The numbers besides the arrows are for identifi-cation only, without ranking them. The plus or minus signs indicate a positive or nega-tive effect of the influencing variable on the influenced variable:

9
9
(1) Advantage in national regulation -> National relative patent advantage (+)
(2) National relative patent advantage –> Export shares (+)
(3) Export shares –> National relative patent advantage (+)
(4) Relative advantage due to national market factors -> Export shares (+)
(5) Export shares -> Relative advantage due to national market factors(+)
(6) Obstacles to international relocation of production -> Export shares (+)
(7) Relative advantage due to national market factors -> National relative patent ad-vantage (+)
(8) Advantage in national regulation -> Relative advantage due to national market factors (+)
(9) Competitiveness of complementary sectors -> Obstacles to international reloca-tion of production (+)
(10) Competitiveness of complementary sectors -> National relative patent advantage (+)
(11) National relative patent advantage -> spillovers (+)
(12) spillovers -> National relative patent advantage (-)
(13) Export shares -> spillovers (+)
(14) Spillovers -> export shares (-)
(15) Patenting competitors -> National relative patent advantage (-)
(16) Market factors competitors -> Relative advantage due to national market factors (-)
(17) Attractiveness of international production location -> Obstacles to international relocation of production (-)
(18) Regulation competitors -> Advantage in national regulation (-)

10
Figu
re 4
: Con
cept
ual m
odel
of l
ead
mar
ket b
ased
fore
ign
trade
suc
cess
in s
yste
m d
ynam
ics
met
hodo
logy
Obs
tact
les
to in
tern
atio
nal
relo
catio
n of
pro
duct
ion
Adv
anta
ge n
atio
nal
regu
latio
n
Rel
ativ
e ad
vant
age
natio
nal m
arke
tfa
ctor
s
Nat
iona
l rel
ativ
epa
tent
adv
anta
geP
aten
ting
com
petit
ors
Reg
ulat
ion
com
petit
ors
Mar
ket f
acto
rsco
mpe
titor
s
Attra
ctiv
enes
s of
inte
rnat
iona
l pro
duct
ion
loca
tion
Com
petiv
enes
sco
mpl
emen
tary
sect
ors
Expo
rt sh
are
+(1
)
+(2
)
+(3
) +(4
)
+(5
)+
(6)
+(7
)
+(8
)
+(9
)
-(1
5)
-(1
6)-
(17)
-(1
8)
Com
petit
iven
ess
com
plem
enta
ry s
ecto
rs
+(1
0)
spill
over
s
+(1
3)
+(1
1)
-(1
2)
-(1
4)

11
4 Implementing the model and examples for empirical results for the case of exports of wind energy technologies
Wind energy technology exports have been dominated by Denmark for many years. Very recently, Germany – which has been the leading country in installed wind energy capacity - has been increased its export share substantially, and it is argued that future export success might be a benefit of the policies to support the diffusion of wind energy in Germany. Thus, the case of Germany was taken as a case study for the implemen-tation of a system dynamics lead market model.
Figure 5: World trade shares in wind turbines
WTS
0%
10%
20%
30%
40%
50%
60%
70%
80%
90%
100%
1991 1992 1993 1994 1995 1996 1997 1998 1999 2000 2001 2002 2003 2004 2005
USDEJPGBESDK
Source: data from ISI lead market database
A System Dynamics model essentially consists of a set of mathematical formulas, each using input data to produce a result. The lead market factors as described above have been quantified using a series of proxies for the indicators. Depending on data avail-ability, various adjustments had to be made. In addition, the functional form of the feedback loops had to be specifies in mathematical terms. In order to limit the neces-sary modelling work, the first prototype was limited to model the export shares of Ger-many in wind energy technologies only. However, the success on the world market depends on the relative advantage one country gains compared to the competing countries. Thus, the modelling has to account for the comparative advantage of a coun-try with regard to the lead market factors in the other countries. Therefore some of the

12
12
influences are described as relative, meaning that the relevant figure measures the situation of Germany compared to the rest of the world. For the rest of the world, the most important countries in this technology field were chosen, which is Denmark, Spain and the USA. This selection was also determined by data availability, furthermore these countries comprise about 85 % of the world supply capacity currently and have shown the highest demand in the past. In order to make the model not extremely com-plex from the beginning on, some of the influencing factors were modelled exoge-nously. This is the case for the innovations friendliness of the regulatory system, the competitiveness of the complementary sectors (machinery) and the lead market factors in the rest of the world.
The following model structure was used to perform the model runs (see also Annex):
• The demand advantage is based on spending for environment protection according to OECD statistics as well as on the general competitiveness of an economy as quantified by the World Economic Forum in its Global Competitiveness Reports.
• For the quantification of the export advantage the revealed comparative advantage (RCA) was used, showing the degree of specialisation in a technology field. The cost advantages were modelled according to the cumulative installed capacity and the cumulative R&D spending in the countries. The numerical relations could draw on the calculations of a two factor learning curve developed by Folz (2008).
• The regulation regime was quantified using R&D spending by the state as a proxy for the supply side and the diffusion of wind technology for the demand side. Addi-tionally, “innovation friendliness” was quantified based on the figures from the Global Competitiveness Reports concerning how difficult it is to get a bank credit for a rele-vant project as well as the general availability of risk capital. Also, figures are avail-able for innovation friendliness of the stateside demand. Additionally, a qualitative analysis of the innovation friendliness in the field of wind power technology was used, which had been developed by Walz et al. (2008c).
• Spillovers are modelled as a direct effect of the export shares and the patent advan-tage. The national relative patent advantage quantifies the specialisation of a coun-try in technology fields. The data for wind energy was taken from the ISI lead market database (see Walz et al. 2008a). Furthermore, the competitiveness of complemen-tary sector was quantified using the revealed comparative advantage (RCA) of the complete machinery sector.
All these factors were implemented in a system dynamics model, resulting in the model visualized in the Annex.
Since the exact mathematical relations between a set of variables is unknown, parame-ters are used in these formulas, which then have to be adjusted to best reproduce the

13
13
observed data. This process is called calibration. Therefore, a System Dynamics model is split into two different time periods:
• the calibration period and
• the forecast period.
The model presented here has been calibrated with data for Germany for the technol-ogy for generating electricity from wind. For the calibration period (1991-2004) the op-timal values for the parameters of the formulas for the calculation of the endogenous variables are searched. This is done by a heuristic approach, during which the en-dogenous variables are calculated with a large set of different values for the parame-ters. These results are compared to the exogenous time series for that variable, and those parameters producing the results best matching the exogenous data are chosen for the model.
Essential to all modelling exercises is the calculation of various scenarios. In these scenarios, the exogenous variables of the model must be specified. In order to test the sensitivity of the model, three scenarios were developed which should yield clearly dif-ferent results:
• Scenario A: Reference scenario: the diffusion of wind energy follows according to the OPTRES scenario “improved policy”, which has been developed for the EU. Fur-thermore, constant R&D spending as in 2004 and a decreasing comparative advan-tage of German demand factors were assumed, reflecting that other countries will follow the German lead in installing wind power capacity.
• Scenario B: Optimistic scenario with maintaining the lead-market position of Ger-many: This scenario assumes a 20% higher diffusion relative to the reference sce-nario, reflecting e.g. a higher growth in offshore wind energy. R&D spending is as-sumed to grow yearly by 2.5%; the other exogenous comparative advantages of na-tional market factors are assumed to be constant.
• Scenario C: Pessimistic scenario with reduced support for wind power in Germany: This scenario assumes 50% less diffusion relative to ref. scenario. R&D is cut down by half until 2020; the decrease in the comparative advantage of German demand factors will be stronger than in the reference scenario.
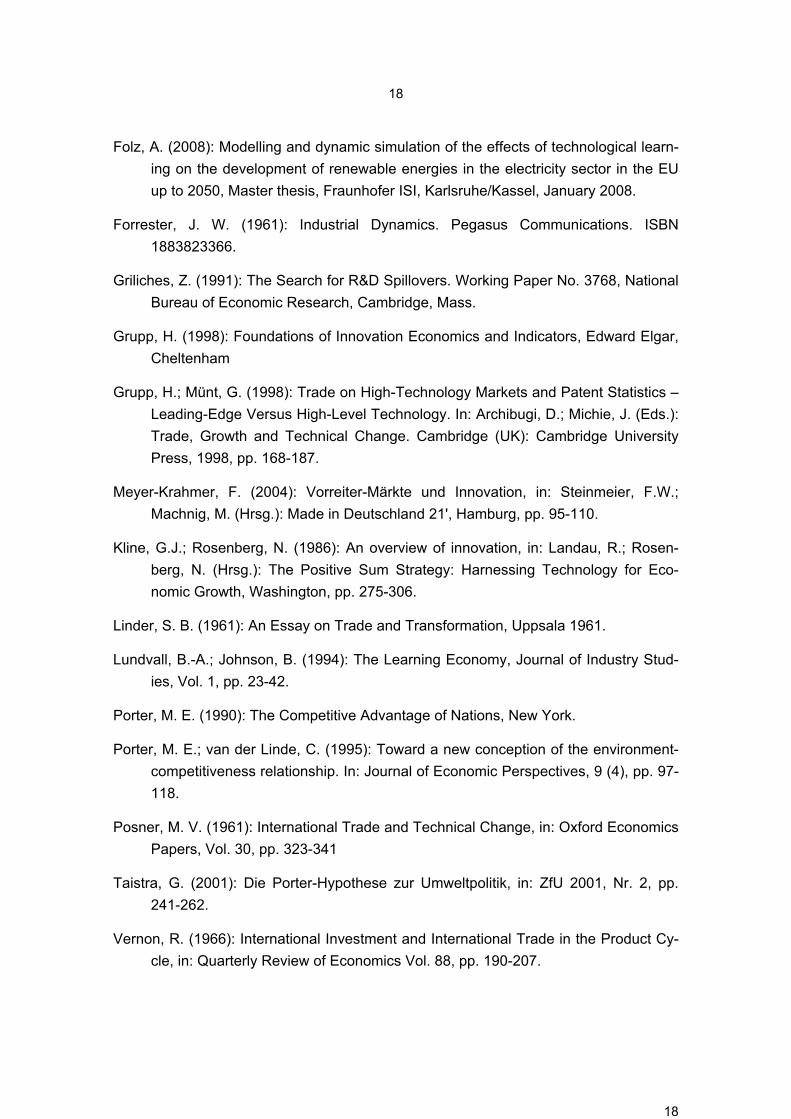
The projected world trade shares for the three scenarios are shown in Figure 5. In all scenarios the world trade share of Germany decreases. This can be mainly explained with the market entry of new players from emerging economies, which are in a process of building up their technological competences in the field of energy and sustainability technologies (see Walz et al. 2008b). This result is also in line with the expectations of market experts, which forecast a decrease in the German export share of the future

14
14
(ZSW et al 2006). Furthermore, the results show significant differences between the different scenarios with regard to the size of the German export share:
• 11% in the reference scenario,
• 15% in the optimistic scenario, and
• 9% in the pessimistic scenario.
The differences in the results between the scenarios match our expectations and sup-port the postulated hypothesis on what drivers influence the world trade shares.
However, these first results should not be interpreted as a forecast, but rather a first modelling exercise. Some influences and feedback loops appear not to be as strong as expected, e.g. between the RPA and the WTS. Together with some additional sensitiv-ity analyses carried out (but not presented in this paper), we derivate the following main problems of the model, which have to be reflected and might lead to a restructur-ing of the model:
• The influence of the spillover appears to be too strong, heavily driving the erosion of world trade shares. This works towards an overestimation of the erosion of the lead-market position and towards an underestimation of the markets shares.
• The time period of the calibration period was rather short, and might have been characterized by a lot of additional noise in the data influencing the calibration of the parameters.
The first and the second problem are interconnected. The spillover variable is the only one among the variables modelled which erodes a lead-market position established. Thus, if during the calibration period the lead market factors for a country remain posi-tive (in relative terms), but the export performance does not follow this, this leads to a high importance calculated for the spillover effects. However, there is the problem that this divergence might be attributed to other factors not included in the modelling. This has been clearly the case for Germany. During the calibration period, Germany has seen a tremendous increase in installations and a strong patent advantage (both posi-tive lead market factors), but a low export share. These can be attributed to an enor-mous growth in the home demand. This growth was so strong that it outpaced any in-crease in the German capacity to supply wind turbines. Thus German suppliers con-centrated on the home market. Indeed the growth in demand was so strong that it led to a surge in imports, mainly from Denmark. Only after the calibration period, the ca-pacity shortage has been removed resulting in a dramatic shift of German suppliers to the world market. However, in the context of the calibration period the special capacity

15
15
shortage effect is attributed to a spillover effect. Thus, the importance of the spillover effect seems to be overvalued.
Figure 6: Overview of German world trade shares forecasts for wind energy technologies in the three scenarios
Scenario A: Reference
Scenario B: Optimistic
Scenario C: Pessimistic
5 Summary and Outlook
This paper started from a discussion of various factors relevant for a lead-market posi-tion. In order to operationalise this approach, it is necessary to account for numerous feedback loops between these factors. At the same time it must be acknowledged that the data availability differs for the different factors. Thus, a pragmatic modelling frame-work is necessary which can account for the feedback loops and is able to be used and tailored to the data availability. System dynamics can serve as a useful modelling framework. The case of wind energy exports from Germany showed that it is possible to implement the factors establishing a lead-market position in such a framework and to establish an empirical model. The empirical results should not be interpreted as fore-casts for future export shares for Germany. Nevertheless, they show the expected dy-namics of the system and underline the importance of the various feedback loops.

16
16
However, this model still can also be judged to be a first methodological prototype only. A critical methodological reflection shows various shortcomings, which have to be overcome in the future. The following steps will be performed in the future to improve the model:
• Using more time lags beside the already implemented 3 year lag of the influence of the RPA on the WTS.
• Extending the calibration period will produce better results. As more data is col-lected, this might become feasible.
• The problem of capacity shortages of technology supplies, which limit the availability to establish and exploit a possible lead-market position, has to be addressed, per-haps by including additional variables in the model.
• Improvement of the functional relations between model variables. Until now, the functions used are mostly linear. Probably, this is not the best way to reflect reality.
• This first model concentrated on Germany; a more reliable model would have to distinguish the other relevant countries separately
• More feedback loops could be introduced and more of the variables modelled en-dogenously.
• Looking at other technologies and implementing models for them would increase the experience gained with the models, and could help to distinguish which results are technology specific, and which common mechanisms can be applied for a larger set of technologies.
In addition to improving the model, it will be also helpful to look into the relationship between certain aspects in more detail. Especially econometric analysis could help to determine the importance of various feedback loops in the past, which could help to reformulate and improve the specifications of the system dynamics model.
17
17
Literature:
Asheim, B.; Gertler, M. S. (2005): The Geography of Innovation: Regional Innovation Systems, in: Fagerberg, J. et al (eds.): The Oxford Handbook of Innovation, Ox-ford University Press, Oxford, pp. 291-317.
Beise, M. (2004): Lead markets: country specific drivers of the global diffusion of inno-vations, in: Research Policy, Vol. 33, pp. 997-1028.
Beise, M.; Rennings, K. (2005): Lead markets and regulation: a framework for analyz-ing the international diffusion of environmental innovations. In: Ecological Eco-nomics, Vol. 52, No.1, pp. 5–17.
Blind, K.; Bührlen, B.; Menrad, K.; Hafner, S.; Walz, R.; Kotz, C. (2004): New Products and Services: Analysis of Regulations Shaping New Markets. Office for Official Publications of the EU, Luxembourg.
Blind, K.; Frietsch, R. (2005): Integration verschiedener Technologieindikatoren. Stu-dien zum deutschen Innovationssystem Nr. 21-2005, BMBF, Berlin.
Blümle, G. (1994): The Importance of Environmental Policy for International Com-petitiveness, in: Matsugi, T; Oberhauser, A. (Hrsg.): Interactions Between Econ-omy and Ecology, Berlin, pp. 35-57.
Bossel, H. (2004): Systeme, Dynamik, Simulation: Modellbildung, Analyse und Simula-tion komplexer Systeme. BoD - Books on Demand.
Ekins, P.; Speck, S. (1998): The impacts of environmental policy on competitiveness: theory and evidence, in: Barker, T.; Köhler, J. (Hrsg.): International Competitive-ness and Environmental Policy, Edward Elgar, Cheltenham, pp. 33-70.
Dosi, G.; Pavitt, K.; Soete, L. (1990): The Economics of Technical Change and Interna-tional Trade, New York.
Fagerberg, J. (1995a): Technology and Competitiveness, in: Oxford Review of Eco-nomic Policy, Vol. 12, No.3, pp. 39-51.
Fagerberg, J. (1995b): User-producer interaction, learning, and competitive advantage, in: Cambridge Journal of Economics, Vol. 19, pp. 243-256.
Fagerberg, J.; Godinho, M. M. (2005): Innovation and Catching-up, in: Fagerberg, J. et al. (eds.): The Oxford Handbook of Innovation, Oxford University Press, Oxford, pp. 514-542.
18
18
Folz, A. (2008): Modelling and dynamic simulation of the effects of technological learn-ing on the development of renewable energies in the electricity sector in the EU up to 2050, Master thesis, Fraunhofer ISI, Karlsruhe/Kassel, January 2008.
Forrester, J. W. (1961): Industrial Dynamics. Pegasus Communications. ISBN 1883823366.
Griliches, Z. (1991): The Search for R&D Spillovers. Working Paper No. 3768, National Bureau of Economic Research, Cambridge, Mass.
Grupp, H. (1998): Foundations of Innovation Economics and Indicators, Edward Elgar, Cheltenham
Grupp, H.; Münt, G. (1998): Trade on High-Technology Markets and Patent Statistics – Leading-Edge Versus High-Level Technology. In: Archibugi, D.; Michie, J. (Eds.): Trade, Growth and Technical Change. Cambridge (UK): Cambridge University Press, 1998, pp. 168-187.
Meyer-Krahmer, F. (2004): Vorreiter-Märkte und Innovation, in: Steinmeier, F.W.; Machnig, M. (Hrsg.): Made in Deutschland 21', Hamburg, pp. 95-110.
Kline, G.J.; Rosenberg, N. (1986): An overview of innovation, in: Landau, R.; Rosen-berg, N. (Hrsg.): The Positive Sum Strategy: Harnessing Technology for Eco-nomic Growth, Washington, pp. 275-306.
Linder, S. B. (1961): An Essay on Trade and Transformation, Uppsala 1961.
Lundvall, B.-A.; Johnson, B. (1994): The Learning Economy, Journal of Industry Stud-ies, Vol. 1, pp. 23-42.
Porter, M. E. (1990): The Competitive Advantage of Nations, New York.
Porter, M. E.; van der Linde, C. (1995): Toward a new conception of the environment-competitiveness relationship. In: Journal of Economic Perspectives, 9 (4), pp. 97-118.
Posner, M. V. (1961): International Trade and Technical Change, in: Oxford Economics Papers, Vol. 30, pp. 323-341
Taistra, G. (2001): Die Porter-Hypothese zur Umweltpolitik, in: ZfU 2001, Nr. 2, pp. 241-262.
Vernon, R. (1966): International Investment and International Trade in the Product Cy-cle, in: Quarterly Review of Economics Vol. 88, pp. 190-207.

19
19
von Hippel, E. (1988 ): Sources of innovation, New York.
Wakelin, K. (1997): Trade and Innovation, Cheltenham.
Walz, R. (2006): Impacts of Strategies to Increase Renewable Energy in Europe on Competitiveness and Employment. In Energy & Environment, Vol. 17 (2006), No. 6, pp. 951-975.
Walz, R. (2007): The role of regulation for sustainable infrastructure innovations: the case of wind energy. In: International Journal of Public Policy, Vol. 2 (2007), No. 1/2, S. 57-88.
Walz, R. et al. (2008a): Zukunftsmärkte Umwelt - Innovative Umweltpolitik in wichtigen Handlungsfeldern, Reihe Umwelt, Innovation, Beschäftigung of the German Envi-ronment Ministry, Berlin 2008.
Walz, R. et al. (2008b): Technological competences for sustainable development in the BRICS countries, IRB publisher, Stuttgart 2008.
Walz, R. et al. (2008c): Innovation and regulation: the case of renewable energy tech-nologies, DIME working paper series “Environmental Innovation” No.2, May 2008.
ZSW et al. (2006): Auswirkungen des Ausbaus erneuerbarer Energien auf den Ar-beitsmarkt, Stuttgart 2006.

20
20
Ann
ex: L
ead
mar
ket m
odel
impl
emen
ted
in V
ENSI
M