How to Pass the QTS Numeracy Skills Test
144
i
-
Upload
ranga-reddy -
Category
Documents
-
view
902 -
download
3
Transcript of How to Pass the QTS Numeracy Skills Test

i
HOW TO PASS
THE QTS NUMERACY SKILLS TEST
ii
THIS PAGE HAS INTENTIONALLY BEEN LEFT BLANK

iii
iv
Publisher’s noteEvery possible effort has been made to ensure that the informationcontained in this book is accurate at the time of going to press, and thepublishers and authors cannot accept responsibility for any errors or omis-sions, however caused. No responsibility for loss or damage occasioned toany person acting, or refraining from action, as a result of the material inthis publication can be accepted by the editor, the publisher or any of theauthors.
First published in Great Britain in 2009 by Kogan Page Limited
Apart from any fair dealing for the purposes of research or private study, orcriticism or review, as permitted under the Copyright, Designs and PatentsAct 1988, this publication may only be reproduced, stored or transmitted,in any form or by any means, with the prior permission in writing of thepublishers, or in the case of reprographic reproduction in accordance withthe terms and licences issued by the CLA. Enquiries concerning repro-duction outside these terms should be sent to the publishers at the under-mentioned address:
Kogan Page Limited120 Pentonville RoadLondon N1 9JNUnited Kingdomwww.koganpage.com
© Chris Tyreman, 2009
The right of Chris Tyreman to be identified as the author of this work hasbeen asserted by him in accordance with the Copyright, Designs and PatentsAct 1988.
British Library Cataloguing in Publication Data
A CIP record for this book is available from the British Library.
ISBN 978 0 7495 5460 9
Typeset by Saxon Graphics Ltd, DerbyPrinted and bound in India by Replika Press Pvt Ltd
Contents
Introduction 1
1. Mental arithmetic 7Maths audit 1 7Working with whole numbers 9Fractions 12Ratio and proportion 14Decimals (decimal fractions) 15Percent and percentage change 18Time 20Money 21Mental arithmetic questions 22
2. General arithmetic 33Maths audit 2 33Decimal numbers 34The metric system of measurement (SI units) 35Areas, borders, perimeters and volumes 36Scales 39Aspects of algebra 40Rearranging linear equations 42Trends 43Averages 44Weighted average 46
v
3. Statistics 49Maths audit 3 49Pie charts 50Bar charts 52Line graphs 56Scatter graphs 59Tables 62Tally charts, frequency tables and histograms 66Cumulative frequency graphs 70Box and whisker plots 73
Introduction to the ‘on-screen’ questions 77Mock test 1 78Mock test 2 88
Answers 99
Glossary 123
vi Contents
1
Introduction
All trainee teachers seeking Qualified Teacher Status (QTS) mustpass the Numeracy Skills Test, the Literacy Skills Test and the ICTSkills Test. This book will enable you to pass the Numeracy SkillsTest at your first attempt. Of course it cannot, without someeffort, miraculously pass the test for you, but if you work steadilythrough each chapter you can succeed.
The pass mark in the QTS Numeracy Skills Test is 17 correctanswers out of 28 questions (60 per cent) and whilst this is notvery high, candidates who work too slowly will not pass. For thisreason, the first chapter teaches quick ways of answering themental arithmetic questions. Five mock QTS mental arithmetictests of 12 questions each provide plenty of practice.
The remaining two chapters cover the general arithmetic andstatistical skills required for the ‘on-screen’ questions. Two mock‘on-screen’ QTS-type tests complete the book, which comes withworked-through answers.
Each chapter begins with a ‘maths audit’ so you can review theexact skills required for each section of the test. To interpret thequestions you must be able convert the language of the questionsinto mathematical operations, as per the following example:
A comprehensive school has 1,400 pupils on roll, including 154 A-level students. What percentage of the pupils on roll are A-levelstudents?
The arithmetic required is division followed by multiplication:
154 ÷ 1400 × 100%
All the material in this book comes with expanded answers thatshow the calculations.
Whilst you need only to remember the four arithmetic opera-tions of addition (+), subtraction (–), multiplication (×) anddivision (÷), you should be familiar with the different ways thatthese operations can be denoted in question form, as given here:
(×) multiply by, times, lots of, product, twice, double, half,multiple, fraction;
(÷) divide by, proportion, ratio, per/percent, out of, each, scale,factor;
(+) add, total, plus, sum, tally, more than;(–) subtract, difference, take, less than.
To interpret the graphs you must be able to work out the distancefrom one tick mark to the next along the axis, ie divide the scaleby the number of tick mark intervals, as per the examples shownbelow.
2 Introduction
0 10
10 ÷ 10 10 ÷ 5 20 ÷ 5 20 ÷ 4 20 ÷ 2
+1 +2 +4 +5 +10
20 40 60 80
Why students fail the QTS tests
Candidates who fail the test tend to do so for the following reasons.
Lack of knowledge
This is probably the main reason why students fail. As a guide,you should have at least a grade B in GCSE maths if you expect topass the test without preparing for it. If you managed only a gradeC or lower then you must prepare carefully. This book will helpyou whatever your level because it assumes that you haveforgotten much of what you learnt at school or college, or thatyou never understood it in the first place. It builds on yourexisting knowledge by using graded exercises combined withfully explained answers. Mock tests are included to simulate thelive test experience as far as possible.
Time pressure
Time constraints are another key reason why candidates fail. Thetest lasts 48 minutes with 12 minutes for the mental arithmeticquestions and 36 minutes for the longer on-screen questions. Themental arithmetic questions are the most troublesome becauseeach question has a strict time limit. If you are only halfwaythrough a question when the next question is read out then youcannot put up your hand and ask the questioner to wait! With theon-screen questions you can work at your own pace, even if thepenalty is missing out on answering every question. It is better tobe certain of a few correct answers than to guess too many,leaving everything to chance.
Another tip for improving your mark is to increase the speed ofyour calculations. This book explains ways in which this can bedone. Do not attempt to work out every problem mentally, butinstead use the pencil and paper provided to write down most ofthe steps in a calculation. You are far more likely to make
Introduction 3
numerical errors if you rely too heavily on your memory. For thepurposes of the QTS test, mental arithmetic is not about workingeverything out in your head, it is arithmetic without the help of acalculator.
Maths phobia
This is the third reason why people fail. Test takers with a mentalblock on maths are susceptible to panic attacks before or duringthe test and this can lead to repeated failures. Fortunately forthese people, there is no limit on the number of times they canattempt to pass the QTS tests and gain Qualified Teacher Status.This third reason for lack of test success is really a combination ofthe first two, ie a lack of knowledge and an inability to cope withthe pressure of working against the clock. A vicious circle ofanxiety and a lack of understanding ensue to create even moreanxiety with feelings of hopelessness.
If this happens to you, then stop, put down your pencil, closeyour eyes, take a few deep breaths, then open your eyes and startagain. Maths phobia can be overcome by practising your mathsskills daily until you feel more confident.
Calculator skills
The calculator and the on-screen nature of the test can be off-putting for some people. You should not have to rely on the on-screen calculator for every single step of the on-screen questions,but you do need to make sure that you are confident with a calcu-lator for the times when it is required.
The QTS on-screen calculator is a basic arithmetic calculatorrather than a scientific type. This means that it will only cope withsingle step arithmetic processes. Eg, 250 ÷ 1.6 can be worked outby simply using the mouse to click on:
[2] [5] [0] [÷] [1] [.] [6] [=]
4 Introduction
However, 250 ÷ 1.6 + 2.75 must be manually split into two parts:
250 ÷ 1.6 = 156.25
Write the answer down, then click on [C] to clear the answer anduse the mouse to enter 156.25 + 2.75 as a final step:
[1] [5] [6] [.] [2] [5] [+] [2] [.] [7] [5]
The [CE] key can be used to clear the last entry if you make amistake, but it is often better to use the [C] key and start thecalculation afresh.
Finally, you can click on the blue bar at the head of the calcu-lator to drag it to a more convenient position on the screen.
TDA website
You can register for the QTS skills tests via the following webaddress: www.tda.gov.uk/skillstests.aspx (or type ‘QTS’ into theGoogle search engine). To book a test you will need a registrationnumber issued to you by your training provider. Full details ofwhere to take the tests are available from the TDA website, whichalso includes links to on-line practice tests. You can book all threeQTS tests for the same day, depending on availability. Your testresults will be shown on-screen as soon as you have finished thetest.
Men are disturbed, not by things, but by the views and notionswhich they form concerning things. When we are hindered, let usnever attribute it to others, but to ourselves; that is, to our ownprinciples. A person lacking information or instruction will laythe fault of his own bad condition upon others. Someone juststarting instruction will lay the fault on himself. Someone who iswell informed and instructed will place blame neither on othersnor on himself.
Epictetus (55 AD)
Introduction 5
6
THIS PAGE HAS INTENTIONALLY BEEN LEFT BLANK
7
Mental arithmetic
Maths audit 1
For the mental arithmetic section you need to know thefollowing.
Whole numbers
� How to add, subtract, multiply and divide whole numbers.
� How to multiply by or divide by 10, 100, 1000, etc.
� How to break down large numbers by finding the primefactors.
Fractions, proportions and ratios
� How to add and subtract fractions with the same anddifferent denominators (find a common denominator).
� How to multiply fractions together (multiply the top numbersand the bottom numbers).
� How to divide fractions (turn the right-hand fraction upside-down and multiply as for multiplications).
1
� How to work with improper (top-heavy) fractions (samerules apply).
� How to work with mixed fractions (whole number + fraction)by converting to an improper fraction as a first step.
� How to cancel fractions (equivalent fractions) and cross-cancel fractions when multiplying fractions together.
� How to divide quantities into ratios and proportional parts.
Decimal numbers
� How to add and subtract decimal numbers (same as for wholenumbers but keep the decimal points aligned).
� How to multiply decimals by 10, 100, 1000, etc (move thedecimal point to the right by how many zeros you have).
� How to divide decimals by 10, 100, 1000, etc (move thedecimal point to the left by how many zeros you have).
� How to multiply decimals by ordinary numbers (multiply asnormal and then remember: number of decimal places in thequestion = number of decimal places in the answer).
� How to divide decimals by ordinary numbers (divide asnormal keeping the decimal point in the same position).
� How to divide by decimal numbers (change the decimal into awhole number as a first step).
� How to convert decimals into fractions and vice versa.
Percentages
� How to express a percentage as a fraction with a denomi-nator of 100.
� How to write a percentage as a decimal by dividing by 100.
8 How to pass the QTS numeracy skills test
� How to multiply any number by any percentage using either afractions method or a decimals method.
� How to work out a percentage change (increase or decrease).
Time
How to express time using the 24-hour clock, and how tocalculate time intervals, and find start and end times.
Money
How to work with the decimal system and exchange rates.
Working with whole numbers
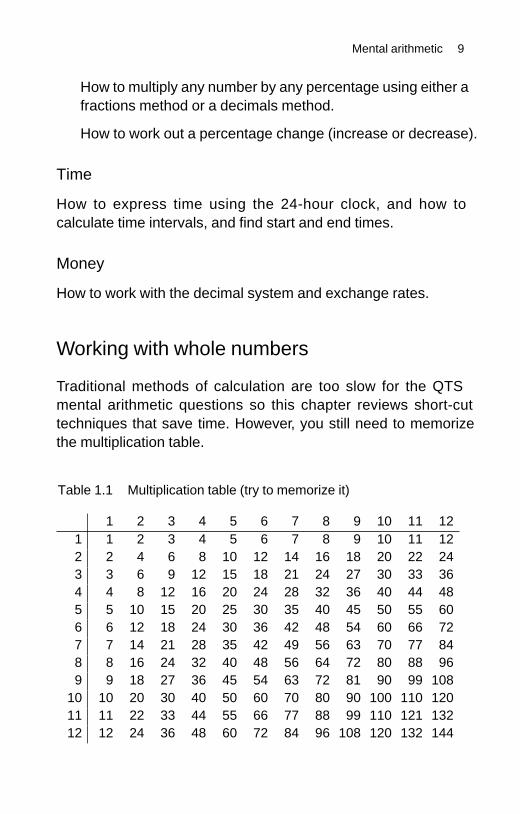
Traditional methods of calculation are too slow for the QTSmental arithmetic questions so this chapter reviews short-cuttechniques that save time. However, you still need to memorizethe multiplication table.
Mental arithmetic 9
1 2 3 4 5 6 7 8 9 10 11 121 1 2 3 4 5 6 7 8 9 10 11 122 2 4 6 8 10 12 14 16 18 20 22 243 3 6 9 12 15 18 21 24 27 30 33 364 4 8 12 16 20 24 28 32 36 40 44 485 5 10 15 20 25 30 35 40 45 50 55 606 6 12 18 24 30 36 42 48 54 60 66 727 7 14 21 28 35 42 49 56 63 70 77 848 8 16 24 32 40 48 56 64 72 80 88 969 9 18 27 36 45 54 63 72 81 90 99 108
10 10 20 30 40 50 60 70 80 90 100 110 12011 11 22 33 44 55 66 77 88 99 110 121 13212 12 24 36 48 60 72 84 96 108 120 132 144
Table 1.1 Multiplication table (try to memorize it)
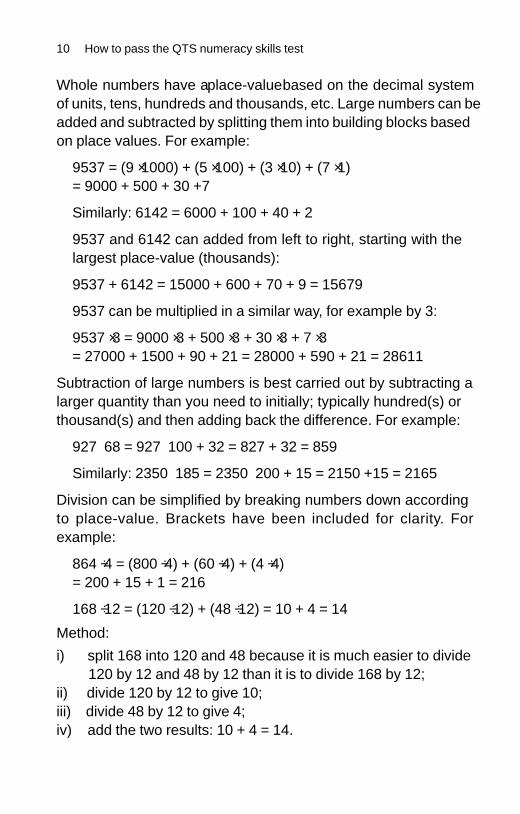
Whole numbers have a place-value based on the decimal systemof units, tens, hundreds and thousands, etc. Large numbers can beadded and subtracted by splitting them into building blocks basedon place values. For example:
9537 = (9 × 1000) + (5 × 100) + (3 × 10) + (7 × 1)= 9000 + 500 + 30 +7
Similarly: 6142 = 6000 + 100 + 40 + 2
9537 and 6142 can added from left to right, starting with thelargest place-value (thousands):
9537 + 6142 = 15000 + 600 + 70 + 9 = 15679
9537 can be multiplied in a similar way, for example by 3:
9537 × 3 = 9000 × 3 + 500 × 3 + 30 × 3 + 7 × 3= 27000 + 1500 + 90 + 21 = 28000 + 590 + 21 = 28611
Subtraction of large numbers is best carried out by subtracting alarger quantity than you need to initially; typically hundred(s) orthousand(s) and then adding back the difference. For example:
927 – 68 = 927 – 100 + 32 = 827 + 32 = 859
Similarly: 2350 – 185 = 2350 – 200 + 15 = 2150 +15 = 2165
Division can be simplified by breaking numbers down accordingto place-value. Brackets have been included for clarity. Forexample:
864 ÷ 4 = (800 ÷ 4) + (60 ÷ 4) + (4 ÷ 4)= 200 + 15 + 1 = 216
168 ÷ 12 = (120 ÷ 12) + (48 ÷ 12) = 10 + 4 = 14
Method:
i) split 168 into 120 and 48 because it is much easier to divide120 by 12 and 48 by 12 than it is to divide 168 by 12;
ii) divide 120 by 12 to give 10;iii) divide 48 by 12 to give 4;iv) add the two results: 10 + 4 = 14.
10 How to pass the QTS numeracy skills test
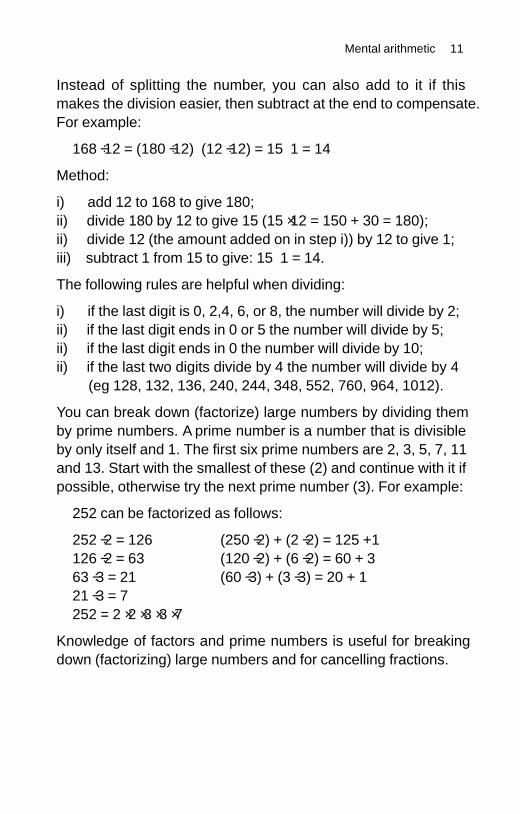
Instead of splitting the number, you can also add to it if thismakes the division easier, then subtract at the end to compensate.For example:
168 ÷ 12 = (180 ÷ 12) – (12 ÷ 12) = 15 – 1 = 14
Method:
i) add 12 to 168 to give 180;ii) divide 180 by 12 to give 15 (15 × 12 = 150 + 30 = 180);ii) divide 12 (the amount added on in step i)) by 12 to give 1;iii) subtract 1 from 15 to give: 15 – 1 = 14.
The following rules are helpful when dividing:
i) if the last digit is 0, 2,4, 6, or 8, the number will divide by 2;ii) if the last digit ends in 0 or 5 the number will divide by 5;ii) if the last digit ends in 0 the number will divide by 10;ii) if the last two digits divide by 4 the number will divide by 4
(eg 128, 132, 136, 240, 244, 348, 552, 760, 964, 1012).
You can break down (factorize) large numbers by dividing themby prime numbers. A prime number is a number that is divisibleby only itself and 1. The first six prime numbers are 2, 3, 5, 7, 11and 13. Start with the smallest of these (2) and continue with it ifpossible, otherwise try the next prime number (3). For example:
252 can be factorized as follows:
252 ÷ 2 = 126 (250 ÷ 2) + (2 ÷ 2) = 125 +1126 ÷ 2 = 63 (120 ÷ 2) + (6 ÷ 2) = 60 + 363 ÷ 3 = 21 (60 ÷ 3) + (3 ÷ 3) = 20 + 121 ÷ 3 = 7252 = 2 × 2 × 3 × 3 × 7
Knowledge of factors and prime numbers is useful for breakingdown (factorizing) large numbers and for cancelling fractions.
Mental arithmetic 11
Fractions
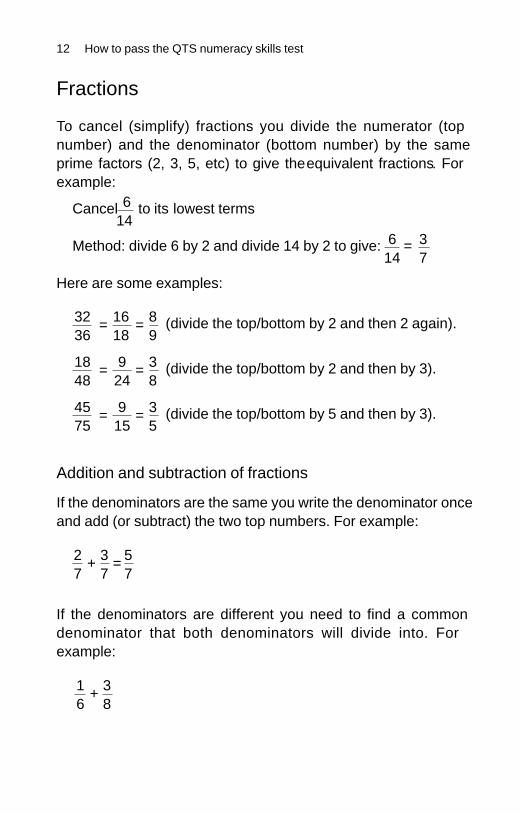
To cancel (simplify) fractions you divide the numerator (topnumber) and the denominator (bottom number) by the sameprime factors (2, 3, 5, etc) to give the equivalent fractions. Forexample:
Cancel 6 to its lowest terms14
Method: divide 6 by 2 and divide 14 by 2 to give: 6 = 314 7
Here are some examples:
Addition and subtraction of fractions
If the denominators are the same you write the denominator onceand add (or subtract) the two top numbers. For example:
If the denominators are different you need to find a commondenominator that both denominators will divide into. Forexample:
12 How to pass the QTS numeracy skills test
3236
1618
89
(divide the top/bottom by 2 and then 2 again).= =
1848
924
915
38
(divide the top/bottom by 2 and then by 3).= =
4575
35
(divide the top/bottom by 5 and then by 3).= =
27
37
57
+ =
16
38
+
A common denominator is a number that both 6 and 8 will divideinto. There are many such numbers; the most obvious is 48 (6 ×8). However, there may be a lower common denominator thatwill make the working easier. One method of finding it is to writedown the equivalent fractions that can be found by multiplyingby prime numbers:
The above fraction cannot be cancelled any further because 13 isa prime number. Subtraction of fractions is carried out in thesame way.
Multiplication and division of fractions
To multiply fractions all you do is multiply the two numerators(top numbers) together and the two denominators (bottomnumbers) together. For example:
Division of fractions is similar, except that the fraction on theright-hand side must be turned upside down and then multipliedwith the fraction on the left-hand side. For example:
Mental arithmetic 13
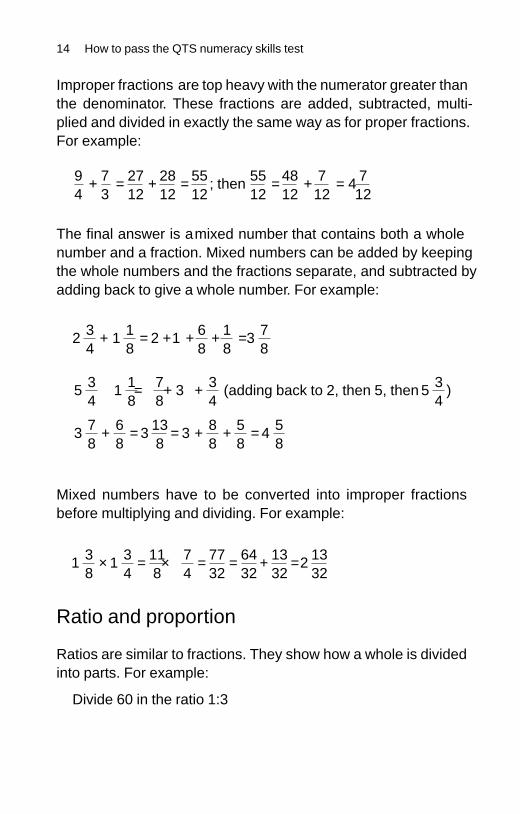
Improper fractions are top heavy with the numerator greater thanthe denominator. These fractions are added, subtracted, multi-plied and divided in exactly the same way as for proper fractions.For example:
The final answer is a mixed number that contains both a wholenumber and a fraction. Mixed numbers can be added by keepingthe whole numbers and the fractions separate, and subtracted by‘adding back’ to give a whole number. For example:
Mixed numbers have to be converted into improper fractionsbefore multiplying and dividing. For example:
Ratio and proportion
Ratios are similar to fractions. They show how a whole is dividedinto parts. For example:
Divide 60 in the ratio 1:3
14 How to pass the QTS numeracy skills test
2 + + + + ==34
1 2 118
3 78
68
18
5 – = + 334
5 )34
1 18
3 + =78
4 58
3 = =+ +3138
68
88
58
78
+ (adding back to 2, then 5, then34
1 2× ×= =38
1 34
74
118
7732
= =6432
+ 1332
1332
94
+ = + = = + = 4; then73
2712
2812
5512
5512
4812
712
712
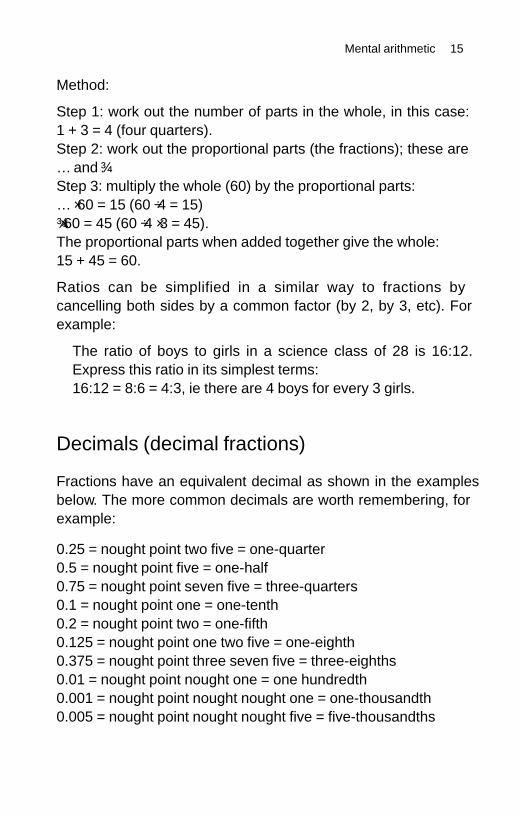
Method:
Step 1: work out the number of parts in the whole, in this case: 1 + 3 = 4 (four quarters).Step 2: work out the proportional parts (the fractions); these are¼ and ¾.Step 3: multiply the whole (60) by the proportional parts:¼ × 60 = 15 (60 ÷ 4 = 15)¾ × 60 = 45 (60 ÷ 4 × 3 = 45).The proportional parts when added together give the whole:15 + 45 = 60.
Ratios can be simplified in a similar way to fractions bycancelling both sides by a common factor (by 2, by 3, etc). Forexample:
The ratio of boys to girls in a science class of 28 is 16:12.Express this ratio in its simplest terms:16:12 = 8:6 = 4:3, ie there are 4 boys for every 3 girls.
Decimals (decimal fractions)
Fractions have an equivalent decimal as shown in the examplesbelow. The more common decimals are worth remembering, forexample:
0.25 = nought point two five = one-quarter0.5 = nought point five = one-half0.75 = nought point seven five = three-quarters0.1 = nought point one = one-tenth0.2 = nought point two = one-fifth0.125 = nought point one two five = one-eighth0.375 = nought point three seven five = three-eighths0.01 = nought point nought one = one hundredth0.001 = nought point nought nought one = one-thousandth0.005 = nought point nought nought five = five-thousandths
Mental arithmetic 15
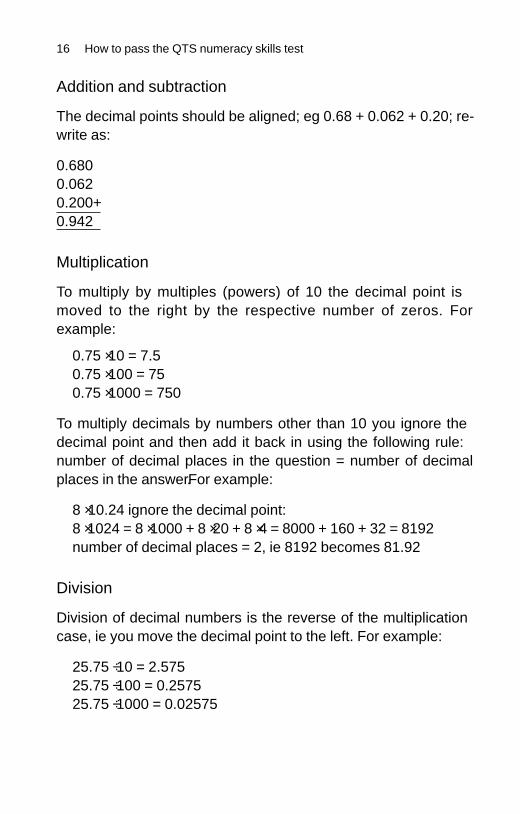
Addition and subtraction
The decimal points should be aligned; eg 0.68 + 0.062 + 0.20; re-write as:
0.6800.0620.200+0.942
Multiplication
To multiply by multiples (powers) of 10 the decimal point ismoved to the right by the respective number of zeros. Forexample:
0.75 × 10 = 7.50.75 × 100 = 750.75 × 1000 = 750
To multiply decimals by numbers other than 10 you ignore thedecimal point and then add it back in using the following rule:number of decimal places in the question = number of decimalplaces in the answer. For example:
8 × 10.24 ignore the decimal point:8 × 1024 = 8 × 1000 + 8 × 20 + 8 × 4 = 8000 + 160 + 32 = 8192number of decimal places = 2, ie 8192 becomes 81.92
Division
Division of decimal numbers is the reverse of the multiplicationcase, ie you move the decimal point to the left. For example:
25.75 ÷ 10 = 2.57525.75 ÷ 100 = 0.257525.75 ÷ 1000 = 0.02575
16 How to pass the QTS numeracy skills test
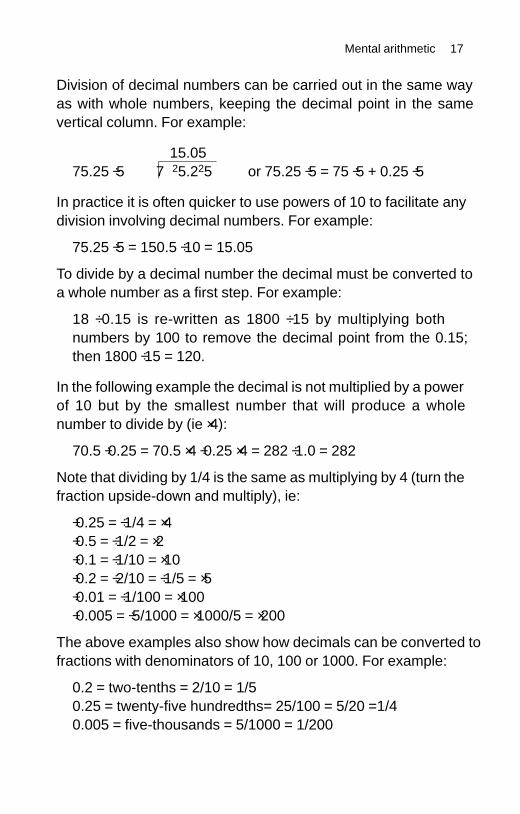
Division of decimal numbers can be carried out in the same wayas with whole numbers, keeping the decimal point in the samevertical column. For example:
15.0575.25 ÷ 5 725.225 or 75.25 ÷ 5 = 75 ÷ 5 + 0.25 ÷ 5
In practice it is often quicker to use powers of 10 to facilitate anydivision involving decimal numbers. For example:
75.25 ÷ 5 = 150.5 ÷ 10 = 15.05
To divide by a decimal number the decimal must be converted toa whole number as a first step. For example:
18 ÷ 0.15 is re-written as 1800 ÷ 15 by multiplying bothnumbers by 100 to remove the decimal point from the 0.15;then 1800 ÷ 15 = 120.
In the following example the decimal is not multiplied by a powerof 10 but by the smallest number that will produce a wholenumber to divide by (ie × 4):
70.5 ÷ 0.25 = 70.5 × 4 ÷ 0.25 × 4 = 282 ÷ 1.0 = 282
Note that dividing by 1/4 is the same as multiplying by 4 (turn thefraction upside-down and multiply), ie:
÷ 0.25 = ÷ 1/4 = × 4÷ 0.5 = ÷ 1/2 = × 2÷ 0.1 = ÷ 1/10 = × 10÷ 0.2 = ÷ 2/10 = ÷ 1/5 = × 5÷ 0.01 = ÷ 1/100 = × 100÷ 0.005 = ÷ 5/1000 = × 1000/5 = × 200
The above examples also show how decimals can be converted tofractions with denominators of 10, 100 or 1000. For example:
0.2 = two-tenths = 2/10 = 1/50.25 = twenty-five hundredths= 25/100 = 5/20 =1/40.005 = five-thousands = 5/1000 = 1/200
Mental arithmetic 17
Percent and percentage change
Percent
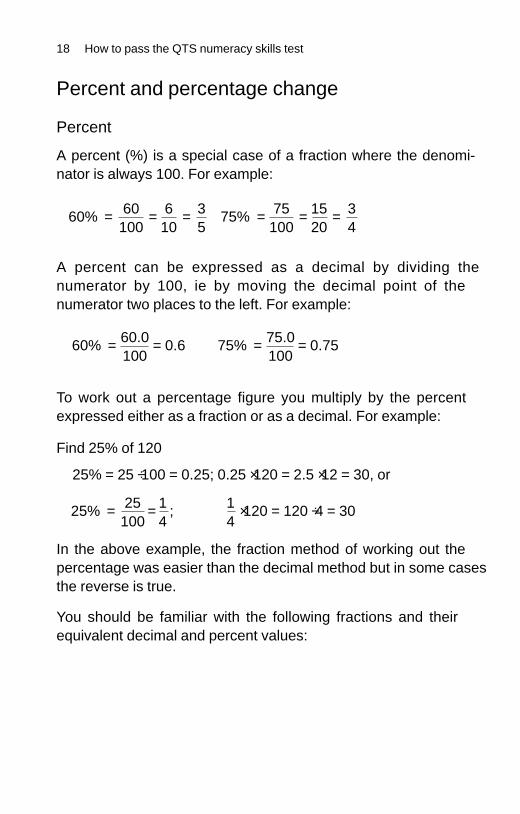
A percent (%) is a special case of a fraction where the denomi-nator is always 100. For example:
A percent can be expressed as a decimal by dividing thenumerator by 100, ie by moving the decimal point of thenumerator two places to the left. For example:
To work out a percentage figure you multiply by the percentexpressed either as a fraction or as a decimal. For example:
Find 25% of 120
25% = 25 ÷ 100 = 0.25; 0.25 × 120 = 2.5 × 12 = 30, or
In the above example, the fraction method of working out thepercentage was easier than the decimal method but in some casesthe reverse is true.
You should be familiar with the following fractions and theirequivalent decimal and percent values:
18 How to pass the QTS numeracy skills test
=25% 25100
14
= × 120 = 120 ÷ 4 = 30; 14
610
60100
= == =75%60% 1520
=35
= 34
75100
=60% = 0.660.0100
=75% = 0.7575.0100
To convert a less obvious fraction to a decimal or a percent youneed to express the denominator as a factor of 100:
Percentage change (increase or decrease)
Mental arithmetic 19
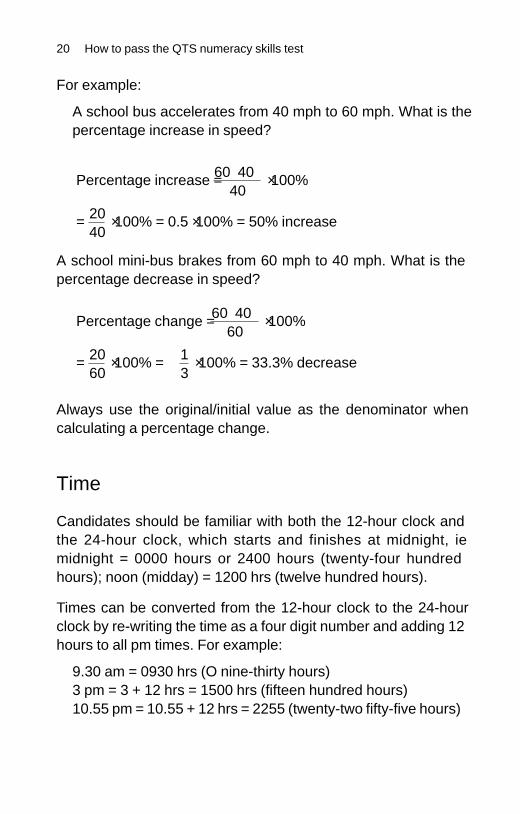
For example:
A school bus accelerates from 40 mph to 60 mph. What is thepercentage increase in speed?
A school mini-bus brakes from 60 mph to 40 mph. What is thepercentage decrease in speed?
Always use the original/initial value as the denominator whencalculating a percentage change.
Time
Candidates should be familiar with both the 12-hour clock andthe 24-hour clock, which starts and finishes at midnight, iemidnight = 0000 hours or 2400 hours (twenty-four hundredhours); noon (midday) = 1200 hrs (twelve hundred hours).
Times can be converted from the 12-hour clock to the 24-hourclock by re-writing the time as a four digit number and adding 12hours to all pm times. For example:
9.30 am = 0930 hrs (O nine-thirty hours)3 pm = 3 + 12 hrs = 1500 hrs (fifteen hundred hours)10.55 pm = 10.55 + 12 hrs = 2255 (twenty-two fifty-five hours)
20 How to pass the QTS numeracy skills test
60 – 4040
× 100%Percentage increase =
= × 100% = 0.5 × 100% = 50% increase2040
60 – 4060
× 100%Percentage change =
= × 100% = 33.3% decrease× 100% =2060
13
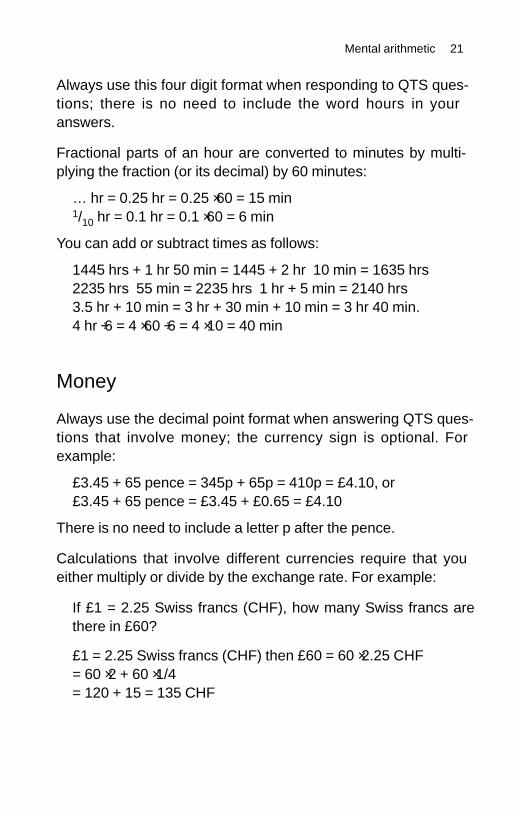
Always use this four digit format when responding to QTS ques-tions; there is no need to include the word ‘hours’ in youranswers.
Fractional parts of an hour are converted to minutes by multi-plying the fraction (or its decimal) by 60 minutes:
¼ hr = 0.25 hr = 0.25 × 60 = 15 min1/10 hr = 0.1 hr = 0.1 × 60 = 6 min
You can add or subtract times as follows:
1445 hrs + 1 hr 50 min = 1445 + 2 hr – 10 min = 1635 hrs2235 hrs – 55 min = 2235 hrs – 1 hr + 5 min = 2140 hrs3.5 hr + 10 min = 3 hr + 30 min + 10 min = 3 hr 40 min.4 hr ÷ 6 = 4 × 60 ÷ 6 = 4 × 10 = 40 min
Money
Always use the decimal point format when answering QTS ques-tions that involve money; the currency sign is optional. Forexample:
£3.45 + 65 pence = 345p + 65p = 410p = £4.10, or£3.45 + 65 pence = £3.45 + £0.65 = £4.10
There is no need to include a letter ‘p’ after the pence.
Calculations that involve different currencies require that youeither multiply or divide by the exchange rate. For example:
If £1 = 2.25 Swiss francs (CHF), how many Swiss francs arethere in £60?
£1 = 2.25 Swiss francs (CHF) then £60 = 60 × 2.25 CHF= 60 × 2 + 60 × 1/4= 120 + 15 = 135 CHF
Mental arithmetic 21
If £1 = 2.25 Swiss francs (CHF), how many pounds are there in90 CHF?
90 CHF = 90 ÷ 2.25 poundsmultiply 2.25 × 4 (removes the decimal point) to give 9 then multiply 90 × 4 to match, ie:90 ÷ 2.25 = 90 × 4 ÷ 9 = 10 × 4 = £40(check: 40 × 2.25 = 80 + 10 = 90)
Mental arithmetic questions
Introduction
The first section of the test is an aural mental arithmetic test heardthrough the computer’s headphones. Each question is read outtwice with no pause in between. You will then be given 18seconds in which to enter your answer using the keyboard beforethe next question is read out. You are not allowed to use a calcu-lator but you will have access to a pen and paper to jot down thecalculation. The following points are worth noting:
� Write down any numbers and attempt the question straightaway without waiting for it to be read out a second time.There is less time to spare than you might think.
� Do not continue with any question beyond the allotted time.Leave it and move on to the next question. Do not pursue anyanswer at the expense of missing the next question.
� Most questions will involve more than one arithmetic process(eg multiplication followed by division or cancelling).
� There are no right and wrong methods. Your answers willbe marked by a computer. This book contains tips andexemplar methods but use any arithmetic techniques thatwork for you.
22 How to pass the QTS numeracy skills test
� The context of the question is irrelevant to the mathsinvolved. You simply apply the four arithmetic operationsof addition, subtraction, multiplication and division to fractions, decimals, percentages, time, money andmeasurements.
There now follows a mental arithmetic exemplar test and fivesimilar tests with answers at the end of the book. You will need apen and paper but not a calculator. You can simulate the actualtest more accurately by having someone read the questions outaloud for you or by recording the questions and then playingthem back.
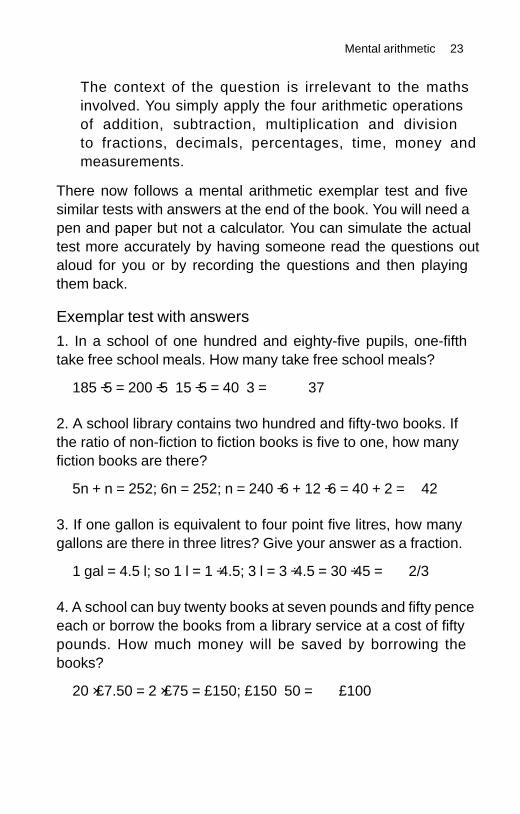
Exemplar test with answers1. In a school of one hundred and eighty-five pupils, one-fifthtake free school meals. How many take free school meals?
185 ÷ 5 = 200 ÷ 5 – 15 ÷ 5 = 40 – 3 = 37
2. A school library contains two hundred and fifty-two books. Ifthe ratio of non-fiction to fiction books is five to one, how manyfiction books are there?
5n + n = 252; 6n = 252; n = 240 ÷ 6 + 12 ÷ 6 = 40 + 2 = 42
3. If one gallon is equivalent to four point five litres, how manygallons are there in three litres? Give your answer as a fraction.
1 gal = 4.5 l; so 1 l = 1 ÷ 4.5; 3 l = 3 ÷ 4.5 = 30 ÷ 45 = 2/3
4. A school can buy twenty books at seven pounds and fifty penceeach or borrow the books from a library service at a cost of fiftypounds. How much money will be saved by borrowing thebooks?
20 × £7.50 = 2 × £75 = £150; £150 – 50 = £100
Mental arithmetic 23
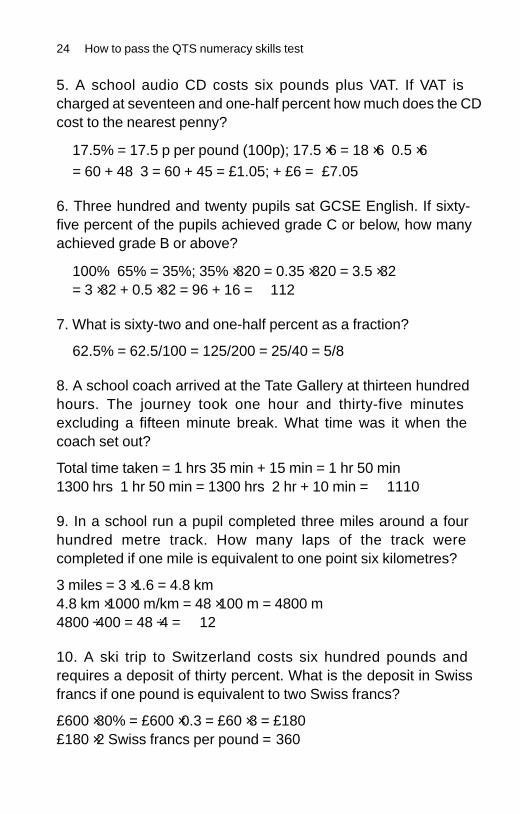
5. A school audio CD costs six pounds plus VAT. If VAT ischarged at seventeen and one-half percent how much does the CDcost to the nearest penny?
17.5% = 17.5 p per pound (100p); 17.5 × 6 = 18 × 6 – 0.5 × 6= 60 + 48 – 3 = 60 + 45 = £1.05; + £6 = £7.05
6. Three hundred and twenty pupils sat GCSE English. If sixty-five percent of the pupils achieved grade C or below, how manyachieved grade B or above?
100% – 65% = 35%; 35% × 320 = 0.35 × 320 = 3.5 × 32= 3 × 32 + 0.5 × 32 = 96 + 16 = 112
7. What is sixty-two and one-half percent as a fraction?
62.5% = 62.5/100 = 125/200 = 25/40 = 5/8
8. A school coach arrived at the Tate Gallery at thirteen hundredhours. The journey took one hour and thirty-five minutesexcluding a fifteen minute break. What time was it when thecoach set out?
Total time taken = 1 hrs 35 min + 15 min = 1 hr 50 min1300 hrs – 1 hr 50 min = 1300 hrs – 2 hr + 10 min = 1110
9. In a school run a pupil completed three miles around a fourhundred metre track. How many laps of the track werecompleted if one mile is equivalent to one point six kilometres?
3 miles = 3 × 1.6 = 4.8 km4.8 km × 1000 m/km = 48 × 100 m = 4800 m4800 ÷ 400 = 48 ÷ 4 = 12
10. A ski trip to Switzerland costs six hundred pounds andrequires a deposit of thirty percent. What is the deposit in Swissfrancs if one pound is equivalent to two Swiss francs?
£600 × 30% = £600 × 0.3 = £60 × 3 = £180£180 × 2 Swiss francs per pound = 360
24 How to pass the QTS numeracy skills test
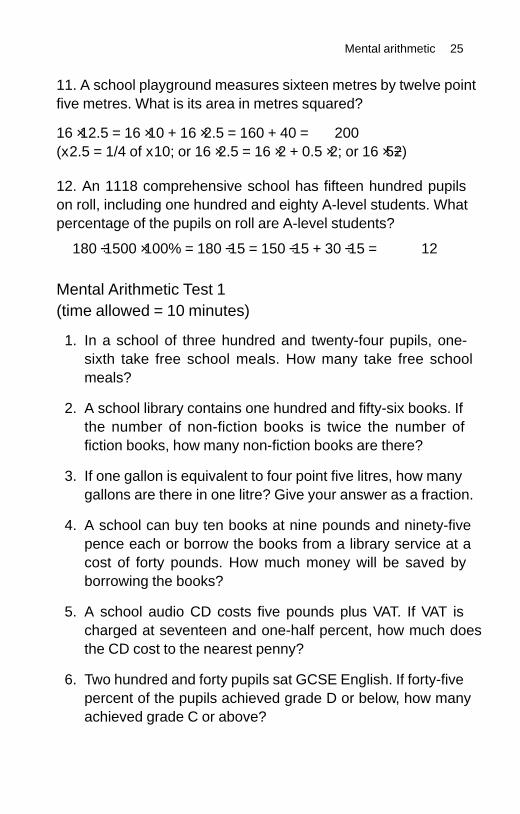
11. A school playground measures sixteen metres by twelve pointfive metres. What is its area in metres squared?
16 × 12.5 = 16 × 10 + 16 × 2.5 = 160 + 40 = 200(x2.5 = 1/4 of x10; or 16 × 2.5 = 16 × 2 + 0.5 × 2; or 16 × 5÷2)
12. An 11–18 comprehensive school has fifteen hundred pupilson roll, including one hundred and eighty A-level students. Whatpercentage of the pupils on roll are A-level students?
180 ÷ 1500 × 100% = 180 ÷ 15 = 150 ÷ 15 + 30 ÷ 15 = 12
Mental Arithmetic Test 1(time allowed = 10 minutes)
1. In a school of three hundred and twenty-four pupils, one-sixth take free school meals. How many take free schoolmeals?
2. A school library contains one hundred and fifty-six books. Ifthe number of non-fiction books is twice the number offiction books, how many non-fiction books are there?
3. If one gallon is equivalent to four point five litres, how manygallons are there in one litre? Give your answer as a fraction.
4. A school can buy ten books at nine pounds and ninety-fivepence each or borrow the books from a library service at acost of forty pounds. How much money will be saved byborrowing the books?
5. A school audio CD costs five pounds plus VAT. If VAT ischarged at seventeen and one-half percent, how much doesthe CD cost to the nearest penny?
6. Two hundred and forty pupils sat GCSE English. If forty-fivepercent of the pupils achieved grade D or below, how manyachieved grade C or above?
Mental arithmetic 25
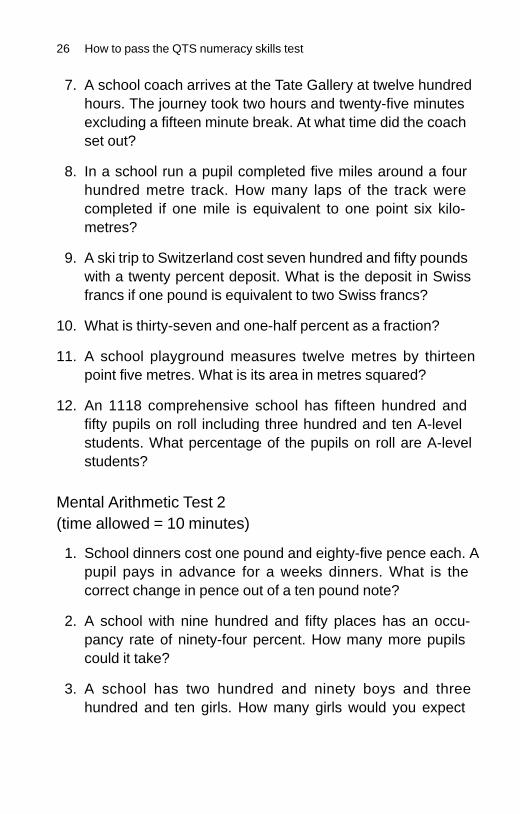
7. A school coach arrives at the Tate Gallery at twelve hundredhours. The journey took two hours and twenty-five minutesexcluding a fifteen minute break. At what time did the coachset out?
8. In a school run a pupil completed five miles around a fourhundred metre track. How many laps of the track werecompleted if one mile is equivalent to one point six kilo-metres?
9. A ski trip to Switzerland cost seven hundred and fifty poundswith a twenty percent deposit. What is the deposit in Swissfrancs if one pound is equivalent to two Swiss francs?
10. What is thirty-seven and one-half percent as a fraction?
11. A school playground measures twelve metres by thirteenpoint five metres. What is its area in metres squared?
12. An 11–18 comprehensive school has fifteen hundred andfifty pupils on roll including three hundred and ten A-levelstudents. What percentage of the pupils on roll are A-levelstudents?
Mental Arithmetic Test 2(time allowed = 10 minutes)
1. School dinners cost one pound and eighty-five pence each. Apupil pays in advance for a week’s dinners. What is thecorrect change in pence out of a ten pound note?
2. A school with nine hundred and fifty places has an occu-pancy rate of ninety-four percent. How many more pupilscould it take?
3. A school has two hundred and ninety boys and threehundred and ten girls. How many girls would you expect
26 How to pass the QTS numeracy skills test
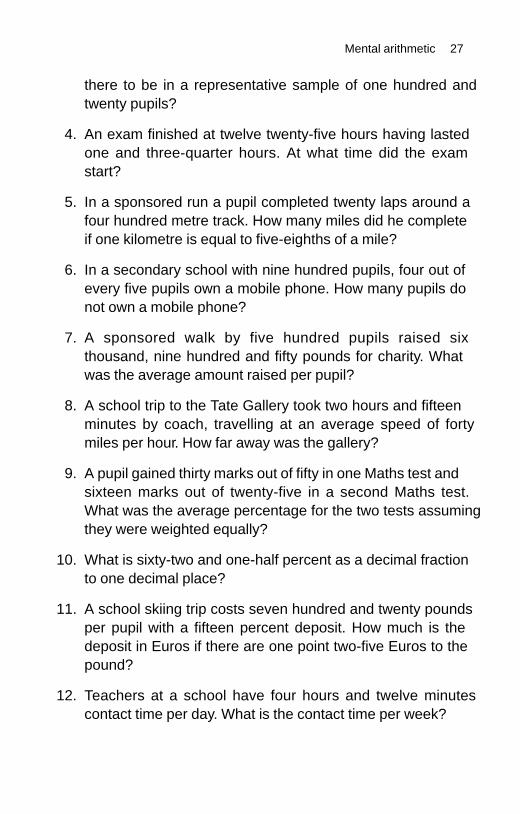
there to be in a representative sample of one hundred andtwenty pupils?
4. An exam finished at twelve twenty-five hours having lastedone and three-quarter hours. At what time did the examstart?
5. In a sponsored run a pupil completed twenty laps around afour hundred metre track. How many miles did he completeif one kilometre is equal to five-eighths of a mile?
6. In a secondary school with nine hundred pupils, four out ofevery five pupils own a mobile phone. How many pupils donot own a mobile phone?
7. A sponsored walk by five hundred pupils raised sixthousand, nine hundred and fifty pounds for charity. Whatwas the average amount raised per pupil?
8. A school trip to the Tate Gallery took two hours and fifteenminutes by coach, travelling at an average speed of fortymiles per hour. How far away was the gallery?
9. A pupil gained thirty marks out of fifty in one Maths test andsixteen marks out of twenty-five in a second Maths test.What was the average percentage for the two tests assumingthey were weighted equally?
10. What is sixty-two and one-half percent as a decimal fractionto one decimal place?
11. A school skiing trip costs seven hundred and twenty poundsper pupil with a fifteen percent deposit. How much is thedeposit in Euros if there are one point two-five Euros to thepound?
12. Teachers at a school have four hours and twelve minutescontact time per day. What is the contact time per week?
Mental arithmetic 27
Mental Arithmetic Test 3(time allowed = 10 minutes)
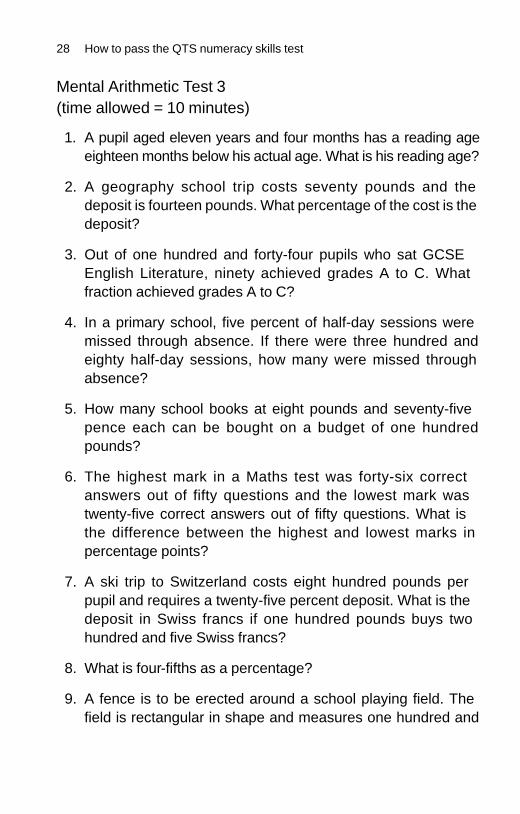
1. A pupil aged eleven years and four months has a reading ageeighteen months below his actual age. What is his reading age?
2. A geography school trip costs seventy pounds and thedeposit is fourteen pounds. What percentage of the cost is thedeposit?
3. Out of one hundred and forty-four pupils who sat GCSEEnglish Literature, ninety achieved grades A to C. Whatfraction achieved grades A to C?
4. In a primary school, five percent of half-day sessions weremissed through absence. If there were three hundred andeighty half-day sessions, how many were missed throughabsence?
5. How many school books at eight pounds and seventy-fivepence each can be bought on a budget of one hundredpounds?
6. The highest mark in a Maths test was forty-six correctanswers out of fifty questions and the lowest mark wastwenty-five correct answers out of fifty questions. What isthe difference between the highest and lowest marks inpercentage points?
7. A ski trip to Switzerland costs eight hundred pounds perpupil and requires a twenty-five percent deposit. What is thedeposit in Swiss francs if one hundred pounds buys twohundred and five Swiss francs?
8. What is four-fifths as a percentage?
9. A fence is to be erected around a school playing field. Thefield is rectangular in shape and measures one hundred and
28 How to pass the QTS numeracy skills test
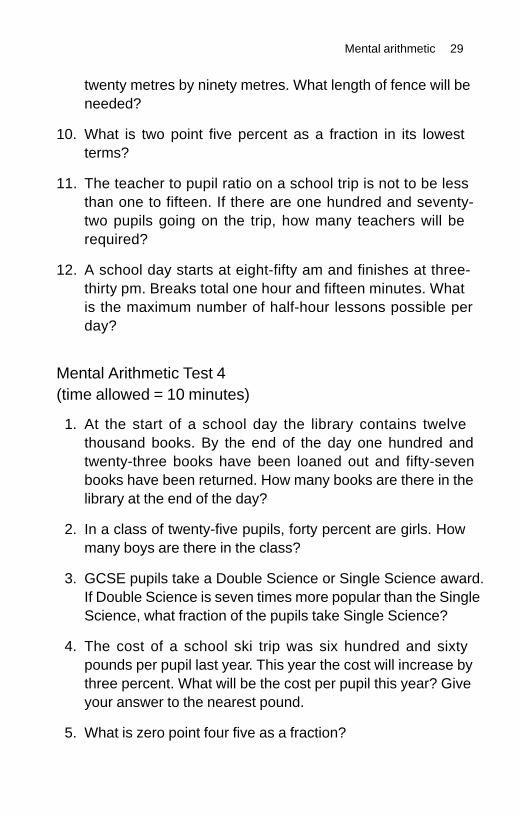
twenty metres by ninety metres. What length of fence will beneeded?
10. What is two point five percent as a fraction in its lowestterms?
11. The teacher to pupil ratio on a school trip is not to be lessthan one to fifteen. If there are one hundred and seventy-two pupils going on the trip, how many teachers will berequired?
12. A school day starts at eight-fifty am and finishes at three-thirty pm. Breaks total one hour and fifteen minutes. Whatis the maximum number of half-hour lessons possible perday?
Mental Arithmetic Test 4(time allowed = 10 minutes)
1. At the start of a school day the library contains twelvethousand books. By the end of the day one hundred andtwenty-three books have been loaned out and fifty-sevenbooks have been returned. How many books are there in thelibrary at the end of the day?
2. In a class of twenty-five pupils, forty percent are girls. Howmany boys are there in the class?
3. GCSE pupils take a Double Science or Single Science award.If Double Science is seven times more popular than the SingleScience, what fraction of the pupils take Single Science?
4. The cost of a school ski trip was six hundred and sixtypounds per pupil last year. This year the cost will increase bythree percent. What will be the cost per pupil this year? Giveyour answer to the nearest pound.
5. What is zero point four five as a fraction?
Mental arithmetic 29
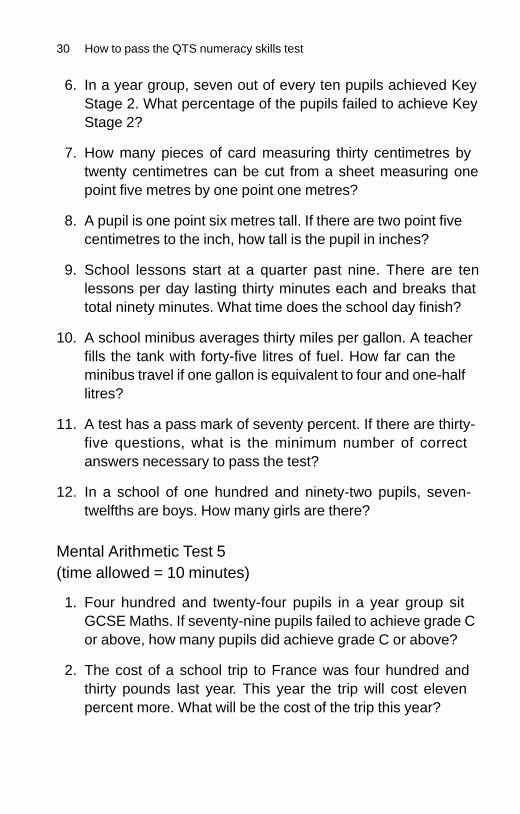
6. In a year group, seven out of every ten pupils achieved KeyStage 2. What percentage of the pupils failed to achieve KeyStage 2?
7. How many pieces of card measuring thirty centimetres bytwenty centimetres can be cut from a sheet measuring onepoint five metres by one point one metres?
8. A pupil is one point six metres tall. If there are two point fivecentimetres to the inch, how tall is the pupil in inches?
9. School lessons start at a quarter past nine. There are tenlessons per day lasting thirty minutes each and breaks thattotal ninety minutes. What time does the school day finish?
10. A school minibus averages thirty miles per gallon. A teacherfills the tank with forty-five litres of fuel. How far can theminibus travel if one gallon is equivalent to four and one-halflitres?
11. A test has a pass mark of seventy percent. If there are thirty-five questions, what is the minimum number of correctanswers necessary to pass the test?
12. In a school of one hundred and ninety-two pupils, seven-twelfths are boys. How many girls are there?
Mental Arithmetic Test 5(time allowed = 10 minutes)
1. Four hundred and twenty-four pupils in a year group sitGCSE Maths. If seventy-nine pupils failed to achieve grade Cor above, how many pupils did achieve grade C or above?
2. The cost of a school trip to France was four hundred andthirty pounds last year. This year the trip will cost elevenpercent more. What will be the cost of the trip this year?
30 How to pass the QTS numeracy skills test
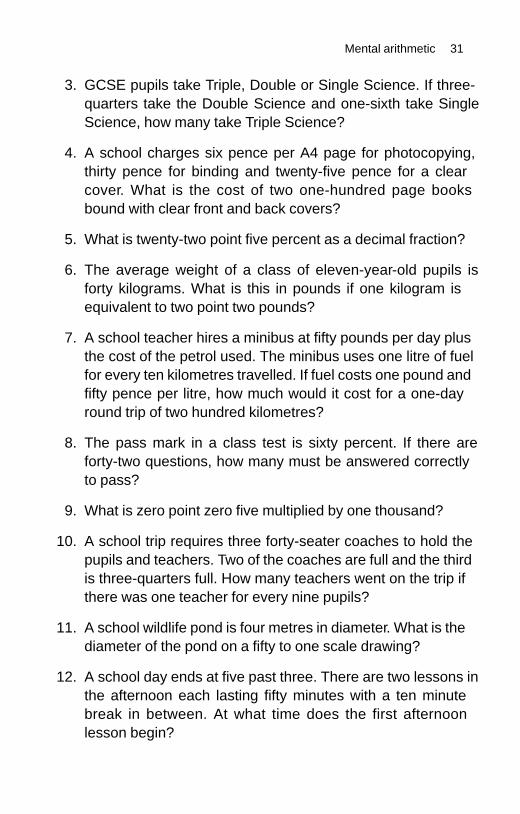
3. GCSE pupils take Triple, Double or Single Science. If three-quarters take the Double Science and one-sixth take SingleScience, how many take Triple Science?
4. A school charges six pence per A4 page for photocopying,thirty pence for binding and twenty-five pence for a clearcover. What is the cost of two one-hundred page booksbound with clear front and back covers?
5. What is twenty-two point five percent as a decimal fraction?
6. The average weight of a class of eleven-year-old pupils isforty kilograms. What is this in pounds if one kilogram isequivalent to two point two pounds?
7. A school teacher hires a minibus at fifty pounds per day plusthe cost of the petrol used. The minibus uses one litre of fuelfor every ten kilometres travelled. If fuel costs one pound andfifty pence per litre, how much would it cost for a one-dayround trip of two hundred kilometres?
8. The pass mark in a class test is sixty percent. If there areforty-two questions, how many must be answered correctlyto pass?
9. What is zero point zero five multiplied by one thousand?
10. A school trip requires three forty-seater coaches to hold thepupils and teachers. Two of the coaches are full and the thirdis three-quarters full. How many teachers went on the trip ifthere was one teacher for every nine pupils?
11. A school wildlife pond is four metres in diameter. What is thediameter of the pond on a fifty to one scale drawing?
12. A school day ends at five past three. There are two lessons inthe afternoon each lasting fifty minutes with a ten minutebreak in between. At what time does the first afternoonlesson begin?
Mental arithmetic 31
32
THIS PAGE HAS INTENTIONALLY BEEN LEFT BLANK
33
General arithmetic
Maths audit 2
For the general arithmetic questions you need to know thefollowing.
Decimal numbers
� How to round a decimal to the nearest whole number.
� How to shorten a decimal number to a given number ofdecimal places.
Measurement
� How to convert units of weight, length and volume in themetric system.
� How to work out the areas of basic shapes and borders.
� How to work out perimeters.
� How to read scales on maps.
2
Averages
� How to work out the arithmetic mean, median and modalvalue (mode).
� How to work out weighted averages.
Algebra
� How to work out arithmetic problems that contain brackets.
� How to solve problems that contain two or more arithmeticsigns using the correct sequence of operations (‘BIDMAS’).
� How to work out simple formulae.
Decimal numbers
Sometimes the numbers you obtain from a calculation give ahigher level of accuracy than is required for a sensible answer. Forexample:
3.75 × 4.29 = 16.0875
To correct the answer to a given number of decimal places youshorten the number of decimal places (dp) so that is has 3, 2 or 1decimal places.
If the number to the right of the decimal place you are roundingto is 5 or above, then you increase the number in the decimalplace by 1; if it is less than 5 it remains the same. Examples are:
16.0875 to 3 dp =16.08816.0875 to 2 dp =16.0916.0875 to 1 dp =16.116.0875 to 0 dp = 160.069827 = 0.0698 to 4 dp (2 is less than 5, so the 8 remainsthe same)
34 How to pass the QTS numeracy skills test
0.069827 = 0.070 to 3 dp (the 8 is more than 5, so 9 becomes10)
Note that rounding a decimal to the nearest whole number is thesame as rounding to 0 decimal places. Examples are:
22.49 to the nearest whole number is 22.0 or 22 (round down)22.50 to the nearest whole number is 23.0 or 23 (round up)
The metric system of measurement (SI units)The most important metric measurements are weight, length andvolume. SI units (international system) are in most cases the sameas metric units, all being based on units of 10.
Weight
The basic unit of weight is the gram (g). All metric weights arebased on this. There are three weights you are likely to encounter:
Name Symbolkilogram kggram gmilligram mg
1 kg = 1000 g; 1 g = 1000 mg
Length
The basic unit of length is the metre (m). All metric lengths arebased on this. There are four lengths you may encounter:
Name Symbolkilometre kmmetre mcentimetre cmmillimetre mm
1 km = 1000 m; 1 m = 100 cm; 1 cm = 10 mm
General arithmetic 35
Volume of liquids and gases (capacity)
Quantities of liquids and gases are measured in litres (l) and milli-litres (ml) where 1 l = 1000 ml. You may also come across:
decilitre (dl) = one-tenth of a litre = 100 mlcentilitre (cl) = one-hundredth of a litre = 10 mlcubic centimetre (cc or cm3) = one-thousandth of a litre = 1 ml
Adding and subtracting metric units
When working out sums with metric units it is important that allthe numbers have the same units. For example:
add 5 cm to 2 m, ie:2 m + 5 cm = 2 m + 0.05 m = 2.05 m1 g + 25 mg = 1 g + 0.025 g = 1.025 g0.6 g – 500 mg = 600 mg – 500 mg = 100 mg or0.6g – 500 mg = 0.6g – 0.5g = 0.1g
Areas, borders, perimeters andvolumes
Areas
The metric units of area are square metre (m2), square centimetre(cm2) and square millimetre (mm2).
Area of a square of side length a = a × a = a2.
36 How to pass the QTS numeracy skills test
a
a
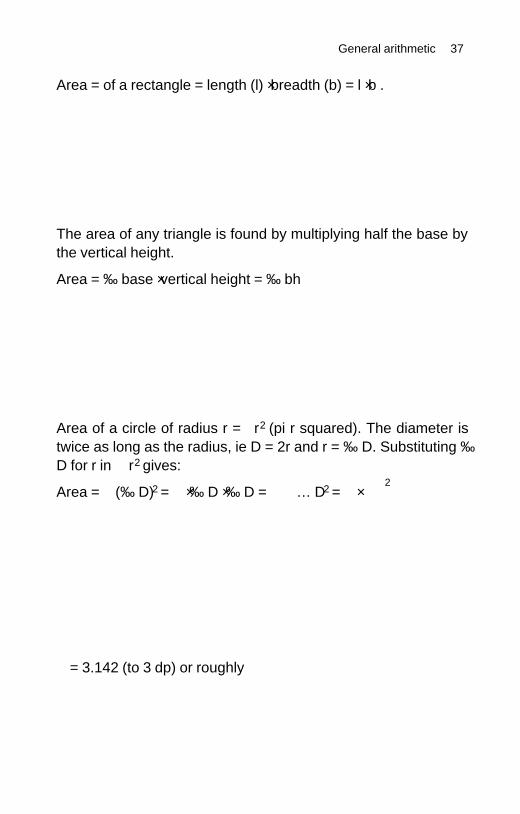
Area = of a rectangle = length (l) × breadth (b) = l × b .
The area of any triangle is found by multiplying half the base bythe vertical height.
Area = ½ base × vertical height = ½ bh
Area of a circle of radius r = �r2 (pi r squared). The diameter istwice as long as the radius, ie D = 2r and r = ½ D. Substituting ½D for r in �r2 gives:
Area = � (½ D)2 = � × ½ D × ½ D = � ¼ D2 = � × 2
� = 3.142 (to 3 dp) or roughly
General arithmetic 37
b
l
b
h
r
D
D4
227
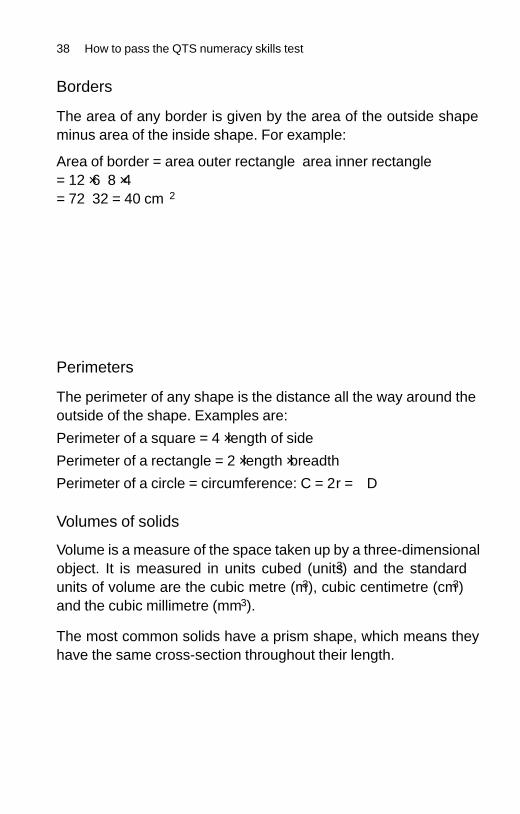
Borders
The area of any border is given by the area of the outside shapeminus area of the inside shape. For example:
Area of border = area outer rectangle – area inner rectangle= 12 × 6 – 8 × 4= 72 – 32 = 40 cm2
Perimeters
The perimeter of any shape is the distance all the way around theoutside of the shape. Examples are:
Perimeter of a square = 4 × length of side
Perimeter of a rectangle = 2 × length × breadth
Perimeter of a circle = circumference: C = 2�r = �D
Volumes of solids
Volume is a measure of the space taken up by a three-dimensionalobject. It is measured in units cubed (units3) and the standardunits of volume are the cubic metre (m3), cubic centimetre (cm3)and the cubic millimetre (mm3).
The most common solids have a prism shape, which means theyhave the same cross-section throughout their length.
38 How to pass the QTS numeracy skills test
6 cm
8 cm
12 cm
4 cm
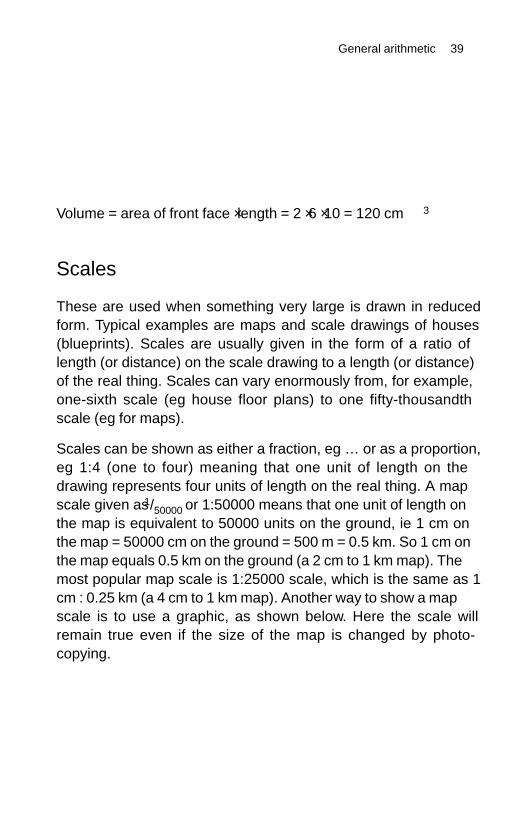
Volume = area of front face × length = 2 × 6 × 10 = 120 cm3
Scales
These are used when something very large is drawn in reducedform. Typical examples are maps and scale drawings of houses(blueprints). Scales are usually given in the form of a ratio oflength (or distance) on the scale drawing to a length (or distance)of the real thing. Scales can vary enormously from, for example,one-sixth scale (eg house floor plans) to one fifty-thousandthscale (eg for maps).
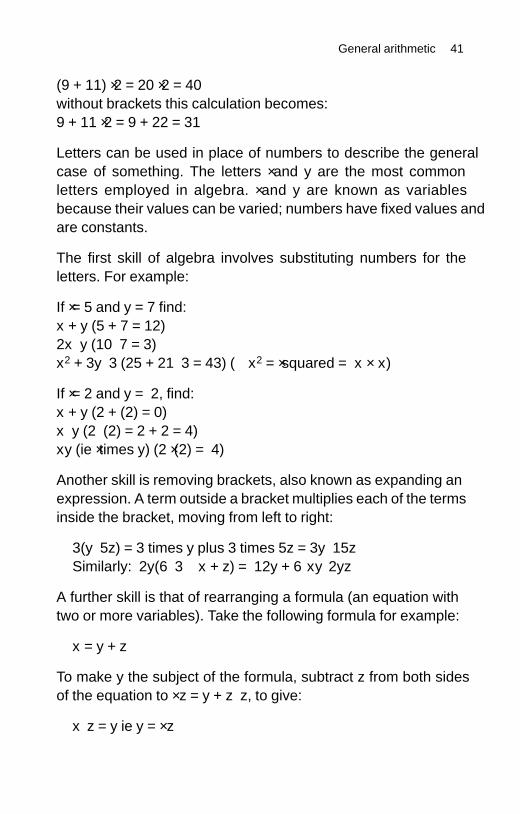
Scales can be shown as either a fraction, eg ¼ or as a proportion,eg 1:4 (one to four) meaning that one unit of length on thedrawing represents four units of length on the real thing. A mapscale given as 1/50000 or 1:50000 means that one unit of length onthe map is equivalent to 50000 units on the ground, ie 1 cm onthe map = 50000 cm on the ground = 500 m = 0.5 km. So 1 cm onthe map equals 0.5 km on the ground (a ‘2 cm to 1 km’ map). Themost popular map scale is 1:25000 scale, which is the same as 1cm : 0.25 km (a ‘4 cm to 1 km’ map). Another way to show a mapscale is to use a graphic, as shown below. Here the scale willremain true even if the size of the map is changed by photo-copying.
General arithmetic 39
10 cm
2 cm
6 cm
0km
1 2 3 4
Aspects of algebra
There are arithmetic rules for positively signed and negativelysigned numbers. The following examples explain the correctprocedures for combining signs:
12 – 3 = 9– 12 – 3 = –15– 12 + 3 = –9– 12 × 3 = –36– 12 × –3 = 3612 ÷ –3 = – 4– 12 ÷ 3 = – 4–12 ÷ –3 = 4– 12 × –3 × – 2 = –72– 12 × –3 × –2 × –2 = 144
Multiplication signs are omitted if brackets are used:(– 12)(– 3)(– 2) = –72, ie not (– 12) × (– 3) × (– 2) = – 72
BIDMAS
The order of working out problems is:
B = Brackets;I = Indices;D = Division;M = Multiplication;A = Addition;S = Subtraction
There is a definite order in which to work out a sum containingmore than one arithmetic sign. The rule is: brackets first followedby indices (powers) then division or multiplication and finallyaddition or subtraction. For example:
40 How to pass the QTS numeracy skills test
(9 + 11) × 2 = 20 × 2 = 40without brackets this calculation becomes:9 + 11 × 2 = 9 + 22 = 31
Letters can be used in place of numbers to describe the ‘generalcase’ of something. The letters × and y are the most commonletters employed in algebra. × and y are known as variablesbecause their values can be varied; numbers have fixed values andare constants.
The first skill of algebra involves substituting numbers for theletters. For example:
If × = 5 and y = 7 find:x + y (5 + 7 = 12)2x – y (10 – 7 = 3)x2 + 3y – 3 (25 + 21 – 3 = 43) (x2 = × squared = x × x)
If × = 2 and y = – 2, find:x + y (2 + (–2) = 0)x – y (2 – (–2) = 2 + 2 = 4)xy (ie × times y) (2 × (–2) = – 4)
Another skill is removing brackets, also known as ‘expanding’ anexpression. A ‘term’ outside a bracket multiplies each of the termsinside the bracket, moving from left to right:
3(y – 5z) = 3 times y plus 3 times –5z = 3y – 15zSimilarly: – 2y(6 – 3x + z) = – 12y + 6xy – 2yz
A further skill is that of rearranging a formula (an equation withtwo or more variables). Take the following formula for example:
x = y + z
To make y the subject of the formula, subtract z from both sidesof the equation to × – z = y + z – z, to give:
x – z = y ie y = × – z
General arithmetic 41
To make z the subject of the formula, subtract y from both sidesof the equation to leave z on its own:
x – y = y + z – y, gives:x – y = z ie z = × – y
Example: Find × if 3x + y = z (ie x is the subject of the formula)Method:
Step 1: subtract y from both sides3x + y – y = z – y3x = z – yStep 2: divide both sides of the equation by 3
Rearranging linear equations
Linear equations have letters with a power of one – there are nosquared terms. Examples of linear equations can be found inmathematics, science and everyday life. Typical examples are:
temperature conversion;speed, distance and time;ratio and proportion;maps and scales;VAT and income tax; andelectrical power.
Examples of linear equations and algebraic manipulation are:
calculate distance travelled (D) from speed (S) and time (T):D = ST (and T = D ÷ S; S = D ÷ T)
calculate power in Watts (W) from volts (V) and amps (A):W = VA (and V = W ÷ A; A = W ÷ V)
42 How to pass the QTS numeracy skills test
= so x =3x3
z – y3
z – y3
The following formula is more difficult to rearrange because itrequires more than one step. In the test you will only be requiredto insert values into a formula to arrive at the answer. However,your ability to find solutions to problems will increase if you canmove letters and numbers around easily from one side of anequation to the other.
To convert temperature from Fahrenheit to Celsius:
Trends
You may be asked to spot a trend in a data series, typically anincrease or decrease in a value with time; for example, schooladmissions over several years. In an arithmetic series there is acommon difference between the numbers that enables you topredict the next number in the series. Examples include:
General arithmetic 43
C + 32 to leave C on its own:rearrange F =
i) subtract 32 from both sides to give F – 32 = C + 0
95
95
ii) now multiply both sides by to give (F – 32) = × C59
59
59
95
(F – 32) = 1 × C, ie C =So (F – 32) to convert Celcius to
(F – 32)Fahrenheit: rearrange C = to leave F on its own:
i) multiply both sides by
ii) add 32 to both sides to give
(also F = 1.8C + 32 or F = (C + 40) × 1.8 – 40)
C + 32 = F, ie F = C + 32;
to give C = F – 32 in a single step
59
95
95
95
95
59
59
200 400 600 800 ___? (common difference = 200)300 350 400 450 ___? (common difference = 50)65 59 53 47 41 ___? (common difference = 6)7.8 6.1 4.4 2.7 __? (common difference = 1.7)
In another type of series the difference between consecutivenumbers increases (or decreases) with each change, for example:
1 2 4 7 11 16 22 __?+1 +2 +3 +4 +5 +6 +7
In a geometric series the ratio of consecutive number is constant,for example, the numbers double or half in value:
1 2 4 8 16 32 64 128 256 512 ___?(common ratio = 2)96 48 24 12 6 __? (common ratio = 0.50)20000 4000 800 160 32 __? (common ratio = 0.2)
AveragesYou might have a group of numbers (a data set) and wish to finda single number that best represents the group, ie a central value.The most common method is to calculate the arithmetic mean.
Mean
Add all the numbers together then divide the total by the numberof numbers. For example:
What is the mean height of the following group of pupils: 1.55 m,1.62 m, 1.57 m, l.65 m and 1.51m?
The mean is the sum total of the heights divided by five:
Alternatives to the mean are the median and mode.
44 How to pass the QTS numeracy skills test
1.55 + 1.62 + 1.57 + 1.65 + 1.515
= 7.9 m ÷ 5 = 1.58 m
Median
The median is the middle number in a group of numbers that havebeen placed in numerical order, from smallest to the largest. Fromthe previous example:
1st 2nd 3rd 4th 5th1.51 1.55 1.57 l.62 1.65
The median is given by the middle value, which in this case is thethird number, ie 1.57 m.
Here is another example. What is the median average of thefollowing numbers?
4.3 10 3 7.5 5 9 6.7 5
Step 1: rearrange in ascending order, repeating any numberswhere necessary:
3 4.3 5 5 6.7 7.5 9 10
There is an even number of numbers in this group and,therefore, no ‘middle value’ as such.
Step 2: to find the ‘middle value’ you work out the mean of thetwo middle numbers:
5 + 6.7 = 11.7 ÷ 2 = 5.85 = median of the group.
To locate the middle position of a large group of numbers (n), add1 and divide by 2, ie (n + 1) ÷ 2. For example:
You have 51 numbers. The middle position (median) is foundby adding 1 and dividing by 2: (51 +1) ÷ 2 = 26th number.You have 50 numbers. The middle position is found by adding1 and dividing by 2: (50 +1) ÷ 2 = 25.5 so you have to averagethe 25th and 26th numbers to find the median.
Mode
The mode is the value that occurs most often.
General arithmetic 45
For example in this group of numbers – 3 4 7 3 4 5 3 9 8 6 3 – themode (modal value) is 3 because it occurs most frequently – fourtimes. If two values are equally popular then the group is said tobe ‘bi-modal’. For example, in the group 5 5 7 8 3 7 4 1 2, themodal values are 5 and 7.
If more than two numbers occur equally most frequently in agroup then the mode would not be used as a way of expressingthe average value.
Range
The range measures the spread of the data, ie the maximum valueminus the minimum value. For example:
5 5 7 8 3 7 4 1 2 – range = 8 – 1 = 7
Weighted average
In a weighted average test, some scores count more than otherstowards the overall result. Weighted averages are used incoursework and in university degree classification. Examples ofdegree course weighting are:
1:3:5 first year = 1/9; second year = 3/9; final year = 5/9 1:3 second year = 25%; final year = 75%1:2 second year = 0.33; final year = 0.67
The weighted average is calculated as follows:
i) convert each mark or score to its percentage (eg 16 correctanswers out of 20 marks = 80%);
ii) multiply each percentage mark by its weight (expressed aseither a fraction, percentage or decimal);
iii) sum the results, giving your answer a percentage.
46 How to pass the QTS numeracy skills test
The following equations show you how to work out the weightedaverage of the three examples given above:
1:3:5 Overall mark = (1 × Yr1 % + 3 × Yr2 % + 5 × Yr3%) ÷ 91:3 Overall mark = Yr2 % × 25% + Yr3 × 75%1:2 Overall mark = Yr 2 × 0.33 + Yr3 × 0.67
If you are not given an equation then you need to multiply eachpercentage mark by its percentage weight and add the resultstogether. For example:
A student scores 16 out of 20 in Test 1 and 32 out of 50 in Test2. If the tests are weighted 25% for Test 1 and 75% for Test 2,what is the overall percentage?
Step i) 16/20 = 80%; 32/50 = 64%Step ii) 80 × 25% = 20; 64 × 75% = 48Step iii) 20 + 48 = 68%
General arithmetic 47
48
THIS PAGE HAS INTENTIONALLY BEEN LEFT BLANK
49
Statistics
Maths audit 3For the statistical questions you need to know the following:
� Pie charts: how to read data from a pie chart (multiply thetotal by the fraction shown).
� Bar charts: how to read data off a bar chart (read across tothe vertical axis from the top of each bar).
� Line graphs: how to read data points on a line graph (readvalues off the horizontal and vertical axes).
� Histograms: how to read histograms created from tally chartsand frequency tables.
� Cumulative frequency graphs: how to find the median, theupper quartile, the lower quartile; how many were below agiven mark and how many were above a given grade.
� Box and whisker plots: how to use a box and whisker plot toidentify six key pieces of information.
� Tables: how to locate information in tables and how to readtwo-way tables.
3
Most of the QTS numeracy questions in the ‘on-screen’ sectioninvolve charts, graphs or tables; they provide a simple and efficient way of displaying school data. You can expect to see a few easy questions, or ‘one-liners’ where the answer can beread directly from a chart or table. However, the majority of the answers require a careful interpretation of the question tolocate the data, followed by the application of mathematicaloperations.
You are not expected to solve every problem in your head, inwhich case you will find it helpful to jot down a few numbers asyou go along. If you need to use a calculator it is useful to have arough idea of the size of the answer first. This book will not teachyou how or when to use a calculator; you are expected to be ableto key in the appropriate figures. Thus to work out 20% of160,000 (see Figure 3.3) you would enter: 20 ÷ 100 × 160000 =.Alternatively you could short-cut this to 0.2 × 160000 or go onestep further and work it out mentally as 2 × 16000.
Pie chartsThese charts are not the most accurate way of displaying data butthey do show at a glance the relative sizes of component parts. Afull circle (360o) represents 100 percent of the data, so 180o =one-half (50%), 120o = one-third (33.3%) and 90o = one-quarter(25%), etc. Reading information from pie charts is easy butmarks are lost when the candidate fails to look at the text in a keyor sub-heading.
Now attempt the single-step questions associated with the twopie charts in Figures 3.1 and 3.2, for which a calculator is notrequired. You will need to use a calculator to answer some of thequestions based on the single pie chart in Figure 3.3.
50 How to pass the QTS numeracy skills test
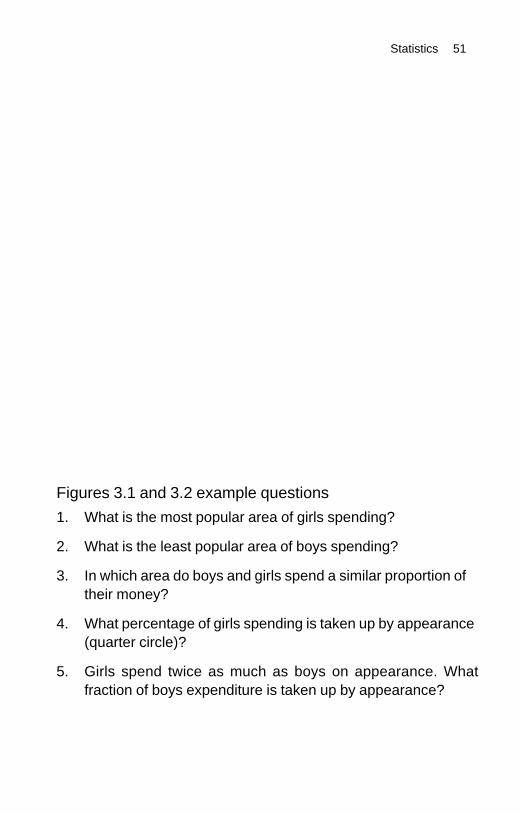
Figures 3.1 and 3.2 example questions1. What is the most popular area of girls’ spending?
2. What is the least popular area of boys’ spending?
3. In which area do boys and girls spend a similar proportion oftheir money?
4. What percentage of girls’ spending is taken up by appearance(quarter circle)?
5. Girls spend twice as much as boys on appearance. Whatfraction of boys’ expenditure is taken up by appearance?
Statistics 51
Boys
Entertainment
Other
Food
Appearance
Figure 3.1 Distribution of boys’ expenditure aged 7 to 15
Figure 3.2 Distribution of girls’ expenditure aged 7 to 15
Girls
Entertainment
Other
Food
Appearance
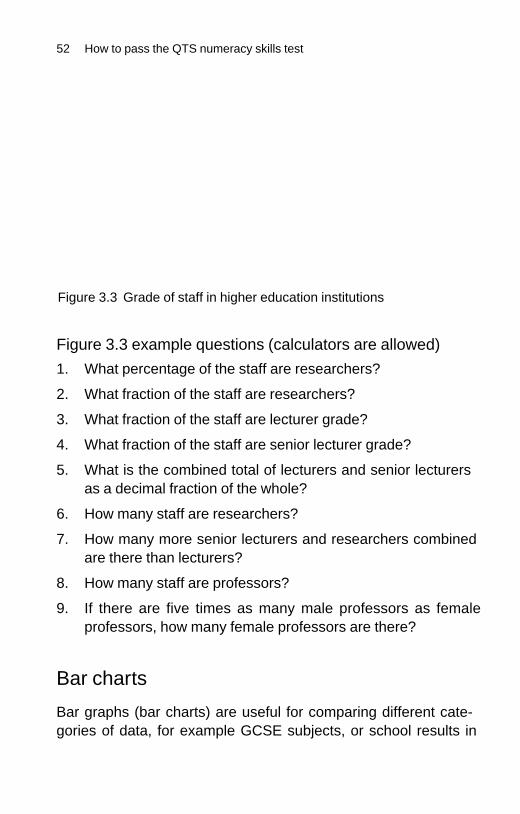
Figure 3.3 example questions (calculators are allowed)1. What percentage of the staff are researchers?
2. What fraction of the staff are researchers?
3. What fraction of the staff are lecturer grade?
4. What fraction of the staff are senior lecturer grade?
5. What is the combined total of lecturers and senior lecturersas a decimal fraction of the whole?
6. How many staff are researchers?
7. How many more senior lecturers and researchers combinedare there than lecturers?
8. How many staff are professors?
9. If there are five times as many male professors as femaleprofessors, how many female professors are there?
Bar chartsBar graphs (bar charts) are useful for comparing different cate-gories of data, for example GCSE subjects, or school results in
52 How to pass the QTS numeracy skills test
Figure 3.3 Grade of staff in higher education institutions
Others20%
Professor9%
Senior Lecturer16%
Lecturer35%
Researcher20%
Total: 160,000
different years. The bars can be drawn vertically or horizontally.The height (or length) of each bar is read off the scale on the axisand corresponds to the size of the data.
The bar graph in Figure 3.4 shows a school’s seven most popularGCSE subjects.
Figure 3.4 example questions1. Which subject is the most popular?
2. Which subject is the fifth most popular?
3. Which subject is three times more popular than History?
4. Which subject is two-thirds as popular as Science double?
5. What proportion of the total is taken up by EnglishLiterature? Give your answer as a fraction in its lowest termsand also as a decimal.
Statistics 53
0
2
4
Per
cent
age
of th
e to
tal
6
8
10
12
14
English EnglishLit.
French Design
GCSE subject
History Sciencedouble
Maths
Figure 3.4 School subject by popularity
6. What proportion of the total is taken up by English andMaths together? Give your answer as a fraction in its lowestterms.
7. What is the ratio of pupils taking English Literature to pupilstaking English? Give your answer in its lowest terms.
8. If 180 pupils take English, how many take EnglishLiterature?
9. What percentage of the total is taken up by all sevensubjects?
10. What decimal fraction of the total is taken up by subjectsother than those shown in the chart?
The bar chart in Figure 3.5 shows the percentage of pupilsachieving grades A* to C in five popular subjects.
54 How to pass the QTS numeracy skills test
French
History
Science
English
Maths
0 20 40
Percentage of pupils achieving grades A*–C
60 80 100
Figure 3.5 Bar chart of grades achieved in five subjects
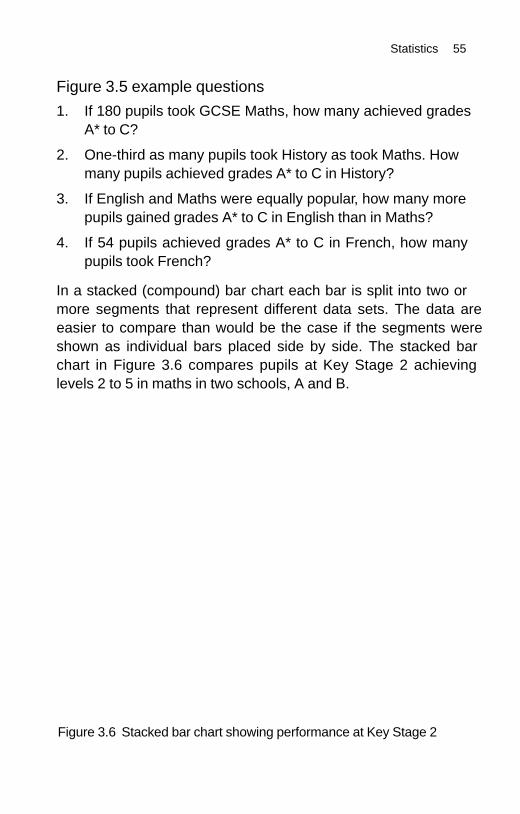
Figure 3.5 example questions1. If 180 pupils took GCSE Maths, how many achieved grades
A* to C?
2. One-third as many pupils took History as took Maths. Howmany pupils achieved grades A* to C in History?
3. If English and Maths were equally popular, how many morepupils gained grades A* to C in English than in Maths?
4. If 54 pupils achieved grades A* to C in French, how manypupils took French?
In a stacked (compound) bar chart each bar is split into two ormore segments that represent different data sets. The data areeasier to compare than would be the case if the segments wereshown as individual bars placed side by side. The stacked barchart in Figure 3.6 compares pupils at Key Stage 2 achievinglevels 2 to 5 in maths in two schools, A and B.
Statistics 55
Figure 3.6 Stacked bar chart showing performance at Key Stage 2
0
10
20
30
40
50
60
70
80
90
100
2 3
Key Stage 2 level
Num
ber
of p
upils
ach
ievi
ng le
vel
4 5
A B
Figure 3.6 example questions1. At which level did school A outperform school B?
2. The graph shows that the number of pupils achieving level 2at school B was three times that of school A (3:1 ratio). Whatwas the B:A ratio for pupils achieving level 3?
Line graphs
With these graphs the data are plotted as a series of points joinedby a line. Figure 3.7 shows a travel graph where the distance trav-elled in miles is plotted against the time in hours. The controllingquantity (time) is plotted on the x-axis and the quantity itcontrols (distance travelled) is plotted on the y-axis. The datatable for the graph is shown in Table 3.1.
56 How to pass the QTS numeracy skills test
0
20
40
60
80
100
120
140
160
0 1 2 3 4
Time (hours)
Dis
tanc
e (m
iles)
Figure 3.7 Distance-time graph for a school coach
Table 3.1 Distance-time data table for a school coach
Time (hours) 0 0.5 1.0 1.5 2.0 2.5 3.0 3.5
Dist. (miles) 0 20 40 60 60 90 120 140
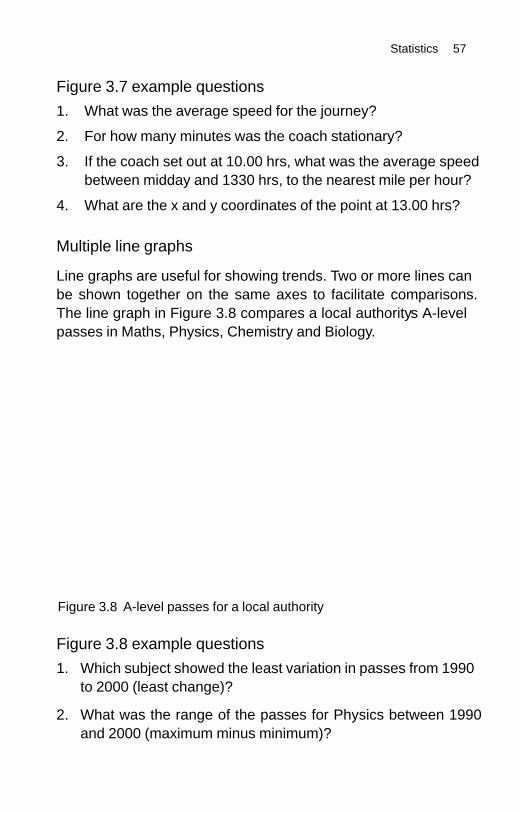
Figure 3.7 example questions1. What was the average speed for the journey?
2. For how many minutes was the coach stationary?
3. If the coach set out at 10.00 hrs, what was the average speedbetween midday and 1330 hrs, to the nearest mile per hour?
4. What are the x and y coordinates of the point at 13.00 hrs?
Multiple line graphs
Line graphs are useful for showing trends. Two or more lines canbe shown together on the same axes to facilitate comparisons.The line graph in Figure 3.8 compares a local authority’s A-levelpasses in Maths, Physics, Chemistry and Biology.
Figure 3.8 example questions1. Which subject showed the least variation in passes from 1990
to 2000 (least change)?
2. What was the range of the passes for Physics between 1990and 2000 (maximum minus minimum)?
Statistics 57
Figure 3.8 A-level passes for a local authority
200
300
400
500
600
700
1990 91 92 93 94 95 96 97 98 99 2000
Year
A-le
vel p
asse
s
Maths
Chemistry
Physics
Biology
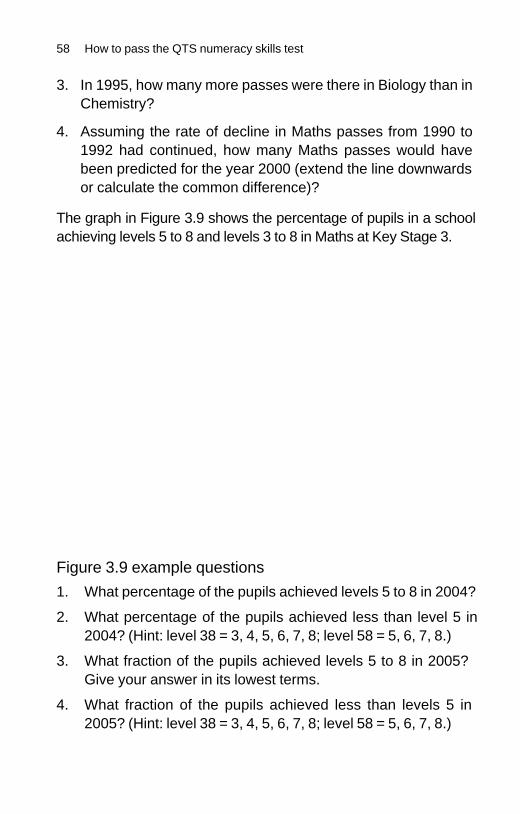
3. In 1995, how many more passes were there in Biology than inChemistry?
4. Assuming the rate of decline in Maths passes from 1990 to1992 had continued, how many Maths passes would havebeen predicted for the year 2000 (extend the line downwardsor calculate the common difference)?
The graph in Figure 3.9 shows the percentage of pupils in a schoolachieving levels 5 to 8 and levels 3 to 8 in Maths at Key Stage 3.
Figure 3.9 example questions1. What percentage of the pupils achieved levels 5 to 8 in 2004?
2. What percentage of the pupils achieved less than level 5 in2004? (Hint: level 3–8 = 3, 4, 5, 6, 7, 8; level 5–8 = 5, 6, 7, 8.)
3. What fraction of the pupils achieved levels 5 to 8 in 2005?Give your answer in its lowest terms.
4. What fraction of the pupils achieved less than levels 5 in2005? (Hint: level 3–8 = 3, 4, 5, 6, 7, 8; level 5–8 = 5, 6, 7, 8.)
58 How to pass the QTS numeracy skills test
200
20
30
40
50
60
70
80
90
100
2004 2005 2006 2007 2008
Year
Per
cent
age
of p
upils
ach
ievi
ng g
rade levels 3–8
levels 5–8
Figure 3.9 Pupil achievement at Key Stage 3 maths
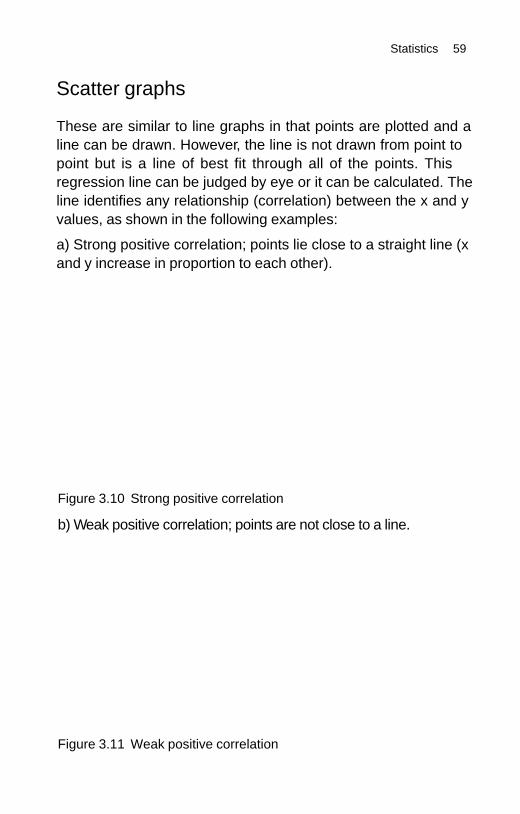
Scatter graphs
These are similar to line graphs in that points are plotted and aline can be drawn. However, the line is not drawn from point topoint but is a ‘line of best fit’ through all of the points. This‘regression line’ can be judged by eye or it can be calculated. Theline identifies any relationship (correlation) between the x and yvalues, as shown in the following examples:
a) Strong positive correlation; points lie close to a straight line (xand y increase in proportion to each other).
Statistics 59
Figure 3.10 Strong positive correlation
b) Weak positive correlation; points are not close to a line.
Figure 3.11 Weak positive correlation
010
20304050
60
7080
90100
0 10 20 30 40 50 60 70 80 90 100
010
203040506070
80
90
100
0 10 20 30 40 50 60 70 80 90 100
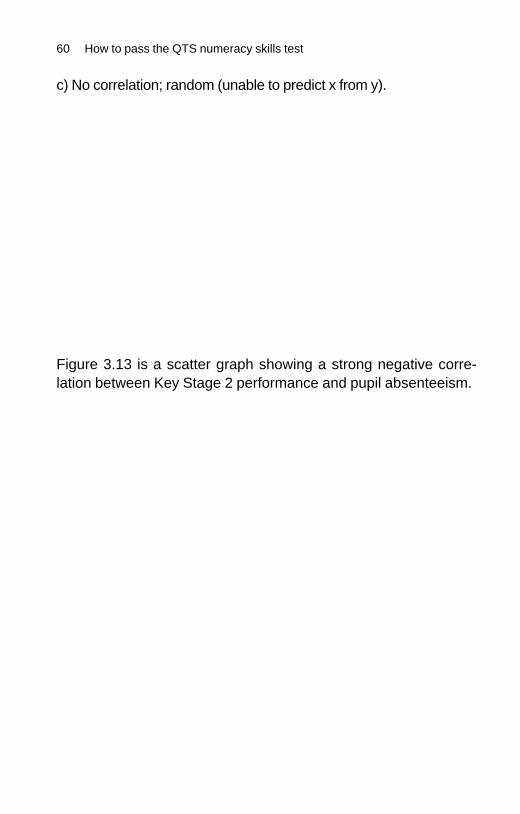
c) No correlation; random (unable to predict x from y).
Figure 3.13 is a scatter graph showing a strong negative corre-lation between Key Stage 2 performance and pupil absenteeism.
60 How to pass the QTS numeracy skills test
0
10
20
30
40
50
60
70
80
90
100
0 10 20 30 40 50 60 70 80 90 100
Figure 3.12 No correlation
Figure 3.13 Strong negative correlation
20
30
40
50
60
70
80
90
100
5 6 7 8 9
Days of absence
better than expected
worse than expected
Per
cent
age
achi
evin
g le
vel 4
+
10 11 12 13 14
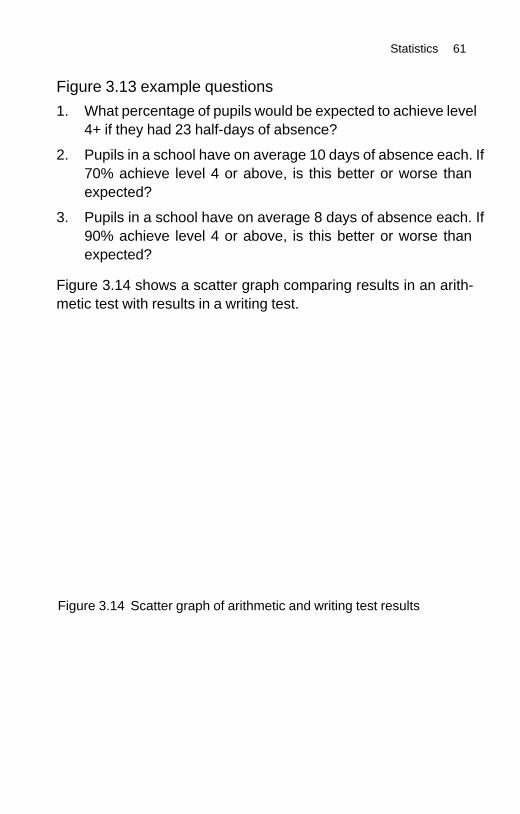
Figure 3.13 example questions1. What percentage of pupils would be expected to achieve level
4+ if they had 23 half-days of absence?
2. Pupils in a school have on average 10 days of absence each. If70% achieve level 4 or above, is this better or worse thanexpected?
3. Pupils in a school have on average 8 days of absence each. If90% achieve level 4 or above, is this better or worse thanexpected?
Figure 3.14 shows a scatter graph comparing results in an arith-metic test with results in a writing test.
Statistics 61
Figure 3.14 Scatter graph of arithmetic and writing test results
0
2
4
6
8
10
12
14
16
18
20
0 1 2 3 4
Writing test results (marks)
Arit
hmet
ic te
st r
esul
ts (
mar
ks)
5 6 7 8 9 10 11 12 13 14 15 16 17 1819 20
F
J
K N
R SU
TP
I
MEA
B
H
G
OC
D
L
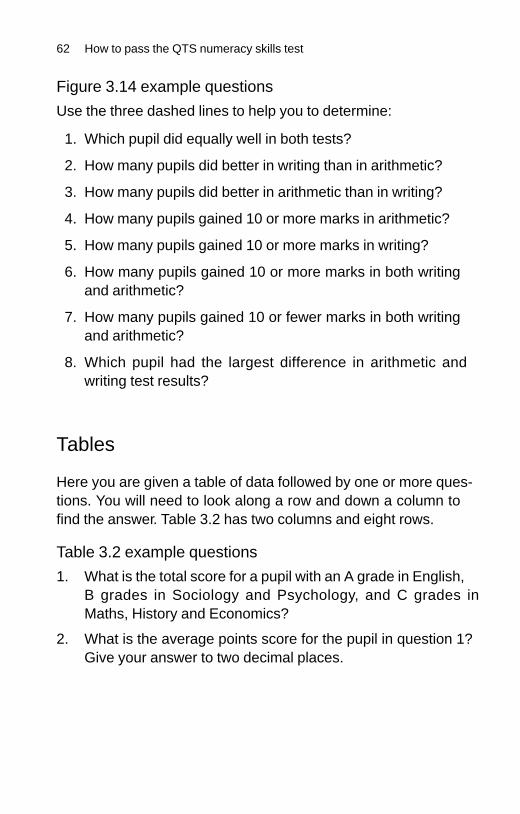
Figure 3.14 example questionsUse the three dashed lines to help you to determine:
1. Which pupil did equally well in both tests?
2. How many pupils did better in writing than in arithmetic?
3. How many pupils did better in arithmetic than in writing?
4. How many pupils gained 10 or more marks in arithmetic?
5. How many pupils gained 10 or more marks in writing?
6. How many pupils gained 10 or more marks in both writingand arithmetic?
7. How many pupils gained 10 or fewer marks in both writingand arithmetic?
8. Which pupil had the largest difference in arithmetic andwriting test results?
Tables
Here you are given a table of data followed by one or more ques-tions. You will need to look along a row and down a column tofind the answer. Table 3.2 has two columns and eight rows.
Table 3.2 example questions1. What is the total score for a pupil with an A grade in English,
B grades in Sociology and Psychology, and C grades inMaths, History and Economics?
2. What is the average points score for the pupil in question 1?Give your answer to two decimal places.
62 How to pass the QTS numeracy skills test
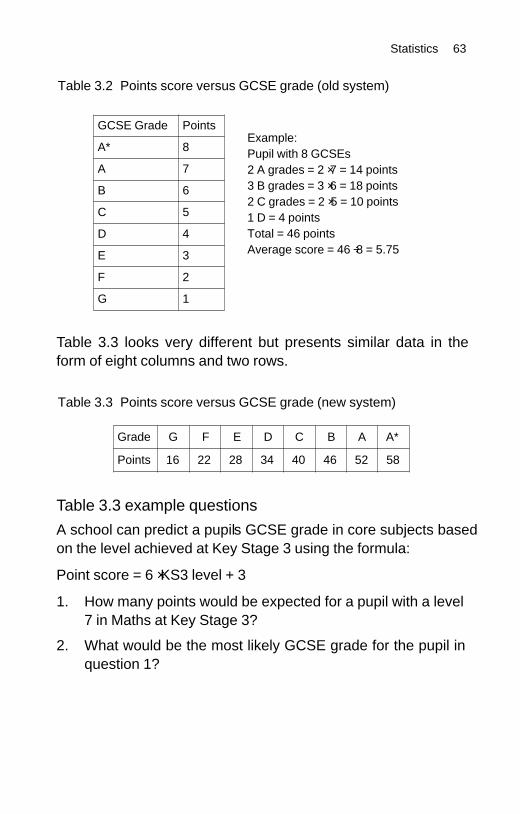
Table 3.3 looks very different but presents similar data in theform of eight columns and two rows.
Table 3.3 example questionsA school can predict a pupil’s GCSE grade in core subjects basedon the level achieved at Key Stage 3 using the formula:
Point score = 6 × KS3 level + 3
1. How many points would be expected for a pupil with a level7 in Maths at Key Stage 3?
2. What would be the most likely GCSE grade for the pupil inquestion 1?
Statistics 63
Grade G F E D C B A A*
Points 16 22 28 34 40 46 52 58
Table 3.3 Points score versus GCSE grade (new system)
Example:Pupil with 8 GCSEs2 A grades = 2 × 7 = 14 points3 B grades = 3 × 6 = 18 points2 C grades = 2 × 5 = 10 points1 D = 4 pointsTotal = 46 pointsAverage score = 46 ÷ 8 = 5.75
GCSE Grade Points
A* 8
A 7
B 6
C 5
D 4
E 3
F 2
G 1
Table 3.2 Points score versus GCSE grade (old system)
3. A pupil gains a level 5 in English at Key Stage 3. What GCSEgrade would be predicted?
4. A pupil is awarded GCSE grade B in Science. What levelwould you have expected at Key Stage 3?
5. A pupil gained level 7 in English and Science and level 6 inMaths. What were the pupil’s average points?
6. What are the total points for a pupil achieving level 7 in eightsubjects?
7. What are the average points for a pupil with two Bs, four Csand two Ds?
8. A pupil has a total of 8 GCSEs, including five Cs and two Bs.If the points totalled 314, what was the other grade?
Two-way tables
These are useful for comparing pupil performance in two subjects(or in two different years). One subject occupies the columns andthe other subject occupies the rows. The cells show the number oftimes the subjects are paired at each grade or level; all the combi-nations possible can be recorded. The table may also include thetotal number (summation) of the combinations across each rowand column.
Table 3.4 compares the GCSE results of pupils who took bothFrench (vertical column) and Spanish (horizontal row). Where acell is empty the number of pupils obtaining that combination ofgrades is zero.
64 How to pass the QTS numeracy skills test
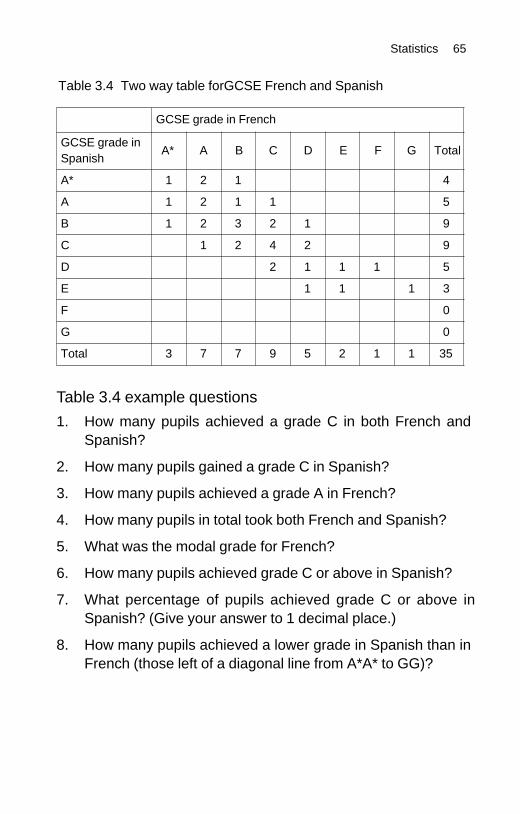
Table 3.4 example questions1. How many pupils achieved a grade C in both French and
Spanish?
2. How many pupils gained a grade C in Spanish?
3. How many pupils achieved a grade A in French?
4. How many pupils in total took both French and Spanish?
5. What was the modal grade for French?
6. How many pupils achieved grade C or above in Spanish?
7. What percentage of pupils achieved grade C or above inSpanish? (Give your answer to 1 decimal place.)
8. How many pupils achieved a lower grade in Spanish than inFrench (those left of a diagonal line from A*A* to GG)?
Statistics 65
GCSE grade in French
GCSE grade inSpanish
A* A B C D E F G Total
A* 1 2 1 4
A 1 2 1 1 5
B 1 2 3 2 1 9
C 1 2 4 2 9
D 2 1 1 1 5
E 1 1 1 3
F 0
G 0
Total 3 7 7 9 5 2 1 1 35
Table 3.4 Two way table forGCSE French and Spanish
Tally charts, frequency tables andhistogramsA tally chart is used to group and count data. The results arepresented in a frequency table, and a frequency histogram (a barchart of frequency distributions) is drawn. The histogramprovides a mental picture of the spread of the marks with themost frequent marks normally centred on the middle. Forexample, 51 pupils achieved the following GCSE grades:
B C D E A B D C B A C C D C A* C E B A C B D C B C E D F DB C D B C D C F E C D B C D C D B C D C C B
The tally chart, frequency table and histogram are shown inFigure 3.15.
66 How to pass the QTS numeracy skills test
A*
A
B
C
D
E
F
Frequency table
HistogramGCSE grade distribution
GCSE gradeF
0
5
10
15
20
E D C B A A*
Num
ber
of p
upils
Grade
Frequency
F
2
E
4
D
12
C
18
B
11
A
3
A*
1
1
3
11
18
12
4
2
Figure 3.15 Tally chart, frequency table and histogram
Tally chart
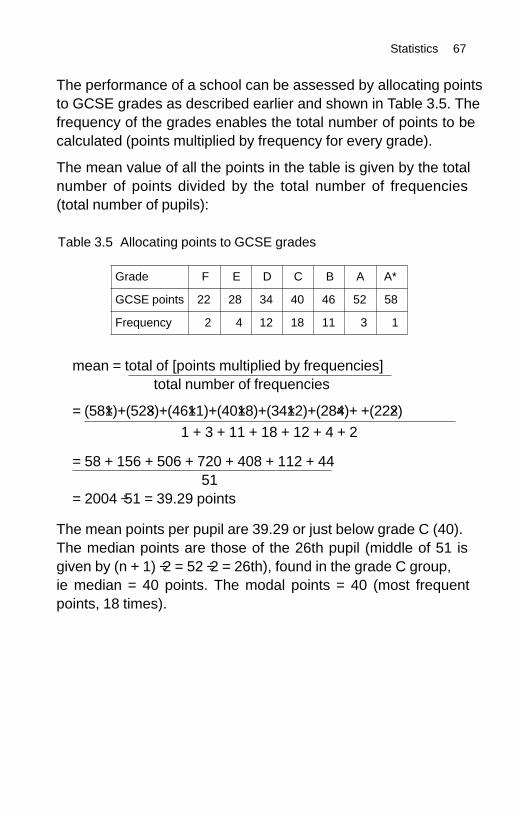
The performance of a school can be assessed by allocating pointsto GCSE grades as described earlier and shown in Table 3.5. Thefrequency of the grades enables the total number of points to becalculated (points multiplied by frequency for every grade).
The mean value of all the points in the table is given by the totalnumber of points divided by the total number of frequencies(total number of pupils):
mean = ‘total of’ [points multiplied by frequencies]‘total number of frequencies’
= (58×1)+(52×3)+(46×11)+(40×18)+(34×12)+(28×4)+ +(22×2)1 + 3 + 11 + 18 + 12 + 4 + 2
= 58 + 156 + 506 + 720 + 408 + 112 + 4451
= 2004 ÷ 51 = 39.29 points
The mean points per pupil are 39.29 or just below grade C (40).The median points are those of the 26th pupil (middle of 51 isgiven by (n + 1) ÷ 2 = 52 ÷ 2 = 26th), found in the grade C group,ie median = 40 points. The modal points = 40 (most frequentpoints, 18 times).
Statistics 67
Table 3.5 Allocating points to GCSE grades
Grade F E D C B A A*
GCSE points 22 28 34 40 46 52 58
Frequency 2 4 12 18 11 3 1
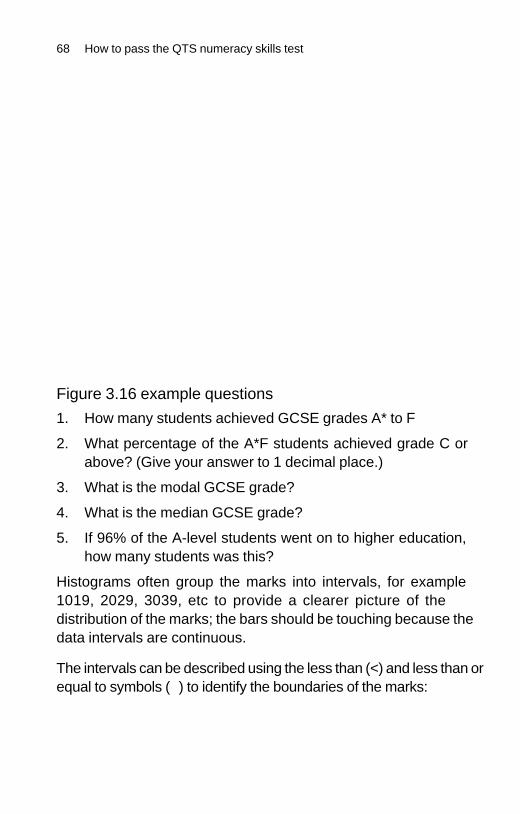
Figure 3.16 example questions1. How many students achieved GCSE grades A* to F
2. What percentage of the A*–F students achieved grade C orabove? (Give your answer to 1 decimal place.)
3. What is the modal GCSE grade?
4. What is the median GCSE grade?
5. If 96% of the A-level students went on to higher education,how many students was this?
Histograms often group the marks into intervals, for example10–19, 20–29, 30–39, etc to provide a clearer picture of thedistribution of the marks; the bars should be touching because thedata intervals are continuous.
The intervals can be described using the less than (<) and less than orequal to symbols (�) to identify the boundaries of the marks:
68 How to pass the QTS numeracy skills test
GCSE grade
F0
10
20
30
40
50
60
E D C B A A*
Num
ber
of A
-leve
l stu
dent
s
15
11
26
39
52
16
Figure 3.16 Histogram of GCSE grades for A-level students
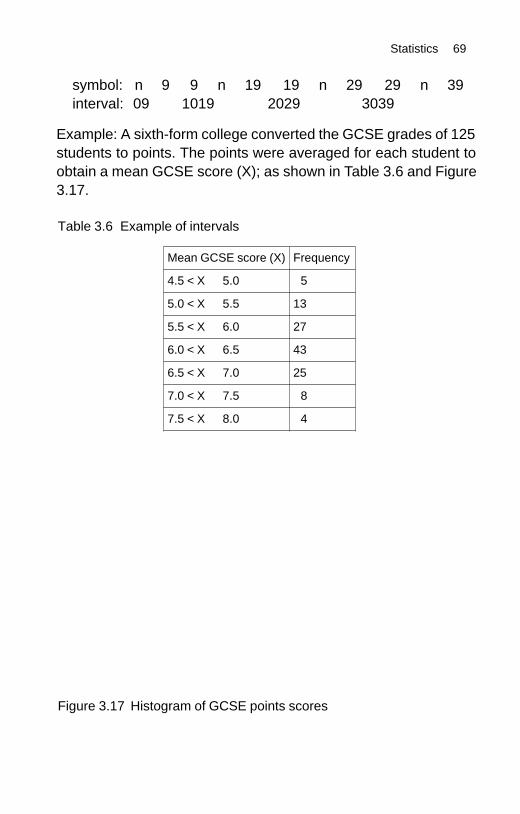
symbol: n � 9 9 � n � 19 19 � n � 29 29 � n � 39interval: 0–9 10–19 20–29 30–39
Example: A sixth-form college converted the GCSE grades of 125students to points. The points were averaged for each student toobtain a mean GCSE score (X); as shown in Table 3.6 and Figure3.17.
Statistics 69
Mean GCSE score (X) Frequency
4.5 < X � 5.0 5
5.0 < X � 5.5 13
5.5 < X � 6.0 27
6.0 < X � 6.5 43
6.5 < X � 7.0 25
7.0 < X � 7.5 8
7.5 < X � 8.0 4
Table 3.6 Example of intervals
Figure 3.17 Histogram of GCSE points scores
GCSE points
4.6–5.0
5.1–5.5
5.6–6.0
6.1–6.5
6.6–7.0
7.1–7.5
7.6–8.0
0
5
10
15
20
25
30
35
40
45
50
Freq
uenc
y
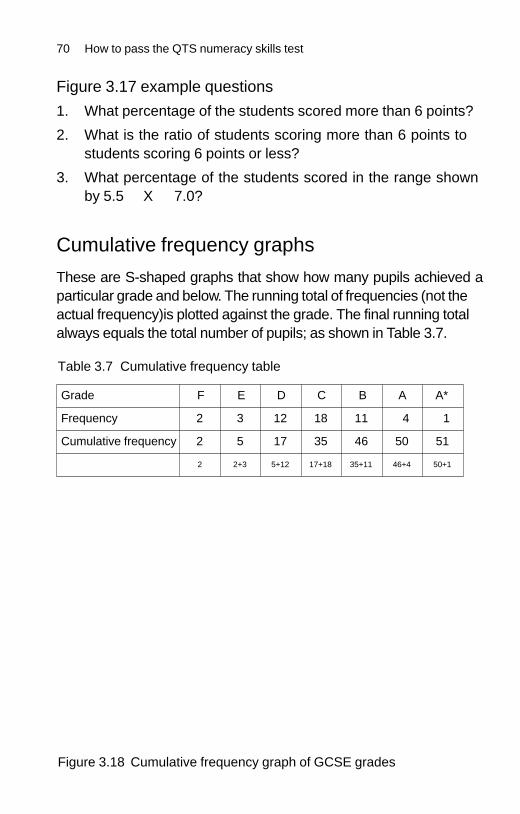
Figure 3.17 example questions1. What percentage of the students scored more than 6 points?
2. What is the ratio of students scoring more than 6 points tostudents scoring 6 points or less?
3. What percentage of the students scored in the range shownby 5.5 � X � 7.0?
Cumulative frequency graphsThese are S-shaped graphs that show how many pupils achieved aparticular grade and below. The running total of frequencies (not theactual frequency)is plotted against the grade. The final running totalalways equals the total number of pupils; as shown in Table 3.7.
70 How to pass the QTS numeracy skills test
Grade F E D C B A A*
Frequency 2 3 12 18 11 4 1
Cumulative frequency 2 5 17 35 46 50 51
2 2+3 5+12 17+18 35+11 46+4 50+1
Table 3.7 Cumulative frequency table
Figure 3.18 Cumulative frequency graph of GCSE grades
GCSE grade
F E D C B A A*0
10
20
30
40
50
60
Cum
ulat
ive
freq
uenc
y
Figure 3.18 example questionsHow many pupils achieved:
1. Grade C and below (ie up to grade C)?
2. Grade B and below (ie up to grade B)?
3. Grade A and below (ie up to grade A)?
There were 51 pupils in total. Refer to your answers in 1, 2 and 3respectively to answer questions 4, 5 and 6.
How many pupils achieved:
4. Grade B and above?
5. Grade A and above?
6. Grade A*?
7. Grade C or above? (Hint: 51 minus grade D and below; orread from the table 18 + 11 + 4 + 1.)
8. Grade D or above?
9. What fraction of the pupils achieved grade C or above?
10. What percentage of the pupils achieved grade D or above?(Give your answer to 1 decimal place.)
11. What proportion of the pupils achieved grade B and above?(Give your answer to 1 decimal place.)
In the cumulative frequency graph in Figure 3.19 the GCSEgrades have been converted to points, as shown in Table 3.8.
Statistics 71
Table 3.8 Cumulative frequency table
Grade F E D C B A A*
GCSE points 22 28 34 40 46 52 58
Frequency 1 2 9 26 42 60 20
Cumulative frequency 1 3 12 38 80 140 160
The median is the point’s score of the middle student (80th)located half way up the cumulative frequency axis.
Figure 3.19 example questions1. What is the highest GCSE point score?
2. What is the lowest GCSE points score?
3. What is the range of the GCSE points scores?
4. What is the median GCSE points score?
5. How many students achieved 52 points and below?
6. How many students achieved more than 52 points?
7. How many students achieved more than 34 points? (Readthe y-axis scale carefully.)
One-hundred students took a QTS numeracy test. The cumu-lative frequency graph in Figure 3.20 shows the percentage ofpupils achieving a given mark or less.
72 How to pass the QTS numeracy skills test
Figure 3.19 Cumulative frequency graph of GCSE points (2)
GCSE points
22 28 34 40 46 52 580
20
40
60
80
100
120
140
160
Cum
ulat
ive
freq
uenc
y
Figure 3.20 example questions1. The median mark can be read from the 50th percentile*
(50% cumulative frequency). What mark does this corre-spond to?
2. Which mark did 70% of the students fall below?
3. Which mark did 12% of the students fall below?
4. How many students achieved 16 marks or lower?
5. The pass mark is 17 out of 28. How many students passed?
* Percentiles: dividing the data (marks) into 100 equal parts.
Box and whisker plots
These plots provide a method of visualizing several key pieces ofstatistical information including the maximum and minimumvalues, the median and the spread (distribution) of the values.
Statistics 73
Mark
6 8 10 12 14 16 18 20 22 24 26 280
10
20
30
40
50
60
70
80
90
100C
umul
ativ
e fr
eque
ncy
%
Figure 3.20 QTS cumulative frequency graph
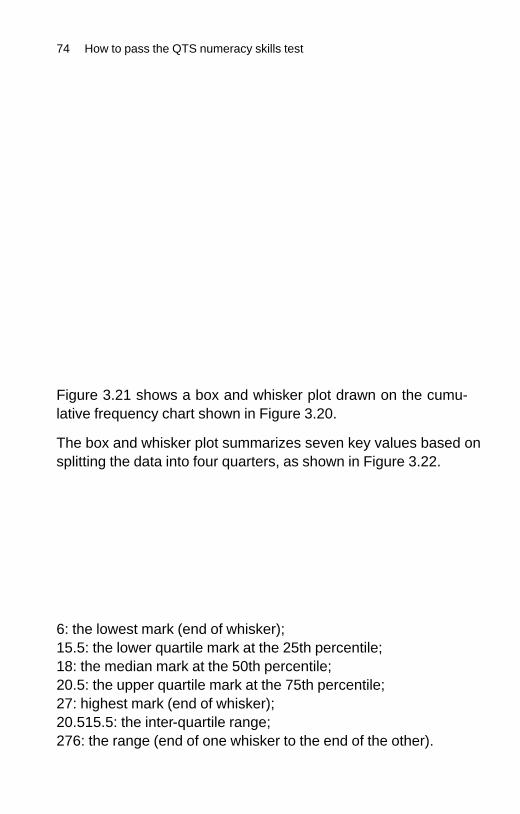
Figure 3.21 shows a box and whisker plot drawn on the cumu-lative frequency chart shown in Figure 3.20.
The box and whisker plot summarizes seven key values based onsplitting the data into four quarters, as shown in Figure 3.22.
6: the lowest mark (end of whisker);15.5: the lower quartile mark at the 25th percentile;18: the median mark at the 50th percentile;20.5: the upper quartile mark at the 75th percentile;27: highest mark (end of whisker);20.5–15.5: the inter-quartile range;27–6: the range (end of one whisker to the end of the other).
74 How to pass the QTS numeracy skills test
6 15.5
1st2nd 3rd
4th
18 20.5 27
Figure 3.22 Splitting the data into four quarters
Figure 3.21 A box and whisker plot
Mark
64 8 10 12 14 16 18 20 22 24 26 280
10
20
30
40
50
60
70
80
90
100C
umul
ativ
e fr
eque
ncy
%
¾ way up
½ way up
¼ way up
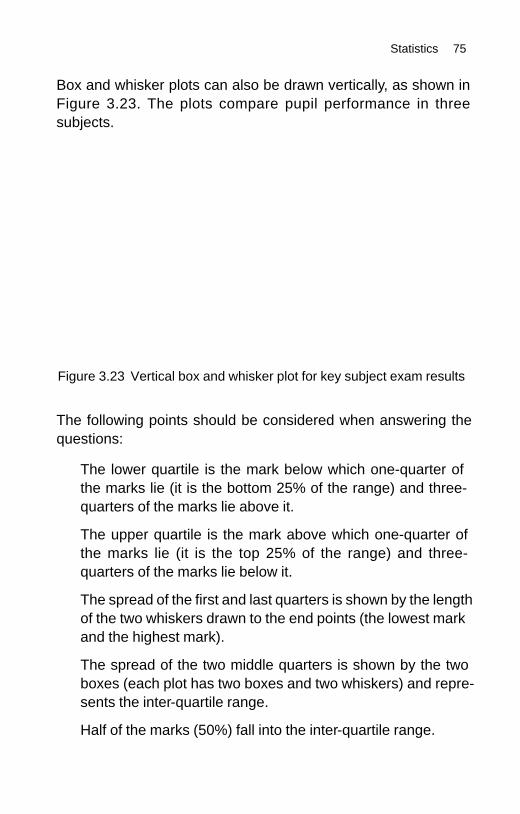
Box and whisker plots can also be drawn vertically, as shown inFigure 3.23. The plots compare pupil performance in threesubjects.
The following points should be considered when answering thequestions:
� The lower quartile is the mark below which one-quarter ofthe marks lie (it is the bottom 25% of the range) and three-quarters of the marks lie above it.
� The upper quartile is the mark above which one-quarter ofthe marks lie (it is the top 25% of the range) and three-quarters of the marks lie below it.
� The spread of the first and last quarters is shown by the lengthof the two whiskers drawn to the end points (the lowest markand the highest mark).
� The spread of the two middle quarters is shown by the twoboxes (each plot has two boxes and two whiskers) and repre-sents the inter-quartile range.
� Half of the marks (50%) fall into the inter-quartile range.
Statistics 75
Figure 3.23 Vertical box and whisker plot for key subject exam results
0
10
20
30
40
50
60
70
80
90
100
English
Cum
ulat
ive
freq
uenc
y %
Maths Science
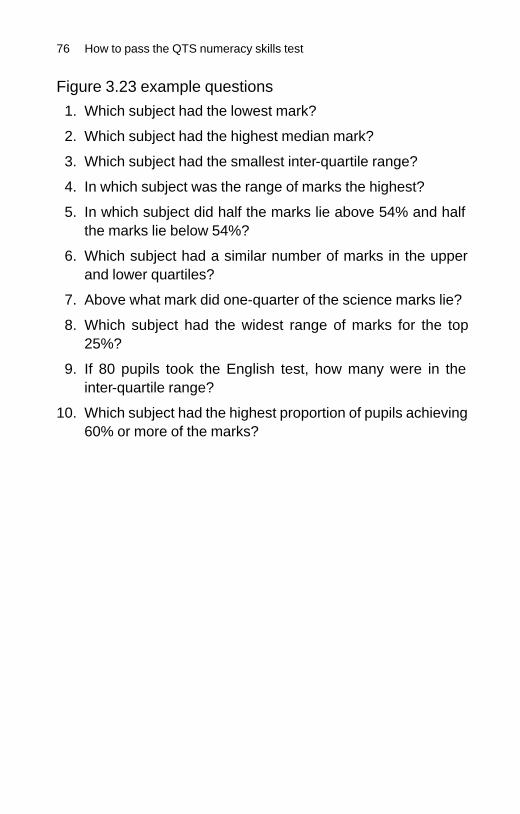
Figure 3.23 example questions1. Which subject had the lowest mark?
2. Which subject had the highest median mark?
3. Which subject had the smallest inter-quartile range?
4. In which subject was the range of marks the highest?
5. In which subject did half the marks lie above 54% and halfthe marks lie below 54%?
6. Which subject had a similar number of marks in the upperand lower quartiles?
7. Above what mark did one-quarter of the science marks lie?
8. Which subject had the widest range of marks for the top25%?
9. If 80 pupils took the English test, how many were in theinter-quartile range?
10. Which subject had the highest proportion of pupils achieving60% or more of the marks?
76 How to pass the QTS numeracy skills test
Introduction to the ‘on-screen’ typemock tests
In the second section of the test the questions appear on the screen.The following points are worth noting for the actual QTS test:
� Remember to use the on-screen calculator.
� Scroll forwards using the ‘next’ button and backwards using the‘previous’ button to find the easier questions; plan to skip themore difficult questions, leaving them until the end of the test.
� Do not accidentally click on the ‘end exam’ button.
� The ‘exhibit’ button displays additional information.
� The clock shows the time remaining.
� There is no need to include units with your answers.
� The mouse is used for ‘drag and drop’ and ‘point and click’answers.
� There is more time than you might think, so do not rush.
There now follow two mock ‘on-screen’ tests of 16 questionseach. You have 35 minutes to complete each test, or just over twominutes per question. If you find any question difficult, skip itand return to it later. Make sure that you have a calculator tohand as well as a pen and paper.
Some questions will ask you to ‘indicate all the true statements’,in which case you tick the correct answer(s), or mark the state-ments True (T) and False (F), as per the answers at the end of thebook. In the actual test you have to click inside a box to bring upa tick mark alongside the correct answer(s).
Introduction to mock tests 77
Mock test 1 (16 ‘on-screen’ questionsin 35 minutes)
Question 1Temperatures in Celsius (C) can be converted to temperaturesin Fahrenheit (F) using the following formula:F = ((C+40) × 1.8 ) – 40What is 21oC converted to Fahrenheit?
Question 2A teacher summarized the marks in a maths test using the boxand whisker plot below.
Indicate all the true statements:
1. At least one pupil achieved 72 marks.
2. The inter-quartile range was 16.
3. One-quarter of the pupils scored more than 38 marks.
Question 3The following table compares a school’s A-level entries inChemistry, Physics and Biology according to sex.
78 How to pass the QTS numeracy skills test
22 38 43 54 72
Chemistry Physics Biology
Boys 36 45 30
Girls 32 10 50
Answer
Answer
Answer
Answer
Indicate all the true statements:
1. The ratio of boys to girls in Chemistry was 8:9.
2. The ratio of girls to boys in Physics was 2:9.
3. The ratio of boys to girls in Biology was 5:3.
Question 4The graph shows the cumulative frequency of a school’s SPaG testresults.
Indicate all the true statements:
1. The median mark was 50%.
2. The upper quartile is at about 70%of the marks.
3. At least 90% of the pupils achieved a mark above 50%.
Mock test 1 79
40 44 48 52 56 60
Mark %
64 68 72 76 80 840
102030405060708090
100
Cum
ulat
ive
freq
uenc
y %
Answer
Answer
Answer
Answer
Answer
Answer
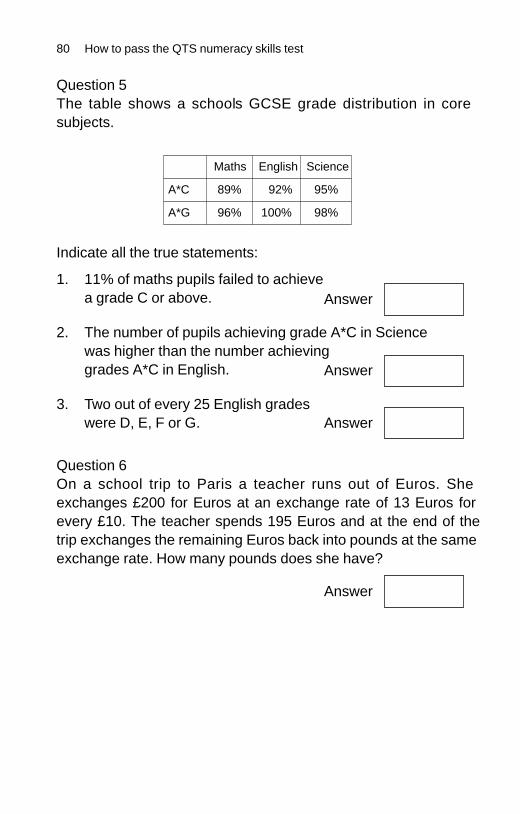
Question 5The table shows a school’s GCSE grade distribution in coresubjects.
Indicate all the true statements:
1. 11% of maths pupils failed to achieve a grade C or above.
2. The number of pupils achieving grade A*–C in Science was higher than the number achieving grades A*–C in English.
3. Two out of every 25 English gradeswere D, E, F or G.
Question 6On a school trip to Paris a teacher runs out of Euros. Sheexchanges £200 for Euros at an exchange rate of 13 Euros forevery £10. The teacher spends 195 Euros and at the end of thetrip exchanges the remaining Euros back into pounds at the sameexchange rate. How many pounds does she have?
80 How to pass the QTS numeracy skills test
Maths English Science
A*–C 89% 92% 95%
A*–G 96% 100% 98%
Answer
Answer
Answer
Answer
Mock test 1 81
Question 7The pie charts show the distribution of A-level grades in twodifferent schools, A and B.
Indicate all the true statements:
1. School B achieved more A grades than School A.
2. The number of pupils achieving grade C or above in School A was 264.
3. The A–C pass rate in School B was 6% above that in School A.
School A School B
E,F,G17% A
25%
D17%
C28%
400 pupils 330 pupils
B13%
E,F,G14%
A30%
D14%
C33%
B9%
Answer
Answer
Answer
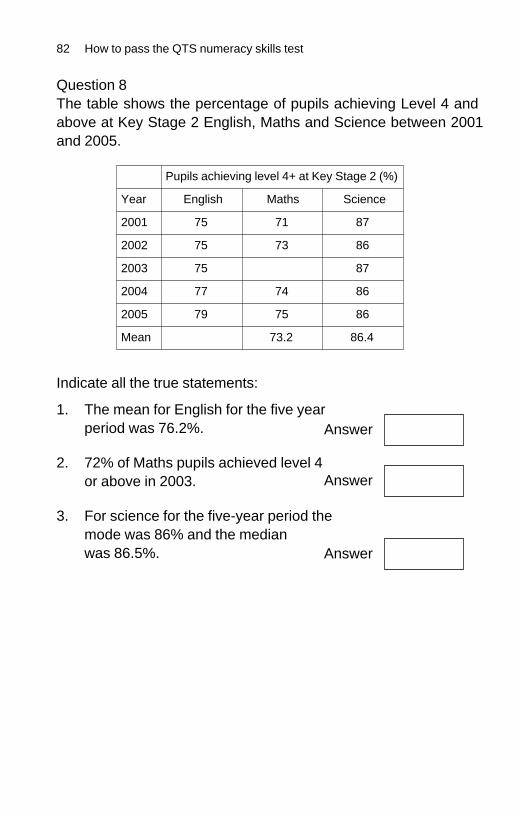
Question 8The table shows the percentage of pupils achieving Level 4 andabove at Key Stage 2 English, Maths and Science between 2001and 2005.
Indicate all the true statements:
1. The mean for English for the five year period was 76.2%.
2. 72% of Maths pupils achieved level 4 or above in 2003.
3. For science for the five-year period the mode was 86% and the median was 86.5%.
82 How to pass the QTS numeracy skills test
Pupils achieving level 4+ at Key Stage 2 (%)
Year English Maths Science
2001 75 71 87
2002 75 73 86
2003 75 87
2004 77 74 86
2005 79 75 86
Mean 73.2 86.4
Answer
Answer
Answer
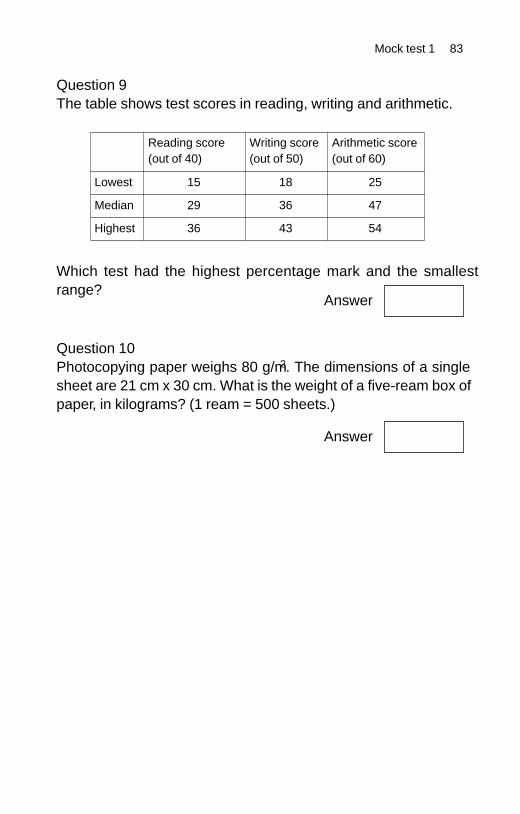
Question 9The table shows test scores in reading, writing and arithmetic.
Which test had the highest percentage mark and the smallestrange?
Question 10Photocopying paper weighs 80 g/m2. The dimensions of a singlesheet are 21 cm x 30 cm. What is the weight of a five-ream box ofpaper, in kilograms? (1 ream = 500 sheets.)
Mock test 1 83
Reading score(out of 40)
Writing score(out of 50)
Arithmetic score(out of 60)
Lowest 15 18 25
Median 29 36 47
Highest 36 43 54
Answer
Answer
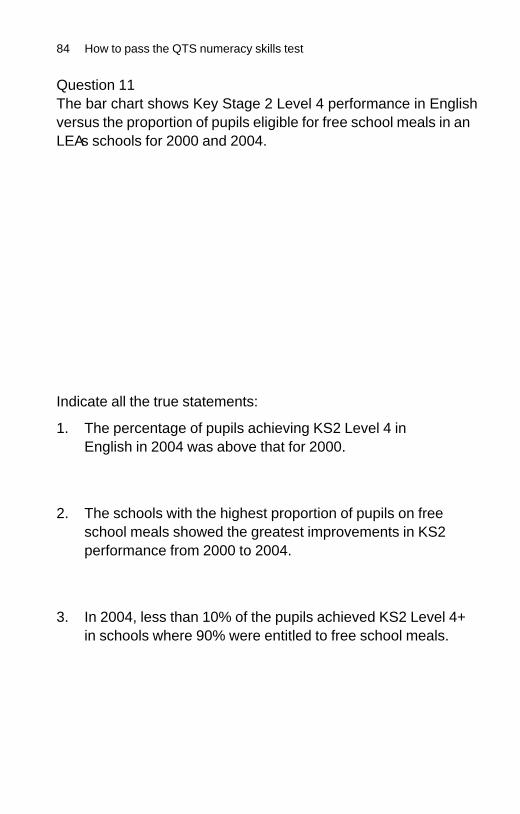
Question 11The bar chart shows Key Stage 2 Level 4 performance in Englishversus the proportion of pupils eligible for free school meals in anLEA’s schools for 2000 and 2004.
Indicate all the true statements:
1. The percentage of pupils achieving KS2 Level 4 in English in 2004 was above that for 2000.
2. The schools with the highest proportion of pupils on freeschool meals showed the greatest improvements in KS2performance from 2000 to 2004.
3. In 2004, less than 10% of the pupils achieved KS2 Level 4+in schools where 90% were entitled to free school meals.
84 How to pass the QTS numeracy skills test
Per
cent
age
achi
evin
g K
S2
leve
l 4+
0
10
20
30
40
50
60
70
80
90
100
<10% 10–19% 20–29%
Proportion entitled to free school meals
30–39% 40%+
2000 2004
Answer
Answer
Answer
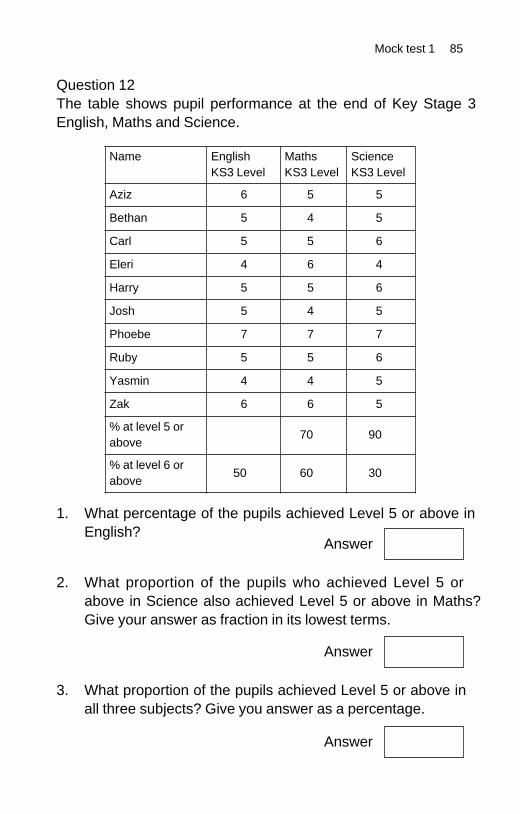
Question 12The table shows pupil performance at the end of Key Stage 3English, Maths and Science.
1. What percentage of the pupils achieved Level 5 or above inEnglish?
2. What proportion of the pupils who achieved Level 5 orabove in Science also achieved Level 5 or above in Maths?Give your answer as fraction in its lowest terms.
3. What proportion of the pupils achieved Level 5 or above inall three subjects? Give you answer as a percentage.
Mock test 1 85
Name EnglishKS3 Level
MathsKS3 Level
ScienceKS3 Level
Aziz 6 5 5
Bethan 5 4 5
Carl 5 5 6
Eleri 4 6 4
Harry 5 5 6
Josh 5 4 5
Phoebe 7 7 7
Ruby 5 5 6
Yasmin 4 4 5
Zak 6 6 5
% at level 5 orabove
70 90
% at level 6 orabove
50 60 30
Answer
Answer
Answer
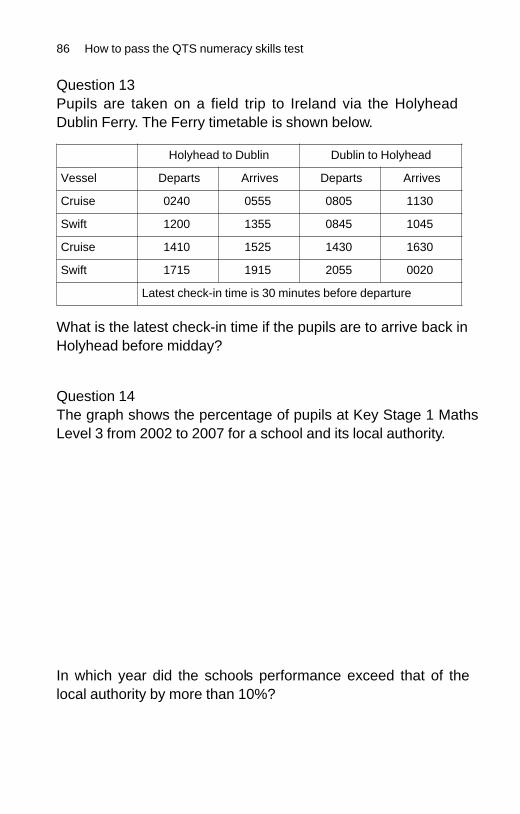
Question 13Pupils are taken on a field trip to Ireland via the Holyhead–Dublin Ferry. The Ferry timetable is shown below.
What is the latest check-in time if the pupils are to arrive back inHolyhead before midday?
Question 14The graph shows the percentage of pupils at Key Stage 1 MathsLevel 3 from 2002 to 2007 for a school and its local authority.
In which year did the school’s performance exceed that of thelocal authority by more than 10%?
86 How to pass the QTS numeracy skills test
Holyhead to Dublin Dublin to Holyhead
Vessel Departs Arrives Departs Arrives
Cruise 0240 0555 0805 1130
Swift 1200 1355 0845 1045
Cruise 1410 1525 1430 1630
Swift 1715 1915 2055 0020
Latest check-in time is 30 minutes before departure
% o
f pup
ils a
t Lev
el 3
30
40
50
60
70
80
90
100
2002 2003 2004 2005 2006 2007
Year
schoolLA
Answer
Answer
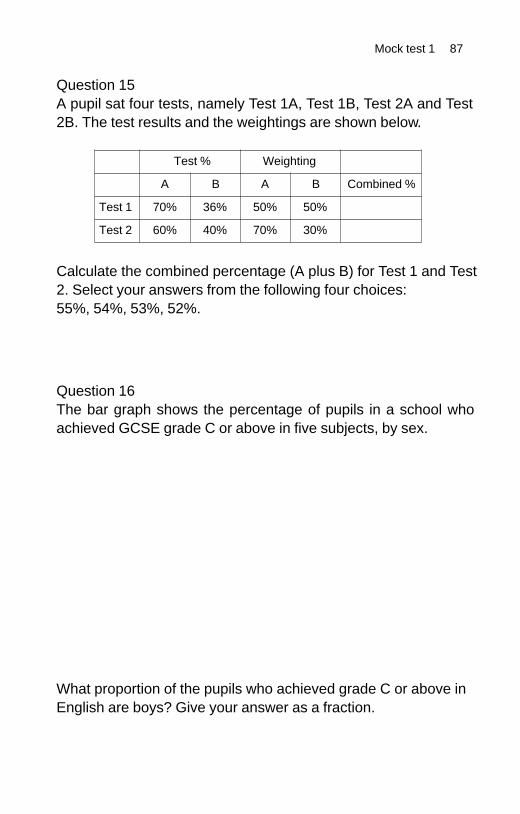
Question 15A pupil sat four tests, namely Test 1A, Test 1B, Test 2A and Test2B. The test results and the weightings are shown below.
Calculate the combined percentage (A plus B) for Test 1 and Test2. Select your answers from the following four choices:55%, 54%, 53%, 52%.
Question 16The bar graph shows the percentage of pupils in a school whoachieved GCSE grade C or above in five subjects, by sex.
What proportion of the pupils who achieved grade C or above inEnglish are boys? Give your answer as a fraction.
Mock test 1 87
Test % Weighting
A B A B Combined %
Test 1 70% 36% 50% 50%
Test 2 60% 40% 70% 30%
History
D & T
Science
Maths
English
Percentage achieving grade C or above
0 10 20 30 40 50 60 70 80 90 100
Boys Girls
Answer 1.
Answer 2.
Answer
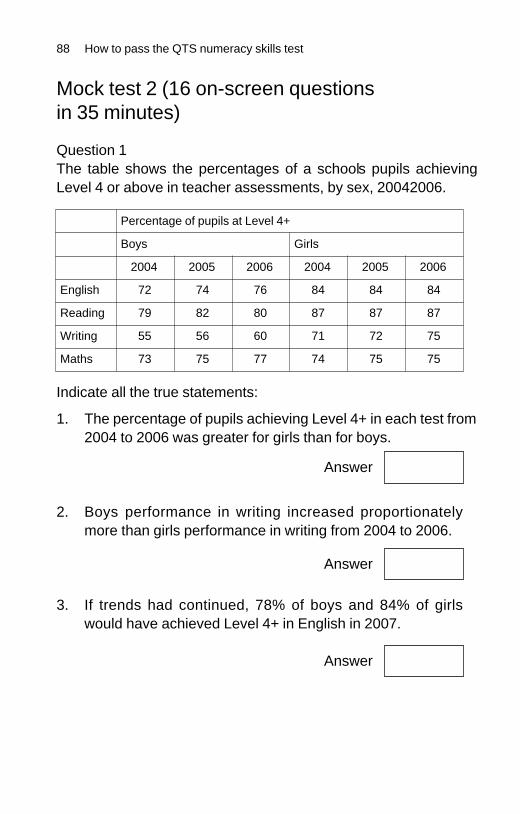
Mock test 2 (16 ‘on-screen’ questionsin 35 minutes)
Question 1The table shows the percentages of a school’s pupils achievingLevel 4 or above in teacher assessments, by sex, 2004–2006.
Indicate all the true statements:
1. The percentage of pupils achieving Level 4+ in each test from2004 to 2006 was greater for girls than for boys.
2. Boys’ performance in writing increased proportionatelymore than girls’ performance in writing from 2004 to 2006.
3. If trends had continued, 78% of boys and 84% of girlswould have achieved Level 4+ in English in 2007.
88 How to pass the QTS numeracy skills test
Percentage of pupils at Level 4+
Boys Girls
2004 2005 2006 2004 2005 2006
English 72 74 76 84 84 84
Reading 79 82 80 87 87 87
Writing 55 56 60 71 72 75
Maths 73 75 77 74 75 75
Answer
Answer
Answer
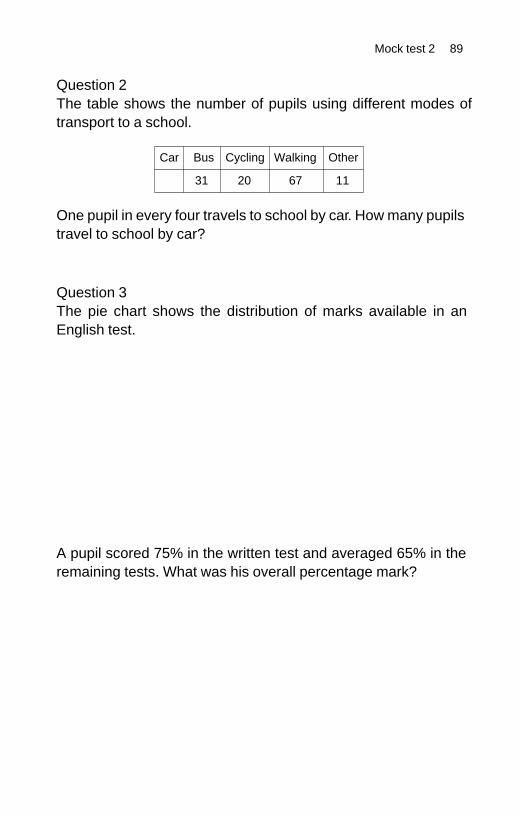
Question 2The table shows the number of pupils using different modes oftransport to a school.
One pupil in every four travels to school by car. How many pupilstravel to school by car?
Question 3The pie chart shows the distribution of marks available in anEnglish test.
A pupil scored 75% in the written test and averaged 65% in theremaining tests. What was his overall percentage mark?
Mock test 2 89
Car Bus Cycling Walking Other
31 20 67 11
Listening
Reading
Speaking
Written test60%
Answer
Answer
Question 4A primary school calculates its Pupil/Teacher Ratio (PTR) bydividing the number of pupils by the number of teachers. Thenumber of teachers includes the Principal and any part-time staff.For part-time staff the full-time teaching equivalent is given by:part-time hours ÷ 25.
Calculate the PTR of a school with 170 pupils where the Principalhas seven full-time teachers and one part-time teacher working 15hours. Give your answer to one decimal place.
Question 5A school compared Key Stage 2 points score with Key Stage 3marks.
Choose the letter of the pupil that fits the description given.
1. This pupil scored 25 points at Key Stage 2 and the middlemark at Key Stage 3.
90 How to pass the QTS numeracy skills test
50% = median; UQ = upper quartile; LQ = lower quartile
016 18 20 22 24
Key Stage 2 points score
26 28 30 32
10
20
30
40
50
60
70
80
Key
Sta
ge 3
mar
ks
UQ
50%
LQ
B
GN S
FL
R
Q
KE
DH
P
T
AC
Answer
Answer
2. One-quarter of the pupils with 28 points at Key Stage 2 haveKey Stage 3 marks above this pupil.
3. Three-quarters of the pupils with 26 points at Key Stage 2have Key Stage 3 marks above this pupil.
Question 6A pupil takes £100 on a school trip to Poland and exchanges £80for Polish zlotys (zl) at an exchange rate £1.00 = 4.25 zl. Hespends 250 zl in Poland and then exchanges the balance of hiszlotys back into pounds at a rate of 4.50 zl = £1.00. How muchmoney does he have on returning home?
Question 7In a school’s charity project, shoeboxes are covered in wrappingpaper and filled with gifts. One shoebox is shown below.
What is the minimum length of wrapping paper needed to coverall four sides of the box with a 2 cm overlap at the join? Give youranswer in metres.
Mock test 2 91
13 cm
32 cm
19 cm
Answer
Answer
Answer
Answer
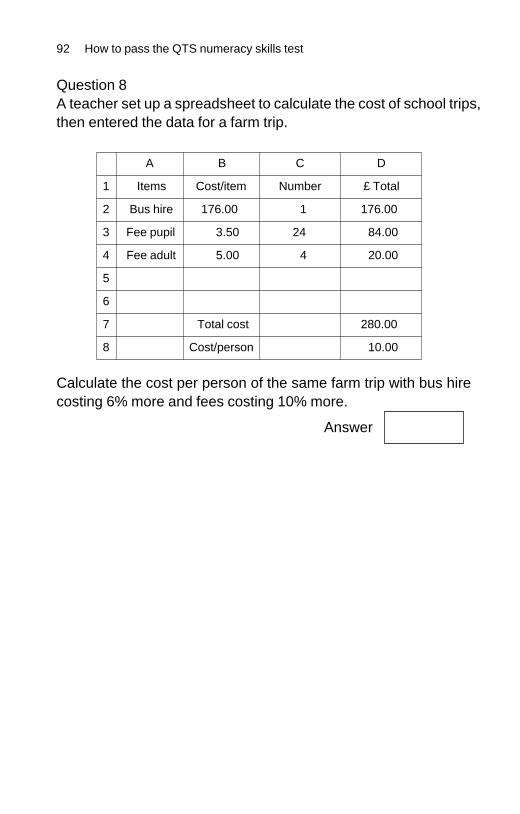
Question 8A teacher set up a spreadsheet to calculate the cost of school trips,then entered the data for a farm trip.
Calculate the cost per person of the same farm trip with bus hirecosting 6% more and fees costing 10% more.
92 How to pass the QTS numeracy skills test
A B C D
1 Items Cost/item Number £ Total
2 Bus hire 176.00 1 176.00
3 Fee pupil 3.50 24 84.00
4 Fee adult 5.00 4 20.00
5
6
7 Total cost 280.00
8 Cost/person 10.00
Answer
Question 9A pupil displayed his coursework data in a bar chart and a piechart.
Which pie chart shows the same data as the bar chart?
Question 10The table shows the distribution of pupils in a school accordingto year group.
How many pupils are on roll at the school if the mean number ofpupils in years 7 to 11 is 181 and the ratio of pupils in year 11 toyear 12 is 7:5?
Mock test 2 93
02468
101214161820
A B C
Year 7 8 9 10 11 12 13 Total
Number 185 184 181 180 120
Answer
Answer
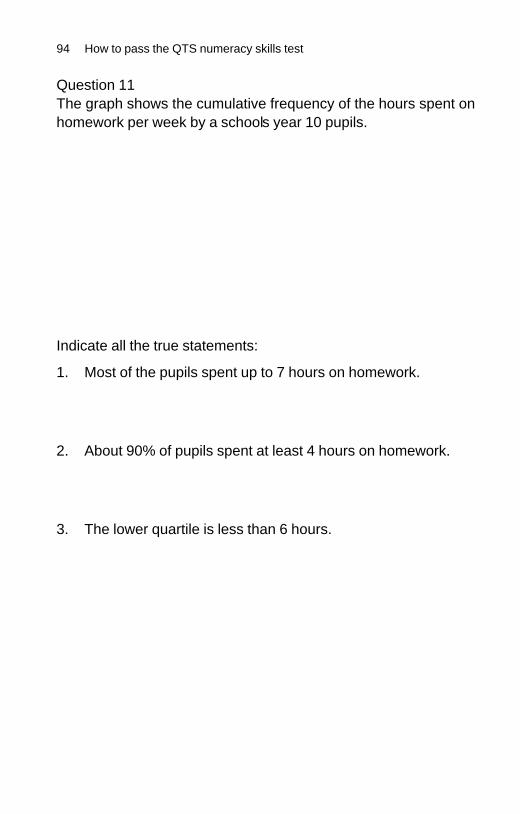
Question 11The graph shows the cumulative frequency of the hours spent onhomework per week by a school’s year 10 pupils.
Indicate all the true statements:
1. Most of the pupils spent up to 7 hours on homework.
2. About 90% of pupils spent at least 4 hours on homework.
3. The lower quartile is less than 6 hours.
94 How to pass the QTS numeracy skills test
00
102030405060708090
100
1 2 3 4 5 6
Time spent on homework (hours)
Cum
ulat
ive
freq
uenc
y %
7 8 9 10 11 12
Answer
Answer
Answer
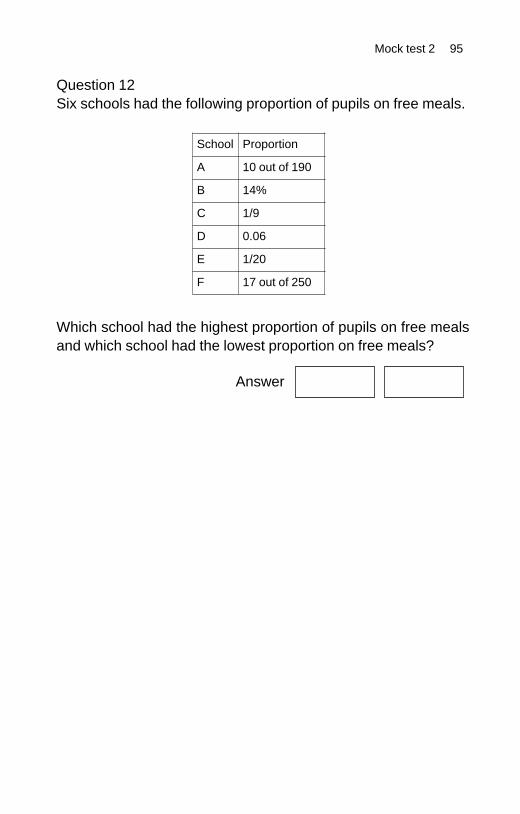
Question 12Six schools had the following proportion of pupils on free meals.
Which school had the highest proportion of pupils on free mealsand which school had the lowest proportion on free meals?
Mock test 2 95
School Proportion
A 10 out of 190
B 14%
C 1/9
D 0.06
E 1/20
F 17 out of 250
Answer
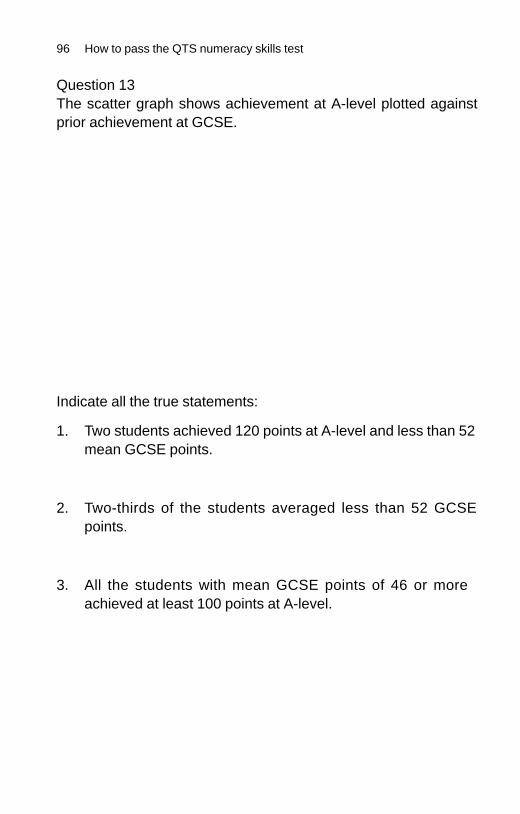
Question 13The scatter graph shows achievement at A-level plotted againstprior achievement at GCSE.
Indicate all the true statements:
1. Two students achieved 120 points at A-level and less than 52mean GCSE points.
2. Two-thirds of the students averaged less than 52 GCSEpoints.
3. All the students with mean GCSE points of 46 or moreachieved at least 100 points at A-level.
96 How to pass the QTS numeracy skills test
4028 34 40
Mean GCSE points
46 52 58
60
80
A-le
vel U
CA
S p
oint
s 100
120
Answer
Answer
Answer
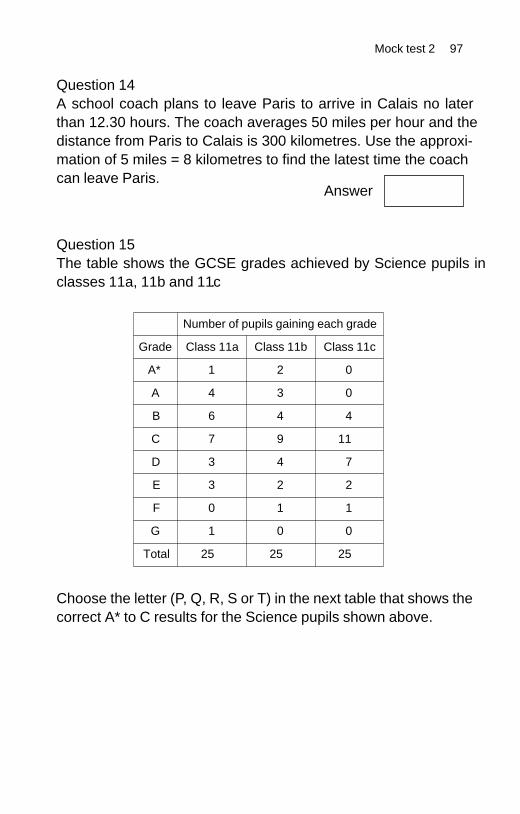
Question 14A school coach plans to leave Paris to arrive in Calais no laterthan 12.30 hours. The coach averages 50 miles per hour and thedistance from Paris to Calais is 300 kilometres. Use the approxi-mation of 5 miles = 8 kilometres to find the latest time the coachcan leave Paris.
Question 15The table shows the GCSE grades achieved by Science pupils inclasses 11a, 11b and 11c.
Choose the letter (P, Q, R, S or T) in the next table that shows thecorrect A* to C results for the Science pupils shown above.
Mock test 2 97
Number of pupils gaining each grade
Grade Class 11a Class 11b Class 11c
A* 1 2 0
A 4 3 0
B 6 4 4
C 7 9 11
D 3 4 7
E 3 2 2
F 0 1 1
G 1 0 0
Total 25 25 25
Answer
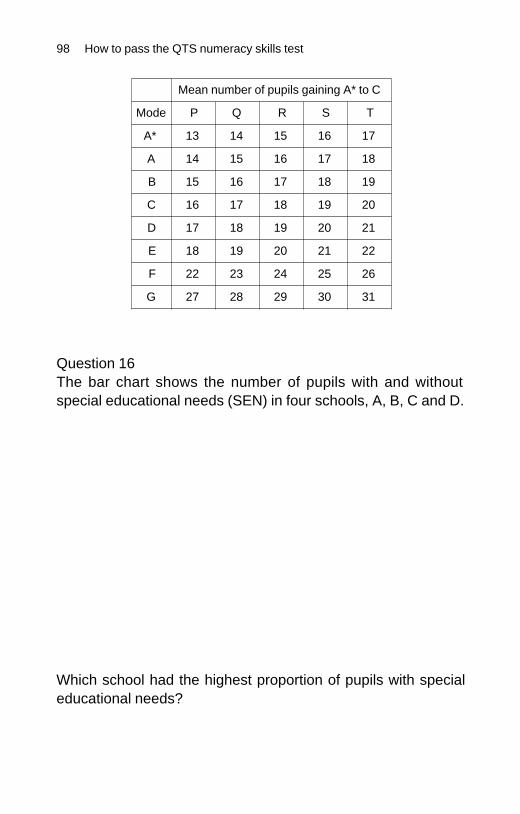
Question 16The bar chart shows the number of pupils with and withoutspecial educational needs (SEN) in four schools, A, B, C and D.
Which school had the highest proportion of pupils with specialeducational needs?
98 How to pass the QTS numeracy skills test
Mean number of pupils gaining A* to C
Mode P Q R S T
A* 13 14 15 16 17
A 14 15 16 17 18
B 15 16 17 18 19
C 16 17 18 19 20
D 17 18 19 20 21
E 18 19 20 21 22
F 22 23 24 25 26
G 27 28 29 30 31
with SEN without SEN
A
B
C
Sch
ools
D
0 100 200 300 400 500
Number of pupils
600 700 800 900 1000
Answer
Answer
99
Answers
Mental arithmetic test 1
1. In a school of three-hundred and twenty-four pupils, one-sixth take free school meals. How many take free schoolmeals?
324 ÷ 6 = 300 ÷ 6 + 24 ÷ 6 = 50 + 4 = 54
2. A school library contains one-hundred and fifty-six books. Ifthe number of non-fiction books is twice the number offiction books, how many non-fiction books are there?
2n + n = 156; 3n = 156; n = 52; 2n = fiction = 104
3. If one gallon is equivalent to four point five litres, how manygallons are there in one litre? Give your answer as a fraction.
1 gal = 4.54 litre so 1 litre = 1 ÷ 4.5 gal = 2 ÷ 9 = 2/9 gal
4. A school can buy ten books at nine pounds and ninety-fivepence each or borrow the books from a library service at acost of forty pounds. How much money will be saved byborrowing the books?
9.95 × 10 – 40 = 99.50 – 40 = £59.50
5. A school audio CD costs five pounds plus VAT. If VAT ischarged at seventeen and one-half percent, how much doesthe CD cost to the nearest penny?
17.5% = 17.5 p per pound (per 100p)17.5 × 5 = 18 × 5 – 0.5 × 5 = 90 – 2.5 = 87.5 p = 88p+ £5 = £5.88
6. Two hundred and forty pupils sat GCSE English. If forty-fivepercent of the pupils achieved grade D or below, how manyachieved grade C or above?
100% – 45% = 55%; 55% × 240 = 50% × 240 + 5% × 240= 120 + 12 = 132
7. A school bus arrives at the Tate Gallery at twelve hundredhours. The journey took two hours and twenty-five minutesexcluding a fifteen minute break. At what time did it set out?
Total time taken = 2 hr 25 min + 15 min = 2 hrs 40 min1200 hr – 2hr 40 min = 1200 hr – 3hr + 20 min = 0920
8. In a school run a pupil completed five miles around a fourhundred metre track. How many laps of the track werecompleted if one mile is taken to be one point six kilometres?
5 miles = 5 × 1.6 = 0.5 × 16 = 8 km8 km = 8 × 1000 m = 8000 m8000 ÷ 400 = 80 ÷ 4 = 20 laps
100 How to pass the QTS numeracy skills test
9. A ski trip to Switzerland cost seven hundred and fifty poundsand requires a twenty percent deposit. What is the deposit inSwiss francs if one pound is equivalent to two Swiss francs?
£750 × 20% = 1/5 × £750 = £150 (or £750 × 0.2 = £75 × 2)£150 × 2 Swiss francs per pound = 300 francs
10. What is thirty-seven and one-half percent as a fraction?
37.5% = 37.5/100 = 75/200 = 15/40 = 3/8
11. A school playground measures twelve metres by thirteenpoint five metres. What is its area in metres squared?
12 × 13.5 = 12 × 10 + 12 × 3 + 12 × 0.5= 120 + 36 + 6 = 156 + 6 = 162 m2
12. An 11–18 comprehensive school has fifteen hundred andfifty pupils on roll, including three hundred and ten A-levelstudents. What percentage of the pupils on roll are A-levelstudents?
310 ÷ 1550 × 100% = 310 ÷ 155 × 10 = 2 × 10 = 20%
Answers 101
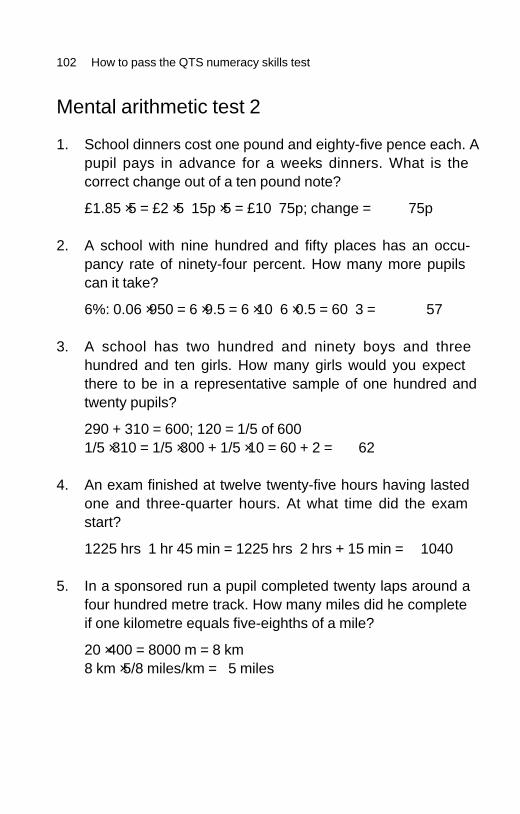
Mental arithmetic test 2
1. School dinners cost one pound and eighty-five pence each. Apupil pays in advance for a week’s dinners. What is thecorrect change out of a ten pound note?
£1.85 × 5 = £2 × 5 – 15p × 5 = £10 – 75p; change = 75p
2. A school with nine hundred and fifty places has an occu-pancy rate of ninety-four percent. How many more pupilscan it take?
6%: 0.06 × 950 = 6 × 9.5 = 6 × 10 – 6 × 0.5 = 60 – 3 = 57
3. A school has two hundred and ninety boys and threehundred and ten girls. How many girls would you expectthere to be in a representative sample of one hundred andtwenty pupils?
290 + 310 = 600; 120 = 1/5 of 6001/5 × 310 = 1/5 × 300 + 1/5 × 10 = 60 + 2 = 62
4. An exam finished at twelve twenty-five hours having lastedone and three-quarter hours. At what time did the examstart?
1225 hrs – 1 hr 45 min = 1225 hrs – 2 hrs + 15 min = 1040
5. In a sponsored run a pupil completed twenty laps around afour hundred metre track. How many miles did he completeif one kilometre equals five-eighths of a mile?
20 × 400 = 8000 m = 8 km8 km × 5/8 miles/km = 5 miles
102 How to pass the QTS numeracy skills test
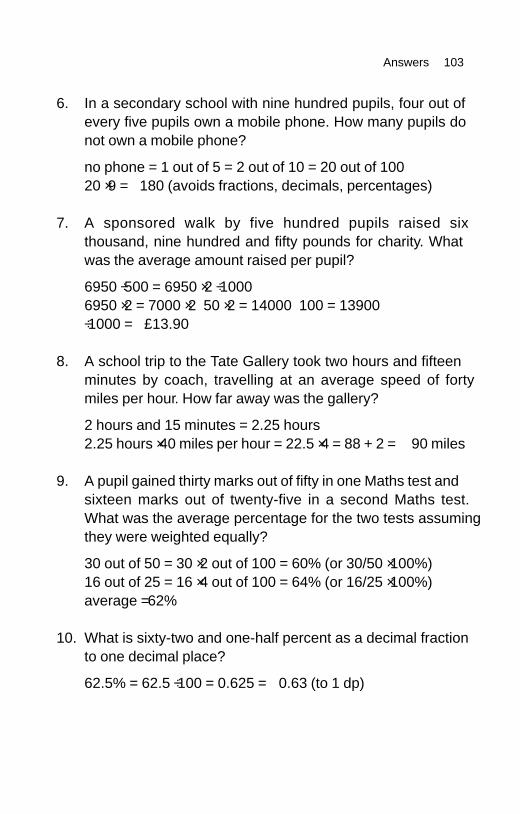
6. In a secondary school with nine hundred pupils, four out ofevery five pupils own a mobile phone. How many pupils donot own a mobile phone?
no phone = 1 out of 5 = 2 out of 10 = 20 out of 10020 × 9 = 180 (avoids fractions, decimals, percentages)
7. A sponsored walk by five hundred pupils raised sixthousand, nine hundred and fifty pounds for charity. Whatwas the average amount raised per pupil?
6950 ÷ 500 = 6950 × 2 ÷ 10006950 × 2 = 7000 × 2 – 50 × 2 = 14000 – 100 = 13900÷ 1000 = £13.90
8. A school trip to the Tate Gallery took two hours and fifteenminutes by coach, travelling at an average speed of fortymiles per hour. How far away was the gallery?
2 hours and 15 minutes = 2.25 hours2.25 hours × 40 miles per hour = 22.5 × 4 = 88 + 2 = 90 miles
9. A pupil gained thirty marks out of fifty in one Maths test andsixteen marks out of twenty-five in a second Maths test.What was the average percentage for the two tests assumingthey were weighted equally?
30 out of 50 = 30 × 2 out of 100 = 60% (or 30/50 × 100%)16 out of 25 = 16 × 4 out of 100 = 64% (or 16/25 × 100%)average = 62%
10. What is sixty-two and one-half percent as a decimal fractionto one decimal place?
62.5% = 62.5 ÷ 100 = 0.625 = 0.63 (to 1 dp)
Answers 103
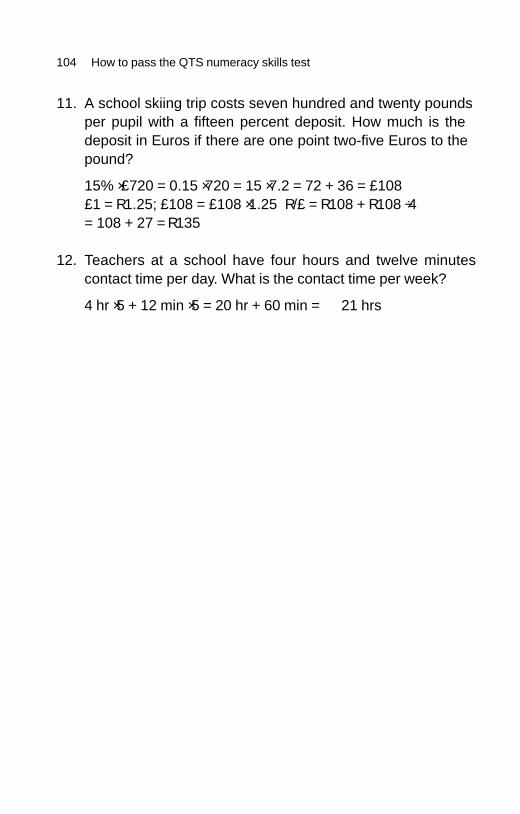
11. A school skiing trip costs seven hundred and twenty poundsper pupil with a fifteen percent deposit. How much is thedeposit in Euros if there are one point two-five Euros to thepound?
15% × £720 = 0.15 × 720 = 15 × 7.2 = 72 + 36 = £108£1 = R1.25; £108 = £108 × 1.25R/£ = R108 + R108 ÷ 4= 108 + 27 = R135
12. Teachers at a school have four hours and twelve minutescontact time per day. What is the contact time per week?
4 hr × 5 + 12 min × 5 = 20 hr + 60 min = 21 hrs
104 How to pass the QTS numeracy skills test
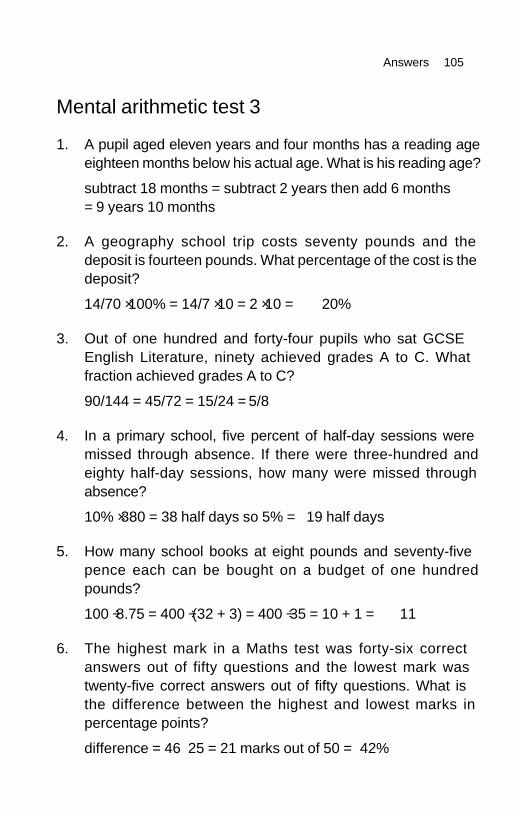
Mental arithmetic test 3
1. A pupil aged eleven years and four months has a reading ageeighteen months below his actual age. What is his reading age?
subtract 18 months = subtract 2 years then add 6 months= 9 years 10 months
2. A geography school trip costs seventy pounds and thedeposit is fourteen pounds. What percentage of the cost is thedeposit?
14/70 × 100% = 14/7 × 10 = 2 × 10 = 20%
3. Out of one hundred and forty-four pupils who sat GCSEEnglish Literature, ninety achieved grades A to C. Whatfraction achieved grades A to C?
90/144 = 45/72 = 15/24 = 5/8
4. In a primary school, five percent of half-day sessions weremissed through absence. If there were three-hundred andeighty half-day sessions, how many were missed throughabsence?
10% × 380 = 38 half days so 5% = 19 half days
5. How many school books at eight pounds and seventy-fivepence each can be bought on a budget of one hundredpounds?
100 ÷ 8.75 = 400 ÷ (32 + 3) = 400 ÷ 35 = 10 + 1 = 11
6. The highest mark in a Maths test was forty-six correctanswers out of fifty questions and the lowest mark wastwenty-five correct answers out of fifty questions. What isthe difference between the highest and lowest marks inpercentage points?
difference = 46 – 25 = 21 marks out of 50 = 42%
Answers 105
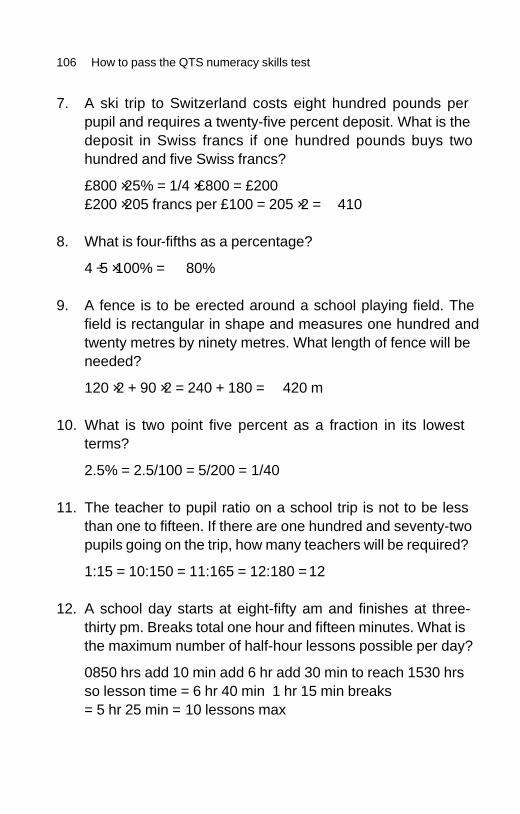
7. A ski trip to Switzerland costs eight hundred pounds perpupil and requires a twenty-five percent deposit. What is thedeposit in Swiss francs if one hundred pounds buys twohundred and five Swiss francs?
£800 × 25% = 1/4 × £800 = £200£200 × 205 francs per £100 = 205 × 2 = 410
8. What is four-fifths as a percentage?
4 ÷ 5 × 100% = 80%
9. A fence is to be erected around a school playing field. Thefield is rectangular in shape and measures one hundred andtwenty metres by ninety metres. What length of fence will beneeded?
120 × 2 + 90 × 2 = 240 + 180 = 420 m
10. What is two point five percent as a fraction in its lowestterms?
2.5% = 2.5/100 = 5/200 = 1/40
11. The teacher to pupil ratio on a school trip is not to be lessthan one to fifteen. If there are one hundred and seventy-twopupils going on the trip, how many teachers will be required?
1:15 = 10:150 = 11:165 = 12:180 = 12
12. A school day starts at eight-fifty am and finishes at three-thirty pm. Breaks total one hour and fifteen minutes. What isthe maximum number of half-hour lessons possible per day?
0850 hrs add 10 min add 6 hr add 30 min to reach 1530 hrsso lesson time = 6 hr 40 min – 1 hr 15 min breaks= 5 hr 25 min = 10 lessons max
106 How to pass the QTS numeracy skills test
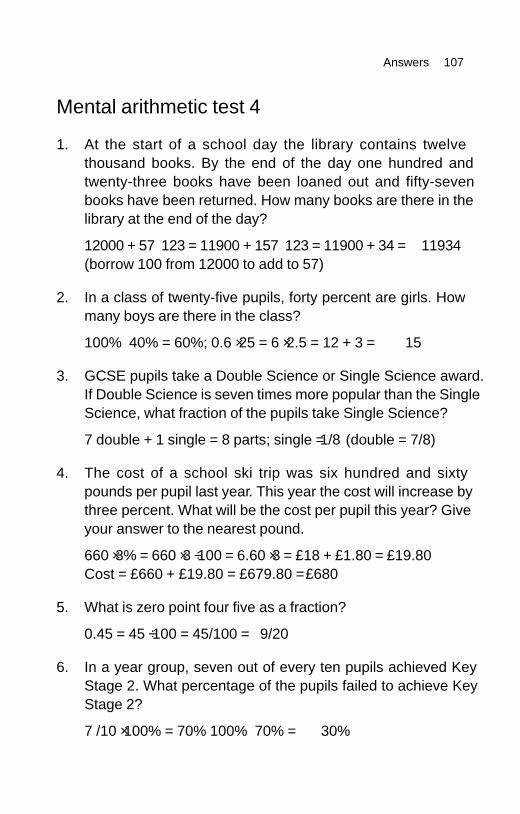
Mental arithmetic test 4
1. At the start of a school day the library contains twelvethousand books. By the end of the day one hundred andtwenty-three books have been loaned out and fifty-sevenbooks have been returned. How many books are there in thelibrary at the end of the day?
12000 + 57 – 123 = 11900 + 157 – 123 = 11900 + 34 = 11934(borrow 100 from 12000 to add to 57)
2. In a class of twenty-five pupils, forty percent are girls. Howmany boys are there in the class?
100% – 40% = 60%; 0.6 × 25 = 6 × 2.5 = 12 + 3 = 15
3. GCSE pupils take a Double Science or Single Science award.If Double Science is seven times more popular than the SingleScience, what fraction of the pupils take Single Science?
7 double + 1 single = 8 parts; single = 1/8 (double = 7/8)
4. The cost of a school ski trip was six hundred and sixtypounds per pupil last year. This year the cost will increase bythree percent. What will be the cost per pupil this year? Giveyour answer to the nearest pound.
660 × 3% = 660 × 3 ÷ 100 = 6.60 × 3 = £18 + £1.80 = £19.80 Cost = £660 + £19.80 = £679.80 = £680
5. What is zero point four five as a fraction?
0.45 = 45 ÷ 100 = 45/100 = 9/20
6. In a year group, seven out of every ten pupils achieved KeyStage 2. What percentage of the pupils failed to achieve KeyStage 2?
7 /10 × 100% = 70% 100% – 70% = 30%
Answers 107
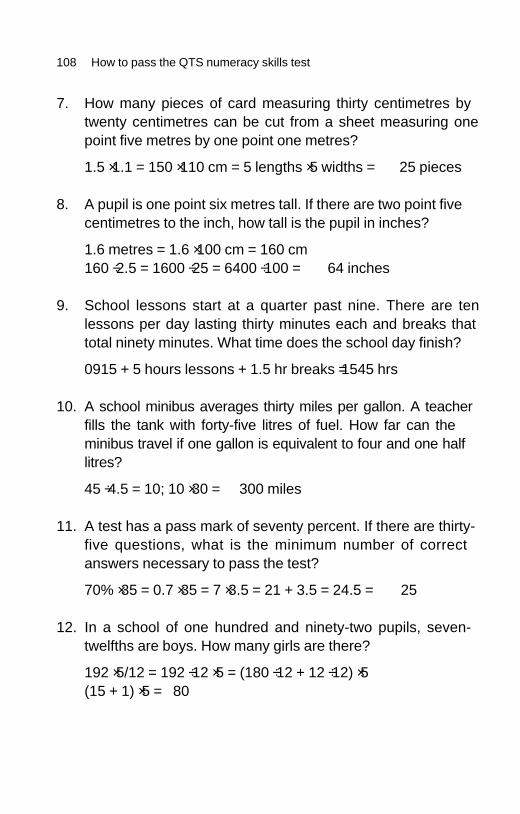
7. How many pieces of card measuring thirty centimetres bytwenty centimetres can be cut from a sheet measuring onepoint five metres by one point one metres?
1.5 × 1.1 = 150 × 110 cm = 5 lengths × 5 widths = 25 pieces
8. A pupil is one point six metres tall. If there are two point fivecentimetres to the inch, how tall is the pupil in inches?
1.6 metres = 1.6 × 100 cm = 160 cm160 ÷ 2.5 = 1600 ÷ 25 = 6400 ÷ 100 = 64 inches
9. School lessons start at a quarter past nine. There are tenlessons per day lasting thirty minutes each and breaks thattotal ninety minutes. What time does the school day finish?
0915 + 5 hours lessons + 1.5 hr breaks = 1545 hrs
10. A school minibus averages thirty miles per gallon. A teacherfills the tank with forty-five litres of fuel. How far can theminibus travel if one gallon is equivalent to four and one halflitres?
45 ÷ 4.5 = 10; 10 × 30 = 300 miles
11. A test has a pass mark of seventy percent. If there are thirty-five questions, what is the minimum number of correctanswers necessary to pass the test?
70% × 35 = 0.7 × 35 = 7 × 3.5 = 21 + 3.5 = 24.5 = 25
12. In a school of one hundred and ninety-two pupils, seven-twelfths are boys. How many girls are there?
192 × 5/12 = 192 ÷ 12 × 5 = (180 ÷ 12 + 12 ÷ 12) × 5(15 + 1) × 5 = 80
108 How to pass the QTS numeracy skills test
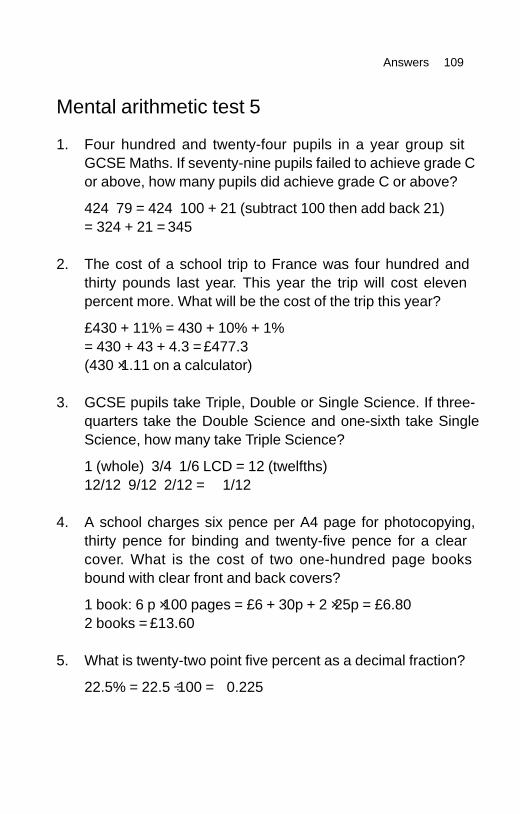
Mental arithmetic test 5
1. Four hundred and twenty-four pupils in a year group sitGCSE Maths. If seventy-nine pupils failed to achieve grade Cor above, how many pupils did achieve grade C or above?
424 – 79 = 424 – 100 + 21 (subtract 100 then add back 21)= 324 + 21 = 345
2. The cost of a school trip to France was four hundred andthirty pounds last year. This year the trip will cost elevenpercent more. What will be the cost of the trip this year?
£430 + ‘11%’ = 430 + ‘10%’ + ‘1%’= 430 + 43 + 4.3 = £477.3(430 × 1.11 on a calculator)
3. GCSE pupils take Triple, Double or Single Science. If three-quarters take the Double Science and one-sixth take SingleScience, how many take Triple Science?
1 (whole) – 3/4 – 1/6 LCD = 12 (twelfths)12/12 – 9/12 – 2/12 = 1/12
4. A school charges six pence per A4 page for photocopying,thirty pence for binding and twenty-five pence for a clearcover. What is the cost of two one-hundred page booksbound with clear front and back covers?
1 book: 6 p × 100 pages = £6 + 30p + 2 × 25p = £6.802 books = £13.60
5. What is twenty-two point five percent as a decimal fraction?
22.5% = 22.5 ÷ 100 = 0.225
Answers 109
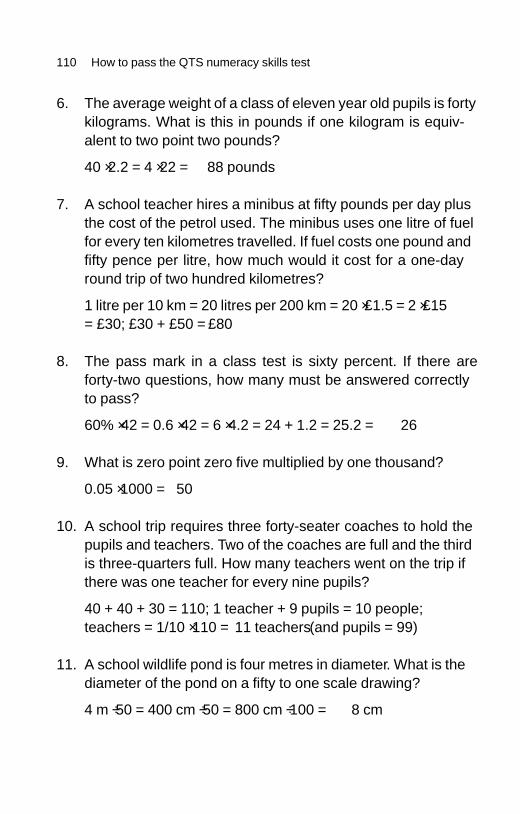
6. The average weight of a class of eleven year old pupils is fortykilograms. What is this in pounds if one kilogram is equiv-alent to two point two pounds?
40 × 2.2 = 4 × 22 = 88 pounds
7. A school teacher hires a minibus at fifty pounds per day plusthe cost of the petrol used. The minibus uses one litre of fuelfor every ten kilometres travelled. If fuel costs one pound andfifty pence per litre, how much would it cost for a one-dayround trip of two hundred kilometres?
1 litre per 10 km = 20 litres per 200 km = 20 × £1.5 = 2 × £15= £30; £30 + £50 = £80
8. The pass mark in a class test is sixty percent. If there areforty-two questions, how many must be answered correctlyto pass?
60% × 42 = 0.6 × 42 = 6 × 4.2 = 24 + 1.2 = 25.2 = 26
9. What is zero point zero five multiplied by one thousand?
0.05 × 1000 = 50
10. A school trip requires three forty-seater coaches to hold thepupils and teachers. Two of the coaches are full and the thirdis three-quarters full. How many teachers went on the trip ifthere was one teacher for every nine pupils?
40 + 40 + 30 = 110; 1 teacher + 9 pupils = 10 people; teachers = 1/10 × 110 = 11 teachers (and pupils = 99)
11. A school wildlife pond is four metres in diameter. What is thediameter of the pond on a fifty to one scale drawing?
4 m ÷ 50 = 400 cm ÷ 50 = 800 cm ÷ 100 = 8 cm
110 How to pass the QTS numeracy skills test
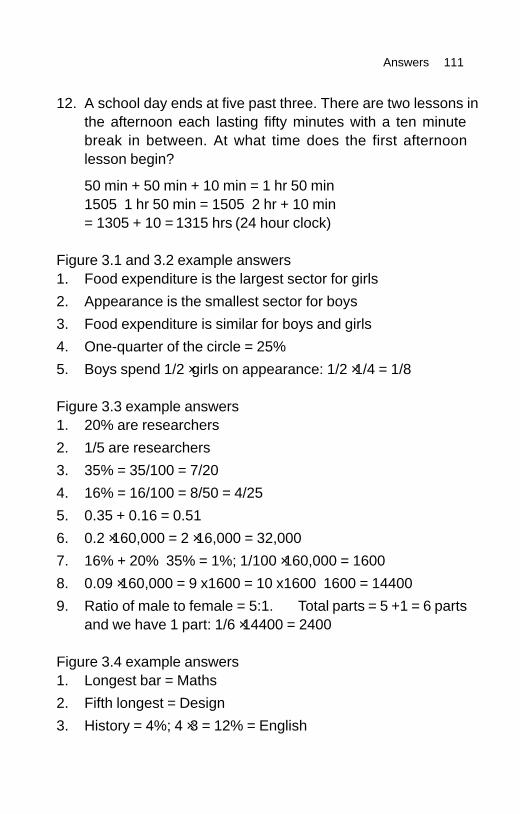
12. A school day ends at five past three. There are two lessons inthe afternoon each lasting fifty minutes with a ten minutebreak in between. At what time does the first afternoonlesson begin?
50 min + 50 min + 10 min = 1 hr 50 min1505 – 1 hr 50 min = 1505 – 2 hr + 10 min= 1305 + 10 = 1315 hrs (24 hour clock)
Figure 3.1 and 3.2 example answers1. Food expenditure is the largest sector for girls
2. Appearance is the smallest sector for boys
3. Food expenditure is similar for boys and girls
4. One-quarter of the circle = 25%
5. Boys spend 1/2 × girls on appearance: 1/2 × 1/4 = 1/8
Figure 3.3 example answers1. 20% are researchers
2. 1/5 are researchers
3. 35% = 35/100 = 7/20
4. 16% = 16/100 = 8/50 = 4/25
5. 0.35 + 0.16 = 0.51
6. 0.2 × 160,000 = 2 × 16,000 = 32,000
7. 16% + 20% – 35% = 1%; 1/100 × 160,000 = 1600
8. 0.09 × 160,000 = 9 x1600 = 10 x1600 – 1600 = 14400
9. Ratio of male to female = 5:1. Total parts = 5 +1 = 6 partsand we have 1 part: 1/6 × 14400 = 2400
Figure 3.4 example answers1. Longest bar = Maths
2. Fifth longest = Design
3. History = 4%; 4 × 3 = 12% = English
Answers 111
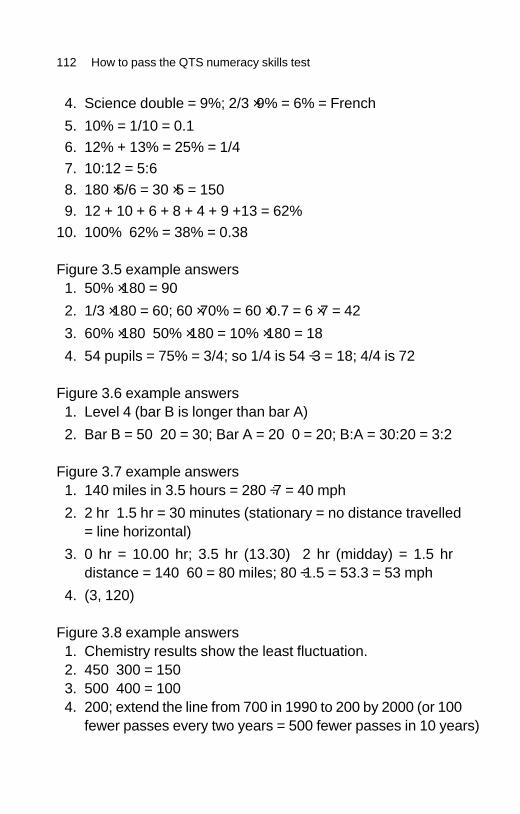
4. Science double = 9%; 2/3 × 9% = 6% = French
5. 10% = 1/10 = 0.16. 12% + 13% = 25% = 1/47. 10:12 = 5:68. 180 × 5/6 = 30 × 5 = 1509. 12 + 10 + 6 + 8 + 4 + 9 +13 = 62%
10. 100% – 62% = 38% = 0.38
Figure 3.5 example answers1. 50% × 180 = 90
2. 1/3 × 180 = 60; 60 × 70% = 60 × 0.7 = 6 × 7 = 42
3. 60% × 180 – 50% × 180 = 10% × 180 = 18
4. 54 pupils = 75% = 3/4; so 1/4 is 54 ÷ 3 = 18; 4/4 is 72
Figure 3.6 example answers1. Level 4 (bar B is longer than bar A)
2. Bar B = 50 – 20 = 30; Bar A = 20 – 0 = 20; B:A = 30:20 = 3:2
Figure 3.7 example answers1. 140 miles in 3.5 hours = 280 ÷ 7 = 40 mph
2. 2 hr – 1.5 hr = 30 minutes (stationary = no distance travelled= line horizontal)
3. 0 hr = 10.00 hr; 3.5 hr (13.30) – 2 hr (midday) = 1.5 hrdistance = 140 – 60 = 80 miles; 80 ÷ 1.5 = 53.3 = 53 mph
4. (3, 120)
Figure 3.8 example answers1. Chemistry results show the least fluctuation.2. 450 – 300 = 1503. 500 – 400 = 1004. 200; extend the line from 700 in 1990 to 200 by 2000 (or 100
fewer passes every two years = 500 fewer passes in 10 years)
112 How to pass the QTS numeracy skills test
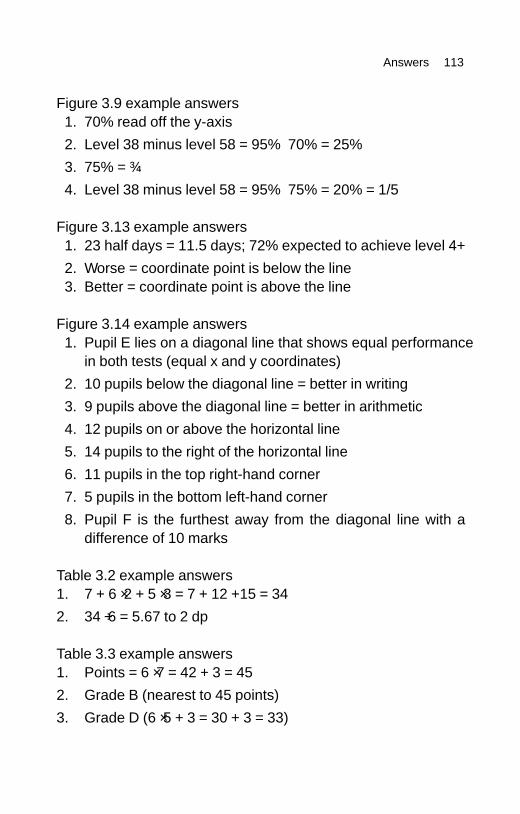
Figure 3.9 example answers1. 70% read off the y-axis
2. Level 3–8 minus level 5–8 = 95% – 70% = 25%
3. 75% = ¾
4. Level 3–8 minus level 5–8 = 95% – 75% = 20% = 1/5
Figure 3.13 example answers1. 23 half days = 11.5 days; 72% expected to achieve level 4+
2. Worse = coordinate point is below the line3. Better = coordinate point is above the line
Figure 3.14 example answers1. Pupil E lies on a diagonal line that shows equal performance
in both tests (equal x and y coordinates)
2. 10 pupils below the diagonal line = better in writing
3. 9 pupils above the diagonal line = better in arithmetic
4. 12 pupils on or above the horizontal line
5. 14 pupils to the right of the horizontal line
6. 11 pupils in the top right-hand corner
7. 5 pupils in the bottom left-hand corner
8. Pupil F is the furthest away from the diagonal line with adifference of 10 marks
Table 3.2 example answers1. 7 + 6 × 2 + 5 × 3 = 7 + 12 +15 = 34
2. 34 ÷ 6 = 5.67 to 2 dp
Table 3.3 example answers1. Points = 6 × 7 = 42 + 3 = 45
2. Grade B (nearest to 45 points)
3. Grade D (6 × 5 + 3 = 30 + 3 = 33)
Answers 113
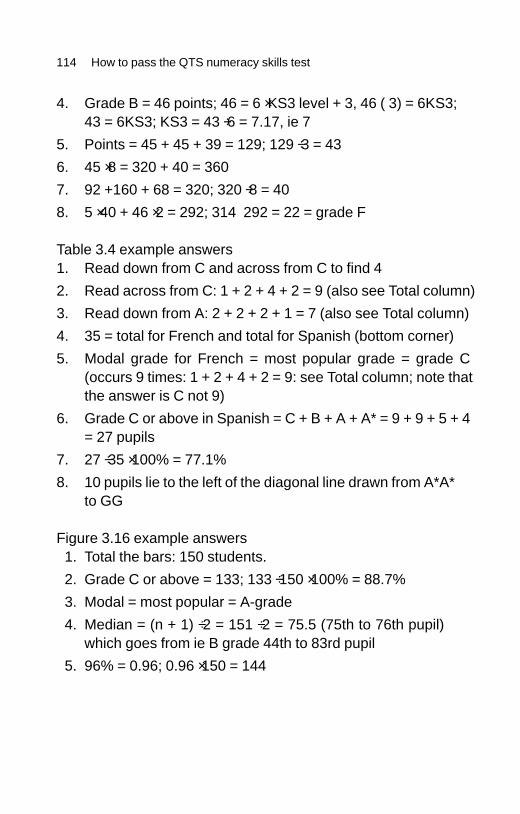
4. Grade B = 46 points; 46 = 6 × KS3 level + 3, 46 (– 3) = 6KS3;43 = 6KS3; KS3 = 43 ÷ 6 = 7.17, ie 7
5. Points = 45 + 45 + 39 = 129; 129 ÷ 3 = 43
6. 45 × 8 = 320 + 40 = 360
7. 92 +160 + 68 = 320; 320 ÷ 8 = 40
8. 5 × 40 + 46 × 2 = 292; 314 – 292 = 22 = grade F
Table 3.4 example answers1. Read down from C and across from C to find 4
2. Read across from C: 1 + 2 + 4 + 2 = 9 (also see Total column)
3. Read down from A: 2 + 2 + 2 + 1 = 7 (also see Total column)
4. 35 = total for French and total for Spanish (bottom corner)
5. Modal grade for French = most popular grade = grade C(occurs 9 times: 1 + 2 + 4 + 2 = 9: see Total column; note thatthe answer is C not 9)
6. Grade C or above in Spanish = C + B + A + A* = 9 + 9 + 5 + 4= 27 pupils
7. 27 ÷ 35 × 100% = 77.1%
8. 10 pupils lie to the left of the diagonal line drawn from A*A*to GG
Figure 3.16 example answers1. Total the bars: 150 students.
2. Grade C or above = 133; 133 ÷ 150 × 100% = 88.7%
3. Modal = most popular = A-grade
4. Median = (n + 1) ÷ 2 = 151 ÷ 2 = 75.5 (75th to 76th pupil)which goes from ie B grade 44th to 83rd pupil
5. 96% = 0.96; 0.96 × 150 = 144
114 How to pass the QTS numeracy skills test
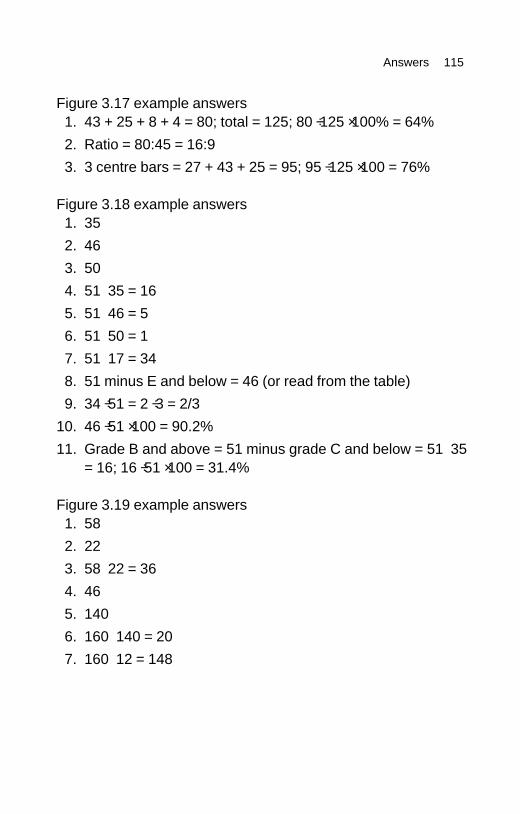
Figure 3.17 example answers1. 43 + 25 + 8 + 4 = 80; total = 125; 80 ÷ 125 × 100% = 64%
2. Ratio = 80:45 = 16:9
3. 3 centre bars = 27 + 43 + 25 = 95; 95 ÷ 125 × 100 = 76%
Figure 3.18 example answers1. 35
2. 46
3. 50
4. 51 – 35 = 16
5. 51 – 46 = 5
6. 51 – 50 = 1
7. 51 – 17 = 34
8. 51 minus E and below = 46 (or read from the table)
9. 34 ÷ 51 = 2 ÷ 3 = 2/3
10. 46 ÷ 51 × 100 = 90.2%
11. Grade B and above = 51 minus grade C and below = 51 – 35= 16; 16 ÷ 51 × 100 = 31.4%
Figure 3.19 example answers1. 58
2. 22
3. 58 – 22 = 36
4. 46
5. 140
6. 160 – 140 = 20
7. 160 – 12 = 148
Answers 115
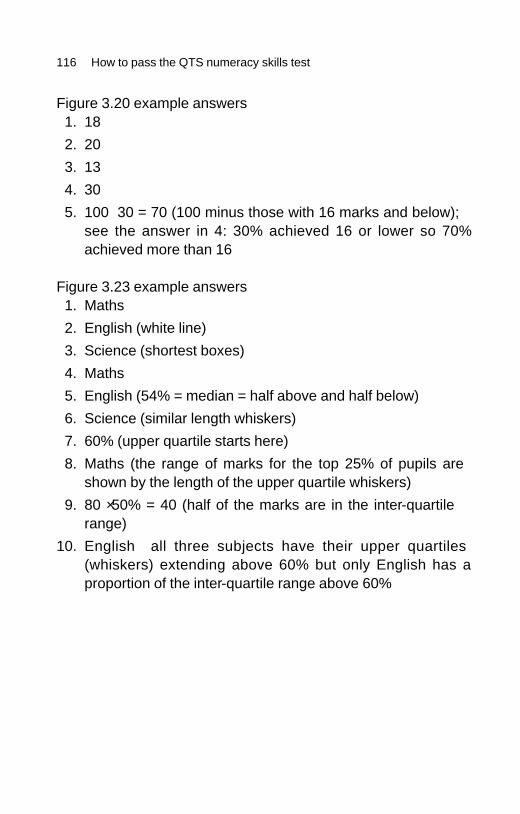
Figure 3.20 example answers1. 18
2. 20
3. 13
4. 30
5. 100 – 30 = 70 (100 minus those with 16 marks and below);see the answer in 4: 30% achieved 16 or lower so 70%achieved more than 16
Figure 3.23 example answers1. Maths
2. English (‘white line’)
3. Science (shortest boxes)
4. Maths
5. English (54% = median = half above and half below)
6. Science (similar length whiskers)
7. 60% (upper quartile starts here)
8. Maths (the range of marks for the top 25% of pupils areshown by the length of the upper quartile whiskers)
9. 80 × 50% = 40 (half of the marks are in the inter-quartilerange)
10. English – all three subjects have their upper quartiles(whiskers) extending above 60% but only English has aproportion of the inter-quartile range above 60%
116 How to pass the QTS numeracy skills test
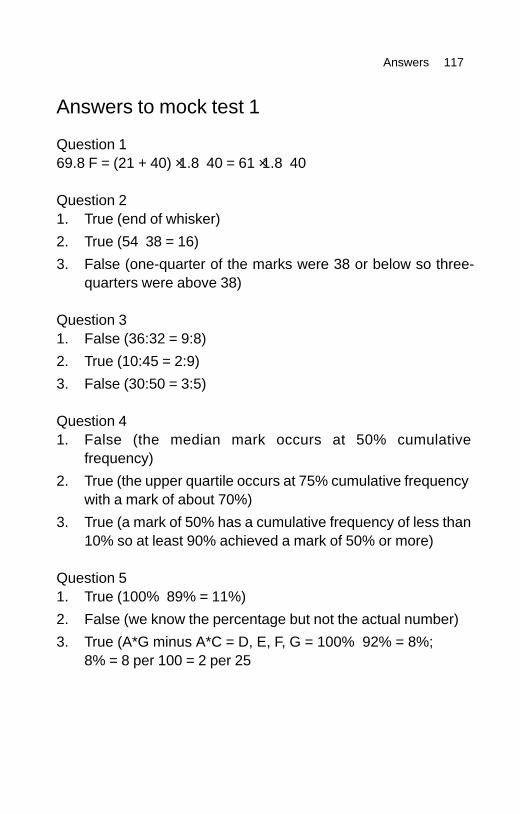
Answers to mock test 1
Question 169.8 F = (21 + 40) × 1.8 – 40 = 61 × 1.8 – 40
Question 21. True (end of whisker)
2. True (54 – 38 = 16)
3. False (one-quarter of the marks were 38 or below so three-quarters were above 38)
Question 31. False (36:32 = 9:8)
2. True (10:45 = 2:9)
3. False (30:50 = 3:5)
Question 41. False (the median mark occurs at 50% cumulative
frequency)
2. True (the upper quartile occurs at 75% cumulative frequencywith a mark of about 70%)
3. True (a mark of 50% has a cumulative frequency of less than10% so at least 90% achieved a mark of 50% or more)
Question 51. True (100% – 89% = 11%)
2. False (we know the percentage but not the actual number)
3. True (A*–G minus A*–C = D, E, F, G = 100% – 92% = 8%;8% = 8 per 100 = 2 per 25
Answers 117
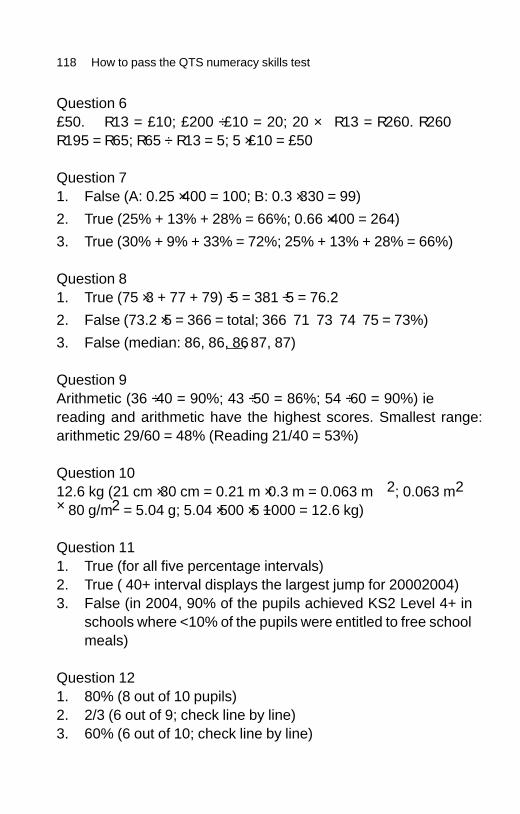
Question 6£50. R13 = £10; £200 ÷ £10 = 20; 20 × R13 = R260. R260 –R195 = R65; R65 ÷ R13 = 5; 5 × £10 = £50
Question 71. False (A: 0.25 × 400 = 100; B: 0.3 × 330 = 99)
2. True (25% + 13% + 28% = 66%; 0.66 × 400 = 264)
3. True (30% + 9% + 33% = 72%; 25% + 13% + 28% = 66%)
Question 81. True (75 × 3 + 77 + 79) ÷ 5 = 381 ÷ 5 = 76.2
2. False (73.2 × 5 = 366 = total; 366 – 71 – 73 – 74 – 75 = 73%)
3. False (median: 86, 86, 86, 87, 87)
Question 9Arithmetic (36 ÷ 40 = 90%; 43 ÷ 50 = 86%; 54 ÷ 60 = 90%) iereading and arithmetic have the highest scores. Smallest range:arithmetic 29/60 = 48% (Reading 21/40 = 53%)
Question 1012.6 kg (21 cm × 30 cm = 0.21 m × 0.3 m = 0.063 m2; 0.063 m2× 80 g/m2 = 5.04 g; 5.04 × 500 × 5 ÷1000 = 12.6 kg)
Question 111. True (for all five percentage intervals)2. True ( 40+ interval displays the largest jump for 2000–2004)3. False (in 2004, 90% of the pupils achieved KS2 Level 4+ in
schools where <10% of the pupils were entitled to free schoolmeals)
Question 121. 80% (8 out of 10 pupils)2. 2/3 (6 out of 9; check line by line)3. 60% (6 out of 10; check line by line)
118 How to pass the QTS numeracy skills test
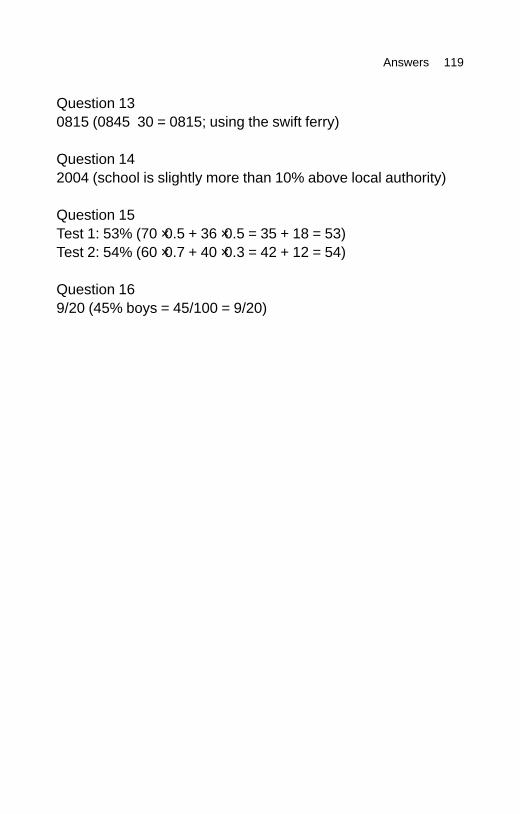
Question 130815 (0845 – 30 = 0815; using the swift ferry)
Question 142004 (school is slightly more than 10% above local authority)
Question 15Test 1: 53% (70 × 0.5 + 36 × 0.5 = 35 + 18 = 53)Test 2: 54% (60 × 0.7 + 40 × 0.3 = 42 + 12 = 54)
Question 169/20 (45% boys = 45/100 = 9/20)
Answers 119
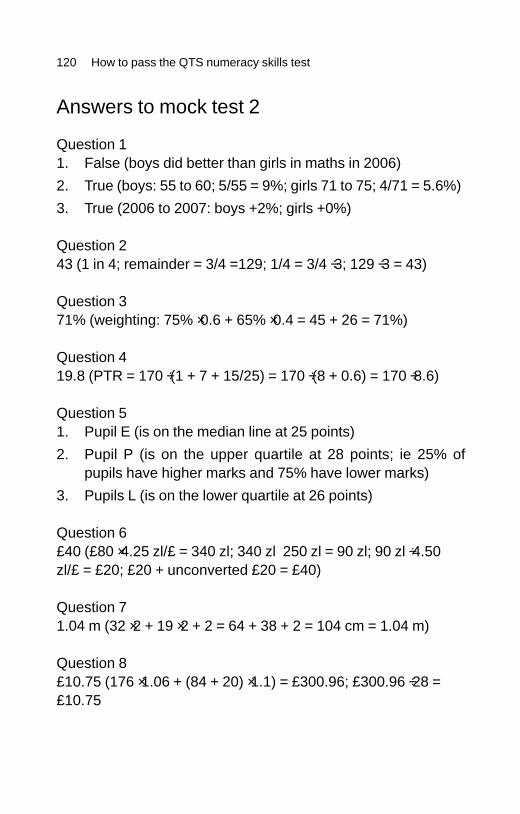
Answers to mock test 2
Question 11. False (boys did better than girls in maths in 2006)
2. True (boys: 55 to 60; 5/55 = 9%; girls 71 to 75; 4/71 = 5.6%)
3. True (2006 to 2007: boys +2%; girls +0%)
Question 243 (1 in 4; remainder = 3/4 =129; 1/4 = 3/4 ÷ 3; 129 ÷ 3 = 43)
Question 371% (weighting: 75% × 0.6 + 65% × 0.4 = 45 + 26 = 71%)
Question 419.8 (PTR = 170 ÷ (1 + 7 + 15/25) = 170 ÷ (8 + 0.6) = 170 ÷ 8.6)
Question 51. Pupil E (is on the median line at 25 points)
2. Pupil P (is on the upper quartile at 28 points; ie 25% ofpupils have higher marks and 75% have lower marks)
3. Pupils L (is on the lower quartile at 26 points)
Question 6£40 (£80 × 4.25 zl/£ = 340 zl; 340 zl – 250 zl = 90 zl; 90 zl ÷ 4.50zl/£ = £20; £20 + unconverted £20 = £40)
Question 71.04 m (32 × 2 + 19 × 2 + 2 = 64 + 38 + 2 = 104 cm = 1.04 m)
Question 8£10.75 (176 × 1.06 + (84 + 20) × 1.1) = £300.96; £300.96 ÷ 28 =£10.75
120 How to pass the QTS numeracy skills test
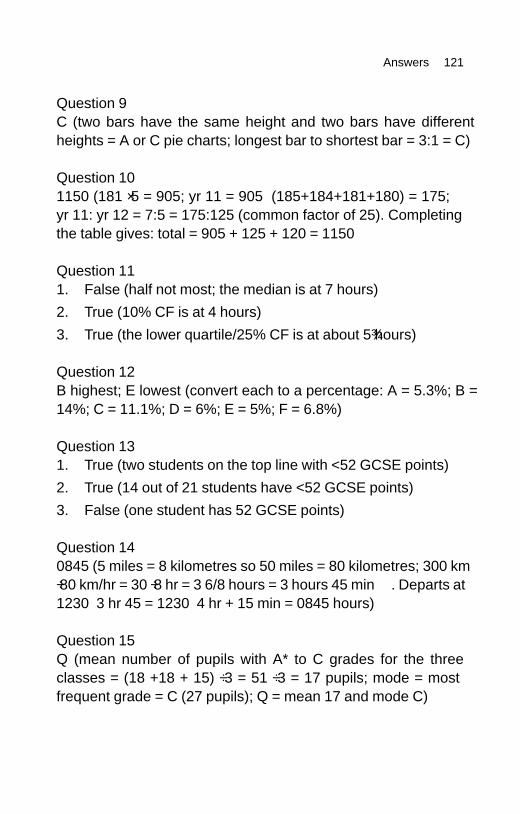
Question 9C (two bars have the same height and two bars have differentheights = A or C pie charts; longest bar to shortest bar = 3:1 = C)
Question 101150 (181 × 5 = 905; yr 11 = 905 – (185+184+181+180) = 175;yr 11: yr 12 = 7:5 = 175:125 (common factor of 25). Completingthe table gives: total = 905 + 125 + 120 = 1150
Question 111. False (half not most; the median is at 7 hours)
2. True (10% CF is at 4 hours)
3. True (the lower quartile/25% CF is at about 5¾ hours)
Question 12B highest; E lowest (convert each to a percentage: A = 5.3%; B =14%; C = 11.1%; D = 6%; E = 5%; F = 6.8%)
Question 131. True (two students on the top line with <52 GCSE points)
2. True (14 out of 21 students have <52 GCSE points)
3. False (one student has 52 GCSE points)
Question 140845 (5 miles = 8 kilometres so 50 miles = 80 kilometres; 300 km÷ 80 km/hr = 30 ÷ 8 hr = 3 6/8 hours = 3 hours 45 min. Departs at1230 – 3 hr 45 = 1230 – 4 hr + 15 min = 0845 hours)
Question 15Q (mean number of pupils with A* to C grades for the threeclasses = (18 +18 + 15) ÷ 3 = 51 ÷ 3 = 17 pupils; mode = mostfrequent grade = C (27 pupils); Q = mean 17 and mode C)
Answers 121
Question 16B (B = 0.4 or 40%; with to without ratios: A = 250:700 (0.36); B= 100:250 (0.4); C = 150:400 (0.375); D = 50:200 = 0.25)
122 How to pass the QTS numeracy skills test
123
Glossary
AccuracyOf a calculated value, the degree of closeness to the actual value.see also decimal place, rounding
AlgebraThe use of letters and symbols in place of numbers to representthe structure of a formula or relationship between numbers.eg y = mx + c
Arithmetical operationA function performed on two or more ‘input’ numbers to create anew number, for example addition, subtraction, multiplication ordivision.see also BIDMAS
Bar chartA statistical graph where data is displayed as a series of vertical orhorizontal bars; can be grouped or stacked.
BIDMASThe order in which arithmetical operations should be performed.Brackets first, then indices (’powers’), followed by division andmultiplication and finally addition and subtraction.
CohortA statistical term used to define a population.eg this year’s GCSE maths cohort
ConversionAn exchange from one unit to another.eg pence to pounds, kilometres to metres, minutes to hours
CorrelationThe strength of a relationship between two variables, such asgrade in GCSE maths versus QTS results.
Cumulative frequencyThe sum of the frequencies of an event recorded at differentstages, from the beginning to the current position.
Decimal fractionA number less than 1, where a decimal point precedes the tenth,hundredth and thousandth, etc.eg 0.732
Decimal numberA number that contains both a whole number and a decimalfraction.eg 3.75
Decimal place (dp)The number of digits to the right of a decimal point in a decimalnumber.eg 2.75 rounded to 1dp = 2.8
DenominatorThe bottom number of a fraction.
DistributionA statistical term that describes the spread of the data.
124 Glossary

Drag and drop questionsAn on-screen test format. Here you click on the correct answer,then drag it to its correct location.
EquationA mathematical statement where two sides are shown to be equalto each other.eg a = b + c
FormulaSimilar to an equation, but often identifies a rule.eg to convert Centigrade to Fahrenheit, F = 1.8C + 32.
FractionPart of a whole; the denominator (bottom number) is the numberof equal parts that the numerator (top) is divided into.
FrequencyA measure of the number of times that something occurs.
Greater than symbolThe symbol >eg x is greater than five: x >5see also less than symbol
HistogramA statistical chart similar to a bar chart, but showing continuousdata (such as age ranges) rather than discrete data (such ascolours).
IntegerA positive or negative whole number, or zero.
Interquartile rangeThe difference between the upper quartile and the lower quartile,which represents the middle 50 per cent of the data.
Glossary 125
KSIn education, Key Stages. KS1 = ages 4 to 7; KS2 = ages 7 to 11;KS3 = ages 11 to 14 and KS4 = ages 14 to 16.
Less than symbolThe symbol <eg x is less than five: x <5see also greater than symbol
Line graphData is plotted as a series of points joined by a line. Useful forshowing trends, ie increases and decreases.
Lower quartileIn statistics, the mark below which one-quarter of the marks lie(the bottom 25 per cent of the range); 75 per cent of the marks lieabove it.
MeanA value found by dividing the total of all of a group of numbersby how many numbers there are in that group; the ‘average’.see also median, mode
MeasurementThe determination of length, weight, volume or any otherquantity.
MedianThe middle number in a group of numbers that have been placedin numerical order, from smallest to the largest.see also mean, mode
Mental arithmeticMaths calculations worked out without using a calculator.
126 Glossary
ModeThe value that occurs the most often in a group of numbers.see also mean, median
More than symbolsame as greater than symbol
Multiple choice questionsA test format. This offers several alternative answers where onlyone is correct.eg ‘How many degrees make a full circle?’a) 180 degreesb) 360 degreesc) 720 degrees
NORNumber on roll: the number of pupils enrolled at a school.
NumeratorThe top number of a fraction.
On-screen questionsA test format. The answers are inputted using the mouse orkeyboard.
PercentageA fraction with a denominator of 100; a fraction expressed inhundredths.
Percentage changeThe change in a value (increase or decrease) divided by theoriginal value and multiplied by 100 per cent.
Percentage pointOne per cent, used to express the difference between twopercentages.eg the difference between 50 per cent and 60 per cent is 10percentage points
Glossary 127
PercentileWhen results are placed in order of rank and divided into 100 equalparts, the value at or below which that percentage of results falls.eg the 70th percentile of test marks = the mark at or below which70 per cent of results fall
Pie chartA statistical graph in which a full circle (360 degrees) equals 100per cent of the data. So half of the circle = 180 degrees = 50 percent of the data; a quarter of the circle = 90 degrees = 25 per cent,etc.
PredictionThe forecasting or extrapolation of pupils’ future results based oncurrent performance.
QuartileOne of four quarter parts that results are divided into, by the25th, 50th and 75th percentiles.
RangeThe difference between the highest value and the lowest value in adata spread.
RatioTwo or more quantities compared as either whole numbers orfractions.eg 2 parts to 5 parts; 2:5 = 2/7 and 5/7
Raw scoreA result showing the actual marks that the person scored on aparticular test.see also standardised score
Reading ageIn a reading test, the national average score for a child. Forexample, most 10-year-olds will have a reading age of 10.
128 Glossary
RoundingA method for simplifying numbers to the required level ofaccuracy, to the nearest 10, 100, 1000, etc.eg 178 rounded up to the nearest 10 = 180; to the nearest hundred= 200, etc.
SATsStandardized Assessments Tasks; tests set at the end of each yearto show pupil progress.
Scale1. A graduation mark on an axis or ruler.2. A way of showing how one measurement relates to another, eg
on a map or chart.eg 1:50,000 (1 cm = 0.5 km)
Scatter graphA statistical graph plotting paired or related data, eg height andweight, to show whether or not a correlation exists.
SectorA ‘wedge’ or part of a circle, as used to represent a percentage ina pie chart.see also pie chart
Single response questionsA test format. Enter the correct answer in the way requested.eg if asked to ‘express the amount to the nearest pound’, for‘£10.75’ you would enter ‘£11’
Standardised scoreA raw score that has been converted to take account of someother factor, eg age.see also raw score
TableA way of displaying data using a grid.
Glossary 129
Tally chartA table that is used to record the frequency of data.
TrendA pattern, sequence or series; the general direction in whichsomething is tending to move, eg upwards or downwards.
Two-way tableA table that is useful for comparing pupil performance in twosubjects or in two different years.
UnityThe number one (1).
130 Glossary
131
ALSO AVAILABLE FROM KOGAN PAGE
ISBN: 978 0 7494 5162 2 Paperback 2008
Order online now at www.koganpage.comSign up for regular e-mail updates on newKogan Page books in your interest area
132
ALSO AVAILABLE FROM KOGAN PAGE
ISBN: 978 0 7494 5333 6 Paperback 2009
Order online now at www.koganpage.comSign up for regular e-mail updates on newKogan Page books in your interest area
133
ALSO AVAILABLE FROM KOGAN PAGE
ISBN: 978 0 7494 5416 6 Paperback 2008
Order online now at www.koganpage.comSign up for regular e-mail updates on newKogan Page books in your interest area
134
ALSO AVAILABLE FROM KOGAN PAGE
ISBN: 978 0 7494 4969 8Paperback 2008
ISBN: 978 0 7494 4421 1Paperback 2005
ISBN: 978 0 7494 5229 2Paperback 2008
ISBN: 978 0 7494 5064 9Paperback 2007
Order online now at www.koganpage.comSign up for regular e-mail updates on newKogan Page books in your interest area
135
ALSO AVAILABLE FROM KOGAN PAGE
ISBN: 978 0 7494 5106 6Paperback 2007
ISBN: 978 0 7494 4954 4Paperback 2007
ISBN: 978 0 7494 4852 3Paperback 2007
ISBN: 978 0 7494 5165 3Paperback 2008
Order online now at www.koganpage.comSign up for regular e-mail updates on newKogan Page books in your interest area
136
ALSO AVAILABLE FROM KOGAN PAGE
ISBN: 978 0 7494 4819 6Paperback 2006
ISBN: 978 0 7494 5237 7Paperback 2008
ISBN: 978 0 7494 4931 5Paperback 2007
ISBN: 978 0 7494 3887 6Paperback 2003
Order online now at www.koganpage.comSign up for regular e-mail updates on newKogan Page books in your interest area
137
ALSO AVAILABLE FROM KOGAN PAGE
ISBN: 978 0 7494 4946 9Paperback 2007
ISBN: 978 0 7494 4971 1Paperback 2008
ISBN: 978 0 7494 4853 0Paperback 2007
ISBN: 978 0 7494 5161 5Paperback 2008
Order online now at www.koganpage.comSign up for regular e-mail updates on newKogan Page books in your interest area

138
You’re reading one of the thousands of bookspublished by Kogan Page, Europe’s largestindependent business publisher. We publish a rangeof books and electronic products covering business,management, marketing, logistics, HR, careers andeducation. Visit our website today and sharpen yourmind with some of the world’s finest thinking.
Don’t let anyone tell you that
the world is flat
www.koganpage.com
Fresh thinking for business today