How to monitor Apache Tomcat with Verax NMS · Adding Apache Tomcat to device inventory ... This...
16
Monitoring Apache Tomcat with Verax NMS
Transcript of How to monitor Apache Tomcat with Verax NMS · Adding Apache Tomcat to device inventory ... This...

Monitoring Apache Tomcat with Verax NMS

Table of contents Abstract ......................................................................................................................................... 3
1. Adding Apache Tomcat to device inventory ...................................................................... 4
2. Adding sensors for Apache Tomcat .................................................................................... 7
3. Adding performance counters for Apache Tomcat ........................................................... 9
4. Creating custom event processing rules for Apache Tomcat ......................................... 11
5. Verax NMS Apache Tomcat plugin overview ................................................................... 12
Summary ..................................................................................................................................... 16
Monitoring Apache Tomcat with Verax NMS
Copyright © Verax Systems. All rights reserved. All trademarks in this document are legal property of their owners.
www.veraxsystems.com Page 3 of 16
DL725
Abstract This publication provides an overview on how to monitor and manage Apache Tomcat using Verax NMS (including the free Express edition available at http://www.veraxsystems.com/en/downloads - please read terms & conditions for limitations of the Express version).
Tools used: Apache Tomcat: http://tomcat.apache.org/tomcat-6.0-doc/ Monitoring tool: www.veraxsystems.com/en/products/nms
Agenda: 1. Adding Apache Tomcat to the list of monitored applications within Verax NMS.
2. Configuring availability sensors and performance counters for Apache Tomcat.
3. Verax NMS Apache Tomcat plugin features overview.
4. Setting up alarms and notification policies.

Monitoring Apache Tomcat with Verax NMS
Copyright © Verax Systems. All rights reserved. All trademarks in this document are legal property of their owners.
www.veraxsystems.com Page 4 of 16
DL725
1. Adding Apache Tomcat to device inventory In order to include Apache Tomcat to be monitored by Verax NMS, add an application instance to the device actually running this instance. Note: Verax NMS allows for creating multiple instances for applications of the same type on a single device. In order to add an Apache Tomcat to the device running its instance, perform the following steps:
1. Log in into the Verax NMS and select Home from the main menu.
2. Select a device running the Apache Tomcat instance from the left-side aspects view.
Figure 1: Aspect hierarchy tree
3. In Summary tab select Manage applications from the actions section.
Figure 2: Adding a new managed application
4. A pop-up dialog is displayed.

Monitoring Apache Tomcat with Verax NMS
Copyright © Verax Systems. All rights reserved. All trademarks in this document are legal property of their owners.
www.veraxsystems.com Page 5 of 16
DL725
Figure 3: Applications list dialog
5. Select Add application option from the context menu and click Go. A dialog window is displayed.
Choose Apache Tomcat from Application types.
Figure 4: Adding Apache Tomcat - parameters dialog
Verax NMS will ask to enter the following application-specific parameters:
Instance name - Name of the application instance. You can enter any name describing the monitored application instance.
Host - Address of the host running the application instance. In most cases, the host address is an IP address of the device the application instance is assigned to.
Port - Port of application server. User - Username used to connect to Apache Tomcat. Password - Password used to connect to Apache Tomcat.

Monitoring Apache Tomcat with Verax NMS
Copyright © Verax Systems. All rights reserved. All trademarks in this document are legal property of their owners.
www.veraxsystems.com Page 6 of 16
DL725
JMX Connection - Set jmx connection url JMX User – JMX username JMX Password – JMX password
Note: application-specific parameters depend on the selected application type.
6. Provide the necessary information and click Save changes.
7. The system will ask if you want to add a default set of sensors and counters for Apache Tomcat. Since, (in this example) sensors and performance will be added manually – click No.
8. The newly added Apache Tomcat is now visible in the aspect tree within the host’s node in Managed Applications category.
Figure 5: Apache Tomcat - properties window

Monitoring Apache Tomcat with Verax NMS
Copyright © Verax Systems. All rights reserved. All trademarks in this document are legal property of their owners.
www.veraxsystems.com Page 7 of 16
DL725
2. Adding sensors for Apache Tomcat Monitoring of Tomcat features in NMS uses the JMX protocol. This protocol should be properly configured on the Tomcat server side. This require the following Java parameters on server startup: set CATALINA_OPTS=-Dcom.sun.management.jmxremote \ -Dcom.sun.management.jmxremote.port=%my.jmx.port% \ -Dcom.sun.management.jmxremote.ssl=false \ -Dcom.sun.management.jmxremote.authenticate=false See the Tomcat documentation for details: http://tomcat.apache.org/tomcat-6.0-doc/monitoring.html Apache Tomcat instance can be monitored by:
Obtaining information and statistics on demand using Show advanced view action available on Summary tab which shows several views with major information about server as well as performance characteristics.
Collecting performance data by configuring performance counter using JMX counter or predefined JMX-based counter templates.
Checking application or service availability by configuring JMX-based sensor. Checking web application availability and measure user-experience by configuring HTTP sensor.
Sensors are active monitors periodically querying the device services for which they are configured and waiting for their responses. If a query is returned with an expected response, the queried service is considered "available." If a response is not received (timed out), or if the response is not as expected, the queried service is considered "unavailable". The system includes a number of pre-configured sensors. The following types of sensors for Apache Tomcat application type are available by default:
JMX Operation - Checks if given operation invoked by device JMX service returns a result for given MBean.
JMX Attribute – Checks if given attribute get by device JMX service returns a value for given MBean.
HTTP - Checks if device HTTP service gives a response defined in parameter "Response code" for given HTTP/HTTPS address and if regular expression is given if response body contains a string matching the expression.
In order to add a sensor, perform the following steps:
1. Select device from the aspect tree in Home view (Apache Tomcat in this case).
2. Select Monitors tab and switch to sensor list by clicking Sensor list link in the upper-right corner of the tab field. The sensor list is displayed.
3. Select Add from the global action menu and click Go. The wizard dialog is displayed.

Monitoring Apache Tomcat with Verax NMS
Copyright © Verax Systems. All rights reserved. All trademarks in this document are legal property of their owners.
www.veraxsystems.com Page 8 of 16
DL725
Figure 6: Adding a sensor
4. Select the sensor you want to add and click Next.
Figure 7: Specify sensor parameters
5. A dialog shows up with all sensor parameters to be provided. Specify the sensor parameters and click Finish.
6. Once the sensors have been added, they are visible on the sensor list (Monitors tab).
Monitoring Apache Tomcat with Verax NMS
Copyright © Verax Systems. All rights reserved. All trademarks in this document are legal property of their owners.
www.veraxsystems.com Page 9 of 16
DL725
3. Adding performance counters for Apache Tomcat Performance counters measure system activity and performance (metrics). The application retrieves their current values in predefined intervals. The aim of probing and collecting data is to analyze and convert the data into a performance graph/chart. The user can define a counter manually or load it from a template.
Performance counter templates are templates with defined probing parameters for specified devices in order to improve and speed up counter creation.
Each Verax NMS counter template is characterized by the following information:
Name and description - unique identifier and optional description,
Device type - type of a device,
Protocol type - protocol used,
Probing interval - pauses between probing.
Counter templates are needed when the counter creation method is set to "from template". Counter templates provide defined probing parameters for specified devices in order to improve and quicken counter creation.
In order to add Apache Tomcat performance counters, perform the following steps:
1. Select device from aspect tree in Home view.
2. Select Monitors tab and switch to the counter list by clicking Counter list link in the upper-right corner of the tab field. A counter list is displayed.
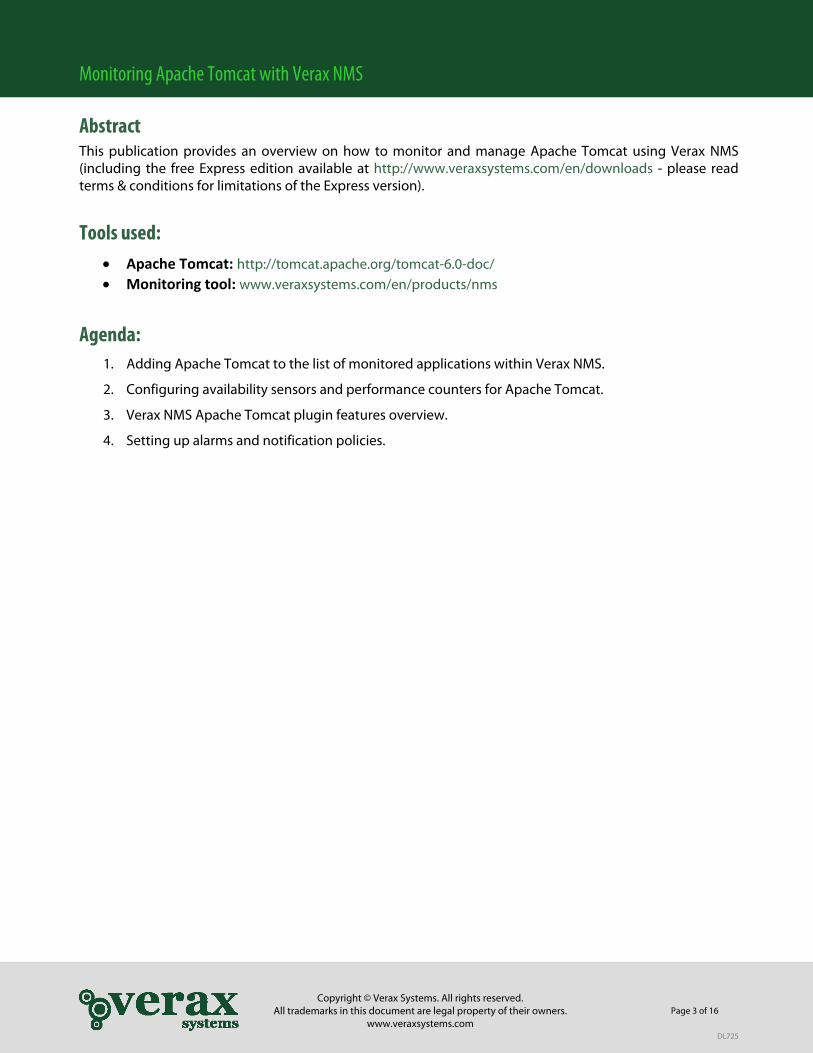
3. Select Create counter from the global action menu and click Go. Select the counter you want to create and click Next.
Figure 8: Adding counter for Apache Tomcat
Monitoring Apache Tomcat with Verax NMS
Copyright © Verax Systems. All rights reserved. All trademarks in this document are legal property of their owners.
www.veraxsystems.com Page 10 of 16
DL725
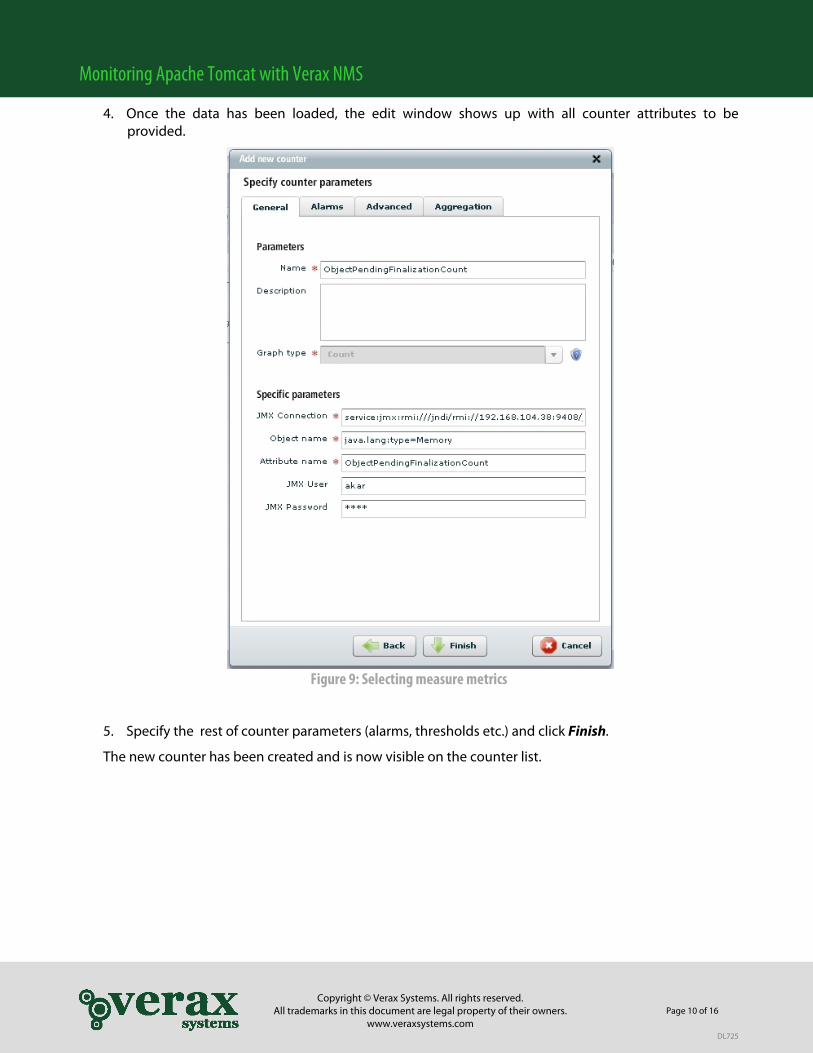
4. Once the data has been loaded, the edit window shows up with all counter attributes to be provided.
Figure 9: Selecting measure metrics
5. Specify the rest of counter parameters (alarms, thresholds etc.) and click Finish.
The new counter has been created and is now visible on the counter list.
Monitoring Apache Tomcat with Verax NMS
Copyright © Verax Systems. All rights reserved. All trademarks in this document are legal property of their owners.
www.veraxsystems.com Page 11 of 16
DL725
4. Creating custom event processing rules for Apache Tomcat Events are processed by Event Processing Rules running under control of the Event Processing Engine. The Event Processing Engine within the system is able to process events fast without materializing them in database. Verax NMS comes with a set of embedded, flexibly customized processing rules such as: De-duplication, Pairwise matching, Event forwarding, Intermittent failure, Scheduled Maintenance, etc. It also provides users with the ability to implement their own processing rules using JRuby scripting language. Verax NMS provides complex fault management, such as alarm collection, filtering, blocking, thresholds and correlation (scripted, user-defined rules defining business logic for alarm correlation, cleaning, root-cause, etc.) as well as alarm management actions, e.g. assignment, change of status, clearing, annotation and others. It also enables users to create alarms based on network data etc. In this example we will show how to assign basic event processing rules:
Alarm generating
Event dropping
Event forwarding
Severity assigning
To assign an event processing rule, perform the following steps:
1. After selecting the desired host go to Events tab.
2. Select events, choose Assign processing rules and click Go.
3. A dialog window is displayed (see figure below).
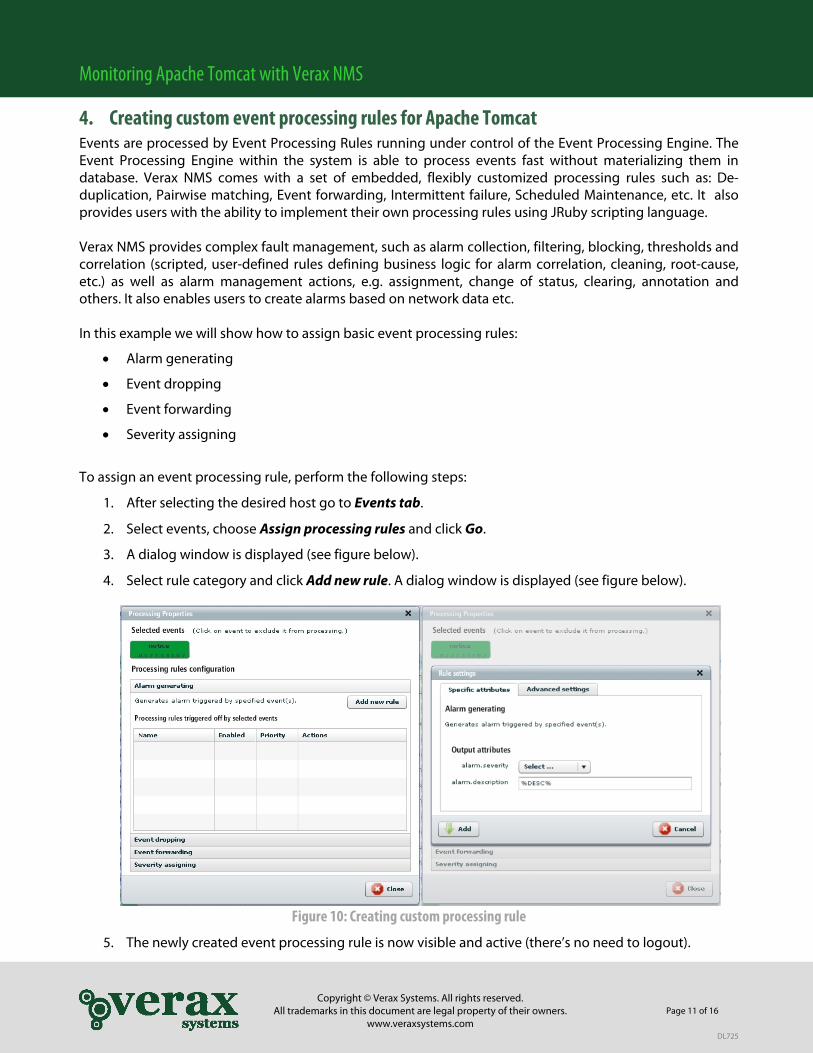
4. Select rule category and click Add new rule. A dialog window is displayed (see figure below).
Figure 10: Creating custom processing rule
5. The newly created event processing rule is now visible and active (there’s no need to logout).

Monitoring Apache Tomcat with Verax NMS
Copyright © Verax Systems. All rights reserved. All trademarks in this document are legal property of their owners.
www.veraxsystems.com Page 12 of 16
DL725
5. Verax NMS Apache Tomcat plugin overview Verax NMS Apache Tomcat plugin is characterized with the following features:
Detailed configuration information: installed, running and suspended applications, JVM information (version, memory statistics), host platform and others.
Server resource usage: request processors, connectors and thread pools statistics, average response times and others.
Application information: current sessions, peak sessions, servlet performance, application status, invalid requests and others.
JMX sensors and counters to monitor JMX attributes and operation, with predefined templates (e.g. threads, CPU, memory).
General information view In the General tab, one may find the overall information about Tomcat version, OS Name and version, JVM vendor and version, JVM info, Control port, Average Response Time. It also contains dashboard view with charts for response summary and threads availability
Figure 11: Verax NMS Apache Tomcat plugin - general view

Monitoring Apache Tomcat with Verax NMS
Copyright © Verax Systems. All rights reserved. All trademarks in this document are legal property of their owners.
www.veraxsystems.com Page 13 of 16
DL725
Applications view
Applications view provides information concerning applications status: current sessions, peak sessions as well as servlets and page performance: URL and average response time.
Figure 12: Verax NMS Apache Tomcat plugin - applications view
Monitoring Apache Tomcat with Verax NMS
Copyright © Verax Systems. All rights reserved. All trademarks in this document are legal property of their owners.
www.veraxsystems.com Page 14 of 16
DL725
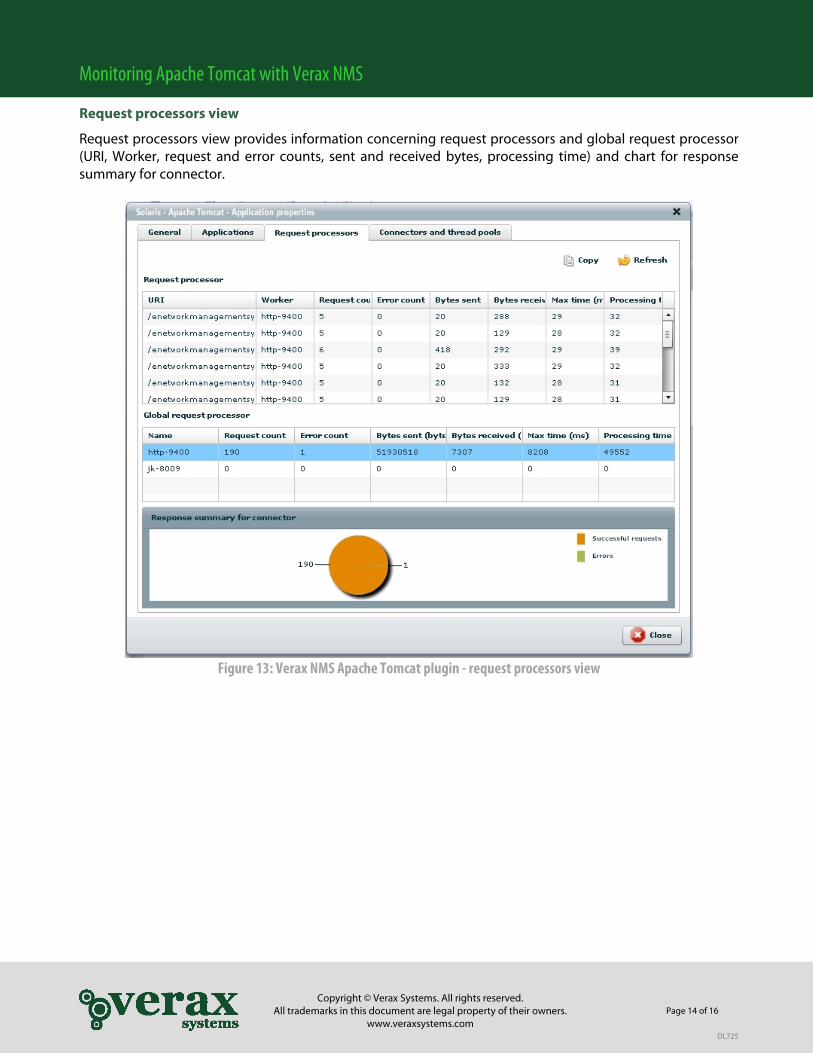
Request processors view
Request processors view provides information concerning request processors and global request processor (URI, Worker, request and error counts, sent and received bytes, processing time) and chart for response summary for connector.
Figure 13: Verax NMS Apache Tomcat plugin - request processors view

Monitoring Apache Tomcat with Verax NMS
Copyright © Verax Systems. All rights reserved. All trademarks in this document are legal property of their owners.
www.veraxsystems.com Page 15 of 16
DL725
Connectors and thread pools view
Connectors and thread pools view provides information concerning connectors parameters (port, protocol, secure, redirect port, max post size), thread pool (name, current threads busy, current threads count, max spare threads) and chart for threads availability.
Figure 14: Verax NMS Apache Tomcat plugin - connectors and thread view
Monitoring Apache Tomcat with Verax NMS
Copyright © Verax Systems. All rights reserved. All trademarks in this document are legal property of their owners.
www.veraxsystems.com Page 16 of 16
DL725
Summary If you performed all actions described in chapters 1-5 you are now able to monitor Apache Tomcat application.