How to maximise the profit from customers & products in cement plants George Handley MBA Management...
19
How to maximise the profit from customers & products in cement plants George Handley MBA Management Consultants
-
Upload
kory-wiggins -
Category
Documents
-
view
217 -
download
0
Transcript of How to maximise the profit from customers & products in cement plants George Handley MBA Management...

How to maximise the profit from customers & products in
cement plantsGeorge Handley
MBA Management Consultants

Top ways to increase profits quickly……
Dogs and cows insert diagram
LEAGUE TABLES OF CUSTOMER PROFITABILITY
FIND BOTTLENECKS & MAXIMISE PROFIT
Company has a large number of very profitable customers, large and small
0.0%
10.0%
20.0%
30.0%
40.0%
50.0%
60.0%
70.0%
80.0%
90.0%
100.0%
1 10 100 1000 10000 100000 1000000
£ size of customer
gro
ss p
rofi
t
MILK COWS & SHOOT DOGS
OPTIMISE ALL PRODUCTION & DISTRIBUTION
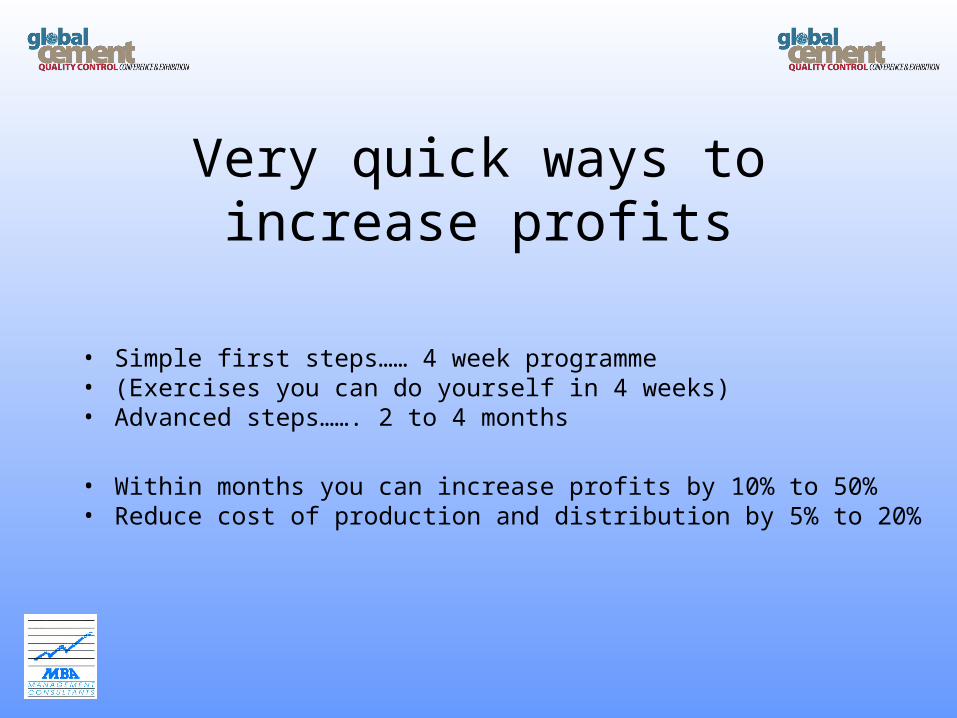
Very quick ways to increase profits
• Simple first steps…… 4 week programme• (Exercises you can do yourself in 4 weeks)• Advanced steps……. 2 to 4 months
• Within months you can increase profits by 10% to 50%• Reduce cost of production and distribution by 5% to 20%
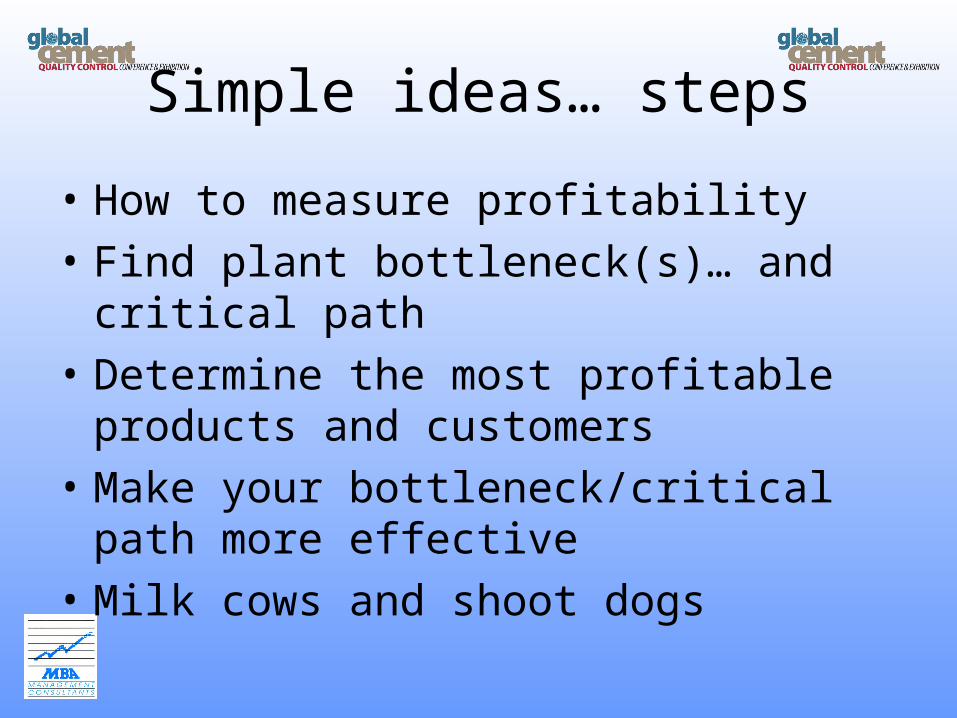
Simple ideas… steps
• How to measure profitability
• Find plant bottleneck(s)… and critical path
• Determine the most profitable products and customers
• Make your bottleneck/critical path more effective
• Milk cows and shoot dogs

Why throughput, critical path and bottlenecks are important
• Added value per kiln hour varies from $1,300/hr up to $9,750/hr depending on product and customer
• An inefficient plant can still double added value and increase profits tenfold by changing marketing mix
• The smaller the plant the easier this is to achieve
• Many investments are a waste of money• Cost/tonne is a poor way to measure cost• Use cost/bottleneck-hr & profit/bottleneck-hr

Exercises you can do yourself
• Find the critical path and bottlenecks
• League table of customer & product profit at bottlenecks
• Create Boston Grid of cows and dogs

How to measure profitability
• Use added value per hour on bottleneck
• First find the bottleneck
• Then calculate the added value of each customer and product on the bottleneck
• Create a league table for customers
• Create a league table for products
• Get rid of dog customers

Finding the bottleneck
• Make a diagram of the plant… about 10 to 20 boxes
• Mark the non-constrained boxes in green• Mark the constrained boxes in red• Join up the boxes in main process
sequence• This is the critical path• The red boxes on the critical path are
bottlenecks


KILN
MILLS
SILOS
CRUSH
IF KILN IS BOTTLENECK…..SWITCH TO HIGH ADDED VALUE/KILN HR CUSTOMERS/PRODUCTS…. THEY ADD LOTS OF VALUE AFTER KILN

KILN
MILLS
SILOS
CRUSH
IF MILLS ARE BOTTLENECK…..SWITCH TO HIGH ADDED VALUE/MILL HR CUSTOMERS/PRODUCTS…. THEY ADD LOTS OF VALUE AFTER MILL…BAGGED/ADDITIVES

Profit on the critical path/bottleneck• For every customer calculate…• Added value (price-materials-energy-transport-
packaging)• Calculate added value per bottleneck hour• Create a league table of customer added value
per hour• Remove the worst customer added value per
hour until bottleneck is free/removed• Always compare bottleneck investment to worst
customers through the bottleneck

Company has a large number of very profitable customers, large and small
0.0%
10.0%
20.0%
30.0%
40.0%
50.0%
60.0%
70.0%
80.0%
90.0%
100.0%
1 10 100 1000 10000 100000 1000000
£ size of customer
gro
ss
pro
fit
Each dot is a customer
DOGS, STARS, CASHCOWS, & PROBLEMS
Busy foolsA
dd
ed
val
ue
pe
r h
ou
r
Customer sizesmall
largelow
highaverage
average

Do’s and Don’ts
• Do not invest in or speed up a non-bottleneck• Only invest in bottlenecks• All investment is paid for by the least profitable
products and customers that will use the investment
• If bottleneck is a very expensive process, change the products and customers that use it/improve the mix/ remove & find more
• If the bottleneck is not expensive, buy more capacity

Advanced steps
• A linear programming optimisation model of production and distribution to optimise complex groups of resources
• Optimise pricing to maximise profits in market
• Optimise distribution to minimise costs
• Capacity investment plan

examples
• European group of 3 plants reduced total production & distribution cost by 18%
• A small producer improved customer and product mix…. Profits increased by 30%
• One plant dropped 3 simple products and doubled bagging capacity. Customer profit increased by 25%
• A major group reduced distribution cost by 12%• Used by the world’s top 2 groups
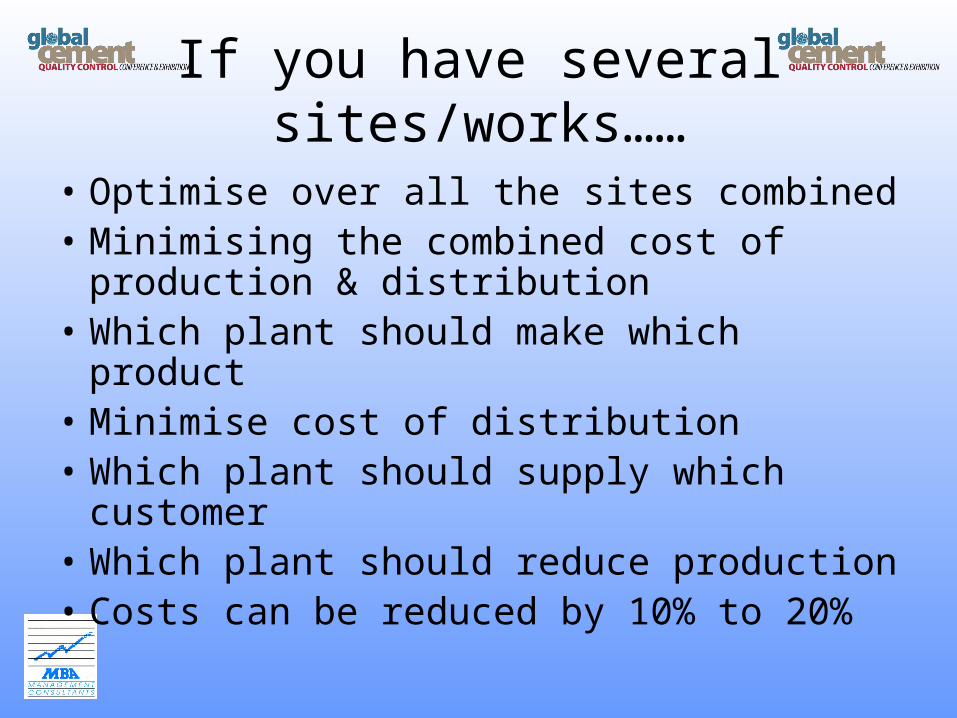
If you have several sites/works……
• Optimise over all the sites combined• Minimising the combined cost of
production & distribution• Which plant should make which product• Minimise cost of distribution• Which plant should supply which customer• Which plant should reduce production• Costs can be reduced by 10% to 20%

Benefits
• No major investment• Short time scale• In a reduced market, increase profits by
– Reduction in production & distribution cost per tonne
– Sell to high profit customers, even at lower prices
– Maximise yield from plant– Decide which plant to scale down/reduce

How to maximise the profit from customers & products in
cement plantsGeorge Handley
MBA Management Consultants