How to make the best use of output metrics
37
| 0 How to make the best use of output metrics Herman Strøm Universitetet i Oslo | Senior Adviser - Education and Research Administration Office Guillaume Warnan Elsevier | Research Intelligence Consultant NARMA Workshop Oslo | 21 April 2016
Transcript of How to make the best use of output metrics

| 0
How to make the
best use of
output metrics
Herman Strøm Universitetet i Oslo | Senior Adviser -
Education and Research Administration Office
Guillaume Warnan
Elsevier | Research Intelligence Consultant
NARMA Workshop
Oslo | 21 April 2016

| 1
Main points covered in this presentation
• Factors that affect metrics
• The example of CRIStin data in SciVal
- Short introduction to SciVal
- Example of UiO
- Live demo in SciVal
• Q&A
| 2
Factors that affect metrics

| 3
“Non-performance variables” may need to be taken
into account when using metrics
Size
Discipline
Age (Output/Researcher)
Larger entities will tend to have higher metrics when size is a factor
Working habits differ from one discipline to another, such as citation or collaboration patterns
Older outputs (as more senior researchers) have had more time to attract attention, and to receive higher counts of interest
Data source Any metric is linked to a specific data source. The same metric might differ from one data source to another
1
2
3
4

| 4
Size: bigger does not necessarily mean better 1
Source: SciVal (Scopus data up to 29 Feb 2016)

| 5
Age: different metrics require different time windows 2
Example: views vs. citations

| 6
Age: different metrics require different time windows 2
Example: patent-cited scholarly output
Source: SciVal (Scopus data up to 29 Feb 2016)

| 7
Researchers’ age also affect some metrics such as
the H-Index 2
Source: SciVal (Scopus data up to 29 Feb 2016)
Prof. dr. Luc Soete Rector Magnificus Maastricht University H-Index: 14
Dr. Arvid Hoffmann Associate Professor of Finance Maastricht University H-Index: 5
The H-Index is one of the sole metrics that can only increase, even if you do nothing

| 8
Citation patterns vary greatly from one discipline to
another 3
Subject area # citations
per pub.
Overall 5.7
Medicine 6.8
Engineering 3.5
Materials Science 6.9
Arts and Humanities 1.9
Social Sciences 2.8
Agri. and Bio. Sciences 6.7
Subject area # citations
per pub.
Overall Medicine 6.8
Anatomy 6.3
Biochemistry (medical) 8.9
Dermatology 4.8
Embryology 7.2
Family Practice 2.8
Health Informatics 3.3
Between “large” disciplines Within a discipline (Social Sciences)
Source: SciVal (Scopus data up to 29 Feb 2016); 2010-2014

| 9
Source: Pohl H, WarnanG, and Baas J (2014) Level the playing field in scientific international collaboration with
the use of a new indicator: Field-Weighted Internationalization Score, Research Trends 39, 3-8.
Share of international co-publications per scientific field 2009 and 2013 . Source: Scopus
Collaboration patterns differ between disciplines 3

| 10
Age – Potential interest in normalized metrics 3
• Normalized metrics give the ability to address discipline discrepancies
• For example Outputs in Top Percentiles (field-weighted)
• Many other normalized metrics are available such as FWC (for
international collaborations), FWVI (usage), SNIP (journal), etc.
• Non-normalized metrics are still useful in some situations. They tend to
be more straightforward and transparent than normalized metrics,
lending themselves more easily to validation.

| 11
Source: “Response to HEFCE’s call for evidence: independent review of the role of metrics in research
assessment”, Elsevier, June 2014
Some disciplines might require some more qualitative
input 3

| 12
Data source 4

| 13
Metrics should also be carefully selected to ensure that
they are appropriate to the question being asked
Which metrics should you use? Snowball Metrics!
Recipes in first recipe
book
Recipes added in
second recipe book

| 14
The example of CRIStin data in
SciVal

| 15
Introduction to SciVal

| 16
SciVal at a glance
SciVal offers quick, easy access to the research performance of 220 nations and
7,000+ research institutions worldwide.
Overview
Visualize
research
performance
Benchmarking
Benchmark your
progress
Collaboration
Develop
collaborative
partnerships
Ready-made-at a
glance snapshots of
any selected entity
Flexibility to create
and compare any
research groups
Identify and analyze
existing and potential
collaboration
opportunities
Trends
Analyze
research areas’
trends
Examine research
areas to discover the
top performers and
rising stars

| 17
SciVal pre-defines 7,000+ institutions and 220 nations, and allow users to
group those institutions and entities on-demand.
• Access to pre-defined 7,000+ institutions, 250 countries and groups (i.e. EU28, US states, German Bundesländer, Russell group and more)
• Ability to create any desired grouping of entities, researcher groups or documents
Flexibility
Ready-to-use & Create your own
A ready-to-use solution with predefined entities
Institutions (+ groups)
Countries (+ groups)
Research Areas
• Search terms
• Entities
• Competencies
Researchers (+ groups)
Publication sets (+ groups)

| 18
The structure of SciVal
• Scopus data only
• 1996 onwards
• Bi-monthly update
Query around 100 trillion metric values
Using advanced data analytics technology, SciVal allows you to instantly
process an enormous amount of data to generate powerful data
visualizations on-demand, in seconds.

| 19
The main role of the data provider is to ensure the best
possible transparency and reproducibility
One common database with different applications on top of the
data that work together
SCOPUS DATA
Scopus.com SciVal.com
Analytical
Services
&Scopus
Custom Data*
APIs
METRICS
RESEARCH OUTCOMES
*Analytical Services refers to the use of Scopus Custom data (and other data) in reports,
assessment exercises, rankings and other Custom Data commercial projects.

| 20
Example of UiO

| 21

| 22

| 23
| 24
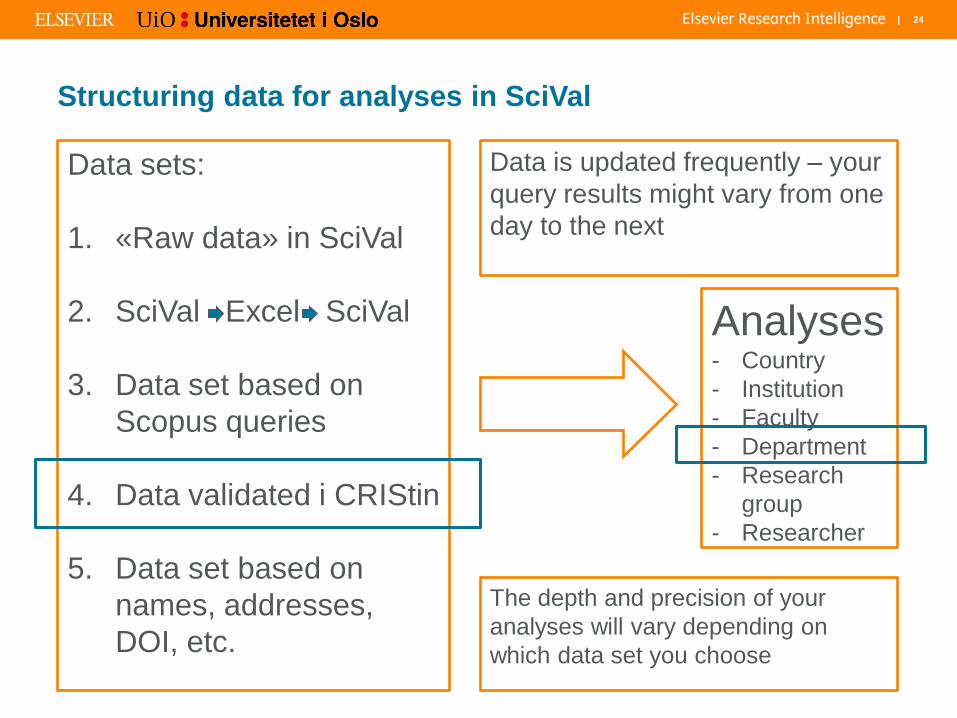
Data sets:
1. «Raw data» in SciVal
2. SciVal Excel SciVal
3. Data set based on
Scopus queries
4. Data validated i CRIStin
5. Data set based on
names, addresses,
DOI, etc.
Analyses - Country
- Institution
- Faculty
- Department
- Research
group
- Researcher
Data is updated frequently – your
query results might vary from one
day to the next
The depth and precision of your
analyses will vary depending on
which data set you choose
Structuring data for analyses in SciVal

| 25
• 2015 publication set from April 2016 - UiO total: 5,491 publications
- With Scopus ID: 2820 (51.4%)
• 2014 publication set from April 2015 - UiO total: 5,451 publications
- With Scopus ID: 2460 (45.1%)
• 2014 publication set from April 2016 - UiO total: 5,444
- With Scopus ID: 2882 (52.9%)
• All publication sets are based on NVI-kontrolldata (excel) from CRIStin
Which year to look at?

| 26
0%
10%
20%
30%
40%
50%
60%
70%
80%
90%
100%
Institute ofTheoretical
Astrophysics
Department ofPhysics
Department ofInformatics
Department ofChemistry
Department ofMathematics
Department ofGeosciences
School ofPharmacy
Department ofBiosciences
Publications with Scopus ID
Faculty of Mathematics and Natural Sciences

| 27
• In CRIStin:
- Download NVI-report (excel file)
• In Excel:
- Remove entries that were not reported (?)
- Filter columns S, T, U to include only the unit you are investigating (department,
research group etc)
- Remove duplicates (remember, there is one row pr affiliation)
- Copy Scopus IDs from column G
• In My SciVal:
- Define new publication set, Import publication set
- Paste list of Scopus IDs
- Wait for the list to be processed
- Give your new publication set a name, and add tags
- Start analysing
Step by step
| 28
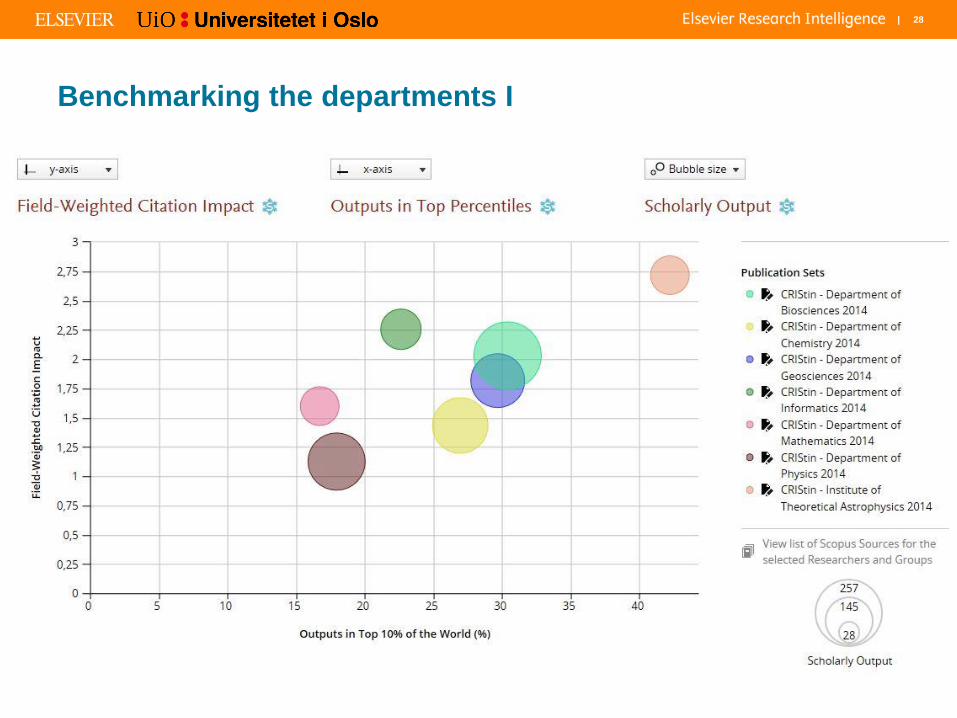
Benchmarking the departments I

| 29
Benchmarking the departments II
| 30
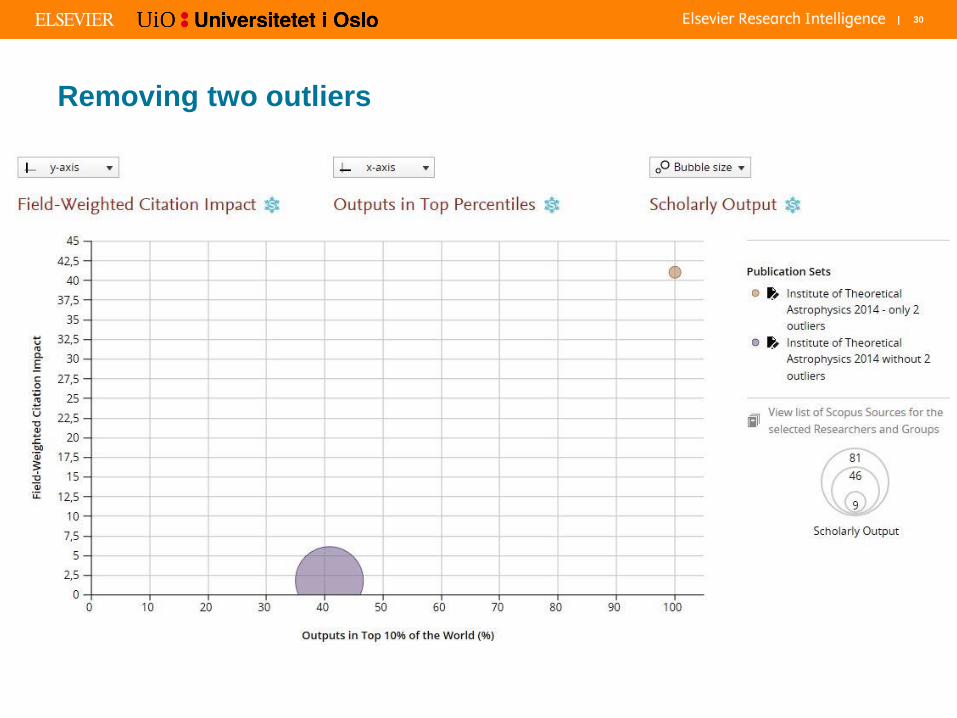
Removing two outliers

| 31
Institute of Theoretical Astrophysics

| 32
Department of Chemistry

| 33
2014
Citation count – 2014 vs. 2015 publications

| 34
• Benefits of using CRIStin data in combination with SciVal
- Cleaned/validated data
- Good basis for analysis of a particular department etc.
- Can combine citation-based analyses with the Norwegian publication
indicator, and examine «non-Scopus» publications
• The overlap between CRIStin and Scopus varies between
departments/research groups etc. Not all units are equally well
covered in Scopus.
• Do not confuse subject area and organisational unit
• Be aware of outliers
Key takeaways

| 35
Live demo

| 36
www.elsevier.com/research-intelligence
Thank you for your attention. Any question?
Herman Strøm | [email protected]
Guillaume Warnan | [email protected]