How To: Install R and the psych package - Personality Project ·...
20
How To: Install R and the psych package William Revelle Department of Psychology Northwestern University May 19, 2016 Contents 1 Overview of this and related documents 2 2 Install R and relevant packages 2 2.1 Install R for the first time ............................ 3 2.1.1 Install R ................................. 4 2.1.2 Install relevant packages ......................... 10 2.2 Seeing what packages are installed and active ................. 14 3 Reading in the data for analysis 15 3.1 Find a file and read from it ........................... 15 3.2 Copy the data from another program using the copy and paste commands of your operating system ............................. 15 3.3 Import from an SPSS or SAS file ........................ 16 4 Some simple descriptive statistics before you start 17 1
Transcript of How To: Install R and the psych package - Personality Project ·...
How To: Install R and the psych package
William RevelleDepartment of PsychologyNorthwestern University
May 19, 2016
Contents
1 Overview of this and related documents 2
2 Install R and relevant packages 22.1 Install R for the first time . . . . . . . . . . . . . . . . . . . . . . . . . . . . 3
2.1.1 Install R . . . . . . . . . . . . . . . . . . . . . . . . . . . . . . . . . 42.1.2 Install relevant packages . . . . . . . . . . . . . . . . . . . . . . . . . 10
2.2 Seeing what packages are installed and active . . . . . . . . . . . . . . . . . 14
3 Reading in the data for analysis 153.1 Find a file and read from it . . . . . . . . . . . . . . . . . . . . . . . . . . . 153.2 Copy the data from another program using the copy and paste commands
of your operating system . . . . . . . . . . . . . . . . . . . . . . . . . . . . . 153.3 Import from an SPSS or SAS file . . . . . . . . . . . . . . . . . . . . . . . . 16
4 Some simple descriptive statistics before you start 17
1

1 Overview of this and related documents
To do basic and advanced personality and psychological research using R is not as compli-cated as some think. This is one of a set of “How To” to do various things using R (R CoreTeam, 2016), particularly using the psych (Revelle, 2016) package.
The current list of How To’s includes:
1. Installing R and some useful packages (this document)
2. Using R and the psych package to find omegah and ωt .
3. Using R and the psych for factor analysis and principal components analysis.
4. Using the score.items function to find scale scores and scale statistics.
5. An overview (vignette) of the psych package
By following these simple guides, you soon will be able to do such things as find ωh byissuing just three lines of code:
R codelibrary(psych)my.data <- read.clipboard()omega(my.data)
The resulting output will be both graphical and textual.
This guide helps the naive R user to issue those three lines. Be careful, for once you startusing R, you will want to do more.
2 Install R and relevant packages
To use R obviously requires installing R on your computer. This is very easy to do (seesection 2.1.1) and needs to be done once.
The power of R is in the supplemental packages. There are at least 8,300 packages thathave been contributed to the R project. To do any of the analyses discussed in these “HowTo’s”, you will need to install the package psych (Revelle, 2016). To do factor analyses orprincipal component analyses you will also need the GPArotation (Bernaards and Jennrich,2005) package. With these two packages, you will be be able to find ωh using ExploratoryFactor Analysis. If you want to find to estimate ωh using Confirmatory Factor Analysis,you will also need to add the sem (Fox et al., 2016) package. To use psych to createsimulated data sets, you also need the mnormt (Azzalini and Genz, 2016) package. Fora more complete installation of a number of psychometric packages, you can install and
2

activate a package (ctv) that installs a large set of psychometrically relevant packages. Asis true for R, you will need to install packages just once.
2.1 Install R for the first time
1. Download from R Cran (http://cran.r-project.org/) (see section 2.1.1)
• Choose appropriate operating system and download compiled R
2. Install R (current version is 3.3.0)
3. Start R.
Note that the R prompt > starts off every line. This is R’s way of indicating thatit wants input. In addition, note that almost all commands start and finish withparentheses.
4. Add useful packages (just need to do this once) (see section 2.1.2)R code
install.packages("psych",dependencies=TRUE) #the minimum requirement orinstall.packages(c("psych","GPArotation"),dependencies=TRUE) #required for factor analysis
(a) or if you want to do CFAR code
install.packages(c("psych","sem"), dependencies=TRUE)
(b) or if you want to install the psychometric task viewsR code
install.packages("ctv") #this downloads the task view packagelibrary(ctv) #this activates the ctv packageinstall.views("Psychometrics") #among others
5. Take a 5 minute break while the packages are loaded.
6. Activate the package(s) you want to use (e.g., psych)R code
library(psych) #Only need to make psych active once a session
psych will automatically activate the other packages it needs, as long as they areinstalled. Note that psych is updated roughly quarterly, the current version is 1.6.4
7. Use R
3

2.1.1 Install R
First go to the Comprehensive R Archive Network (CRAN) at http://cran.r-project.org: (Figure 1)
Choose your operating system and then download and install the appropriate version
For a PC: (Figure 2)
Download and install the appropriate version – Mac, PC or Unix/Linux
Starting R on a PC.
Once you have installed R you probably will want to download and install the R Studioprogram. It is a very nice interface for PCs and Macs that combines four windows into onescreen.
When using a PC, RStudio is very helpful. (Many like it for Macs as well).
4

Figure 1: The basic CRAN window allows you choose your operating system. Comprehen-sive R Archive Network (CRAN) is found at http://cran.r-project.org:
5

Figure 2: On a PC you want to choose the base system6

Figure 3: Download the Windows version
7

Figure 4: The startup screen for a PC (without R Studio)
8

Figure 5: Using R Studio on a PC. The four windows are for your notes, the system console,graphics, and the help windows. The color choice is optional.
9

Start up R and get ready to play (Mac version).
R version 3.3.0 (2016-05-03) -- "Supposedly Educational"Copyright (C) 2016 The R Foundation for Statistical ComputingPlatform: x86_64-apple-darwin13.4.0 (64-bit)
R is free software and comes with ABSOLUTELY NO WARRANTY.You are welcome to redistribute it under certain conditions.Type 'license()' or 'licence()' for distribution details.
Natural language support but running in an English locale
R is a collaborative project with many contributors.Type 'contributors()' for more information and'citation()' on how to cite R or R packages in publications.
Type 'demo()' for some demos, 'help()' for on-line help, or'help.start()' for an HTML browser interface to help.Type 'q()' to quit R.
[R.app GUI 1.68 (7202) x86_64-apple-darwin13.4.0]
[Workspace restored from /Users/revelle/.RData][History restored from /Users/revelle/.Rapp.history]
>
2.1.2 Install relevant packages
Once R is installed on your machine, you still need to install a few relevant “packages”.Packages are what make R so powerful, for they are special sets of functions that are de-signed for one particular application. In the case of the psych package, this is an applicationfor doing the kind of basic data analysis and psychometric analysis that psychologists andmany others find particularly useful.
You may either install the minimum set of packages necessary to do the analysis using anExploratory Factor Analysis (EFA) approach (recommended) or a few more packages to doboth an EFA and a CFA approach. It is also possible to add many psychometrically relevantpackages all at once by using the “task views” approach. A particularly powerful package isthe lavaan (Rosseel, 2012) package for doing structural equation modeling. Another usefulone is the sem pacakge (Fox et al., 2016).
Install the minimum set This may be done by typing into the console or using menuoptions (e.g., the Package Installer underneath the Packages and Data menu).
R code
install.packages("psych", dependencies = TRUE)}
10
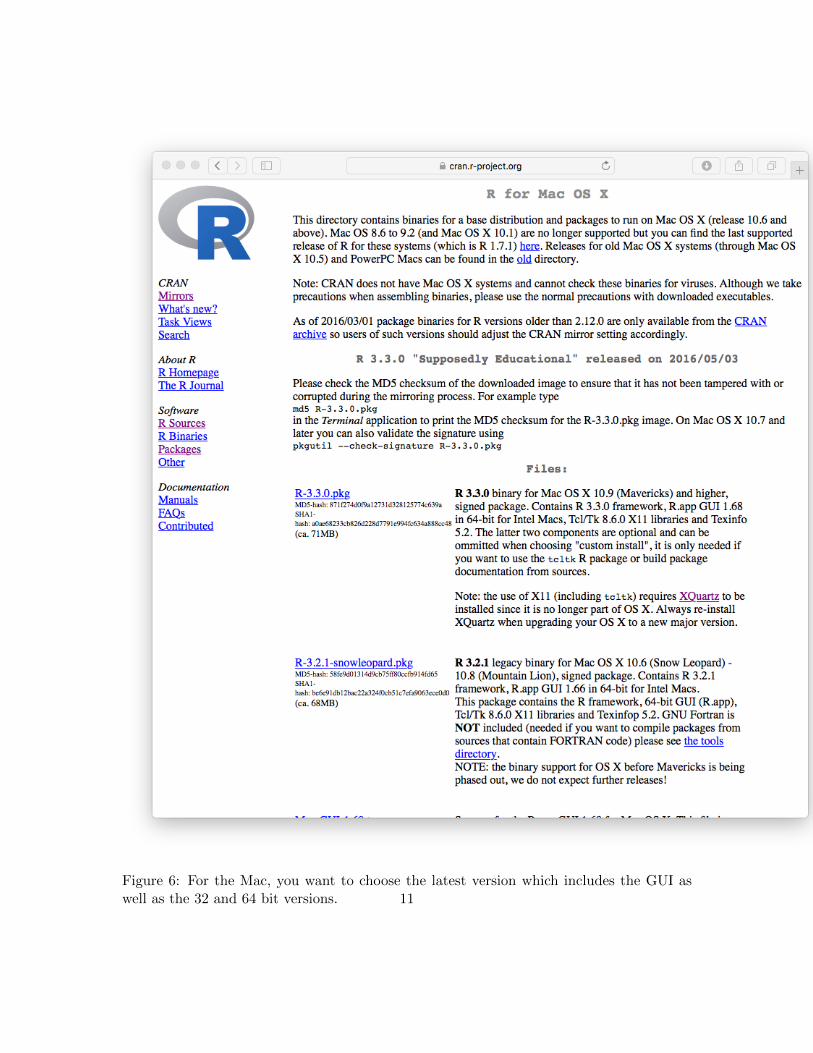
Figure 6: For the Mac, you want to choose the latest version which includes the GUI aswell as the 32 and 64 bit versions. 11

Figure 7: Installing packages using R studio on a PC. Use the install menu option. Theright hand window is showing the installed packeges. The Install Packages menu optionallows you to search CRAN for the desired packages. Note that the Install Dependenciesoption has been checked.
12
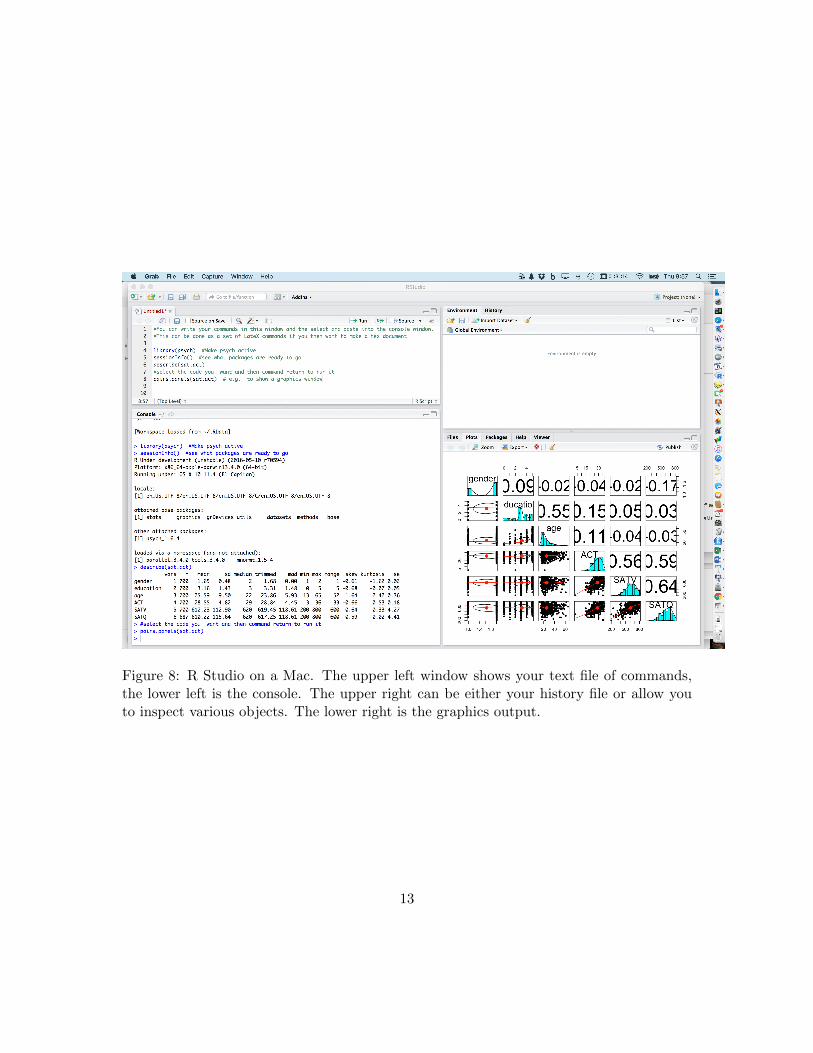
Figure 8: R Studio on a Mac. The upper left window shows your text file of commands,the lower left is the console. The upper right can be either your history file or allow youto inspect various objects. The lower right is the graphics output.
13

Install a few more packages If you want some more functionality for some of themore advanced statistical procedures (e.g., omegaSem) you will need to install a few morepackages (e.g., sem.
R code
install.packages(c("psych","GPArotation","sem"),dependencies=TRUE)
Install a “task view” to get lots of packages If you know that there are a number ofpackages that you want to use, it is possible they are listed as a “task view”. For instance,about 50 packages will be installed at once if you install the “psychometrics” task view.You can Install all the psychometric packages from the “psychometrics” task view by firstinstalling a package (“ctv”) that in turn installs many different task views. To see the listof possible task views, go to https://cran.r-project.org/web/views/.
R code
install.packages("ctv") } #this downloads the task view packagelibrary(ctv) #this activates the ctv packageinstall.views("Psychometrics") #one of the many Taskviews
Take a 5 minute break because you will be installing about 50 packages.
Make the psych package active. You are almost ready. But first, to use most of thefollowing examples you need to make the psych package active. You only need to do thisonce per session.
R codelibrary(psych)
(If you want to automate this last step, you can create a special command to be run everytime you start R.
R code.First <- function() {library(psych)}
Do this when you first start R. Then quit with the save option. Then restart R. You willnow automatically have loaded the psych package every time you start R.)
2.2 Seeing what packages are installed and active
To see what packages are active (as a way of telling which version of R you have, and whichversion of relevant packages are loaded):
R codesessionInfo()
14
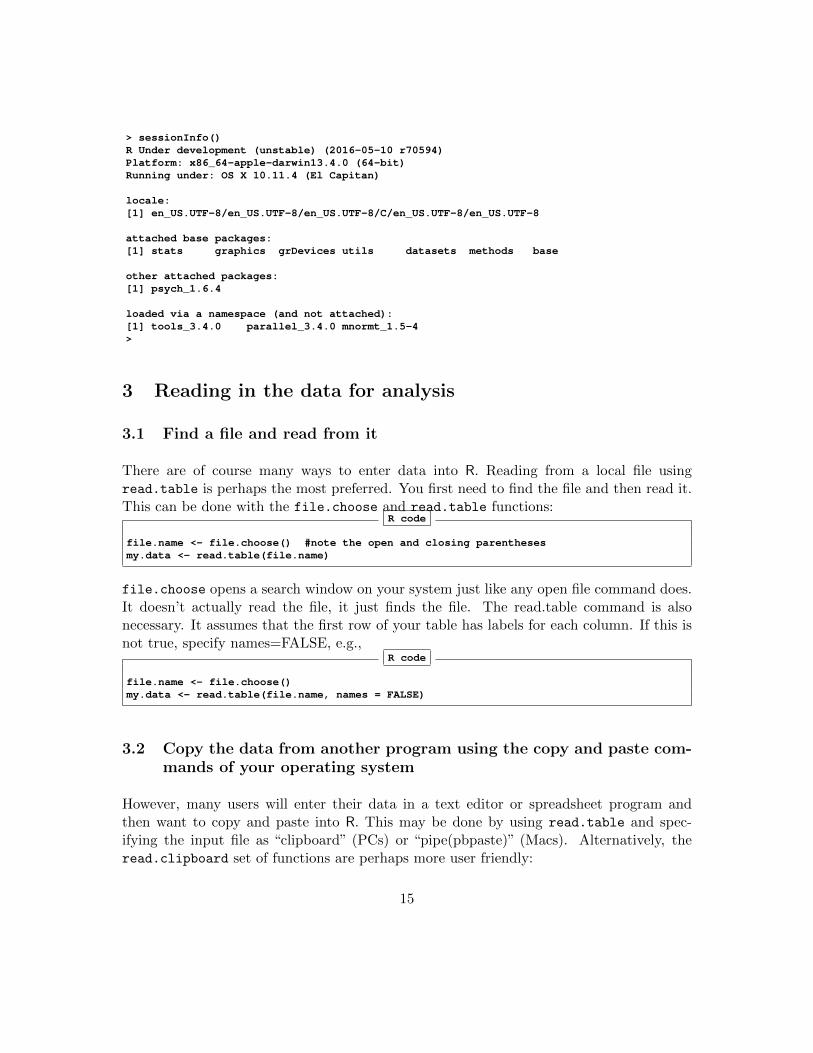
> sessionInfo()R Under development (unstable) (2016-05-10 r70594)Platform: x86_64-apple-darwin13.4.0 (64-bit)Running under: OS X 10.11.4 (El Capitan)
locale:[1] en_US.UTF-8/en_US.UTF-8/en_US.UTF-8/C/en_US.UTF-8/en_US.UTF-8
attached base packages:[1] stats graphics grDevices utils datasets methods base
other attached packages:[1] psych_1.6.4
loaded via a namespace (and not attached):[1] tools_3.4.0 parallel_3.4.0 mnormt_1.5-4>
3 Reading in the data for analysis
3.1 Find a file and read from it
There are of course many ways to enter data into R. Reading from a local file usingread.table is perhaps the most preferred. You first need to find the file and then read it.This can be done with the file.choose and read.table functions:
R code
file.name <- file.choose() #note the open and closing parenthesesmy.data <- read.table(file.name)
file.choose opens a search window on your system just like any open file command does.It doesn’t actually read the file, it just finds the file. The read.table command is alsonecessary. It assumes that the first row of your table has labels for each column. If this isnot true, specify names=FALSE, e.g.,
R code
file.name <- file.choose()my.data <- read.table(file.name, names = FALSE)
3.2 Copy the data from another program using the copy and paste com-mands of your operating system
However, many users will enter their data in a text editor or spreadsheet program andthen want to copy and paste into R. This may be done by using read.table and spec-ifying the input file as “clipboard” (PCs) or “pipe(pbpaste)” (Macs). Alternatively, theread.clipboard set of functions are perhaps more user friendly:
15

read.clipboard is the base function for reading data from the clipboard.
read.clipboard.csv for reading text that is comma delimited.
read.clipboard.tab for reading text that is tab delimited (e.g., copied directly from anExcel file).
read.clipboard.lower for reading input of a lower triangular matrix with or without adiagonal. The resulting object is a square matrix.
read.clipboard.upper for reading input of an upper triangular matrix.
read.clipboard.fwf for reading in fixed width fields (some very old data sets)
For example, given a data set copied to the clipboard from a spreadsheet, just enter thecommand
R codemy.data <- read.clipboard()
This will work if every data field has a value and even missing data are given some values(e.g., NA or -999). If the data were entered in a spreadsheet and the missing valueswere just empty cells, then the data should be read in as a tab delimited or by using theread.clipboard.tab function.
R codemy.data <- read.clipboard(sep="\t") #define the tab option, ormy.tab.data <- read.clipboard.tab() #just use the alternative function
For the case of data in fixed width fields (some old data sets tend to have this format),copy to the clipboard and then specify the width of each field (in the example below, thefirst variable is 5 columns, the second is 2 columns, the next 5 are 1 column the last 4 are3 columns).
R codemy.data <- read.clipboard.fwf(widths=c(5,2,rep(1,5),rep(3,4))
3.3 Import from an SPSS or SAS file
To read data from an SPSS, SAS, or Systat file, you must use the foreign package. Thisshould come with Base R need to be loaded using the library command.
read.spss reads a file stored by the SPSS save or export commands.
read.spss(file, use.value.labels = TRUE, to.data.frame = FALSE,
max.value.labels = Inf, trim.factor.names = FALSE,
trim_values = TRUE, reencode = NA, use.missings = to.data.frame)
16
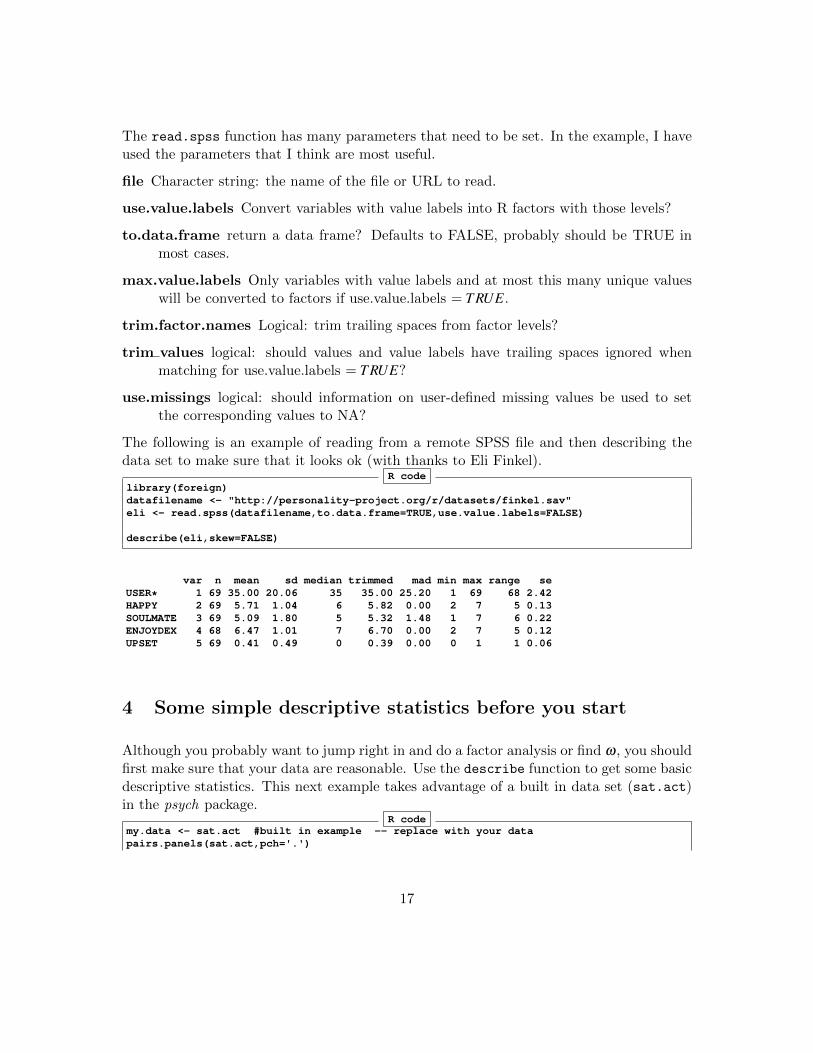
The read.spss function has many parameters that need to be set. In the example, I haveused the parameters that I think are most useful.
file Character string: the name of the file or URL to read.
use.value.labels Convert variables with value labels into R factors with those levels?
to.data.frame return a data frame? Defaults to FALSE, probably should be TRUE inmost cases.
max.value.labels Only variables with value labels and at most this many unique valueswill be converted to factors if use.value.labels = T RUE.
trim.factor.names Logical: trim trailing spaces from factor levels?
trim values logical: should values and value labels have trailing spaces ignored whenmatching for use.value.labels = T RUE?
use.missings logical: should information on user-defined missing values be used to setthe corresponding values to NA?
The following is an example of reading from a remote SPSS file and then describing thedata set to make sure that it looks ok (with thanks to Eli Finkel).
R codelibrary(foreign)datafilename <- "http://personality-project.org/r/datasets/finkel.sav"eli <- read.spss(datafilename,to.data.frame=TRUE,use.value.labels=FALSE)
describe(eli,skew=FALSE)
var n mean sd median trimmed mad min max range seUSER* 1 69 35.00 20.06 35 35.00 25.20 1 69 68 2.42HAPPY 2 69 5.71 1.04 6 5.82 0.00 2 7 5 0.13SOULMATE 3 69 5.09 1.80 5 5.32 1.48 1 7 6 0.22ENJOYDEX 4 68 6.47 1.01 7 6.70 0.00 2 7 5 0.12UPSET 5 69 0.41 0.49 0 0.39 0.00 0 1 1 0.06
4 Some simple descriptive statistics before you start
Although you probably want to jump right in and do a factor analysis or find ω, you shouldfirst make sure that your data are reasonable. Use the describe function to get some basicdescriptive statistics. This next example takes advantage of a built in data set (sat.act)in the psych package.
R codemy.data <- sat.act #built in example -- replace with your datapairs.panels(sat.act,pch='.')
17

describe(my.data)
var n mean sd median trimmed mad min max range skew kurtosis segender 1 700 1.65 0.48 2 1.68 0.00 1 2 1 -0.61 -1.62 0.02education 2 700 3.16 1.43 3 3.31 1.48 0 5 5 -0.68 -0.07 0.05age 3 700 25.59 9.50 22 23.86 5.93 13 65 52 1.64 2.42 0.36ACT 4 700 28.55 4.82 29 28.84 4.45 3 36 33 -0.66 0.53 0.18SATV 5 700 612.23 112.90 620 619.45 118.61 200 800 600 -0.64 0.33 4.27SATQ 6 687 610.22 115.64 620 617.25 118.61 200 800 600 -0.59 -0.02 4.41
In addition to simple descriptives, it is always helpful to graphically examine your datausing the pairs.panels function.
gender
0 1 2 3 4 5
0.09 -0.02
5 15 25 35
-0.04 -0.02
200 500 800
1.0
1.4
1.8
-0.17
012345
education
0.55 0.15 0.05 0.03
age
0.11 -0.04
2040
60
-0.03
515
2535 ACT
0.56 0.59
SATV200
500
800
0.64
1.0 1.4 1.8
200
500
800
20 40 60 200 500 800
SATQ
Figure 9: A scatter plot matrix (splom) of a data set is a a powerful way to examine adata set. Elements on the diagonal show the histograms and densities of the data, loweroff diagonal elements are the pairwise scatter plots, upper off diagonal elements are thepairwise correlations.
18

There are, of course, all kinds of things you could do with your data at this point, butread about them in the vignette for the psych package http://cran.r-project.org/web/packages/psych/vignettes/overview.pdf.
19

References
Azzalini, A. and Genz, A. (2016). The R package mnormt: The multivariate normal and tdistributions (version 1.5-4).
Bernaards, C. and Jennrich, R. (2005). Gradient projection algorithms and software forarbitrary rotation criteria in factor analysis. Educational and Psychological Measurement,65(5):676–696.
Fox, J., Nie, Z., and Byrnes, J. (2016). sem: Structural Equation Models. R package version3.1-7.
R Core Team (2016). R: A Language and Environment for Statistical Computing. RFoundation for Statistical Computing, Vienna, Austria.
Revelle, W. (2016). psych: Procedures for Personality and Psychological Research. North-western University, Evanston, http://cran.r-project.org/web/packages/psych/. R pack-age version 1.6.4.
Rosseel, Y. (2012). lavaan: An R package for structural equation modeling. Journal ofStatistical Software, 48(2):1–36.
20