How to Foster the Internationalisation of SMEs through … · 1 grs project insights how to foster...
78
GLOBAL RELATIONS Latin America and the Caribbean How to Foster the Internationalisation of SMEs through the Pacific Alliance Integration Process Project Insights
Transcript of How to Foster the Internationalisation of SMEs through … · 1 grs project insights how to foster...

GLOBAL RELATIONSLatin America and the Caribbean
How to Foster the Internationalisation
of SMEs through the Pacific Alliance Integration Process
Project Insights
ORGANISATION FOR ECONOMIC CO-OPERATION AND DEVELOPMENTThe OECD is a unique forum where governments work together to address the economic, social and environmental challenges of globalisation. The OECD is also at the forefront of efforts to understand and to help governments respond to new developments and concerns, such as corporate governance, the information economy and the challenges of an ageing population. The Organisation provides a setting where governments can compare policy experiences, seek answers to common problems, identify good practice and work to co-ordinate domestic and international policies.
The OECD member countries are: Australia, Austria, Belgium, Canada, Chile, the Czech Republic, Denmark, Estonia, Finland, France, Germany, Greece, Hungary, Iceland, Ireland, Israel, Italy, Japan, Korea, Luxembourg, Mexico, the Netherlands, New Zealand, Norway, Poland, Portugal, the Slovak Republic, Slovenia, Spain, Sweden, Switzerland, Turkey, the United Kingdom and the United States. The European Union takes part in the work of the OECD.www.oecd.org
OECD LATIN AMERICA AND THE CARIBBEAN REGIONAL PROGRAMMELaunched at the OECD’s 2016 Ministerial Council Meeting by OECD Secretary General Angel Gurría and the President of Chile, Michelle Bachelet, the OECD LAC Regional Programme aims to support the region in advancing its reform agenda along three key regional priorities: increasing productivity, advancing social inclusion, and strengthening institutions and governance. For each of these priorities, the Programme, in partnership with regional international organisations, works to deliver greater availability of comparable statistics; the preparation of policy assessments; policy dialogue at a high and technical level; and support for implementation with policy advice tailored to specific needs of countries or sub-regional contexts. The Programme builds on over 20 years of OECD engagement with the region through its Development Centre and a number of regional policy networks across a range of policy areas, linked to OECD Committees.
Contact:Ms Irene HorsHead of DivisionStrategic Partnerships and New InitiativesGlobal Relations SecretariatOECD

1
GRS PROJECT INSIGHTS
HOW TO FOSTER THE INTERNATIONALISATION OF SMEs THROUGH THE PACIFIC
ALLIANCE INTEGRATION PROCESS

2
FOREWORD
The Pacific Alliance is an ambitious regional integration project that aims at high policy standards.
The OECD welcomes and supports this endeavour, which engages two of its member countries, Chile and
Mexico, a country in the accession process, Colombia, as well as Peru, which benefits from a Country
Programme with the Organisation.
In 2014, the OECD participated in the IX Pacific Alliance Summit in Punta Mita, Mexico, and agreed
to inform policy discussions on how to support the integration of small and medium enterprises into global
and regional value chains. This report, which was presented at the X Pacific Alliance Summit in Paracas,
Peru in 2015, aims to support the Pacific Alliance in building a joint agenda for internationalisation of
SMEs. It synthesises existing OECD expertise on SME internationalisation, conducts a preliminary
assessment of intra-regional trade and investment flows, and takes stock of current initiatives conducted by
Pacific Alliance countries to promote SME development and internationalisation.
This report is a preliminary stocktaking exercise, which underscores the significant opportunities that
further intra-regional integration and support for SME internationalisation could bring to the economies of
the four countries concerned. Representing close to 99% of businesses and 67% of employment, a
comprehensive joint strategy in support of SME competitiveness and internationalisation could result in
significant gains in terms of both productivity and inclusive growth.
The OECD looks forward to continuing this collaboration, extending it to other policy areas of
interest, and contributing to the dissemination of good policy practices in the Latin American region. The
OECD’s Latin America and the Caribbean (LAC) Regional Programme, fruit of the decision of our
member countries to interact more systematically with the region, offers a unique platform for dialogue
between countries in the region and OECD countries, which together constitute the majority of the
observers in the Pacific Alliance integration process.
We hope that the analysis and proposals contained in this report will be an asset for the Pacific
Alliance in its integration and reform efforts. The OECD’s expertise is at the Alliance’s disposal to jointly
advance better policies for better lives.
Marcos Bonturi
Director, OECD Global Relations

3
ACKNOWLEDGEMENTS
The authors would like to express their gratitude to officials from the Pacific Alliance’s Working
Group on SMEs, representing Chile, Colombia, Mexico and Peru, who replied to questionnaires and
provided valuable support during the data cleaning and validation process. The OECD is also grateful for
the opportunity given by the Ministers of Foreign Affairs of the Pacific Alliance to present this scoping
paper at the X Pacific Alliance Summit, which took place from 1-3 July 2015 in Paracas, Peru.
This report was prepared by the OECD Global Relations Secretariat (GRS) under the supervision
of Jose Antonio Ardavin. Primary research and drafting was done by Anna Wiersma, with guidance from
Antonio Fanelli and support on data collection by Fabio Gehrke. The report benefited from strategic
guidance by GRS Director Marcos Bonturi and Irene Hors, Head of the Strategic Partnerships and New
Initiatives Division.
The report draws upon the previous work of and valuable input from the following OECD
Directorates: Directorate for Financial and Enterprise Affairs; Public Governance and Territorial
Development; Development Centre; Directorate for Science, Technology and Innovation; Trade and
Agriculture Directorate; and the Centre for Entrepreneurship. GRS would like to extend its thanks for these
most helpful contributions throughout the report preparation process.
Production support was provided by Vanessa Vallee and Grace Dunphy. Copy editing was
conducted externally by Sally Hinchcliffe.

4
TABLE OF CONTENTS
FOREWORD ................................................................................................................................................... 2
ACKNOWLEDGEMENTS ............................................................................................................................ 3
READER’S GUIDE ........................................................................................................................................ 5
ACRONYMS AND ABBREVIATIONS ........................................................................................................ 6
EXECUTIVE SUMMARY ............................................................................................................................. 7
SECTION 1: INTERNATIONALISING SMALL AND MEDIUM-SIZED ENTERPRISES IN THE
PACIFIC ALLIANCE: CHALLENGES AND OPPORTUNITIES ............................................................. 10
I. The context for small and medium-sized enterprises in the Pacific Alliance ......................................... 11 II. Trade and global value chains in the Pacific Alliance .......................................................................... 12 III. Promoting SME internationalisation in the Pacific Alliance: Opportunities and challenges............... 14
Opportunities .......................................................................................................................................... 15 Challenges .............................................................................................................................................. 15
SECTION 2: MEETING THE CHALLENGES: ELEMENTS TO CONSIDER FOR A JOINT AGENDA20
Introduction ................................................................................................................................................ 20 Elements for the Pacific Alliance to Consider in Advancing Their Joint Agenda ..................................... 20
1. Finance ............................................................................................................................................... 20 2. Business environment ........................................................................................................................ 21 3. Firm capabilities ................................................................................................................................. 23 4. Market access ..................................................................................................................................... 25
SECTION 3: PROPOSALS FOR FUTURE OECD SUPPORT ................................................................... 31
ANNEX A: KEY FIGURES AND TABLES................................................................................................ 33
ANNEX B: METHODOLOGICAL ISSUES................................................................................................ 45
ANNEX C: INSTITUTIONS, POLICIES, AND PROGRAMMES SUPPORTING SME DEVELOPMENT
IN PACIFIC ALLIANCE COUNTRIES ...................................................................................................... 48
ANNEX D: OECD LITERATURE ON CHALLENGES AND OPPORTUNITIES FOR SME
INTERNATIONALISATION ....................................................................................................................... 56
ANNEX E: OECD TOOLS IN THE FIELDS OF SME POLICY, TRADE AND INVESTMENT ............ 66
REFERENCES .............................................................................................................................................. 69

5
READER’S GUIDE
This document relies on existing OECD work related to SME internationalization; data was updated
whenever possible and supplemented with information from other organisations (IDB, ECLAC) when this
was judged to provide significant value added. Data was provided for the PA bloc whenever possible;
when figures were unavailable for specific analysis of the PA, figures for the Latin America and the
Caribbean region were used, as all PA countries are part of this regional grouping.
The document is structured as follows:
Section 1 provides a general context of SMEs and the existing trade structure in the PA, and of
challenges and opportunities that SMEs face when engaging in international activities.
Section 2 takes stock of PA countries’ current policy efforts and initiatives carried out to promote SME
development and internationalisation; provides elements for the PA to consider in advancing their joint
agenda, grouped in the policy domains of finance, business environment, firm capabilities, market
access and trade.
The document concludes by outlining how the OECD could support and accompany such an agenda
with ongoing or proposed projects.
Annexes provide further information in support of the two main sections:
o Annex A provides key figures and tables.
o Annex B outlines methodological issues.
o Annex C gives an overview of institutions, policies and programmes supporting SME
development in PA countries.
o Annex D gives a summary of OECD work on SME internationalisation.
o Annex E describes OECD tools in the fields of SME policy, trade and investment.
6
ACRONYMS AND ABBREVIATIONS
ASEAN Association of South East Asian Nations
COP Colombian peso
CORFO Production Development Corporation (Peru)
EPO export promotion organisation
GDP gross domestic product
ICT information and communications technology
IDB Inter-American Development Bank
INADEM National Institute of the Entrepreneur (Mexico)
LAC Latin America and the Caribbean
LPI Logistics Performance Index (World Bank)
MENA Middle East and North Africa
MFN most favoured nation
MILA Latin American Integrated (Stock) Market
MNE multinational enterprise
NAFIN Nacional Financiera (Mexico)
NAFTA North American Free Trade Agreement
PA Pacific Alliance
PFI Policy Framework for Investment
PPP public-private partnerships
PTA preferential trade agreement
R&D research and development
RCA revealed comparative advantage
RoR rules of origin
SOE state-owned enterprise
SME small and medium-sized enterprise
STRI Service Trade Restrictions Index
TiVA Trade in Value Added database
UNCTAD United Nations Conference on Trade and Development

7
EXECUTIVE SUMMARY
The Pacific Alliance (PA) represents an economic region with a combined gross domestic product (GDP)
of USD 1.9 trillion and an integrated market of more than 200 million people. Created in 2011 to enhance
policy convergence, foster synergies and promote economic integration among its members through trade
and investment, its members are Chile, Colombia, Mexico and Peru.1 It is the second largest economic
aggregation in Latin America and the Caribbean (LAC) after the Mercosur, and its dynamic member
economies and rapid demographic growth make it increasingly relevant.
Small and medium-sized enterprises (SMEs) form an important part of the PA’s economy, accounting for
approximately 99% of businesses and 67% of employment. However, their contribution to GDP in LAC is
just 30%, compared to 60% in OECD economies, reflecting shortcomings in labour productivity. While it
is normal for larger companies to be more productive than smaller ones worldwide, the productivity gap in
PA countries is very wide, with labour productivity in large companies up to 33 times greater than
microenterprises and up to 6 times greater than small firms. Intra- and extra-regional PA trade is dominated
by large enterprises, with the largest 1% of exporting firms accounting for more than 70% of total exports.
Internationalisation may take several forms: direct exports/imports of intermediate or finished products, or
indirect exports through participation in international value chains and or by entering into point venture
agreements, licencing and technological transfer agreements, commercial cooperation or franchising
agreements. The channel consisting of direct export activities requires a set of skills and resources that only
the most productive and well-managed SMEs are able to muster. However, the globalisation of value
chains has further opened up the possibility of SMEs participating in international trade as suppliers of
goods and services to larger enterprises.
There is significant potential to strengthen intra-regional integration, underpinned by the PA’s ambitious
programme of trade and investment liberalisation. The PA has relatively low levels of cross-regional trade
and investment flows: in 2013, trade between its members represented only 3.5% of the total, compared
with 59.1% for the European Union. While the barriers to exporting to larger markets may be too much for
most SMEs to overcome, exporting to other PA countries may be easier, allowing them to benefit from
scale effects and enhance their competitiveness, and ultimately serving as a platform to target extra-
regional markets as well. Greater economic integration would create opportunities to diversify the region’s
economies, develop new comparative advantages and increase employment.
Overall, the building of a regional market through the PA’s programme of trade and investment
liberalisation, as well as the fragmentation of production into global value chains (GVCs), opens new
opportunities for SMEs. However, trade and investment liberalisation alone will not be sufficient to secure
a higher level of SME internationalisation. The PA economies, particularly Chile, Colombia and Peru, are
currently concentrated on a few resource-oriented sectors where SMEs play a marginal role. The PA will
need policies to promote economic diversification and support entrepreneurship and enterprise
development to build productive capacities and develop new comparative advantages in the manufacturing
and service sectors in order to broaden and deepen trade flows and enable a more active role for SMEs.

8
Against this background, the PA could undertake a number of joint initiatives to promote the
internationalisation and greater integration of SMEs at both the intra-PA level and into global value chains.
The following areas merit consideration, following OECD experience in SME internationalisation:
1. Finance
PA countries have in place relatively well-developed policies for SME financing, but no country has fully
developed all of the possible options from direct funding to venture capital for start-ups. PA countries
could consider diversifying their own portfolio of instruments for financing SMEs and take advantage of
existing joint efforts in the creation of the Latin American Integrated (Stock) Market to create joint
financing instruments to support the expansion of the most advanced and innovative SMEs. Sharing
experience and best practices could help identify and overcome other barriers to scaling up, while
measures to foster high-quality securitisation of loans to SMEs could indirectly promote SME financing.
The OECD SME Financing Score Board could be used to monitor progress in the provision of SME
financing within the PA and to compare it with OECD countries.
2. Business environment
An important strength of PA countries is their openness to international trade and investment. All PA
countries have a variety of well-established institutions promoting SME development, exports and
investment, and are working to promote exports, attract foreign investment, support clusters and facilitate
the adoption of internationally recognised technical and quality standards.
PA countries could consider further developing business clusters and linkages between SMEs and larger
enterprises in sectors where there are opportunities for greater participation of SMEs in GVCs.
Furthermore, the PA could consider the implementation of effective compliance measures for preventing
bribery, enabling SMEs to meet multinationals' standards. Joint initiatives to attract investment and provide
investor after-care services could concentrate on multinational enterprises (MNEs), particularly those with
multiple operations in the region, and promote technology and knowledge transfer to local partners. PA
countries could build on their joint participation in OECD investment initiatives to increase synergies in
their investment policies, and avoid mutually damaging actions. The forthcoming OECD Investment
Policy Review synthesis report will include all PA countries and Costa Rica, which could support and
better inform future joint efforts, as could policy dialogue between the PA’s SME and investment groups.
3. Firm capabilities
PA countries have developed a variety of incubation, supplier development, innovation and skills-
development programmes for SMEs; many of these are in line with internationally recognised good
practices and merit being shared among PA countries.
PA countries could consider creating joint supplier development programmes with clear mechanisms to
strengthen SME-MNE linkages and upgrade technological and managerial skills. These programmes could
be supported by the development of a PA certification to help MNEs identify quality local suppliers. More
broadly, PA countries could develop a balanced policy mix to encourage the creation and scaling up of
innovative SMEs, through integrated support programmes offering finance, business services and the
development of entrepreneurial skills. To widen the pool of human capital, in the short term countries
could facilitate the entry of professionals from other countries. In the long term, alliances could be created
between the private sector, academia and the public sector to ensure that education provides students with
the right set of skills for key sectors. Additionally, PA countries could consider measures to encourage
formalisation as a first step to facilitating the entry of a greater number of firms in the region into GVCs,
especially microenterprises.

9
4. Market access
PA countries vary in their level of market access programme development, but it represents the area where
most joint initiatives have occurred, led by their export and investment promotion agencies. The extended
PA market provides an expansion opportunity for many SMEs, given the similarity of PA country markets
and their same-language advantage.
PA countries could exploit this opportunity by facilitating the creation of PA-wide distribution channels
and providing relevant information to SMEs. To encourage SMEs to export indirectly as suppliers to
MNEs, PA countries could also include supplier development programmes and an SME-MNE linkage
component in their SME national development strategies. Greater participation of SMEs in the wider PA
market could be encouraged through more effective competition policy, reducing barriers to entry and
expansion. Public procurement could be made more accessible to SMEs, perhaps through specific
measures such as setting targets, dividing contracts into smaller pieces, and allowing joint bids by consortia
of SMEs, including those from different PA countries.
5. Trade and trade-related policies
While tariff negotiations among PA member countries have been concluded, a number of initiatives could
be undertaken to further reduce tariffs along specific value chains, taking advantage of the network of trade
treaties that PA countries have subscribed to.
PA countries could assess other policies restricting access to foreign intermediate goods and services that
could have a detrimental impact on their position in regional and global supply chains, as well as policies
that aim to artificially increase the domestic content of exports. They could fully exploit trade facilitation
instruments to facilitate SME access to foreign markets and develop joint initiatives based on best
practices. They could consider joint initiatives to reduce trade restrictions in services and improve transport
and communication logistics and infrastructure, which will reduce costs and increase the ability of SMEs
to take part in GVCs. A forthcoming OECD study into the region’s participation in GVCs could be used as
a basis for the PA to build a more comprehensive strategy in this field in conjunction with insights from the
OECD’s Trade Facilitation Indicators and Service Trade Restrictiveness Index.
Proposals for future OECD support: Placing SME development at the core of the PA integration agenda
The OECD is ready to support further the creation and implementation of a joint PA agenda on SME
internationalisation. Three broad policy areas are suggested: SME policy, trade, and investment. These
interlinked policy areas extend beyond the scope of the PA SME Working Group, but are critical for a joint
strategy aimed at increasing the internationalisation and integration of SMEs in global value chains.
The OECD could undertake a peer review process for the Pacific Alliance with three pillars, linked to
specific committees (on Investment and Trade) and a Working Party (on SMEs), which have developed
tools for comparative analysis and exchange of best practices that could help PA countries to address the
challenges and implement the agenda suggested above. These tools include the OECD SME Policy Index
for the SME policy pillar; the OECD Trade in Value Added (TiVA) Database, OECD Trade Facilitation
Indicators and OECD Services Trade Restrictiveness Index for the trade pillar; and the OECD’s Policy
Framework for Investment for the investment pillar.

10
SECTION 1: INTERNATIONALISING SMALL AND MEDIUM-SIZED ENTERPRISES IN THE
PACIFIC ALLIANCE: CHALLENGES AND OPPORTUNITIES
Introduction
The Pacific Alliance (PA) represents an economic region with a combined gross domestic product (GDP)
of USD 1.9 trillion and an integrated market of more than 200 million people. Created in 2011, the trade
bloc consists of Chile, Colombia, Mexico and Peru. In 2014, Costa Rica began the process of joining the
group. The PA is the second-largest economic aggregation in Latin America and the Caribbean (LAC)
after Mercosur. Its relevance is increasing, given the dynamism of its member economies and their fast
demographic expansion. Its members’ aim is to use the alliance as a platform for economic and trade
integration.
The PA has clearly stated its specific goal of enhancing the internationalisation of the region’s SMEs,
using the PA as a platform for internationalisation and prioritising engagement with the Asia-Pacific
region. This scoping paper thus aims to identify alternatives for joint initiatives to promote the
internationalisation and greater integration of SMEs at both the intra-PA level and into global value chains,
as well as the kind of support the OECD could provide.
Businesses, especially SMEs, can internationalise their economic activity in many forms other than directly
exporting intermediate or finished products, Other forms of internationalisation include indirect exports
through participation in international value chains and/or by entering into point venture agreements,
licencing and technological transfer agreements, commercial cooperation or franchising agreements. The
channel consisting of direct export activities requires a set of skills and resources that only the most
productive and well-managed SMEs are able to muster. Indeed, even in countries with strong SME sectors,
it is rare for SMEs, especially micro and small businesses, to export directly. Instead, SMEs seek to access
foreign markets indirectly in various ways, such as partnership schemes, consortia, sales groups, market
operators, sub-contracting, It is here where the globalisation of value chains has further opened up the
possibility of SMEs participating in international trade as suppliers of goods and services to larger
enterprises. Indeed, previous OECD work has concluded that the establishment of sustainable linkages
between SMEs and MNEs is one of the most effective ways to integrate domestic suppliers into GVCs
(OECD, 2008a).
The globalisation of value chains is central to today’s discussions on trade. It is linked to the growth of
global production networks in which multinational companies play an important role and has resulted in
the physical fragmentation of production into optimal locations for each of the various stages. As a result,
intermediate products and services account for 56% of world trade in goods and 73% of world trade in
services, demonstrating that finished products are now less important in trade flows (OECD/ECLAC,
2012). This opens up new possibilities for developing/emerging economies, allowing them to engage in
areas of production that were not previously feasible, and industrialise more rapidly. Without these chains,
economies would have to master entire production processes in order to compete on the world market. The
fragmentation of production also opens up opportunities in niche products and services.
In order to better understand these phenomena in the PA context, this section provides a general evaluation
of SMEs and the existing trade structure in the PA, and enumerates a number of challenges and
opportunities that SMEs2 face when engaging in international activities, building on existing OECD work.

11
I. The context for small and medium-sized enterprises in the Pacific Alliance
SMEs are an important source of employment in PA countries.
SMEs account for approximately 99% of businesses and 67% of employment in PA countries (see Annex
A, Table 1). If microenterprises are excluded from this category, a distinction which might be important
when discussing the specific topics of internationalisation and participation in GVCs,3 SMEs in PA
economies then represent from 1.8% of businesses in Peru to 12.2% in Colombia.
SMEs’ contribution to GDP in the region is relatively low compared to other regions, reflecting
shortcomings in labour productivity.4
In the LAC region, SMEs produce approximately 30% of GDP. This contrasts with the much higher
contribution of SMEs to GDP in OECD countries, which reaches 60% (OECD/ECLAC, 2012). While it is
a normal phenomenon worldwide for larger companies to be more productive than microenterprises, the
productivity gap in the LAC region is much wider than that experienced in OECD countries. Large LAC
companies reach labour productivity levels up to 70 times greater than LAC microenterprises and up to 6
times greater than small firms (OECD/ECLAC, 2012). The PA economies are no exception, with large
firms experiencing productivity rates that are on average between 33 and 6.25 times greater than
microenterprises, and between 6.25 and 2.86 times greater than small firms (see Annex A, Table 2).5 In
contrast, large companies in OECD countries are only 2.4 and 1.6 times more productive, on average, than
microenterprises and small firms, respectively (OECD/ECLAC, 2012).
This lower than average performance by SMEs is reinforced by the structure of the economy
(OECD/ECLAC, 2012). In 2008, over 70% of all workers in the LAC region were employed in low-
productivity sectors, such as agriculture, construction, retail and personal services; 20% were employed in
medium-productivity sectors, such as manufacturing and transport; and 8% were employed in high-
productivity sectors, such as mining, finance, and energy (OECD/ECLAC, 2012). These employment
patterns lead to a vicious cycle, as large productivity gaps reinforce inequality in other areas (skills, access
to networks, adoption of technical developments, etc.) (OECD/ECLAC, 2012). For example, a high wage
gap exists between SMEs and large firms (see Annex A, Table 3), contributing to and reinforcing
inequalities in the social sphere.
Pacific Alliance SMEs have limited exports and play little part in global and regional value chains.
SMEs in PA countries have very small levels of direct and indirect6 exports. This is a common issue across
the entire LAC region; the share of SMEs who export in Latin America is only half of that recorded in
Europe and one-third less than the levels in four selected East Asian countries (see Annex A, Table 4).
Specifically, in PA countries, less than 15% of SMEs in each PA country engage in direct exporting, with
less than 6% in Mexico (IDB, 2014a). If indirect exporters are added, then the percentage of Pacific
Alliance SMEs engaged in exporting approaches 10% for Mexico, 20% for Chile and Peru, and slightly
exceeds 20% for Colombia. Of the SMEs that engage in direct exports, these exports make up
approximately 20% of their total sales for SMEs in Chile, Colombia and Mexico, and just over 30% for
SMEs located in Peru (IDB, 2014a). Indirect exports make up approximately 25-30% of sales among firms
that engage in them (IDB, 2014a).
In most countries, more than half of total exports are from MNEs. Within the OECD, some of the countries
with the highest values are the United States (75%), Hungary (73%) and Finland (72%) (OECD, 2011a).
However, this pattern is more acute in Latin America and in PA countries, ranging from 84% in Colombia
to 73% in Mexico (CEPAL, 2014). Some of these large firms are state-owned enterprises (SOEs) in the
extractive sectors, including Pemex, Ecopetrol, and Codelco, which rank 2nd
, 5th and 6
th among the largest

12
exporter firms of Latin America. Others include regional MNEs, often referred to as the “Multilatinas
group” (Cemex, Femsa, Groupo Alfa, Escondida, Grupo Mexico, Bimbo, Penoles and Minera Antamina)
and MNEs based in PA countries (such as Volkswagen Mexico and Chrysler Mexico); members of both of
these groups also appear in the top 20 exporters group of Latin America.
The median exporter in each PA country exports only two products to a single market (IDB, 2014a).
Furthermore, 38.5% of exporters in Chile, 27.5% in Colombia, 40.1% in Mexico and 29.8% in Peru export
only a single product to a single market. These types of exporters contribute relatively little to export
values, consisting of only 0.8% of total exports in Chile, 3% in Colombia, 1.2% in Mexico and 3.8% in
Peru (IDB, 2014a). This poses a significant barrier to further diversification and productivity, as it has been
shown that increases in export variety lead to increases in productivity (IDB, 2014a).7
II. Trade and global value chains in the Pacific Alliance
Gross trade figures for 2013 show that PA countries have different sectoral and regional trade
specialisations.
The gross trade figures8 show two distinct specialisation patterns in the region: while 77% of Mexico’s
exports are manufactured goods and only 23% primary commodities, the opposite is the case in the rest of
the PA countries. Primary commodities form 81% of Chile’s exports, 78% of Colombia’s, and 84% of
Peru’s. Mexico’s volume of trade is also significantly larger, in the order of USD 289 billion in the
manufacturing sector and USD 86 billion in commodities, while the figures for Chile, Colombia and Peru
are USD 13 billion, USD 12 billion and USD 6 billion for manufacturing and USD 58 billion,
USD 42 billion and USD 32 billion for commodities, respectively.
Regional specialisation patterns are also diverse and complementary. Mexican trade is strongly biased
toward the North American Free Trade Agreement (NAFTA) region, which took 82% of its total exports
and supplied 52% of total imports in 2013, while the other countries are more diversified. Chile is the most
diversified in its trading patterns, with 27% of trade going to Eastern Asia (mainly China and Japan), 16%
to NAFTA countries, 16% to the EU and 16.5% to South America (see Annex A, Figure 1).9
A further sectoral analysis by main trading partners confirms these patterns (see Annex A, Figures 2-5 and
Tables 5-8). On the one hand, the Mexican economy is strongly linked to the United States, through both
intra-industry and cross-sectoral trade. Trade in machinery and transport equipment with the United States
represents 47% of Mexico’s total exports and 18% of its imports. Exports of petroleum and related
products to the United States represent 9% of Mexico’s total exports, while imports of chemicals and
related products from the United States represent 7% of its total imports. On the other hand, Chile,
Colombia and Peru are more focused on a limited range of commodity exports, and rely more heavily on
importing machinery and manufactured goods. Exports of ores and non-ferrous metals represent 58% of
Chile’s total exports and 47% of Peru’s, while petroleum and related products represent 69% of
Colombia’s total exports.
Trade within the Pacific Alliance region is relatively low and therefore has significant potential for
enlargement under the agreed tariff reductions.
In 2013, intra-PA trade represented only 3.5% of the region’s total trade, while the corresponding figures
in the EU, the NAFTA region and the ASEAN+5 region,10
were 59.1%, 49.6% and 49.8%, respectively.11
This low intra-regional trade is not unique to the PA, but rather applies to the LAC region more generally.
While Mercosur’s intra-regional trade flows are significantly higher than those of the PA, they are still
only 14% of its total trade (CEPAL, 2014). According to UNCTAD (2014) estimates, with intra-regional
global value chain (GVC) flows totalling only 11% of total regional GVC participation, Latin America is

13
the region with the second-lowest intra-regional flows, just ahead of Africa (6%).12
A deeper analysis
could be done through the application of a trade gravity model to the region, but it is clear that given the
robust economic size and cultural homogeneity of countries in the region, the potentially complementary
nature of their sectoral specialisations in exports and imports, and the relatively short distances involved,
there is significant potential for stronger trade integration in the PA.
Within the Pacific Alliance, in 2013, Mexican exports to Colombia were worth USD 4.7 billion,
USD 2.1 billion to Chile and around USD 1.7 billion to Peru. In the same year, Chile exported close to
USD 2 billion to Peru and USD 1.3 billion to Mexico. Peru’s exports to Chile in 2013 totalled
USD 1.6 billion. All other exchanges are below the USD 1 billion mark (see Annex A, Table 9). Intra-PA
trade in primary commodities is more balanced; for example, Colombia exports to Chile around the same
value of primary commodities (USD 1.2bn) that Peru exports to Chile (USD 1.06bn).
A closer look at trade between PA countries supports a general distinction between the Mexican economy
and Chile, Colombia and Peru, with Mexico clearly standing out in terms of its exports of machinery and
electronics, while export activity among the other three is concentrated in the natural resource sectors (see
Annex A, Tables 5-9). Mexico’s intra-PA exports are clearly concentrated in the sectors of machinery and
electronics, transportation, and chemicals. In contrast, Chile’s intra-PA exports are concentrated in food
products, wood, chemicals, metals and vegetables, along with exports of machinery and electronics to
Peru. Over 70% of Colombia’s exports to Chile are made up of fuel; other significant exports exist in the
chemicals sector (except to Chile), transportation sector (to Mexico), and plastic and rubber. Peru’s exports
are concentrated in the fuel sector (Mexico), metals (Colombia), and minerals (Chile).
The degree and type of participation PA countries have in global value chains also follows two
distinct patterns.
The updated OECD Measuring Trade in Value Added (TiVA) database released in 2015 defines GVC
participation in terms of the value-added embodied in exports looking both backwards and forwards from a
reference country: backward when it comes to foreign value added embodied in exports, and forward when
it refers to domestic value added that is used as inputs to produce exports in the destination country (see
Annex B, Box 1). Within the PA, while Mexico demonstrates a high backward participation index, Chile’s
GVC participation is clearly more waited towards forward linkages, with Colombia and Peru exhibiting
patterns closer to those of Chile than to those of Mexico (see Annex A, Figure 6).
Over the last twenty years, Mexico has been able to incorporate a growing proportion of foreign value-
added embodied in its exports, rising from 26% in 1995 to 30% in 2009, i.e. a high backward participation
index. Its sales into other countries’ value chains [i.e. the domestic value added embodied in the exports of
other countries as a share of its gross exports, or its forward GVC participation index, is comparatively
small, rising from 10% to 11% over the period 1995 to 2009 (see Annex A, Figure 6). This suggests a
larger share of assembly rather than the production of intermediate goods13
, in manufacturing sectors such
as electrical or transport equipment.
Chile, on the other hand, has a lower, albeit growing, foreign value added content embodied in its exports –
i.e. its backward participation index – 15% in 1995 rising to 18% in 2009. Yet its sales into GVCs early in
the production process are much more prominent. Its forward GVC participation index is thus at the
opposite end of the spectrum from Mexico, growing from 22% in 1995 to 33% in 2009. Its participation is
mainly characterised by sales of products from primary sectors, where it has a strong comparative
advantage, to other countries’ productions of exports. Colombia and Peru’s economic structure and trade
specialisation patterns are closer to those of Chile than to those of Mexico. The estimated backward
participation indexes of Colombia and Peru in 2005 are 16% and 10% respectively, and their forward
participation indexes are estimated at 18% and 16%, respectively.

14
The relevant economic concept is the principle of comparative advantage. It is clear that in the past three
decades, Mexico has diversified its economy and developed significant comparative advantages, output
and jobs in the assembly of relatively advanced manufacturing products (see Annex B, Box 2), while Chile
and Peru have strong revealed comparative advantages in mining, and Colombia has advantages in
minerals, fuels and related materials.
Foreign direct investment (FDI) reinforces trade specialisation patterns.
FDI patterns within the PA also exhibit a clear split between that of Mexico and those of Chile, Colombia,
and Peru (see Annex A, Table 10). These patterns are clearly related to the aforementioned patterns of
GVC participation, reflecting Mexico’s specialisation in assembly of intermediate goods and Chile’s
comparative advantage in the sale of products from primary sectors.
In the case of Mexico, the so-called maquila industry is characterised by “vertical multinational
enterprises” that import intermediate goods for production and export a large share of their production,
taking advantage not only of the proximity to the US market and the lower labour cost, but also,
increasingly, the qualifications and experience accumulated in the manufacturing labour force.
In the cases of Chile, Colombia and Peru, the most prevalent pattern is that of “greenfield FDI”,
representing 2.5, 2.3 and 2.8% of GDP, respectively, which is oriented towards developing natural
resource deposits. Greenfield FDI brings capital and expertise to the country and develops forward GVC
linkages, usually by exporting extracted raw materials, which are often processed elsewhere. While this
type of FDI is mostly driven by large enterprises, SMEs may be able to play a role as
upstream/downstream suppliers and suppliers of services to these large foreign ventures.
The above analysis has highlighted the importance of recognising the differences in the degree and type of
engagement in global value chains by Pacific Alliance countries, as well as the growing importance of this
engagement. The analysis evidences the need for wider structural reform, through policies fostering
diversification, especially in the cases of Chile, Colombia and Peru. The low level of current regional
integration into GVCs,14
coupled with potential complementarities arising from differing specialisations
along specific value chains and sectors, suggests that there might be scope to significantly increase intra-
Pacific Alliance participation in GVCs and trade flows. While this analysis has considered the most
prominent forms of economy-wide engagement in GVCs, it is also important to analyse other types of
engagement in particular industries. Forthcoming OECD analysis15
will provide greater insights about
specific sectoral interactions between PA countries that could better inform policy decisions.
III. Promoting SME internationalisation in the Pacific Alliance: Opportunities and challenges
As previously stated, international fragmentation of production into global value chains has changed
international trade patterns. This has opened new opportunities, allowing emerging economies to engage in
areas of production that were not previously feasible and industrialise more rapidly, and SMEs to position
themselves in new niches for the supply of novel products and services, exploiting their flexibility and
ability to move quickly (OECD, 2008a).
Notwithstanding, SMEs in general face a number of challenges in engaging in international activities,
particularly in the areas of innovation, compliance with standards, uneven bargaining power, lack of
capacity and resources, skills, and information gaps. This sub-section looks at opportunities and challenges
in the PA context for the participation of SMEs in international activities, drawing on OECD experience.

15
Opportunities
Overall, participation in GVCs and supply chains can help to diversify exports, create new jobs, and
obtain new technological capabilities and knowledge through spillovers and transfers.16
More specifically, participation in GVCs can offer potential improvements in efficiency or productivity in
the following categories: upgrading production process efficiency; product upgrading; functional
upgrading, which involves adding new functions with a greater added value to the chain; and inter-sectoral
upgrading, which involves expanding clusters into new production activities. As an OECD study on
barriers to SME access to international markets stated, “…there are strong links between innovation,
internationalisation and productivity growth. Internationalisation allows access to new markets, allows the
absorption of excess production capacity or output, and improves resource utilisation and productivity. It
exposes the SME to international best practice, knowledge, and technology through greater experience of
the competitive pressures of the international trading environment” (OECD, 2008d: p.14).
In addition to the general opportunities provided for SME internationalisation through integration into
GVCs, the building of a PA regional market also opens new possibilities for SME internationalisation,
including through direct exports, indirect trade participation, business collaboration and direct
investment.
Exporting to large markets, such as the United States, Europe or East Asia, requires substantial capabilities
from SMEs, in order to comply with technical standards and overcome logistic, commercial and even
language barriers. Exporting to other PA countries, on the other hand, may be easier, and would allow
SMEs to benefit from scale effects and enhance their competitiveness. Ultimately, it would serve as a
platform to prepare to target extra-regional markets as well. Developing intra-PA distribution channels
would thus be an important policy priority, particularly true for sectors with strong SME participation such
as light manufacturing, food products, textiles and clothing, wood, vegetables, animals, and footwear.
Indeed, focusing on fostering SME internationalisation through the development of intra-PA trade could be
a particularly fruitful engine for economic integration and growth, given the structure of the PA economies,
and the relatively low volume of existing intra-PA trade. A greater level of economic integration among
PA members would open opportunities to diversify and deepen their productive structure, develop new
comparative advantages, and increase economic activity and employment.
Strong existing trade links emerge when intra-PA trade is examined in detail. An in-depth analysis of the
value added figures is not within the scope of this paper; nonetheless, Tables 5-8 in Annex A provide
specific percentages by sector, and Figure 7 in Annex A highlights some of these trade links. Strengthening
the existing trade linkages depicted in Figure 7 could also open significant opportunities for participation in
GVCs and consolidating intra-PA value chains. While PA countries’ exports are concentrated in sectors
that are heavily dominated by MNEs, there is scope to increase SMEs’ participation in GVCs as quality
providers of goods and services to these large firms.
Challenges
Despite all of the potential benefits outlined above, it must be recognised that SMEs are limited in their
ability to participate in international activities. This is especially the case in Chile, Colombia and Peru,
whose economies are currently concentrated in a few resource-oriented sectors where SMEs play a
marginal role.17
While SMEs can play a vital role in fostering regional economic integration, trade and
investment liberalisation alone will not be sufficient to secure a higher level of SME participation in intra-
PA trade and investment flows. In order to achieve this goal, trade and investment liberalisation should be
accompanied by policies promoting economic diversification and supporting entrepreneurship and
16
enterprise development in order to open up wider opportunities for SMEs to benefit from GVCs.
Therefore, the emergence of new comparative advantages in the manufacturing and service sectors is
somehow a precondition for the broadening and deepening of trade flows in the PA and a more active role
for SMEs in the PA’s trade and economic integration. In general, SMEs tend to be greatly concentrated in
the non-tradable service sector, rather than in more internationally-oriented sectors such as manufacturing,
and generally must reach a threshold in terms of both productivity and size in order to successfully export
directly and/or gain the interest of large companies. Thus, policy makers should be aware that small and
medium-sized companies are much more likely to be successful in exporting than microenterprises.
Previous OECD work on SME internationalisation has identified the key challenges across a variety of
global contexts. Two surveys conducted by the OECD in 2008, entitled The Member Economy
Policymaker Survey and The Survey of SMEs’ Perceptions of Barriers to Access to International Markets,
obtained detailed insights into the barriers facing international SMEs as perceived by policy makers and
SMEs themselves (OECD, 2008d). The barriers to internationalisation identified in the survey were
classified into the four categories outlined below. Specific challenges of PA countries and the Latin
American context are highlighted.
1. Finance
Traditional bank finance poses challenges to SMEs, in particular to newer, innovative and fast-growing
firms with a higher risk profile. Diversified funding sources for SMEs can better serve the needs of firms at
different stages of their life cycle, as well as help to mitigate systemic risk, strengthen economies’
resilience to critical shocks, and foster new sources of growth (OECD, 2015a).
LAC SMEs face substantial challenges in obtaining financing. SMEs account for only 12% of total credit
in the region, compared to 25% in OECD countries (OECD/ECLAC, 2012). Long-term financing is also
more expensive for SMEs in the region due to both an ongoing transition in the banking sector and high
collateral requirements. While regional net interest margins have already been lowered to 8.6%, this rate
still sharply contrasts with the OECD average of 2.7% (OECD/ECLAC, 2012). Furthermore, collateral
requirements for SMEs remain high, exceeding 200% of the value of the loan in the case of Peru, Chile and
Mexico (IDB, 2014a). Demand-side issues exist as well; although the approval rate of SME loans is
relatively high, very few SMEs overall have financing. Within the PA, Chile and Colombia emerge as
leaders, with close to 100% of their SMEs having a checking and/or savings account, and approximately
60-80% a bank loan or line of credit. Mexico ranks significantly lower, with only around 60% of SMEs
having a checking and/or savings account and less than 40% a bank loan or line of credit (IDB, 2014a).18
The share of SMEs identifying access to capital as a major constraint in 2009 was approximately 8% in
Peru, 20% in Chile, 30% in Mexico and 45% in Colombia (IDB, 2014a).
2. Business Environment
The length and cost of processes to start and close a business are important considerations for the SME
sector (OECD/ECLAC 2012). Lengthy processes and high costs when starting up encourage SMEs to
operate informally, restricting their access to assistance and finance from formal and governmental
institutions, and preventing them from joining GVCs. On the other hand, lack of an appropriate framework
to close down companies exposes creditors to significant risk, making them less likely to invest in new,
smaller businesses.
The World Bank Entrepreneurship Database reveals a strong relationship between the level of cost, time, 19
and procedures required to start a business and the rate of new firm registration. Only Chile performs
above the OECD average, with Peru above the LAC regional average, and Colombia and Mexico
significantly below both (see Annex A, Table 11). Yet, PA economies stand out as the top four ranked

17
economies in the LAC region when it comes to overall rankings for “Doing Business”, as measured by the
World Bank’s Doing Business survey , with Colombia taking the top position (34th place overall),
20
followed by Peru (35th place overall), then Mexico (39
th place overall), and then Chile (41
st place overall).
There are two sides to this picture: while PA economies are doing well relative to the region, there is still
room for improvement to reach the standards of other regions and OECD countries.
In addition to these more general considerations, the productive structure prevalent in LAC countries poses
barriers to SME productivity and internationalisation. The regional export structure does not encourage
SMEs to access more innovative processes, as it is centred on natural resources and their derivatives, and
dominated by large firms due to the heavy required investment costs in these sectors (OECD/ECLAC,
2012). Furthermore, the productive structure of LAC SMEs markedly differs from what is found in OECD
countries. As stated in the OECD’s Latin American Economic Outlook, “In OECD countries, SMEs can
only survive in the industrial development process if they produce specific goods and services that do not
compete with products mass-produced by large industrial firms… almost all of them [LAC SMEs] operate
in standardised forms of production that are not knowledge-intensive, thus competing directly with mass
producers and/or large commercial enterprises” (OECD/ECLAC, 2013: p.52). This productive structure
limits the ability of the region’s SMEs to link with larger firms, as rather than complementing their
production they are attempting to compete with them (see Annex A, Figure 8 for an illustration). Their
particularly low rates of productivity also affect their ability to link with large firms, who are not likely to
choose suppliers that will struggle to meet the necessary quality standards or volume of production. This
results in a vicious cycle, with the SMEs’ initial low productivity fuelling an absence of knowledge
transfer between businesses, which in turn keeps productivity low (OECD/ECLAC, 2012)
3. Firms’ Capabilities
SMEs in the LAC region have important skills gaps. Almost 37% of companies in the region believe
finding a workforce with the necessary training is one of their main obstacles, posing limits to their
development and preventing productivity gains. This is higher than both the global average and figures for
other developing regions (OECD/ECLAC, 2012). Technical skills and “soft skills” – critical thinking,
teamwork, problem solving and change management, oral and written communication, responsibility at
work, and the capacity to adapt to new environments – are most in demand by the region’s SMEs, with the
greatest deficiencies being in soft skills (OECD/ECLAC, 2012).
LAC SMEs also have low levels of use of advanced information and communications technology (ICT),
which leads to fewer opportunities to connect, enter international markets and increase competitiveness
(OECD/ECLAC, 2012). Previous OECD work has found that the use of ICT and related services plays an
important role in facilitating small firms’ access to foreign markets, as it allows them to extend their
network of business partners and reach new customers with greater ease and at lower costs (OECD,
2008a). Furthermore, ICT-enabled business processes are central to participating in GVCs (OECD/World
Bank, 2015). However, the low levels of penetration of fixed broadband access in the region, and in
particular the low level of adoption of technology among SMEs, limits their capacity to grow and expand
their market opportunities.
4. Market Access
Poor infrastructure and institutions strongly affect the capacity of SMEs to access other markets. Better
logistics infrastructure improves trade opportunities for SMEs in particular, as logistics (customs,
infrastructure, international shipments, tracking and tracing, timeliness, stock management, storage,
transport and distribution, etc.) tend to cost more in relative terms for small producers than for large ones.
In Latin America, domestic logistics costs can add up to more than 42% of total sales for SMEs, compared
to 15-18% for large firms (OECD/CAF/ECLAC, 2013).Furthermore, both uncertainty in international

18
contracts and low-quality infrastructure can lead to delays and sub-optimal outcomes for trade and
investment (Kowalski et al., 2015; OECD/CAF/ECLAC, 2013). Investment in infrastructure and quality
institutions is thus key to facilitating trade and reducing trade costs. Indeed, high-quality logistics affect
trade at least as much as, and at times even more than, distance or transport costs. Changes in logistics
performance have a 37% greater impact on imports than distance, and for exports this figure rises to 96%
(Korinek and Sourdin, 2011; OECD/CAF/ECLAC, 2013). Increasingly complex international transactions
necessitate institutions that can create appropriate contracting environments to ease difficulties. This is
demonstrated by the close association between institutional quality and backwards participation in GVCs
(Kowalksi et al., 2015).
The importance of logistics is particularly clear in the PA context, as Chile, Colombia and Peru’s exports
are all more than twice (three times in the context of Chile and Peru) as likely to be time sensitive or
logistics intensive than for OECD countries (see Annex A, Figure 9). The World Bank’s Logistics
Performance Index (LPI) indicates that the LAC region as a whole performs worse than OECD countries
and East Asia21
and the Pacific. However, PA countries on average perform better than the LAC and East
Asian and the Pacific regions, although they still significantly lag behind the OECD average (see Annex A,
Tables 12 and 13). Chile is the only PA country who performs above the world average for the quality of
both its infrastructure and institutions (see Annex A, Figure 10). The six components of the LPI can be
divided into two groups. The first group comprises regulatory and institutional components, the main
inputs in the logistics chain where public policy has a direct effect: customs, infrastructure and logistics
services. The second group comprises the components that measure the performance of the logistics chain:
timeliness of shipments, cost of shipments and traceability of consignments (OECD/CAF/ECLAC, 2013).
The PA lags furthest behind the OECD average in the first group, where public policy plays a vital role.
The largest gap is for infrastructure, followed by customs and then logistics services. However, PA
countries also face comparable gaps in the performance-related elements of tracking and tracing, and
timeliness, showing a need to focus on performance in these areas as well.
IV. Conclusion
This initial analysis makes clear both the significant opportunities and challenges that SMEs in the Pacific
Alliance face when attempting to internationalise and integrate into GVCs. While more in-depth analysis is
necessary to fully explore the particularities of the PA context, key preliminary conclusions can be
summarised as follows:
SMEs are an important source of employment in PA countries; however, SMEs’ contribution to GDP
in the region is relatively low compared to other regions, reflecting shortcomings in labour
productivity. Furthermore, Pacific Alliance SMEs have limited exports and play little part in global
and regional value chains.
PA countries have different sectoral and regional trade specialisations, with a general distinction
between the Mexican economy and Chile, Colombia and Peru. Mexican trade is strongly biased toward
the NAFTA region, while the other countries are more diversified. Mexico also clearly stands out in
terms of its exports of machinery and electronics, while export activity among the other three is
concentrated in the natural resource sectors.
A general distinction also exists between the Mexican economy and Chile, Colombia and Peru in terms
of their type of participation in global value chains. For Mexico, backward linkages are its
predominant form of participation in GVCs. Chile, on the other hand, has a much more prominent
forward participation index. Colombia and Peru’s GVC participation patterns are closer to those of
Chile than to those of Mexico.

19
Trade within the Pacific Alliance region is relatively low. Given the robust economic size and cultural
homogeneity of countries in the region, the potentially complementary nature of their sectoral
specialisations in exports and imports, and the relatively short distances involved, there is significant
potential for stronger trade integration in the PA under the agreed tariff reductions.
International fragmentation of production into GVCs has opened new opportunities, allowing emerging
economies to engage in areas of production that were not previously feasible and industrialise more
rapidly, and SMEs to position themselves in new niches for the supply of novel products and services.
The building of a PA regional market also opens new possibilities for SME internationalisation,
including through direct exports, indirect trade participation, business collaboration and direct
investment. While exporting to large extra-regional markets requires substantial capabilities from
SMEs, exporting to other PA countries may be easier. Ultimately, it would serve as a platform to
prepare to target extra-regional markets as well. Developing intra-PA distribution channels would thus
be an important policy priority, particularly true for sectors with strong SME participation.
Despite all of the potential benefits, it must be recognised that SMEs are limited in their ability to
participate in international activities. This is especially the case in Chile, Colombia and Peru, whose
economies are currently concentrated in a few resource-oriented sectors where SMEs play a marginal
role.22
Trade and investment liberalisation alone will not be sufficient to secure a higher level of SME
participation in intra-PA trade and investment flows. In order to achieve this goal, trade and investment
liberalisation should be accompanied by policies promoting economic diversification and supporting
entrepreneurship and enterprise development in order to open up wider opportunities for SMEs to
benefit from GVCs.
Previous OECD work on SME internationalisation has identified key challenges in the areas of
finance, business environment, firm capabilities, and market access across a variety of global contexts.
Certain challenges within these aforementioned categories are more acute in the LAC region and PA
sub-region, including supply and demand-side issues related to financing; the length and cost of
processes to start and close a business; the productive and export structure; skills gaps; low use of
advanced ICT; and poor logistics infrastructure.

20
SECTION 2: MEETING THE CHALLENGES: ELEMENTS TO CONSIDER FOR A JOINT
AGENDA
Introduction
Addressing barriers to internationalisation for SMEs requires a broad, co-ordinated policy agenda which
spans many areas of government, and in this case across governments of various countries.
A joint PA policy agenda for SMEs could benefit from considering SME internationalisation as a learning
process, encompassing different types of support for individual SMEs depending upon where they are in
their learning process and allowing them to evolve over time as they gain more experience and knowledge.
The PA countries clearly recognise the need for co-ordination and the integration of SME
internationalisation efforts into the overall development strategy. Work to co-ordinate the efforts of their
respective export and investment promotion agencies (ProColombia, ProMéxico, PromPerú, ProChile) 23
and to form a technical working group on SMEs to identify priorities and develop joint initiatives represent
some steps in the right direction. As stated in the previous section, the PA has clearly stated its specific
goal of enhancing the internationalisation of the region’s SMEs, using the PA as a platform for
internationalisation and prioritising engagement with the Asia-Pacific region, providing a clear framework
for efforts by the bloc, national agencies, and the private sector.
This section takes stock of existing policies in PA countries to address four key policy areas outlined in the
previous section; a fifth area, specifically focusing on trade, is added in line with the special focus of this
document on SME internationalisation. The examination of each policy area concludes by providing
elements for the PA to consider in advancing their joint agenda. A summary of existing OECD research in
each policy area can be found in Annex D.
Elements for the Pacific Alliance to Consider in Advancing Their Joint Agenda
1. Finance
PA countries have a large variety of financing instruments in place for SMEs, including direct
funding; factoring and reverse factoring24
; provision of credit under favourable conditions and guarantees
for credit; micro insurance; and facilitation of access to venture capital for start-ups. These measures vary
significantly in orientation, size and which segment of the SME population they target. No country,
however, has fully developed all of these options. As many of these instruments are linked to other
programmes, this section will be limited to a short review of bank financing and other SME financing
support schemes.25
Mexico has engaged in supplier financing through factoring and reverse factoring, targeting SMEs linked
to global value chains (GVCs) and multinational enterprises (MNEs). Mexico’s National Entrepreneurship
Fund also allocates approximately 36% of its funding into a guarantees programme, intended to enhance
access to finance for SMEs by allocating resources to financial institutions while still having the federal
government incur the financing risk.
21
Chile provides more general loan programmes, such as the CORFO Credit for Micro and Small
Enterprises, along with a variety of measures aimed specifically at financing start-ups and growth,
providing guarantees to lessen risk, and facilitating access to venture capital.26
Colombia’s entrepreneurial development bank, Bancoldex, designs and offers a variety of financial and
non-financial instruments to promote competitiveness, productivity, growth and development. Bancolodex
aims to increase SMEs’ access to finance by offering longer repayment terms and lower interest rates, with
credit lines that provide funding for working capital, investment and company modernisation, green
financing, and innovation and entrepreneurship. Microinsurance to protect entrepreneurs’ equity is also
available, as well as a private equity and venture capital fund aimed at developing the capital investment
industry in Colombia.
PA countries understand the role that governments can play in helping to bear part of the risk that SMEs
undertake when they venture into international markets, thus increasing incentives for more SMEs to
internationalise, as well as the need for a variety of targeted financial products which correspond to SMEs’
core needs (innovation, starting up etc.).
In the future, PA countries could consider:
Diversifying their own portfolio of instruments for financing SMEs, learning from other PA
country experiences, and ensuring that their instruments complement those adopted by their PA
partners. The OECD SME Financing Scoreboard provides comparisons of financing mechanisms
for SMEs across OECD countries. A specific report could be undertaken for the PA, building on
this analysis (see Section 3).
Taking advantage of existing joint efforts to create the Latin American Integrated (Stock) Market
(MILA) to create joint financing instruments for the most advanced and innovative SMEs,
providing a new alternative source of equity financing to support their expansion.
Organising a workshop on SME financing where PA countries and other countries could share
their own practices. The OECD could support PA countries in this endeavour.
Sharing experiences with existing venture capital programmes (in Chile and Colombia) and
investing in further research in order to identify key barriers to scale-up in PA countries.
Engaging in measures to foster high-quality securitisation of SME loans and liabilities, to
indirectly promote SME financing, without the complete disintermediation of banks.
2. Business environment
PA countries have a variety of well-established and proactive activities in the areas of forming
business clusters (see Annex C, Table 18) and attracting foreign investment. Indeed, as the “GVC
revolution” has been driven to a large extent by MNEs and FDI (OECD, 2013), an important strength of
the PA is its openness to international trade and investment.
PA member countries have played a major role in the growth of FDI flows in Latin America.
According to the OECD FDI Regulatory Restrictiveness Index27
, the PA countries are on average more
open to international investment than the other 54 countries included. According to the World Investment
Report (UNCTAD, 2014), Mexico, Chile and Colombia were among the top 20 recipients of FDI flows in
the world in 2013, with inflows totalling USD 38 billion, USD 20 billion and USD 17 billion respectively,
and ranking only after Brazil as the top recipients in the region.28
However, there is considerable potential
22
for raising intra-PA FDI flows, currently equal to only 3% of total FDI received from all sources, and
mostly attributable to the activities of Chilean “multilatinas”. Linkage programmes between local SMEs
and foreign-owned enterprises are still relatively underdeveloped in the PA, with the exception of Mexico
and Chile.
Regarding FDI, concrete PA initiatives in support of economic integration include the activities of the
Working Group on Trade and Investment and the Working Group on Services. A joint group composed of
an investment subcommittee and a service trade committee has been established to improve the
institutional and policy environment through enhanced co-operation and exchange of information. There is
also healthy competition among national and sub-national investment promotion agencies, as well as
collaboration to organise high-level forums such as those held in New York in 2013 and Miami in 2014,
where the four heads of state jointly promoted the PA.
In the area of international certification, in Mexico, INADEM’s National Entrepreneurship Fund can be
used for the support of projects focused on certifications within Category I (Regional and Sectoral
Development) of its “public calls” programme, as well as within specific calls for “High Impact
Entrepreneurs” and “Development and Strengthening of the Exportable Offer”.
In advancing a joint agenda to improve business environment, PA countries could consider:
Developing or further developing business clusters and linkages between SMEs and larger
enterprises in sectors where there are opportunities for greater participation of SMEs in GVCs.
This may include measures to promote business networks and intra-firm co-operation, the
introduction of SME mentoring schemes and the expansion of quality certification programmes to
ensure that SMEs acquire the technical and quality standards they need to qualify as suppliers to
multinational enterprises and integrate into GVCs.
Going beyond the development of clusters at the national level, and working to form PA clusters
by sector (automotive, textile, etc.), as a way to identify synergies among Alliance members, and
encourage further trade, mergers and sharing of information.
Build on already substantial joint efforts to attract FDI. Future policies can explicitly be designed
to meet a variety of needs, such as attracting MNEs that will promote technology and knowledge
transfer to local suppliers and subcontractors, or helping established foreign affiliates to enter
and/or upgrade into higher-value activities. Investor after-care services are also a key policy area to
consider, as this can influence investors’ decisions on initial and/or continued linkage development
(OECD, 2008a). PA countries could thus undertake joint initiatives to attract FDI and develop
investor after-care services with an emphasis on MNEs, particularly on those with multiple
operations in the PA region that will promote technology and knowledge transfer to local suppliers
and contractors.
Building on their joint participation in the OECD Investment Committee and adherence to the
Guidelines for Multinational Enterprises to increase synergies in their investment policies, and
avoid mutually damaging actions such as a race to the bottom on incentives; failing to respect
regulations on the environment, intellectual property rights and labour; and the tolerance of anti-
competitive practices directly harming SMEs.
Including provisions for technology transfer from small subcontractors to MNEs, within the
context of the OECD Guidelines for Multinational Enterprises, (OECD, 2011b).

23
Implementing effective compliance measures for preventing bribery. SMEs in the Pacific Alliance
region will not be able to integrate into global value chains unless they can implement effective
compliance measures for preventing bribery, allowing them to meet MNEs’ standards for their
suppliers and distributors. The measures would need to be reasonable and proportionate to the risks
that they face.
3. Firm capabilities
PA countries have a number of policies in place to enhance firm capabilities in the following domains:
Supplier development programmes.
Supplier development programmes can increase SMEs’ ability to boost productivity and increase sales,
while creating stable, qualified suppliers for large companies. The continued development of supplier
development programmes is a key policy area for the PA, offering clear mechanisms for the strengthening
of SME-MNE linkages that can serve as a platform to both indirect and direct internationalisation. When
designing these types of programmes, PA countries should keep in mind that interventions to boost a
company’s productivity and competitiveness need to be paired with interventions that strengthen links and
integration (OECD/ECLAC, 2012).
Both Chile and Mexico’s supplier development programmes (see Annex C, Table 19) are aimed at
overcoming co-ordination failures in order to strengthen the relationship between MNEs and their SME
suppliers. Chile’s BHP Billiton-CODELCO (National Copper Corporation) programme also aims to
improve SME suppliers’ prospects for internationalisation. Without these programmes, co-ordination
failures often arise, as companies can be unwilling to assist their producers for fear that they will
potentially switch buyers, while producers are often not motivated on their own due to lack of information
about foreign market requirements and potential pay-offs (IDB, 2014c).
Innovation.
Start-ups are an emerging phenomenon in LAC innovation strategies (OECD, 2013). Among the PA
countries, Chile emerges as a leader regarding the state of implementation of various policy tools to
promote start-ups, with well-developed tools in the areas of financing, business services and
entrepreneurial training, and tools in development to strengthen the regulatory framework (see Annex C,
Table 20). While other PA countries’ innovation programmes tend to be more recently created or in
development, Table 21 (see Annex C) gives more information by outlining a number of programmes
highlighted by the countries concerned.
Skills development
PA countries such as Chile, Mexico and Peru have developed successful skills-development programmes.
For example, the Mexican “Promotion Programme of Exportable Supply for SMEs” supports companies
interested in beginning to export and/or diversify their products. It does so through comprehensive and
integrated services such as qualification, specialised consultancy, promotion of international markets and
commercialisation, and institutional and management support for developing export projects, thus
combining assistance in both capabilities development and gaining access to markets (OECD, 2008d).
Similarly, Mexico’s Exportable Supply Impellers Promotion Programme brings together foreign trade
organisations to support SMEs, and specifically assists in developing infrastructure for product promotion
and storage, inventory management, determination of costs and international marketing, providing
comprehensive assistance across the areas of financing, capabilities development and access to markets
(OECD, 2008d). In Peru, the “Generating Capacities for Export Chains” programme aims to generate

24
capacities that will allow micro and small enterprises to become incorporated in export chains, through
non-financial training and information services (OECD, 2008d).
In addition, various LAC countries, including Mexico and Colombia, have successfully experimented with
involving scientific research institutions, universities and centres of excellence in their support services,
which were often were not properly connected or integrated into production activity for cultural or
regulatory reasons, despite having the knowledge and high-quality infrastructure for the production
environment (OECD/ECLAC, 2012). One example is the software cluster in Mexico City, where the
Monterrey Institute of Technology and Higher Education and the University of León created training
programmes for universities and businesses (OECD/ECLAC, 2012). Colombia’s Bancoldex provides
entrepreneurial training developed in association with academic partners to help micro and small
companies gain access to and appropriately administer credit, and acquire knowledge on administration,
marketing, human development and international trade.
PA initiatives to increase exchanges of master’s and PhD students, promote cross-country enterprise
internships and support the intra-regional movement of professional and highly qualified technical staff
could also generally support the creation of innovative start-ups, cross-border fertilisation processes and
the emergence of innovative enterprise hubs in the larger PA market. The challenge for the region is to
build alternatives to limit the loss of highly qualified staff to the United States and other advanced
countries.
Incubators
CORFO’s 2010 reform of its incubation system could serve as a roadmap for other PA countries. It
changed the way incubators were paid from a flat fee for every firm incubated, into a renewal system that
evaluated various performance criteria. These included quality of corporate governance, management,
services provided, and the firm selection process; the sales performance of incubated firms; the degree to
which firms have been able to internationalise; and the extent to which firms were able to gain financing.
CORFO thus helped to align incentives around the success of incubated firms (IDB, 2014c). Preliminary
evaluations have found improvements in the quality of both incubators and incubated firms, as a well as a
change in hiring practices, with a shift away from hiring of former CORFO officials towards professionals
from the bank and retail sectors (IDB, 2014c). Incubators can also now choose to retain up to 7%
ownership in an incubated firm, providing further incentives to select firms with high potential and provide
high-quality incubation services (IDB, 2014c).
In designing a joint strategy to develop skills capabilities, PA countries could now consider:
Jointly developing supplier development programmes that offer clear mechanisms for the
strengthening of SME-MNE linkages and the upgrading of technological and managerial skills,
which can serve as a platform for both direct and indirect internationalisation. These programmes
could be supported by the development of a PA certification to help MNEs identify quality
suppliers in PA countries.
Balancing the policy mix to encourage both the creation and the scaling up of innovative SMEs,
which often involves having integrated support programmes that simultaneously offer the
development of finance, business services and entrepreneurial skills.
Ensuring an adequate-sized pool of human capital across the region, through both short and long-
term actions:
25
o In the short term, increasing the pool of available skills by facilitating the entry of
professionals from other countries. As noted above, Peru has made advances on this
through the elimination of business visas for PA citizens, which could be a fruitful joint
policy option for other PA members to consider.
o In the long term, creating alliances between the private sector, academia and the public
sector in order to ensure that education provides students with the right set of skills for key
sectors. The OECD Skill Strategy Project, currently ongoing in Chile and Peru, could
orient its work with PA-bloc members to provide insights to ensure that the needs of SMEs
in particular are incorporated into work to improve the match between market demand and
supply of relevant skills.
Encouraging formalisation as a first step to facilitate the entry of a greater number of firms in the
region into GVCs, especially microenterprises. While it is too early to evaluate the success of
Mexico’s national formalisation strategy,2 PA countries could certainly consider similar efforts
both jointly and at the national level, taking note of the need to offer both simple instructions and
clear incentives to encourage formalisation. In addition, the results of the World Bank “Doing
Business” Survey 20143 indicate opportunities for intra-PA sharing of best practices and peer
learning.4 Sharing experiences on policy reforms to streamline processes to start and close
businesses could increase the incentives to formalise businesses, especially for SMEs and
entrepreneurs who are disproportionately affected by high costs due to their small size and may
find cumbersome processes particularly overwhelming to navigate.
4. Market access
The consolidation of PA countries into a bloc offers clear opportunities for increasing intra-PA trade. This
could, in turn, provide new windows for SMEs who have not previously engaged directly in exporting to
begin exporting within the PA market. While successfully exporting to other regions is a very difficult
process, as evidenced throughout this report, ongoing efforts to harmonise trade policy within the PA bloc
(see next sub-section), as well as a shared language, could make exporting to other PA countries a simpler
process for first-time exporters, which could serve as a foundation for eventually expanding export activity
beyond PA borders. Recent research supports this recommendation, finding that once firms have
successfully exported to neighbouring/other Latin American countries, they are more likely to reach larger
OECD markets, with a 24% chance of reaching an OECD destination (IDB, 2014c). This demonstrates the
potential of both starting small and learning-by-doing, as the productivity increases gained through
exporting to regional markets helps to set exporters on a path for future, expanded success (IDB, 2014c).
PA countries vary in their level of programme development related to market access, however it is in this
area where most PA-wide joint initiatives have been carried out, led by their export promotion and
investment promotion agencies.
Direct export promotion
All PA countries have developed programmes that specifically provide support to SME exporters,
generally including training elements related to exporting, marketing, and use of advanced ICT (see Annex
C, Table 22). Both ProColombia and PromPerú have also developed “Ruta Exportadora” web portals,
which provide roadmaps for entrepreneurs interested in exporting, taking them through key stages and the
questions they must address. Both portals provide additional information, such as export statistics, market
access conditions, a tool for exporters to input their product information and identify potential
opportunities, and a variety of logistical information, as well as information on various educational
seminars, programmes and exploratory missions, trade fairs, and showrooms.

26
Additionally, in response to its findings of very low exporting activities among companies in key sectors
such as agribusiness and manufacturing, ProColombia has developed an advisory programme for SMEs
aimed at fostering an export culture and allowing companies to effectively internationalise. The
programme has four modules, consisting of the following elements:
market intelligence: information on specialisation and value-added through seminars,
publications, and web content;
identification of exportable offerings;
exploratory missions to learn about market requirements in countries of interest;
adjustments to proposed exportable offerings and creation of a business plan.
MNE-SME Linkages
Creating linkages between SMEs and large enterprises, where SMEs serve as in-country suppliers to large
exporting enterprises is a strategy with potential for increasing the internationalisation of SMEs without
them having to export directly. Although Colombia and Mexico have made some efforts in this area (see
Annex C, Table 22), other countries, such as Peru, have expressly noted that this is an area in which they
currently lack developed programmes. This suggests that this could be a particularly fruitful policy area for
the development of joint PA efforts.
The IDB’s review of a variety of country experiences with programmes to try and foster SME-MNE
linkages resulted in the following general lessons (IDB, 2014c):
Programmes based exclusively on matchmaking services seem to have more limited effects than
those which also provide complementary support to the suppliers, such as training.
Most successful linkage programmes are founded on merit-based selection criteria.
Any assistance to the supplier should be based on transparent diagnosis and auditing processes.
A pilot programme may be the best way to start, followed by periodical reviews to fine tune
objectives, strategies, targets and action plans.
Public procurement
Barriers to participation in public procurement contracts can be particularly significant for smaller firms.
The OECD’s Framework for the Evaluation of SME and Entrepreneurship Policies and Programmes
(OECD, 2008b) explains that the low share of SMEs awarded public contracts can arise for several reasons
that do not directly reflect discrimination. Most public contracts are simply too large for SMEs to
effectively bid for; governments tend to place a higher value on reliability than some parts of the private
sector, disadvantaging small and new firms; and the often high application costs provide a further
advantage to large firms, who can afford to make many applications more easily (OECD, 2008b).
Colombia, Peru and Mexico all have a variety of legal requirements to help prioritise and/or include SMEs
in public procurement processes. However, these vary considerably, with only Peru setting a quota for
SME involvement (see Annex C, Table 23).
To further consolidate these advances, PA countries could consider:
Facilitating the creation of PA-wide distribution channels and providing relevant information for
SMEs. The extended PA market provides an expansion opportunity for many SMEs already
competitive in their own market, given the similarity of markets and the common language. Many
of these firms may not yet be exporting or may not have considered exporting before, since
exporting traditionally often implied complying with very high standards for the US, European, or

27
Asian markets. PA countries could exploit this opportunity by facilitating the creation of PA-wide
distribution channels and providing relevant information for SMEs.
Including supplier development programmes and a SME-larger enterprises linkages component in
their SME national development strategies. These programmes should consider international best
practices, including the combination of matchmaking services with training, merit-based selection
criteria, transparent diagnosis and auditing processes.
Encouraging greater participation of SMEs in the PA-wide market through public procurement of
governmental institutions serving national markets and state-owned enterprises (SOEs) serving
national and international markets. Possible approaches include targets or ¨set asides¨ of public
expenditure that are to be delivered by SMEs, dividing contracts into smaller pieces that SMEs can
more easily deliver, and reducing the complexity and cost of application forms.
The preparation of a ¨how-to¨ guide for SME engagement in the PA market, either through direct
exporting activity or through the provision of quality goods and services for MNEs engaged in
GVCs.
5. Trade and trade-related policies
PA countries have already made substantial joint efforts to foster trade integration and facilitation, there
remain areas for improvement that could further foster intra-PA trade and the integration of the PA into
regional and global supply chains.
Tariffs
While tariff negotiations among PA member countries have concluded with the signature of the Additional
Protocol to the Framework Agreement for the PA, most favoured nation (MFN) tariffs in the region remain
higher than in other parts of the world. Mexico’s MFN tariff on intermediate products fell from 12% to 8%
in the period from 1995 to 2009. For Peru, the change was more pronounced, with tariffs on intermediates
falling from 16% to 5% while Costa Rica saw a reduction from 9% to 3%. While such falls are a step in the
right direction, tariffs on intermediates remain comparatively high (both the EU and US tariffs on
intermediates are around 3.5%). These protection measures increase the costs of production and can have
adverse effects on a country’s ability to compete in export markets: tariffs and other barriers on imports are
effectively taxes on exports.
Trade agreements
An important strength of the PA is its openness to investment and trade. PA member countries have
commercial agreements with most of the developed countries of the world.29
Colombia, for example, has
13 commercial agreements that grant preferential access to nearly 1.5 billion consumers in over 45
countries; Mexico’s free trade network gives preferential access to 45 countries that produce two-thirds of
world GDP (Pacific Alliance, n.d.). As discussed above, PA countries are already engaged in joint efforts
to profit from one another’s free trade networks, thus expanding these already substantial networks.
A vast array of trade agreements could turn out problematic due to the use different rules of origin. The PA
has made substantial progress in this respect, both through the signing of the Additional Protocol to the
Framework Agreement for the PA, and agreement on a mechanism for accumulation of origin and
common rules of origin, which should significantly assist the process of economic and commercial
integration within the Pacific Alliance. The protocol should be noted for its plans to remove all trade
barriers within the PA, removing 92% of these upon signature, and the remaining 8% in the short and

28
medium term (3-17 years). Furthermore, it covers key issues related to trade facilitation, customs co-
operation, sanitary control, conflict resolution, and trade in border zones, with the aim of further
stimulating intra-bloc trade. As noted above, however, MFN tariffs remain comparatively high.
The PA countries’ respective promotion agencies have already identified specific opportunities in which
products from one member country could undergo a productive transformation in another member country
in order to comply with rules of origin and/or other conditions required by outside nations, thus allowing
the final product to fall under this third countries’ preferential tariffs. For example, ProColombia has made
note of 25 specific opportunities for exports with the final destinations of Japan, China, New Zealand, and
Australia, across the agribusiness, cosmetics, containers, auto parts and mechanics, mobile phones,
artificial dyes, and apparel industries. Such integration efforts allow firms to take advantage of differing
factor prices across economies, and thus choose the location for various aspects of the production process
based upon comparative advantage (IDB, 2014c). Furthermore, while this certainly has the potential to
increase SME internationalisation through increased activity across PA member countries, it also has the
potential to serve as a platform for greater ties with other regions, due to facilitating the production of more
competitive and cost-effective goods (IDB, 2014c). Along similar lines, but at the country level, Colombia
has set up a Trade Agreement Leveraging Centre (Centro de Aprovechamiento de Acuerdos Comerciales)
in order to take advantage of the opportunities provided by trade agreements, which is tasked with the
creation of strategies to leverage benefits from trade agreements currently enjoyed by the country.
Trade facilitation
Trade facilitation could be a powerful instrument for PA countries to further enjoy gains from trade. Trade
facilitation helps countries participate in GVCs by cutting costs, avoiding unnecessary delays and reducing
uncertainty at the border. As goods cross borders many times, first as inputs and then as final products, fast
and efficient customs and port procedures are essential to the smooth operation of supply chains.
The PA has several trade facilitation initiatives in place. Annex C, Figure 13 highlights some of the
strengths and weaknesses of PA countries with respect to best practices in trade facilitation, and identifies
areas for action with the greatest potential gains. Overall, the main areas where PA countries could
improve include formalities related to documents and procedures, appeal procedures, information
availability, fees and charges, and internal and external border agency cooperation.
Services, transport and communications logistics and infrastructure
GVCs are particularly sensitive to the quality and efficiency of services. Services make up close to 30% of
the value added of exports from Chile and Mexico, highlighting the importance of reducing barriers in this
sector as well as the potential gains. If established firms or potential new entrants cannot find local services
supporting their activities, they will have to rely on cross-border provision when feasible or establish
elsewhere. Better logistics performance is also particularly essential for SMEs, as logistics tends to cost
more for small producers than for large producers. As GVC goods normally cross many borders in the
production process, trade in parts and components is almost 50% more sensitive to improvements in
logistics performance than trade in final goods (OECD/CAF/ECLAC, 2013).
Logistics is also an especially critical policy area for countries in the LAC region and PA, especially in the
context of boosting the relatively low levels of existing intra-regional trade. Despite geographical
proximity, logistical deficiencies mean that freight costs are almost as high for intra-regional exports
within Latin America as they are for extra-regional exports, and sometimes they are higher
(OECD/CAF/ECLAC, 2013). A 10% reduction in freight costs and tariffs would increase LAC bilateral
imports by 45% and would increase regional imports by 60%. For maritime transport between Latin
American countries, doubling the port efficiency of two ports would have the same impact on transport
29
costs as halving the distance between them. Indeed, there is greater scope for action in reducing logistics
costs at the domestic level than at the international level (OECD/CAF/ECLAC, 2013).The largest logistics
gap in the LAC region tends to be in the transport sector, especially roads, where standards remain below
those typical of middle-income countries. For instance, Colombia has some of the world’s highest
domestic costs per container for international transport and handling (OECD/CAF/ECLAC, 2013).
Improved transport infrastructure and a suitable framework for transport investment are thus essential.
All PA countries have begun designing and/or implementing national logistics plans. More specifically,
both Colombia and Mexico have made improving multimodal transport a part of their development
agendas, in addition to improving legislation on PPPs. Colombia’s plan aims to draw up a national logistics
policy, developing a national logistics research programme and setting up a national freight-logistics
observatory. In Colombia and Mexico in particular, the lack of incentives for institutions to co-operate with
each other is a major obstacle to linking primary roads to ports, and ports to railways
(OECD/CAF/ECLAC, 2013).
The current systems for PPPs in PA countries could still be improved to reduce the possibility of future
renegotiations of contracts and promote effective investment in infrastructure. Regulatory and institutional
weaknesses in concessions have led to continuous renegotiations of PPP contracts in PA countries, without
necessarily lowering logistics costs.30
Integrating logistics policies into development plans requires major
implementation and follow-up efforts. Policies must be accompanied by capacity building to ensure
government resources are used efficiently and effectively.
Once again, the efforts of the PA to go beyond simply reducing tariffs are an asset when it comes to
reducing logistics costs. An analysis of trade with the United States shows that transport costs are a far
greater impediment than tariffs (OECD/CAF/ECLAC, 2013). Some of this is due to distance, as in Chile,
yet it is also largely due to inefficient logistics. On average, the freight costs of trade between the United
States and all its partners are less than double the tariff costs. However, for trade between the United States
and the LAC, the ratio rises to almost 9:1 (see Annex C, Figure 14).
To further advance their joint trade agenda, PA countries could consider:
Accelerating tariff reductions and applying them on a MFN basis, to more fully realise the benefits
of a low tariff regime.
Assessing and evaluating other policies that restrict access to foreign intermediate goods and
services in key value chains that could have a detrimental impact on their position in regional and
global supply chains, as well as policies that aim to artificially increase the domestic content of
exports. The OECD’s forthcoming study on Participation in Global Value Chains in Latin America
– Implications for Trade and Trade-Related Policy will focus on, among other areas, non-tariff
measures in the context of GVCs. The analysis could thus be used as a basis for the PA to evaluate
its policies in this field.
Fully exploiting trade facilitation instruments to facilitate SME access to foreign markets and
developing joint initiatives based on best practices within the PA. For example, according to the
TFIs, Peru’s border agency co-operation (both internal and external) could be improved, but this is
an area where Chile (external), Colombia (internal) and Mexico (internal and external) perform
relatively well. On the other hand, Mexico could improve its involvement of the trade community,
while Peru performs relatively well. Likewise, Chile could assist Colombia in the area of appeals
procedures, while Colombia could assist Chile in the area of formalities related to documents.
Learning from Costa Rica, currently in process of joining the PA, would also be useful, as with the

30
introduction of a “single window”, this country reduced clearance time for dairy products from 10
to 1.5 hours and for agrochemicals from 26.5 to 2.2 hours.
Developing joint initiatives for reducing services trade restrictions and improving transport and
communication logistics and infrastructure. These can greatly reduce the cost of trade and increase
and capacity of SMEs to take part in GVCs. The OECD Service Trade Restrictiveness Index
provides insights into restrictions in key sectors that could be reduced. The OECD could undertake
a workshop with the Trade and Integration and SME working groups of the PA to identify specific
actions.

31
SECTION 3: PROPOSALS FOR FUTURE OECD SUPPORT
As demonstrated in Section 1, although small and medium-sized enterprises are clearly very important in
numerical and employment terms, the productivity gap between SMEs and large firms is a crucial
limitation for a stronger and more inclusive growth in Latin American countries in general and PA
countries in particular.
Building on the suggested elements to consider provided in the previous sub-section, highlighted below are
proposals for OECD work to support the creation and implementation of a joint PA agenda on SME
internationalisation. Three broad policy areas are considered: SME policy, trade, and investment. The
OECD proposes a peer review process for the Pacific Alliance with three pillars, linked to specific
committees (on Investment and Trade) and a Working Party (on SMEs), which have developed tools for
comparative analysis and exchange of best practices that could help PA countries to address the challenges
and implement the agenda suggested above. These interlinked policy areas extend beyond the scope of the
PA SME Working Group, but are critical for a joint strategy aimed at increasing the internationalisation
and integration of SMEs in global value chains.
The OECD tools for analysis are the OECD SME Policy Index for the SME policy pillar; the OECD Trade
in Value Added (TiVA) Database, OECD Trade Facilitation Indicators and OECD Services Trade
Restrictiveness Index for the trade pillar; and the OECD’s Policy Framework for Investment for the
investment pillar (see descriptions in Annex E).
Although a number of policy assessments have been done for individual countries in these areas (i.e. an
SME Policy and Entrepreneurship Review of Mexico31
, a GVC Diagnostic of Engagement in Global Value
Chains for Chile32
, no internationally comparable exercises have been undertaken for the four PA countries
in these fields. The OECD therefore offers a number of projects within this proposal, with different degrees
of ambition, which could help to benchmark policies in the PA countries, nurture the policy dialogue in the
relevant working groups, and lead to a constructive process of peer learning and exchange that could be
replicated in other policy areas.
For small and medium-sized enterprises
A Pacific Alliance version of the OECD’s Scoreboard on Financing SMEs and Entrepreneurs:
the OECD could launch a specific analysis, based on the information already provided by countries for
the Scoreboard, which currently includes Chile, Colombia and Mexico, and facilitate Peru’s integration
into the database.33
The study would be presented and discussed during a workshop.
A peer-review process in the field of SMEs: this review process would involve conducting a full
OECD SME Policy Index Analysis for the PA countries, a project of approximately 12-18 months,
something which has already been carried out for other regional groups.34
The analysis would allow
PA countries to benchmark their policy practices against each other, as well as other countries and
regions, providing a clear basis for policymakers to further improve the environment that SMEs
operate in.
For trade
Capacity-building workshops on using the OECD TiVA database: The OECD is already working
to integrate Peru into the OECD TiVA database. Once the integration is completed, the PA would have
at its disposal a valuable set of information about the bilateral exchanges of goods and services in
value added terms. The OECD could conduct workshops with the Working Group on Trade and

32
Integration to discuss the findings for PA countries and/or specific training on how to utilise this
powerful source of information.
Assistance in the creation of trade one-stop shops: the Trade Facilitation Indicators have been
recently updated, including for the PA countries. The OECD could conduct workshops and accompany
the efforts of the PA in creating trade one-stop-shops and other trade facilitation initiatives.
A peer-review process using the OECD Services Trade Restrictiveness Index, which already
includes information for Mexico, Chile and Colombia. In the framework of the Country Programme
with Peru, a workshop is proposed to support the country to identify restrictions in a number of service
industries. A peer-review study could provide insights into restrictions in key sectors that could be
reduced, assisting in the development of efficient and effective joint initiatives for reducing services
trade restrictions and improving transport and communication logistics and infrastructure, which
greatly impact the cost and capacity of SMEs to take part in GVCs. The presentation of the study
would take place within the context of a capacity-building workshop.
Presentation of relevant studies for the Pacific Alliance: the OECD is carrying out a diagnostic of
GVCs for Chile and preparing an OECD study of participation in global value chains in Latin
America. These two inputs would be useful for the PA’s discussions about how to better integrate
among themselves and into GVCs. The OECD could present these reports at the next meeting of the
PA Working Groups and conduct a workshop to discuss the main findings.
For investment
In-depth analysis of Investment Policies in the Pacific Alliance: Chile (1997), Peru (2008) and
Colombia (2012)35
have already undertaken OECD Investment Policy Reviews. More in-depth
analysis could be undertaken in order to assess implementation of the Investment Policy Reviews,
benchmark with other countries and regions, and advance a joint agenda. The study would propose a
way forward for the bloc in terms of making the best use of the updated PFI.

33
ANNEX A: KEY FIGURES AND TABLES
Table 1. Numbers of SMEs in Pacific Alliance countries (percentage of all businesses), 2011
Chile Colombia Mexico Peru
Micro 90.4 93.2 95.4 98.1
SMEs 9 6.5 4.4 1.8
Small 7.8 5.5 3.6 1.5
Medium 1.2 1 0.8 0.3
Large 0.6 0.3 0.2 0.1 Source: OECD/ECLAC (2012), Latin American Economic Outlook 2013, SME Policies for Structural Change, OECD Publishing, Paris, http://dx.doi.org/10.1787/leo-2013-en.
Table 2. Relative labour productivity of firms in Chile, Mexico and Peruxxxvi
(as percentages; productivity of large firms = 100%)
Chile Mexico Peru
Micro 3 16 6
Small 26 35 16
Medium 46 60 50
Large 100 100 100 Source: OECD/ECLAC (2012), Latin American Economic Outlook 2013, SME Policies for Structural Change, OECD Publishing, Paris, http://dx.doi.org/10.1787/leo-2013-en.
Table 3. Percentage wage gaps between SMEs and large firms, 2006xxxvii
Chile Mexico
Micro - 21
Small 52 56
Medium 69 55
Large 100 100 Source: OECD/ECLAC (2012), Latin American Economic Outlook 2013, SME Policies for Structural Change, OECD Publishing, Paris, http://dx.doi.org/10.1787/leo-2013-en.
Table 4. Direct or indirect exporters by size and region (percentage), 2009-10xxxviii
Latin America Eastern Europe East Asia
Small 9.12 18.78 13.19
Medium 12.86 26.45 25.51
Large 20.05 32.21 50.18 Source: OECD/ECLAC (2012), Latin American Economic Outlook 2013, SME Policies for Structural Change, OECD Publishing, Paris, http://dx.doi.org/10.1787/leo-2013-en.
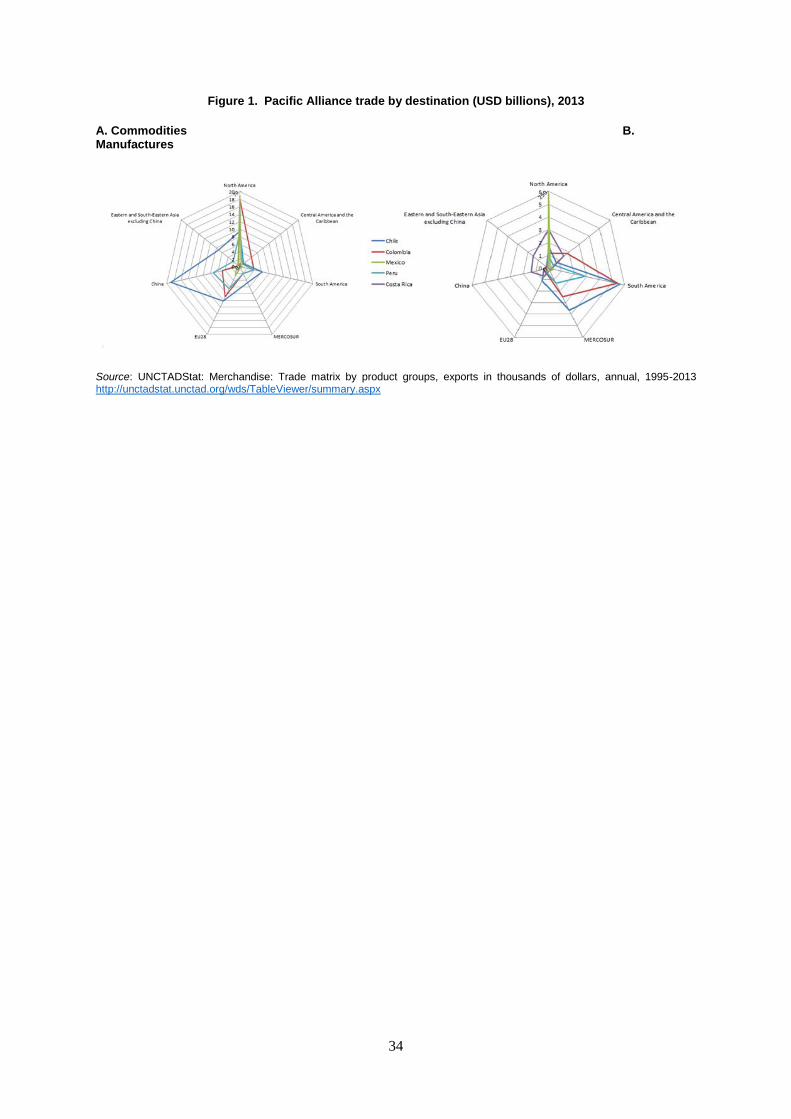
34
Figure 1. Pacific Alliance trade by destination (USD billions), 2013
A. Commodities B. Manufactures
Source: UNCTADStat: Merchandise: Trade matrix by product groups, exports in thousands of dollars, annual, 1995-2013 http://unctadstat.unctad.org/wds/TableViewer/summary.aspx
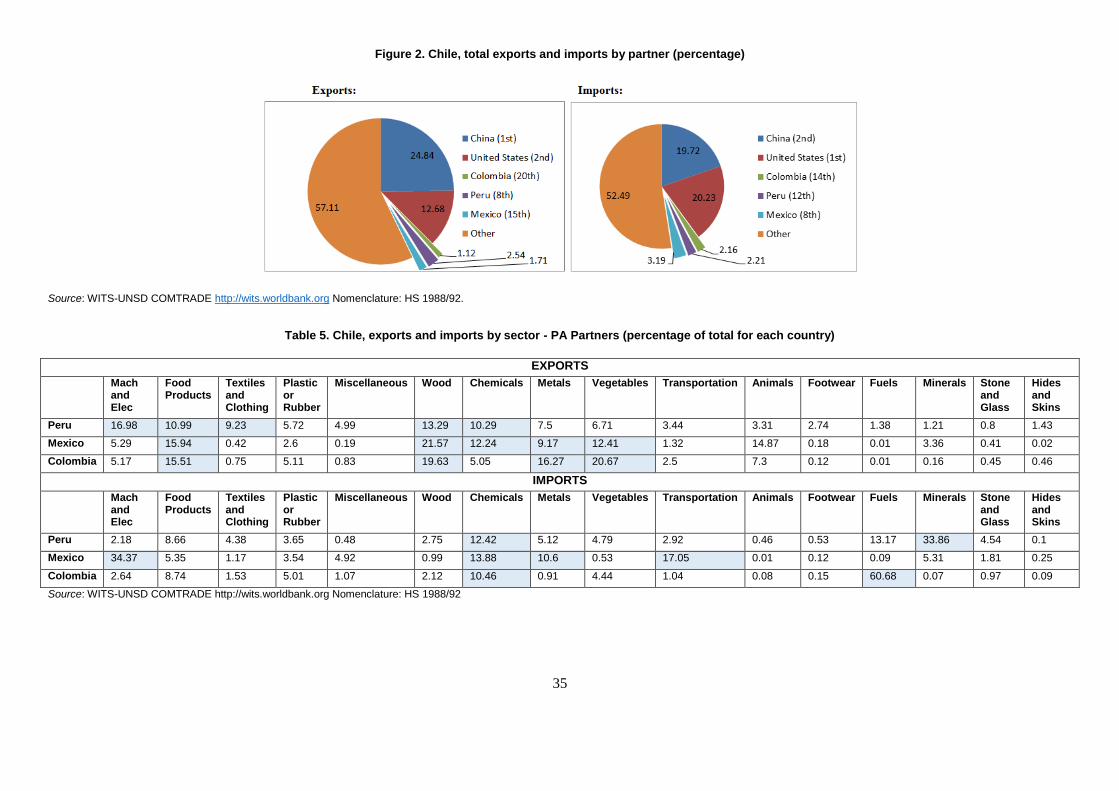
35
Figure 2. Chile, total exports and imports by partner (percentage)
Source: WITS-UNSD COMTRADE http://wits.worldbank.org Nomenclature: HS 1988/92.
Table 5. Chile, exports and imports by sector - PA Partners (percentage of total for each country)
EXPORTS
Mach and Elec
Food Products
Textiles and Clothing
Plastic or Rubber
Miscellaneous Wood Chemicals Metals Vegetables Transportation Animals Footwear Fuels Minerals Stone and Glass
Hides and Skins
Peru 16.98 10.99 9.23 5.72 4.99 13.29 10.29 7.5 6.71 3.44 3.31 2.74 1.38 1.21 0.8 1.43
Mexico 5.29 15.94 0.42 2.6 0.19 21.57 12.24 9.17 12.41 1.32 14.87 0.18 0.01 3.36 0.41 0.02
Colombia 5.17 15.51 0.75 5.11 0.83 19.63 5.05 16.27 20.67 2.5 7.3 0.12 0.01 0.16 0.45 0.46
IMPORTS
Mach and Elec
Food Products
Textiles and Clothing
Plastic or Rubber
Miscellaneous Wood Chemicals Metals Vegetables Transportation Animals Footwear Fuels Minerals Stone and Glass
Hides and Skins
Peru 2.18 8.66 4.38 3.65 0.48 2.75 12.42 5.12 4.79 2.92 0.46 0.53 13.17 33.86 4.54 0.1
Mexico 34.37 5.35 1.17 3.54 4.92 0.99 13.88 10.6 0.53 17.05 0.01 0.12 0.09 5.31 1.81 0.25
Colombia 2.64 8.74 1.53 5.01 1.07 2.12 10.46 0.91 4.44 1.04 0.08 0.15 60.68 0.07 0.97 0.09
Source: WITS-UNSD COMTRADE http://wits.worldbank.org Nomenclature: HS 1988/92

36
Figure 3. Colombia, total exports and imports by partner (%)
Source: WITS-UNSD COMTRADE http://wits.worldbank.org Nomenclature: HS 1988/92
Table 6. Colombia, exports and imports by sector - PA partners (percentage of total for each country)
EXPORTS
Mach and Elec
Food Products
Textiles and Clothing
Plastic or Rubber
Miscellaneous Wood Chemicals Metals Vegetables Transportation Animals Footwear Fuels Minerals Stone and Glass
Hides and Skins
Peru 8.88 11.76 5.7 13.69 2.52 8.9 23.66 2.93 0.5 3.07 0.1 0.22 15.13 0.48 2.19 0.27
Mexico 3.82 2.82 12.06 9.29 1.92 3.87 15.22 3.21 4.14 29.6 0.19 0.27 9.17 0.46 2.5 1.47
Chile 2.85 6.11 1.37 5.71 0.84 2.15 5.02 0.7 1.82 2.09 0.01 0.14 70.06 0.01 1.09 0.04
IMPORTS
Mach and Elec
Food Products
Textiles and Clothing
Plastic or Rubber
Miscellaneous Wood Chemicals Metals Vegetables Transportation Animals Footwear Fuels Minerals Stone and Glass
Hides and Skins
Peru 2.06 10.57 10.72 17.25 1.07 5.39 6.91 22.38 12.14 1.99 1 0.57 2.98 0.9 3.98 0.11
Mexico 27.28 1.91 2.15 6.02 1.84 0.75 10.87 14.61 0.17 21.09 0.03 0.24 11.09 0.28 1.64 0.01
Chile 4.29 15.91 1.21 5.07 0.64 19.98 5.39 15.45 22.61 0.21 7.85 0.06 0.01 0.35 0.46 0.5

37
Figure 4. Mexico, total exports and imports by partner (percentage )
Source: WITS-UNSD COMTRADE http://wits.worldbank.org Nomenclature: HS 1988/92
Table 7. Mexico, exports and imports by sector - PA partners (percentage of total for each country)
EXPORTS
Mach and Elec
Food Products
Textiles and Clothing
Plastic or Rubber
Miscellaneous Wood Chemicals Metals Vegetables Transportation Animals Footwear Fuels Minerals Stone and Glass
Hides and Skins
Peru 29.37 3.26 1.5 4.76 1.15 1.48 15.08 4.79 1.23 20.31 0.01 0.05 0.12 15.8 1.04 0.06
Colombia 26.66 1.94 2.11 6.99 1.1 0.8 11.27 15.26 0.28 21.42 0.04 0.18 9.98 0.23 1.71 0.03
Chile 35.55 5.42 1.12 4.76 1.29 1.03 17.24 7.58 0.6 20.65 0.06 0.13 0.12 2.43 1.98 0.04
IMPORTS
Mach and Elec
Food Products
Textiles and Clothing
Plastic or Rubber
Miscellaneous Wood Chemicals Metals Vegetables Transportation Animals Footwear Fuels Minerals Stone and Glass
Hides and Skins
Peru 3.35 0.8 7.62 6.6 0.96 6.71 3.19 4.67 6.86 0.09 2.01 0.3 46.86 7.74 1.63 0.61
Colombia 3.37 2.61 13.22 12.88 2.53 4.16 15.89 3.37 4.51 20.89 0.15 0.32 11.37 0.68 2.69 1.35
Chile 5.16 14.93 0.37 2.99 0.71 21.99 14.06 8.04 13.54 0.48 14.35 0.03 0.01 2.92 0.4 0.02
Source: WITS-UNSD COMTRADE http://wits.worldbank.org Nomenclature: HS 1988/92

38
Figure 5. Peru, total exports and imports by partner (percentage)
Source: WITS-UNSD COMTRADE http://wits.worldbank.org Nomenclature: HS 1988/92
Table 8. Peru, exports and imports by sector - PA partners (percentage of total for each country)
EXPORTS Mach
and Elec
Food Products
Textiles and Clothing
Plastic or Rubber
Miscellaneous Wood Chemicals Metals Vegetables Transportation Animals Footwear Fuels Minerals Stone and Glass
Hides and Skins
Mexico 6.5 1.6 8.56 4.88 0.85 6.16 4.09 2.74 5.46 0.55 1.35 0.57 47.1 7.1 1.79 0.7
Colombia 2.96 9.69 11.21 16.8 1.37 5.2 7.2 21.05 10.1 1.14 0.85 0.58 7.03 0.58 3.98 0.24
Chile 2.42 9.23 5.27 3.96 0.49 2.81 10.89 5.59 4.59 2.19 0.49 0.41 13.28 33.74 4.52 0.1
IMPORTS Mach
and Elec
Food Products
Textiles and Clothing
Plastic or Rubber
Miscellaneous Wood Chemicals Metals Vegetables Transportation Animals Footwear Fuels Minerals Stone and Glass
Hides and Skins
Mexico 39.04 3.29 1.58 4.82 1.73 1.67 14.78 4.65 0.97 23.15 - 0.07 0.1 2.86 1.26 0.03
Colombia 7.93 11.03 6.14 12.67 2.03 8.28 22.33 2.3 0.45 2.43 0.11 0.2 20.82 0.67 2.42 0.18
Chile 10.4 13.22 1.01 6.94 1.43 20.72 17.11 8.88 10.07 1.56 5.25 0.04 2.04 0.21 1.02 0.1
Source: WITS-UNSD COMTRADE http://wits.worldbank.org Nomenclature: HS 1988/92
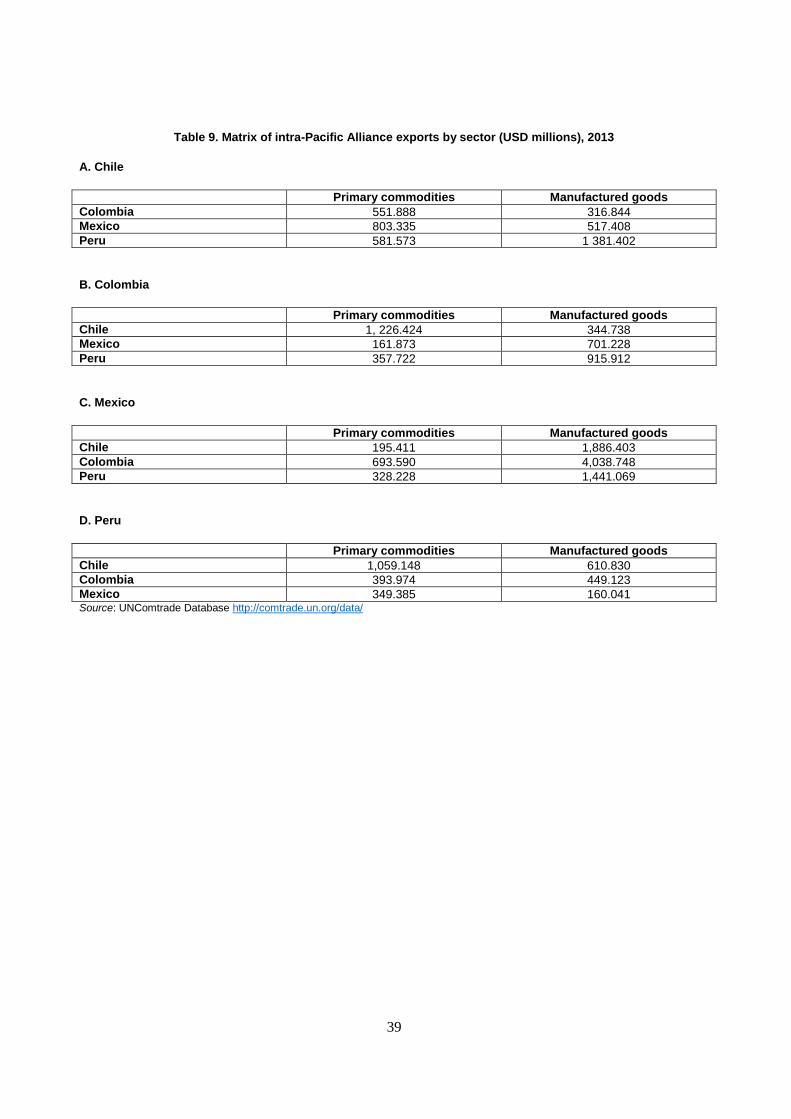
39
Table 9. Matrix of intra-Pacific Alliance exports by sector (USD millions), 2013
A. Chile
Primary commodities Manufactured goods
Colombia 551.888 316.844
Mexico 803.335 517.408
Peru 581.573 1 381.402
B. Colombia
Primary commodities Manufactured goods
Chile 1, 226.424 344.738
Mexico 161.873 701.228
Peru 357.722 915.912
C. Mexico
Primary commodities Manufactured goods
Chile 195.411 1,886.403
Colombia 693.590 4,038.748
Peru 328.228 1,441.069
D. Peru
Primary commodities Manufactured goods
Chile 1,059.148 610.830
Colombia 393.974 449.123
Mexico 349.385 160.041 Source: UNComtrade Database http://comtrade.un.org/data/

40
Figure 6. Forward and backward GVC linkages, 2009
1. The OECD Global Value Chains indicators do not yet have information available for Colombia and Peru. Thus, these estimations are based on the EORA database. While EORA offers data for a wider range of developing countries, the quality of the underlying input-output and trade data is inferior to that of TiVA, where great care is taken to harmonise the trade and input-output data. Notwithstanding, the EORA database performs adequately, particularly at capturing backward participation. Colombia was added to the OECD TiVA database in its June 2015 update, paving the way for future analysis.
Sources: OECD TiVA Database (http://www.oecd.org/sti/ind/measuringtradeinvalue-addedanoecd-wtojointinitiative.htm); EORA database for Latin American Countries, including Peru and Colombia (http://worldmrio.com/).

41
Table 10. Foreign direct investment in the PA (percentage of GDP), 2013
Sector Chile Colombia Mexico Peru
Agriculture and food industry 0.01 0.08 0.01 0
Mining related activities 0.8 0.78 0.33 2.25
Energy extraction and production
1.75 1.44 0 0.62
Total greenfield FDI 2.56 2.3 0.34 2.87
Others 3.93 1.94 3 1.72
TOTAL 6.49 4.24 3.34 4.59 Source: IDB (2015), The Labyrinth: How Can Latin America and the Caribbean Navigate the Global Economy?, Inter-American Development Bank.
Figure 7. Existing representative trade links between Pacific Alliance countries
Sectors representing 10% or more of intra-country trade flows
1. Sectors in bold text indicate that this sector makes up not only more than 10% of exports from one country to the other, but also more than 10% of the recipient country’s imports from that country.
Source: Author's calculations with information from WITS-UNSD COMTRADE, see Annex A, Tables 5-8 for details.
Table 11. New business density for PA countries, LAC region and OECD countries, 2012
number of newly registered private, formal sector companies per 1 000 working-age people (ages 15-64)
Chile (2012)
Colombia (2012)
Mexico (2012)
Peru (2012)
LAC Region
OECD Countries
New business density
5.7 2.0 0.9 3.8 2.6 4.9
Note: Refers only to incorporated enterprises; LAC region is defined as World Bank’s “Latin America and the Caribbean (all income levels)” dataset. Source: Author's calculations based on World Bank regional (http://data.worldbank.org/indicator/IC.BUS.NDNS.ZS/countries/1W-ZJ-OE?display=graph) and country specific (http://data.worldbank.org/indicator/IC.BUS.NDNS.ZS) data.

42
Figure 8. Typical industrial organisation in developed and developing countries
Source: OECD/ECLAC (2012), Latin American Economic Outlook 2013, SME Policies for Structural Change, OECD Publishing, Paris, http://dx.doi.org/10.1787/leo-2013-en
Figure 9. Time-sensitive, logistics-intensive exports, 2010
(% of total exports)
1. Logistics-intensive sectors include mining, forestry and logging, wood manufacturing, paper publishing and printing. Time-sensitive sectors include agriculture, fisheries, food and drink manufacturing, clothing and horticulture. Latin America and the Caribbean (LAC) consists of 18 countries.
Source: Data taken from UN COMTRADE, based on Figure 4.4 in OECD/CAF/ECLAC (2013), Latin American Economic Outlook 2014: Logistics and Competitiveness for Development, OECD Publishing, Paris, http://dx.doi.org/10.1787/leo-2014-en.

43
Table 12. Performance of Pacific Alliance countries in relation to other regions: World Bank Logistics Performance Index (LPI), 2014
LPI Customs Infrastructure Logistics competence
International shipments
Tracking and tracing
Timeliness
Chile (42nd
in
global rankings, 1
st in LAC)
3.26 3.17 3.17 3.19 3.12 3.3 3.59
Mexico (50th
in
global rankings, 3
rd in LAC)
3.13 2.69 3.04 3.12 3.19 3.14 3.57
Peru (71st in
global rankings, 10
th in LAC)
2.84 2.47 2.72 2.78 2.94 2.81 3.3
Colombia (97th in
global rankings, 17
th in LAC)
2.64 2.59 2.44 2.64 2.72 2.55 2.87
PA average 2.97 2.73 2.84 2.93 2.99 2.95 3.33
LAC average 2.74 2.57 2.52 2.7 2.79 2.76 3.08
East Asia & Pacific average
2.85 2.69 2.74 2.87 2.79 2.84 3.17
High income: OECD average
3.7 3.61 3.73 3.71 3.46 3.67 4.05
Gap between OECD and PA
0.73 0.88 0.89 0.78 0.47 0.72 0.72
Note: the Logistics Performance Index (LPI) has a scale of 1 to 5, where 5 represents the best logistics performance. Latin America and the Caribbean (LAC) consists of 19 countries.
Source: World Bank Logistics Performance Index Database, Global Rankings 2014 http://lpi.worldbank.org/international/global
Table 13. Logistics performance gap to the best-performing OECD country, 2014
LPI Customs Infrastructure Logistics competence
International shipments
Tracking and tracing
Timeliness
Chile 0.86 0.95 0.95 0.93 1 0.82 0.53
Mexico 0.99 1.43 1.08 1 0.93 0.98 0.55
Peru 1.28 1.65 1.4 1.34 1.18 1.31 0.82
Colombia 1.48 1.53 1.68 1.48 1.4 1.57 1.25
Note: The gap refers to the difference for each logistics component with the best-performing OECD country overall, which was Germany in 2014 (Index Score of 4.12).
Source: World Bank Logistics Performance Index Database, based on Figure 4.2 in OECD/CAF/ECLAC (2013), Latin American Economic Outlook 2014: Logistics and Competitiveness for Development, OECD Publishing, Paris, http://dx.doi.org/10.1787/leo-2014-en.

44
Figure 10. Infrastructure and institutional quality in Pacific Alliance countries with respect to the global average
Note: Global average is indicated by score of zero. Possible scores range from -2.5 (worst possible performance) to 2.5 (best possible performance) Source: World Competitiveness Indicators 2010 and World Bank Logistics Performance Index 2014

45
ANNEX B: METHODOLOGICAL ISSUES
Box 1. Measuring participation in global value chains (GVCs)
Figure 2 provides a schematic illustration of backward and forward GVC linkages. The reference country (i), which sources foreign value added from abroad (k) to be processed for exports to its trading partners (j), is in the core of the GVC node— in value terms, it buys foreign inputs (A), combines them with domestic value added and sells the resulting output to foreign customers via exports (B). In the case of forward participation, on the other hand, the reference country (i) is the source of value added that its foreign partner (l) uses for exports (in value terms this link is represented by C) to a third country (x)—it sells its inputs. The implication is that the backward participation index (A/B) may reflect the reference country’s characteristics more closely than forward (C/B), a claim which evidence from the TiVA database supports.
While both the backward participation index (foreign intermediate value added used in the export activity of a given country) and the forward GVC participation index (domestic value added embodied in exports used by firms in partner countries as inputs into their own exports) are expressed as shares of the reference country’s exports, in fact they measure very different forms of engagement. For example, a country that is predominantly assembling products into final goods and subsequently exporting these will have a strong backward participation index, but a small forward participation measure. Conversely, a country which predominantly supplies intermediates to an assembler will have a highly developed forward participation indicator, but a small backward participation measure.
Figure 11. Backward and forward participation: supply and demand of intermediate inputs
1. The green arrows denote the foreign value added embodied in imported intermediates used for exports of country (i)—the backward linkage. The red arrows denote the value added of the reference country (i) embodied in its exports of intermediates which are used for exports of country (l)—the forward linkage.
Source: Kowalski, P. et al. (2015b), “Participation of developing countries in global value chains: Implications for trade and trade-related policies”, OECD Trade Policy Papers, No. 179, OECD Publishing, Paris

46
Box 2. Revealed comparative advantages in the Pacific Alliance
The revealed comparative advantage (RCA) was first introduced by Bela Balassa (Balassa, 1965) to measure international specialisation and can be defined as:
The numerator represents the percentage share of a given sector in national exports – Xij are exports of sector i from country j. The denominator represents the percentage share of a given sector in world exports. A country has comparative advantage if RCA>1. If RCA is<1, the country is said to have a comparative disadvantage.
Table 14 Revealed comparative advantage (RCA), 2013
Chile Colombia Mexico Peru
0. Food and live animals 5.64 2.63 1.65 4.8
1. Beverage and tobacco 6.6 0.4 2.54 0.24
2. Crude materials, inedible, except fuels
16.05 1.63 0.97 14.41
3. Minerals fuels, lubricants and related materials
0.11 8.51 1.63 1.66
4. Animals and vegetable oils, fats and waxes
1.17 1.66 0.19 3.57
5. Chemicals and related products
0.83 1.13 0.73 0.51
6. Manufactured goods classified chiefly by materials
5.4 0.81 1.17 2.11
7. Machinery and transport equipment
0.17 0.18 3.24 0.06
8. Miscellaneous manufactured articles
0.24 0.44 1.54 0.78
9. Gold, non-monetary (excluding gold ores and concentrates)
1.94 4.11 1.67 20.55
*Note: the top two RCA values for each country are highlighted
The analysis of the RCA values for PA countries confirms the trade pattern discussed before. While Chile, Colombia and Peru mainly have strong comparative advantages in primary commodities, Mexico has a more diverse export structure, with an emphasis on manufactured products.
Chile reveals significant comparative advantages in non-ferrous metals, metalliferous ores and metal scrap, and pulp and waste paper, with RCA index values of 31.6, 28.0 and 27.7 respectively. Colombia has robust comparative advantages in coal, coke and briquettes; crude animal and vegetable materials; and coffee, tea, cocoa, spices, and manufactures thereof, with RCA index values of 32.6, 15.7 and 14.3, respectively. Mexico displays comparative advantages in road vehicles (RCA index value of 5.3), and telecommunications and sound-recording and reproducing apparatuses and equipment (5.0). Peru has substantial comparative advantages in animal oils and fats (48.5), metalliferous ores and metal scrap (28.9), and gold (20.5).
Sources: Balassa, B. (1965), “Trade liberalisation and ‘revealed’ comparative advantage”, The Manchester School, Vol. 33/2, pp.99-123”; UNComtrade Database http://comtrade.un.org/data/

47
Box 3. Measuring SMEs’ contribution to employment and GDP in the context of informality
Among LAC countries there are at least two different definitions of SMEs. One is based on the number of employees in the firm, and the other uses sales revenue to determine economic size. The first definition ignores what are usually major differences among sectors (and among branches within each sector). As the OECD Latin American Economic Outlook 2013 argues, this often results in an overestimation of SMEs’ contribution to the economy (OECD/ECLAC, 2012). However, as this is the criterion used in national statistics departments, this paper uses an employee-based classification, which is applicable for all PA countries. This defines microenterprises as those with 0-10 employees; small, 11-50; medium-sized, 51-250 and large, 251+ employees.
In OECD countries, SMEs provide over two-thirds of formal employment and over half of national output. The World Bank estimates that in middle-income countries, such as the PA countries, the contribution of the SME sector to GDP is close to 39%. It also estimates that formal SMEs contribute to more than half of total employment in middle-income countries. To narrow the category microenterprises are sometimes excluded, defining SMEs as having a minimum number of employees (5 or 10).
The distinction between microenterprises and SMEs is particularly important in emerging markets, where informality is an important phenomenon. While informality is by no means synonymous with microenterprises, the two are closely interlinked. Informality is one of the top five constraints on small firms in developing countries in doing business. It is also a binding constraint on integrating into GVCs (OECD/World Bank, 2015).
Figure 12. GDP and employment: SME and informal sector contributions
1. “Residual” includes sources such as large enterprises and the public sector.
Source : Ayyagari, Beck, and Demirguc-Kunt (2003)

48
ANNEX C: INSTITUTIONS, POLICIES, AND PROGRAMMES SUPPORTING SME
DEVELOPMENT IN PACIFIC ALLIANCE COUNTRIES
SME development institutions
PA countries have both autonomous SME development institutions and those that fall under the
responsibility of various ministries. Both types are mandated to implement SME supporting programmes;
policy elaboration remains under the remit of the line ministries. Colombia, Mexico and Peru have SME
development institutions under the responsibility of a ministry (see Table 15), while the Production
Development Corporation (CORFO) of Chile stands out as the sole autonomous institution. Having
development institutions that can work more closely with relevant government ministries (production,
industry or finance) can make it easier to match policies aimed at SMEs with the national economic
development agenda. However, having institutions with a certain degree of independence can generate a
greater capacity to design and implement policies (OECD/ECLAC, 2012).
Table 15. SME development institutions in Pacific Alliance countries
Country Policy implementation institution/s Overseeing ministry
Chile Production Development Corporation (CORFO) Independent
Colombia Micro, Small and Medium Enterprises (MSME)
Department
Ministry of Commerce, Industry and Tourism
Mexico National Institute of the Entrepreneur (INADEM)
Under-secretariat for SMEs
Nacional Financiera (NAFIN)
Secretariat of Economy
Peru SME and Industry Bureau
Foreign Trade Development Bureau
Ministry of Production
Ministry of Foreign Trade and Tourism
Source: based on official information from countries
The export and investment promotion organisations of PA countries also support SME internationalisation
in a variety of ways. On a number of occasions, these agencies have joined efforts with the specific goal of
“present[ing] the Pacific Alliance and Latin America to the world” (ProMexico, 2014), including
conducting joint seminars on attracting business and strategies for international promotion. They have also
organised an annual “Pacific Alliance Business Matchmaking Forum”, offering PA entrepreneurs
opportunities to interact and generate business and partnerships; and an annual Innovation Promotion and
Entrepreneurship Forum. Overall, they organised 87 jointly co-ordinated activities for promoting trade,
investment and tourism in the period 2013-14.
Table 16. Export and investment promotion organisations in Pacific Alliance countries
Country Institution Overseeing ministry
Chile ProChile Ministry of Foreign Affairs
Colombia ProColombia Ministry of Commerce, Industry and Tourism – MINCIT
Mexico ProMéxico Secretariat of Economy
Peru PromPerú Ministry of Tourism and Foreign Trade
Source: based on official information from countries
PA countries also stand out as top regional performers regarding the presence of export promotion
organisations (EPOs) abroad, with ProChile, ProMéxico, and ProExport (ProColombia) taking the region’s
top three places in terms of number of EPO offices abroad, although there is definite room for

49
improvement in comparison to other countries outside of the region. Only Peru has no listed EPOs abroad,
most likely relying, like other Latin American and the Caribbean (LAC) countries, on embassies and
consulates to support exporting companies (IDB, 2014b).
Budget allocation
Budgetary constraints pose a key constraint to proper SME development and support in the LAC
region.
All LAC countries allocate less than 0.1% of GDP to developing SMEs, and in many countries it is less
than 0.01% (OECD/ECLAC, 2012). These low numbers also hold true for PA economies, with only
Mexico and Chile’s expenditures rising above 0.01% of GDP (see Table 17).
Table 17. Expenditure by institutions to develop SMEs (percentage of GDP), 2005
Expenditure
Chile 0.03
Colombia 0.008
Mexico 0.015
Peru 0.004
Source: OECD/ECLAC (2012), Latin American Economic Outlook 2013, SME Policies for Structural Change, OECD Publishing, Paris, http://dx.doi.org/10.1787/leo-2013-en.
The Pacific Alliance countries are among those allocating the most resources in the region to export
promotion, demonstrating the importance they place on it. Most LAC countries allocate lower levels of
resources to EPOs than would be expected for their level of development, but the exceptions – Costa Rica
(ProComer), ProChile, PromPerú, and ProColombia – are mostly Pacific Alliance countries (IDB, 2014b).
On average, annual budgets for EPOs in developed countries regularly exceed USD 100 million, and can
exceed USD 300 million, but among LAC countries only Brazil and Mexico’s EPOs have budgets that
exceed that figure, with Colombia, Chile and Peru taking the next three places (IDB, 2014b). Within the
LAC region, only ProChile, ProMéxico, and PromPerú have more than 300 employees (IDB, 2014b).
Furthermore, expenditure on SMEs in PA countries is increasing; for example, Colombia’s budget for
SME promotion and support has increased 66.89%, from approximately USD 32.25 billion in 2014 to USD
53.8 billion in 2015.
Policies and Programmes
Table 18. Examples of cluster programmes in Pacific Alliance countries
Programme name Key points
Chile Programas
Asociativas de
Fomento
- In place since 1992.
- Brings together groups of at least five SMEs in order to improve their access to
markets.
- Had reached over 10 000 SMEs by 2014.
Colombia iNNpulsa, -
Competitive Routes
Programme
- Seeks to develop clusters that increase the competitiveness of local businesses,
and integrate all actors within value chains, including foreign companies
- 67 clusters are currently in place, covering both goods and services
Mexico INADEM – public
call for
“Development and
Strengthening of the
Exportable Offer”
- Category “Business co-operation for exports” refers to projects that either set up
or consolidate exporting consortia of Mexican partners.

50
Peru ProInversión in
collaboration with
the United Nations
Conference on
Trade and
Development
(UNCTAD)
Peru’s Private Investment Promotion agency has implemented a technical co-
operation programme, which includes the following elements: a module on the
promotion of the entrepreneurial relationship (to assist SMEs and individual
entrepreneurs), encouragement of entrepreneurial associations and cluster
development, and expansion of modern business practices through the creation
of a global network.
Source: Official information from countries; IDB (2014b), Rethinking Productive Development: Sound Policies and Institutions for Economic Transformation, Inter-American Development Bank; OECD (2008c), OECD Investment Policy Reviews: Peru 2008, OECD Publishing, Paris, http://dx.doi.org/10.1787/9789264053755-en.
Table 19. Examples of supplier development programmes in Pacific Alliance countries
Programme
name
Key points Key
achievements/goals
Chile CORFO -
Programa de
Desarrollo de
Proveedores
- “Leader" or applicant must submit a
development strategy for a group of its
suppliers;1 if accepted, the leader provides
complementary funds.
- Particularly successful
in assisting Chilean
companies in the process
of adhering to new
standards for their
products upon signature
of a variety of free trade
agreements in the 1990s.
BHP Billiton-
CODELCO
(National Copper
Corporation)-
CORFO
- Offers participating local businesses the chance
to increase their efficiency and competitiveness
through technical-training activities about the
production process, setting targets for improving
the quality of products and services, and
providing consulting services to improve
business management.
- Goal is for 250 suppliers
to meet an international
quality standard by 2020
and improve their
competitiveness and
prospects for
internationalisation.
- During 2008-13, 50
BHP Billiton suppliers
and 20 CODELCO
suppliers joined.
- CORFO joined in 2011.
Mexico INADEM public
call for
“Development of
Suppliers”
- Grants are aimed at supporting one or several
SMEs with the explicit support or interest of
larger enterprises, in areas such as equipment,
infrastructure, consulting and training, design and
innovation, transfer of technology, certifications,
and others.
- Grant amounts can total up to USD 1.3 million,
or 50-60% of the project.
1. Must be composed of a minimum of 10 companies if belonging to the agroforestry sector, or five companies in other productive sectors.
Sources: official information from countries; OECD/ECLAC (2012), Latin American Economic Outlook 2013, SME Policies for Structural Change, OECD Publishing, Paris, http://dx.doi.org/10.1787/leo-2013-en; IDB (2014b), Rethinking Productive Development: Sound Policies and Institutions for Economic Transformation, Inter-American Development Bank.

51
Table 20. Targeted policy tools to promote start-ups in Latin America: Pacific Alliance countries, 2012
Category Tool Chile Colombia Mexico Peru
Fin
an
cin
g Seed capital
Angel investors x
Venture capital x
Bu
sin
ess
se
rvic
es
an
d
en
tre
pre
neu
ria
l
tra
inin
g
Incubators x x
Accelerators x x
Corporate spin-offs
Technology transfer and university spin-offs
x
Business training x x x
Re
gu
lato
ry
fra
me
wo
rk
Ease of creating or closing down businesses
x x x x
Taxation and special legislation x x
(Implemented) x (In development) (Recently created) Blank (needs to be created or reformed)
Source: OECD (2013), Start-up Latin America: Promoting Innovation in the Region, Development Centre Studies, OECD Publishing, Paris, http://dx.doi.org/10.1787/9789264202306-en.
Table 21. Examples of programmes to promote start-ups and innovation in Pacific Alliance countries
Programme name Key points
Chile InnovaCORFO - Provides tax incentives for investment in R&D (up to 35% of resources
allocated to R&D are eligible).
- Co-finances prototype development and/or the improvement of
products/innovative processes.
Colombia iNNpulsa Mipyme
Fund SME Innovation
Support Initiative
iNNpulsa Mipyme
Fund Value Chain
Relationships Support
Programme
- Provides resources totalling up to either COP 400 million (Colombian
pesos) or 65% of the project cost, to firms developing new goods or
services with market potential.
- Provides resources totalling up to either COP 700 million or 65% of the
project cost to support process upgrading, product development and
meeting market requirements in order to increase SMEs’ efficiency and
scale
- Provides up to COP 200 million or 70% of total costs for start-up and
beginning operational costs.
Mexico See section below on
“Skills development”
- Current efforts mainly focused on technology transfer and utilisation of
universities.
Peru “Start-Up Peru”
“Innovate Peru”
- Uses an incubation system to promote the creation and development of
SMEs offering innovative products and services with high technological
content, with an emphasis on connections to international markets.
- Promotes research and development, as well as transferring knowledge
through competitive funds, such as the Fund for Research and
Development for Competitiveness.
Source: official information from countries.

52
Table 22. Examples of direct SME export assistance and SME-MNE linkage programmes in the Pacific Alliance
Programme name Key points Key achievements/ goals Type of assistance
Chile ProChile – Plan C - Provides training related
to exporting and
marketing, and supports
SMEs in the creation of an
online crowdfunding page,
with access to preferred
status within ProChile,
Fundación Chile, País
Digital and Imagen de
Chile’s respective
networks.
- Aims to assist SMEs that are
already successful in Chile; have a
unique, exportable product; and have
an interest in expansion through
exporting, but are hindered by their
size and lack of experience.
- Aims for crowdfunding success
rates of 66% (currently 33%), and
improving the capture of export value
from 33% to 80% of the margin.
Direct assistance to
SME exporters.
Colombia ProColombia –
Mipyme
Internacional
- Provides and funds 90%
of the cost of a foreign
trade advisor to create a
working plan to implement
export activity within a one
year timeframe.
- Aims to support mirco, small and
medium-sized enterprises (MSMEs)
that offer goods for which there is
international demand, but no
corresponding foreign trade
department or unit to offer assistance.
Direct assistance to
SME exporters.
ProColombia –
Product Adaptation
Programme
- Includes support to
develop an adaptation
programme; price review
and adjustment;
assessment and definition
of potential clients; and
support in negotiations,
product delivery, and
promotion during market
entry.
- In 2014, 455 people participated in
this programme, across 18 different
product departments.
Direct assistance to
SME exporters.
ProColombia –
Export Training
Programme (PFE)
- Consists of introductory,
specialized and practical
seminars on the topics of
good, services and
tourism
- Also has a web portal
(ProColombia, n.d.)
focused on identifying the
best market opportunities
for exports across
countries and sectors.
- In all, in-person and online seminars
were attended by 6 200 people in
2014.
Direct assistance to
SME exporters.
ProColombia –
Exporter Mentor
Programme
- Connects companies
with export experience, or
foreign investors, to
MSMEs that are interested
in internationalising their
operations.
- Supermarket chain Grupo Éxito has
used the programme to train its
suppliers to begin exporting,
identifying markets with good
potential through assistance from
ProColombia.
Fostering SME-MNE
linkages.
Mexico INADEM - National
Entrepreneurship
Fund
Public call for
“Development and
Strengthening of the
Exportable Offer”
- Grants of up to USD
6 000, or 50% of the
project, are offered for
consulting, training,
market studies, export
plans, information
systems, product image
design, participation in
export missions, export
consortia and products.
- Aim is to develop MSME’s
exportable offers and integrate
offerings with export consortia and/or
business associations’ models for
export, in order to promote and
improve these products’ competitive
position in the international market.
Direct assistance to
SME exporters
(Project area #1:
direct exporting for
increasing the
exportable offer of
MSMEs).
Fostering SME-MNE
Linkages (Project
area #2: supplier
development of
MSMEs for global
firms and #3:

53
business co-
operation for
exports).
Source: official information from countries
Table 23. Public procurement and SMEs in the Pacific Alliance
Legal provisions Programmes
Chile None reported. ProSME Council (Consejo ProPYMEs) established in 2012 to promote
participation and opportunities for SMEs in public procurement.
Colombia Articles 331, 152
2 and
1533 of Decree 1510.
ProColombia seminars inform entrepreneurs about opportunities for
exports to the public sector of other countries, as well as the relevant
requirements, contracts, payments and registration processes.
Mexico Federal policy
requires setting
increasing goals for
the share of public
procurement that
must come from
Mexican MSMEs.
INADEM National Entrepreneurship Fund:
– core strategy implemented through 31 annual public calls, which
provide subsidies for the undertaking of projects to support
entrepreneurs or MSMEs within the five categories of regional and
sectoral development, entrepreneurial development, entrepreneurs and
financing, programmes for MSMEs, and incorporation of ICT.
Expo for Government Purchases:
- organised each year by the Secretariat of Economics
- ministries and SOEs display their areas of interest in buying goods and
services from MSMEs
- training, consulting, and information sessions also included
Peru Productive
Development and
Business Growth Law
of 2013.4
Compras MYPERU: a platform where the state can buy SME products
and services.
[1] Stipulates that in the event of a tie between the total score of two or more bids, priority should be given to bids submitted
by a national SME, among other criteria.
[2] Stipulates that public calls should be limited to SMEs (with a minimum of one year of experience in the procurement
process) when the value of the project is less than USD 125 000 or 3 requests to do so have been received from national
SMEs in advance to the opening of the call (at least one business day).
[3] Stipulates that state entities can perform limited public calls to national SMEs that are located within the territorial
municipality/department where the contract will be implemented, as long as the SMEs are already registered/ have a formal
certificate of existence.
[4] States that “State institutions must schedule at least 40 percent of their contracts to be met by SMEs in those goods and
services that are able to supply”.
Source: official information from countries

54
Figure 13. Performance of Pacific Alliance countries in the OECD Trade Facilitation Indicators
1. The OECD average includes the indicators’ values for 26 OECD countries.
Source: OECD Trade Facilitation Indicator’s latest available data as of June 2015. http://www.oecd.org/trade/facilitation/indicators.htm

55
Figure 14. Ratio of freight costs to tariffs, 2012
1. Calculations based on imports from the US market. The figures show the ratio of freight cost to tariffs on imports to the region. ASEAN is the Association of Southeast Asian Nations. Latin America and the Caribbean (LAC) consists of 20 countries.
Source: Based on data from the US Census Bureau, based on Figure 4.5 from OECD/CAF/ECLAC (2013), Latin American Economic Outlook 2014: Logistics and Competitiveness for Development, OECD Publishing, Paris, http://dx.doi.org/10.1787/leo-2014-en.

56
ANNEX D: OECD LITERATURE ON CHALLENGES AND OPPORTUNITIES FOR SME
INTERNATIONALISATION
Previous OECD work on SME internationalisation has identified key challenges across a variety of global
contexts. Two surveys conducted by the OECD in 2008, entitled The Member Economy Policymaker
Survey and The Survey of SMEs’ Perceptions of Barriers to Access to International Markets, obtained
detailed insights into the barriers facing international SMEs as perceived by policy makers and SMEs
themselves (OECD, 2008d). The barriers to internationalisation identified in the survey were classified into
four categories:
1. finance – systemic inefficiencies in financial markets
2. business environment – the general business environment within which SMEs operate
3. firms’ capabilities – human resource development and the capability of SMEs to survive and
compete
4. market access –access to information and markets
1. Finance
New OECD research highlights the fact that traditional bank finance poses challenges to SMEs, in
particular to newer, innovative and fast-growing firms with a higher risk profile. Diversified funding
sources for SMEs can better serve the needs of firms at different stages of their life cycle, as well as help to
mitigate systemic risk, strengthen economies’ resilience to critical shocks, and foster new sources of
growth (OECD, 2015a).
Overall, the OECD (2015a) found it is essential to address obstacles limiting SMEs’ use of a broader range
of financial instruments by:
addressing skills gaps in finance
designing regulation that balances financial stability, investor protection and the development of
innovative financing channels for SMEs
creating information infrastructures to improve credit risk assessment
increasing the participation of private actors in SME finance.
Although market-based financing and lending by non-banks can be important sources of finance for SMEs,
full non-bank intermediation is neither desirable nor achievable and bank lending is essential for coping
with information asymmetries and the local character of SMEs (OECD, 2015d). To that end, fostering
high-quality securitisation of SME loans and liabilities can be an effective market-based shortcut to
indirectly promoting SME financing, without the complete disintermediation of banks (Nassr and
Wehinger, 2015a). Partially transferring SME credit risk from originators to investors through
securitisation of SME liabilities can create headroom in banks’ balance sheets, allowing them to further
lend to small heterogeneous and mostly local SMEs.
An active private equity industry can help firms to scale up their operations by investing in companies,
improving their management practices and restructuring them to operate at a larger scale. The lack of a

57
healthy private equity industry could be part of the reason behind low scale-up rates in the region39
(IDB,
2014b). Venture capital can also be a powerful aid to the expansion of start-ups with high growth potential
and productivity. It can have strong complementarities with other policies, such as incubators; indeed,
incubation may be unable to meet its potential without a strong venture capital industry to offer firms
further funding. The average LAC economy has only 10% of the venture capital relative to GDP that China
and India have, despite having double the income per capita, while only Chile and Colombia mention
venture capital within their SME development activities (see below).
Carefully designed public equity markets tailored to SMEs can provide fast-growing young SMEs with
appropriate risk financing (initial public offerings and follow-on offerings) where unpredictable cash flows
and the lack of a track record renders bank lending unsuitable. They also offer venture capital and private
equity funds viable exit strategies (Nassr and Wehinger 2015b). Several forms of market-based debt
financing, such as small cap bonds and private placements, can be attractive to the upper end of the SME
size spectrum, allowing long-term institutional investors to allocate funds to SMEs (Nassr and Wehinger,
2015a).
More mature and/or larger firms can help firms to scale up and link start-ups with international markets
through acquisitions. Research on innovative companies shows that most of the successful exits by
venture-capital backed firms in the United States were through acquisitions by older firms (IDB, 2014b). It
also showed that when companies get access to public stock markets, they increase their acquisition of
innovative technology (IDB, 2014b). The integration of all PA countries into the MILA stock market is
thus a significant development, which could potentially assist firms in the scaling-up process.
Policies intended to help SMEs can also end up dampening incentives to scale up. This phenomenon has
been identified in Mexico, where policies ranging from tax exemptions and electricity subsidies to zoning
rules have resulted in perverse incentives to stay small and the protection of “mom and pop” businesses
from modern competitors, allowing these businesses to continue with low rates of productivity without
facing consequences (Bolio and McKinsey, 2015).
2. The business environment
Previous OECD work on the business environment has outlined a number of important considerations and
recommendations in the areas of developing industrial clusters, attracting foreign direct investment,
facilitating international certification, compliance with anti-bribery standards, and protecting intellectual
property rights.
Development of industrial clusters
A focus on developing strong industrial clusters aligns well with the goal of internationalising SMEs,
especially through GVCs, as, once a cluster is developed, MNEs can play a key role in helping to integrate
them into GVCs (OECD, 2008a). Clusters can also help to foster skills development, especially through
sector-specific worker training. As the OECD noted in its report on the role of SMEs in global value
chains, “cluster initiatives allow for economies of scale and agglomeration, and also help develop an
experienced local pool of skilled labour and a network of firms cooperating in complementary areas of
specialisation. By doing so, they strengthen their competitive advantages in a sustainable manner and
become attractive sites for quality FDI” (OECD, 2008a:p.13). Quality cluster programmes should create
frameworks for private-private, public-private, and public-public collaboration. Public-public co-ordination
has proved to be the most difficult to acheive; in this regard, horizontal development agencies, such as
CORFO, may be better placed to oversee clusters, as they can co-ordinate across agencies, have
implementation capacity, and are less constrained by the political cycle of ministries (IDB, 2014b).

58
Clusters can also help to foster mergers, where they serve the interests of the SMEs involved. In response
to the heightened demands and expectations on subcontractors from lead firms, as discussed in Section 1,
there are heightened pressures on SMEs to merge in order to attain the level of capacity and resources they
need to comply with lead firms’ demands (OECD, 2008a; IDB, 2014c). Indeed, research has found that
firms seldom join GVCs on their own; instead, they leverage resources with other firms in order to obtain
capabilities, and often collaborate through clusters and associations in order to overcome information gaps
(IDB, 2014c). Thus, enterprises within an industrial cluster can overcome barriers of information and trust
regarding potential partners, and facilitate mergers that could serve to upgrade their capacity to participate
in GVCs.
Overall, the value of cluster development lies in the creation of networks of enterprises, which can then
foster the sharing of information, best practice and access to markets and opportunities.
Attracting foreign direct investment
The OECD has also done considerable work on policy frameworks that support and encourage investment,
potentially creating opportunities for integration into GVCs. The updated 2015 Policy Framework for
Investment (PFI) looks at 12 different policy areas affecting investment: investment policy, investment
promotion and facilitation, competition, trade, taxation, corporate governance, finance, infrastructure,
developing human resources, policies to promote responsible business conduct and investment in support
of green growth, and broader issues of public governance (OECD, 2015b). It pays attention to the
particularities of SMEs and the specific challenges they face in each of these areas.
In the 2015 Latin American Economic Outlook, the OECD identifies two conditions if foreign direct
investment (FDI) is to boost technology uptake:40
“…investment must be channelled towards the most
technology-intensive sectors or activities, and beneficiary countries need an environment that is conducive
to spill overs and linkages with the rest of the economy. Both aspects require an institutional environment
and policies that prevent new technologies from becoming an enclave with scant linkages to the rest of the
production system” (OECD/CAF/ECLAC, 2014).
Facilitating international certification
The OECD recommends that governments should ensure that national certification systems do not impose
an excessive burden on small firms and encourage SMEs to participate in the standard-setting process in
order to ensure this happens (OECD, 2008a). PA efforts to harmonise sanitary measures and certifications
are a positive measure in this regard, and show clear recognition of the barriers that complex certifications
systems can pose to internationalisation. The public sector can also assist SMEs by helping to develop and
administer quality labels in order to assist their efforts to attract the attention of global buyers. Inter-
American Development Bank (IDB) research found that many firms regard their certifications as similar to
business cards, using them as an introduction to global buyers (IDB, 2014c).
Interventions to close information gaps are also very useful in educating firms about the importance of and
steps needed to achieve quality and certification standards. The kinds of exchanges of information
discussed below under “Provision of information” can serve to close information gaps surrounding this
topic, as potential exporters are often not fully aware of all the steps needed to obtain certain standards or
certifications, or may not be convinced that these certifications are worth the cost (IDB, 2014c).
Compliance with anti-bribery standards
As many MNEs are listed in countries with very robust enforcement of the bribery of foreign public
officials, they are required to conduct risk assessments of their foreign business partners, including any

59
local SMEs that want to join their value chains as suppliers or distributors. Having in place effective anti-
bribery management measures is thus key to SMEs’ ability to successfully internationalise and integrate
into global value chains, especially through SME-MNE linkages and indirect exports.
Unfortunately, the OECD has observed, in the context of monitoring implementation of the OECD Anti-
Bribery Convention, that SMEs often do not measure up in this area. As a result, MNEs often hesitate to
contract with local SMEs, and favour business partners that they control, such as controlled subsidiaries.
This can be harmful to the local economies as it is prejudicial to SMEs struggling to get a foothold in
global value chains.
Protection of intellectual property rights
Protection of intellectual property rights is also a key policy area, as small firms’ incentives to innovate
may be reduced if they are threatened with the appropriation of any resulting economic benefits (OECD,
2008a). SMEs have reported that requests by contractors for complete transparency from them on virtually
every relevant aspect of their business has facilitated unfair business behaviour, such as the contractor
passing their original designs and plans on to lower-cost competitors (OECD, 2008d).
3. Firm capabilities
Services provided by SME development institutions to develop firms’ capabilities usually cover a broad
range of general instruction in business management, such as how to start a company or manage cash
flow. This section will focus on more specialised service provision, covering the areas of supplier
development programmes, promotion of start-ups and innovation, skills development, quality product
standards, and incubation.
Prior to the analysis of these specialised categories, it should be noted that SMEs generally lack sufficient
understanding of the structure and dynamics of GVCs, although this varies across firms and sectors.41
Indeed, for many, the concept itself of a value chain is not always easy to grasp. Lack of knowledge of
overseas markets and contacts was unanimously identified as the main internal barrier SMEs faced
concerning internationalisation during an OECD-APEC workshop in 2006 (OECD, 2008d).
Supplier development programmes
In order for SMEs to capture more value added from their participation in GVCs, or even make their first
successful entry into a GVC, upgrading their technology is essential. This can be fostered through public
policies targeting supplier development and/or supplier financing. Policies in this area should aim to
support training and capacity building via skills development programmes; to promote partnerships
between SMEs and organisations overseas that can develop or transfer technology, products, processes or
management practices; and to facilitate technological upgrading through various financial schemes, such as
credit lines for upgrading (OECD, 2008a).
Innovation
In the field of innovation, the OECD has made relevant recommendations to individual PA countries
within its Innovation Policy Reviews (Colombia 201442
; Peru 201143
; Mexico 200944
; Chile 200745
); in
addition, the recent OECD study entitled Start-up Latin America: Promoting Innovation in the Region
(OECD, 2013) identified a number of key findings for the region, which could constitute elements of a PA
agenda, including:

60
Increase co-ordination in strategy planning. Start-up support programmes can only reach their full
potential when they are set within broader productive transformation strategies that contribute towards
creating a favourable environment for these companies to develop.
Ensure the availability of a balanced policy mix targeting different development stages. Often,
countries tend to focus on one particular tool, overlooking other important elements which are critical
for these firms to develop. For instance, while venture capital is essential for the expansion stages of
start-ups, its effectiveness will depend on the existence of seed funding for entrepreneurs at earlier
stages.
Design and implement more sophisticated support tools that are more in line with emerging global
trends. Despite the region’s recent progress in promoting start-ups, Latin American countries still face
important barriers that need to be overcome by: 1) simplifying the regulatory framework to facilitate
the creation and expansion of start-ups; 2) identifying opportunities to promote business angel
networks; 3) investing in promoting an entrepreneurial culture, particularly among young people;
4) introducing performance-based management criteria in incubators and agencies that facilitate access
to public development programmes; and 5) designing integrated support programmes that
simultaneously offer financing, business services and entrepreneurial skills learning.
Take advantage of emerging private sector open innovation trends, corporate venture capital and
knowledge-sharing to foster both the quantity and quality of innovative entrepreneurial projects
Evaluate programmes and adjust incentive schemes based on performance. This also requires
investing in creating new and better metrics for measuring the creation and expansion of start-ups in
the region in order to improve the capacity to design better policies based on results.
Skills development
Participation in GVCs can result in transfers of knowledge and technology, and thus improve SMEs’
human and technological resources, but initial entrance into a GVC, or continuance within it, can be a very
demanding process. This is especially the case in light of the recent tendency of lead companies to
disengage from some stages of production in the chain, and transfer greater responsibilities for oversight
and product development or innovation to subcontractors. Therefore, SMEs need to meet an initial
threshold of capabilities to successfully enter value chains. Policies that aim to raise technical and
managerial skills among SMEs can boost the integration of these firms into GVCs (OECD, 2008a).
A growing body of empirical studies has found that having an adequate pool of human capital seems to be
a key factor for exporting a wide range of services related to GVCs (IDB, 2014c). Quality of education is
almost certainly an important factor, but it is not enough in and of itself; there needs to also be a
sufficiently large pool of individuals with the skills that the market demands (IDB, 2014c). OECD work on
Costa Rica echoes this, finding that although the country has a quality education system, it needs to
increase its overall quantity of human capital to maintain its current levels of participation in information
and knowledge-intensive sectors (OECD, 2012).
SMEs struggle to obtain these above-average level of skills46
needed (OECD/World Bank, 2015). A wide
variety of sources have shown that developing country firms which join GVCs tend to have superior skills
and capabilities than those that do not (IDB, 2014c). For example, analysis of a sample of Chilean
businesses finds that vertically linked affiliates employ about 27% more workers, have 16% more skilled
workers and have 42% higher total factor productivity, demonstrating both SMEs’ lower representation
within this group, and the superior quality of skills employed by these firms. Vertically linked affiliates are
also found to be superior to exporters in these categories, and have 82% more exports overall, export 17%

61
more products, and have 32% more exports per product than other exporters (IDB, 2014c). Exporting
SMEs in the LAC region have been found to have 55% higher sales, 54% higher value added per worker,
and be 9% more skill intensive than non-exporting SMEs (IDB, 2014a). Other studies have found similar
results related to other forms of offshoring, with the general result that firms participating in international
production networks, even if they are just selling to MNEs located in their own country, tend to have
superior skills and capabilities than other firms (IDB, 2014c). While this level of expertise can certainly
develop once a firm enters a GVC, evidence points to there being a threshold level of skills that is needed
in order to successfully facilitate even this initial entry (OECD, 2008d). Furthermore, to move up the value
chain, SMEs need to take on larger and more complex sets of tasks. Firms seeking to join GVCs thus must
improve their skills and capacities to above-average levels in order to successfully compete (OECD,
2008d; IDB, 2014c).The ability to attract, develop and retain high-quality personnel will thus be key, as the
internationalisation process calls for efficient management at the corporate, business and functional levels.
Quality Product Standards
Achieving the strict product quality standards required to participate in GVCs is difficult and costly. SMEs
are often dissatisfied with the proliferation of private standards set by contractors and the fact that they
differ from each other, alleging that this makes the costs of compliance even more burdensome (OECD,
2008d). Furthermore, not only does entry into global chains require higher standards, but firms also need to
be prepared to rapidly switch to new standards, due to changes in technology or company strategy (OECD,
2008d). Costs of certification are, on average, very high for small firms. Small volumes of orders can limit
a small firm’s ability to afford the costs associated with investment in new equipment and systems,
obtaining certification, and developing the capabilities required to meet new standards (OECD, 2008a).
Yet, lead firms in value chains are under increasing pressure to adopt more and higher levels of standards,
in response to security and health concerns from government, and environmental and ethical concerns from
consumers and civil society.
Despite these challenges, certification and meeting standards are strongly associated with increased
exports, and the evidence generally shows that these benefits tend to outweigh compliance costs (IDB,
2014c). Thus, there is a clear need to assist SMEs in taking on these initial costs so that they can reap the
benefits of increased exports from their investment.
Incubators
The development of high-quality incubators is a potentially important policy area to facilitate the success
of firms with high potential for growth (IDB, 2014b). Incubators should aim to provide services that
markets are less likely to offer, such as quality mentoring and matching young firms with assets and ideas
that could help them to grow (IDB, 2014b). Incubators should also be structured in ways that align
incentives between the incubator itself and the firms it seeks to help, as CORFO’s 2010 reform aimed to do
(see below), rather than paying incubators a fixed fee based on the number of firms incubated.
4. Market access
Previous OECD work has outlined a number of important considerations and recommendations in the
areas of provision of information, production linkage mechanisms, and competition and public
procurement.
Provision of information
The OECD’s study on Removing Barriers to SME Access to International Markets (OECD, 2008d)
identifies three main skill sets that should be viewed as prerequisites for any SME wishing to compete

62
effectively in international markets: planning, manning and scanning (see Table 24). “Planning” refers to
the way a company navigates its involvement in foreign markets (finances, legal matters, production,
resources, logistics); “manning” refers to the management process by which a company organises or
develops its resources to service foreign markets; and “scanning” refers to the way in which the business
informs itself about international markets (OECD, 2008d).
This study notes that the majority of support programmes for developing international SMEs address
elements of the “scanning” process, bypassing the first two stages. While information about opportunities
in a foreign market can be sufficient to create an export opportunity, a company often first needs to assess
its readiness and ability to export effectively and in a sustained manner. In this situation, information about
foreign markets needs to be aligned in a more structured way with the company’s plans (OECD, 2008d).
Table 24. Planning, manning and scanning: Skills, purposes and knowledge breakdown
Skills Purpose (find answers) Knowledge
Planning Markets
Financial
Legal
Production
Competition
What are the reasons for going
international?
Is the company ready to do it?
What will be the impact of this
decision on the organisation?
Do the responsible
managers know
how to build a
strategy?
Manning Communication
(foreign languages)
Sales
Production
Competition
Do we have the resources to
support exporting?
Do we have the skills to meet the
needs of overseas clients?
Are we prepared to build and
develop relationships with key
partners?
Do the responsible
managers know
how to structure
and skill up the
company?
Scanning Market research
Identifying
opportunities
Building the best
channels to market
Building networks
Monitoring the
competition
Is there a market for our products
and, if so, what do we need to
know about it?
How do we find these things out?
How do we exploit these
opportunities?
Do the responsible
managers know
how business
practice differs in
other markets and
how this might
impact on the
company?
Source: OECD (2008d), Removing Barriers to SME Access to International Markets, OECD Publishing, Paris, http://dx.doi.org/10.1787/9789264045866-en.
Furthermore, research has found a common thread across case studies of GVCs in Latin America: firms
that are part of GVCs generally have a manager, chief executive officer or owner who has previous
international business experience (IDB, 2014c). This once again demonstrates the strength of the barrier
raised by lack of information about international markets and GVC standards and common practices.
Public policy has a clear role here: promoting environments that produce information exchange between
actors (IDB, 2014c). This can be implemented through workshops with global buyers, in order to learn
about their standards; coaching programmes with successful exporters; or through EPOs, who can offer
training for inexperienced firms on export procedures, marketing, and business negotiations, specialised
counselling and technical assistance, and/or co-ordinate, support, and co-finance participation in
international trade missions, trade shows and meetings with global buyers (IDB, 2014c). Previous
experiences show that, although companies are in competition with one another, successful firms are often
willing to share their experiences with others (IDB, 2014c).

63
Production linkage mechanisms
Previous OECD work has set out basic conditions that production linkage mechanisms must meet in order
to produce positive results:
Linkage mechanisms should be incorporated into industrial policy and national development
strategies.
Operational decentralisation of the instruments will broaden the programme’s reach into the
various regions.
All agents, especially those in the public sector, should use participatory processes that use
consensus to define short-, medium- and long-term action plans (OECD/ECLAC, 2012:pp.165-
166).
5.
The work emphasised the importance of the first condition: “When there are scattered development
initiatives in a weak institutional context with a lack of priorities for industrial policy and for selecting
production chains and sectors, there is less chance for complementarity, co-ordination of support and
institutional learning” (OECD/ECLAC, 2012:p.179).
Competition and public procurement
SMEs will often be the main beneficiaries of competition policy, whether it takes the form of the
enforcement of laws against anti-competitive behaviour by firms with market power, or pro-competitive
policy reform of anti-competitive regulations. The OECD 2009 Council Recommendation on Competition
Assessment47
and the associated Competition Assessment Toolkit48
particularly emphasise the need to
reform regulations that inadvertently create barriers to entry and expansion (such as minimum scale
requirements, financial guarantees or fixed costs of regulatory compliance). Governments and competition
agencies should scrutinise new and existing laws and regulations for such barriers, and seek to identify
alternative approaches to achieving regulatory objectives that do not restrict competition.
SMEs are often effectively shut out of the government procurement market due to the mismatch between
their size and the needs stipulated in the bids. Possible approaches include targets or setting aside a
proportion of public expenditure to be delivered by SMEs, as Peru and Mexico have already done;
commitments to deliver public programmes/contracts in smaller pieces so that SMEs can deliver more
easily; and reducing the complexity and costs of application forms (OECD, 2008b). Other OECD work
recommends the development of SME consortia to enter joint bids on government procurement projects
(OECD, 2008a).
New recommendations by the OECD Council on public procurement recommend that access to
procurement opportunities be facilitated for competitors of all sizes (OECD, 2015c). The recommendations
state that countries should 1) have in place clear, simple, coherent, and stable institutional, legal, and
regulatory frameworks; 2) deliver clear and integrated tender documentation, with specific designs of
tender opportunities for SMEs, as well as aligning the extent and complexity of information required to the
size and complexity of the procurement; 3) use competitive tendering, limiting the use of exceptions and
single-source procurement; and 4) employ recent digital technology developments that allow integrated e-
procurement solutions covering the public procurement cycle, avoiding excessively complicated systems
that could create challenges for new entrants or SMEs (OECD, 2015c).

64
5. Trade and trade-related policies
The OECD has outlined a number of important considerations and recommendations in the areas of trade
agreements; trade facilitation; and services, transport, and communications logistics and infrastructure.
Trade agreements
Recent OECD analysis (Kowalski et al., 2015) found evidence suggesting that importing is essential to
developing export competitiveness. The use of imported intermediates is not only linked to positive
productivity changes, but also positive changes in the extensive margins of trade. Diversification was
associated with positive changes in backwards participation and the use of more sophisticated non-primary
imported intermediates, with the former being more relevant for low and middle-income countries, and the
latter more relevant for high-income countries.
These findings underscore the importance of fostering multilateral liberalisation, in order to ensure access
to quality and competitive intermediate imports, which can then be used to support subsequent increases in
the domestic value added of exports49
, diversification and competitiveness.
Forthcoming OECD analysis (OECD, 2015e) also highlights the importance of rules of origin (RoOs) in
the context of GVCs, identified as one of the key factors shaping trade and investment decisions in
preferential trade agreement members and their trading partners. RoOs provide definitions of the origin of
products for the purposes of their preferential treatment under preferential trade agreements (PTAs). In a
global economy characterised by internationally fragmented production processes, such rules can shape
trade, investment and value chain location decisions. Different RoOs that may accompany similar trade
preferences may have different effects on value chain participation. Some may constitute more of an
obstacle to employing cheaper parts and materials from third countries, particularly if these are used to
produce final goods that are later exported to other PTA members. Restrictive RoOs on final goods can
also encourage intra-regional trade in inputs, and thus discourage use of external sources.
The policy challenge is how to define RoOs so that they help implement the provisions of preferential trade
agreements but also maximise the benefits from trade integration and value chain engagement, including
strategic issues such as FDI and FDI-led innovation.
Trade facilitation
Trade facilitation could be a powerful instrument for PA countries to further enjoy gains from trade. Some
practical and relatively inexpensive actions could cut trade costs by as much as 16.3% for some countries
in the LAC region (OECD, 2015).50
Policy makers could also consider forming consultation schemes and other support programmes to help
exporting SMEs diagnose trade barriers and/or discuss issues related to trade barriers directly with policy
makers. Previous OECD work has recommended that policy makers develop a framework to facilitate
SMEs’ integration into the trade policy process, in order to create a more co-operative and facilitating
relationship comprised of two major elements: 1) SME participation in government mechanisms for public
consultation, and 2) programmes that assist firms to understand and overcome trade barriers (OECD,
2008d). Government consultation models vary widely, but generally include both formal and informal
mechanisms.51
While OECD countries in general have more formalised and extensive consultative
mechanisms involving business interests in policy discussions and technical matters, many consultation
mechanisms in developing countries tend to suffer from resource constraints that limit private-sector
participation, even though business input becomes more important as nations adopt more open trading
regimes.

65
Services, transport and communications logistics and infrastructure
As discussed in Section 1, OECD research clearly indicates the importance of having high-quality
infrastructure in the areas of transport and communications logistics and infrastructure, with the quality of
logistics affecting trade at least as much as, and at times even more than, distance or transport costs
(OECD/CAF/ECLAC, 2013).
Appropriate private-sector involvement in transport infrastructure can limit future fiscal costs and reduce
logistics costs. Effectively exploiting the benefits of public-private partnerships (PPPs) requires developing
a strong capacity to assess, tender and manage concession contracts. Following a social-feasibility analysis,
value-for-money assessments can be used to decide whether a concession contract would be more
appropriate than publicly funded work. While most OECD economies do a cost-benefit analysis or use a
public-sector comparator, Latin American countries usually limit their analysis to comparing the results of
tenders. This creates uncertainty regarding whether the private sector provides better value for money.
Additionally, mechanisms must be put in place to limit the possibility of projects running over schedule or
above budget.
Overall, while greater and better investment in infrastructure is essential, it is insufficient on its own; it
should be accompanied by improvements to the institutional framework. Since eliminating gaps in hard
components like transport infrastructure cannot be achieved in the short run, active policies to improve the
transport of goods and services using existing infrastructure should be a priority (OECD/CAF/ECLAC,
2013). The most important measure is to improve co-ordination among the various organisations involved
in logistics and to promote good governance through mechanisms that co-ordinate the various national and
regional public-private partnership initiatives at both the national and sub-national levels
(OECD/CAF/ECLAC, 2013). Improvements to the institutional framework can encourage investment in
co-modal transport52. Integration or better co-ordination among the various institutions responsible for
each mode of transport would increase the role of rail transport and inland waterways in the region, which
would have a tremendous impact on logistics costs. It would also reduce the negative externalities on the
population and the environment, especially in saturated port areas.

66
ANNEX E: OECD TOOLS IN THE FIELDS OF SME POLICY, TRADE AND INVESTMENT
Small and medium-sized enterprises
The SME Policy Index is a tool to support policy makers tap the full potential of SMEs as drivers for job
creation and economic growth. The Index provides a structured and comparative evaluation by defining a
country’s position on a set of key SME policy dimensions, building on a set of policy indicators. This leads
to the identification of strengths and weaknesses in the development of policies and initiatives for SME
support, allowing a better targeting of government and SME stakeholder action, a more efficient allocation
of resources, and a more effective dialogue with the private sector.
The SME Policy Index has been applied by the OECD and other international organisations to several
regional groupings, including the West Balkans (2006, 2009 and 2012), Eastern Europe (2012, 2016),
Middle East and North Africa (MENA) (2008 and 2013) and the Association of South East Asian Nations
(ASEAN) (2014). An example of findings related to SME internationalisation that have emerged from
OECD SME Policy Indexes of other regions can be found in Box 4.
Box 4. Internationalisation of SMEs in the MENA and Eastern European regions: SME Policy Index findings
Middle East and North Africa
The OECD’s comprehensive SME Policy Index evaluation of the MENA region’s efforts to facilitate SME internationalisation in 2014 paid particular attention to the role of initiatives to promote trade such as the implementation of trade promotion strategies, export promotion programmes, and the simplification and facilitation of trade procedures. It found there was a need to update and/or adopt strategic approaches towards export promotion and increase efforts for the facilitation of trade through electronic procedures and virtual one-stop shops. The assessment framework focused on two elements: proactive trade policy and measures to simplify procedures for international trade. The first element evaluated four specific areas: 1) export promotion strategy; 2) intra-region trade agreements; 3) providing advice and high-value information on the international market; and 4) export capacity-building programmes. The second element focused on three areas: 1) the level of computerisation of procedures; 2) quality of access to regulatory and procedural information; and 3) virtual one-stop shops. Eastern Europe
The OECD’s comprehensive SME Policy Index evaluation of six1 Eastern Partner countries’ efforts to facilitate SME
internationalisation in 2016, assessed regional export promotion programmes, including export promotion agencies; support services for SMEs and export finance; and integration of SMEs into GVCs, including business linkage programmes, industrial competitiveness clusters, and supplier development programmes.
Overall, the analysis found that export promotion efforts in Eastern Partner countries are still nascent; while most have export promotion agencies, their services are mainly limited to trade fairs and training. Regarding integration of SMEs into GVCs, it was found that no targeted government programmes currently exist to help SMEs with this integration process. Thus, recommended key priorities going forward include scaling up the services of export promotion agencies, adding more sophisticated products, building capacity in existing export promotion agencies, and further development of trade and financing options.
1. Armenia, Azerbaijan, Belarus, Georgia, Republic of Moldova and Ukraine
Sources: OECD (2014), “Internationalisation of SMEs”, in OECD/The European Commission/ETF, SME Policy Index: The Mediterranean Middle East and North Africa 2014: Implementation of the Small Business Act for Europe, OECD Publishing, Paris, http://dx.doi.org/10.1787/9789264218413-18-en; OECD, et al. (2015), “Internationalisation of SMEs (Dimension 10) in Eastern partner countries”, in OECD, SME Policy Index: Eastern Partner Countries 2016: Assessing the Implementation of the Small Business Act for Europe, OECD Publishing, Paris. DOI: http://dx.doi.org/10.1787/9789264246249-en.

67
Trade
OECD Trade in Value Added (TiVA) Database
The joint OECD-World Trade Organisation (WTO) TiVA initiative considers the value added by each
country in the production of goods and services that are consumed worldwide in order to better inform
policy makers by providing new insights into the commercial relations between nations.
The 2015 edition of the TiVA database53
includes 61 economies covering OECD, EU28, G20, most
East and South-east Asian economies and a selection of South American countries (OECD, 2015f). The
industry list has been expanded to cover 34 unique industrial sectors, including 16 manufacturing and 14
services sectors (OECD, 2015g). The years covered are 1995, 2000, 2005 and 2008 to 2011.
The indicators presented in the TiVA database provide insights into domestic and foreign value added
content of gross exports by exporting industry; services content of gross exports by exporting industry, by
type of service and value added origin; participation in GVCs via intermediate imports embodied in
exports (backward linkages) and domestic value added in partners’ exports (forward linkages); “global
orientation” of industrial activity i.e. share of industry valued added that meets foreign final demand;
origins of value added in final demand, by source country and source industry; bilateral trade relationships
based on flows of value added embodied in domestic final demand; and inter-regional and intra-regional
relationships.
OECD Trade Facilitation Indicators
To help governments improve their border procedures, reduce trade costs, boost trade flows and
reap greater benefits from international trade, the OECD has developed a set of trade facilitation
indicators that identify areas for action and enable the potential impact of reforms to be assessed. Estimates
based on the indicators provide a basis for governments to prioritise trade facilitation actions and mobilise
technical assistance and capacity-building efforts for developing countries in a more targeted way.
The OECD Trade Facilitation Indicators (TFIs)54
cover the full spectrum of border procedures
across 10 indicators (advance rulings; appeal procedures; external and internal co-operation; fees and
charges; formalities in automation, documents and procedures; governance and impartiality; and
information availability) for 160 countries (including all PA members) across income levels, geographical
regions and development stages. The TFIs take values from 0 to 2, where 2 represents the best performance
that can be achieved. They are calculated on the basis of information in the TFI database.
OECD Services Trade Restrictiveness Index:
The OECD Service Trade Restrictions Index (STRI)55
helps identify which policy measures
restrict trade, providing policy makers and negotiators with information and measurement tools to open up
international trade in services and negotiate international trade agreements. It can also help governments
identify best practice and then focus their domestic reform efforts on priority sectors and measures.
The STRI assesses services trade restrictiveness across 18 sectors56
in 40 OECD and partner
countries.57
Indices take a value from 0 to 1, where 0 is completely open and 1 is completely closed. They
are calculated on the basis of information in the STRI database which reports regulation currently in force.

68
Investment
The Policy Framework for Investment (PFI), adopted in 2006 and updated in 2015 (OECD,
2015b), is the most comprehensive and systematic approach for improving investment conditions ever
developed. In response to new forces reshaping the global investment landscape and the numerous lessons
learnt through its use over the years, the PFI has been updated to reflect new global economic
fundamentals and to incorporate feedback from the international investment policy community.
The PFI looks at 12 different policy areas affecting investment: investment policy, investment
promotion and facilitation, competition, trade, taxation, corporate governance, finance, infrastructure,
developing human resources, policies to promote responsible business conduct and investment in support
of green growth, and, lastly, broader issues of public governance.
The PFI also provides a basis for support regarding regional investment policy dialogue.
Established regional economic communities are currently using the PFI to promote peer learning on
regional investment policy and policy harmonisation among their members. Examples include the
NEPAD-OECD Africa Investment Initiative (OECD, n.d. a), the ASEAN-OECD Investment Programme
(OECD, n.d. b), the Latin America and Caribbean Investment Initiative (OECD, n.d. c), the Investment
Compact for South East Europe (OECD, n.d. d), and the Middle East and North Africa Investment
Programme (OECD, n.d. e).

69
REFERENCES
Ayyagari, M., Demirgüç-Kunt, A. and Beck, T. (2003). “Small and Medium Enterprises across the Globe:
A New Database”. World Bank Policy Research Working Paper No. 3127. Available at
SSRN: http://ssrn.com/abstract=636547
Balassa, B. (1965), “Trade liberalisation and ‘revealed’ comparative advantage”, The Manchester School,
Vol. 33/2, pp.99-123.
Bolio, E. and J.R. McKinsey (11 March 2015), “Mexico, destined to always underachieve?”, FT
beyondbrics blog, http://blogs.ft.com/beyond-brics/2015/03/11/guest-post-mexico-destined-to-always-
underachieve/.
CEPAL (2014), La Alianza del Pacífico y el MERCOSUR: Hacia la Convergencia en la Diversidad,
Comisión Ecónomica para América Latina (Economic Commission for Latin America and the Caribbean).
FUNDES (2015), Micro, pequeñas y medianas empresas: hacia el desarrollo sostenible en la región
http://mipymes.fundes.org/
IDB (2015), The Labyrinth: How Can Latin America and the Caribbean Navigate the Global Economy?,
Inter-American Development Bank.
IDB (2014a), Going Global: Promoting the Internationalisation of Small and Mid-Size Enterprises in
Latin America and the Caribbean, Inter-American Development Bank.
IDB (2014b), Rethinking Productive Development: Sound Policies and Institutions for Economic
Transformation, Inter-American Development Bank.
IDB (2014c), Synchronized Factories: Latin America and the Caribbean in the Era of Global Value
Chains, Inter-American Development Bank.
IFC (2010), Scaling-Up SME Access to Financial Services in the Developing World, International Finance
Corporation.
Korinek, J. and P. Sourdin (2011), “To what extent are high-quality logistics services trade
facilitating?”, OECD Trade Policy Papers, No. 108, OECD Publishing, Paris,
http://dx.doi.org/10.1787/5kggdthrj1zn-en.
Kowalski, P. et al. (2015), “Participation of developing countries in global value chains: Implications for
trade and trade-related policies”, OECD Trade Policy Papers, No. 179, OECD Publishing, Paris.
Nassr, I.K., and G. Wehinger (2015a), “Unlocking SME finance through market-based debt: Securitisation,
private placements and bonds”, OECD Journal: Financial Market Trends, Vol. 2014/2,
http://dx.doi.org/10.1787/fmt-2014-5js3bg1g53ln.
Nassr, I.K., and G. Wehinger (2015b), “Opportunities and limitations of public equity markets for SMEs”,
OECD Journal: Financial Market Trends, Vol. 2015/1 (forthcoming).
70
OECD (2015a), New Approaches to SME and Entrepreneurship Financing: Broadening the Range of
Instruments, OECD Publishing, Paris, http://dx.doi.org/10.1787/9789264240957-en.
OECD (2015b), Policy Framework for Investment, 2015 Edition, OECD Publishing, Paris,
http://dx.doi.org/10.1787/9789264208667-en.
OECD (2015c), Recommendation of the Council on Public Procurement, OECD Council,
http://acts.oecd.org/Instruments/ShowInstrumentView.aspx?InstrumentID=320&InstrumentPID=348.
OECD (2015d), Opportunities and Constraints of Market-Based Financing for SMEs, OECD Report to
G20 Finance Ministers and Central Bank Governors (September), OECD, Paris,
www.oecd.org/finance/financial-markets/Opportunities-and-Constraints-of-Market-based-Financing-for-
SMEs.pdf.
OECD (2015e), Participation in Global Value Chains in Latin America – Implications for Trade and
Trade-related Policy: Scoping Paper, OECD, Paris.
OECD (2015f), “TiVA 2015 geographical coverage”, OECD website,
www.oecd.org/sti/ind/tiva/TiVA_2015_Country_Region_List.pdf.
OECD (2015g), “Industry breakdown for the 2015 Trade in Value Added (TiVA indicators”. OECD
website, www.oecd.org/sti/ind/tiva/TiVA_2015_Industry_List.pdf.
OECD (2014), “Internationalisation of SMEs”, in OECD/The European Commission/ETF, SME Policy
Index: The Mediterranean Middle East and North Africa 2014: Implementation of the Small Business Act
for Europe, OECD Publishing, Paris, http://dx.doi.org/10.1787/9789264218413-18-en.
OECD (2013), Start-up Latin America: Promoting Innovation in the Region, Development Centre Studies,
OECD Publishing, Paris, http://dx.doi.org/10.1787/9789264202306-en.
OECD (2012), “Attracting knowledge-intensive FDI to Costa Rica: Challenges and policy options”,
Making Development Happen, No. 1, OECD Publishing, Paris, www.oecd.org/countries/costarica/E-
book%20FDI%20to%20Costa%20Rica.pdf.
OECD (2011a), “Selling to foreign markets: A portrait of OECD exporters”, Statistics Brief, No. 16,
OECD Publishing, Paris, www.oecd.org/std/47014723.pdf.
OECD (2011b), OECD Guidelines for Multinational Enterprises, OECD Publishing, Paris,
http://dx.doi.org/10.1787/9789264115415-en.
OECD (2008a), Enhancing the Role of SMEs in Global Value Chains, OECD Publishing, Paris,
http://dx.doi.org/10.1787/9789264051034-en.
OECD (2008b), OECD Framework for the Evaluation of SME and Entrepreneurship Policies and
Programmes, OECD Publishing, Paris, http://dx.doi.org/10.1787/9789264040090-en.
OECD (2008c), OECD Investment Policy Reviews: Peru 2008, OECD Publishing, Paris,
http://dx.doi.org/10.1787/9789264053755-en.
OECD (2008d), Removing Barriers to SME Access to International Markets, OECD Publishing, Paris,
http://dx.doi.org/10.1787/9789264045866-en.

71
OECD (n.d. a), “NEPAD-OECD Africa Investment Initiative”, OECD website,
www.oecd.org/daf/inv/investment-policy/africa.htm.
OECD (n.d. b), “International investment in Southeast Asia”, OECD website,
www.oecd.org/daf/inv/investment-policy/seasia.htm.
OECD (n.d. c), “Latin America and Caribbean-OECD Investment Initiative”, OECD website,
www.oecd.org/daf/inv/mne/latin-america-caribbean-investment-initiative.htm.
OECD (n.d. d), “Investment Compact for South East Europe”, OECD website,
www.oecd.org/investmentcompact.
OECD (n.d. e), “Middle East and North Africa: Initiative on Governance and Investment for
Development”, OECD website, www.oecd.org/mena/investment.
OECD, et al. (2015), “Internationalisation of SMEs (Dimension 10) in Eastern partner countries”, in SME
Policy Index: Eastern Partner Countries 2016: Assessing the Implementation of the Small Business Act for
Europe, OECD Publishing, Paris, http://dx.doi.org/10.1787/9789264246249-en.
OECD/CAF/ECLAC (2014), Latin American Economic Outlook 2015: Education, Skills and Innovation
for Development, OECD Publishing, Paris, http://dx.doi.org/10.1787/leo-2015-en.
OECD/CAF/ECLAC (2013), Latin American Economic Outlook 2014: Logistics and Competitiveness for
Development, OECD Publishing, Paris, http://dx.doi.org/10.1787/leo-2014-en.
OECD/ECLAC (2012), Latin American Economic Outlook 2013, SME Policies for Structural Change,
OECD Publishing, Paris, http://dx.doi.org/10.1787/leo-2013-en.
OECD/World Bank (2015), Inclusive Global Value Chains: Policy Options in Trade and Complementary
Areas for GVC Integration by Small and Medium Enterprises and Low-Income Developing Countries,
World Bank, Washington, DC.
OECD/WTO/UNCTAD (2013), “Implications of global value chains for trade, investment, development
and jobs”, report prepared for the G-20 Leaders Summit, Saint Petersburg, September 2013,
http://www.oecd.org/trade/G20-Global-Value-Chains-2013.pdf.
Pacific Alliance (n.d.), “Commercial agreements”, Pacific Alliance website,
https://alianzapacifico.net/en/negocios-e-inversion/#commercial-agreements.
ProColombia (n.d.), “Portal de exportaciones”, www.colombiatrade.com.co/.
ProMéxico (May 2014), “The Pacific Alliance Issue”, Negocios, ProMéxico.
UNCTAD (2014), World Investment Report 2014: Investing in the SDGs: An Action Plan, United Nations
Conference on Trade and Development,
http://unctad.org/en/pages/PublicationWebflyer.aspx?publicationid=937.

72
1 In 2014, Costa Rica began the process of joining the group.
2 This paper uses the following classification for SMEs, applicable for all PA countries: Micro: 0-10, Small: 11-50,
Medium: 51-250, Large: 251+ employees.
3 SMEs generally must reach a threshold in terms of both productivity and size in order to be successful in directly
exporting and/or gaining the interest of large companies. Thus, policy makers should be aware that small
and medium-sized companies are much more likely to be successful in exporting than microenterprises.
4 Measuring the contribution of SMEs to GDP is a complex task, particularly in emerging economies, as informality
plays a major role (see Annex B, Box 3).
5 It is important to note that relative labour productivity may also be influenced by large companies’ specialisations in
capital intensive sectors, such as mining in Chile and Peru.
6 Indirect exporting consists of selling to an intermediary, who in turn sells the product directly to customers or to
importing wholesalers.
7 Recent IDB research finds that a 10 percent increase in export product variety of all industries leads to a 1.3 percent
increase in productivity (IDB, 2014a).
8 UNCTADStat: Goods and Services (BPM6): Exports and imports of goods and services, annual, 2005-2014.
http://unctadstat.unctad.org/wds/TableViewer/tableView.aspx?ReportId=89795
9 All data taken from UNCTADStat: Merchandise: Trade matrix by product groups, exports in thousands of dollars,
annual, 1995-2013 http://unctadstat.unctad.org/wds/TableViewer/summary.aspx
10 Includes the 10 members of ASEAN plus China, Japan, Korea, Hong-Kong and Chinese Taipei.
11 All data taken from UNCTADStat: Merchandise: Trade matrix by product groups, exports in thousands of dollars,
annual, 1995-2013 http://unctadstat.unctad.org/wds/TableViewer/summary.aspx
12 Thoroughly evaluating whether regional GVC participation is high or low needs to be seen in relative terms,
controlling for various structural factors, such as size of the market, distance to economic poles of activity,
and specialisation patterns. As it is outside of the scope of this paper to use a trade gravity model to do so,
the paper uses analysis from the Inter-American Development Bank (IDB, 2014c) to support the claim that
the region’s GVC participation is generally low relative to other regions. The IDB comes to this conclusion
after engaging in various forms of analysis, gathering evidence from intra-industry trade indexes; trade in
value-added; FDI data; and trade in services (see Chapter 2 of IDB, 2014c).
13 While it is true that assembly activities often represent a very small share of the value added of the final product,
the case of Mexico, confirmed by recent research (Kowalski et al., 2015), shows that what matters, both at
firm and at aggregate level, is both the ability to progressively move to higher value added functions in the
production chain, as well as the total scale of the production/assembly operations.
14 See previous note.
15 OECD (2016, forthcoming), Participation in Global Values Chains in Latin America: Implications for Trade and
Trade-related Policy, OECD Publishing, Paris.
16 A recent OECD study (Kowalski et al., 2015) found evidence that positive changes in backward participation and
the use of more sophisticated non-primary imported intermediates are associated with diversification, with
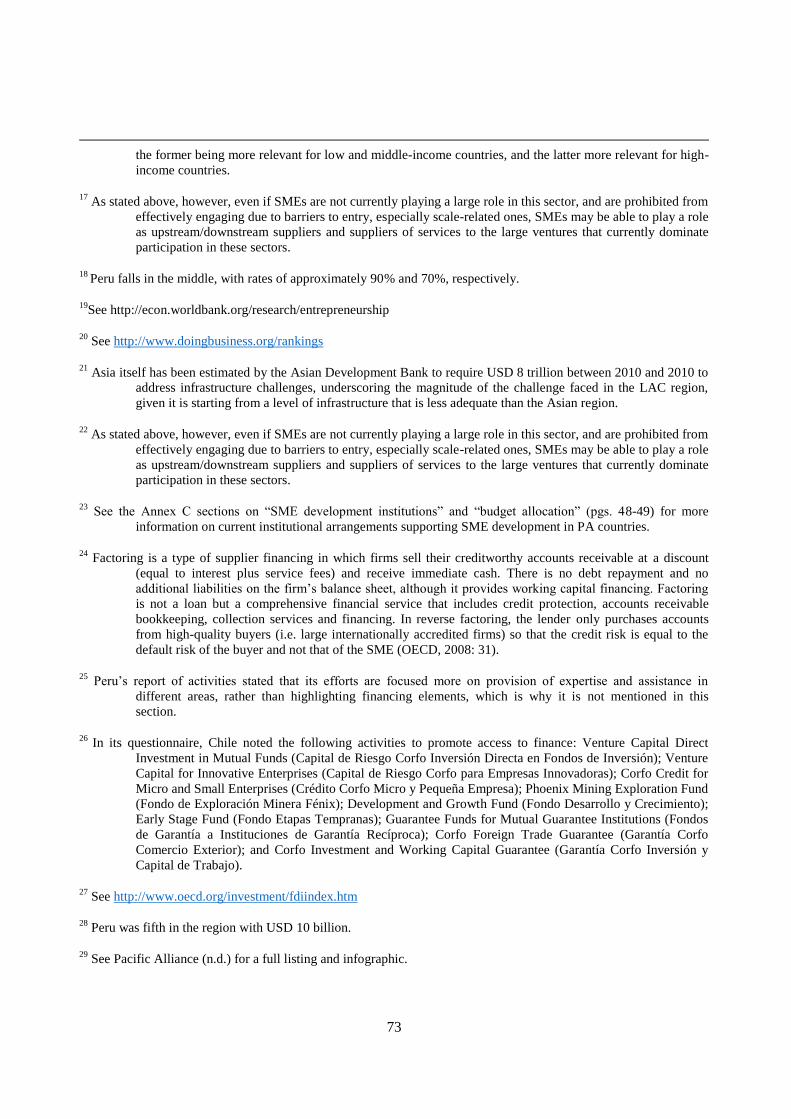
73
the former being more relevant for low and middle-income countries, and the latter more relevant for high-
income countries.
17 As stated above, however, even if SMEs are not currently playing a large role in this sector, and are prohibited from
effectively engaging due to barriers to entry, especially scale-related ones, SMEs may be able to play a role
as upstream/downstream suppliers and suppliers of services to the large ventures that currently dominate
participation in these sectors.
18 Peru falls in the middle, with rates of approximately 90% and 70%, respectively.
19See http://econ.worldbank.org/research/entrepreneurship
20 See http://www.doingbusiness.org/rankings
21 Asia itself has been estimated by the Asian Development Bank to require USD 8 trillion between 2010 and 2010 to
address infrastructure challenges, underscoring the magnitude of the challenge faced in the LAC region,
given it is starting from a level of infrastructure that is less adequate than the Asian region.
22 As stated above, however, even if SMEs are not currently playing a large role in this sector, and are prohibited from
effectively engaging due to barriers to entry, especially scale-related ones, SMEs may be able to play a role
as upstream/downstream suppliers and suppliers of services to the large ventures that currently dominate
participation in these sectors.
23 See the Annex C sections on “SME development institutions” and “budget allocation” (pgs. 48-49) for more
information on current institutional arrangements supporting SME development in PA countries.
24 Factoring is a type of supplier financing in which firms sell their creditworthy accounts receivable at a discount
(equal to interest plus service fees) and receive immediate cash. There is no debt repayment and no
additional liabilities on the firm’s balance sheet, although it provides working capital financing. Factoring
is not a loan but a comprehensive financial service that includes credit protection, accounts receivable
bookkeeping, collection services and financing. In reverse factoring, the lender only purchases accounts
from high-quality buyers (i.e. large internationally accredited firms) so that the credit risk is equal to the
default risk of the buyer and not that of the SME (OECD, 2008: 31).
25 Peru’s report of activities stated that its efforts are focused more on provision of expertise and assistance in
different areas, rather than highlighting financing elements, which is why it is not mentioned in this
section.
26 In its questionnaire, Chile noted the following activities to promote access to finance: Venture Capital Direct
Investment in Mutual Funds (Capital de Riesgo Corfo Inversión Directa en Fondos de Inversión); Venture
Capital for Innovative Enterprises (Capital de Riesgo Corfo para Empresas Innovadoras); Corfo Credit for
Micro and Small Enterprises (Crédito Corfo Micro y Pequeña Empresa); Phoenix Mining Exploration Fund
(Fondo de Exploración Minera Fénix); Development and Growth Fund (Fondo Desarrollo y Crecimiento);
Early Stage Fund (Fondo Etapas Tempranas); Guarantee Funds for Mutual Guarantee Institutions (Fondos
de Garantía a Instituciones de Garantía Recíproca); Corfo Foreign Trade Guarantee (Garantía Corfo
Comercio Exterior); and Corfo Investment and Working Capital Guarantee (Garantía Corfo Inversión y
Capital de Trabajo).
27 See http://www.oecd.org/investment/fdiindex.htm
28 Peru was fifth in the region with USD 10 billion.
29 See Pacific Alliance (n.d.) for a full listing and infographic.

74
30
In the 1990s, close to 50% of transport concessions were renegotiated in Chile, Colombia and Mexico. In Chile
each concession was renegotiated an average of four times between 1993 and 2007 and by 2011 an average
of 40% of concessions in the region had been renegotiated. Also, 50 of the 61 highway concessions signed
up to 2010 in Colombia, Chile and Peru have been renegotiated at least once, resulting in more than 540
renegotiations. The first modification of all renegotiations took place less than three years after the
concession was granted. The situation in Colombia is particularly striking, where 21 concessions were
renegotiated a total of more than 400 times, costing almost 3 times the initial cost of the 21 renegotiated
concessions (OECD/CAF/ECLAC, 2013).
31 OECD (2013), Mexico: Key Issues and Policies, OECD Studies on SMEs and Entrepreneurship, OECD Publishing,
Paris.
DOI: http://dx.doi.org/10.1787/9789264187030-en
32 OECD (2015), Diagnostic of Chile’s Engagement in Global Value Chains, OECD Publishing, Paris.
33 This would not have any cost implications other than appointing a point of contact and providing the relevant
information.
34 West Balkans (2006, 2009, 2012), Eastern Europe (2012), Middle East and North Africa (MENA) (2008; 2013) and
Association of South East Asian Nations (ASEAN) (2014) (see Annex E for further information).
35 Costa Rica has also undertaken a review (2013).
xxxvi Colombia not included in data set.
xxxvii Colombia and Peru not included in data set.
xxxviii Includes 4 countries in East Asia (Philippines, Indonesia, Lao People's Democratic Republic and Vietnam), 12 in
Europe and 18 in Latin America.
39 Research shows that, for example, firms in the United States that have survived for 40 years employ nearly 8 times
more workers than firms that are 5 years old or younger, while the same scale-up factor for Mexico is only
2 times (IDB, 2014b). Little is known about why firms scale up relatively little in the LAC region so this is
a key area for potential research.
40 This can be spurred by FDI due to its bringing in of new technologies, and creation of foreign ties with markets that
have more stringent competitiveness demands (price and quality) (OECD/CAF/ECLAC, 2014).
41 A majority of SMEs across different industries are not able to identify their competitive strengths within the value
chain. Most also do not fully understand the importance of identifying them if they are to optimise their
participation in GVCs. SMEs report a lack of time and resources to understand the evolving global context
and devise a market strategy. This, in turn, translates into insufficient ability to define an adequate business
model to gain or increase their competitiveness (OECD, 2008d). This seems to be a function of the
complexity of the sector and/or the position of the firm in the chain. In sectors with especially complex
value chains, such as the tourism or cinema industries, or those that can serve a variety of very different
industries, such as in the scientific and precision instruments industries, it can be difficult for SMEs to
obtain knowledge beyond their immediate environment. The same has been found for companies, usually
SMEs, which occupy a low position in the chain (OECD, 2008a).
42 OECD (2014), OECD Reviews of Innovation Policy: Colombia 2014, OECD Publishing, Paris.
DOI: http://dx.doi.org/10.1787/9789264204638-en
43 OECD (2011), OECD Reviews of Innovation Policy: Peru 2011, OECD Publishing, Paris.
DOI: http://dx.doi.org/10.1787/9789264128392-en

75
44
OECD (2009), OECD Reviews of Innovation Policy: Mexico 2009, OECD Publishing, Paris.
DOI: http://dx.doi.org/10.1787/9789264075993-en
45 OECD (2007), OECD Reviews of Innovation Policy: Chile 2007, OECD Publishing, Paris.
DOI: http://dx.doi.org/10.1787/9789264037526-en
46 An important phenomenon in the globalisation of value chains is the disengagement of lead companies from a
number of stages of production along the value chain, which implies the transfer of greater responsibilities
to subcontractors. Contractors demand more of their partners: not just to manufacture a product or provide
a service, but also to contribute to its development, organise and monitor a network of sub-suppliers,
implement internal quality-control systems and assure compliance with an increasing set of standards, and
ensure delivery and quality at competitive costs, but SMEs often state that they lack managerial capacity to
deal with the complexity of these tasks (OECD, 2008a).
47 See http://www.oecd.org/daf/competition/oecdrecommendationoncompetitionassessment.htm
48 See http://www.oecd.org/competition/assessment-toolkit.htm
49 OECD (2015b) found evidence that across all income groups positive changes in foreign sourcing are associated
with positive changes in the domestic value added in exports, thereby suggesting that a greater use of
foreign value added is complementary to a growing per capita domestic value added in exports. The
experiences of countries varied across different income groups. In high-income countries, increases in the
amount of domestic value added embodied in exports were driven mainly by a growing use of more
sophisticated primary and non-primary intermediates. In middle-income countries, gains were mostly
driven by increasing flows of inward FDI. In low-income countries, they were mostly driven by the
sophistication of non-primary intermediates.
50 These gains would be derived from full implementation of the new World Trade Organization Trade Facilitation
Agreement – further gains can be made by going beyond such measures.
51 Some governments provide for formal SME groups to solicit specific trade policy advice, such as the Industry
Trade Advisory Committee on Small and Minority Business (ITAC 11) in the United States, the SME
Envoy in the European Union, and the Canadian SME Advisory Board, whose mandate is to promote SME
needs and perspectives in government policies, including on trade issues, thus enabling SMEs to have a
voice and engage in a formal and systematic dialogue with government (OECD, 2008d).
52 Co-modal transport refers to the refers to the intelligent use of two or more modes of transport on their own and in
combination, in order to obtain the largest benefit possible from each mode utilised.
53 See http://www.oecd.org/sti/ind/measuringtradeinvalue-addedanoecd-wtojointinitiative.htm
54 See http://www.oecd.org/trade/facilitation/indicators.htm
55 See http://www.oecd.org/tad/services-trade/services-trade-restrictiveness-index.htm
56 Accounting, air transport, architecture, commercial banking, computers, construction, courier, distribution,
engineering, insurance, legal, maritime transport, motion picture, rail freight transport, road freight
transport, sound recording, telecommunications, television and broadcasting.
57 Including Chile, Colombia and Mexico of the PA. In the framework of the Country Programme with Peru, a
Workshop is proposed to support the country to identify restrictions in a number of service industries.
HOW TO FOSTER THE INTERNATIONALISATION OF SMES THROUGH THE PACIFIC ALLIANCE
INTEGRATION PROCESS
The fragmentation of production into global value chains (GVCs) opens up new possibilities for developing and emerging economies, allowing them to engage in
areas of production that were not previously feasible, and industrialise more rapidly. It also opens opportunities for the internationalisation of SMEs as suppliers of goods and
services to multinational enterprises.
Created in 2011, the Pacific Alliance is an ambitious regional integration project that aims at high policy standards. A key objective of the Pacific Alliance is to support the
internationalisation of Chilean, Colombian, Mexican, and Peruvian SMEs through direct exports, business associations, and their insertion into GVCs.
How to Foster the Internationalisation of SMEs Through the Pacific Alliance Integration Process builds on OECD expertise in SMEs, investment and trade policy. It
aims to support the Pacific Alliance in identifying policy levers to promote the internationalisation and greater integration of SMEs at both the intra-regional level
and into GVCs. It also outlines the support the OECD could provide in implementing
this agenda.