How to design Mongolia's SWF_Raabe.pdf
29
A primer on how to design Mongolia’s SWF Frank-Alexander Raabe Transforming mineral wealth into development: A primer on how to design Mongolia’s sovereign wealth fund Prof. Pomfret Central Asian Economies SAIS Bologna Center May 11, 2012 Submitted by Frank-Alexander Raabe
-
Upload
munkhnaran -
Category
Documents
-
view
28 -
download
2
description
Mongolia, Academic work
Transcript of How to design Mongolia's SWF_Raabe.pdf

A primer on how to design Mongolia’s SWF Frank-Alexander Raabe
1
Transforming mineral wealth into development: A primer on how to design Mongolia’s sovereign wealth fund
Prof. Pomfret Central Asian Economies SAIS Bologna Center May 11, 2012
Submitted by Frank-Alexander Raabe

A primer on how to design Mongolia’s SWF Frank-Alexander Raabe
2
Abstract
Mongolia currently experiences a resource boom that bears the potential to catapult the country to the high-income league of nations. This paper suggests that the creation of a sovereign wealth fund is a useful tool to address the inflow of foreign exchange and the multiple development challenges at the same time. In order to identify an optimal design of the sovereign wealth fund in terms of its contribution to development, 12 hypotheses are tested by means of a panel data analysis. This analysis distils the determinants of success in boosting development by looking at the patterns across sovereign wealth funds of 33 countries over 31 years. As a result, this first empirical study on the design of a sovereign wealth fund provides valuable advice on how to carefully design and manage the fund.
Acknowledgements
I sincerely thank Prof. Pomfret for his guidance in choosing the topic. As well, I am thankful for his support in developing the methodological approach for the econometric analysis in this paper. Furthermore, I express my gratitude to Prof. Sourdin for her patience and advice in explaining the handling of Stata statistic software. Moreover, I would like to thank my fellow student Kristoffer Bjarkefur for his advice on preparing the data in a suitable format.
Table of contents 1. Introduction: Mongolia’s mineral wealth and development challenge....................3
2. SWFs as driver of development: definition, objectives and development impact ..8
3. Theoretical framework .........................................................................................12
4. Methodology of the empirical study .....................................................................14
5. Results and policy implications............................................................................18
6. Conclusion ...........................................................................................................22
7. References ..........................................................................................................24
8. Annex...................................................................................................................27

A primer on how to design Mongolia’s SWF Frank-Alexander Raabe
3
1. Introduction: Mongolia’s mineral wealth and development challenge While other Central Asian nations rapidly embarked on economic reforms in the aftermath of the Soviet Union’s collapse, Mongolia’s transformation into a market economy has started only recently. During this rather long transition period, the vast mineral resources of this land-locked Central Asian country remained largely untapped. Mineral deposits comprise mostly copper and gold, but also coal, molybdenum, tin and tungsten. There are several reasons, why the mineral deposits have not been exploited so far. First, frequent natural disasters such as extremely cold winters called dzuds render mining activities difficult. Second, the remoteness of the mining areas impedes the infrastructure development necessary to supply a large mine with water and electricity. Third and most importantly, the Mongolian People's Revolutionary Party (MPRP), the leading power in the country’s young democratic setting, slowed down economic reforms liberalizing markets in the 1990s. This also impacted the exploitation of the country’s abundant mineral resources. Although the presence of the minerals in the Gobi-desert was well known, the policy environment did not encourage exploitations. Moreover, major foreign mining companies were discouraged from starting explorations although the country depends on these foreign partners that deliver the necessary mining equipment and technology. Already in the beginning of the 2000s one of the world’s largest copper and gold deposits was confirmed at Oyu Tolgoi (Pomfret, 2012), but negotiations with foreign mining companies were delayed by almost 10 years since Mongolia attempted to ensure majority (51 percent) shareholding.1 Meanwhile, prices for exported commodities such as copper and precious metals like gold were skyrocketing (Figure 1). Since Mongolia did not manage to set up an enabling environment that would allow foreign mining companies to invest, the country missed the opportunity to benefit from the first resource boom of the 21st century.
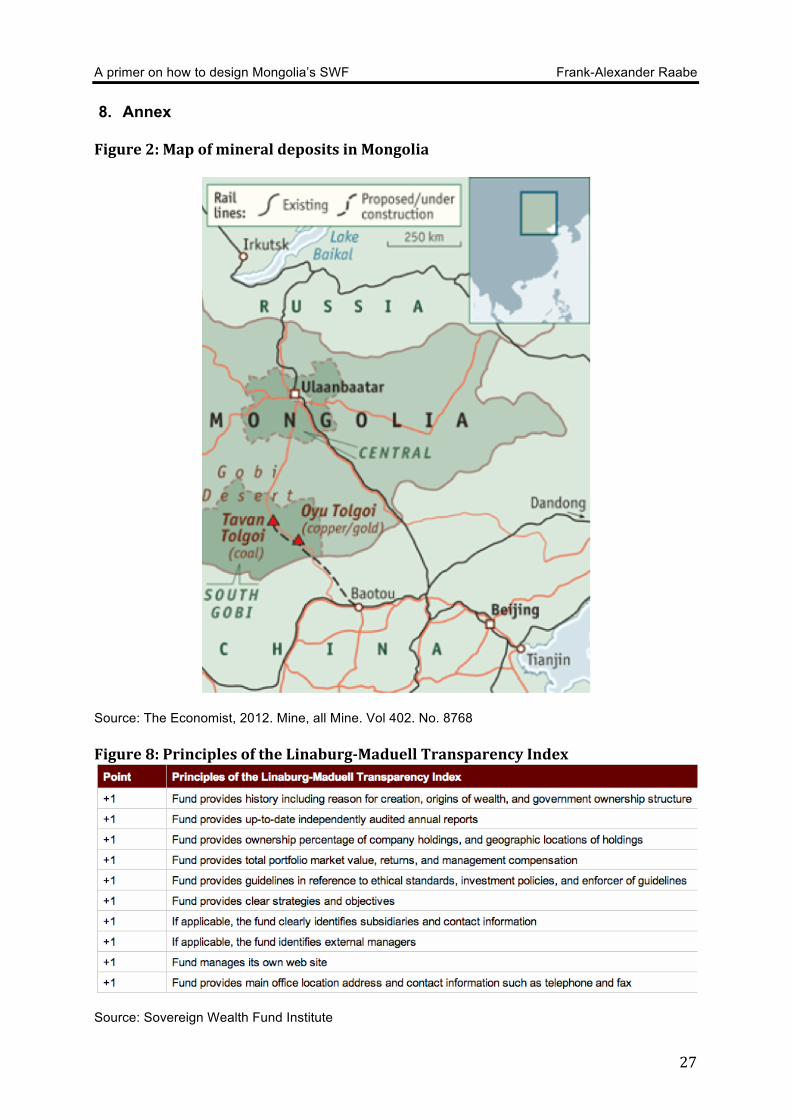
This situation changed in 2009 when the government and the Canadian mining company Ivenhoe Mines in cooperation with mining giant Rio Tinto signed an agreement to explore the Oyu Tolgoi area located in the South Gobi region, 550 km south of Ulaanbaatar and 80 km north of the Chinese-Mongolian border, hence close to the large Chinese market (Figure 2, annex). China is already Mongolia’s largest export market and accounts for 70 percent of its total exports (Batchuluun and Lin, 2010). In fact, the investment agreement took effect on March 31, 2010. The government acquired a 34 percent interest, while Ivenhoe Mines retained 66 percent interest. Oyu Tolgoi is supposed to be the world's largest undeveloped copper and gold exploitation project. According to Ivenhoe Mines, this mine contains about 40.5 million tons of copper and 1437.5 tons of gold to be exploited.2 The government delivers higher estimates and indicates around 64 billion tons of copper and 1600 tons of gold. By the end of 2011, construction works to gear up for exploitation were 70 percent complete. Once fully developed, the mine will produce more than 450,000 tons of copper and 11.3 tons of gold annually. The project is supposed to be worth US$ 4 billion and will account for 30 percent of the country’s GDP. As for total mineral wealth present in Mongolia mining experts assume that minerals worth US$ 1 trillion remain untapped until today as precious metals were identified in over 6171
1 According to Pomfret (2012), resource-rich countries should consider accepting a less favourable deal. Acknowledging the huge set up costs that foreign companies have to bear by dint of higher rewards would help to attract foreign direct investment (FDI) into the mining sector. Otherwise there is no other choice than to leave the minerals underground. 2 Source: http://www.ivanhoemines.com/s/Oyu_Tolgoi.asp?ReportID=379189; retrieved on May 8, 2012.

A primer on how to design Mongolia’s SWF Frank-Alexander Raabe
4
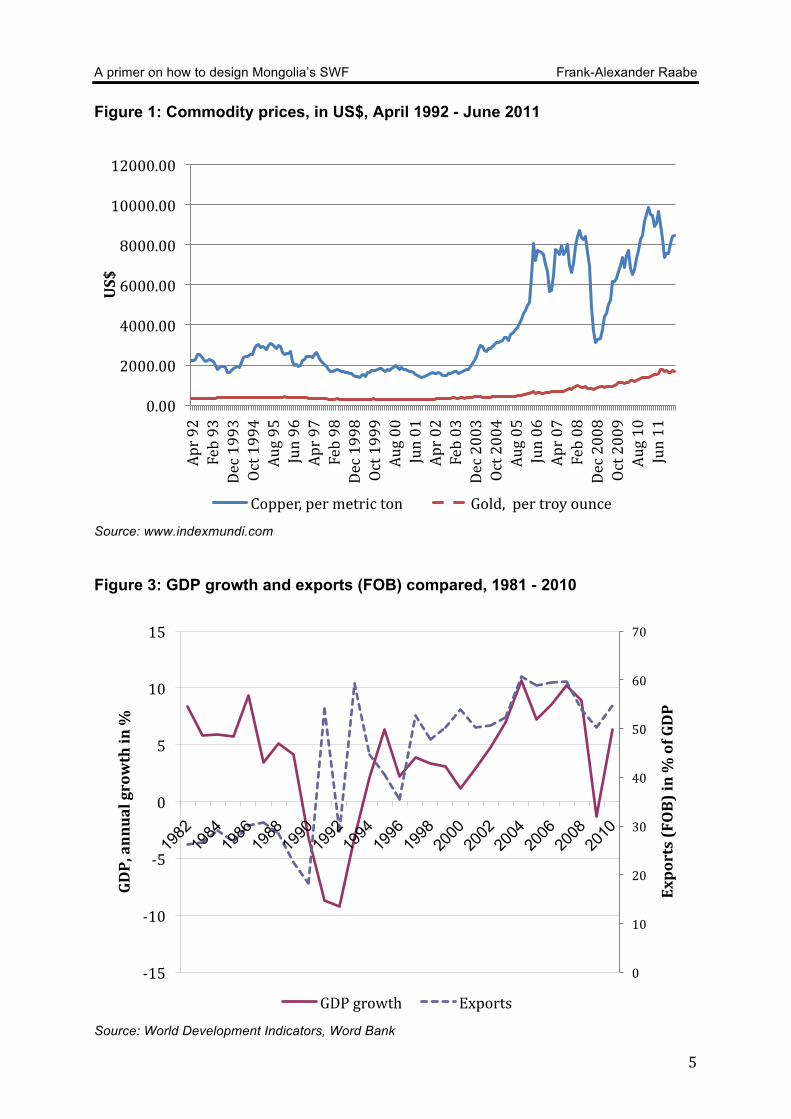
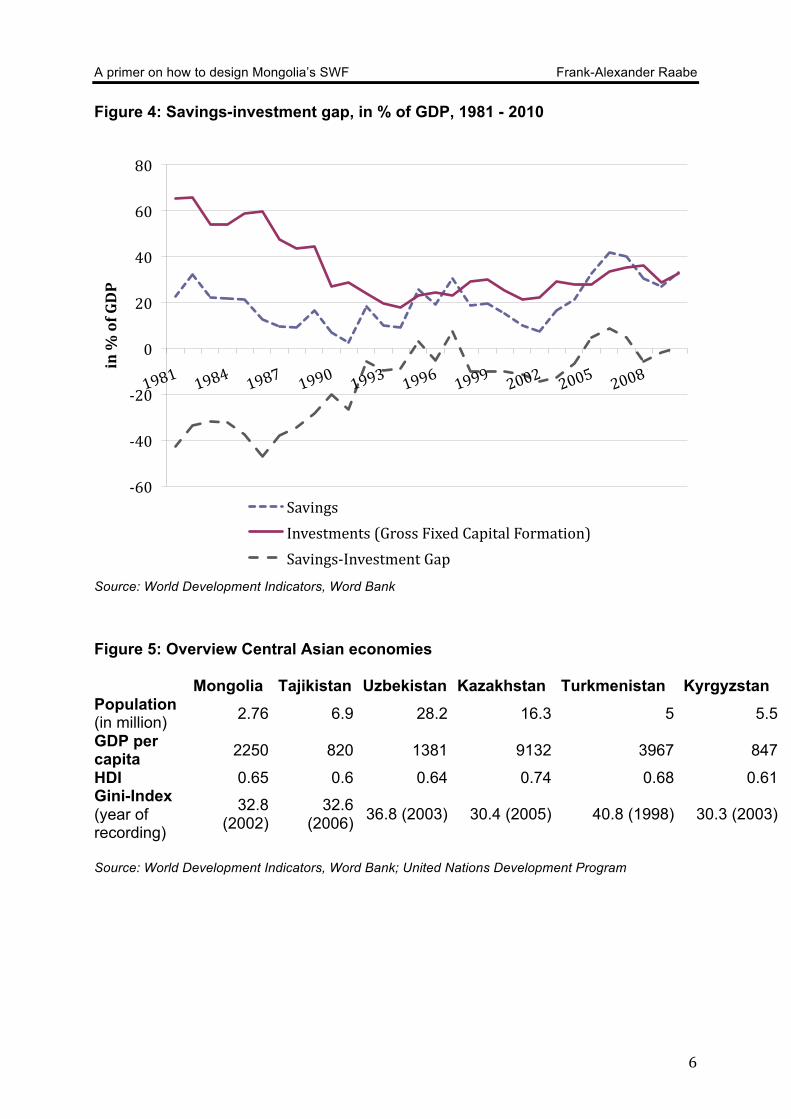
sites (Batchuluun and Lin, 2010). At current market prices the mineral wealth mentioned above translates into US$ 333,333 per inhabitant. Besides copper and gold other minerals are important, too, as the world’s largest coal reserves are also found in Mongolia’s Tavan Tolgoi mining area (Brookings, 2011). After the deal concerning Oyu Tolgoi kicked off an unforeseen boom of the mining industry, foreign direct investment (FDI) has soared. This has turned the mining sector into a major driver of GDP (Figure 3), already reaching a contribution share equalling 21.8 percent of GDP and further expanding. Likewise, 80 percent of total export value stems from the natural resources. Clearly, the rapidly growing mining business implies a stellar potential for economic growth in the coming years, maybe decades. This is why Renaissance Capital, a Russian investment bank, coined Mongolia’s nick-name as “Asian wolf”, following the nomenclature for other Asian high-growth countries in the 1990s. Given Mongolia’s low level of development progress, the export revenues generated from mining have the potential to propel the country on a high-growth path, producing a relief for the shortage of capital (Figure 4) and eventually favouring human development. The IMF conservatively projects economic growth at 14 percent between 2012 and 2016. Given the enormous amounts of untapped natural deposits and the relatively small population of 3 million people, the country has the potential to become the next Brunei or Dubai, two other small nations whose economic success depends on natural resources (The Economist, 2012). In many ways, the mining boom makes Mongolia resembling Australia in the 1930s (Brian Fisher as quoted in The Economist, 2012). So, this mining boom could mark the beginning of a development success story. However the country still ranks 100 out of 169 countries covered by the human development index (HDI) issued by the United Nations Development Program (UNDP). 35.2 percent of Mongolians lead a life below the national poverty line. GNI per capita amounts to US$ 1870. Thus, the country classifies as a lower middle-income country, but remains behind Kazakhstan and Turkmenistan as one of the poorest among the Central Asia economies3 (Figure 5). In fact, Mongolia left the lower income-level fairly recently during the last decade. Compared to the 2004 level, GNI per capita already more than tripled from US$ 640 to today’s level.
3 The World Bank categorizes countries as follows: low income: US$1,005 or less; lower middle income: US$1,006 - US$3,975; upper middle income: US$3,976 - US$12,275; and high income: US$12,276 or more. Source: World Bank
A primer on how to design Mongolia’s SWF Frank-Alexander Raabe
5
Figure 1: Commodity prices, in US$, April 1992 - June 2011
Source: www.indexmundi.com Figure 3: GDP growth and exports (FOB) compared, 1981 - 2010
Source: World Development Indicators, Word Bank
0.00
2000.00
4000.00
6000.00
8000.00
10000.00
12000.00 Apr 92
Feb 93
Dec 1993
Oct 1994
Aug 95
Jun 96
Apr 97
Feb 98
Dec 1998
Oct 1999
Aug 00
Jun 01
Apr 02
Feb 03
Dec 2003
Oct 2004
Aug 05
Jun 06
Apr 07
Feb 08
Dec 2008
Oct 2009
Aug 10
Jun 11
US$
Copper, per metric ton Gold, per troy ounce
0
10
20
30
40
50
60
70
-‐15
-‐10
-‐5
0
5
10
15
Exports (FOB) in % of GDP
GDP, annual growth in %
GDP growth Exports
A primer on how to design Mongolia’s SWF Frank-Alexander Raabe
6
Figure 4: Savings-investment gap, in % of GDP, 1981 - 2010
Source: World Development Indicators, Word Bank Figure 5: Overview Central Asian economies Mongolia Tajikistan Uzbekistan Kazakhstan Turkmenistan Kyrgyzstan Population (in million) 2.76 6.9 28.2 16.3 5 5.5
GDP per capita 2250 820 1381 9132 3967 847
HDI 0.65 0.6 0.64 0.74 0.68 0.61 Gini-Index (year of recording)
32.8 (2002)
32.6 (2006) 36.8 (2003) 30.4 (2005) 40.8 (1998) 30.3 (2003)
Source: World Development Indicators, Word Bank; United Nations Development Program
-‐60
-‐40
-‐20
0
20
40
60
80
in % of GDP
Savings Investments (Gross Fixed Capital Formation) Savings-‐Investment Gap
A primer on how to design Mongolia’s SWF Frank-Alexander Raabe
7
Despite the urgent need to boost economic development and to let Mongolians benefit from the mineral wealth under their feet, the exports proceeds that will soon flood into the country could have some major drawbacks. The most important concern is how to deal with the immediate impact of the imminent inflow of foreign exchange. This effect has to be sterilized in order to prevent a high inflation rate. In Mongolia, the latter already stands at 10 percent.4 Moreover, history is full of examples of resource curses in resource-rich countries such as in Nigeria, Russia or Azerbaijan. The possibly emerging Dutch disease refers to an appreciation of the exchange rate due to the capital inflow5, which leads to a loss of competitiveness in other sectors and possibly a Balance-of-Payments (BOP) crisis due to cheapened imports. This also would render attempts for diversification of Mongolia’s economy more difficult. Furthermore sharply increasing windfall gains from resource exploitation could lead to a time-inconsistency problem, as politicians or other elites with de facto power (Acemoglu, 2004) might increase spending in favour of their constituencies. As elections are coming up on June 28 of this year, increased government spending has been reported as the incumbent government plans to distribute US$ 1060 for every citizen. The cash distribution program is to be financed by a US$250 million pre-payment from the Oyu Tolgoi project (Bloomberg, 2009).6 This proves that there might be a lack of discipline not to use scarce resources for such political purposes. The central issue here is the intertemporal time-preference: Should the government spend the windfall gains now (rentism) or later, i.e. to let future generations benefit from today’s proceeds received for resource exports? Apart from this intergenerational problem, should the government consider conditional cash-transfer programs instead of investment in infrastructure and provision of public services such as health and education? A politically particularly sensitive area of debate is the targeting of such cash-transfers since inequalities have to be taken into account. The Gini-index measuring such inequality stands at 0.36 in Mongolia. Compared to other Central Asian economies, this is relatively high (Kazakhstan: 0.26), meaning that targeting of any cash transfers is of eminent importance. Taking the leaf out of the book of other resource-abundant countries such as Chile or many Middle Eastern nations, the Mongolian government might consider establishing a sovereign wealth fund (SWF) as a financial instrument to mitigate the problems mentioned above, especially the intergenerational challenge. In fact, in 2008 Mongolia’s parliament agreed on a National Development Strategy that comprises the creation of a SWF. The suggested name “Human Development Fund” also raises hopes that the savings from export revenues will be used for development purposes. This would be in line with the government’s aspirations to transform the economy to join the league of developed nations by 2020. A part from the government rhetoric, the creation of Mongolian SWF would mark the first time in the nation’s history that citizens would be legally eligible to own a share of the mineral wealth. The seed capital is supposed to come from the Oyu Tolgoi project, which is estimated to generate US$30 billion in tax revenue over the next 50 years. In light of these concrete plans to establish a Mongolian SWF, this paper addresses whether a SWF is a suitable instrument to tackle the questions raised above and under which conditions the windfall gains from the resource boom are 4 2009 data retrieved from the World Development Indicators database, World Bank 5 The foreign currency is used to buy domestic currency and therefore bids up the value of the domestic currency. 6 Due to lack of funds, the cash program has now been scaled back to US$92 per citizen (Brookings, 2012).
A primer on how to design Mongolia’s SWF Frank-Alexander Raabe
8
managed best to spur development. For this purpose, section 2 presents the SWFs’ general characteristics, development impact and appropriate case studies. Section 3, 4 and 5 investigate by means of a panel-data analysis the ingredients for a policy recipe that enhances the fund’s development impact. Section 3 introduces the theoretical framework Section 4 explains the methodology. Section 5 presents the results, applies these to the case of Mongolia and highlights specific challenges. Section 6 concludes. The approach described in this agenda contrasts - to the best of the author’s knowledge - with the literature on SWFs. So far research focuses on SWF’s impact on the firms the funds invest in (e.g. Bertolotti et al., 2010 or Chhaochharia and Laeven, 2009). Dewenter et al. (2009) look at 196 purchases and 47 sales of stock by SWFs and find that stock prices rise by 1.7 percent upon announcement and sales trigger a drop by 1.3 percent. Other studies deal with investment patterns and internal management structures (Bernstein et. al, 2009). For instance, the latter paper analyzes the private equity investment strategies across SWFs and the relationship to the fund’s organizational structure and finds that “they [SWFs] are more likely to invest at home when domestic equity prices are higher, and invest abroad when foreign prices are higher“. Many studies are driven by fears that foreign SWFs could be abused by issuing countries for strategic national goals by purchasing assets abroad and thus exercising economic control over another government. However, this paper looks at SWFs from another angle. It examines the development impact on the issuing country and distills by means of a panel analysis determinants that enhance the SWFs potential to boost development. The author identified only two research papers that qualitatively access the development impact of SWFs on the issuer and discuss the general design. Allen and Caruana (2008) elaborate on management transparency, mandate, surveillance and best practices. However, none of these papers undertakes a quantitative study looking at past trends of other SWFs in order to draw conclusions on which country-specific, non-financial market determined, conditions are conducive for the creation and high growth-enabling impact of a SWF. 2. SWFs as driver of development: definition, objectives and development
impact SWFs are not a new phenomenon. The first SWF was created by the British colonial administration for Kuwait in order to save the revenues from oil exports for future generations and thereby reduce Kuwait’s dependence on finite fossil fuels. Since then further SWFs have appeared in two waves. The first wave took place in the mid-1970s when Singapore’s Temasek holdings and the Abu Dhabi Investment Authority were launched. Until the year 2000 only about 10 SWFs existed. Another 40 mushroomed during the last decade. In this sense, Mongolia would follow a broader trend. Today, the biggest funds comprising 44 percent of total SWF volume are located in the Middle East based on the petrodollars generated by Abu Dhabi, Dubai, Kuwait, Oman, Qatar and Saudi Arabia. The total volume of assets managed by SWFs exceeds assets managed by hedge funds (US$ 1.9 trillion). SWFs account for almost one third of assets held by sovereigns (Lipsky, 2008). According to Jen (2007) from the investment bank Morgan Stanley, SWFs can be defined as follows: “A government investment vehicle which is funded by

A primer on how to design Mongolia’s SWF Frank-Alexander Raabe
9
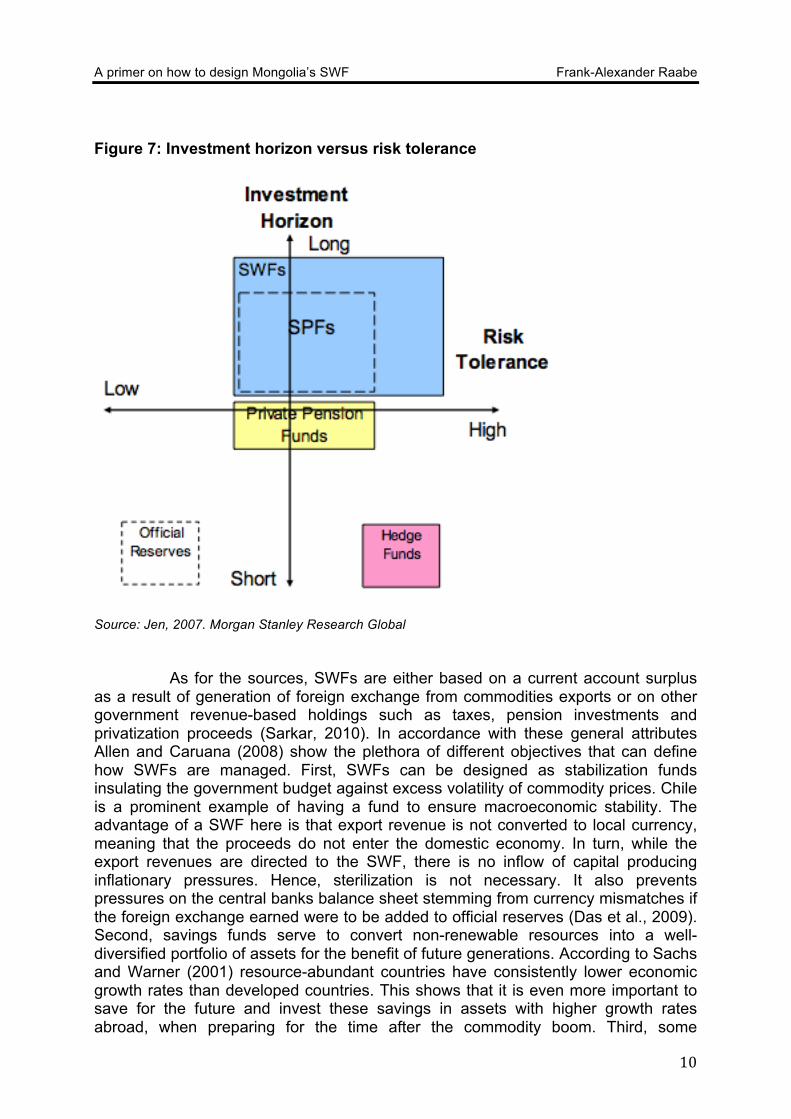
foreign exchange assets, and which manages these assets separately from official reserves”. Sarkar (2010) specifies six properties of SWFs. First, they are state-owned or -controlled. Second, they are managed separately from official reserves, although as in the case of South Korea and Norway this can be ambiguous. In both countries the fund’s assets could be classified as official reserves. A special provision allows for withdrawals in case of a BOP-crisis when a trade deficit needs to be financed in the short run. Third, SWFs are exposed to foreign currencies, implying that they are exposed to exchange rate risk. However, investments do not need to be 100 percent held in foreign assets. Singapore’s Temasek Holdings and Malaysia’s Khazanah Nasional BHD also invest in domestic assets. Fourth, in contrast to pension funds, SWFs have no contingent liabilities (Figure 6). Fifth, their risk tolerance is high since, sixth, they have long-term investment horizons, often decades. In contrast, official foreign reserves have short investment horizons and a lower tolerance for credit risk, as they are constantly needed for monetary policy purposes such as open market operations (Figure 7). This is why they are mostly held in sovereign bonds in liquid markets (Jen, 2007). Figure 6: Liabilities versus foreign currency exposure
Source: Jen, 2007. Morgan Stanley Research Global
A primer on how to design Mongolia’s SWF Frank-Alexander Raabe
10
Figure 7: Investment horizon versus risk tolerance
Source: Jen, 2007. Morgan Stanley Research Global As for the sources, SWFs are either based on a current account surplus as a result of generation of foreign exchange from commodities exports or on other government revenue-based holdings such as taxes, pension investments and privatization proceeds (Sarkar, 2010). In accordance with these general attributes Allen and Caruana (2008) show the plethora of different objectives that can define how SWFs are managed. First, SWFs can be designed as stabilization funds insulating the government budget against excess volatility of commodity prices. Chile is a prominent example of having a fund to ensure macroeconomic stability. The advantage of a SWF here is that export revenue is not converted to local currency, meaning that the proceeds do not enter the domestic economy. In turn, while the export revenues are directed to the SWF, there is no inflow of capital producing inflationary pressures. Hence, sterilization is not necessary. It also prevents pressures on the central banks balance sheet stemming from currency mismatches if the foreign exchange earned were to be added to official reserves (Das et al., 2009). Second, savings funds serve to convert non-renewable resources into a well-diversified portfolio of assets for the benefit of future generations. According to Sachs and Warner (2001) resource-abundant countries have consistently lower economic growth rates than developed countries. This shows that it is even more important to save for the future and invest these savings in assets with higher growth rates abroad, when preparing for the time after the commodity boom. Third, some

A primer on how to design Mongolia’s SWF Frank-Alexander Raabe
11
countries such as China, Abu Dhabi and Qatar run a reserve investment corporation to increase returns on reserves by investing abroad. Fourth, other funds have a specific development purpose, e.g. in support of health and education. The last category is pension funds to support the budget in serving pension liabilities. Norway’s SWF is an example for the latter. Often, funds are operated with regard to several of these objectives. As aforementioned, few pieces of literature are devoted to the analysis of the SWF’s impact on the issuing country. Also, most SWF emerged only recently, suggesting that it might be too early to draw final conclusions. As far as Mongolia is concerned, a cornucopia of objectives will apply to its SWF under way, since it not only transforms finite mineral wealth into financial assts. It also is supposed to achieve development objectives by means of a more diversified asset portfolio and higher returns compared to just relying on export revenues to finance development, since this is the actual purpose of turning illiquid natural resources into liquid financial assets. The fund could also be tapped in times of weak terms of trade and to reduce dependence on export revenues. In the long run the accumulated savings of the fund could serve to undertake investments that allow for a transformation of the Mongolian economy once resources are depleted as well as to finance adjustment costs on its development path. The SWF’s macroeconomic stabilization function stated above, i.e. smoothing the government budget and reducing inflationary pressures, certainly favours the country’s development as economic agents can plan ahead more reliably. This is particularly important for the reinforcement of the private sector growth since entrepreneurs intending to undertake long-term investments rely on a stable macroeconomic environment. Remarkably, the impact on inflation is more pronounced in commodity-rich countries such as Mongolia as compared with non-commodity based SWFs (Selfin et al.,2011). Furthermore in the short run a SWF prevents a Dutch disease effect, as foreign currency does not flow into the country. However, Shabsigh and Ilahi question this (2007). While they find that oil funds are associated with reduced inflation, they report that the negative relation between the presence of an oil fund and the volatility of the exchange rate is statistically weak. However, this might be specific for this commodity only and therefore not apply to Mongolia because Mongolia does not produce oil. The following three hypotheses that are empirically proven by Selfin et al. (2011) also emphasize the importance of a SWF for development. First, foreign investors perceive the country more favourably, as an established SWF is a signal of fiscal prudence. The reason is that the risk of default is lower as the SWF could always be raided to pay for the foreign debt if a credit event occurred that results in a sharp depreciation of the domestic currency. Second, SWF can boost the transparency of financial policy making and help to fight corruption under the condition that the creation of an SWF entails a clear rules base. As foreign exchange is channelled into the fund, there are fewer incentives for politicians to use the proceeds for other than development purposes. Third, a SWF’s administration requires highly skilled and trained finance personnel as well as efficient institutions to cope with the dynamics of international financial markets. This may not only spur financial sector development but also have positive spill-over effects into the entire public administration as demonstrated by the case of Singapore. There, Tony Tan managed Tamasek Holdings before becoming President. Aizenmann and Glick (2009) give cause for serious concern that a SWF might decrease the official reserves because governments start to channel a larger share of official reserves into SWFs. In turn, this would make those countries’
A primer on how to design Mongolia’s SWF Frank-Alexander Raabe
12
financial system less resilient when a crisis requires extraordinarily huge amounts of domestic currency in short time. As the SWF aims at long term investments, it might be difficult to withdraw the committed capital as fast as necessary. However, a panel regression of the determinants of foreign reserves relative to GDP by Aizenmann and Glick does not confirm that a SWF leads to lower levels of foreign reserves. As demonstrated by this overview of recent literature, during the commodity boom it seems a good idea to put money aside for the rainy day as well as economic and social development in the long run. Creating a SWF makes even more sense for Mongolia in light of rising commodity prices (Figure 1). However, the literature keeps policy makers in the dark about which variables determine a SWF’s effectiveness in contributing to development and to which extent a SWF can spur development. Knowing these determinants and magnitudes of influence would allow Mongolian policy makers to tailor make the design of the Mongolian SWF to the country’s developmental challenges. The existing literature covers some qualitative assessments of SWFs’ management only and will be referred to in section 5. Empirical, quantitative studies have not been produced yet. In order to satisfy the information needs of Mongolian policy makers and answer the questions raised previously, it is imperative to look at past trends of other SWFs and distil insights applicable to the design of the planned Mongolian SWF.
3. Theoretical framework The starting point to draw these conclusions is to ask which conditions need to be set up to render the SWF effective in terms of enabling development. In the following the performance of the SWF is judged by this effectiveness. The identification of such pre-established conditions that lead to a high-performing SWF can be best studied when looking at the patterns of SWF performance across those countries that already established a SWF. Therefore, several hypotheses will be tested with regard to these enabling conditions. As outlined above, the existence of a SWF attracts foreign investors as the fund signals fiscal discipline. Nevertheless the flow of FDI also depends on the openness of the economy, e.g. the absence of capital controls. This gives rise to the first hypothesis:
1) A more open economy increases the SWF’s performance. Since the establishment of a SWF depends on a current account surplus, a more open economy is more likely to generate a surplus and hence foreign exchange to be channelled to the SWF. In turn, when more foreign exchange is available for the fund, a higher degree of portfolio diversification can be achieved reducing the volatility of the funds’ return on investment. Likewise, a larger investment portfolio yields higher absolute returns. This implies that the fund’s development performance increases with the size of assets managed by the fund. The second hypotheses is derived from this:
2) The SWF’s performance is dependant on the size of assets. Next, is there a relationship between the income level achieved upon the creation of the fund and its performance? For instance, low-income countries such as

A primer on how to design Mongolia’s SWF Frank-Alexander Raabe
13
the Republic of Congo could not benefit from the fund’s savings as much as countries on a higher income level. The reason is that low-income countries’ economies are mostly based on subsistence agriculture. So, even when taking advantage of the savings accumulated by the SWF it might take generations until manufacturing industries are created that allow for a higher growth path. In this sense a SWF might require the attainment of a certain threshold of economic development. What’s more, since developing countries usually suffer from weak institutions it seems plausible that a certain income threshold as a proxy for efficient institutions is required before starting a SWF. Otherwise the fund might suffer from mismanagement or theft by corrupt government officials. Hence, the third hypothesis is:
3) The higher the income level the more a country benefits from its SWF. For the same reason a more sophisticated and better enforced rule of law and low corruption levels should have a positive effect on a SWF. High corruption and weak rule of law probably leads to higher political discretionary power over the fund. Populist spending policies at the expense of the SWF’s savings do not favour development. This gives rise to the following two hypotheses:
4) Strong rule of law improves the SWF’s development impact. 5) The lower the perceived corruption the better the SWF’s performance
Besides economic development, a higher level of human development as defined by Sen and Haq (1990) could lead to higher development effectiveness of the SWF. Managing such a fund requires a well-educated and trained workforce. Also the SWF is likely to perform better when the population is healthy. For instance, due to high HIV levels in Africa a large part of the population there cannot take advantage of new jobs created if money was withdrawn from the fund and invested in the economy. This results in two hypotheses:
6) The SWF shows better performance when education levels are high. 7) The SWF’s impact depends on the health level of the workforce.
Should the SWF’s performance depend on a country’s level of human development, this also could be approximated by the amount of official development assistance that a country receives. The lower the level of human development, the more aid is usually required. This leads to the hypothesis:
8) The higher the aid received, the lower the level of development and likewise the impact of the SWF.
Besides these conditions related to a country’s state of development in general, the fund’s profile itself could influence the performance. As introduced earlier, a fund can be commodity or non-commodity based. In line with Sachs and Warner’s (2001) argument that commodity-based economies enjoy lower growth rates, the following hypothesis will be tested in order to determine whether this difference in commodities versus non-commodity based growth matters.
9) The commodity-based SWF’s have a smaller development impact.

A primer on how to design Mongolia’s SWF Frank-Alexander Raabe
14
Moreover, the age of a SWF could matter for its performance since SWFs that were established decades ago have probably accumulated larger savings and are managed in a more professional manner. Also, due to the long-term investment horizon of SWFs, older funds are more likely to already have yielded returns that can be invested domestically for development purposes. The hypothesis is therefore:
10) The older the fund the higher is the development impact. Besides the nation-wide corruption levels captured by hypothesis 4), the transparency of the fund’s management itself should lead to a better performance. Higher public disclosure standards that hold the managing institution accountable puts pressure on management to perform better and prevent theft. Thus:
11) An increased SWF’s transparency leads to higher performance. Finally, the study has to account for social, cultural and economic peculiarities in different regions that could influence the performance of a SWF. For instance, income levels as well as education and health care provision is systematically lower in Africa. The following hypothesis can be derived:
12) SWFs of different regions perform systemically different.
4. Methodology of the empirical study The hypotheses presented in section 3 are tested using a panel data regression, i.e. cross-country-cross-sectional-OLS regressions, with the dependant variable being the SWF’s performance from 1980 to 2010. As emphasized in section 3 the performance refers to the SWF’s potential as a driver of economic development. The rationale for employing a panel data analysis is the following. The advantage of a panel analysis is that it takes the influence of observations in the previous periods on current observations into account. Since the change in the SWF’s performance as a reaction to the conditions hypothesized in section 3 occurs time-delayed, a panel data analysis is the appropriate tool to account for time. Another advantage is that a panel analysis avoids unobserved heterogeneity and reduces collinearity since the degrees of freedom increase (Hasio, 2003). Also a panel analysis allows exploring better whether the proposed linkages are representative and significant for a large sample.
The panel consists of 33 countries that established their SWF between 1953 and today (Figure 8: overview SWFs). In order to obtain representative results the list comprises developed as well as developing and emerging market countries.7 The panel used for the analysis is unbalanced, meaning that not for all cross-sections the observations are available for the same periods due to lacking data. This is why 168 observations are finally left. However, as long as observations are missing randomly and not systematically, there is no severe implication for the quality of the results (Hasio, 2003). Since no data could be retrieved for the regressors “rule of law” and
7 Originally this list also included the US federal states Alabama, Texas and Alaska that all have oil-funds. However, data required for the subsequent analysis is not available on the state level.

A primer on how to design Mongolia’s SWF Frank-Alexander Raabe
15
“health expenditures” for the time prior to 1996, a separate regression named “reduced set” was run in order to consider the systematic lack of data.
The initial challenge in this analysis was the measurement of the SWFs’ performance in driving development. It would be intuitive to assume that this performance is best proxied by the return on the SWFs’ investment (ROI). Though, data on the ROI of individual funds are not published either due to lack of reporting, secrecy or simply because they are not publicly listed. As a result of this lack of data, a two-step procedure is applied. In the first step the performance measurement is derived. The second step is the actual regression to identify the determinants of a SWF’s performance.
The first step requires a regression of a variable measuring development on a set of explanatory variables. Consequently, the residual, i.e. the difference between the predicted value from this regression and the actual value of the development variable, serves as a proxy for the impact of a SWF. Admittedly, this residual could capture other factors than the SWF, but due to lack of data to measure the SWF performance directly this concern has to be neglected. In the second step the residual is regressed on a series of independent variables in accordance with the hypotheses of section 3. As for the first step in this procedure, the development variable originally chosen was HDI8. However, due to lack of data for many years and countries in the panel, using HDI would have reduced the number of observations even further in this unbalanced panel. Although being too narrow for the multifaceted process of human development economic growth functions as a proxy for development, whereas economic growth is just a mere means of human development instead of an end in itself. It is worth noting that in contrast to human development economic growth does not capture the notion of freedom, entitlements and choice (Sen and Haq (1990) as quoted in Sharma and Gani, 2004). Economic growth is measured by GDP, although it does not take non-residents’ state of well-being into account. GDP is expressed in logarithmic form, ln_gdp. As a result of a Hausman-test specification test, a fixed-effects model applies. The regression function estimated is: ln_gdp = ß0 + ß1*gdp_l5ct + ß2*health_expct + ß3*edu_expct + ß4*health_educt +
ß5*trade_gdpct + ß6*aidct + ß7*corruptionct + ß7*africadct + ß8*latamdct + ß9*asiadct + εct
(c: country-‐cross-‐section, t: time)
(1)
The first explanatory variable is GDP9, which is applied with a lag of five years since changes in current GDP are likely to depend on past economic growth.
8 Developed by Sen and Haq in 1990, the HDI is a widely used measure of well-being. It therefore serves as an indicator for a country's development progress. The indicator captures improvements in life expectancy, literacy and education. The index takes the measurement of the average achievements in these three core areas of human development (Sharma and Gani, 2004). The essential qualities of human life are firstly a long and healthy life measured by life expectancy at birth. Secondly knowledge and education is included and approximated with two-thirds weight by the adult literacy rate and with one third by the combined primary, secondary and tertiary gross enrolment ratio. Thirdly, a decent standard of living is measured by economic growth represented through GDP per capita. Actually the GNP should be utilized instead of the GDP since the GDP also takes into account the non-residents. But due to data availability GDP is still used. In the next step UNDP calculates an index for each of the three qualities, while a value between zero (lowest) and one (highest) indicates the performance. The HDI is then composed by the three indices with a weight of one third each. 9 Source: World Development Indicators, World Bank

A primer on how to design Mongolia’s SWF Frank-Alexander Raabe
16
Originally, lags were supposed to be constructed for all regressors, but again data availability would have led to too few observations. Health and education expenditure10 as a share of GDP not only reflect the public services provided in key areas for development, they also stand for lagged HDI11 which could not be included due to data availability. An interaction term combining both of these variables is introduced next in order to increase the explanatory power of the model. The aid as share of GDP frames the effect of official development assistance provided. The openness of the economy is proxied by the trade volume to GDP. Trade is measured as the sum of FOB exports and imports12 despite of the concern that trade volume is also driven by the competitiveness of a country or distance to market. A corruption13 indicator reflects the efficiency of institutions, since paying bribes increases transaction costs in an economy. An indicator framing the rule of law was not included, since data is only available starting in 1996. This would have led to fewer observations due to the nature of the unbalanced panel. As this regression is just the first step, this reduction in observations deteriorates the quality of the results by generally increasing the standard errors14. This is not acceptable because the standard error of the residual term should be as small as possible εct. Finally, three zero-one dummies capture special regional characteristics in Africa, Latin America and Asia. In addition year-specific dummies are created to control for special events in single years such as coups undermining the political stability or recessions. Having obtained the residual as a proxy for the SWF’s performance in the first step, in the subsequent step the error-term is regressed on variables possibly impacting the SWF’s performance. The primary regression function estimated before controlling for various variables looks like this: resid(ε) = ß0 + ß1*gdpct_l5 + ß2*health_expct + ß3*edu_expct + ß4 * health_educt +
ß5*trade_gdpct + ß6*aid + ß7*corruptionct + ß7*africadct + ß8*latamdct + ß9*asiadct + ß10*size_assets_gdpct + ß11*ruleoflawct + ß12*corruption_assetsizect + ß13*corruption_commodityct + ß14*commodity_ruleoflawct + ß15*commodity_metalsdct + ß16*linaburgmodellct + ß17*10yrct + ß17*20yrct + εct
(c: country-‐cross-‐section, t: time)
(2)
In addition to the regressors included in the first regression, several other SWF-specific variables in line with the hypotheses put forward are included in the second step. The asset size15 as a share of GDP is the 10th variable added. Since data only is available for the current asset size managed by each SWF, the asset
10 ibid 11 ibid 12 ibid 13 According to the World Bank, the indicator “[r]eflects perceptions of the extent to which public power is exercised for private gain, including both petty and grand forms of corruption, as well as "capture" of the state by elites and private interests”. Source: The Worldwide Governance Indicators, 2011 Update, World Bank 14 Increasing the number of observations decreases the standard error of the independent variables assuming that the variation of the newly added observations equals the variation of the previously included observations. 15 Source: Sovereign Wealth Fund Institute

A primer on how to design Mongolia’s SWF Frank-Alexander Raabe
17
size is assumed to be time-invariant. Circumventing the data availability problem this way certainly misses out on the change of the asset size over time. However, the asset size is mostly determined by an economy’s ability to generate current account surpluses that are channelled into the fund. In turn, the surpluses depend on further factors such as the size of the economy and its competitiveness. These factors are less likely to change over time. This implies that the relative magnitude of the asset size in comparison to the asset size of other funds does not change because the underlying determinants remain constant. When assuming that the relative size of each SWF as compared to all SWFs’ assets did not change and assuming that the current relative size of each SWF’s assets was similar in the past, the assumption of a time-invariant asset size is justifiable. Corruption is included again. However, this time it does not reflect the level of corruption in the entire economy. Instead it measures the discipline the fund is managed with. High corruption levels exist in politico-social environments in which theft and opaque activities of the fund are not considered problematic. A variable accounting for the rule of law16 mirrors the political system. Due to the varying degrees between different political systems and the various forms of sub-categories of political systems it is difficult to determine whether a country’s political system qualifies e.g. as a fully-fledged democracy in accordance with Western standards. What matters more, though, is the fact that the rule of law is systematically higher in certain political systems such as in democracies. The reason is that the risk for politically motivated spending of the fund’s savings is lower in a democracy because voters hold politicians in check. Furthermore the regressor commodity_metalsd is a dummy for the type of source of funds17. The dummy equals 1 if the export revenues put into the fund stemmed from commodities and 0 otherwise. Two other dummies reflect the age of the fund18, whether it is founded more than 10 or more than 20 years ago. The variable “linaburgmodell” is the transparency index invented by Linaburg and Maduell.19 Besides regional dummies as in the previous regression, interaction terms are introduced: “commodity_ruleoflaw” is entered to control for the possibly opaque management of resource-based funds, especially in developing countries. “corruption_assetsize” helps to identify a connection between the size of assets and the level of corruption. Intuition suggests that the incentive for officials to be corrupt is the higher the more is at stake. For the same reason “corruption_commodity” helps to investigate whether officials are more corrupt if the fund was commodity-based. In contrast to financial sources such as pension payments, corrupt behavior might be facilitated in case of commodities, for instance because it is easier to manipulate export receipts. Finally, year-specific dummies allow controlling for the volatility of SWFs’ returns, which could be well influenced by stock-market volatility if a fund invested in corporate shares. Since feedback linkages cannot be taken account in a panel data analysis they are not considered here. Nevertheless, it is worth noting that the performance of
16 According to the World Bank, this variable “[r]eflects perceptions of the extent to which agents have confidence in and abide by the rules of society, and in particular the quality of contract enforcement, property rights, the police, and the courts, as well as the likelihood of crime and violence.” . Source: The Worldwide Governance Indicators, 2011 Update, World Bank 17 Source: Sovereign Wealth Fund Institute 18 ibid 19 Source: The index is based on ten principles depicting SWF transparency to the public (Figure 8, annex). Each principle adds one point of transparency to the index rating. A minimum of 8 points is required for an adequate transparency. Source: Sovereign Wealth Fund Institute
A primer on how to design Mongolia’s SWF Frank-Alexander Raabe
18
a SWF also influences the explanatory variables such as economic growth and rule of law as outlined in section 2. A Hausman test has been conducted to determine the preferred model, either fixed- or random effects model. Although the result of the Hausman test suggests a fixed-effects model the results of the random-effects model seem more useful. The reason is that R-squared is highest in the random model, meaning that the regressors described above together explain 92.6 percent of the variation of the SWF-performance. Moreover, a fixed-effects model automatically creates dummy variables that are needed in order to differentiate the cross-sections. In combination with the other dummy variables defined as independent variables they effectuate multicollinearity, so that the impact of these dummies cannot be observed in a fixed-effects model.
5. Results and policy implications
Running the above-specified regression yields several findings, which shed light on the determinants of a SWF’s performance. The results are reported in the annex (Figure 9). The regression on the residual, the proxy for the SWF’s performance, reveals that the trade volume is significant at the 1 percent significance level. This is in line with the first hypothesis and suggests that Mongolia should further commit to liberalizations of trade and financial flows on its trajectory towards a market economy. The caveat remains that this suggestions is associated with a better performance of the SWF only, since such liberalizations might have side-effects on the inequality and income levels of the poor.
The asset size of a SWF enters significant at the 5 percent level and negatively in both the fixed- and random-effects models. In the “SWF variables only” regression, asset size is significant at the 0.1 percent level. This is good news for Mongolia, as the country would benefit from the fund already from the beginning on, when accumulated savings are still low.
As hypothesized, lagged GDP has a positive impact on the SWF’s performance. Lagged GDP is significant at the 1 percent level in “reduced set” and at the 0.1 percent level in the random-effects model.
Surprisingly, rule of law and the associated interaction terms are not significant in any of the regressions. The same is true for corruption. Again, also the interaction terms combining corruption with the asset size and the source of funds (commodity vs. non-commodity) prove insignificant. This might be because secrecy plays an important role for the performance of the SWF and would justify not publishing any information on investment returns and strategies as most funds chose to do. This insight could also explain why the variable measuring the transparency of the fund, linaburgmodell, shows no significance. However, this contrasts with the need for accountability (Truman, 2007). Accountability and transparency prevent misuse not geared towards development and a lack of integration with the fiscal and monetary framework. Both rule of law and corruption are very problematic issues in Mongolia. As for corruption, the country scores 3 out of 10 total points on Transparency International’s corruption index, indicating a highly corrupt environment. Similarly, rule of law is assigned a value of -0.71 in the World Bank’s assessment. On a scale from -2.5 to +2.5, this implies that rule of law is rather weak in Mongolia. Despite the insignificance revealed in this study it probably is a good idea for Mongolian policy makers to aim for a highly transparent SWF, also in order

A primer on how to design Mongolia’s SWF Frank-Alexander Raabe
19
to spur the improvement of the rule of law in other sectors of the economy. Secrecy as a recipe for success might only work for funds from middle- to high-level income countries, where corruption is usually not an issue and the rule of law strong. Secrecy also might apply to funds already established long time ago, since procedures guaranteeing the success of the SWFs are less likely to be deviated from and reflect a prudent management of the fund. In fact, the insignificance of both variables might stem from the fact that high income-countries such as Singapore, Australia and Norway as well as countries with old funds such as Kuwait and Saudi Arabia were included in the panel analysis. Development achievements in terms of education levels do not enter significantly. Hence hypothesis 6 that higher education levels improve the fund’s performance thanks to more skilled management does not hold. The reason could be that education expenditures, here used as a proxy for education levels, is a mere input variable and does not say anything about the effectiveness of those expenditures in achieving higher education levels. Also if money was spent on primary education, there is most likely no impact on the SWF performance because the management of the fund requires highly skilled finance specialists. This suggests that, unless there are qualified Mongolians, external managers could be hired until Mongolians receive finance training required to run the fund. Hiring foreigners for these specialized tasks worked well in the past as shows the case of Peter Morrow, former CEO of Mongolia’s Khan Bank. Hence, this habit could be extended from the private sector to the state-owned investment vehicle in order to overcome a possible shortage in skilled human resources. However, education expenditures enter positively at the 0.1 percent significance level in combination with health expenditures. At the same time health expenditures itself have a significantly (0.1 percent significance level) negative impact, refusing hypothesis 7. This would make sense if increased current expenditure on public health services required a substantial part of the earned foreign exchange so that less currency was available to be put into the fund. The fact that the interaction term of education and health enters positively, although health expenditure enters negatively and education expenditures are not significant, implies that an omitted variable renders the interaction of both significant and positive. Therefore, the impact of human development as approximated by education and health levels remains ambiguous. Official development assistance enters negatively and is significant at the 1 percent level in both random-effects regressions. This confirms hypothesis 8. This should, however, not be a cause for concern since the amount of aid provided to Mongolia will eventually level off while the country climbs the income ladder. If the source of the current account surplus is based on a commodity, this has a significant (at the 1 percent significance level) negative impact on the SWF’s impact on development. Due to the country’s comparative advantage in raw material production, Mongolia does not have a choice of an alternative source for its SWF. Nevertheless, the commodity-based SWF could be complemented by a non-commodity based fund later on. In fact Chile already established a second fund. While the older SWF is based on copper, the newer one is a savings fund for pensions and invests abroad. As for the age of a SWF, the analysis yields a very clear picture. The earlier the fund has been established the higher its positive impact on development. The dummy accounting for the SWFs established more than 20 years ago enters positively, at the 0.1 percent significance level in the random-effects “reduced set” regression. Younger funds, however, seem to have a negative impact. The 10-year

A primer on how to design Mongolia’s SWF Frank-Alexander Raabe
20
dummy is significant at the 0.1 percent level in the random-effects regression. The reason is probably that the establishment of a SWF entails set-up costs, especially when established as a separate entity as opposed to a department in the treasury or central bank. The money spent on creating the SWF obviously is not available for other development-related expenditures. Some of the alternative development-enhancing investments are probably more urgent in the short run such as provision of quality education. A lack of these investments could therefore impact the SWF’s development performance negatively. An alternative explanation for the negative impact of the younger SWFs is that the lag between the establishment of a SWF and its development impact takes more than ten years. Hence the negative result would not be representative as a SWF’s impact can be measured in the long-run only. This explanation would be in tandem with the long investment horizons of SWFs. The lesson to be drawn for the creation of the Mongolian SWF is that its establishment will pay off in terms of a development progress in the long run only. The region specific dummies representing the development impact of funds established by African, Latin American and Asian countries are negative at various significance levels. This could be connected to the weakness of institutions or the generally lower level of development in those regions, but should not prevent the Mongolian government from creating a SWF due to SWFs’ function as driver of long-run development progress as described in section 2.
While the results stated above provide valuable advice for the creation of the Mongolian SWF, its performance clearly also depends on the internal management of the fund. Since the management quality is less easy to measure quantitatively, in the following the empirical findings are complemented by the literature on the management of SWFs. Lipsky (2008) suggests that the operations of the SWF must be well integrated in the overall monetary and fiscal framework in order to avoid parallel budgets. In this regard, Le Borgne and Medas (2007) conduct a study on SWFs of Pacific island nations. If well designed and integrated with the government’s budget, SWFs fostered a sound fiscal framework. Nevertheless, this finding hinges on the condition of a sophisticated design and integration with the budget, which is not always the case as the contrasting cases of Nauru and Kiribati show. Kiribati established a SWF in 1956 to save the proceeds from mining phosphate. Since mining stopped in 1979 the fund has been prudently managed so that the interest payments today represent 30 percent of government revenues. Nauru on the other hand also created a SWF in 1968 based as well on phosphate. In 2006 the fund entered receivership due to poor management (Lerner). This example underlines that the effectiveness of a fund can be largely impeded due to institutional weakness, especially underperforming asset management and inadequate controls. In fact, mismanagement of Nauru’s fund in combination with an undiversified portfolio with most investments in luxury real estate resulted in a depletion of the fund’s resources by 90 percent compared to the beginning of the 1990s. Instead of limiting the fund to financing the government budget, the assets were used as collateral for granting loans or financing fiscal deficits without monitoring by financial authorities. Hence, sound oversight mechanisms should be established in Mongolia. These mechanisms need to be complemented by reliable reporting. Without public disclosure of the fund’s investments and strategies, it will be difficult to hold management accountable. Based on the regression results in this study, once the country achieves higher income levels, the mandate for disclosure needs to be balanced with the secrecy that seems to enhance the fund’s effectiveness in spurring development.

A primer on how to design Mongolia’s SWF Frank-Alexander Raabe
21
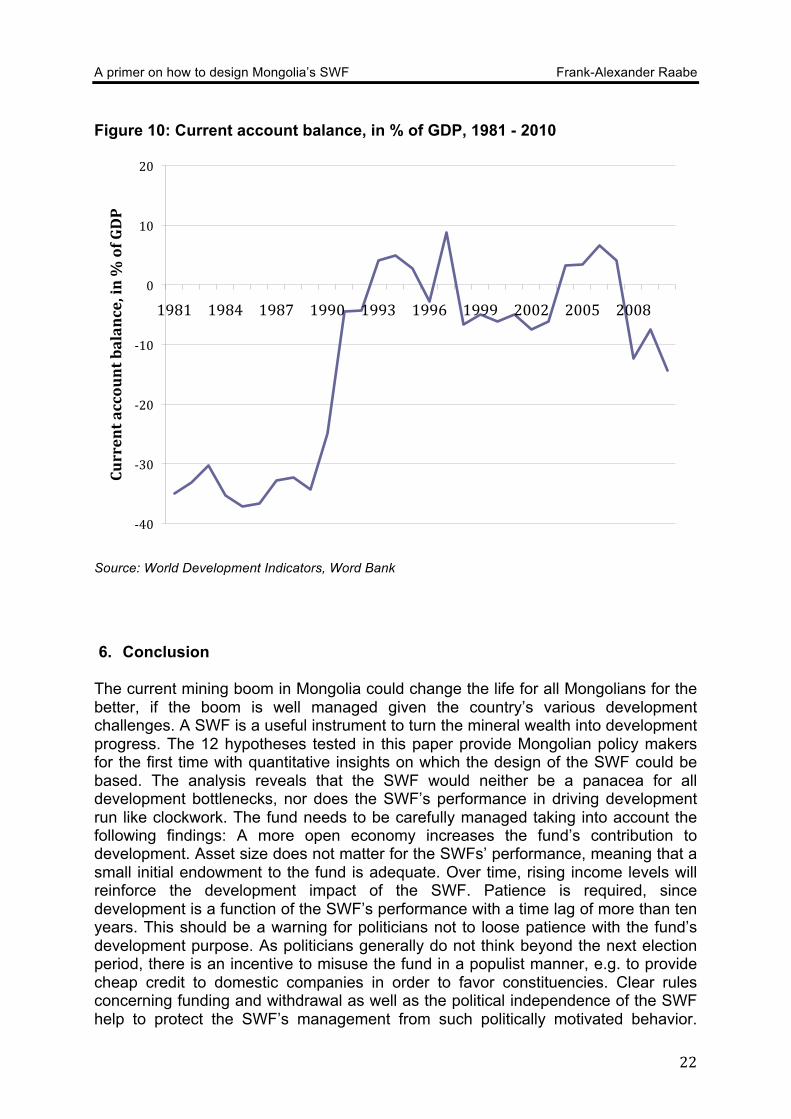
Fasano (2000) confirms the important role that management and discipline play in increasing the funds effectiveness. Looking at SWFs from Chile, Norway, the State of Alaska, Kuwait and Oman and their impact on fiscal management, his study reveals that the greatest challenges for a SWF are adhering to established rules, fiscal discipline and the institutional set-up in general. Lipsky’s (2008) recommendations on the management of SWFs are in tandem with this finding. Lipsky (2008) opines that funding and withdrawal rules need to be well-designed and names the Chilean SWF a recipe for success. The Chilean SWF is created to smooth government expenditures across the business cycle (Lipsky, 2008). In addition the internal governance structures should clearly define the responsibilities and relationships between the government -bodies involved in the SWF's administration. Besides a strong capacity to access investment risk appropriately, Lipsky (2008) emphasizes the importance of institutional independence. Like in the case of central banks, independence from other government bodies, in particular those prone to discretionary political power, guarantees a better management of the fund. As far as the withdrawal rules for Mongolia’s SWF are designed currently, the fund will not be immune against misuse. In 2009, in its quest to smoothen the budget, the Parliament passed a law creating a mechanism for saving surplus revenues from mineral export revenues when market prices are high in order to withdraw currency when prices fall. In addition, the Parliament approved a provision that allows withdrawing a certain amount of money from the SWF, i.e. not a percentage of the fund’s value, in anticipation of export revenues to be generated. It is this second provision that could have negative repercussions. Should commodity prices fall suddenly, as happened in 2008 in the case of copper (Figure 1), money would still be withdrawn. Hence, the mechanism suggested could lead to a fast depletion of the fund. Furthermore, the practical implementation of the fund should be reconsidered. Griffith-Jones and Ocampo are right in asserting that the transformation of the mineral wealth into financial assets makes sense only, if the ROI of these assets was higher than the revenues that could be generated directly by selling the minerals. This means that possible investment targets of the fund should be identified abroad and their ROI compared to export revenues before the fund is created. Though, these authors overlook the savings function of a SWF that is supposed to serve future generations. In addition, creating a SWF makes sense only in case the current account is positive. This is necessary in order to channel foreign exchange into the SWF. In case of Mongolia, the current account is negative (Figure 10). However, due to the mining boom and still elevated levels of commodity prices, Mongolia’s current account should soon turn positive again.
A primer on how to design Mongolia’s SWF Frank-Alexander Raabe
22
Figure 10: Current account balance, in % of GDP, 1981 - 2010
Source: World Development Indicators, Word Bank
6. Conclusion The current mining boom in Mongolia could change the life for all Mongolians for the better, if the boom is well managed given the country’s various development challenges. A SWF is a useful instrument to turn the mineral wealth into development progress. The 12 hypotheses tested in this paper provide Mongolian policy makers for the first time with quantitative insights on which the design of the SWF could be based. The analysis reveals that the SWF would neither be a panacea for all development bottlenecks, nor does the SWF’s performance in driving development run like clockwork. The fund needs to be carefully managed taking into account the following findings: A more open economy increases the fund’s contribution to development. Asset size does not matter for the SWFs’ performance, meaning that a small initial endowment to the fund is adequate. Over time, rising income levels will reinforce the development impact of the SWF. Patience is required, since development is a function of the SWF’s performance with a time lag of more than ten years. This should be a warning for politicians not to loose patience with the fund’s development purpose. As politicians generally do not think beyond the next election period, there is an incentive to misuse the fund in a populist manner, e.g. to provide cheap credit to domestic companies in order to favor constituencies. Clear rules concerning funding and withdrawal as well as the political independence of the SWF help to protect the SWF’s management from such politically motivated behavior.
-‐40
-‐30
-‐20
-‐10
0
10
20
1981 1984 1987 1990 1993 1996 1999 2002 2005 2008
Current account balance, in % of GDP
A primer on how to design Mongolia’s SWF Frank-Alexander Raabe
23
Besides, the integration into the fiscal framework as well as accountability are crucial for the creation of a SWF. Should Mongolia climb the income ladder, a balance needs to be struck between the transparency requirement and secrecy that seems to foster the SWF’s performance. Finally, it is of utmost importance to keep in mind that these findings are derived from a general assessment and do not yet account for the peculiarities of the Mongolian SWF. In particular, each fund is different in terms of objectives, meaning that the findings described here need to be applied to Mongolia specifically. This is why based on this paper the next step should be a case study that takes into account the institutional setting in Mongolia.

A primer on how to design Mongolia’s SWF Frank-Alexander Raabe
24
7. References Acemoglu et al., 2004. Institutions as the fundamental cause of long-run growth. Working Paper 10481. NBER. Aizenmann and Glick, 2008. Sovereign wealth funds: Stylized facts about their
determinants and governance. Federal Reserve Bank of San Francisco. Working paper series.
Aizenmann and Glick, 2009. Sovereign wealth funds, governance, and reserves
accumulation. Retrieved on May 6, 2012. www.voxeu.org. Allen and Caruana, 2008. Sovereign wealth funds - a work agenda. IMF. Ang, 2010. Four benchmarks of sovereign wealth funds. Working paper series,
Columbia Business School and NBER. Balin, 2008. Sovereign wealth funds: A critical analysis. Johns Hopkins University –
Paul H. Nitze School of Advanced International Studies. Batchuluun and Lin, 2010. An analysis of mining sector economics in Mongolia.
Global Journal of Business Research. Vol. 4. No. 4. Behrendt, 2011. Sovereign wealth funds in nondemocratic countries: Financing
entrenchment or change?. Journal of International Affairs. Vol. 65. No. 1. Bernstein et. al., 2009. The investment strategies of sovereign wealth funds. Working
paper 1486. NBER. Bloomberg, 2009. Mongolia fund to manage $30 billion mining jackpot (Update2).
Retrieved on May 6, 2012. http://www.bloomberg.com/apps/news?pid=newsarchive&sid=aWm8u8kb0R5E.
Bortolotti et al., 2010. Quiet Leviathans: Sovereign wealth fund investment, passivity
and the value of the firm. Breisinger et al., 2010. Managing future oil revenues in Ghana: An assessment of
alternative allocation options. African Development Review. Vol. 22, No. 2, 303–315.
Brookings, 2012. Mongolia’s quest to balance human development in its booming
mineral-based economy. Published January 2012. Retrieved on April 21, 2012. http://www.brookings.edu/opinions/2012/0110_mongolia_campi.aspx.
Chhaochharia and Laeven, 2009. Sovereign Wealth Funds: Their Investment
Strategies and Performance.

A primer on how to design Mongolia’s SWF Frank-Alexander Raabe
25
Das et. al., 2009. Setting up a sovereign wealth fund: Some policy and operational
considerations. IMF working paper WP/09/179. Dwenter et al., 2009. Firm values and sovereign wealth fund investments. SSRN
working paper. Eguzozie, 2011. How sovereign wealth fund can drive Nigeria’s growth, infrastructure
development. Published May 16, 2011. Retrieved on April 21, 2012. www.businessdayonline.com.
Fasano, 2000. Review of the experience with oil stabilization funds in selected
countries. IMF working paper WP/00/112. Griffith-Jones and Ocampo. Sovereign wealth funds: A developing country
perspective. Gruen, 2012. The role of sovereign wealth funds in managing resource booms: a
comparison of Australia and Norway. Third Annual Asia Central Bank and Sovereign Wealth Fund Conference. Retrieved on May 6, 2012. http://www.treasury.gov.au/PublicationsAndMedia/Speeches/2012/The-role-of-sovereign-wealth-funds-in-managing-resource-booms.
Hasio, 2003. Analysis of Panel Data. 2nd edition. Cambridge University Press.
Cambridge. Jen, 2007. The definition of a sovereign wealth fund. Morgan Stanley Research
Global. Published October 25, 2007. Le Borgne and Medas, 2007. Sovereign wealth funds in the Pacific island countries:
Macro-fiscal linkages. IMF working paper WP/07/297. Lerner. New insights into sovereign wealth funds: clues and mysteries. Presentation
at the Harvard Business School. Retrieved on May 6, 2012. www.hbgholdings.com/resources/14_12.00_Josh_Lerner.pdf.
Lim, 2010. The optimal design of sovereign wealth funds. Retrieved on May 6, 2012.
http://blogs.worldbank.org/prospects/the-optimal-design-of-sovereign-wealth- funds.
Lipsky, 2008. Sovereign wealth funds: Their role and significance. Speech by John
Lipsky, First Deputy Managing Director of the International Monetary Fund, at the Seminar „Sovereign Funds: Responsibility with Our Future“, Santiago de Chile, September 3, 2008.
Ploeg and Venables, 2008. Harnessing windfall revenues in developing countries:
Sovereign wealth funds and optimal tradeoffs between citizen dividends, public infrastructure and debt reduction. CEPR discussion paper 6954.
A primer on how to design Mongolia’s SWF Frank-Alexander Raabe
26
Ploeg and Venables, 2011. Harnessing windfall revenues: optimal policies for resource-rich developing countries. The Economic Journal. Vol. 121 (March). 1–30.
Ploeag and Venables, 2011. Natural resource wealth: The challenge of managing a
windfall. CEPR discussion paper No. 8694. Pomfret, 2012. Resource management and transition in Central Asia, Azerbaijan and
Mongolia. Journal of Asian Economics. Vol. 23. 146-156. Sachs and Warner, 2011. The curse of natural resources. European Economic
Review. Vol. 45. 827-838. Sarkar, 2009. Sovereign wealth funds: Furthering development or impeding it?.
Georgetown Journal of International Law. Selfin et al., 2011. The impact of sovereign wealth funds on economic success.
Economic views. PWC. Shabsigh and Ilahi, 2007. Looking beyond the fiscal: Do oil funds bring
macroeconomic stability?. IMF working paper WP/07/96. Sharma and Gani, 2004. The Effects of Foreign Direct Investment on Human
Development. Global Economy Journal. Vol. 4. No. 2. The Economist, 2012. Mine, all Mine. Vol 402. No. 8768 Truman, 2007. Sovereign wealth funds: The need for greater transparency and
accountability. Policy Brief No. 07-6. Peterson Institute for International Economics.
Truman, 2008. A blueprint for sovereign wealth fund best practices. Policy Brief No.
08-3. Peterson Institute for International Economics.
A primer on how to design Mongolia’s SWF Frank-Alexander Raabe
27
8. Annex Figure 2: Map of mineral deposits in Mongolia
Source: The Economist, 2012. Mine, all Mine. Vol 402. No. 8768 Figure 8: Principles of the Linaburg-Maduell Transparency Index
Source: Sovereign Wealth Fund Institute

A primer on how to design Mongolia’s SWF Frank-Alexander Raabe
28
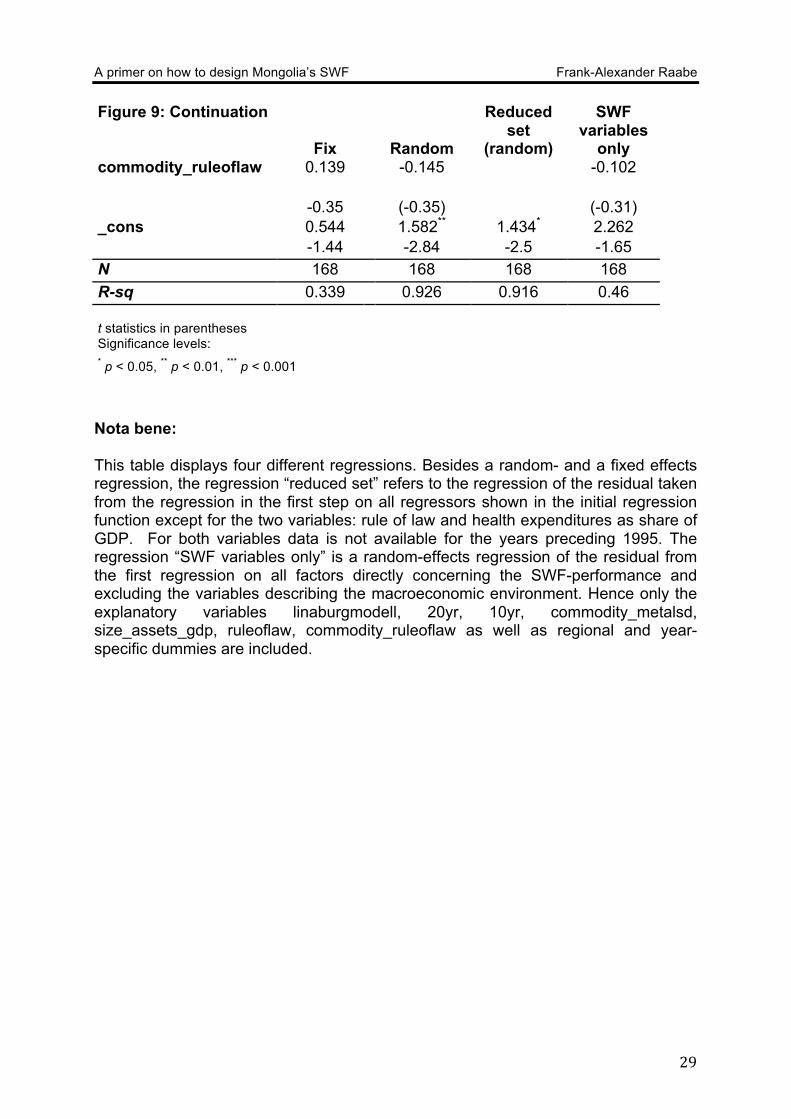
Figure 9: Regression results, dependent variable: SWF performance Fix Random Reduced
set (random)
SWF variables
only gdp_l5 -
0.00000908 0.000108*** 0.0000370**
(-0.68) -8.42 -3.09 corruption_assetsize 0.0128 -0.0486
-0.47 (-1.19) corruption_commodity -0.524 0.191
(-1.57) -0.59 health_edu 0.00936 0.0727*** -0.76 -4.14 asiad 0 -0.207 -0.836* -1.033 (.) (-1.43) (-2.42) (-1.09) latamd 0 -0.428* -0.362 -0.0648 (.) (-2.09) (-0.92) (-0.06) africad 0 -1.383*** -1.935*** -2.228* (.) (-7.83) (-6.00) (-2.57) linaburgmodell 0 0.0156 -0.0363 -0.0639
(.) -1.24 (-1.20) (-0.75) 20yr 0 0.354** 1.259*** 1.631* (.) -2.72 -4.31 -2.15 10yr 0 -0.929*** -0.750* -0.397 (.) (-5.26) (-2.32) (-0.47) commodity_metalsd 0 -0.067 -1.153** -1.578
(.) (-0.30) (-2.71) (-1.43) ruleoflaw -0.0728 -0.325 0.227 (-0.19) (-0.86) -0.72 size_assets_gdp -0.0262* -0.0461* -0.017 -0.0257*** (-2.22) (-2.41) (-1.71) (-3.61) aid -2.23E-10 -5.61e-10** -4.95e-10** (-1.50) (-2.83) (-3.22) corruption 0.616 0.417 -1.89 -1.4 edu_exp -0.00945 -0.116 0.0733 (-0.12) (-1.32) -1.7 health_exp -0.0799 -0.478*** (-1.18) (-4.94) trade_gdp -0.000147 0.00372** 0.00233
(-0.10)
-2.97
-1.92
A primer on how to design Mongolia’s SWF Frank-Alexander Raabe
29
Figure 9: Continuation
Fix
Random
Reduced set
(random)
SWF variables
only commodity_ruleoflaw 0.139 -0.145 -0.102
-0.35 (-0.35) (-0.31) _cons 0.544 1.582** 1.434* 2.262 -1.44 -2.84 -2.5 -1.65 N 168 168 168 168 R-sq 0.339 0.926 0.916 0.46 t statistics in parentheses Significance levels: * p < 0.05, ** p < 0.01, *** p < 0.001 Nota bene: This table displays four different regressions. Besides a random- and a fixed effects regression, the regression “reduced set” refers to the regression of the residual taken from the regression in the first step on all regressors shown in the initial regression function except for the two variables: rule of law and health expenditures as share of GDP. For both variables data is not available for the years preceding 1995. The regression “SWF variables only” is a random-effects regression of the residual from the first regression on all factors directly concerning the SWF-performance and excluding the variables describing the macroeconomic environment. Hence only the explanatory variables linaburgmodell, 20yr, 10yr, commodity_metalsd, size_assets_gdp, ruleoflaw, commodity_ruleoflaw as well as regional and year-specific dummies are included.