How to Analyze Dividend Stocks · How to Analyze Dividend Stocks. Key Takeaways 2 • Dividend...
39
Jaclyn McClellan Associate Financial Analyst, AAII Editor, Computerized Investing How to Analyze Dividend Stocks
Transcript of How to Analyze Dividend Stocks · How to Analyze Dividend Stocks. Key Takeaways 2 • Dividend...

Jaclyn McClellanAssociate Financial Analyst, AAIIEditor, Computerized Investing
How to Analyze Dividend Stocks

Key Takeaways
2
• Dividend growth stocks have outperformed non-dividend growers
• How to use the dividend yield as a guide to stock valuation
• Why the P/E ratio may be difficult to interpret at times
• Important considerations for financial strength and profitability
• Considerations for determining when to sell a dividend stock

What are dividends?
3
EquityRetained earnings
‒Dividends
AssetsCash
‒Dividends
Balance Sheet (A = L + OE)
Dividends are a distribution of cash from a company to its shareholders

Why should you care?
4
1. Dividends increase total returntotal return = dividend yield + price return
Source: Duff & Phelps.
7.7%
12.0%
0.0%2.0%4.0%6.0%8.0%
10.0%12.0%14.0%
No Dividends With Dividends
Average Annual Large-Cap Returns 1926 - 2016

Why should you care?
5
2. Dividends align with shareholders’ interests
3. Dividend-paying stocks mitigate downside risk
4. Dividends are a positive signal from management
5. Dividend stocks have outperformed

Dividend Strategies
6
Two main approaches • Dividend growth: Look for growing
dividend. Usually better quality, less risk, lower absolute yield when compared to high-yield approach
• High dividend yield: Seek high-yielding stocks. Usually lower quality, more risk
What we will talk about today!
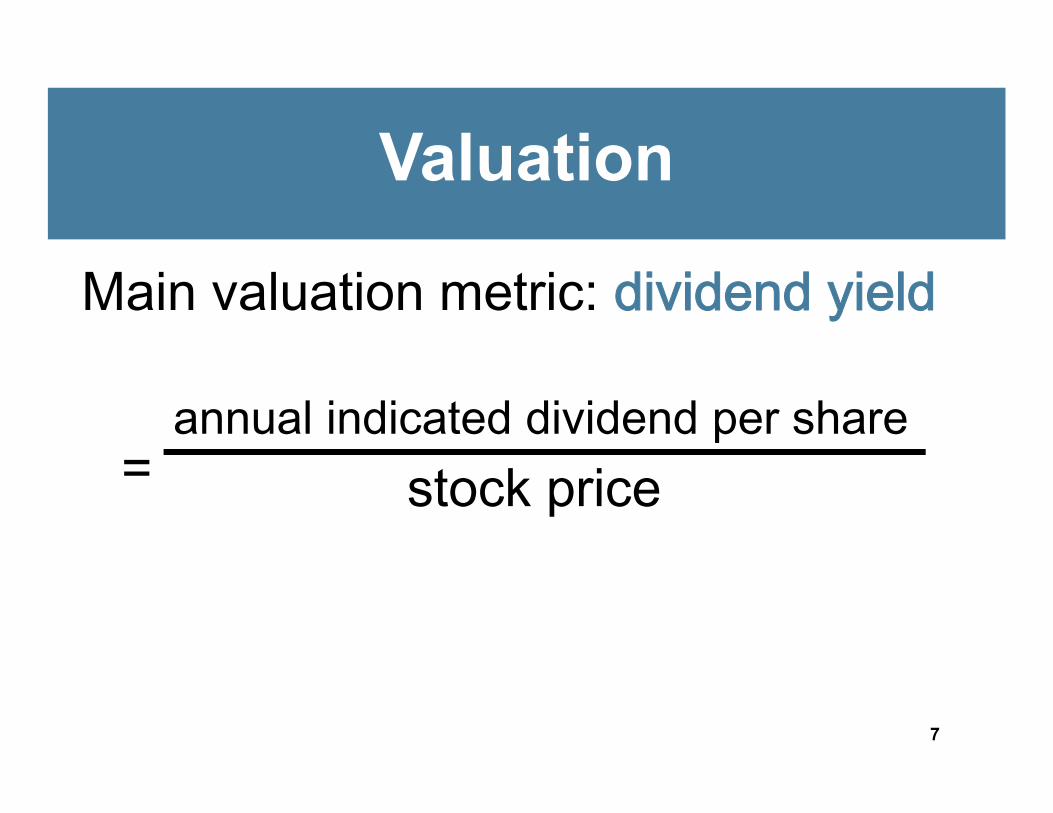
Valuation
7
annual indicated dividend per sharestock price
Main valuation metric: dividend yield
=

Dividend Yield
8
Holding dividend steady:If price goes up, yield goes downIf price goes down, yield goes up
• Compare to stock’s historical average and market• Generally, we want yield above historical average
yield• High yield can mean high risk• Shows what you pay for a given level of dividends

THE AMERICAN ASSOCATION OF INDIVIDUAL INVESTORS2017 INVESTOR CONFERENCE
Dividend Yield
9

10
756 exchange-traded stocks with yield above 5-yr average
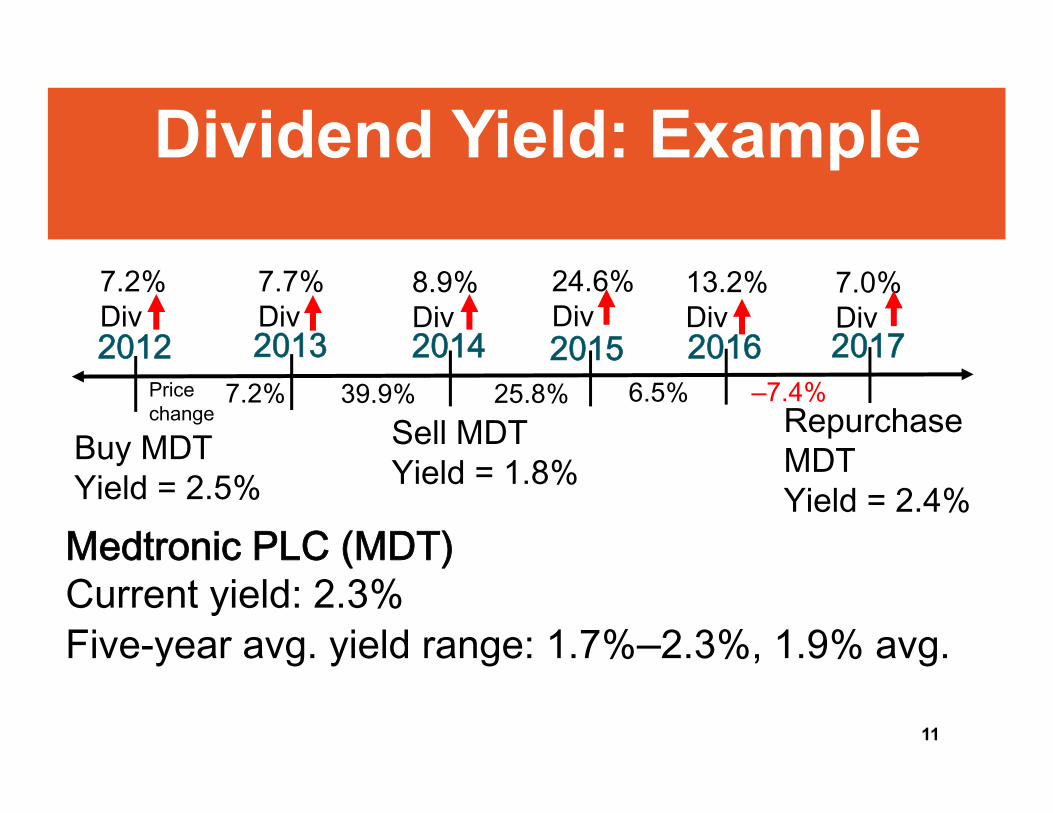
Dividend Yield: Example
11
2014
8.9%Div
Sell MDTYield = 1.8%
2015 2016 2017
Medtronic PLC (MDT)Current yield: 2.3%Five-year avg. yield range: 1.7%‒2.3%, 1.9% avg.
Buy MDTYield = 2.5%
24.6% Div
13.2% Div
7.0%Div
Repurchase MDTYield = 2.4%
201320127.2% 39.9% 25.8% 6.5% ‒7.4%
7.2%Div
7.7%Div
Pricechange

Valuation
12
Another common valuation metric is the
= stock priceearnings per share
12 trailing month or forward earnings
price-earnings (P/E) ratio

P/E Ratio: Example
THE AMERICAN ASSOCATION OF INDIVIDUAL INVESTORS2017 INVESTOR CONFERENCE 13
Caterpillar (CAT)
Est EPS FY 2018: $9.14Forward P/E: 17.6xFive-year avg. yield range: 2.6%‒3.9%, 3.1% avg.
2014 2015 2016 20172013
Price: $90.81EPS: $5.75P/E: 15.8xYield: 2.6%
Price: $91.53EPS: $3.90P/E: 23.5xYield: 3.1%
Price: $67.96EPS: $4.18P/E: 16.3xYield: 4.5%
Price: $92.74EPS: ‒$0.12P/E: nmfYield: 3.3%
Price: $124.67TTM EPS: $0.15P/E: 831.1xYield: 2.5%

P/E Ratio
14
• Compare to historical average• Compare to market• The higher the value, the higher the price for a
given level of earnings• Value investor ‒ wants lower• Growth investor ‒ doesn’t care as much• Forward looking (even the TTM version)• Particularly difficult to interpret with cyclical
stocks (normalized earnings are an alternative)• Not meaningful if earnings are negative

Dividends
15
• Growth: Does the company grow its dividend?
• Sustainability: Can the company sustain its dividend payment in the future?
• Consistency: Does the company consistently pay its dividend?

Dividend Growth
16
• Analyze historical dividend growth• Prefer growth above inflation• Prefer increasing rate of growth, but consider
economic conditions and earnings• Dividend growth can’t outpace earnings growth in
the long term• Dividend growth will boost dividend yield (holding
price steady)

Dividend Sustainability
17
If a company can’t sustain the payment ‒ the “stickiness” of their dividends is questionable-Payout ratio: earnings and free-cash-flow-Financial strength: high leverage is bad-Long-term earnings growth: dividends come from earnings-Long-term competitive advantage: no demand = no profitability. Look at margins but also analyze non-quantitative aspects

Dividend Sustainability
18
Earnings payout ratio
= earnings per sharedividends per share
Free-cash-flow (FCF) payout ratio
=dividends per share
FCF per shareFCF = (cash from operations – capital expenditures)This calculation is a “pre-dividend” calculation.

Payout Ratios
19
• Generally lower is better >> shows room to grow• High payout (above 100%) isn’t sustainable over
the long term• Compare to industry and historical average• Check if company mentions “target” payout ratio• Free cash flow is less easily manipulated by
management• Sometimes it can be affected by one time issues

Dividend Sustainability: Example
20
Earnings payout ratio
Mattel, Inc. (MAT)2014 2015 2016 2017
104.1% 140.8% 163.9% 216.1%FCF per share $0.33 ‒$0.10 ‒$0.54 ‒$1.14
Mattel cut its dividend 60% in June 2017, from $0.38 per share to $0.15 per share.From the time of the cut to the end of February, MAT shares lost roughly 22%.

Dividend Consistency
21
• Record of paying and increasing dividends• Have they ever decreased the dividend? Why?• Long-time payers have done well, but stocks
that recently implemented a dividend could also be committed to paying it
• Bottom line: Consistency shows commitment, but doesn’t guarantee it

Profitability
22
Does the company make money?• Analyze historical trends of company
- If cyclical: peaks and troughs - Cyclicals are okay but be aware of business cycle’s impact on profits
• Analyze overall corporate/industry profitability to the best of your ability
• ROE, ROIC, earnings growth, margins

Earnings Growth & Margins
23
Earnings: historical, expected, earnings surprise• Dividends can’t grow without earnings growth• Look at historical and expected earnings growth ‒ pay
attention to business cycle• Consistently missing earnings estimates is badMargins: gross margin, profit margin, operating margin• Higher margins are better (industry specific)• Expanding margins signal competitive advantage• Listen to management: Sometimes declining margins
can mean the business model is changing

Earnings Growth & Margins: Example
24
Texas Instruments (TXN)2014 2015 2016 2017
Net profit marginOperating margin
21.3% 22.6% 26.6% 24.4%30.3% 32.9% 35.9% 40.7%
EPS growthYear-over-yearDividend growthYear-over-year
34.7% 9.7% 23.2% 3.7%
13.3% 29.1%31.6%11.8%

Return on Invested Capital
25
Return on Invested Capital (ROIC)
=net operating profit aftertax (NOPAT)
Invested Capital (LT debt + equity)
NOPAT = EBIT x (1 – tax rate)

Return on Invested Capital
26
• Is the company efficiently allocating capital to profitable investments?
• Higher is better• ROIC > WACC* means creating value: earning
more for every dollar invested• Different between industries ‒ some invest more
capital so it’s more meaningful
*See formula at end of presentation

Financial Strength
27
• Ties into dividend sustainability ‒ can the company actually support the dividend? What about during “hard times”?
• Companies with more significant capital needs are more likely to carry more debt as % of total capital
• Metrics are usually industry-specific• Debt coverage, cash flow, interest coverage, debt
to capital

Interest Coverage
28
Interest coverage ratio
=earnings before interest and taxes (EBIT)
interest expense

Interest Coverage
29
• Measures company’s ability to meet its debt obligations
• Higher is better • Good because increasing debt isn’t always
bad, what matters is if the company can pay its current obligations and if it’s using the debt effectively

Interest Coverage: Example
30
Interest coverage2014
Home Depot Inc. (HD)2015 2016 2017
12.9 13.0 13.0 13.9
ROIC 21.4% 26.2% 28.0% 32.1%
LT debt to capital 54.0% 64.4% 76.7% 83.8%
Change in shares outstanding
‒5.1% ‒6.1% ‒4.7% ‒3.8%

Sector Medians in SIP
31

32

When to Sell
33
Think: changes regarding the growth, sustainability or consistency of the dividend-Excessively high yield (can signal a cut)-Yield below benchmark yield (market and company’s historical range)-Lack of increase (case by case) or growth consistently less than inflation-Continuing poor fundamentals

When to Sell
34
-Dividend cut-Change in dividend policy-Significant business risk: legal/regulatory-Overall poor business/growth prospects-Continually negative FCF/inability to continue to pay dividend-More attractive opportunity elsewhere: trade-off

Conclusions
35
• Decide if you want to be 100% quantitative or make exceptions
• Keep notes of why you added a stock to begin with
• Use the dividend yield as a guide to determine over- or under-valuation
• When using ratios, fully understand what goes into the calculation and what could distort it
• Remember, no company can have everything

AAII Dividend Investing
36
• Model portfolio, but has actual money invested• 24 dividend growth stocks• Equal-weighted portfolio• Alert members of additions or deletions • Reinvest excess cash into underweight positions• Monthly publication• Weekly email/commentary
www.aaiidividendinvesting.com

The End
THE AMERICAN ASSOCATION OF INDIVIDUAL INVESTORS2017 INVESTOR CONFERENCE 37
Questions?
THE AMERICAN ASSOCATION OF INDIVIDUAL INVESTORS2017 INVESTOR CONFERENCE
References
38
“Return on Capital (ROC), Return on Invested Capital (ROIC) and Return on Equity (ROE): Measurement and Implications.” Aswath Damodaran, Stern School of Business. July 2017.
“Calculating Return on Invested Capital.” Michael J. Mauboussin and Dan Callahan, CFA. Credit Suisse. June 2014.
“Why Dividends?” Santa Barbara Asset Management. January 2017.This report includes the charts displayed in the beginning of this presentation
“A Dividend Approach to Judging the Value of Stocks.” John Bajkowski and Jaclyn McClellan. AAII Journal. May 2017.
“The Weiss Approach to Value in Blue-Chip Stocks.” Jaclyn McClellan. AAII Journal. June 2016.
Data Source: AAII Stock Investor Pro, data as of September 30, 2017.
“2017 Stocks, Bonds, Bills and Inflation Yearbook,” Roger G. Ibbotson and Duff & Phelps. John Wiley & Sons, 2017.
THE AMERICAN ASSOCATION OF INDIVIDUAL INVESTORS2017 INVESTOR CONFERENCE
References
39
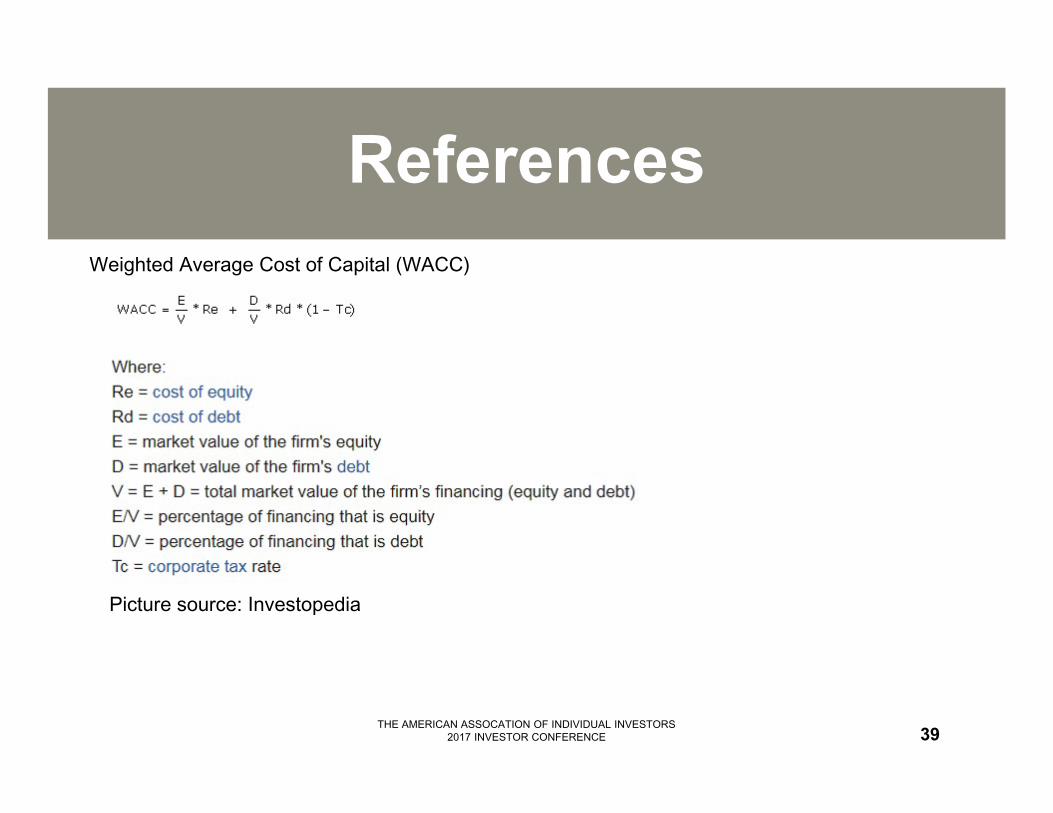
Weighted Average Cost of Capital (WACC)
Picture source: Investopedia