How Population Density Influences Agricultural ...
117
Purdue University Purdue e-Pubs Open Access eses eses and Dissertations 2013 How Population Density Influences Agricultural Intensification and Productivity: Evidence from Ethiopia Anna Leigh Josephson Purdue University Follow this and additional works at: hps://docs.lib.purdue.edu/open_access_theses Part of the Agricultural and Resource Economics Commons , Agricultural Economics Commons , and the Economics Commons is document has been made available through Purdue e-Pubs, a service of the Purdue University Libraries. Please contact [email protected] for additional information. Recommended Citation Josephson, Anna Leigh, "How Population Density Influences Agricultural Intensification and Productivity: Evidence from Ethiopia" (2013). Open Access eses. 31. hps://docs.lib.purdue.edu/open_access_theses/31
Transcript of How Population Density Influences Agricultural ...

Purdue UniversityPurdue e-Pubs
Open Access Theses Theses and Dissertations
2013
How Population Density Influences AgriculturalIntensification and Productivity: Evidence fromEthiopiaAnna Leigh JosephsonPurdue University
Follow this and additional works at: https://docs.lib.purdue.edu/open_access_theses
Part of the Agricultural and Resource Economics Commons, Agricultural Economics Commons,and the Economics Commons
This document has been made available through Purdue e-Pubs, a service of the Purdue University Libraries. Please contact [email protected] foradditional information.
Recommended CitationJosephson, Anna Leigh, "How Population Density Influences Agricultural Intensification and Productivity: Evidence from Ethiopia"(2013). Open Access Theses. 31.https://docs.lib.purdue.edu/open_access_theses/31

Graduate School ETD Form 9 (Revised 12/07)
PURDUE UNIVERSITY GRADUATE SCHOOL
Thesis/Dissertation Acceptance
This is to certify that the thesis/dissertation prepared
By
Entitled
For the degree of
Is approved by the final examining committee:
Chair
To the best of my knowledge and as understood by the student in the Research Integrity and Copyright Disclaimer (Graduate School Form 20), this thesis/dissertation adheres to the provisions of Purdue University’s “Policy on Integrity in Research” and the use of copyrighted material.
Approved by Major Professor(s): ____________________________________
____________________________________
Approved by: Head of the Graduate Program Date
Anna Leigh Josephson
How Population Density Influences Agricultural Intensification and Productivity: Evidence fromEthiopia
Master of Science
Dr. Jacob Ricker-Gilbert
Dr. Raymond Florax
Dr. Gerald Shively
Dr. Jacob Ricker-Gilbert
Dr. Raymond Florax
Dr. Ken Foster 05/02/2013

HOW POPULATION DENSITY INFLUENCES AGRICULTURAL
INTENSIFICATION AND PRODUCTIVITY:
EVIDENCE FROM ETHIOPIA
A Thesis
Submitted to the Faculty
of
Purdue University
by
Anna Leigh Josephson
In Partial Fulfillment of the
Requirements for the Degree
of
Master of Science
December 2013
Purdue University
West Lafayette, Indiana

ii
ACKNOWLEDGEMENTS
I would first like to thank my committee members, Dr. Jacob-Ricker Gilbert, Dr.
Raymond Florax, and Dr. Gerald Shively, for their help and devotion throughout the
process of research and writing. Thanks, in particular, go to my two committee chairs,
Dr. Ricker-Gilbert and Dr. Florax, for their patience corrections, excellent
recommendations, and constant stream of support.
I must also acknowledge Dr. Derek Heady and Mekdim Dereje, both of the
Intentional Food Policy Research Institute for in country support, research suggestions,
and translation assistance. Further, I am very thankful for all of the help from Dr. Jordan
Chamberlain, with not only GIS and programming help, but also great cultural and
historic insight.
The informal support and encouragement of my friends has been indispensable,
and I would like to acknowledge in particular, Meghan DeWitt, for her listening ears,
reading eyes, and complete and total support while I wrote, and sometimes, whined.
I would also like to acknowledge my family, for the support they’ve provided
through my life and throughout my education. I am especially thankful to my parents,
Irene and Eric Josephson, my siblings, Laura and Thomas Josephson, and my
grandparents, Harry and Doris Siegler. Without their unwavering encouragement, I
would have never moved so far from home, or have the courage to research even further
away.
Finally, I would like to thank my fiancé, Jeffery Michler, without whose love,
support, and editing assistance, I would not have finished this thesis.
In conclusion, I recognize that this research would not have been possible without
the financial support of the Bill and Melinda Gates Foundation, as well as the
collaboration between so many excellent institutions, including so many excellent people
at Purdue University, as well as Michigan State University and the International Food
Policy Research Institute.

iii
TABLE OF CONTENTS
Page
LIST OF TABLES ...............................................................................................................v
LIST OF FIGURES ........................................................................................................... vi
ABSTRACT ...................................................................................................................... vii
CHAPTER 1: INTRODUCTION ........................................................................................1
1.1 Land Use in Africa .........................................................................................................1
1.2 Land Use in Ethiopia .....................................................................................................3
1.3 Objective ........................................................................................................................5
1.4 Organization ...................................................................................................................6
CHAPTER 2: LITERATURE REVIEW .............................................................................7
2.1 Highland and Lowland Dynamics .................................................................................7
2.2 Redistribution ...............................................................................................................10
2.3 Land Tenure .................................................................................................................12
2.4 Population ....................................................................................................................14
CHAPTER 3: METHODOLOGY .....................................................................................16
3.1 Methodology Overview ...............................................................................................16
3.2 Farm Size and Population Density ...............................................................................20
3.3 Prices and Population Density .....................................................................................21
3.3.1 Wages ........................................................................................................................21
3.3.2 Staple Crop Prices .....................................................................................................22
3.3.3 Fertilizer Price ...........................................................................................................23
3.4 Demand for Modern Inputs and Output of Staple Crops .............................................23
3.4.1 Fertilizer Use .............................................................................................................24
3.4.2 Staple Crops ..............................................................................................................25
3.4.3 Farm Income .............................................................................................................25
3.5 Direct and Indirect Pathways .......................................................................................25

iv
Page
3.6 Empirical Estimation ...................................................................................................27
CHAPTER 4: DATA .........................................................................................................29
4.1 Ethiopian Rural Household Surveys ............................................................................29
4.2 GIS Data.......................................................................................................................31
4.3 Field Group Surveys ....................................................................................................32
CHAPTER 5: EMPIRICAL RESULTS ............................................................................34
5.1 Descriptive Statistics ....................................................................................................34
5.2 Estimation Results .......................................................................................................40
5.2.1 Prices and Landholding.............................................................................................41
5.2.2 Fertilizer Use per Hectare .........................................................................................52
5.2.3 Maize Yield ...............................................................................................................57
5.2.4 Teff Yield ..................................................................................................................61
5.2.5 Farm Income per Hectare..........................................................................................65
CHAPTER 6: CONCLUSIONS ........................................................................................69
6.1 Summary of Findings ...................................................................................................69
6.2 Policy Implications ......................................................................................................71
6.3 Limitations ...................................................................................................................74
6.4 Future Research ...........................................................................................................75
LIST OF REFERENCES ...................................................................................................77
APPENDIX ........................................................................................................................81

v
LIST OF TABLES
Table Page
Table 3.1: Variables Used in the Empirical Analysis, with Definitions ............................. 18
Table 3.2: Variables Used in Empirical Analysis ............................................................... 19
Table 5.1: Population Density: Percentiles and Mean ........................................................ 35
Table 5.2: Factors Affecting Landholding, CRE Equation by Equation ............................ 43
Table 5.3: Factors Affecting Landholding, CRE SUR ....................................................... 44
Table 5.4: Factors Affecting Log Daily Wage, CRE Equation by Equation ...................... 45
Table 5.5: Factors Affecting Log Daily Wage, CRE SUR ................................................. 46
Table 5.6: Factors Affecting Log Maize Price, CRE Equation by Equation ...................... 47
Table 5.7: Factors Affecting Log Maize Price, CRE SUR ................................................. 48
Table 5.8: Factors Affecting Log Teff Price, CRE Equation by Equation ......................... 49
Table 5.9: Factors Affecting Log Teff Price, CRE SUR .................................................... 50
Table 5.10: Factors Affecting Log Fertilizer Price, CRE Equation by Equation ............... 51
Table 5.11: Factors Affecting Log Fertilizer Price, CRE SUR .......................................... 52
Table 5.12: Factors Affecting Fertilizer Use, CRE Equation by Equation ......................... 53
Table 5.13: Factors Affecting Fertilizer Use, CRE SUR .................................................... 55
Table 5.14: Factors Affecting Maize Yield, CRE Equation by Equation ........................... 58
Table 5.15: Factors Affecting Maize Yield, CRE SUR ...................................................... 60
Table 5.16: Factors Affecting Teff Yield, CRE Equation by Equation .............................. 62
Table 5.17: Factors Affecting Teff Yield, CRE SUR ......................................................... 64
Table 5.18: Factors Affecting Farm Income, CRE Equation by Equation ......................... 66
Table 5.19: Factors Affecting Farm Income, CRE SUR .................................................... 67

vi
LIST OF FIGURES
Figure Page
Figure 1.1: Map of Ethiopia .................................................................................................4
Figure 2.1: Ethiopian Elevation Map ...................................................................................8
Figure 3.1: Indirect and Direct Influence of Population Density on Input Demand and
Output Supply ....................................................................................................................17
Figure 4.1: Ethiopian Population Density Map, with Survey Villages ..............................30
Figure 5.1: Landholding per Adult Equivalent ..................................................................35
Figure 5.2: Adult Equivalents per Cultivated Area ...........................................................36
Figure 5.3: Fertilizer Use per Cultivated Area...................................................................37
Figure 5.4: Daily Agricultural Wage .................................................................................38
Figure 5.5: Farm Income per Cultivated Area ...................................................................39
Figure 5.6: Asset Value per Adult Equivalent ...................................................................39

vii
ABSTRACT
Josephson, Anna Leigh. M.S., Purdue University, December 2013. How Population
Density Influences Agricultural Intensification and Productivity: Evidence from Ethiopia.
Major Professors: Jacob Ricker-Gilbert, Raymond J.G.M. Florax.
We use household-level panel data to estimate how population density impacts
agricultural intensification and farm income in Ethiopia. We hypothesize that increases in
population density affect agricultural intensification and farm income directly through
information flows, institutional development, and reduction in transactions costs.
Increases in population density also affect agricultural intensification and farm income
indirectly through farm size, agricultural wage rates, and staple crop prices. We find that
increases in population density lead to lower farm sizes, which has major implications for
agricultural intensification and household well-being. Our analysis indicates that
increases in population density cause farmers to purchase more inorganic fertilizer per
hectare. This is due to population density’s direct effects on market access. However, we
find that population density does not have a statistically significant effect on maize
yields, teff yields or farm income per hectare.
Keywords: Ethiopia, population density, landholding, productivity, intensification
JEL Codes: O13, O55, Q12, Q15, Q18

1
CHAPTER 1: INTRODUCTION
1.1 Land Use in Africa
Increasing population density is a critical challenge facing Sub-Saharan Africa
(SSA), but few studies empirically estimate the effects of increasing population density
on peoples’ lives. With a current population in SSA of 900 million people, and
projections for that number to double by 2050 (Population Reference Bureau, 2012), it is
imperative to investigate the influence of growing population on people’s lives and
behaviors. Most people in SSA live in rural areas, which are experiencing rapid
population expansion and correspondingly declining per capita farm size. Hence, the
influence of increasing population density will have an enormous impact on agriculture,
the ability of smallholder farmers to feed themselves and their families, and the food
security of the continent.
When considering data on SSA, a paradox emerges. It is estimated that in the
region about 201 million hectares, about 12 percent of total land, are unused. However,
most of the rural population resides in densely populated areas (Muyunga and Jayne,
2011). Broadly, this suggests an agricultural development strategy that encourages
production growth on the extensive margin, gained through expansion of cultivation into
unused areas of land. Yet, it is not clear if this unused land is situated where most
smallholder farmers live. Further, even if unused land exists in the areas where
smallholders reside, it is unlikely that significant area expansion can occur. This is due to

2
the underdeveloped state of African output per hectare markets, the inflexible nature of
rural labor markets, and the traditional tenure system of allocating land, which dominates
much of rural Africa. Additionally, environmental concerns such as erosion and
salination, associated with clearing land, indicate that even if institutionally possible,
such expansion may not be environmentally desirable for SSA. Therefore, as increasing
production along the extensive margin is neither viable nor optimal, it is crucial to
investigate realistic alternatives (Muyunga and Jayne, 2011).
Considering the difficulties associated with increasing production at the extensive
margin, it is therefore important to increase productivity on the intensive margin.
Relevant economic theories provide predictions regarding how growing population
density will indirectly influence agricultural productivity. In this thesis, we draw
primarily upon the theory of Boserup (1965), who presented an argument contrary to
Malthus’ (1798) projection of death and famine resulting from growing population.
Specifically, Boserup hypothesized that increasing population density will lead to greater
use of modern inputs, as well as a shift away from long-fallow periods towards annual
and multi-cropping practices. Driven largely by prices, this process will ultimately result
in increasing productivity per unit of land. Additional theories extend this argument to the
value of land and the value of labor. These include von Thünen (1826) as well as Hayami
and Ruttan (1970). Both theories utilize the underlying idea that prices drive behavioral
changes, in order to adapt to changing conditions which result from growing population
density. The former theory, which has found empirical support (Guiling et al., 2009;
Delbecq and Florax, 2010), suggests that as land prices increase, farmers switch to higher
value crops, in order to maximize value produced per hectare. The latter theory, often

3
referred to as the induced innovation hypothesis, suggests that the positive relationship
between population density and increased agricultural productivity occurs because the
price of labor declines relative to the price of land, causing demand for labor-intensive
and high-yield, modern inputs use to increase. The ultimate result is an increase in
production per hectare. This theory has been applied in the context of Africa by Pingali
and Binswanger (1984), and Binswanger and McIntire (1987).
It is also possible that population density itself is a driver of demand for inputs,
and staple crop productivity. Population density can directly affect agricultural
intensification through improved information flows, encouragement of the development
and advancement of institutions and reduction of transaction costs. Regions with greater
population density may be characterized by more rapid, and potentially more accurate,
diffusion of information regarding market prices, availability of products, and
transportation costs (Baerenklau, 2005; Foster and Rosenzweig, 2010; Conley and Udry,
2010; McMillen et al., 2011). This extended information may then encourage the
development of institutions, in particular the improvement of markets, in order to
capitalize on the availability of information. This in turn reduces transaction costs, and in
doing so helps to boost productivity.
1.2 Land Use in Ethiopia
Ethiopia is a densely populated country with a current population of 88 million
people, with expectations for that number to increase to 160 million by 2050 (Population
Reference Bureau, 2012). A map of the country can be found in Figure 1.1. Ethiopia’s
people and economy are dependent on agriculture, with agriculture contributing to over

4
85 percent of employment and 41 percent of gross domestic product (GDP) (World
Factbook, 2012). The main export crops grown are coffee and chat (a mild narcotic).
Maize and teff are the principle subsistence crops, cultivated by most smallholder
farmers. The way in which Ethiopian farmers respond to increased population pressure
will have an impact on millions of smallholder farmers in Ethiopia, as well as on food
security and the economy of the nation.
Figure 1.1: Map of Ethiopia
(National Geographic, 2013)
Data used in this analysis comes from three primary sources. First, we use six
waves of household-level data collected between 1993 and 2004, covering 1,293
households. Second, we use population estimates and land estimates, gathered from two
different Geographic Information System (GIS) databases, the Global Rural Urban
Mapping Project (GRUMP) and Global Agro-Ecological Zones database (GAEZ).

5
Finally, we use qualitative data as a complement to the quantitative data, with
information gathered in focus group discussions1 conducted in Ethiopia in May 2012.
1.3 Objective
This thesis is part of a series of five collaborative studies that combine household-
level panel data, GIS data, and qualitative focus group data to investigate the impacts of
population density growth on agriculture in SSA.2 The objective of this research is to
identify the adaptations in agricultural methods that are necessary to sustainably grow
enough food for an increasing population and to determine how increasing population
density drives agricultural intensification. We also attempt to determine household level
changes in agricultural practices which occur as agriculture intensifies.
We estimate the impact of population density on 1) household landholding; 2)
factor and output prices including agricultural wage rates, fertilizer price, maize price,
and teff price; 3) fertilizer use per hectare; 4) teff and maize output per hectare; and 5)
farm income per hectare. We estimate these relationships using a correlated random
effects (CRE) estimator, in an equation by equation model, as well as a seemingly
unrelated regression (SUR) model.
Population density has both indirect and direct influences on agricultural
productivity, and therefore on the demand for fertilizer, the supply of maize and teff, and
1 These focus groups covered 12 of the 15 villages used in our survey, and were designed to complement
quantitative data from the ERHS. Focus group discussions involved between six and eight individuals, over
the age of 30, and included questions about farming, perceptions about population growth, well-being, land
use, education, and believes regarding the past as well as the future. 2 This research has been funded by the Bill and Melinda Gates Foundation and is a collaborative work
between Purdue University, Michigan State University, and the International Food Policy Research
Institute. Other countries included in this project are Kenya, Malawi, Mozambique, and Zambia. A
comprehensive set of project results is forthcoming as a special issue of the journal Food Policy. For more
information, please contact the author.

6
farm income. The indirect effect of population density on input demand and output
supply comes from population’s direct influence on wages, factor prices, and
landholding. The direct effect of population density on input demand and output supply
comes from leftover general equilibrium effects not captured in factor prices or
landholding. Therefore, throughout this thesis, we consider both the indirect and direct
pathways of influence and incorporate them both into our analysis.
1.4 Organization
The remainder of this paper is structured as follows. The next chapter presents
some background on Ethiopia, considering the nation’s institutional history and how
present population density distribution and agricultural practices are influenced by this
past. The conceptual framework and methods used in the analysis are presented in
chapter 3. The final chapters, 4 through 6, present the data, results, and conclusions,
respectively. An appendix is provided at the end of this thesis, giving more information
on field group survey results and information from our discussions.

7
CHAPTER 2: LITERATURE REVIEW
Understanding the factors that determine why the people of Ethiopia have located
in particular regions over time is important to the analysis of population density and
agricultural productivity in the country. Historical, political, cultural, and agro-ecological
factors have played an important role in people’s decisions to locate in certain areas.
Highland and lowland dynamics, resettlement programs, and land policy have all helped
to shape the present distribution of population in Ethiopia and, congruently, population
density and many agricultural practices. We discuss these relationships and their interplay
throughout this chapter. Correspondingly we cite existing literature where relevant, and
hence wind a literature review throughout the thesis.
2.1 Highland and Lowland Dynamics
Consideration of highland and lowland dynamics is necessary for understanding
the process of resettlement and land policy in Ethiopia. Throughout its history, most of
Ethiopia’s population lived at high elevations, between 1,500 and 2,300 meters; see
Figure 2.1. Throughout the structural transformation process and the expansion of
markets more people began to migrate, and the lines between the different regions blurred
(Pankhurst, 2009). However, the geographical, societal, and historical reasons for the
varied development between the highlands and lowlands remain important, particularly
for the analysis of population density and agricultural practices in the country.

8
Figure 2.1: Ethiopian Elevation Map
(Ethiopian Review, 2013)
The highlands have many advantages which led to their early development and
corresponding population expansion. First, the highlands benefit from steady rainfall and
plateaus which were at the outset conducive to the development of agriculture. Second,
the highlands benefit from centuries old technological innovations on ox-ploughs, which
led to intensification of production and expansion of land under cultivation (Hammond,
2008). This also may have permitted and encouraged initial growth in population as it
was possible to grow more food. Third, the land-tenure system which developed in the
highlands is based on kinship groups that allocate cultivation rights to individuals. This

9
institutional framework encouraged friendly relations, long-term security, and general
tenure stability in the highlands, which generated investment in land and encouraged
technology adoption. The combination of these factors permitted the development of
agricultural surplus, along with early state and central social formations. The higher
development potential and favorable conditions of the highlands encouraged population
to grow and population density to correspondingly expand (Pankhurst, 2009).
Conversely, the lowlands suffer from developmental stagnation and have lower
population density than the highlands. The lowlands are characterized by variable and
limited rainfall, shallow soils, and constraints on human settlements due to limited water
availability and foreign diseases, in particular malaria. These conditions did not
encourage agricultural development, so technological innovations in the lowlands did not
progress beyond hoe and shifting cultivation techniques. As a result, the lowlands are
primarily pastoral3 with households frequently participating in seasonal migration and
small-scale farming activities. Contrary to the highlands, these unfavorable conditions
discouraged population density expansion and development of agricultural practices in
the lowlands.
The historical and current physical, cultural, and economic differences between
the highlands and lowlands, explain the variation in their population density as well as
the diverse agricultural practices utilized in different areas. This impacts which strategies
are appropriate for agricultural development.
3 Pastoralists primarily herd goats, although there are some sheep and cattle, as well.

10
2.2 Redistribution
Despite Ethiopians’ historical inclinations to settle in one location or another, the
Ethiopian government has practiced land redistribution for decades. Redistribution, often
referred to as “resettlement” or “villagization”, has occurred due to overcrowding
throughout the Ethiopian highlands. These practices, which began in the nineteenth
century, continued into the twentieth century as cropland available to each family
declined drastically due to rising population. In redistribution programs, families were
moved from one, generally more populated region (often in the highlands), to another,
less populated region (often in the lowlands). This process occurred forcibly during the
1970s and 1980s, and voluntarily during the 1990s and 2000s (Pankhurst, 2009).
In resettlement programs, during the 1970s and 1980s, under the Marxist Derg
government, households were moved to seven randomly selected sites. These sites had
not been analyzed by ecologists, agronomists, or economists to determine the influence
that the new population might have on the land or how the land might receive such a
large influx of people. Furthermore, the resettlers and the host populations were not
consulted about the programs (Tareke, 2009). The locations chosen for resettlement were
largely ill-suited for agriculture and in 1971, the first year of the program, as many as 5.5
percent of those resettled died of starvation. In addition, since many of these locations
were in the lowlands, many settlers died of diseases that did not exist in the highlands, in
particular malaria (Tareke, 2009). Cultural factors and ethnic strife also generated
problems between the resettled and host populations. As a result, as many as 14 percent
of resettled families ultimately returned to their original homes or moved to urban areas
(Tareke, 2009).

11
A voluntary version of the resettlement program has been attempted under the
present federal democratic government. However, this program was only voluntary in the
sense that those being relocated were given a choice about doing so. Host populations
were still not consulted. In the regions where families were resettled, land was often
seized from already established households to give to arriving settlers. As a result, the
program was largely unsuccessful, primarily due to animosity from host populations.
Further, land seizure generated feelings of tenure insecurity that remain problematic
across the country today, and continue to influence agricultural practices and
productivity. It has been suggested that households which were redistributed, and remain
insecure about tenure, still have less land, and despite increased propensity to use modern
inputs, have generally lower output per hectare per hectare (Ali et al., 2011).
Once again, many resettlers have returned to their original homes. However, some
focus group participants from our May 2012 indicated that they were participants in the
resettlement program from the 2000s and were pleased with their new home. This
favorable outlook was largely due to the greater availability of land in the region,
although many voiced concerns about declining soil quality and increased disease rates.
Even with numerous resettlement programs in Ethiopia, the distribution of land is
highly unequal (Kebede, 2006). This indicates that there has been a lack of success in
attempts to equalize land ownership in the nation, even although this was a goal of
redistribution programs. Overall land redistribution and resettlement programs in
Ethiopia have been perceived as unsuccessful.

12
2.3 Land Tenure
It is not surprising that the Ethiopian government’s resettlement practices have
generated a sense of tenure insecurity among smallholders. This insecurity, combined
with the historical relationship between the highland and the lowland populations, has
repercussions for land use and agricultural practices in the country. As population density
has increased, tenure rights have become even more tenuous, further straining already
tried relationships.
All land in Ethiopia is officially owned by the government. This has been true
since the Marxist Derg government took power in the 1970s and continues in the present
federal democratic republic. Specific land use rights, however, are granted to every
Ethiopian who wants to engage in agriculture. In principle, this guarantees land to any
native citizen who desires to make a living by farming. When this system was put in
place in 1995, it increased demand for land, so the federal government undertook a
program of land reassignment to ensure that the law was carried out. These new
assignments of land were intended to occur through administrative reallocation of land.
However, the process generated conflict and undermined existing tenure security. As a
result, the redistribution program threatened the new government’s popularity. Therefore,
in 1997, the constitution was updated, and the federal government ceded the
responsibility of land allocation to individual regions (Jemma, 2004). Hence, present land
policy is dictated by the federal government, but is carried out by individual regional
governments.
Present land policy does not allow for the legal sale of land, although inheritance
of land is legal (Ali et al., 2011). This land policy creates a weak rental market (Teklu,

13
2008), encourages urban migration (de Brauw and Mueller, 2012), and fosters a general
feeling of tenure insecurity (Holden and Yohannes, 2002; Devereux, 2000; Ali et al.,
2005; Deininger and Jin, 2006). In addition to feelings of insecurity indicated in the
literature, our field group discussants in May 2012 regularly mentioned insecure feelings
of tenure and anxiety about rights to their land. While some of this resulted from previous
redistributions, many participants also mentioned a “use it or lose it” policy, in which un-
used or under-used land may be seized by the government. This undermines tenure
insecurity, and further discourages agricultural practices centered on fallow periods.
One interesting finding that emerged from the focus group discussions was that
farmers in areas with good market access felt less secure in their tenure. This was
especially true in the village of Sirbana located along the highway between Nazareth and
Addis Ababa. In recent years investors built large-scale flower farms for the international
export market. Although many members of the community were able to find jobs at the
flower farms, they also felt their land could be seized at any time in order to expand the
flower cultivation projects.
The focus group discussions also revealed that tenure insecurity continues to
influence input decisions and therefore agricultural productivity and intensification of
farmers. Many smallholders felt that their feelings of insecurity increase the amount of
investment which they put into their land, and therefore influence their agricultural
practices. Although this is a perception from farmers in our field group surveys and a
body of literature (Holden and Yohannes, 2002; Deininger et al., 2009; Deininger and
Jin, 2006), some studies have noted that the reverse is actually true (Pender, 2001). Ali et
al. (2011) in particular noted that limited tenure rights negatively influences investment

14
in Ethiopia, particularly in the case of tree crops, despite beliefs of farmers that
investment was actually increased.
2.4 Population
Exacerbating the issues of redistribution and insecure tenure is the large and
persistent increase in population throughout Ethiopia. With an United Nations (UN)-
projected growth rate of 3.2 percent annually, the population is expected to reach 160
million people by 2050 (Population Reference Bureau, 2012). This growth is largely
driven by the nation’s young age structure, a fertility rate of 5.1 children per woman, and
fewer than 10 percent of women using contraception.
As previously discussed, the distribution of population in Ethiopia is important for
determining relative densities. The UN projects that most population growth in the next
several decades will occur in the highlands, due to rising disease rates and increasingly
poor environmental conditions at lower altitudes. Further, all focus group participants
expressed concern over the growing population and the constraints on farming associated
with an increased demand for land. Many noted that farm sizes are decreasing due to
large families and longer lifespans in older generations. These concerns were even
greater in highland villages.
Ethiopia’s economy is dependent on agriculture and a strong relationship exists
between population density and agricultural productivity. Agriculture contributes 41
percent of GDP and over 85 percent of employment (World Factbook, 2012). The way in
which Ethiopian farmers respond to increased population pressures will have an impact

15
on millions of smallholder farmers in Ethiopia, as well as on the food sustainability and
independence of the entire country.

16
CHAPTER 3: METHODOLOGY
This section presents the outline for our estimation of the impact of population
density on landholding, factor prices, input demand, output supply, and farm income. We
additionally discuss the indirect and direct pathways through which population density
influences supply of staple crops, demand for inputs, and the influence which it has on
agricultural productivity.
3.1 Methodology Overview
Our conceptual and empirical model is motivated by Boserup (1965) and Hayami
and Ruttan (1970). Their theories both postulate that prices will influence supply of staple
crops and demand for modern inputs. Therefore, we first discuss the role of population
density on landholding and factor prices. As land rental markets in Ethiopia are thin and
under-developed, prices for land are unreliable. Therefore, we use farm size as a proxy
for the price of land. Second, we conceptualize how population density influences a
utility maximizing household’s demand for modern inputs, supply of staple crops, and
farm income. Table 3.1 presents a full list of explanatory variables used in our analysis.
Table 3.2 also shows these variables, displayed in a manner that reflects where they
appear in the different equations, which will be discussed later in the chapter.
Our hypothesis is that population density has both indirect and direct influences
on agricultural productivity. The indirect effect of population density on input demand,

17
output supply, and farm income comes from its direct influence on wages, fertilizer
prices, food prices, and landholding. These factors in turn have a direct effect on
agricultural productivity, so we obtain the indirect effect (partial derivative) on
productivity with respect to population density. The direct effect of population density on
input demand, output supply, and farm income comes from general equilibrium effects
not captured in factor prices or landholding, such as improved information and
institutions, as well as reduced transaction costs. Figure 3.1 shows these relationships in a
flowchart.
Figure 3.1: Indirect and Direct Influences of Population Density on Input Demand and
Output Supply (Chamberlain, 2013)
Rural population
density
Output prices
Wagerates
Landholding
Input demand
& Output supply
Information
Land prices
Non-market institutions
observedintermediateoutcomes
observedfinal
outcomes
unobservedintermediateoutcomes
observeddriver

18
Table 3.1: Variables Used in the Empirical Analysis, with Definitions
Dependent variables:
Fertilizer use / cultivated area Kilograms of fertilizer used per cultivated area (hectares) in a
year
Maize yield Kilograms of maize produced per hectare in a year
Teff yield Kilograms of teff (white) produced per hectare in a year
Income / cultivated area Farm income (birr) per cultivated area (hectares) in a year
Landholding* Amount of land owned by a household (hectares)
Daily wage* [Log] Wage rate for agricultural labor per day (birr)
Fertilizer price* [Log] Price of fertilizer per kilogram (birr)
Prices* [Log] Previous year prices (birr) of maize and teff per kilogram
Regressors:
Population density* Total population per square kilometer land – constructed using
GRUMP estimates for population and GAEZ population for land
NPP Net primary productivity (NPP) is a measure of the rate at which
chemical energy is stored as biomass in a given period, proxy for
agricultural production potential in a particular area (mass in
grams of carbon per square meter per year)
Elevation Elevation of the area of interest (meters)
Elevation squared Elevation squared of the area of interest (meters squared)
Value of assets Sum of value of assets of household (birr)
Agricultural cooperatives Number of agricultural cooperatives in the respective area
Distance to cooperative Distance, in kilometers to the closest agricultural cooperative
(km)
Distance from the capital Distance, in kilometers, from the capital to the village (km)
Distance to a paved road* Distance, in kilometers, from the village to a paved road (km)
Rainfall 10-year average* Rainfall average for the ten years prior to the year of interest
(mm)
Annual rainfall average* Rainfall average for the year of interest (mm)
Female headed household* Dummy variable: if household is female headed = 1
Recent death* Dummy variable: if household experienced recent death of adult
(over 18) in household = 1 (proxy for shock to a household)
Land lost during
redistribution
Dummy variable: if household lost land during redistribution in
1995 = 1
Highest grade* Level of education attained by household head (0 through 14,
with 13 indicating some college, 14 indicating college degree)
Adult equivalents* Number of adult equivalents in household
Oxen* Number of oxen owned by household
Note: An * denotes that a time average of the variable is also included in regressions

19
Table 3.2: Variables Used in Empirical Analysis
landhold
ing
mai
ze p
rice
teff
pri
ce
fert
iliz
er p
rice
dai
ly w
age
inco
me
fert
iliz
er u
se
mai
ze y
ield
teff
yie
ld
fem
ale
hea
ded
rece
nt
dea
th
hig
hes
t gra
de
land l
ost
adult
equiv
alen
ts
oxen
asse
t val
ue
cooper
ativ
e dis
tan
ce
road
dis
tance
capit
al d
ista
nce
net
pri
mar
y p
roduct
ivit
y
ten y
ear
rain
av
erag
e
annual
rai
n a
ver
age
agri
cult
ura
l co
op
erat
ive
popula
tion d
ensi
ty
elev
atio
n
elev
atio
n s
quar
ed
yea
r dum
my
landhol
ding / x x x x x x x x x x x x
maize
price / x x x x x x x x x x
teff
price / x x x x x x x x x x
fert.
price / x x x x x x x x x x x
wages / x x x x x x
income x x x x x / x x x x x x x x x x x x x
fert. use x x x x x / x x x x x x x x x x x x x x x
maize
yield x x x x / x x x x x x x x x x x x x
teff
yield x x x x / x x x x x x x x x x x x x

20
3.2 Farm Size and Population Density
Ex ante we expect changes in population density to influence cultivation practices
and farm size. As land rental markets in Ethiopia are thin and under-developed, prices for
land are unreliable. Therefore, we use farm size as a proxy for land price. This is based
on the idea that as population density increases the price of farm land will increase as
land per capita declines, which implies that land prices increase. Boserup (1965)
postulates that when population density increases, farming intensity also increases. This
is a result of farmers moving away from long towards short fallow practices, and
ultimately to annual and multiple cropping systems. They do so in order to accommodate
rising populations and increased demand for food. Further, as population increases, and
land is passed down from parents to children, it is divided into smaller plots, leaving less
land for each household. Hence, over time, cropping will become more frequent and will
be done on smaller plots of land. For household i a community at time t, we considering
landholding, :
(1)
where the variable of interest is the amount of land held by a household, measured in
hectares. The subscript refers to parameters of landholding. Landholding is largely
determined by household factors, as well as by the influence of population density. In
equation (1), population density is represented by , and is the corresponding
parameter. A matrix, , of household-level factors includes asset value, whether the
household lost land during redistribution, the highest grade attained by the head of the
household, whether the household is female-headed, the number of adult equivalents in

21
the household, and the number of oxen which the household owns. The term is the
corresponding parameter vector and is the error term.
In our analysis, landholding serves as a proxy for the price of land. As previously
mentioned, land markets are thin due to institutional issues which discourage land rentals,
and prohibit the purchase and sale of land. Therefore landholding should be regarded as a
quasi-fixed factor that we would expect to decrease as population density increases.
3.3 Prices and Population Density
The effect of population density on input prices comes from the theory of induced
innovation, adapted to the process of agricultural development by Hayami and Ruttan
(1970). The theory implies that as population grows, ceteris paribus, land becomes scarce
relative to labor. The change in the land to labor ratio causes the price of labor to
decrease relative to the prices of land. At the same time, increased population density
leads to increased demand for food. As a result, population growth may put upward
pressure on food prices. We estimate all prices as the natural logarithm of each respective
variable, in order to normalize the distribution of the data and interpret the coefficients as
partial elasticities.
3.3.1 Wages
We estimate the logarithm of daily agricultural wages for household i at time t
as:
(2)

22
where population density is represented by , and is the corresponding parameter.
The subscript refers to parameters of wage. A vector
of household-level factors
includes whether a household is female headed and the education level of the head of
household; with a corresponding parameter vector . A matrix
of community-level
variables includes the number of agricultural cooperatives in the region, the distance from
the village to the nearest to the agricultural cooperative, the distance of the village from
the capital the net primary productivity of the soil in the area (NPP), and a ten-year rain
average; with a corresponding parameter vector and the error term is .
3.3.2 Staple Crop Prices
Similarly, we can estimate previous years’ log prices of maize or teff received
by household i at time t as:
(3)
where the output price of interest, represented by , is either the price of maize or the
price of teff. The subscript refers to parameters related to the prices of staple crops.
We use lagged prices, based on the previous rounds’ prices4, in order to be able to
connect this equation to other equations in the system of equations, presented later.
Prices are determined by community factors, including distance to an agricultural
cooperative and the net primary productivity of the soil. As previously: represents
population density, while is the corresponding parameter. A matrix of
4 For the first round in our data, 1993, we use data collected in 1989. The year 1989 was the first round of
the ERHS, but we have chosen not to use it in our study. This round had fewer households than later
rounds, and also was limited in scope. For 1994, we use 1993 prices, for 1995, we use 1994 prices, and so
on.

23
community-level variables includes the distance from the nearest agricultural
cooperative, the number of agricultural cooperatives, the distance from the village to the
capital, the net primary productivity of the soil in the area (NPP), and a ten-year rain
average; with a corresponding parameter vector and the error term is .
3.3.3 Fertilizer Price
Finally, we estimate the log price of fertilizer, , for household i at time t as:
(4)
where the input price of interest estimated by is the price of fertilizer. As mentioned in
the previous section, prices are largely determined by community factors. As previously:
represents population density, while is the corresponding parameter. A matrix
of household-level factors includes only whether a household is female headed and is
the corresponding parameter vector. A vector of community-level variables the
number of agricultural cooperatives in the region, the distance from the village to the
nearest to the agricultural cooperative, the distance of the village from the capital the net
primary productivity of the soil in the area (NPP), and a ten year rain average and is
the corresponding parameter vector. Again, the error term is
3.4 Demand for Modern Inputs and Output of Staple Crops
The increase in the price of staple food crops should induce a supply response
where farmers adopt technology to increase production of staple crops. Therefore, an
increase in population density induces farmers to further intensify and adopt modern

24
inputs, in order to increase output on smaller plots of land. However, this assumes that
farmers have adequate resources to access such inputs as their farms become smaller.
This is not always the case, particularly as population becomes denser, and households
face the constraints of small farm size and limited resources, such as access to credit that
could be used to purchase modern inputs like fertilizer. Below, we provide more details
for fertilizer use, staple crop production, and farm income.
3.4.1 Fertilizer Use
For household i at time t, demand for modern inputs such as chemical fertilizer,
denoted by , is:
(5)
Population density, , along with its parameters , are as previously defined. The
subscript refers to parameters related to the use of fertilizer. Prices, , includes the
price of fertilizer and represents landholding. and as the corresponding
parameters. Wages, , is also included as an explanatory variable along with its
parameter, . A vector of community-level variables includes the net primary
productivity of the soil, the number of agricultural cooperatives, distance to an
agricultural cooperative, and a ten-year rain average. is the corresponding parameter
vector. A matrix of household-level factors, , includes the household’s value of assets,
whether the household lost land during redistribution, highest grade attained by the head
of household, whether the household is female headed, and whether there was a recent
death in the household while is the corresponding parameter. is the error term.

25
3.4.2 Staple Crops
In the equation for output supply, represented by both maize and teff yield, , for
household i at time t, is:
(6)
This equation represents either maize or teff output supply. The subscript refers to
parameters related to the yield of staple crops. All terms are as previously defined,
although in this case prices, include the price for the crop of interest in the equation and
the price of fertilizer.
3.4.3 Farm Income
Finally, in the equation for farm income, , for household i at time t, is:
(7)
All terms are as previously defined, although in this case prices, , includes the price
for both maize and teff, as well as the price of fertilizer. The subscript refers to
parameters related to farm income.
3.5 Direct and Indirect Pathways
In equations (1)–(4) the indirect pathways are measured through landholding,
daily wages, and prices of maize, teff, and fertilizer.5 In equations (5)–(7) the direct
5 Both the within-estimator and the time-average estimator are included for all indirect factors. More
information will be given on this in the following section.

26
pathways are measured, representing factors such as information flow, transaction costs,
and institutions. When the direct and indirect pathways are added together, the influence
of population density on each variable is determined.
In order to derive the effect of population density on input demand, , we
rewrite equation (5) as:
(8)
We define the total derivative of , with respect to as:
(9)
which can also be written as:
(10)
We refer to α as direct effect of population density on the outcome of interest. In the case
of fertilizer, is the direct effect of population density on fertilizer demand. The indirect
effect of population density on fertilizer demand through wage rates is and is equal
to
in equation (9), and in equation (10). The indirect effect + the
direct effect give us the total effect of population density on fertilizer demand.

27
The effect of population density on maize and teff yield, and farm income is
derived in an analogous manner.
3.6 Empirical Estimation
In our estimation we first run our model on an equation-by-equation basis,
utilizing the correlated random effects estimator. We do so in order to address potential
correlation between the entire history of the explanatory variables and the random
household effects. These unobservable factors (denoted ) include characteristics such as
motivation, risk aversion, and inherent ability of farmers. In order to use the CRE
estimator we decompose the error , as = + , where represents the time-varying
unobserved shocks. The CRE estimator is based on the assumption that the unobserved
heterogeneity takes on the form of ̅ where ).
Here ̅ is the time average of household level characteristics in all of the equations
(Mundlak, 1978; Wooldridge, 2010). To functionalize the CRE estimator it is necessary
to include ̅ in the specification of the different equations. The CRE estimator produces
coefficient estimates for the original (non-averaged) variables that are identical to those
generated by a household-level fixed effects model (Wooldridge, 2010). The additional
benefit from the use of the CRE estimator is that it does not remove time-constant
covariates from the model, unlike a fixed-effects specification. As some variables
considered do not vary over time (such as distance to an agricultural cooperative and
whether a household lost land during redistribution), it is important to retain these
variables without including a time-averaged version. The CRE estimator is implemented
by running a simple pooled regression on the expanded model specifications. In order to

28
correct for heteroskedasticity and correlation across time we use robust standard errors
with non-zero covariances at the household level (“clustered” standard errors).
Next, we run the CRE-specification as a seemingly unrelated regression (SUR)
model. As our system is non-recursive, it is worth noting that this estimation is the same
as three stage least squares (3SLS). Further, it still allows a relationship between
unobserved factors and observed variables. We control for heteroskedasticity and
correlation within households in our equations through using a clustered bootstrap
procedure at the household level (see Stata, 2013, for details), running 500 repetitions.
The SUR setup assumes that equations are related, with the errors correlated across the
system. As expected, the estimation results for the equation-by-equation approach and the
SUR approach are very similar, and we therefore concentrate on the more efficient SUR
results in our below discussion of the estimation results.
We argue that population density is exogenous in our equations in the sense that it
is not correlated with household-level time-varying unobservable shocks. As reverse
causality could be a potential problem we have tested for potential endogeneity of
population density using the control function method, with agro-ecological factors
serving as instruments for population density (Wooldridge, 2010). Using this method we
found that endogeneity is not present in any of the equations. Finally, as we use the CRE
method to deal with correlation between population density and time-constant
unobserved factors, omitted variable bias should not be a problem, especially when we
include agro-ecological factors, such as, elevation and its square, net primary
productivity, and rainfall in all equations.

29
CHAPTER 4: DATA
Data used in this thesis comes from three sources. First, we use nationally
representative household-level data on smallholder farms in Ethiopia. Second, we use
GIS data, collected from GRUMP and GAEZ databases. Finally, we use qualitative data
collected in Ethiopia in May of 2012 in field group survey discussions. All three sources
are discussed in this chapter.
4.1 Ethiopian Rural Household Surveys
Household-level data used in this study comes from survey data sets collected in
Ethiopia by the International Food Policy Research Institute (IFPRI). The nationwide
Ethiopia Rural Household Survey (ERHS) is a panel dataset tracking approximately
1,500 households in eight survey waves over the twenty year period from 1989 to 2009.
We use the center six waves of the survey, which include 1993, 1994, 1995, 1997, 1999,
and 2004, and cover 1,293 households.
The households are located across 15 villages, which were selected to cover
diversity in the farming systems in the country, including grain-plough areas in the
Northern and Central highlands, as well as the enset-growing area and sorghum-hoe areas
in the lowlands (Dercon and Hoddinott, 2011). Efforts were also made to include a span
of population densities, which makes it an ideal source for this study; see Figure 4.1.

30
However, as the data only considers rural, non-pastoral households, it is not considered to
be nationally representative, although it is broadly representation of small-holder
subsistence farmers.
The data set includes consumption, asset, and income data, as well as household
characteristics, agriculture and livestock information, food consumption, as well as on
health and women’s activities. The data set also includes community-level data on
electricity, water, sewage, roads, and general facilities.
Figure 4.1: Ethiopian Population Density Map, with Survey Villages
(Heady et al., 2013)

31
4.2 GIS Data
We combined two regional databases describing spatial distributions of rural
population (GRUMP and GAEZ; see below) to generate estimates of population density.
Estimates of rural population density are derived from the Global Rural Urban
Mapping Project (GRUMP) database. The dataset provides gridded estimates of local
population densities, beginning with sub-national census data and allocating the
population to a specific area. This allocation is based on where people are generally most
likely to settle. GRUMP separates the urban and rural components of local population
with the rural component being equally allocated between all rural grid cells in the area.
Information on land resources was obtained from the Global Agro-Ecological
Zones (GAEZ) 3.0 database. This data consists of gridded estimates of local land and
agro-climatic resources, including soils, terrain, land cover, and other climate indicators.
It also contains derived estimates of agricultural suitability and potential yields for a
multitude of commodities under given management levels. Using the land cover
components of the GAEZ database, we create three definitions of “land.” Areas are
classified as 1) under cultivation, 2) under cultivation or grassland, and 3) under
cultivation or grassland or forest/woodland. The motivation behind the adoption of
multiple definitions was to evaluate the robustness of the analysis to alternative
definitions. Classification 1 reflects currently available farmland while classifications 2
and 3 indicate potentially available farmland, if adequate costs are incurred to alter
grassland and forest land to farming. We use the latter and broader definition in our

32
analysis6, as Ethiopian farmers cultivate tree crops, which cannot be distinguished from
forest or woodland in GAEZ. Additionally, forest and woodland areas are also used by
farmers as grazing areas for animals. Therefore, using this broader definition of land
allows for the capture of all potential uses of land by rural farmers.
We combine the GIS datasets on land and rural population at the level of one
square kilometer grid cells. To generate the population density term, we took the
estimates of population from GRUMP and divided those numbers by the estimates of
land from GAEZ. In doing so, we determine the number of persons per square kilometer,
or population density. In the construction of this variable, we omitted all pixels
categorized as rural that contained less than 10 percent land or exceeded 2,000 persons
per square kilometer, based on the assumption that populations over this level were
approaching peril-urban status or were incorrectly categorized. Ultimately, our
population density term is observed at the community-level, and population density does
not vary over local groups of households.
4.3 Field Group Surveys
Finally, we utilize field group surveys conducted in twelve of the fifteen ERHS
villages in May of 2012. Using questions designed to gain qualitative information about
farmers’ perceptions regarding population growth, land use, inheritance regulations,
farming practices, children, and the future, we use their answers to extend our
quantitative analysis and support the resulting conclusions. The primary concerns of
6 Although we chose this broader definition in this case, we have also tested with alternative, more
conservative definitions of land, in order to test for robustness. Our results are similar, regardless of
definition. For a copy of these results, please contact the author.

33
focus group participants were: 1) the rapid expansion of population across the country;
and 2) the limited generation of new area suitable for agriculture, which in the past has
generally been done by the government. These discussions made clear the challenges
facing different communities, as well as measures being undertaken to address these
problems. The insights from these surveys are incorporated throughout this thesis, as well
as included as an appendix at the end of the thesis.

34
CHAPTER 5: EMPIRICAL RESULTS
This chapter presents the quantitative and qualitative results of our study
including descriptive statistics and regression results, as well as insights from our field
group discussions. We first present descriptive statistics regarding the relationship
between population density and agricultural intensification. Subsequently, we discuss our
results and the total effects of population density on agricultural productivity.
5.1 Descriptive Statistics
Based on agricultural data from the ERHS and population density data derived
GRUMP and GAEZ, we construct six lowess7 smoothing graphs where population
density is on the x-axis and the measures of agricultural intensification are on the y-axis.
In order to understand these graphs, we have constructed an associated table with
population densities at different percentile levels; see Table 5.1. This table and the
corresponding graphs in Figures 5.1 through 5.6 use the same definition of land as our
regression results, so land is not weighted by arability.
7 Lowess provides a locally weighted scatterplot smoothing. The basic idea behind the function is to
generate a new variable which, for every y-variable, contains the corresponding smoothed value. The
smoothed values are obtained by running a regression of the y-variable on the x-variable. In lowess, the
regression is weighted so that the central point (xt, yt) gets the highest weight and points that are further
away receive less weight. Estimated regression lines are used to predict the smoothed value for the y-
variable only. This is repeated for all remaining values. Lowess is considered to be a desirable smoother
due to its locality – it tends to follow the data. Polynomial smoothing methods, for example, are global in
what happens on the left of a scatterplot, and can therefore influence fitted values on the right. The same is
not true for a lowess smoothing method, though, due to its central focus (see Stata 2013, for details).

35
Table 5.1: Population Density: Percentiles and Mean
The descriptive figures illustrate the unconditional effects of population density
on the factors of interest, as they do not hold all other factors constant as in a regression
context. As such, these figures describe and illustrate general trends for agriculture in
Ethiopia, which are instructive for informing the overall results of our analysis and
conclusions.
Figure 5.1: Landholding per Adult Equivalent
In Figure 5.1, the amount of land held by each adult equivalent decreases
constantly. Although there is a slight increases around 250 people per square kilometer
(just below the 75th
percentile), the amount of land consistently decreases across
25th percentile
50th percentile
75th percentile
99th percentile.2.3
.4.5
.6
land
ho
ldin
g p
er
adu
lt e
quiv
ale
nt in
(h
a)
0 200 400 600population / square km of land
Percentile 10th
25th
50th
75th
90th
Mean
Population Density
(persons / km2)
80 107 158 279 394 210

36
population densities. Since the quantity of land in an area is ultimately fixed, less land is
available for each individual as population grows, causing the landholding per adult
equivalent to decrease. This follows Boserup, who predicted that population density will
cause increased demand for land, represented ultimately by less land held by person.
Figure 5.2: Adult Equivalents per Cultivated Area
In Figure 5.2, the number of adult equivalents per area cultivated increases as
population grows, although there is a slight decline just below 400 people per square
kilometer (just above the 90th
percentile). As there are more individuals in an area, less
land is available and therefore there are more people on the land area which is cultivated.
This follows Boserup who predicted increased demand for land, and as a result, more
people per unit of land, as population grows.
25th percentile
50th percentile
75th percentile
99th percentile010
20
30
40
ad
ult e
quiv
ale
nt pe
r cultiv
ate
d a
rea
in (
ha
)
0 200 400 600population / square km of land

37
Figure 5.3: Fertilizer Use per Cultivated Area
In Figure 5.3, the expenditure on purchased inputs per hectare increases to around
300 people per square kilometer (just above the 75th
percentile), and then declines
slightly. This implies that there is some threshold at which people begin to use less
fertilizer per hectare. There could be many reasons for this, including supply availability,
credit constraints, and diversification to crops8 which do not require fertilizer. Frequently
in our field group discussions from May 2012, participants discussed lack of available
credit to purchase fertilizer as being a significant barrier that prevented them from
purchasing more fertilizer. This is likely worse in areas of high population density where
small farm sizes limit credit availability with which to purchase fertilizer. Additionally,
our focus group discussions revealed that some farmers in densely populated areas have
diversified into to tree crops, such as coffee and chat, as they generally require less
8 Diversification crops generally include cash crops, which are not typically grown. These include tree
crops, such as coffee and chat, as well as vegetables, such as green beans, onions, and squash.
25th percentile
50th percentile
75th percentile
99th percentile
10
20
30
40
50
60
fert
ilizer
use
per
cultiv
ate
d a
rea in
(h
a)
0 200 400 600population / square km of land

38
fertilizer. Due to barriers which influence input access in Ethiopia, fertilizer use is only
used up until a point, after which, it is not used in regions of greatest population density.
Figure 5.4: Daily Agricultural Wage
Figure 5.4 shows that hired agricultural wages decrease from around 300 people
per square kilometer (just above the 75th
percentile). With an increase in the number of
people in a region looking for work, given the same number of jobs available, the price of
labor will be driven down, as predicted by Hayami and Ruttan. This has strong
implications for off-farm income and household income. Even if people work more hours
they may not make as much money as off-farm laborers in the most densely populated
regions, simply because the wages are so much lower in these regions.
25th percentile
50th percentile
75th percentile
99th percentile12
34
5
da
ily a
gri
cultu
ral w
ag
e in (
bir
r)
0 200 400 600population / square km of land

39
25th percentile
50th percentile
75th percentile
99th percentile
15
00
20
00
25
00
30
00
35
00
40
00
asse
t valu
e p
er
ad
ult e
qu
iva
lents
0 200 400 600population / square km of land
Figure 5.5: Farm Income per Cultivated Area
In Figure 5.5, farm income per hectare cultivated increases until around 350
people per square kilometer (just below the 75th
percentile). This implies the highest
population density has the least income per cultivated area and that the people at the
middle population densities have the greatest income per cultivated area.
Figure 5.6: Asset Value per Adult Equivalent
25th percentile
50th percentile
75th percentile
99th percentile
40
00
60
00
80
00
10
00
012
00
014
00
0
farm
inco
me p
er
cu
ltiv
ate
d a
rea
in (
ha
)
0 200 400 600population / square km of land

40
In Figure 5.6 the value of assets per adult equivalent decreases as population
density increases. It is quite high initially, but then decreases consistently beginning
around 150 people per square kilometer (just above the 25th
percentile). Assets serve as a
proxy for wealth, and this graph implies that the poorest people are in regions with the
highest population densities, decreasing from the least dense population densities which
have the wealthiest individuals. Following Figure 5.5, those who have less income, at the
densest regions, also have the least value of assets.
These diagrams, all together indicate that landholding and cultivated area per
adult equivalent decline with increased population density, and correspondingly farm
income also declines. They also suggest that coping strategies, including working off-
farm and using more labor-intensive inputs, may be problematic, the former due to low
wage rates, and the latter due a threshold beyond which it is difficult to use fertilizer.
These figures also suggest the existence of several thresholds, or turning points. These
indicate that some agricultural adaptations to increasing population density, in particular
fertilizer use (representing increased use of labor intensive inputs), are not possible
beyond a certain point and therefore other strategies must be investigated. While these
thresholds are not incorporated at this time into regression models, these lowess figures
are able to give us general strategies and information regarding population density and
intensification.
5.2 Estimation Results
In this section, we present results for factors affecting agricultural intensification
and income using the linear correlated random effects specification estimated with a

41
seemingly unrelated regression (SUR) estimator. Following Mundlak (1978), the
specifications include a long-term household average of all time-varying variables, and a
time-varying component of each variable. These former terms can be interpreted as the
long-term effect of the variable of interest, over the 11-year period of the survey. The
latter terms are equivalent to the fixed effects, or within estimator. We also include the
joint direct effect of the time-varying component and the time-averages of each variable.
Each of our tables includes 3 columns. The first column shows the time-varying
covariate, while the second column shows its time-average, where applicable. If the
variable does not vary over time, it obviously it does not have a time-constant
counterpart. The coefficients on the time-varying covariates are the within households
estimators. The third column shows the results of a joint test which indicates the
influence of the combined short-term and long-term effects, from the first two columns,
and is referred to as the joint direct effect. In regard to population density, it can also be
interpreted as the direct effect. The magnitude of this effect indicates the direction and
total value of the two terms together.
5.2.1 Prices and Landholding
The results for factors affecting landholding, daily agricultural wages, prices of
maize and teff, and fertilizer are found in Table 5.2 through Table 5.11. Tables 5.2, 5.4,
5.6, 5.8, and 5.10 are the results from the equation by equation models, and Tables 5.3,
5.5, 5,7, 5.9, and 5.11 are the results from the SUR models.
We first consider landholding. The direct effect of population density indicates
that higher populations lead to significantly smaller landholdings. This effect suggests
that, on average, a 10 person increase in population density decreases landholding by

42
0.013 hectares. Further, population density and its long-term average are both significant
in the equation by equation and SUR models, suggesting that population density causes
an increase of 0.03 hectares for every additional 10 people in the short term, while in the
long-term, it decreases by 0.04 hectares. These results suggest that while population
density may not influence landholding negatively in the short-term, it does decrease it in
the long-run. The magnitude is slightly larger in the short-term in the SUR model, than in
the equation by equation model.
For the other explanatory variables, we will only discuss the joint direct effects of
each, for the sake of parsimony. Of these, the highest grade attained by the head of
household, whether the household is female headed term, whether the household suffered
a recent death, the number of adult equivalents, and the number of oxen are both
significant in both models. First, for an additional grade attained by the head of
household, there is an additional, increase in landholding of 0.05. This suggests that
greater education results in greater landholding, and there is benefit to famers who
continue in school. Second, if a household is female-headed, it holds 0.43 fewer hectares
of land than households which are not female headed. This indicates that women hold
less land than men, on average. Third, a death in the household increases landholding by
0.35 hectares. This increase may result from inheritance of the additional land from the
deceased. Finally, an additional oxen or additional adult equivalent in the household
results in an increase in landholding of 0.6 and 0.04 hectares, respectively. These findings
makes sense, as households with more members require more land on which to produce
more food, and they also have more available labor, which could be provided by family
members or by oxen.

43
Table 5.2: Factors Affecting Landholding, CRE Equation by Equation
Time-Varying
Covariate
Time-Average
Covariate
Joint Direct
Effect
Population / land
0.003***
(0.001)
-0.004***
(0.001)
-0.001***
(0.0003)
Value of assets
2.61e-06
(3.05e-06)
Land lost during redistribution
-0.028
(0.062)
Highest grade
0.012*
(0.006)
0.050***
(0.012)
0.062***
(0.010)
Female-headed household
-0.134**
(0.054)
-0.309***
(0.094)
-0.443***
(0.078)
Recent death
0.014
(0.027)
0.390**
(0.173)
0.404**
(0.181)
Adult equivalents
0.002
(0.010)
0.040**
(0.016)
0.042***
(0.014)
Oxen
-0.013
(0.018)
0.587***
(0.071)
0.574***
(0.066)
Net primary productivity
-1.27e-05
(1.89e-05)
Elevation
-0.003***
(0.001)
Elevation2
5.71e-07***
(1.89e-07)
Constant
5.91***
(0.834)
Observations 7,758
R2
0.269
Note: ***, **, * denotes that the corresponding coefficients are statistically significant at
the 1%, 5% and 10% level respectively; standard errors in parentheses. Year dummies are
also included.
The dummy variable for whether or not the household lost land during the 1995
redistribution is also significant in the SUR. As discussed in the literature review chapter,
massive land redistributions have taken place for decades in Ethiopia. The results of the
SUR estimation indicate that if a family lost land, they now hold about 0.12 fewer
hectares, on average, than a family who lost no land.

44
Table 5.3: Factors Affecting Landholding, CRE SUR
Time-Varying
Covariate
Time-Average
Covariate
Joint Direct
Effect
Population / land, in km2
0.003***
(0.001)
-0.004***
(0.001)
-0.0013***
(0.0003)
Value of assets, in birr
2.39e-06
(3.10e-06)
Land lost during redistribution
-0.120*
(0.065)
Highest grade
0.014**
(0.006)
0.037***
(0.012)
0.051***
(0.006)
Female-headed household
-0.132**
(0.055)
-0.301***
(0.091)
-0.433***
(0.043)
Recent death
0.023
(0.027)
0.332**
(0.162)
0.354***
(0.090)
Adult equivalents
0.001
(0.009)
0.042***
(0.016)
0.043***
(0.007)
Oxen
-0.011
(0.018)
0.619***
(0.067)
0.608***
(0.032)
Net primary productivity
-1.17e-05
(8.55e-04)
Elevation
-0.003***
(0.001)
Elevation2
5.24e-07***
(2.01e-07)
Constant
5.78***
(0.87)
Observations 7,758
R2 0.27
Note: ***, **, * denotes that the corresponding coefficients are statistically significant at
the 1%, 5% and 10% level respectively; standard errors in parentheses. Year dummies are
also included.
With a median farm size in our sample of 1 hectare, 0.12 hectares composes about a sixth
of the average holding, and represents a substantial component of a household’s average
landholding.
Several community characteristics are also significant, including elevation and its
square term in both the equation by equation model and the SUR model. Elevation effects

45
are not marginal effects (as the other effects are), and significance is determined through
a joint test. This is true in all cases when significance of elevation is discussed hereon.
Next we consider the results for factors affecting the log of daily agricultural
wage. Factors affecting daily wages are included in Table 5.4 (equation by equation), and
Table 5.5 (SUR). As wage rates are primarily determined by an employer, worker
characteristics, rather than community or household characteristics, are likely to influence
the wage. The direct joint direct effect results indicate that daily wage has a positive
impact on population density; the coefficient suggests that over time, a 10 person increase
in population density decreases daily wage by approximately 0.5 percent, on average.
This finding suggests that in areas of higher population density labor prices rise slightly,
possibly through the positive effects generated by market and institutional development,
which provide more opportunities and higher wages for workers.
Table 5.4: Factors Affecting Log of Daily Wage, CRE Equation by Equation
Time-Varying
Covariate
Time-Average
Covariate
Joint Direct
Effect
Population / land, in km2
0.0002*
(0.0001)
0.0003*
(0.0002)
0.0005***
(0.0001)
Highest grade
-0.006*
(0.004)
0.022***
(0.008)
0.015**
(0.007)
Female-headed household
0.032
(0.022)
0.031
(0.053)
0.063
(0.049)
Elevation
-0.004***
(3.16e-04)
Elevation2
1.06e-06***
(7.87e-08)
Constant
3.99***
(0.303)
Observations 7,758
R2 0.123
Note: ***, **, * denotes that the corresponding coefficients are statistically significant at
the 1%, 5% and 10% level respectively; standard errors in parentheses. Year dummies are
also included.

46
Several household and community variables are also significant in influencing
daily wages. First, higher education levels positively drive wages. In both the equation by
equation and SUR models the coefficient for highest grade attained is positive and
significant, as more education generally leads to better jobs and better pay. In the SUR,
the results indicate that a higher grade increases wages by 0.044 for an additional grade
attained. This follows field group discussions where many participants noted that better
education leads to better jobs, although only high school education was perceived as
important. Many discussants indicated that college did not guarantee success or
employment, and therefore was not much more valuable than a high school education.
Table 5.5: Factors Affecting Log of Daily Wage, CRE SUR
Time-Varying
Covariate
Time-Average
Covariate
Joint Direct
Effect
Population / land, in km2
0.0002**
(0.0001)
0.0002
(0.0002)
0.0005***
(0.0001)
Highest grade
-0.009***
(0.004)
0.053***
(0.009)
0.044***
(0.003)
Female-headed household
0.020
(0.023)
0.039
(0.051)
0.059***
(0.021)
Elevation
-0.004***
(0.0003)
Elevation2
1.06e-06***
(8.45e-08)
Constant
3.91***
(0.32)
Observations 7,758
R2 0.11
Note: ***, **, * denotes that the corresponding coefficients are statistically significant at
the 1%, 5% and 10% level respectively; standard errors in parentheses. Year dummies are
also included.
Additionally, elevation and its square were significant, suggesting that wages are
lower at higher elevations. This makes sense, following the distribution of population in
Ethiopia, and its concentration in the highlands. In these regions, when population is most

47
dense, it is likely that more people are looking for work, and therefore, depressing the
price of wages.
Next, the results for the log prices for maize and teff can also be found in Tables
5.6 through 5.9. The results indicate that overall, population density negatively drives
maize price and teff price. As population increases, a 10 person increase in population
density decreases maize price and teff price by approximately 0.6 percent, for both crops.
Table 5.6: Factors Affecting Log of Maize Price, CRE Equation by Equation
Time-Varying
Covariate
Time-Average
Covariate
Joint Direct
Effect
Population / land
-0.0002***
(0.0001)
-0.0004***
(0.0001)
-5.94e-04***
(1.12e-04)
Number of cooperatives
-0.374***
(0.010)
Distance to cooperative
-0.014***
(0.003)
Distance to capital
-0.002***
(1.06e-04)
Distance to a paved road
-0.005***
(0.001)
0.043***
(0.003)
0.038***
(0.003)
Net primary productivity
1.39e-04***
(7.94e-06)
Ten year rainfall average
-3.73e-04***
(5.48e-05)
-0.002***
(1.03e-04)
-0.003***
(7.55e-05)
Elevation
-0.002***
(3.24e-04)
Elevation2
3.50e-07***
(8.15e-08)
Constant
3.33***
(0.35)
Observations 7,758
R2 0.743
Note: ***, **, * denotes that the corresponding coefficients are statistically significant at
the 1%, 5% and 10% level respectively; standard errors in parentheses. Year dummies
are also included.

48
This finding may initially seem counter intuitive, but maize and teff are tradable items
and with improved market access, and price information, prices may be lower in areas of
higher population density.
Table 5.7: Factors Affecting Log of Maize Price, CRE SUR
Time-Varying
Covariate
Time-Average
Covariate
Joint Direct
Effect
Population / land
-0.0002***
(0.0001)
-0.0004***
(0.0001)
-0.0006***
(0.0001)
Number of cooperatives
-0.400***
(0.009)
Distance to cooperative
-0.016***
(0.003)
Distance to capital
-0.002***
(0.0001)
Distance to a paved road
-0.007***
(0.001)
0.045***
(0.003)
0.038***
(0.001)
Net primary productivity
0.0001***
(7.52e-06)
Ten year rainfall average
-0.0004***
(0.0001)
-0.002***
(0.0001)
-0.002***
(4.01e-5)
Elevation
-0.001***
(0.0003)
Elevation2
3.06e-07***
(7.71e-08)
Constant
3.08***
(0.325)
Observations 7,758
R2 0.74
Note: ***, **, * denotes that the corresponding coefficients are statistically significant at
the 1%, 5% and 10% level respectively; standard errors in parentheses. Year dummies
are also included.
This idea is supported by several market access terms, including distance from a
cooperative, distance from the village to the capital, distance to a paved road, as well as
the number of cooperatives in the village, all of which indicate that market access is
important in determining maize and teff prices.

49
Table 5.8: Factors Affecting Log of Teff Price, CRE Equation by Equation
Time-Varying
Covariate
Time-Average
Covariate
Joint Direct
Effect
Population / land
0.0001***
(0.00003)
-0.001***
(0.0001)
-6.99e-04***
(6.86e-05)
Number of cooperatives
-0.004
(0.007)
Distance to cooperative
-0.008***
(0.001)
Distance from village to
capital
-3.76e-04***
(3.02e-05)
Distance to a paved road
-0.006***
(0.001)
0.016***
(0.001)
0.010***
(0.001)
Net primary productivity
-4.78e-05***
(4.75e-06)
Ten year rainfall average
2.69e-05 (3.73e-
05)
0.001***
(5.28e-05)
0.001***
(4.13e-5)
Elevation
0.003***
(0.0001)
Elevation2
-5.70e-07***
(3.58e-08)
Constant
-1.76***
(0.135)
Observations 7,758
R2 0.158
Note: ***, **, * denotes that the corresponding coefficients are statistically significant at
the 1%, 5% and 10% level respectively; standard errors in parentheses. Year dummies are
also included.
Finally, considering agro-ecological terms, we find that net primary productivity
is statistically significant with both models for both crops. This finding indicates that
yields vary with soil quality. Further, it suggests that higher soil quality is associated with
higher maize yield, but lower soil quality is associated with higher teff yield. This is
likely a result of the two crops having different ideal conditions, and therefore the quality
of soil impacts prices differently. Elevation and its square term, as well as the ten year
rain average are also significant.

50
Table 5.9: Factors Affecting Log of Teff Price, CRE SUR
Time-Varying
Covariate
Time-Average
Covariate
Joint Direct
Effect
Population / land
0.0001***
(0.00003)
-0.0008***
(0.0001)
-0.0006***
(6.89e-05)
Number of cooperatives
-0.010
(0.007)
Distance to cooperative
-0.01***
(0.001)
Distance to capital
-0.0004***
(0.00003)
Distance to a paved road
-0.007***
(0.001)
0.017***
(0.001)
0.009***
(0.001)
Net primary productivity
-4.90e-05***
(4.83e-06)
Ten year rainfall average
0.0001
(4.06e-05)
0.001***
(0.0001)
0.001***
(2.03e-5)
Elevation
0.003***
(0.0001)
Elevation2
-5.70e-07***
(3.71e-08)
Constant
-1.76***
(0.14)
Observations 7,758
R2 0.52
Note: ***, **, * denotes that the corresponding coefficients are statistically significant at
the 1%, 5% and 10% level respectively; standard errors in parentheses. Year dummies are
also included.
Last, in Tables 5.10 and 5.11, we present the results of the log of fertilizer price
equations. Overall, population density increase fertilizer price by 0.2 percent for every
additional 10 people in the area. This indicates that prices increase as there are more
people in a region, and increased demand for those demanding fertilizer.
Of the explanatory variables, the driving force in determining fertilizer price is
location. These factors include the number of cooperatives and the distance variables,
including distance from a cooperative, a paved road, and from the capital.

51
Table 5.10: Factors Affecting Log of Fertilizer Price, CRE Equation by Equation
Time-Varying
Covariate
Time-Average
Covariate
Joint Direct
Effect
Population / land
-0.0002**
(0.0001)
0.002***
(0.0001)
0.002***
(1.38e-04)
Female headed household
-0.006
(0.010)
-0.073*
(0.040)
-0.079**
(0.039)
Number of cooperatives
0.196***
(0.021)
Distance to cooperative
-0.028***
(0.002)
Distance to capital
0.001***
(6.66e-05)
Net primary productivity
7.00e-06
(1.05e-05)
Ten year rainfall average
1.68e-04
(1.58e-04)
-1.31e-04
(1.98e-04)
3.65e-5
(1.04e-4)
Elevation
-0.003***
(2.94e-04)
Elevation2
8.71e-07***
(7.52e-08)
Constant
5.52***
(0.328)
Observations 7,758
R2 0.412
Note: ***, **, * denotes that the corresponding coefficients are statistically significant at
the 1%, 5% and 10% level respectively; standard errors in parentheses. Year dummies
are also included.
Fertilizer prices are largely set by the government based on location, therefore the
proximity of villages to roads and markets are very important. Elevation and its squared
term are also significant and again emphasize the importance of location and elevation in
determining prices.
These results suggest that prices are influenced by community variables, while
landholding is primarily influenced by household factors. We also find that market access
is of overriding importance in determining prices. As discussed earlier, population
density is likely to result in improved markets and information, and therefore, it follows

52
that markets have a great influence on purchase prices for staple crops and fertilizer, as
we observe.
Table 5.11: Factors Affecting Log of Fertilizer Price, CRE SUR
Time-Varying
Covariate
Time-Average
Covariate
Joint Direct
Effect
Population / land
-0.0002**
(0.0001)
0.002***
(0.0001)
0.002***
(0.0001)
Female headed household
-0.009
(0.010)
-0.073*
(0.042)
-0.083***
(0.014)
Number of cooperatives
0.203***
(0.021)
Distance to cooperative
-0.030***
(0.002)
Distance to capital
0.001***
(0.0001)
Net primary productivity
9.33e-06
(1.06e-05)
Ten year rainfall average
1.88e-04
(1.54e-04)
-1.56e-04
(2.00e-04)
3.19e-05 (4.51e-
05)
Elevation
-0.003***
(0.0003)
Elevation2
8.55e-07***
(7.86e-08)
Constant
5.44***
(0.348)
Observations 7,758
R2 0.38
Note: ***, **, * denotes that the corresponding coefficients are statistically significant at
the 1%, 5% and 10% level respectively; standard errors in parentheses. Year dummies are
also included.
5.2.2 Fertilizer Use per Hectare
We estimate factors affecting fertilizer use per hectare in order to understand how
population density and other factors drive fertilizer demand and input intensification in
Ethiopia. The results for this equation can be found in Table 5.12 (equation by equation)
and Table 5.13 (SUR). The latter table now includes the total effect, which can be found
at the bottom, in the first column. The results indicate that population density has a

53
Table 5.12: Factors Affecting Fertilizer Use, CRE Equation by Equation
Time-Varying
Covariate
Time-Average
Covariate
Joint Direct
Effect
Population / land
-0.002
(0.020)
0.195***
(0.047)
0.193 ***
(0.040)
Value of assets
3.26e-04
(2.35e-04)
Land lost during
redistribution
1. 09
(3.53)
Highest grade
0.148
(0.234)
-0.365
(0.799)
-0.217
(0.759)
Female-headed household
-3.62*
(2.19)
-10.06**
(4.95)
-13.69***
(4.51)
Adult equivalents
0.411
(0.431)
-1.73*
(0.995)
-1.32
(0.89)
Recent death
-0.821
(1.38)
-11.04
(11.08)
-11.86
(11.15)
Number of oxen
0.893
(0.622)
16.71***
(4.99)
17.60***
(4.93)
Landholding, in hectares
-8.22***
(1.50)
13.65***
(2.33)
5.44***
(1.52)
Fertilizer price (log)
-1.95
(4.08)
2.73
(6.76)
0.78
(5.88)
Daily wage (log)
-0.695
(1.36)
-8.67**
(4.09)
-9.37**
(3.82)
Teff price (log)
-8.21*
(4.49)
-24.47*
(14.89)
-32.68**
(14.06)
Maize price (log)
-11.62*
(7.07)
35.57***
(8.94)
23.94***
(5.60)
Distance to agricultural
cooperative
-0.618
(0.600)
Distance to paved road
1.00***
(0.225)
-3.66***
(0.625)
-2.65***
(0.58)
Ten year rain average
0.085***
(0.024)
-0.069*
(0.039)
0.016
(0.028)
Net primary productivity
-0.001
(0.002)
Elevation
0.132*
(0.073)
Elevation2
-3.51e-05*
(1.9e-05)
Constant
-109.60
(74.66)

54
Table 5.12: Factors Affecting Fertilizer Use, CRE Equation by Equation (continued)
Time-Varying
Covariate
Time-Average
Covariate
Joint Direct
Effect
Observations 7,758
R2 0.309
Note: ***, **, * denotes that the corresponding coefficients are statistically significant at
the 1%, 5% and 10% level respectively; standard errors in parentheses. Year dummies are
also included.
positive effect on fertilizer intensification. The direct effect of population density
suggests that a 10 person increase in population density increases fertilizer use per
hectare by approximately 1.81 kilograms per hectare, on average, and the effect is
statistically significant at the 1% level. The total effect (direct + indirect effect) suggests
that a 10 person increase in population density increases fertilizer use by 1.83 kilograms
per hectare, on average. This finding indicates that fertilizer demand is mainly driven
directly by population density, rather than indirectly through landholding, wage rates and
prices. It may be that market and institutional development that happens in areas of high
population density could be helping farm intensify, but this may be offset by smaller
landholdings, and lower prices in these areas.
The results of the fertilizer demand equation also indicate the importance of
several household and community variables. The log of daily wage, teff price, and maize
price are significant determinates of fertilizer demand. Fertilizer use decreases by 9.31
kilograms for every additional percentage point increase in daily wage. Fertilizer demand
also decreases by 33.97 kilograms per hectare for a 1 percent increase in teff price.
Conversely, fertilizer use increases by 24.29 kilograms per hectare on average with a 1
percent increase in maize price.

55
Table 5.13: Factors Affecting Fertilizer Use, CRE SUR
Time-Varying
Covariate
Time-Average
Covariate
Joint Direct
Effect
Population / land
-0.004
(0.021)
0.185***
(0.047)
0.181***
(0.04)
Value of assets, in birr
0.0003
(0.0002)
Land lost during redistribution
1.15
(3.53)
Highest grade
0.123
(0.234)
-0.659
(0.804)
-0.535*
(0.327)
Female-headed household
-3.61
(2.24)
-9.76**
(4.77)
-13.38***
(2.35)
Adult equivalents
0.403
(0.434)
-1.602
(1.00)
-1.20***
(0.37)
Recent death
-0.784
(1.35)
-12.53
(11.10)
-13.32***
(4.91)
Number of oxen
0.888
(0.622)
18.28***
(5.04)
19.17***
(1.87)
Landholding, in hectares
-7.91***
(1.45)
12.77***
(2.22)
4.86***
(0.72)
Fertilizer price (log)
-4.92
(4.22)
4.70
(6.93)
-0.22
(2.32)
Daily wage (log)
-2.06
(1.39)
-7.23*
(3.96)
-9.31***
(1.43)
Teff price (log)
-4.93
(4.50) -29.04** (14.57)
-33.93***
(5.80)
Maize price (log)
1.28
(8.09)
23.01**
(9.45)
24.27***
(2.14)
Distance to cooperative
-0.450
(0.588)
Number of cooperatives
50.84***
(3.75)
Distance to paved road
1.11***
(0.230)
-3.79***
(0.646)
-2.68***
(0.28)
Ten year rain average
0.079***
(0.025)
-0.046
(0.037)
0.03***
(0.01)
Net primary productivity
-0.003
(0.002)
Elevation
0.137*
(0.072)
Elevation2
3.52e-05*
(1.89e-05)
Constant
-111.61
(72.98)

56
Table 5.13: Factors Affecting Fertilizer Use, CRE SUR (continued)
Time-Varying
Covariate
Time-Average
Covariate
Joint Direct
Effect
Observations 7,758
R2 0.31
Total effect
0.183***
(0.024)
Note: ***, **, * denotes that the corresponding coefficients are statistically significant at
the 1%, 5% and 10% level respectively; standard errors in parentheses. Year dummies are
also included.
All of the effects are slightly larger in the equation by equation model, although the teff
price is not significant. Together these results suggests that government policy designed
to increase fertilizer use would be more effective by focusing on increasing purchase
prices for maize then by providing fertilizer at a subsidized price. Higher prices may
increase income for households who produce more, therefore encouraging fertilizer use to
expand production.
Additionally, several household characteristics have significant effects on
fertilizer per hectare. First, female headed households demand less fertilizer use per
hectare. On average, if a household is female-headed, 13.37fewer kilograms of fertilizer
are demanded. Second, an additional adult equivalent in a household decreases fertilizer
use by 1.20 kilograms per hectare. This is a relatively small effect, but suggests that large
households are unable to use more fertilizer, despite having more potential labor
available. This follows Figure 5.3, which suggested that higher population densities
decrease fertilizer use. Third, the number of oxen increases fertilizer demand by 19.17
kilograms per hectare, on average. As households with oxen are able to use them to clear
fields and prepare them for cultivation more quickly than those without, it follows such

57
households may be more intensive in their cultivation practices, hence increasing demand
for fertilizer. Finally, household landholding increases fertilizer demand by 4.86
kilograms per hectare, indicating that households with more land, also use more fertilizer.
Several community variables are also significant, including the number of
cooperatives and the distance from the nearest paved road. Households in areas with
more cooperatives demand significantly more fertilizer and households further from the
paved road demand significantly less fertilizer. Together, these suggest that market
access is important in determining the demand for fertilizer. Agro-ecological terms,
elevation, and its square are also significant. This indicates the importance of location in
determining the demand and the use of inputs.
5.2.3 Maize Yield
Maize is the first crop used in this thesis to examine the influence of population density
on staple crop output per hectare. The results of the maize output supply equation can be
found in Table 5.14 (equation by equation) and Table 5.15 (SUR). The direct effect of
population density on maize yield suggests that for a 10 person increase in population
density results in an additional 5.6 kilograms of maize per hectare on average. The effect
is statistically significant at the 5% level. However the indirect and total effects are not
statistically significant. This suggests that population density may be increasing yields
through improvements in markets and information flow, but the indirect effects of
smaller landholdings and lower prices offset the direct effects and make the total effect
insignificant. Therefore, population density has no significant overall effect on maize
yield.

58
Table 5.14: Factors Affecting Maize Yield, CRE Equation by Equation
Time-Varying
Covariate
Time-Average
Covariate
Joint Direct
Effect
Population / land
2.60***
(0.82)
-1.91**
(0.82)
0.697**
(0.337)
Value of assets, in birr
0.011***
(0.004)
Land lost in redistribution
-46.82
(47.29)
Highest grade
21.22**
(9.81)
-11.68
(13.55)
9.55
(11.72)
Female-headed household
165.6**
(80.22)
-267.2***
(96.91)
-101.60*
(55.77)
Adult equivalents
0.950
(16.14)
27.64
(19.19)
28.59**
(12.37)
Recent death
78.04*
(47.50)
361.8**
(147.2)
439.88***
(133.16)
Number of oxen
26.57
(18.84)
120.1**
(48.64)
146.66***
(47.34)
Landholding
-19.72
(22.45)
-26.26
(25.86)
-45.98***
(12.86)
Fertilizer price (log)
-36.33
(130.8)
-162.1
(155.0)
-198.47**
(78.50)
Daily wage (log)
57.52
(54.44)
166.7**
(68.88)
224.3***
(43.62)
Maize price (log)
-644.7***
(187.9)
1,014***
(193.5)
369.4***
(33.55)
Annual rainfall
-0.063
(0.079)
-0.059
(0.080)
-0.12***
(0.02)
Net primary productivity
0.094***
(0.021)
Elevation
6.75***
(0.66)
Elevation2
-0.002***
(1.69e-04)
Constant
-5034***
(827.7)
Observations 7,758
R2 0.167
Note: ***, **, * denotes that the corresponding coefficients are statistically significant at
the 1%, 5% and 10% level respectively; standard errors in parentheses. Year dummies
are also included.

59
The results indicate that daily wages and maize price have a positive impact on
maize yield. Daily wages increase maize output by 213.34 kilograms per hectare. An
increase in daily wage increases income for those who participate in off-farm activities.
This behavior was discussed many times in our field group surveys. Many men said that
they worked off-farm when wages were high in order to purchase more inputs to use on-
farm, which is likely the effect we observe here. Maize prices also increases maize yields,
which makes sense, as farmers will be more incentivized to produce maize, if they
believe they may be able to get a higher price at market, based on the past years’ prices.
Maize price increases yields by 443.78 kilograms per hectare.
Several other community and household level factors influence maize yield. First,
a 10 birr increase in value of assets (about 80 cents) increases maize yield by
approximately 1 kilogram per hectare. As assets are a proxy for wealth, this suggests that
prosperity improves yields, although by a very small amount. Second, an additional year
of schooling boosts maize yield by 12.76 kilograms per hectare. This suggests a
relationship between education and yields, and that those with higher education are better
farmers. Third, if a household is female-headed, yields decrease by 98.01 kilograms per
hectare. This indicates that female households are not able to produce as much per
hectare as their male counterparts, in addition to generally having less land, and using
less fertilizer. Fourth, a recent death increases maize yield by 430.95 kilograms per
hectare. This is a large effect and shows that a shock, such a death, can have a great
impact on a household’s production. Finally, the number of oxen owned by a household
increases a household’s yield by 156.01 kilograms per hectare.

60
Table 5.15: Factors Affecting Maize Yield, CRE SUR
Time-Varying
Covariate
Time-Average
Covariate
Joint Direct
Effect
Population / land
2.63***
(0.80)
-2.07***
(0.81)
0.560**
(0.346)
Value of assets, in birr
0.011***
(0.004)
Land lost in redistribution
-28.60
(44.01)
Highest grade
20.60**
(10.32)
-7.83
(14.22)
12.64*
(6.64)
Female-headed household
155.70*
(80.95)
-253.83***
(98.84)
-98.00**
(45.11)
Adult equivalents
0.956
(16.29)
31.12*
(18.84)
32.11***
(6.97)
Recent death
86.04*
(48.15)
344.63**
(142.42)
430.95***
(93.94)
Number of oxen
32.25*
(17.74)
123.76**
(48.76)
155.99***
(34.54)
Landholding
-27.47
(22.92)
-22.22
(27.05)
-49.79***
(13.09)
Fertilizer price (log)
-41.60
(142.93)
-187.33
(162.39)
-228.29***
(37.18)
Daily wage (log)
106.35*
(56.13)
107.00
(67.94)
213.60***
(25.39)
Maize price (log)
-595.91***
(186.72)
1,041***
(189.43)
444.54***
(27.35)
Annual rainfall
-0.070
(0.084)
-0.042
(0.086)
-0.111***
(0.015)
Net primary productivity
0.090***
(0.023)
Elevation
6.82***
(0.631)
Elevation2
-0.002***
(0.0002)
Constant
-5,078***
(808.71)
Observations 7,758
R2 0.16
Total effect
0.185
(0.371)
Note: ***, **, * denotes that the corresponding coefficients are statistically significant at
the 1%, 5% and 10% level respectively; standard errors in parentheses. Year dummies are
also included.

61
This follows the results of the fertilizer demand equation, and suggests that those
with more oxen have higher production potential and are able to cultivate at a higher
intensity. Several community variables are also significant, including net primary
productivity, elevation, and its square. These suggest that better soils produce higher
yields, and that higher elevations produce higher yields.
5.2.4 Teff Yield
Teff is the second crop in our study used to examine the impact of population
density on staple crop output per hectare. The results for the teff supply equation can be
found in Table 5.16 (equation by equation) and Table 5.17 (SUR). The results of this
model indicate that the direct, indirect, and total effects of population density on teff yield
are insignificant. Therefore, we can conclude that teff yield is not influenced by
population density.
Several community and household level factors influence teff yield, however. Of these
variables, many that were significant in determining maize output are significant in
determining teff output and yield to the same interpretation. First, an additional year of
schooling boosts teff yield by 15.85 kilograms per hectare. Second, the number of oxen
owned by a household increases yields by 989.06 kilograms per hectare. This follows the
results of the fertilizer demand equation, as well as the maize equation, and suggests that
those with more oxen have higher production potential and therefore use more fertilizer
and produce greater yields. Finally, landholding is significant indicating that households
with more land produce less teff. This may be a result of diversification to other crops,
which is possible, and potentially easier, with greater landholding.

62
Table 5.16: Factors Affecting Teff Yield, CRE Equation by Equation
Time-Varying
Covariate
Time-Average
Covariate
Joint Direct
Effect
Population / land
-1.15***
(0.22)
1.14***
(0.30)
-0.008
(0.237)
Value of assets
4.55e-04
(0.003)
Land lost in redistribution
184.2***
(48.94)
Highest grade
-10.12**
(5.14)
21.46*
(13.04)
11.34
(11.16)
Female-headed household
-4.65
(34.46)
-0.922
(68.12)
-5.58
(62.85)
Adult equivalents
0.512
(10.21)
-4.04
(15.13)
-3.53
(10.47)
Recent death
-39.68
(25.20)
-286.8*
(147.6)
-326.52**
(146.41)
Number of oxen
41.66**
(17.35)
1,016***
(86.44)
1,057***
(81.27)
Landholding
-19.17
(15.08)
-8.21
(20.95)
-27.38**
(12.93)
Fertilizer price (log)
-101.6
(95.78)
166.2
(105.1)
64.57
(51.51)
Daily wage (log)
-62.89*
(36.53)
247.3***
(57.20)
184.41***
(39.73)
Teff price (log)
133.9
(94.67)
-50.40
(137.3)
83.54
(115.68)
Annual rainfall
0.060*
(0.034)
0.044
(0.039)
0.10***
(0.02)
Net primary productivity
-0.058***
(0.016)
Elevation
2.68***
(0.677)
Elevation2
-5.41e-04***
(1.73e-04)
Constant
-3958***
(777.0)
Observations 7,758
R2 0.321
Note: ***, **, * denotes that the corresponding coefficients are statistically significant at
the 1%, 5% and 10% level respectively; standard errors in parentheses. Year dummies
are also included.

63
Additionally, if a household lost land during redistribution influences teff yields,
increasing it by 254.59 kilograms, on average. This suggests that households which lost
land are now incentivized, at least for teff, to produce more if they did not lose land. This
result differs somewhat from some of the previous literature in Ethiopia; this includes Ali
et al. (2011) which finds that households who are tenure insecure do not make long-term
investments in coffee and chat production. However, our finding is different perhaps
because teff is an annual crop and other studies including Holden and Yohannes (2002),
Deininger et al. (2009), and Deininger and Jin (2006) suggests that redistribution has
improved access to inputs, which has increased use of fertilizer and staple crop yields.
We also found in our landholding regressions that those who lost land in the
redistribution farm smaller plots. Therefore, the finding of higher teff yields on plots that
lost lands is consistent with the inverse productivity hypothesis, which suggests that
households with smaller plots are able to produce more per hectare than households with
more land. The existence of this connection has been supported by Binswanger et al.
(1995), Benjamin (1995), Barrett (1996), and Lamb (2003).
Several community variables are also significant, including net primary
productivity, elevation, and its square term. These suggest that better soils produce lower
yields, and that higher elevations produce higher yields.
Finally, several price factors also drive teff yield. Teff price and daily wage both
positively drive teff output. A 1 percent increase in teff price decreases teff output by
79.74 kilograms per hectare. Further, a 1 percent increase in daily wage increases teff
yield by 184.89 kilograms per hectare.

64
Table 5.17: Factors Affecting Teff Yield, CRE SUR
Time-Varying
Covariate
Time-Average
Covariate
Joint Direct
Effect
Population / land
-1.07***
(0.226)
0.976***
(0.319)
-0.096
(0.263)
Value of assets
0.0004
(0.003)
Land lost in redistribution
254.59***
(49.60)
Highest grade
-11.35**
(5.22)
27.20**
(13.76)
15.93***
(4.72)
Female-headed household
-13.31
(34.43)
10.52
(69.43)
-2.85
(31.81)
Adult equivalents
-0.103
(10.33)
0.652
(14.03)
0.533
(4.926)
Recent death
-42.64*
(25.96)
-213.21
(138.36)
-255.98***
(66.03)
Number of oxen
39.12**
(17.26)
949.95***
(84.29)
989.07***
(23.99)
Landholding
-40.87***
(15.74)
12.99
(20.74)
-27.82***
(9.22)
Fertilizer price (log)
-41.88
(94.06)
155.57
(102.20)
113.39***
(26.58)
Daily wage (log)
23.26
(39.46)
162.08***
(57.93)
185.14***
(18.56)
Teff price (log)
322.05**
(134.23)
-402.56***
(141.40)
-79.74*
(67.17)
Annual rainfall
0.062*
(0.035)
0.094**
(0.042)
0.160***
(0.011)
Net primary productivity
-0.083***
(0.016)
Elevation
2.96***
(0.717)
Elevation2
-0.001***
(0.0002)
Constant
-4,648***
(849.13)
Observations 7,758
R2 0.31
Total effect
-0.330
(0.302)
Note: ***, **, * denotes that the corresponding coefficients are statistically significant at
the 1%, 5% and 10% level respectively; standard errors in parentheses. Year dummies are
also included.

65
It is intuitive is why an increase in daily wage increases teff output, as an increase
in daily wage increases the income for those who participate in off-farm activities,
allowing them to purchase more inputs or invest more in their own farms. However, the
relationship between teff price and teff production is not altogether intuitive, as farmers
are not incentivized to produce teff for potentially higher prices. This does suggest
though that while prices have a relationship with production, people will generally
produce teff regardless of price, in the long-run.
Considering the maize yield results and teff yield results, three differences do
exist. These differences include: 1) whether a household is female-headed does not
influence teff output (it had a negative effect in the long-run); 2) land lost in
redistribution has a positive effect on teff output (it did not influence maize output); and
3) whether a household had a recent death in the household has a positive effect on maize
output (it had no impact on teff output). However, these differences result from the fact
that maize and teff are not perfect substitutes for one another, and therefore have
relationships with slightly different factors, despite having many similarities.
5.2.5 Farm Income per Hectare
Finally, farm output per hectare is used in our analysis to understand the effect of
population density on overall farm productivity measured by the value of crop output,
including staple crops and cash crops, as well as output of farm animals. The results for
the farm output equation can be found in Table 5.18 (equation by equation) and Table
5.19 (SUR). While the time average of population density is statistically significant and
negative, neither the direct effect nor the total effect, which can be found at the bottom of
the table, is significantly different from zero.

66
Table 5.18: Factors Affecting Farm Income, CRE Equation by Equation
Time-Varying
Covariate
Time-Average
Covariate
Joint Direct
Effect
Population / land
553.3
(343.6)
-641.8***
(245.8)
-88.51
(151.44)
Value of assets
-1.25
(1.13)
Land lost in redistribution
-78,586
(55,984)
Highest grade
27,345
(31,890)
1,204
(10,974)
28,549
(24,041)
Female-headed household
-10,400
(14,095)
133,604
(127,394)
123,204
(127,165)
Adult equivalents
63,940
(78,317)
-54,369
(70,269)
9,571
(8,740)
Recent death
-87,158
(83,796)
207,071
(198,003)
119,913
(115,770)
Number of oxen
143,762
(114,515)
-117,878
(86,062)
25,884
(38,815)
Landholding, in hectares
-66,770**
(31,766)
30,035
(25,414)
-36,735***
(13,025)
Fertilizer price (log)
-2,253
(16,668)
-135,386***
(49,571)
-137,638***
(42,987)
Daily wage (log)
-27,361
(53,884)
-36,994
(43,540)
-64,356
(62,807)
Teff price (log)
115,128
(105,727)
-37,731
(139,663)
77,397
(234,631)
Maize price (log)
109,317
(86,972)
-105,511
(107,052)
3,806
(24,118)
Annual rainfall
38.30
(44.97)
-81.42
(50.08)
-43.11
(41.37)
Net primary productivity
29.48
(19.55)
Elevation
63.98
(419.7)
Elevation2
-0.031
(0.089)
Constant
680,520
(611,551)
Observations 7,758
R2 0.012
Note: ***, **, * denotes that the corresponding coefficients are statistically significant at
the 1%, 5% and 10% level respectively; standard errors in parentheses. Year dummies
are also included.

67
Therefore, we can conclude that overall population density does not significantly
drive farm income. The only factors which influence farm income per hectare are the
landholding of the household and the log of fertilizer price. Landholding negatively
influences farm output per hectare by 68,099 (about 5,000 dollars) for every additional
hectare owned. The effect is slightly larger in the equation by equation model. Further,
fertilizer price drives down income by 130,147 birr (about 1,000 dollars). This
relationship indicates that farmers are unable to produce as crops as successfully, with
higher prices of fertilizer, and as a result farm income declines. These are both large
effects and suggest that income is highly responsive to landholding and fertilizer price,
despite having no impact on so many other regressors.
Table 5.19: Factors Affecting Farm Income, CRE SUR
Time-Varying
Covariate
Time-Average
Covariate
Joint Direct
Effect
Population / land
526.62
(336.99)
-610.74**
(245.05)
-84.11
(166.36)
Value of assets
-1.31
(1.21)
Land lost in redistribution
-70,770
(46,741)
Highest grade
27,495
(33,171)
1,245
(11,611)
22,664
(7,491)
Female-headed household
-10,927
(15,605)
132,175
(131,840)
126,653
(54,957)
Adult equivalents
63,980
(81,036)
-53,947
(71,752)
11,090
(8,506)
Recent death
-87,368
(86,690)
211,808
(209,104)
139,622
(114,249)
Number of oxen
143,786
(119,417)
-123,895
(96,541)
16,918
(42,086)
Landholding, in hectares
-68,099**
(34,170)
30,774
(26,512)
-41,556***
15,730
Fertilizer price (log)
-25,065
(22,984)
-130,148**
(53,754)
-102,716**
(42,698)
Daily wage (log)
-18,992
(49,143)
-45,343
(51,109)
-45,580
(30,787)

68
Table 5.19: Factors Affecting Farm Income, CRE SUR (continued)
Time-Varying
Covariate
Time-Average
Covariate
Joint Direct
Effect
Teff price (log)
133,589
(195,771)
-83,911
(97,524)
-64,408
(112,216)
Maize price (log)
24,702
(44,064)
-24,052
(47,127)
13,125
(32,940)
Annual rainfall
38.30
(51.02)
-76.91
(55.75)
-41.50
(54.40)
Net primary productivity
26.67
(19.75)
Elevation
13.29
(592.11)
Elevation2
-0.015
(0.134)
Constant
774,934
(811,312)
Observations 7,758
R2 0.01
Total effect
-160.05
(128.11)
Note: ***, **, * denotes that the corresponding coefficients are statistically significant at
the 1%, 5% and 10% level respectively; standard errors in parentheses. Year dummies are
also included.

69
CHAPTER 6: CONCLUSIONS
6.1 Summary of Findings
The objective of this thesis is to estimate the impacts of population density on
agricultural intensification and farm income in Ethiopia. We first evaluate the direct
channels through which population density impacts intensification, measured as fertilizer
demand per hectare, maize and teff yields, and farm income per hectare. Population
density directly influences agricultural intensification by improving information flows,
enabling the development of institutions, and reducing transactions costs. In addition, we
estimate the indirect effects that population density has on intensification and income
through its effect on landholding, wage rates, fertilizer prices and maize and teff prices.
Dramatic increases in population density and corresponding difficulties in access to land
suitable for agricultural activities are prevalent throughout Ethiopia. This thesis finds that
population density is a significant factor that influences input demand, but not output
supply.
The main findings of the study are as follows. First, we find that increased
population density lead to smaller farm sizes. This has major implications for staple crop
production and household food security, as it limits farm productivity on the extensive
margin. This suggests that developing a functioning land market, by permitting people to
sell and rent land may boost productivity. A working land market would encourage those

70
who would rather leave agriculture to sell or rent land to those who can use it more
productively.
Additionally, we find that population density has a positive effect on input
demand, represented by fertilizer use per cultivated area. We find that input
intensification is driven by the direct effects of population density, including improved
information flow, institutions, and reduced transaction costs, rather than through the
indirect effects of factor prices and landholding. We are also able to conclude that
population density has no significant relationship with maize yield, teff yield, and farm
income.
Finally, we find that maize and teff prices fall when population density suggesting
that in more densely populated regions there may be better market access and improved
information. Since staple crops are tradable goods, as markets develop commodities
move to areas of higher demand.
In addition to these direct effects of population density intensification and well-
being, we find that market access factors such as distance to cooperatives and roads have
an effect on output prices, and fertilizer demand. Therefore, improving infrastructure is
an important policy measure to reduce transaction costs, as well as the cost of fertilizer
and prices of staple crops. Education is also of great importance and the positive
relationship between higher education attainment, fertilizer use, and yields suggests that
school systems should be expanded and supported.
Finally, this study finds that past land redistribution practices may have
influenced present investment patterns. We find that, at least in the short-term, people
produce more teff, if they previously lost land. This follows perceptions of farmers from
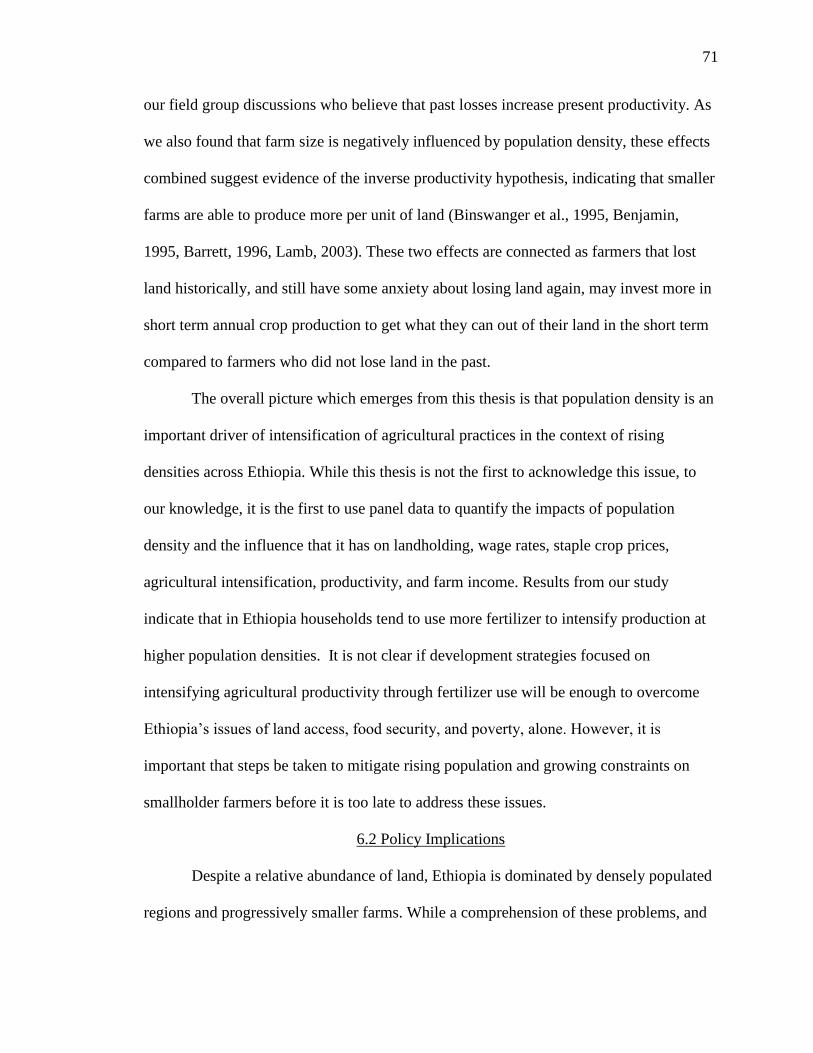
71
our field group discussions who believe that past losses increase present productivity. As
we also found that farm size is negatively influenced by population density, these effects
combined suggest evidence of the inverse productivity hypothesis, indicating that smaller
farms are able to produce more per unit of land (Binswanger et al., 1995, Benjamin,
1995, Barrett, 1996, Lamb, 2003). These two effects are connected as farmers that lost
land historically, and still have some anxiety about losing land again, may invest more in
short term annual crop production to get what they can out of their land in the short term
compared to farmers who did not lose land in the past.
The overall picture which emerges from this thesis is that population density is an
important driver of intensification of agricultural practices in the context of rising
densities across Ethiopia. While this thesis is not the first to acknowledge this issue, to
our knowledge, it is the first to use panel data to quantify the impacts of population
density and the influence that it has on landholding, wage rates, staple crop prices,
agricultural intensification, productivity, and farm income. Results from our study
indicate that in Ethiopia households tend to use more fertilizer to intensify production at
higher population densities. It is not clear if development strategies focused on
intensifying agricultural productivity through fertilizer use will be enough to overcome
Ethiopia’s issues of land access, food security, and poverty, alone. However, it is
important that steps be taken to mitigate rising population and growing constraints on
smallholder farmers before it is too late to address these issues.
6.2 Policy Implications
Despite a relative abundance of land, Ethiopia is dominated by densely populated
regions and progressively smaller farms. While a comprehension of these problems, and

72
incorporation of the resulting issues into national development plans and poverty
reduction strategies, we also make several policy implications based on the relationships
between population density, input demand, and output supply. Therefore, we make the
following policy recommendations:
1. Agricultural wages are increased by higher population density. Therefore, people
who desire to work off-farm should be incentivized to migrate to places where
they can obtain higher wages. Programs to encourage such migration could be
successful not only in improving employment, but also potentially increase staple
crop yields. Location of demand and supply, in terms of jobs and people willing
to work, are also important to consider.
2. Population density also leads to smaller landholding. Developing a functioning
land market, through permitting people to sell and rent land may boost
productivity. A working land market would encourage those who would rather
leave agriculture to sell or rent land to those who can use it more productively.
3. The distance to a cooperative, the distance to a paved road, and the distance from
the capital often influence prices and yields. Therefore, improving infrastructure
and ensuring development of markets is an important policy measure to reduce
transaction costs, as well as the cost of fertilizer and prices of staple crops.
4. Short-term production behavior is positively influenced by historic redistribution
and resettlement practices. However, redistributions have negatively influenced
farm sizes; making the landholding of those who lost land in 1995 smaller today.
These two effects are connected as farmers that lost land historically, and still
have some anxiety about losing land again, may try harder in the immediate term

73
than they might otherwise. This mentality may result in the soil being overused as
farmers try to get all that they can today, on typically smaller plots of land. Future
redistribution and resettlement programs should keep these effects in mind, as it
could influence future productivity, even if it has been beneficial thus far.
5. Net primary productivity influences staple crop prices and daily wages and hence
it is important to consider soil quality. The government should undertake and
support soil management programs in order to preserve current soil conditions,
and potentially improve them over time. These could include soil terracing,
increased incentives for fallow periods, crop rotation, or tillage.
6. Education is of great concern to many farmers. Increases in education are
associated with higher landholding, increased daily wage, increased demand for
fertilizer, and increased output per hectare of maize. Further, adequate access to
education was of tremendous concern in many of our focus group discussions.
Parents generally believe that their children will be better off with more
education, and are concerned about their futures if they are unable to access it.
Therefore, continued and increased access to quality education is of huge
importance for the future of rural farmers, particularly as population density
continues to expand.
It is not clear if these strategies will be enough to overcome Ethiopia’s issues of
land access, food security, and poverty, on their own. However, it is important that steps
be taken to mitigate rising population and growing constraints on smallholder farmers
before it is too late to address these issues altogether.

74
6.3 Limitations
Although this research is carefully prepared, we are aware of its limitations and
shortcomings. These issues cannot be easily addressed and primarily focus on the data
used for then analysis.
1. The panel is relatively short, covering only 11 years. Issues of population density
have long-term influence, and though we attempt to uncover these long-term
effects in our analysis, the period analyzed is still relatively short.
2. There is limited spatial variation across villages. As the ERHS only considers 15
villages, there are only 90 distinct observations for population density (15 villages
over 6 years). This limits conclusions which can be made regarding population
density, despite the observed variation across the 15 villages.
3. The data is not nationally representative, as non-pastoral households are not
considered. Widening the sample to be nationally representation would allow the
development of broader conclusions and therefore potentially improved policy
implications.
4. Other potential measures of intensification and productivity are not considered. In
particular, hybrid seeds, on-farm labor, mechanization, and crop diversification
are not evaluated in this thesis. This is primarily due to their absence in the ERHS
survey and desires to limit the scope of this thesis.
These limitations give way for excellent future research, and the potential to expand
conclusions and policy implications based on such improvements.

75
6.4 Future Research
Future research on this topic should take advantage of the existing conceptual
framework, but build upon the limitations mentioned previously, in order to address
issues with data. Most importantly, the use of a longer, more nationally representative
panel, with a greater variation in population density locations could tremendously
improve the strength of our conclusions. Further, expanding the definition of
intensification and productivity would be effective for a broader evaluation of the
problem. This reframing of the problem, using a different data set, could serve to test the
robustness of our conclusions.
Further, our econometric method could be improved or expand through the use of
other estimators, such as a 3SLS or GMM. This would be done in conjunction with a re-
specification of the model in a recursive fashion, rather than the current non-recursive
version we have used thus far. With the current specification it is difficult to find
exclusion variables; however, there is opportunity for the design of a recursive model.

LIST OF REFERENCES

76
LIST OF REFERENCES
Ali, D.A., K. Deininger, S. Holden, and J. Zevenbergen, (2005). “Rural Land
Certification in Ethiopia: Process, Initial Impact, and Implications for Other
African Countries”, World Development 36(10): 1786-1812.
Ali, D.A., S. Dercon, and M. Gautam, (2011). “Property Rights in a Very Poor Country:
Tenure Insecurity and Investment in Ethiopia”, Agricultural Economics 42
(2011): 75-86.
Baerenklau, K.A., (2005). “Toward an Understanding of Technology Adoption: Risk,
Learning, and Neighborhood Effects”, Land Economics 81 (1): 1-19.
Barrett, C.B., (1996). “On Price Risk and the Inverse Farm Size Productivity
Relationships”, Journal of Development Economics 51 (2): 193-215.
Benin, S. and J. Pender, (2001). “Impacts of Land Redistribution on Land Management
and Productivity in the Ethiopian Highlands”, AAEA Meeting Selected Paper,
August 2001.
Benjamin, D., (1995). “Can Unobserved Land Quality Explain the Inverse Productivity
Hypothesis”, Journal of Development Economics 46 (1): 51-84.
Binswanger, H.P., and J. McIntire, (1987). “Behavioral and Material Determinants of
Production Relations in Land-abundant Tropical Agriculture”, Economic
Development and Cultural Change 36 (1): 73-99.
Binswanger, H.P., K. Deininger, and G. Feder, (1995). “Chapter 42: Power, Distortions,
and Revolt and Reform in Agricultural Land Relations”, Handbook of
Development Economics 3 (B): 2569-2772.
Boserup, E., (1965). The Conditions of Agricultural Growth: the Economics of Agrarian
Change Under Population Pressure. Chicago: Aldine Publishing Company.
Chamberlain, J., (2013). “Landholding, Access, and Small Farm Development in
Zambia”, Unpublished Doctor Dissertations, third essay. Michigan State
University, 2013.

77
Conley, T.G., and C.R. Udry, (2010). “Learning About a New Technology: Pineapple in
Ghana”, The American Economic Review 100 (1): 35-69.
de Brauw, A. and V. Mueller, (2012). “Do Limitations in Land Rights Transferability
Influence Mobility Rates in Ethiopia?”, Journal of African Economics 6 (6): 1-32.
Deininger, K., and S. Jin, (2006). “Tenure Security and Land Related Investment:
Evidence from Ethiopia”, European Economic Review 50 (5): 1245-77.
Deininger, K., D.A. Ali, and T. Alemu, (2009). “Impacts of Land Certification on Tenure
Security, Investment, and Land Markets: Evidence from Ethiopia,” Environment
for Development, Discussion Paper Series.
Delbecq, B.A., and R.J.G.M. Florax, (2010). “Farmland Allocation along the Rural-
Urban Gradient: The Impacts of Urbanization and Urban Sprawl”, Selected Paper
at AAEA 2010.
Dercon, S., (2007). “Globalization and Marginalization in Africa: Poverty, Risk, and
Vulnerability in Rural Ethiopia”, United Nationals University – World Institute
for Development Economics Research:
<http://www.wider.unu.edu/stc/repec/pdfs/rp2007/rp2007-73.pdf>.
Dercon S. and J. Hoddinott, (2011). “The Ethiopian Rural Household Surveys 1989-
2009: Introduction”, International Food Policy Research Institute.
Dercon, S., J. Hoddinott, and T. Woldehanna, (2005). “Shocks and consumption in 15
Ethiopian villages, 1999-2004”, Journal of African Economics 14 (4): 559-85.
Dercon, S., J. Hoddinott, T. Woldehanna, (2006). “Consumption, Vulnerability, and
Shocks in Rural Ethiopia”, Ethiopian Journal of Economics 15 (1): 55-84.
Dercon, S., J. Hoddinott, and T. Woldehanna, (2012). “Growth and Chronic Poverty:
Evidence from Rural Communities in Ethiopia”, Journal of Development Studies
48 (2): 238-53.
Dessalegn, R., (1997). “Manufacturing poverty: rural policy and micro-agriculture”,
Paper presented at the Workshop of the Land Tenure Project of the Institute of
Development Research, Addis Ababa.
Devereux, S., (2000). “Food Insecurity in Ethiopia”, Discussion paper for DFID.
Ethiopian Review, 2013. History: Ethiopia. <www.ethiopianreview.net>

78
Foster, A.D., and M.R. Rosenzweig, (1995). “Learning by Doing and Learning from
Others: Human Capital and Technical Change in Agriculture”, Journal of
Political Economy 103 (6): 1176-209.
Gebreselassie, S., (2006). “Land, Land Policy, and Smallholder Agriculture in Ethiopia:
Options and Scenarios”, Futures Agricultures Consortium, Institute for
Development Studies.
Gebreselassie, S., (2011). “Land, Land Policy, and Smallholder Agriculture in Ethiopia,”
Future Agricultures Briefing. Future Agricultures Consortium.
<www.future-agricultures.org>.
Guiling, P., B. Brorsen, and D. Doyle, (2009). “Effect of Urban Proximity on
Agricultural Land Values”, Land Economics 85 (2): 252.
Hammond, L., 2008. “Strategies of Invisibilization: How Ethiopia’s Resettlement
Programme Hides the Poorest of the Poor”, Journal of Refugee Studies 21 (4):
517 – 536.
Hayami Y., and V. Ruttan, (1970). “Factor Prices and Technical Change in Agricultural
Development: The United States and Japan, 1880-1960”, Journal of Political
Economy 78 (5): 115-41.
Heady, D., M. Dereje, J. Ricker-Gilbert, A.L. Josephson, and A.S. Taffesse, (2013).
“Agricultural Intensification in Ethiopia,” International Food Policy Research
Institute.
Holden, S., and H. Yohannes, (2002). “Land Redistribution, Tenure Insecurity, and
Intensity of Production: A Study of Farm Households in Southern Ethiopia”, Land
Economics 78 (4): 573-90.
Jemma, H., (2004). “The Politics of Land Tenure in Ethiopian History: Experience from
the South”, XI World Congress of Rural Sociology, Trondheim, Norway July 25-
30, 2004.
Johnson, D. Gale, (2000). “Population, food and knowledge”, American Economic
Review 90 (1): 1–14.
Kebede, B., (2006). “Land Reform, Distribution of Land and Institutions in Rural
Ethiopia: Analysis of Inequality with Dirty Data”, Poverty, Income Distribution,
and Labor Market Issues: African Economic Research Consortium.
Lamb, R.L., (2003). “Inverse Productivity: Land Quality, Labor Markets, and
Measurement Error”, Journal of Development Economics 71 (1): 71-95.

79
Malthus, T., (1798). “An Essay on the Principle of Population”, Joseph Johnson.
McMillan M.S., W.A. Masters, and H. Kazianga, (2011). “Rural Demography, Public
Services, and Land Rights in Africa: A Village-Level Analysis in Burkina Faso”,
NBER Working Paper Series.
Mellor, J., (1966). The Economics of Agricultural Development, Cornell University
Press, Business and Economics.
Mundlak, Y., (1978). “On the Pooling of Time Series and Cross Section Data”,
Econometrica 46 (1): 69-85.
Muyanga, M., and T.S. Jayne, (2011). “Land Constraints in Kenya’s Densely Populated
Rural Areas: Implications for Food Policy and Institutional Reform”, Department
of Agricultural, Food & Resource Economics, Michigan State University.
National Geographic, (2013). Countries: Ethiopia Guide.
<www.travel.nationalgeographic.com>
Pan, L., (2009). “Risk Pooling through Transfers in Rural Ethiopia”, Economic
Development and Cultural Change 57 (4) 809-35.
Pankhurt, A., (2009). Moving People in Ethiopia: Development, Displacement, and the
State. Rochester, New York: Bodell and Brewer Ltd.
Pender, J., (1998). “Population Growth, Agricultural Intensification, Induced Innovation
and Natural Resource Sustainability: An Application of Neoclassical Growth
Theory”, Agricultural Economics 19: 99-112.
Pender, J., (2001). “From ‘Structural Adjustment’ to ‘Comprehensive Development
Framework’: Conditionality Transformed?”, Third World Quarterly 22(3).
Pingali P. and H. Binswanger, (1984). “Induced Innovation Model of Agricultural
Development”, International Agricultural Development. John’s Hopkins
University Press, 163-178.
Population Reference Bureau, Data Finder, August 2012. < http://www.prb.org/>.
Rahmato, D., (2007). “Resettlement in Ethiopia: The Tragedy of Population Relocation
in the 1980s”, Forum for Social Studies: A Center for Policy Research and
Dialogue.
Stata Base Reference Manual, (2013). Release 12. Stata Press Publication, StataCorp LP,
College Station, Texas.

80
Tareke, G., (2009). The Ethiopian Revolution: War in the Horn of Africa, New Haven:
Yale University.
Teklu, T., (2008). “Land Scarcity, Tenure Change, and Public Policy in the African Case
of Ethiopia: Evidence of Efficacy and Unmet Demands for Land Rights”.
von Thünen, J.H., (1826). Der isolierte Staat in Beziehung auf Landwirtschaft und
Nationalökonomie. Jena: G. Fischer, 1910.
Woldemeskel, G., (1989). “The Consequences of Resettlement in Ethiopia” African
Affairs 88 (352): 359 – 374.
Wooldridge, J.M., (2010). Econometric Analysis of Cross Section and Panel Data, MIT
Press, Second Edition.
World-Bank, (2009). World Development Report 2009: Reshaping Economic
Geography. Washington DC: The World Bank.
World Factbook, Central Intelligence Agency, (2012). East Africa: Ethiopia.
<https://www.cia.gov/library/publications/the-world-factbook/geos/et.html>.

APPENDIX

81
APPENDIX: FOCUS GROUP DISCUSSIONS
A.1 Debre Birhan
Debre Birhan is located 120 kilometers northeast of Ethiopia’s capital, Addis
Ababa. As it is situated at the center of the highland plateau Shewa, the town serves as an
important economic of political center for the surrounding peasant communities. The
main crops grown in the area are teff, barley, and beans, all of which are grown for
household consumption. Using local varieties, maize and wheat are also grown, using
hybrid seeds. Hybrids over traditional seeds are preferred for these crops as they generate
higher yield and are “more clean”9 when harvested. However, in recent years, hybrid
seeds have begun to fail and lose productivity due to changes in the formula which make
them inappropriate for the type of soil in Debre Birhan.
The primary problems faced by farmers are: 1) decreasing soil quality and 2)
decreasing land access. Issues with soil quality are exacerbated by steep topography. Due
to lack of space, farmers are forced to cultivate on slopes, which causes erosion, and
results in further degradation of the soil. Continuous cultivation and clearing of trees have
also become common practice, in order to increase available land for farming, both of
which contribute to the decreasing quality of the soil. These issues have become more
9 While this is a quote from our discussions, we assume that they are referring to the final crop, and the
easy of cleaning the final product for sale and consumption.

82
problematic due to increases in population and connect with decreasing access to land.
With increasing population density, land has become scarce due to large numbers of
people wishing to farm in the same amount of space. While some common land remains,
it is used for grazing and pasture land and is not available to transition to household farm
land. Farmers are eager to obtain more land, but do not believe that this is possible, as
there is no land that is not being used for agricultural purposes at this time. Further, there
is general fear of land redistribution occurring again in the region within the next ten
years, generating a feeling of tenure insecurity.
Land redistribution is a large issue within the community. Debre Birhan has gone
through the process of land registration, which gives families a clear claim to their land,
but these certificates indicate that the government has the right to seize and redistribute
land at any time, without warning. As a result, people do not feel secure in their tenure,
although farmers do not believe that this decreases their productivity. One farmer
indicated that “…the land may belong to the government…but with that in mind, the land
belongs to me.”
In addition to issues of soil quality and decreased land access, weather is a
constant problem. While rainfall is generally regular and good throughout the rainy
season, Debre Birhan has experienced crop destruction due to snow and hail, both of
which are somewhat uncommon in Ethiopia. Due to the steep topography of the region,
farmers are used to dealing with flooding due to excessive rain, but they are wholly
unable to deal with it. Hail, in particular, destroys crops and farmers are unsure how to
deal with it. Farmers often mentioned climate change, and hold it responsible for
changing weather patterns.

83
As a result of the change weather, soil, and decreasing land availability farmers
are not optimistic about the future. While they feel that children should attend school,
they do not believe that children who do will hold better jobs than themselves, and for the
most part believe that their children will also be farmers. While they feel that education
will help their children to become better farmers, due to lack of nearby private schools,
and poor quality of local public schools, they are not confident this will actually be the
outcome.
A.2 Dinki
Dinki is located in the northern region of the highland plateau Shewa northeast of
Addis Ababa. It is a fairly isolated village; the closest city is Ankober, approximately 20
kilometers away. Due to its isolation, Dinki suffered greatly during the 1984 famine. The
main crops grown in the area are teff and millet, although diversification to more crops is
prevalent, particularly to high value crops. Hybrids seeds are commonly used for maize
and teff, although hybrids are only preferred for the latter. As hybrid seeds require more
water and fertilizer, and Dinki is a particularly hot area, such seeds can be difficult to
keep alive. While outputs have improved in the past several years, there is still not
enough surplus to sell to the dealers who frequent the area
The primary problems faced by farmers include: 1) access to land, 2) decreased
soil quality, and 3) pest damage. Farm sizes are shrinking, due to increases in population
density, with the average person holding about three quarters of a hectare. Due to rising
population density, all land has been transitioned to agricultural land, save for a
mountain, which is not possible to farm or to use for grazing, due to its extreme slope.

84
Farmers indicate that they would like more land to farm, but due to no close-by clear
land, they do not believe such a possibility exists. The lack of land is made more
problematic by the poor quality of soil. Farmers feel that the poor soil quality makes their
land seem even smaller. Erosion and repeated farming are responsible for the degradation
of soil quality, both of which are caused by the lack of available land to farm. Farmers
treat poor soil quality with increased use of fertilizer, although the price of fertilizer has
now risen to a point where it is not possible for most farmers to afford. As a result, the
yield of many crops has decreased. Yields are also lowered due to problems with pests.
Worms and monkeys are particularly problematic. Worms, which have become a
problem only in the past ten years, often eat crops while they are young. Farmers are
sometimes able to replant and start the crop again when this occurs, but they are unsure
of how to eliminate the worms altogether. Additionally, monkeys are a larger problem, as
they steal fully grown plants, which farmers are not able to replant in time.
In recent years, weather has also become a problem. Farmers again cite climate
change as the cause of the shift in weather patterns which they are unable to
accommodate. In Dinki, climate change is manifested primarily through regular drought.
While historically Dinki, like most regions of Ethiopia, has experienced two seasons of
rain, in the past five years rainfall has decreased. The first rainy season has been lost
altogether and the second is delayed. In an already hot and dry climate, this caused
problems for crop yields, as well as for herders who require water for their animals.
Despite a history of famine and rising concerns about drought, many farmers are
optimistic regarding the future. Farmers are eager to diversify crops and to move away
from simply growing staples for consumption to growing high value crops for sale.

85
Further, many feel that despite their current isolation, over the next several years, more
roads will be put in and electricity will come into the area, modernizing the whole
village. However, despite this optimism about their town, most farmers do not believe
that their children will have good lives, if they decide to be farmers. Due to decreasing
farm size, general lack of land, and declining crop yields, farmers indicate that they
would like their children to work in other professions. By sending children to school and
encouraging children to migrate to larger urban areas, people believe that their children
will have better lives. Therefore, many parents encourage their children to attend school
and ultimately migrate to Addis Ababa or to the Middle East.
A.3 Sirbana
Sirbana is located in the Shewa province, southeast of Addis Ababa. The village
is located by the main road which connects Addis Ababa, to Debre Zeit, one of the larger
cities in the country. Due to the proximity of the village to two large cities it is quite
wealthy and has been historically targeted with agricultural policy by the government.
The primary crops grown are permanent crops and cereals, with teff being particularly
successful in the region. The area has good soil and hybrids are generally successful and
preferred by farmers. As hybrids generally lead to higher yields, and are also disease
tolerance, and weed resistance, most farmers use hybrids whenever available.
The primary problems faced by farmers are: 1) lack of access to fertilizer, 2) land
scarcity, and 3) lack of adequate education. As all farmers prefer hybrid seeds to
conventional seeds, and hybrids require fertilizer to be successful, fertilizer is essential.
However, fertilizer is often unavailable, or too expensive. There are also problems with

86
timing of fertilizer delivery, as often it comes too late to be used. Therefore, while
farmers have been able to somewhat head off the increasing land scarcity in the area, the
lack of access to fertilizer has increased the problem. The drastically increasing
population the area, exacerbated by large in-migration, has increased issues with
adequate access to land. Most individuals hold approximately one half of a hectare. With
such a small area of land, fallow practices have been eliminated, and many individuals
have moved away from planting cereal crops for consumption to growing chat and coffee
for sale, effectively becoming net purchasers of food. Many find that this also mitigates
issues with fertilizer, because tree crops do not require annual fertilization. However, it
does not increase food security, and many feel that though they have good land, and good
soil, they are unable to make enough food to survive simply because they do not have
enough space.
Many farmers also expressed concerns with education. Due to changes in
government policy, the education which adults attained in school is quite different from
what their children are now learning in the same schools. The largest difference is that
school is now taught in a different language10
. As the parents are only able to speak the
new language, but cannot read the characters, many children struggle and drop out before
they would if their parents were able to help them. Parents often hire a tutor for their
children, but it is very expensive to do so. With a great understanding and appreciation of
the importance of education, parents are very nervous about the prospects for their
children, if they are unable to complete grade school.
10
During the Derg, all schools taught Amheric, the national language in Ethiopia. Under the new federal
democratic republic, states are encouraged to teach regional languages and letters. As a result, this region
now learns Oromifa in school.

87
The central location of Sirbana encourages investment from foreign companies
interested in growing vegetables and cut flowers for sale abroad. A recent large scale
investment from Holland brought 2,000 jobs to the area, which people were able to obtain
without high school or college education. Some farmers gave up their land in order to
work at the factory instead. However, despite the benefits from the jobs, the company
also diverted water away from farmers, causing problems for subsistence farmers.
Further, those who worked in the factory were exposed to chemicals which caused
subsequent health problems. While many farmers feel that the best path for the future is
to work off-farm to earn money, and to keep a small farm in order to grow food for
consumption, issues such as water diversion and health problems caused by large scale
investments have made many wary of any type of foreign investment.
Due to poor past relationships with education and investment, most farmers are
not particularly optimistic about the future of the community, although they are
optimistic about the future of their children. Many believe that education opportunities
will decrease and foreign investment will increase, exacerbating the issues of land and
problems with chemicals which they have already experienced. Overall, most farmers
hope that their children will also be farmers. Many believe that the large investment
farms will teach them about technology, and therefore their children will learn to improve
their farming techniques. However, while they feel that their children will be better off as
adults, they do not think that they themselves will be better off in their own lifetime.

88
A.4 Korodegaga
Korodegaga is situated in Oromia located southeast of Addis Ababa. It is a poor-
soiled, located in an impoverished region, just outside of a fertile and wealthy valley. The
village is bordered by the Awash River, and the only access to the village is on a raft,
manually hauled across the river on a steel cable. Korodegaga is remote, 38 kilometers
from the nearest paved road, which results in many issues related to access, in particular
in regard to buying and selling food. Cereals are the most common crop, but in recent
years some households have grown green beans for sale at market. Hybrids are
occasionally available, although seeds are frequently delivered too late to use. This is
likely the result of Korodegaga’s distance from markets. Although the town is located on
the river, drought is a large problem in the region. As most hybrid seeds are resistant to
drought they are preferred over local varieties.
The primary problems faced by farmers include: 1) lack of access to roads and
markets, 2) poor soil quality, and 3) land scarcity. Due to the town’s isolation, residents
of Korodegaga have frequent issues with late delivery of seed and fertilizer, and are
therefore often unable to use them. Also, due to the distance from markets, when traders
come to the region, they drop the price at which they are willing to buy, and hence if
farmers sell crops, they do not make a profit. Poor soil quality makes the absence of
fertilizer and hybrid seeds even more problematic. Poor soil quality has resulted in lower
yields in recent years. The decreased soil quality is largely due to erosion and
deforestation which resulted from clearing of land to make the area more suitable for
agricultural purposes. Land scarcity is the largest problem, however. With rapidly
increasing population and barriers to out-migration, more people are demanding land for

89
farming in the region. Large estate farms have also come into the area, increasing
competition for land, though thus far estate farms have been unsuccessful due to the poor
quality of soil. On average, farmers own just less than 1 hectare of land, although all
expect this amount to decrease in the next five years.
Women are particularly outspoken in the community, compared with other
regions in Ethiopia. Women believe that ownership of their own reproductive decisions
could help to mitigate population growth, but they did not feel that they have an
understanding of contraceptive to a point where this was possible. As a result they felt
that land would be a greater problem over time due to more children to split the land
among. Further, they felt somewhat that this densification was their fault.
Weather is also a large problem in the region. While on a river, drought is a great
issue. Irrigation cannot always be done, although most farms to have the capacity to do
so. While there is a pipe in the village that leads to farms, it is too expensive to pump
water from the river to irrigate fields. Drought is a particularly large problem during the
planting season, while flooding is a problem during the harvesting season. Further, during
the rainy season, the river often overflows, and destroys crops which are farmed along the
river and otherwise benefit from the water’s proximity. Water in general is an issue in
Korodegaga, as many farmers have problems with drinking water, in addition to water for
farming. All water is obtained from the river, but the river is polluted by a nearby
recreation center. As a result, there are problems with water beyond the drought and
flooding dealt with by farmers in other areas.
Despite their difficult situation, all farmers, particularly women, feel that the
future will be better for their children. Due to technology, modern inputs, increased

90
planting and growth of high value crops, and better education for their children, farmers
believe that their children will be better off, regardless of their chosen profession. Many
farmers feel that they will be even more successful if a road is built to the area.
A.5 Oda Dawata – Assela
Assela is situated in the Oromia region, southeast of Addis Ababa. It is located at
the base of a set of hills, although most of the land within the village is flat. The primary
crops grown are wheat, maize, and barley. Hybrids are preferred by most households as
they generate greater yields and are more tolerant to disease than local varieties. Many
vegetables are also grown, including potatoes, onions, and beans, although only local
varieties are used. Traders do not frequent the region, although there is a market close-by
where farmers can sell their surplus. In recent years, farmers have grown more potatoes
due to increased demand at market. Many farmers have found that growing a few potato
plants can ensure money for food, even if other crops fail.
The main problem faced by farmers is lack of access to land due to rising
population density in the region. Although Assela does not deal with the same problems
of lack of access to fertilizer and seed, or soil degradation as observed in other areas,
most farmers perceive a tremendous increase in population density. In addition to more
people having more children, there are also fewer people migrating out of the area, and
more people immigrating into the region. There is a general perception that farmland is
better in this region and therefore people are hesitant to leave, and many people are eager
to come. As a result of the increase in population, land has become scare. Most people
own about 1 hectare, although some in the area own as many as 7 hectares. As a result of

91
the decreasing availability of land, fallow periods have become uncommon and
alternative land management practices have become popular. Many people favor crop
circulation and manure to restore land.
Rain is also a concern, primarily due to flooding. As the village is located below
hills, drainage off the hills, in addition to the rain itself, often damages crops. Also,
although the nearest market is not far, it is necessary to cross a bridge to get to it, and in
strong rains, the bridge is often washed away. Farmers have observed that rain has
become much stronger in recent years, and although its frequency has not changed, the
amount of rain that comes each season has increased. Many farmers attribute this shift to
climate change.
Opinions about the future are consistent between farmers. Some felt optimistic
about the future, while an equal number were pessimistic. For those who were optimistic,
they trusted that science and technology would help children to improve farming. They
also believed that children could advance into different professions with more education.
They felt that their children would be as well off as themselves, and in most cases,
potentially even better off. However, while those who were pessimistic agreed that
education and technology would improve the lives of their children, they believed that
rising food prices and increased costs associated with farming would make it too difficult
to have a living in any type of work. As a result, they felt their children’s lives would be
worse than their own. Both groups agreed, however, that in the future, farms would be
smaller and that any adaptations in farming practices would need to come through
technology. Further, both groups felt that rather than attempting to deal with the issue of
lack of land, over which they have no control, they should instead try to family plan, and

92
have fewer children to address land scarcity. Further, they also felt that diversifying into
more off-farm activities, in particular handicrafts would be a good route for their children
in the future, when farming became more difficult.
A.6 Turphe Kechema
Turphe Kechema is situated in the eastern Shewa zone of the Oromia region,
close to the relatively large city of Shashemene, southeast of Addis Ababa. Located about
approximately 2,000 meters in elevation, it is a plain area with fertile soil suitable for
agriculture. Further, it is in the vicinity of one of Ethiopia’s large forests, as well as to
three rivers, one of which runs through the village. The primary crops of the area are
wheat, barely, teff, and potatoes, although maize and chickpeas are also grown. Hybrid
seeds are only preferred for wheat and maize, as for other crops using hybrids historically
resulted in crop failures.
The primary problems faced by farmers are: 1) soil quality and 2) access to land.
Soil quality has been decreasing over the past twenty years, and few measures have been
taken to mitigate the decline. Inappropriate farming techniques, in particular elimination
of fallow periods, and deforestation have caused soil quality to deteriorate. The problem
has been exacerbated by lack of access to fertilizer, which is too expensive for most
farmers in the area to afford. The poor soil quality, combined with lack of access to land,
has caused many people to leave farming altogether and become day laborers in
Shashemene, a large city nearby. Despite people leaving farming, there is still a lack of
land, and most farmers own just less than 1 hectare. Some common land still exists in the
village, although this is primarily used for animal grazing. Animal agriculture has

93
become more common in Turphe Kechema as population density has increased, as
animals do not require as much land as required by food crops.
Registration activities recently took place in Turphe Kechema and they have
increased security of land ownership. Farmers now feel as though they actually own their
land, although they do understand that the government is still technically the legal owner.
Most farmers also believe that registration has resolved disputes that previously occurred
as the boundaries of property are more clearly defined. Unfortunately, taxes are now
more clearly established, and the amount paid is based on the amount of land held.
Farmers enjoy having clear boundaries, but do not care for paying taxes. However, they
believe on the whole that the registration program was successful.
Farmers do not have a positive opinion of the schools in the area. Most feel that
20 years ago, when they were going to school, education was far better. Due to the
increase in competition for jobs and the increase in the average level of education of a
typical person, a high school or college education no longer guarantees a job. As a result,
many farmers believe that education is worth less than it was previously. However,
although they do not believe that education has a great value, most farmers also do not
believe that their children should be farmers. As landholding is decreasing and prices of
food are rising, most farmers believe that their children should seek other professions,
outside of farming.
Since farmers do not believe that farming or education will improve the lives of
their children, they feel that they must save more money for them. Many with older
children have also encouraged migration beyond Sheshamane to Addis Ababa and the
Middle East. For those that remain in the area, farmers believe that diversification of

94
crops, away from plants, to animals, will be a good decision for the long-term. Goats,
particularly, are easy to care for and do not require much land. However, overall, most
farmers believe that moving away from the area altogether will be the best option for
success.
A.7 Addado
Addado is located 390 kilometers south of Ethiopia’s capital, Addis Ababa, in the
Gedeo zone of Southern Ethiopia. The two largest towns nearby are Bule, which is 10
kilometers away, and Dila, which is 25 kilometers away. Due to its isolation, the people
of the Gedeo zone have been historically considered culturally and linguistically different
than the rest of the population. However, in recent years, improved transportation has
decreased this diversity. The region is known for its excellent production of coffee.
Unfortunately, there has been general lack of success in growing cereals. While some
maize hybrids are grown in the region, for the most part, enset is the staple crop of
choice. Enset is a perennial tree crop, which produces a starchy root vegetable, which
resembles a banana. Throughout Ethiopia, it is generally considered to be a food of
desperation, eaten only during times of starvation. As a result of Addado’s historic
isolation, most farmers do not to rely on markets for staple crops, and instead grow enset
to ensure food security.
The primary problems facing farmers include: 1) soil degradation and 2) access to
land. While most of the crops grown in the area are tree crops, which do not require
fertilizer or the same level of soil quality as subsistence crops, soil quality is still
problematic for those who grow subsistence staple crops. As mentioned previously, many
families move away from subsistence crops to coffee. Lack of access to land is common

95
due to the success of coffee in the region as well. Many large scale investors have built
coffee plantations, which create jobs for local people, but take away land from small-
scale farmers.
In addition to large estate farms, a great increase in population has made land
even more constrained. Some farmers have left farming and instead diversified into other
activities, including working as hired labor on other people’s farmers, self-employment
making handicrafts, as well as working in coffee-trading. While coffee-trading is quite
common in the area, most traders are not local, and historically locals who have tried to
make their living this way have not been successful.
Education is a large concern in Addado. Though all adults believe that education
is important and want their children to go to school, attendance at primary school is
below 40 percent, and no children attend secondary school. Parents feel that it is difficult
to force children to attend school. Paying for education and the quality of the schools in
the area are also of concern to many farmers. With so many local coffee plantations, there
are many opportunities for off-farm labor even for children. Therefore many children
leave school in order to make extra money for their families. In a community where food
is scare, and generally purchased rather than grown, it is difficult for parents to force their
children to attend school when they could be making money. One teacher expressed
concerns of this problem and admitted that he did not know how to begin to address the
problem.
Perhaps due to the status of education in the community, many farmers believe
that the future will not be better for their children. Even those who hold the most
optimistic view of the future still only feel that their children’s lives will be fine. They

96
feel that their lives are already decent, so it is likely that is how circumstances will
continue. For those farmers who are not optimistic, it seems that there is not enough land,
there are too many people, and these pressures will combine to make life too difficult for
everyone. Instead of farming, most believe that children should seek employment away
from the village, toward the capital or other large cities in Ethiopia. Some families even
express the desire to move away from the village while their children are still young.
They hope that will give them the chance to get an education and live somewhere else, so
and ensure that they do not get stuck in Addado, which they view as entrenched in
poverty.
A.8 Aze Deboa
Aze Deboa is situated about 360 kilometers southwest of Addis Ababa and is
about 4 kilometers from Durame, the next closest city. The woreda11
in which it is
located, Kembata, is one of the most densely populated in Ethiopia. Due to the proximity
to so many cities, the region has a long history of seasonal and temporary migration.
Most crops, as a result, are primarily tended by women, who are present year-round.
These crops include enset and maize for consumption, as well as chat and coffee for sale.
Hybrids are preferred for maize, however, recently yields have decreased and many
farmers are shifting away from hybrids altogether. When growing hybrids, fertilizer is
essential. As fertilizer has risen in price, recently it has been too difficult for farmers to
purchase, further encouraging farmers to return to conventional varieties of seeds.
The primary problems faced by farmers include: 1) lack of access to land, 2) soil
degradation, and 3) climate change. Access to land has decreased due to increases in
11
This is an Ethiopian word that is the English equivalent of county.

97
population density. Most farmers now hold approximately ½ of a hectare, while twenty
years ago, most farmers owned 2 hectares. Some common land is still available in the
village, although it is used for grazing. Many farmers wish the land could be divided
among those who do not have any land. Population density expansion has also resulted in
the degradation of soil, due to over-farming and deforestation of land in order to create
land suitable for agriculture. While some practices, including soil ditching to prevent
water retention and planting trees to restore soil quality, have been undertaken in recent
years, the effects of such practices have not yet been observed.
Climate change was highlighted and frequently discussed by farmers as it
influences all areas of their lives. Farmers attribute many problems to climate change,
including: 1) soil degradation, 2) decreasing yields, and 3) shifting weather patterns. The
last of these points is largely observed through changes in seasonal rains. The timing of
rain has shifted so there are more droughts during the first rainy season and more
flooding during the second rainy season. When drought occurs, the land becomes dry,
which results in greater flooding when the rains do come. Flooding causes erosion and
washes away crops, which further damages soil. Additionally, dry weather followed by
flooding encourages the growth of pests, particularly on root crops, ultimately killing
them. Farmers believe that in the future, climate change will become worse, and they are
not sure how to adapt to it.
In the future, most farmers hope that circumstances will improve. However, when
they consider climate change and population pressures, they do not believe that their lives
will get better. Most feel that if they or their children want to remain working as farmers,
they will need to transition away from growing staples crops, and instead move totally

98
toward high value crops, such as beans, coffee, vegetables, and root crops. Even with
these changes, however, they do not believe that their children will have lives as good as
their own, if they continue working as farmers. Instead parents believe that their children
should look for local non-farm employment, in particular in making handicrafts and
similar artisan crafts. They also believe that migration out of the area, into larger urban
areas, or more fertile rural areas, would be more productive than staying in the area. As
migration for seasonal purposes is very common in the region, most parents feel that for
their sons, long-term migration is a natural choice.
A.9 Doma
Doma is situated about 500 kilometers south of Addis Ababa and 100 kilometers
from Sodo, the capital of the region. Most residents of Doma were resettled into the area
during the 1980s, in an attempt to move people away from areas suffering from drought
during that time. Although Doma12
means “harshlands” and from 1985 until 1990 the
area suffered a drought, most households resettled into the area have remained. The soil
is fertile and not particularly densely populated. The most common crops grown are enset
and maize, with maize planted primarily as a hybrid crop. Fertilizer has only begun to be
used within the last fifteen years, as the quality of soil began to decrease. Historically
both soil and seeds are received at the appropriate time, although recently delivery has
been later, and not on time. Farmers believe that because they have been resettled into the
area, the government makes sure that they have seed and fertilizer when they require it, in
order to make the land, and hence the resettlement program, successful.
1212
Alternatively spelled Do’oma.

99
The primary problem faced by farmers is lack of access to land. As Doma began
as a resettlement region many of the people who were resettled have encourage family
members from their original home to move to the area. Additionally, the government still
moves people into the area, and often redistributes land from people already living there
to the new residents. Many people also move into the area voluntarily as they believe that
the area has better agricultural land, and greater access to markets. Most families hold
about 1 hectare of land. There is a great deal of communal land in the area including
grazing land, forest land, and a nearby national park. The latter two are protected by the
government, although the forest is frequently segmented and given to new residents for
farming. As more people move into the area, farmers believe that even more land will be
taken from them, and from the forest. They feel that over time it will become impossible
to farm enough food to feed their families because their plots will be too small.
Irrigation is very common in Doma and there is a tremendous difference between
irrigated and non-irrigated land. For a farmer who holds 1 hectare of land, generally
about one half of that is irrigated land. Most farmers do not own more than 1 hectare of
irrigated land, even if they own more than 2 hectares of land altogether. Obviously, land
which can be irrigated is more valuable than non-irrigated land. Large-scale irrigation
projects have been undertaken by residents since being resettled in the area, including
digging canals and ditches so that water can be properly distributed through fields. Non-
irrigated fields are typically used to grow subsistence crops, while potential high value
crops, including potatoes and onions, are grown in irrigated fields.
Farmers believe that their children will have better lives than they do working as
farmers and would like them to continue working as farmers. Even though they want

100
their children to work as farmers, 85 percent of children still graduate secondary school.
Many parents have made investments in their land, and believe that such investments will
provide in the future and ensure good lives for their children. With such investments,
farmers believe that their children will be able to produce plenty of food for their
families, even on a smaller amount of land. They feel that even though they sometimes
struggle now, they were redistributed into a productive region, their families will succeed
there, and the government is looking out for them.
A.10 Gara Godo
Gara Godo is situated in Sidmo province, with the nearest city being the densely
populated Wolayitta. The village is about 1,700 meters above sea level and has poor soil.
Gara Godo has suffered during all recent famines, including those in 1983, 1984, and
2003. Although the region appears to be fertile, and the entire region looks green, crops
are generally not successful, giving the nickname “Home of the Green Famine”. The
most common crops which are grown are barely and enset, although several types of
maize are grown. Hybrid maize is preferred, when available, although typically seed is
not delivered to the village in time, so it is generally not used. Fertilizer is also required
for hybrids to be successful and it also suffers from a delivery timing problem. While
hybrids are desired, due to their greater yields, most families grow conventional varieties
of maize, enset, and barely for consumption.
The primary problems facing farmers are: 1) lack of land for farming, 2) soil
degradation, and 3) lack of production of food crops. While many people have been
leaving the area, families still have many children, increasing the amount of land required
by each household in order to produce enough food. Most farmers hold under ½ of a

101
hectare of land. The land was registered to increase security of tenure in the early 2000s,
but there are still many disputes over land ownerships in the region. Some common land
is still available, although it is used for grazing animals, and for meetings organized for
the town. Most farmers do not believe that it could be transitioned into farm land, despite
the need for increased agricultural land. Soil degradation is a large problem due to the
scarcity of land and lack of fertilizer. Land is no longer kept fallow and no conservation
practices have been undertaken to attempt to restore the land. Most farmers are concerned
with producing enough food to feed their family in the current year, rather than planning
for future years’ crops.
Overall, the main problem in the region is the lack of food. Farmers are hesitant to
diversify into high value crops, due to the risk of crop failure which comes with an
unfamiliar crop. Although diversification is a traditional coping mechanism when land is
scarce, and has been done by other villages in our survey. However, farmers in Gara
Godo are unwilling to try new crops when they do not know the outcome. Some farmers
have begun to grow coffee, as a cash crop, but have suffered as coffee plants take several
years to produce. In the time between they have been forced to purchase food on credit,
and other farmers believe them to be “suffering greatly”13
. Due to the long gap between
coffee planning and harvesting, as well as the perceived suffering, other farmers are
hesitant to diversify to coffee.
Farmers do not believe that their children will be as well off as they are. All
perceptions about the future were very pessimistic. Most farmers believe that education is
the best option for their children, but believe that even education will not guarantee them 13
This is simply a quote from survey participants. No people who were actually growing coffee as an
adaptive strategy participated in our survey.

102
work in the future. This echoes other villages and farmers beliefs that college education o
longer guarantees employment, due to the large number of people who now have college
degrees. Most farmers would prefer their children to work off-farm making handicrafts or
migrating away from the region altogether to Addis Ababa, or to different countries in
Afica. Many parents have watched their children starve to death in recent famines, and do
not want their children to see their own offspring suffer in the same way. Therefore, most
would prefer their children to leave Gara Godo, and in some cases, Ethiopia, altogether.
A.11 Imdibir (Emdibir)
Imdibir is situated on 800 hectares of flat land, although it is located in a
mountainous part of the Shoa region. Historically, the area has been considered
unfavorable for crops due to this terrain, despite having good weather and abundant water
sources. However, the village itself is favorably located and most households are able to
farm on flat land. Due to the desirable traits of the region, it is quite densely populated.
The primary crops grown include coffee and chat for sale and enset and maize for
consumption. Wheat and teff are also grown, although only when hybrids are available.
Hybrids are also preferred for maize, due to their rapid maturation and resistance to
diseases. Although hybrids require fertilizer, farmers are generally willing to pay the cost,
provided that fertilizer is available. In recent years timing has been problematic, so
despite demand, it is not always possible for farmers to use it.
The primary problems faced by farmers are: 1) lack of access to land and 2)
degradation of soil quality. Most farmers own just less than 1 hectare of land, but
increasing family sizes have made it difficult to produce enough food for a family on that
amount of land. Due to these constraints many households would like to leave the area,

103
but cannot due to due to lack of money and lack of support in the urban areas. Many
farming households cope with present difficulties with diversifying to other activities, in
particular raising animals and selling handicrafts. Degradation of soil has become a
greater problem due to the constraints of decreasing land size. Soil has been degrading
slowly over time, but has increased recently due to lack of fallow practices, which
stopped about ten years ago. Many farmers indicate a desire to revive fallow practices, as
they did recently, but due to the lack of land, they are unable to do so. Instead, terracing
has recently taken up, with the help of a Catholic aid organization. There has been some
success in improving soil quality in those areas as a result.
High value crops have become more important over time. A large number of
farmers are transitioning away from producing only coffee and chat as crops for sale, and
beginning to include spices, avocados, and mangos. Fruits, in particular avocados and
mangos have been in high demand in the capital, and therefore farmers have been able to
get good prices. Other farmers, despite the success of others, are hesitant to give up other
crops due to fear of prices decreasing.
In Imdibir farmers have mixed perceptions about how their children will fare in
the future. Many believe that agricultural productivity will increase through improved
technology, and if prices continue to improve, then their children will do well as farmers.
Others are not as optimistic, and are concerned about growing population density and
smaller farms. For those who do not think that their children will be successful as
farmers, they believe that local non-farm employment and trading will be their best
employment options. Education is important to parents, as well. Although education is
less important than before, due to the difficulty in obtaining a job despite high

104
qualifications, parents still believe that education can help children to be better farmers,
as well as increase their odds of getting a job off the farm.
A.12 Somodo
Somodo is situated very close to the city of Jimma, in a major coffee producing
region, located south of Addis Ababa. The area is densely populated, and is one of the
only primarily Muslim villages in the region. The primary crops include coffee and chat
for sale, as well as maize and enset for consumption. Hybrids are not preferred as local
varieties consistently produce higher yields. Further, sale of hybrid seeds are tied to sale
of fertilizer, which makes them cost prohibitive. Farmers who only want to purchase
either seeds or fertilizer are unable to do so, and if they cannot afford both, most simply
go without.
In addition to the problem of lack of access to inputs, the primary problems faced
by farmers are: 1) lack of access to land, 2) poor soil quality, and 3) flooding. Most
farmers own about 1 hectare of land, and most would like to have access to more, but all
available land in the community is currently used for communal grazing land. The village
ascribes great value to communal land and would prefer to keep it public. The farmers
believe that the decrease in land availability is due to a large increase in family size,
although most women believe that contraceptive use has kept this increase smaller than it
would have been otherwise. The increased population density has caused degradation of
soil quality. Land is no longer kept fallow for any period and attempts to improve soil
quality through digging ditches and planting grass have not been successful. Flooding is a
related problem, as it further degrades the soil through erosion. Farmers believe that
climate change is responsible for the increased flooding observed in recent years.

105
Many farmers have begun to diversity crops to a variety of cash crops, away from
just coffee, in order to increase their opportunities to make money through selling fruits
and vegetables. While coffee is consistently lucrative, many farmers have found that they
can make more through selling chat abroad. Many also find it easy to grow other tree
crops, including mangos and avocados. Beekeeping has also become popular, as
pollinators can help to increase yields, and Jimma has historically been known for good
honey.
Schooling is a somewhat contentious topic in Somodo. While the village is near to
Jimma it is still too far for children to walk and there is no public school in the area.
Therefore, children who are educated are sent to a private Catholic school in the area,
which problematic as most families are Muslim. Most parents felt uncomfortable about
sending their children to a school with a foundational base so different from their own,
but ultimately determined that getting a good education was more important. Most
children, as a result, are able to attend school through grade 10 at the Catholic school.
Most farmers are not optimistic about the future for their children. None believe
that their children will be better off than they are as farmers. Due to decreasing farm size,
increasing family size, and degrading quality of land, parents feel that their children will
be better off in different professions. One woman in particular voiced the concern that her
children do not learn as much about farming as she did as a child because they spend all
their time in school. She argued that they could perhaps be better off as farmers if they
were able to attend school part time and spend the rest of the time on the farm. However,
due to the structure of the school, they must attend full time. She said that it was not
possible for her children to be better off as farmers. Most parents echoed her opinion and

106
said that their children would be better off migrating to urban areas, or out of the country
altogether. As most families are Muslim, there was great optimism for moving to Qatar or
other Arab nations and making a new life there. While most farmers in Somodo are
presently doing well, they have little hope for the future of their children.