How performance management can improve client satisfaction
46
Wendy Xiaowei Li Ph.D. Oral Defense – June 22, 2012 Construction Engineering and Management, CEE, Stanford University Committee Martin Fischer, John Kunz, Ray Levitt, Mike Lepech Chair: Robert Burgelman (Graduate School of Business) Metric-Based Performance Feedback Methodology (MetPerforma)
-
Upload
skanska-usa -
Category
Business
-
view
2.033 -
download
0
Transcript of How performance management can improve client satisfaction
Wendy Xiaowei LiPh.D. Oral Defense – June 22, 2012
Construction Engineering and Management, CEE, Stanford University
CommitteeMartin Fischer, John Kunz, Ray Levitt, Mike Lepech
Chair: Robert Burgelman (Graduate School of Business)
Metric-Based Performance Feedback Methodology (MetPerforma)
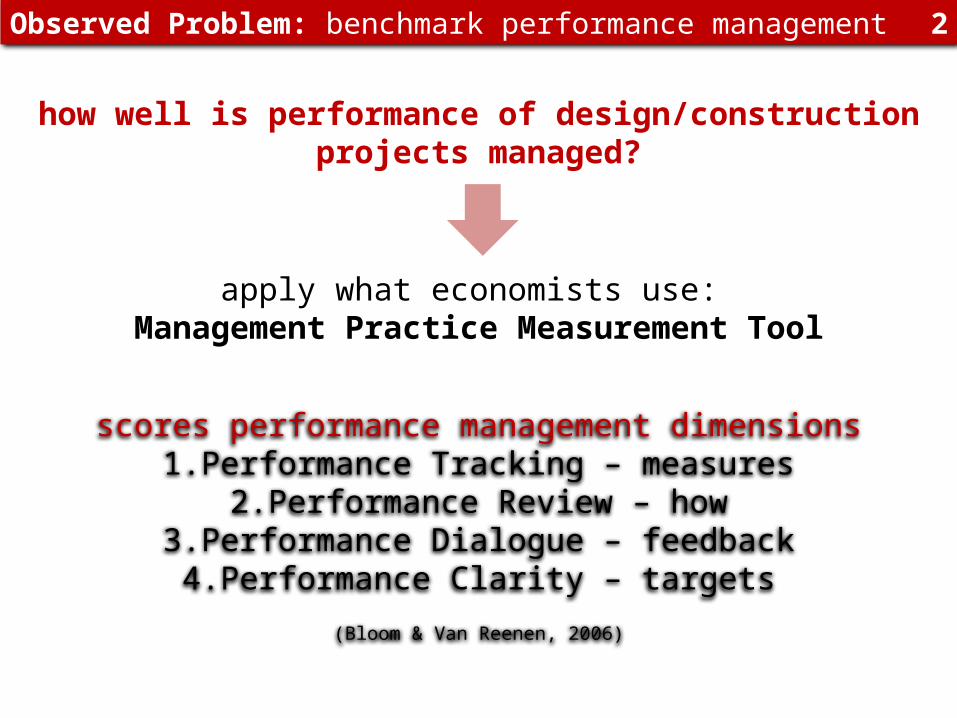
Observed Problem: benchmark performance management 2
how well is performance of design/construction projects managed?
apply what economists use: Management Practice Measurement Tool
scores performance management dimensions1. Performance Tracking – measures
2. Performance Review – how3. Performance Dialogue – feedback
4. Performance Clarity – targets
(Bloom & Van Reenen, 2006)
Observed Problem: benchmark performance management 3
30 project interviews with managers
sample interview questions• tell me how you evaluate project performance
• what indicators are tracked? • how frequently?
• how do you know how you are doing against those indicators?
0
1
2
3
4
5
6
7
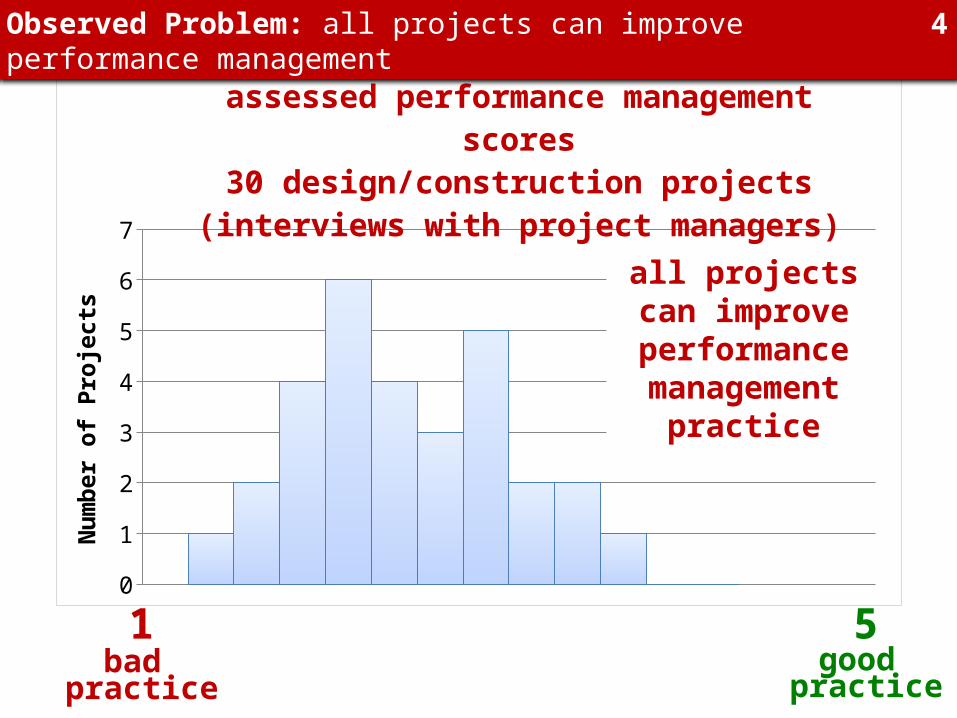
assessed performance management scores30 design/construction projects
(interviews with project managers)
Num
ber o
f Pro
ject
s
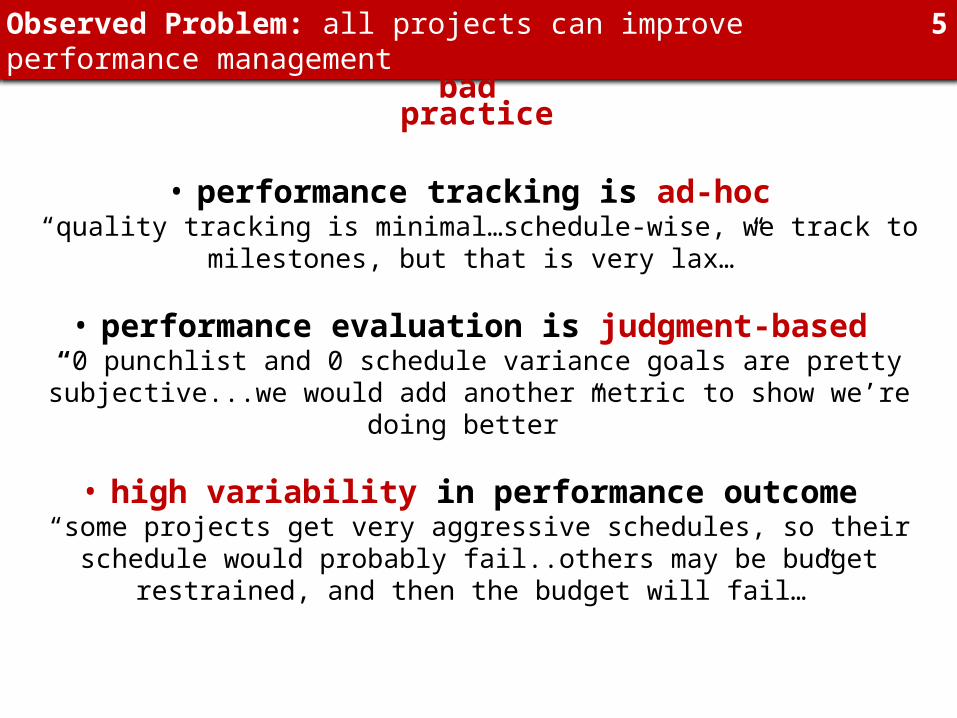
bad practice
all projects can improve
performance management
practice
Observed Problem: all projects can improve performance management 4
1good
practice
5
Observed Problem: all projects can improve performance management 5
• performance tracking is ad-hoc “quality tracking is minimal…schedule-wise, we track to milestones, but that is very
lax…”
• performance evaluation is judgment-based “0 punchlist and 0 schedule variance goals are pretty subjective...we would add
another metric to show we’re doing better ”
• high variability in performance outcome “some projects get very aggressive schedules, so their schedule would probably
fail..others may be budget restrained, and then the budget will fail…”
bad practice
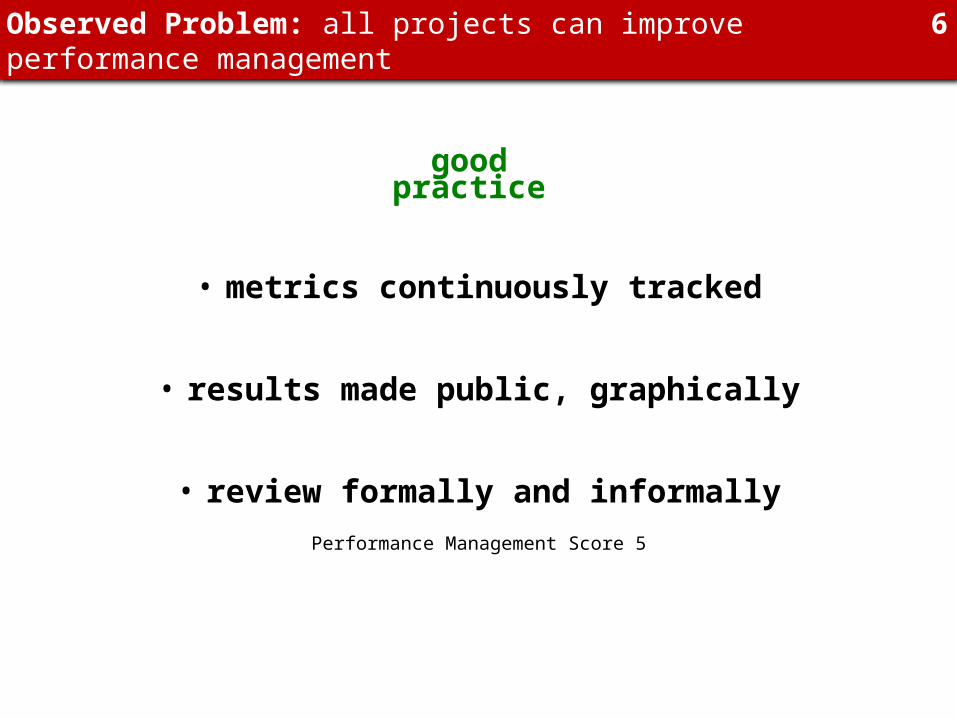
• metrics continuously tracked
• results made public, graphically
• review formally and informallyPerformance Management Score 5
goodpractice
Observed Problem: all projects can improve performance management 6
1984 1986 1988 1990 1992 1994 1996 1998 20003
3.5
4
4.5
5
5.5
6
6.5
7
7.5
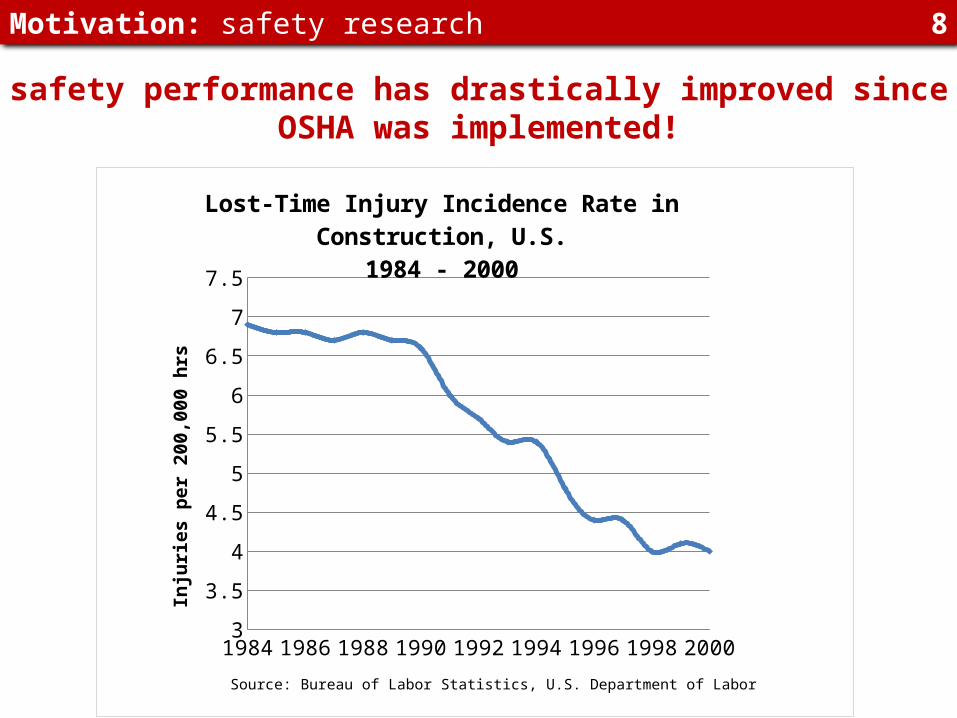
Lost-Time Injury Incidence Rate in Construction, U.S.1984 - 2000
Inju
ries
per
200
,000
hrs
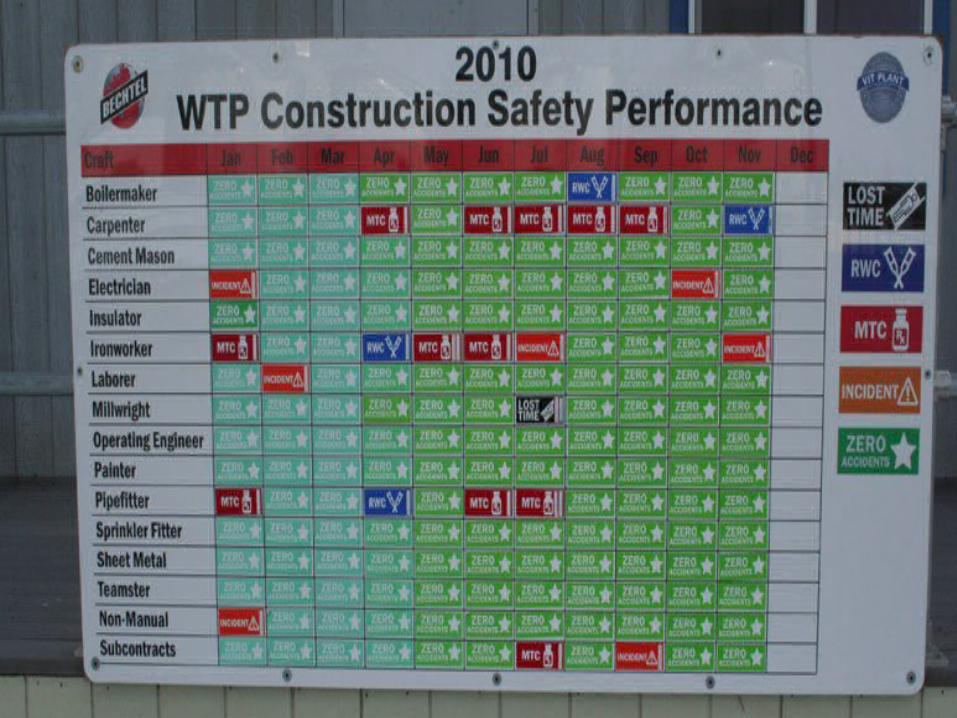
Motivation: safety research 8
safety performance has drastically improved since OSHA was implemented!
Source: Bureau of Labor Statistics, U.S. Department of Labor
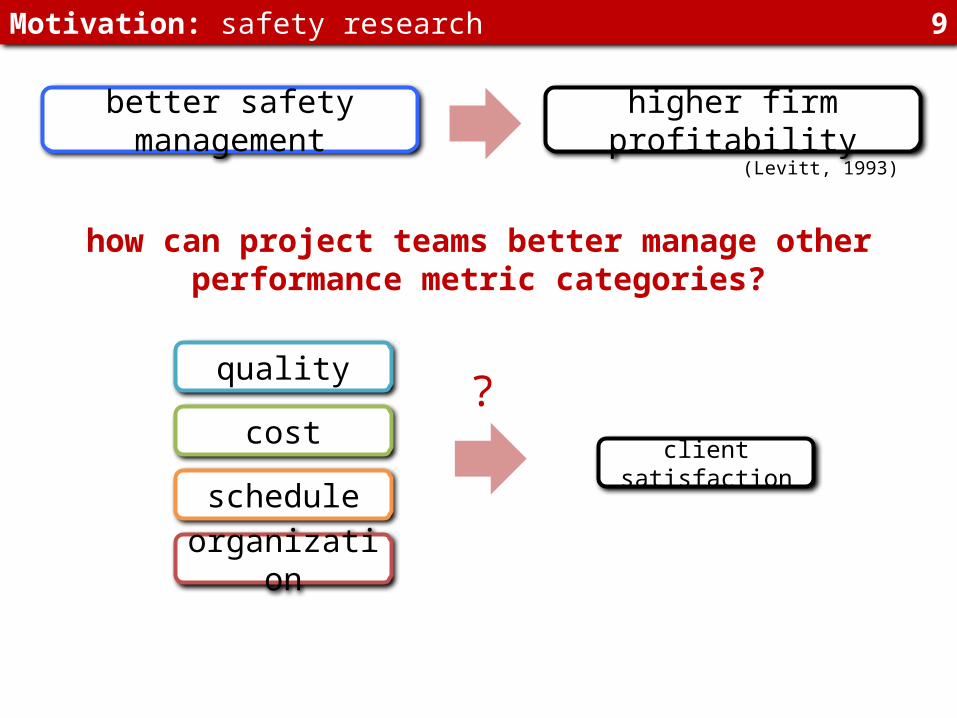
Motivation: safety research 9
how can project teams better manage other performance metric categories?
(Levitt, 1993)
quality
cost
schedule
organization
better safety management higher firm profitability
client satisfaction
?
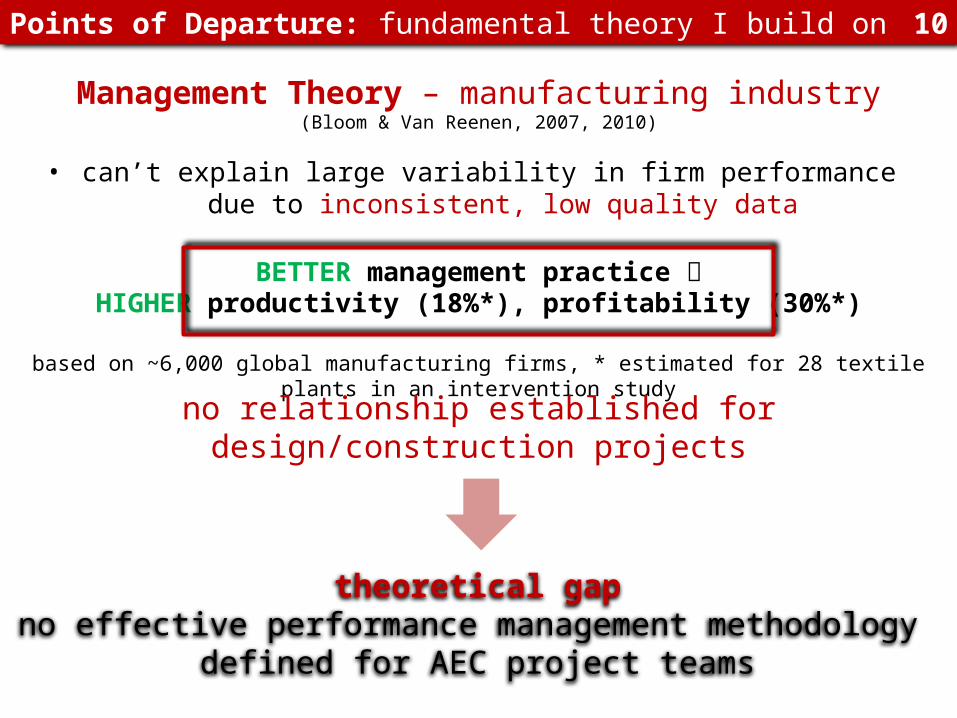
Points of Departure: fundamental theory I build on 10
Management Theory – manufacturing industry(Bloom & Van Reenen, 2007, 2010)
• can’t explain large variability in firm performance due to inconsistent, low quality data
BETTER management practice HIGHER productivity (18%*), profitability (30%*)
based on ~6,000 global manufacturing firms, * estimated for 28 textile plants in an intervention study
theoretical gapno effective performance management methodology
defined for AEC project teams
no relationship established for design/construction projects
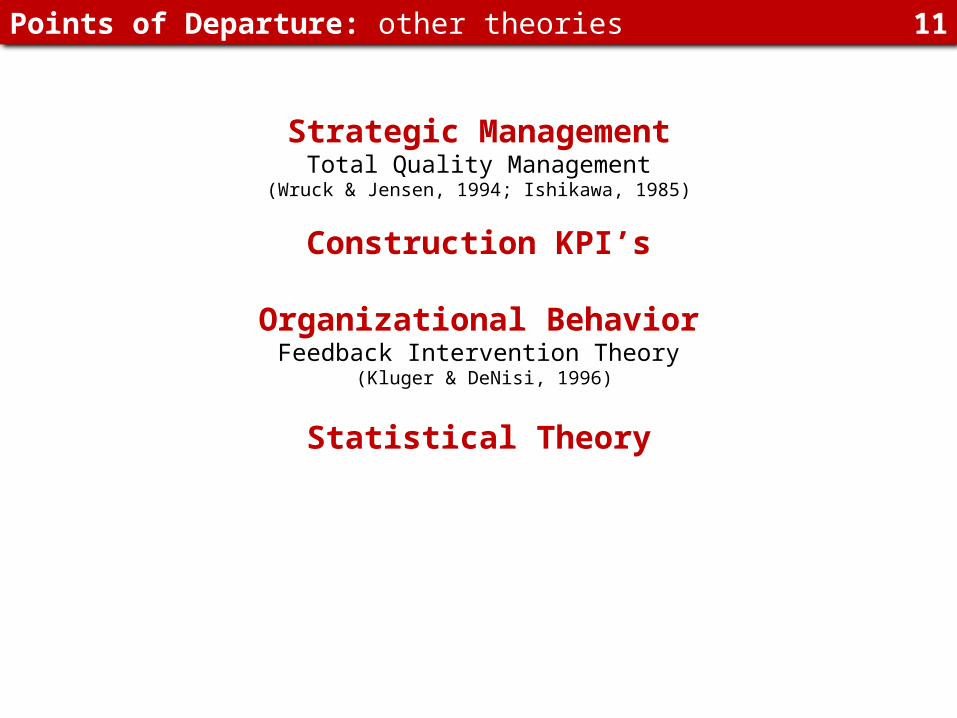
Points of Departure: other theories 11
Strategic ManagementTotal Quality Management
(Wruck & Jensen, 1994; Ishikawa, 1985)
Construction KPI’s
Organizational BehaviorFeedback Intervention Theory
(Kluger & DeNisi, 1996)
Statistical Theory
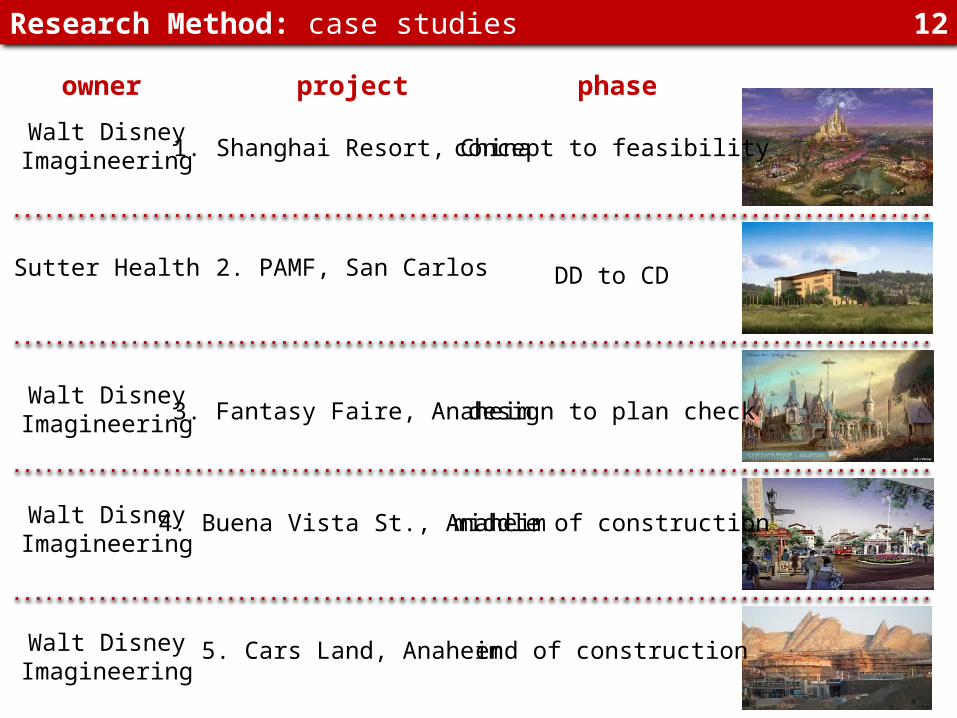
Research Method: case studies 12
owner phaseproject
concept to feasibility
DD to CD
design to plan check
middle of construction
end of construction
1. Shanghai Resort, China
2. PAMF, San Carlos
3. Fantasy Faire, Anaheim
4. Buena Vista St., Anaheim
5. Cars Land, Anaheim
Walt DisneyImagineering
Sutter Health
Walt Disney Imagineering
Walt Disney Imagineering
Walt Disney Imagineering
Conceptual Development
Detailed Development I
Detailed Development II
Formalization
is there sufficient and explanative data?
YES
METPERFORMA DEVELOPMENTRESEARCH TASKS
Theory: MetPerforma 13
Extend Existing Theory
Case Study 1
Case Studies 2 - 5
how can I use MetPerforma?
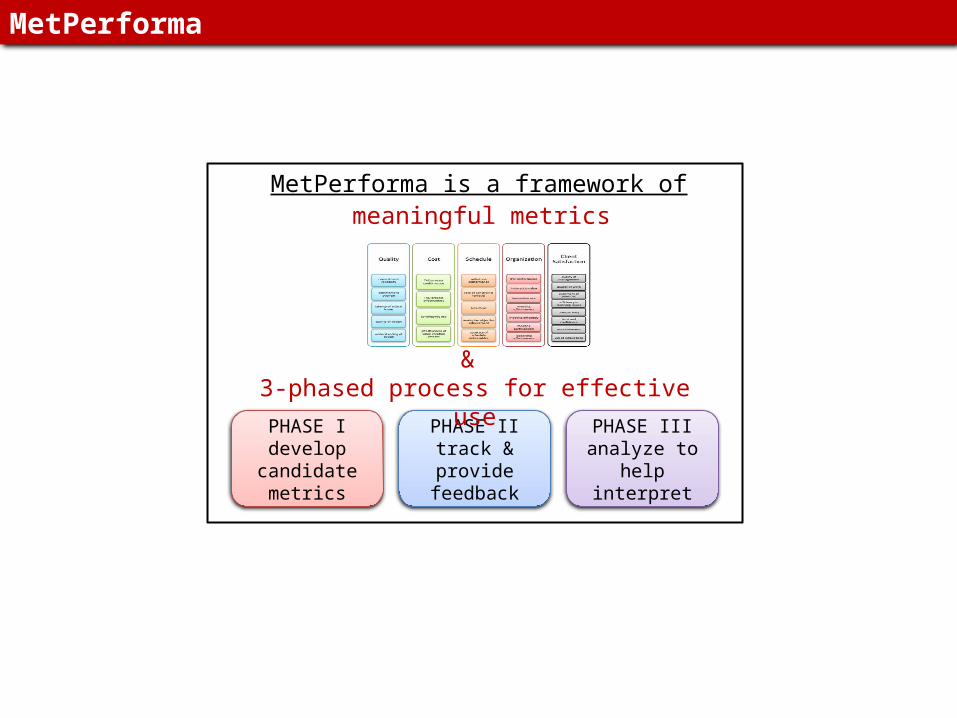
MetPerforma is a framework of
PHASE Idevelop
candidate metrics
PHASE IItrack & provide
feedback
PHASE IIIanalyze to help
interpret
& 3-phased process for effective use
meaningful metrics
MetPerforma
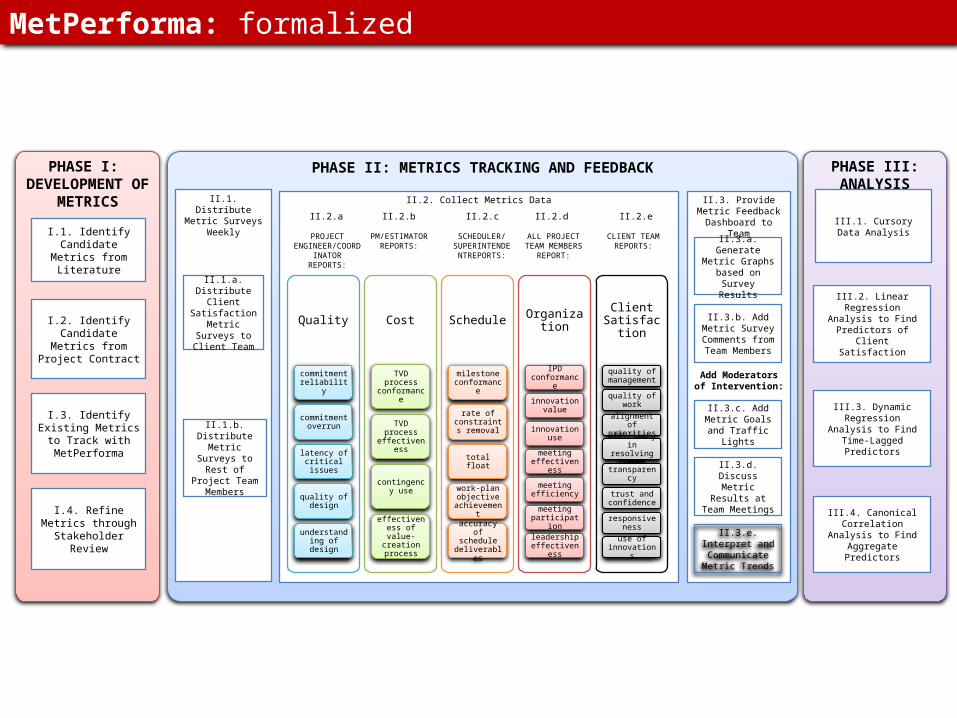
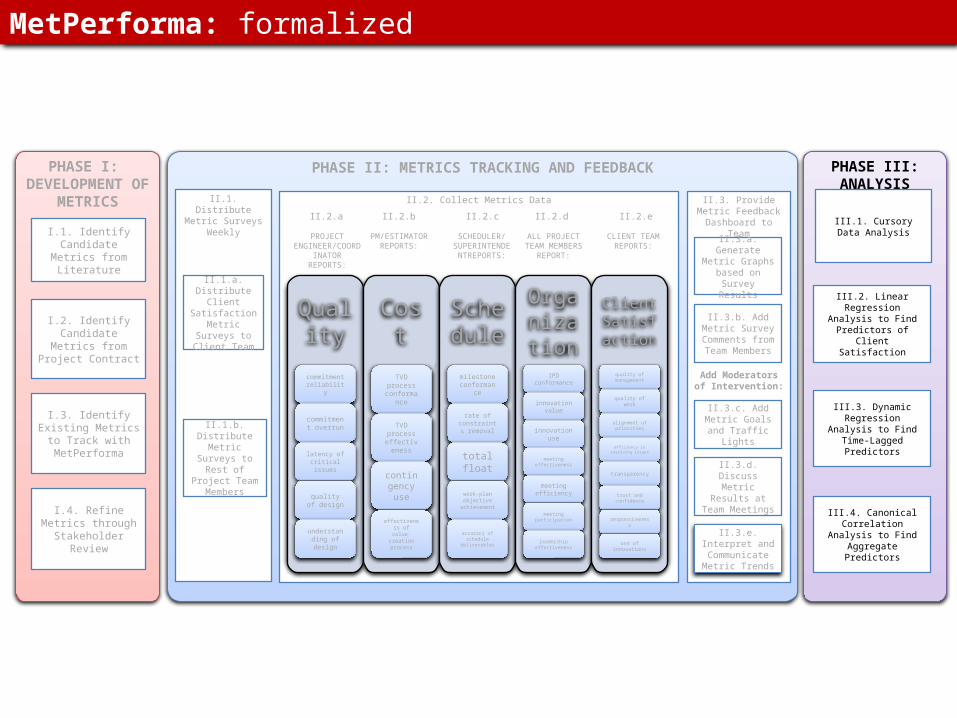
PHASE III: ANALYSIS
III.2. Linear Regression Analysis to Find Predictors
of Client Satisfaction
III.3. Dynamic Regression Analysis to Find Time-
Lagged Predictors
III.1. Cursory Data Analysis
III.4. Canonical Correlation Analysis to Find Aggregate
Predictors
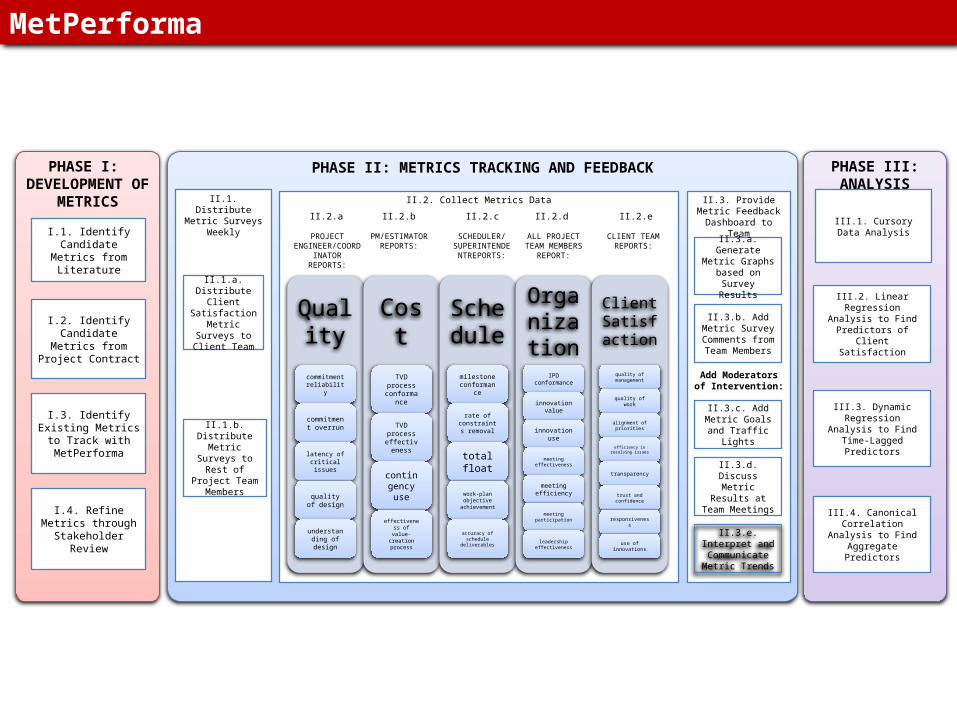
PHASE II: METRICS TRACKING AND FEEDBACK
II.2. Collect Metrics Data II.3. Provide Metric Feedback Dashboard to
Team
II.3.a. Generate Metric Graphs
based on Survey Results
II.3.b. Add Metric Survey Comments
from Team Members
II.3.c. Add Metric Goals and Traffic
Lights
II.3.d. Discuss Metric Results at Team Meetings
Add Moderators of Intervention:
II.2.a II.2.b II.2.c II.2.d II.2.e
PROJECT ENGINEER/COORDINATOR REPORTS:
PM/ESTIMATOR REPORTS:
SCHEDULER/SUPERINTENDENT
REPORTS:
ALL PROJECT TEAM MEMBERS
REPORT:
CLIENT TEAM REPORTS:
Quality
commitment reliability
commitment overrun
latency of critical issues
quality of design
understanding of design
Cost
TVD process conformance
TVD process effectiveness
contingency use
effectiveness of value-creation
process
Schedule
milestone conformance
rate of constraints
removal
total float
work-plan objective
achievement
accuracy of schedule
deliverables
Organization
IPD conformance
innovation value
innovation use
meeting effectiveness
meeting efficiency
meeting participation
leadership effectiveness
Client Satisfaction
quality of management
quality of work
alignment of priorities
efficiency in resolving issues
transparency
trust and confidence
responsiveness
use of innovations
II.3.e. Interpret and Communicate Metric Trends
II.1. Distribute Metric Surveys Weekly
II.1.a. Distribute Client Satisfaction Metric Surveys to
Client Team
II.1.b. Distribute Metric Surveys to
Rest of Project Team Members
PHASE I: DEVELOPMENT OF
METRICS
I.1. Identify Candidate Metrics from Literature
I.2. Identify Candidate Metrics from Project
Contract
I.3. Identify Existing Metrics to Track with
MetPerforma
I.4. Refine Metrics through Stakeholder
Review
MetPerforma: formalized
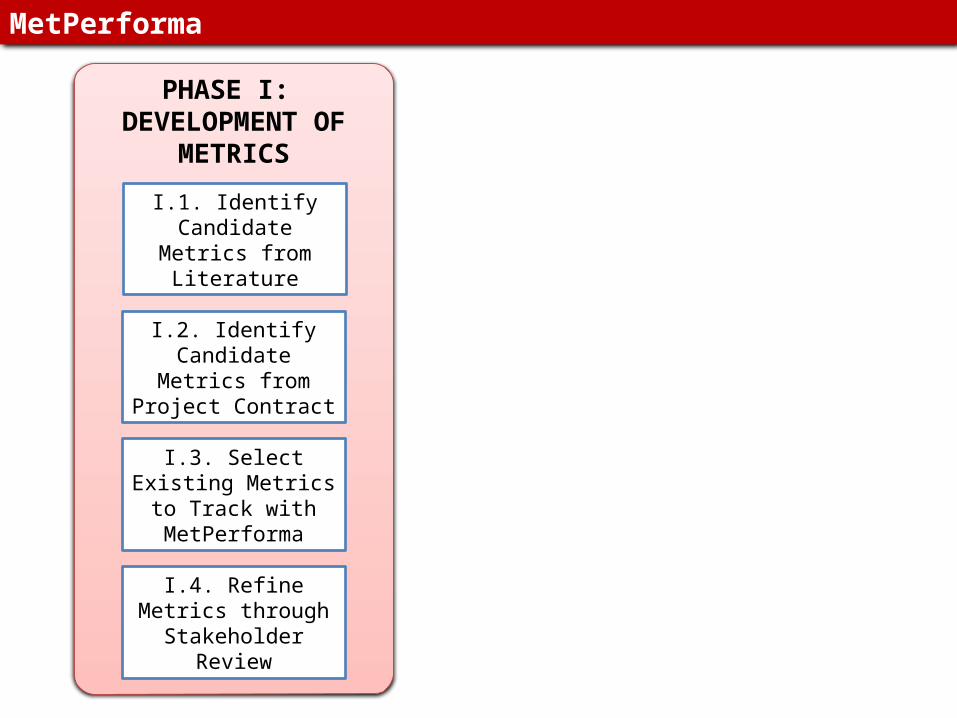
PHASE I: DEVELOPMENT OF
METRICS
I.1. Identify Candidate Metrics from Literature
I.2. Identify Candidate Metrics from Project
Contract
I.3. Select Existing Metrics to Track with
MetPerforma
I.4. Refine Metrics through Stakeholder
Review
MetPerforma
PHASE I: DEVELOPMENT OF
METRICS
I.1. Identify Candidate Metrics from Literature
I.2. Identify Candidate Metrics from Project
Contract
I.3. Select Existing Metrics to Track with
MetPerforma
I.4. Refine Metrics through Stakeholder
Review
(client satisfaction)quality of work
(Uzaslan & Song, 2008)
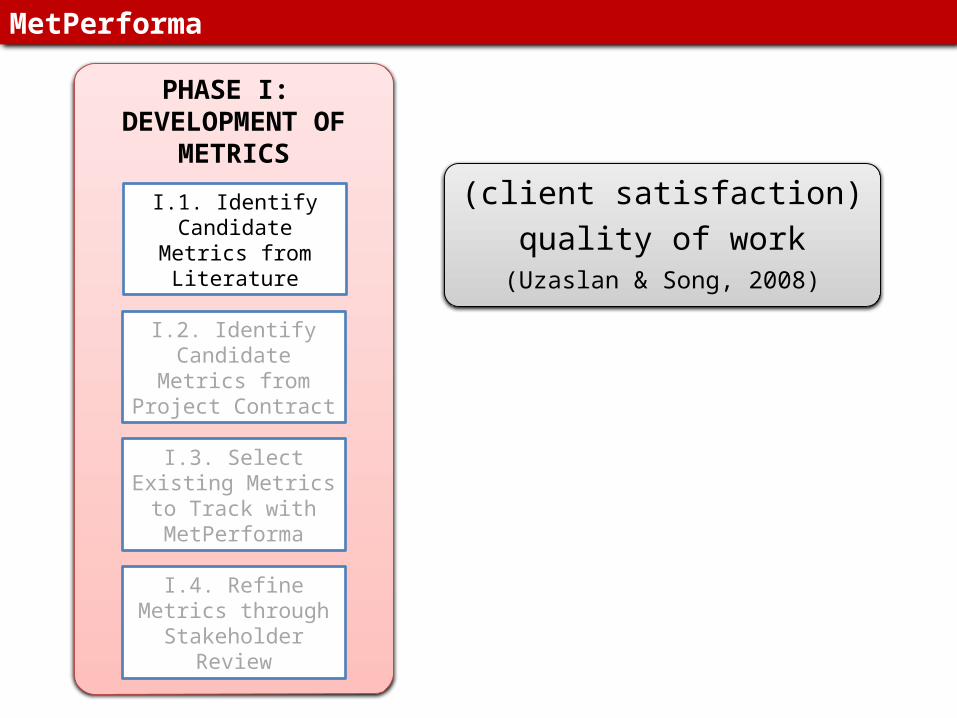
MetPerforma

PHASE I: DEVELOPMENT OF
METRICS
I.1. Identify Candidate Metrics from Literature
(client satisfaction)quality of work
(Uzaslan & Song, 2008)
I.3. Select Existing Metrics to Track with
MetPerforma
I.2. Identify Candidate Metrics from Project
Contract
I.4. Refine Metrics through Stakeholder
Review
commitment reliability(PPC)
MetPerforma: formalized
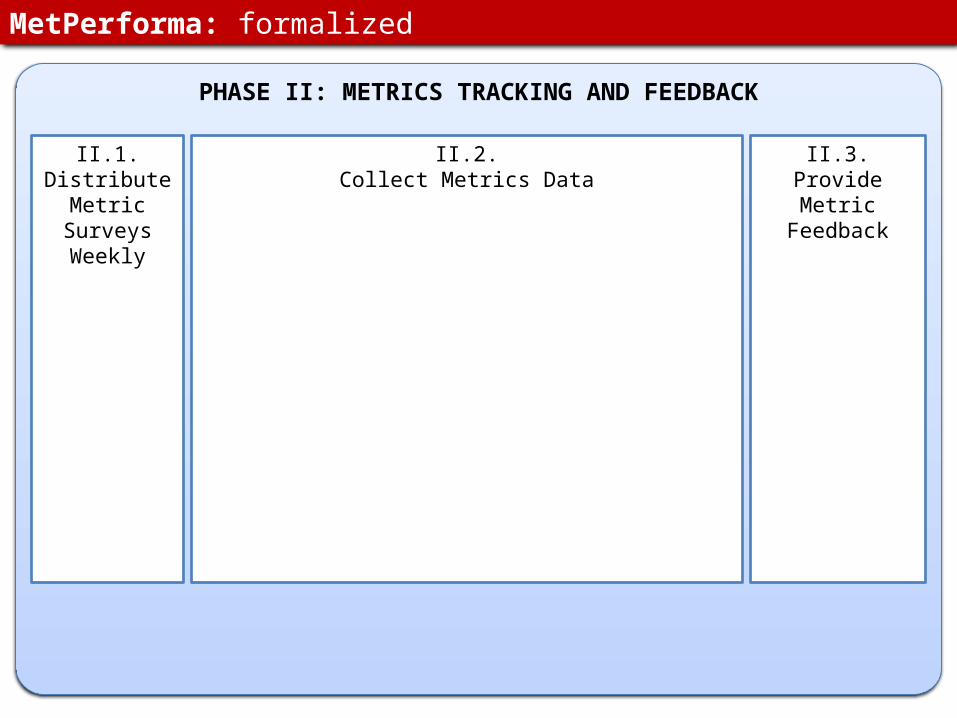
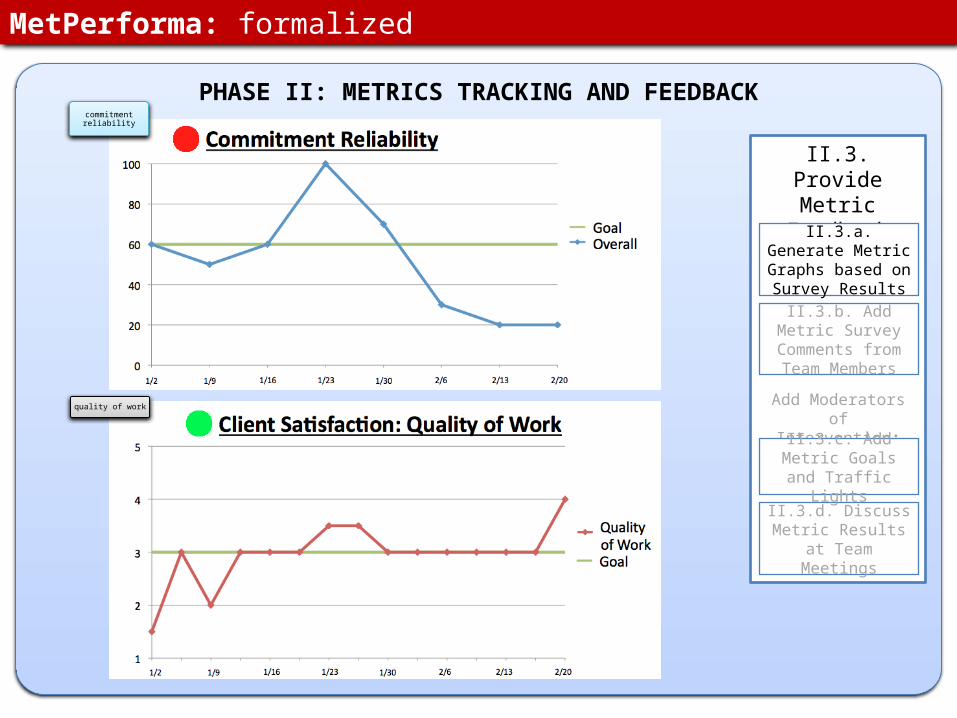
PHASE II: METRICS TRACKING AND FEEDBACK
II.3.Provide Metric
Feedback
II.1.Distribute
Metric Surveys Weekly
II.2.Collect Metrics Data
MetPerforma: formalized
PHASE II: METRICS TRACKING AND FEEDBACK
II.1.Distribute
Metric Surveys Weekly
II.1.a. Distribute Client Satisfaction Metric Surveys to
Client Team
II.1.b. Distribute Team Metric
Surveys to Rest of Project Team
Members
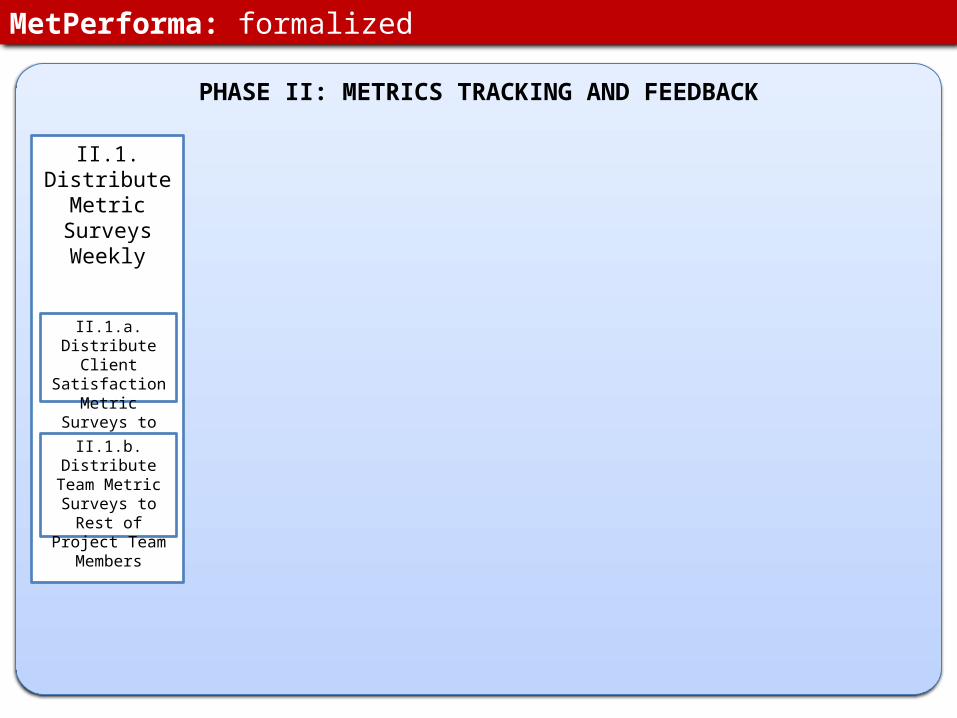
MetPerforma: formalized
PHASE II: METRICS TRACKING AND FEEDBACK
II.1.Distribute
Metric Surveys Weekly
II.1.a. Distribute Client Satisfaction Metric Surveys to
Client Team
II.1.b. Distribute Team Metric
Surveys to Rest of Project Team
Members
quality of work
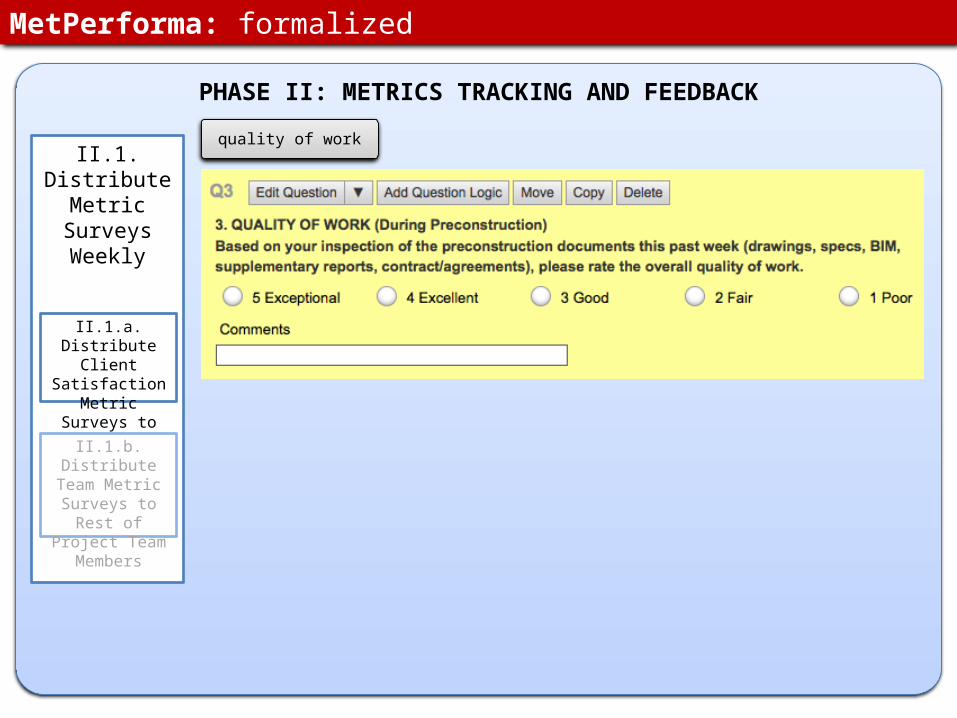
MetPerforma: formalized
PHASE II: METRICS TRACKING AND FEEDBACK
II.1.Distribute
Metric Surveys Weekly
II.1.a. Distribute Client Satisfaction Metric Surveys to
Client Team
II.1.b. Distribute Team Metric
Surveys to Rest of Project Team
Members
commitment reliability
quality of work
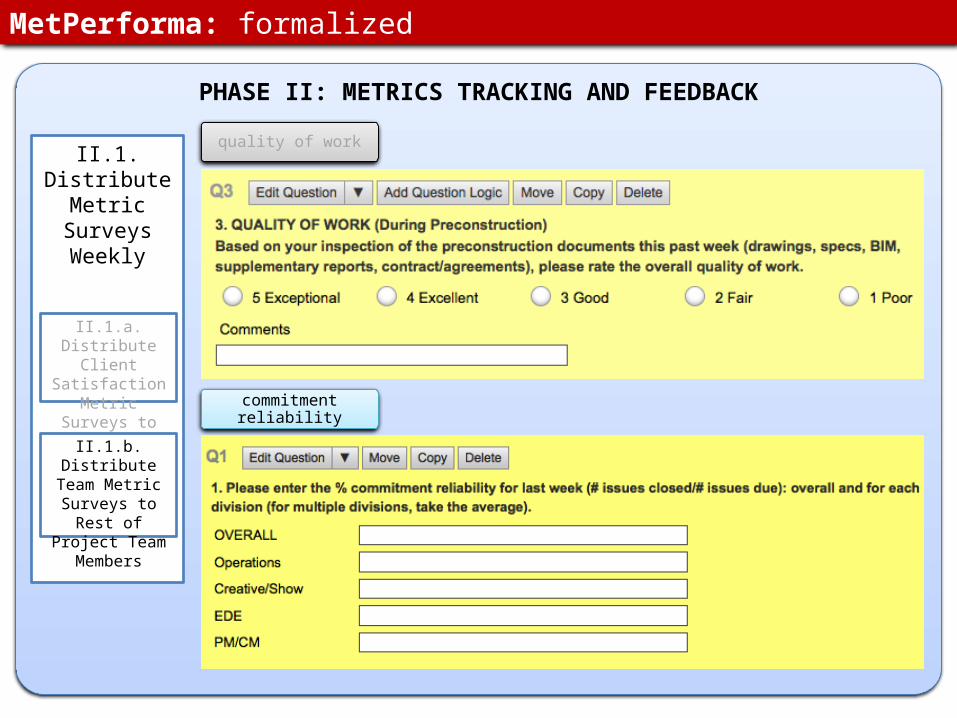
MetPerforma: formalized
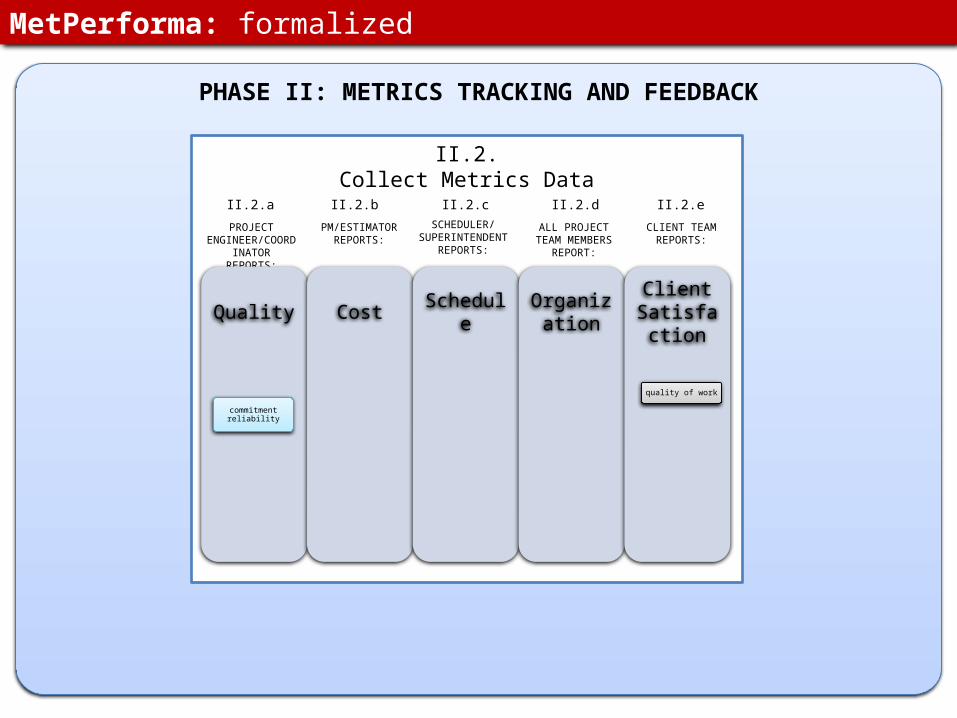
PHASE II: METRICS TRACKING AND FEEDBACK
II.2.Collect Metrics Data
PROJECT ENGINEER/COORDIN
ATOR REPORTS:
PM/ESTIMATOR REPORTS:
SCHEDULER/SUPERINTENDENT
REPORTS:
ALL PROJECT TEAM MEMBERS REPORT:
CLIENT TEAM REPORTS:
II.2.a II.2.b II.2.c II.2.d II.2.e
Quality Cost Schedule
Organization
Client Satisfacti
on
commitment reliability
quality of work
MetPerforma: formalized
PHASE II: METRICS TRACKING AND FEEDBACK
II.3.Provide Metric
Feedback
II.3.d. Discuss Metric Results at Team
Meetings
Add Moderators of Intervention:
II.3.a. Generate Metric Graphs based on
Survey Results
II.3.b. Add Metric Survey Comments
from Team Members
II.3.c. Add Metric Goals and Traffic
Lights
commitment reliability
quality of work
MetPerforma: formalized
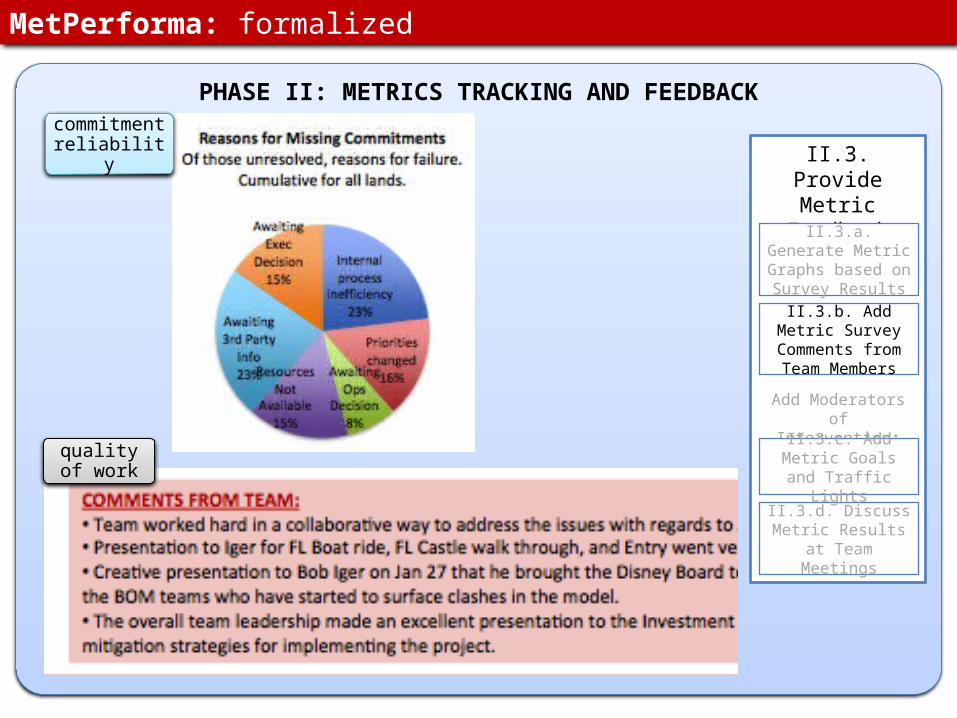
PHASE II: METRICS TRACKING AND FEEDBACK
II.3.Provide Metric
Feedback
II.3.a. Generate Metric Graphs based on
Survey Results
II.3.b. Add Metric Survey Comments
from Team Members
II.3.d. Discuss Metric Results at Team
Meetings
Add Moderators of Intervention:
II.3.c. Add Metric Goals and Traffic
Lights
commitment reliability
quality of work
MetPerforma: formalized
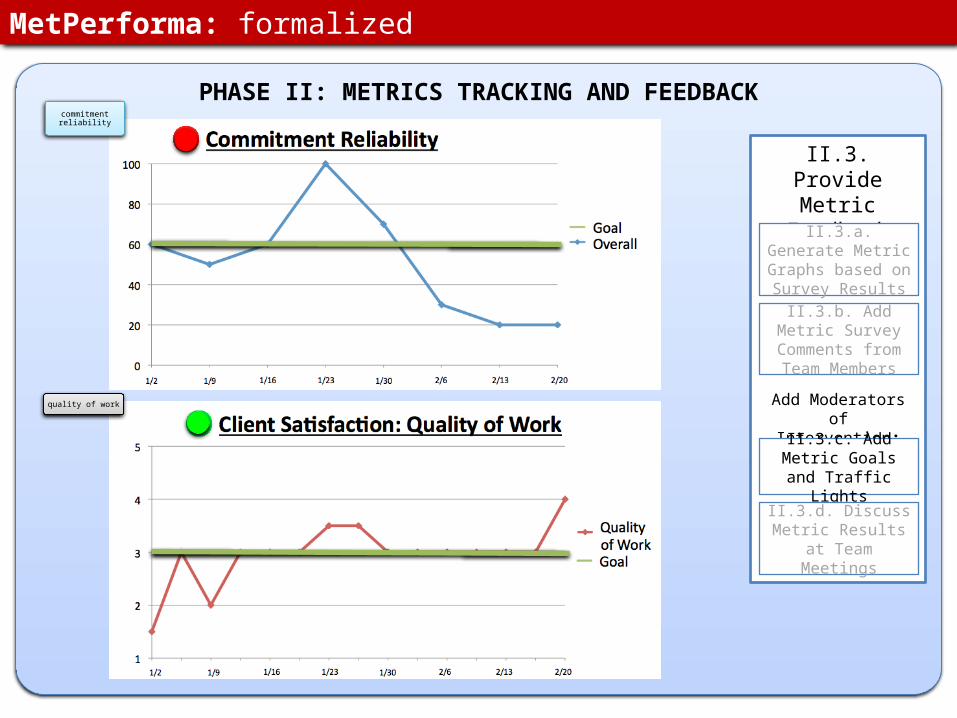
PHASE II: METRICS TRACKING AND FEEDBACK
II.3.Provide Metric
Feedback
Add Moderators of Intervention:
II.3.c. Add Metric Goals and Traffic
Lights
II.3.d. Discuss Metric Results at Team
Meetings
II.3.b. Add Metric Survey Comments
from Team Members
II.3.a. Generate Metric Graphs based on
Survey Results
commitment reliability
quality of work
MetPerforma: formalized
PHASE II: METRICS TRACKING AND FEEDBACK
II.3.Provide Metric
Feedback
II.3.d. Discuss Metric Results at Team
Meetings
Add Moderators of Intervention:
II.3.b. Add Metric Survey Comments
from Team Members
II.3.c. Add Metric Goals and Traffic
Lights
II.3.a. Generate Metric Graphs based on
Survey Results
MetPerforma: formalized
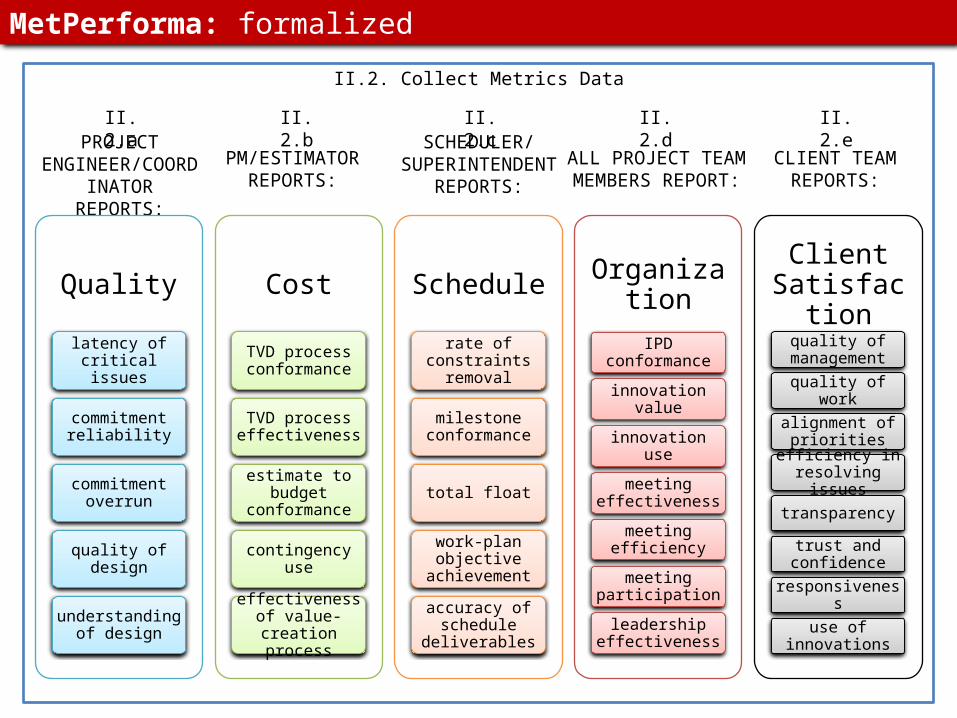
II.2. Collect Metrics Data
PROJECT ENGINEER/COORDIN
ATOR REPORTS:
PM/ESTIMATOR REPORTS:
SCHEDULER/SUPERINTENDENT
REPORTS:
ALL PROJECT TEAM MEMBERS REPORT:
CLIENT TEAM REPORTS:
II.2.a II.2.b II.2.c II.2.d II.2.e
Quality
commitment reliability
latency of critical issues
commitment overrun
quality of design
understanding of design
Cost
TVD process conformance
TVD process effectiveness
estimate to budget conformance
contingency use
effectiveness of value-creation
process
Schedule
rate of constraints removal
milestone conformance
total float
work-plan objective
achievement
accuracy of schedule
deliverables
Organization
IPD conformance
innovation value
innovation use
meeting effectiveness
meeting efficiency
meeting participation
leadership effectiveness
Client Satisfaction
quality of work
quality of management
alignment of priorities
efficiency in resolving issues
transparency
trust and confidence
responsiveness
use of innovations
MetPerforma: formalized
PHASE III: ANALYSIS
III.2. Linear Regression Analysis to Find Predictors
of Client Satisfaction
III.3. Dynamic Regression Analysis to Find Time-
Lagged Predictors
III.1. Cursory Data Analysis
III.4. Canonical Correlation Analysis to Find Aggregate
Predictors
PHASE II: METRICS TRACKING AND FEEDBACK
II.2. Collect Metrics Data II.3. Provide Metric Feedback Dashboard to
Team
II.3.a. Generate Metric Graphs
based on Survey Results
II.3.b. Add Metric Survey Comments
from Team Members
II.3.c. Add Metric Goals and Traffic
Lights
II.3.d. Discuss Metric Results at Team Meetings
Add Moderators of Intervention:
II.2.a II.2.b II.2.c II.2.d II.2.e
PROJECT ENGINEER/COORDINATOR REPORTS:
PM/ESTIMATOR REPORTS:
SCHEDULER/SUPERINTENDENT
REPORTS:
ALL PROJECT TEAM MEMBERS
REPORT:
CLIENT TEAM REPORTS:
Quality
commitment reliability
commitment overrun
latency of critical issues
quality of design
understanding of design
Cost
TVD process conformanc
e
TVD process effectivenes
s
contingency use
effectiveness of value-creation process
Schedule
milestone conformanc
e
rate of constraints
removal
total float
work-plan objective
achievement
accuracy of schedule
deliverables
Organizatio
nIPD
conformance
innovation value
innovation use
meeting effectiveness
meeting efficiency
meeting participation
leadership effectiveness
Client Satisfaction
quality of management
quality of work
alignment of priorities
efficiency in resolving issues
transparency
trust and confidence
responsiveness
use of innovationsII.3.e. Interpret and
Communicate Metric Trends
PHASE I: DEVELOPMENT OF
METRICS
I.1. Identify Candidate Metrics from Literature
I.2. Identify Candidate Metrics from Project
Contract
I.3. Identify Existing Metrics to Track with
MetPerforma
I.4. Refine Metrics through Stakeholder
Review
II.1. Distribute Metric Surveys Weekly
II.1.a. Distribute Client Satisfaction Metric Surveys to
Client Team
II.1.b. Distribute Metric Surveys to
Rest of Project Team Members
MetPerforma: formalized
PHASE III: ANALYSIS
III.2. Linear Regression Analysis to Find Predictors of
Client Satisfaction
III.3. Dynamic Regression Analysis to Find Time-Lagged
Predictors
III.1. Cursory Data Analysis
III.4. Canonical Correlation Analysis to Find Aggregate
Predictors
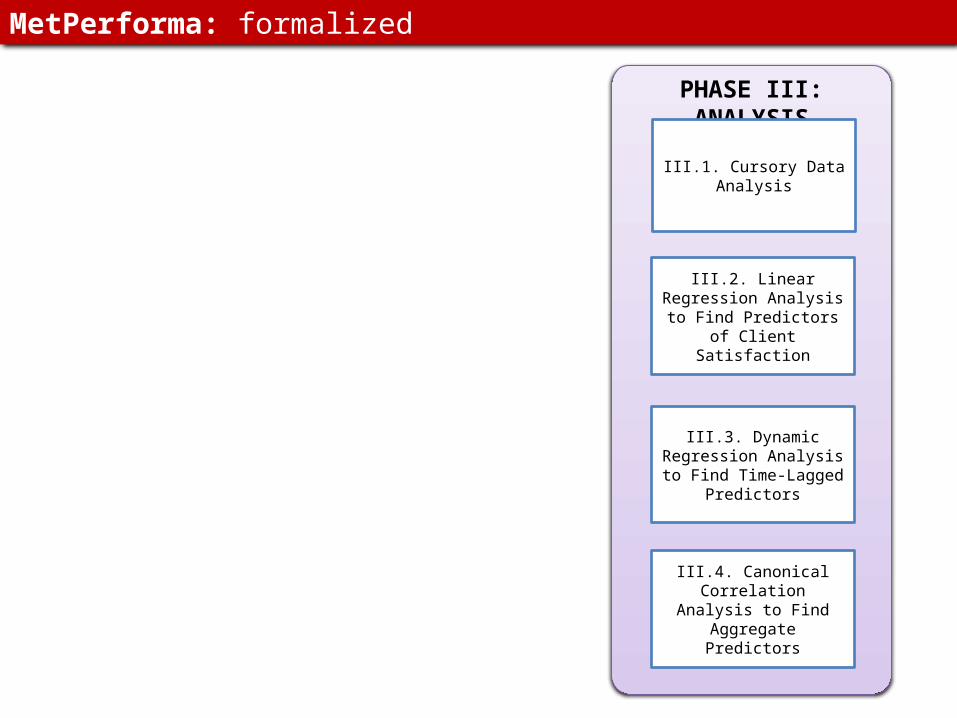
MetPerforma: formalized
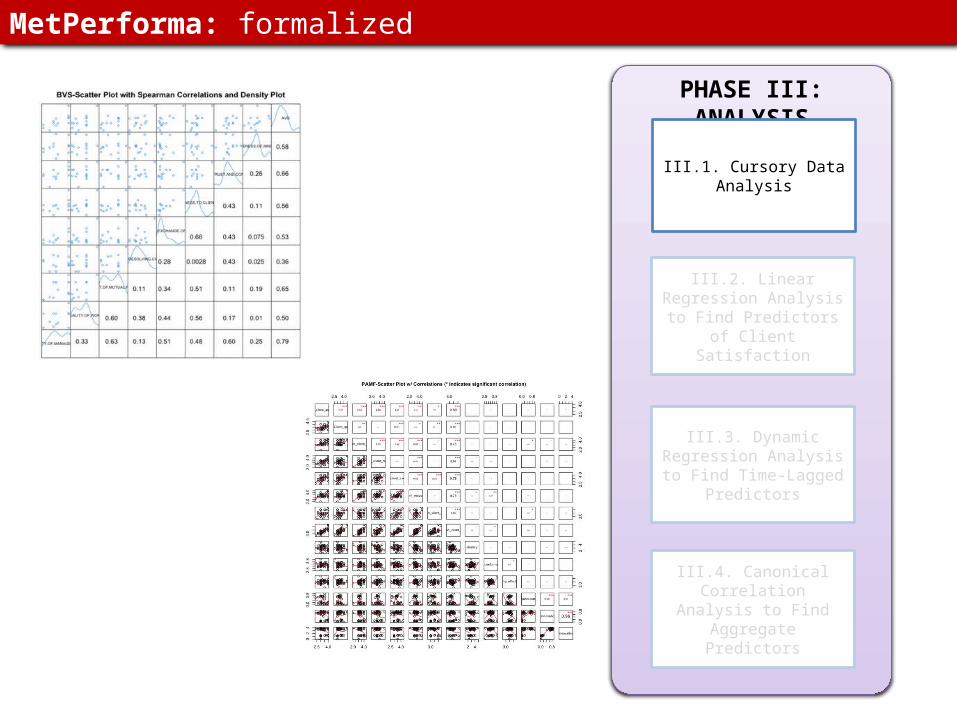
PHASE III: ANALYSIS
III.1. Cursory Data Analysis
MetPerforma: formalized
III.2. Linear Regression Analysis to Find Predictors of
Client Satisfaction
III.3. Dynamic Regression Analysis to Find Time-Lagged
Predictors
III.4. Canonical Correlation Analysis to Find Aggregate
Predictors
PHASE III: ANALYSIS
III.2. Linear Regression Analysis to Find Predictors of
Client Satisfaction
III.3. Dynamic Regression Analysis to Find Time-Lagged
Predictors
III.1. Cursory Data Analysis
III.4. Canonical Correlation Analysis to Find Aggregate
Predictors
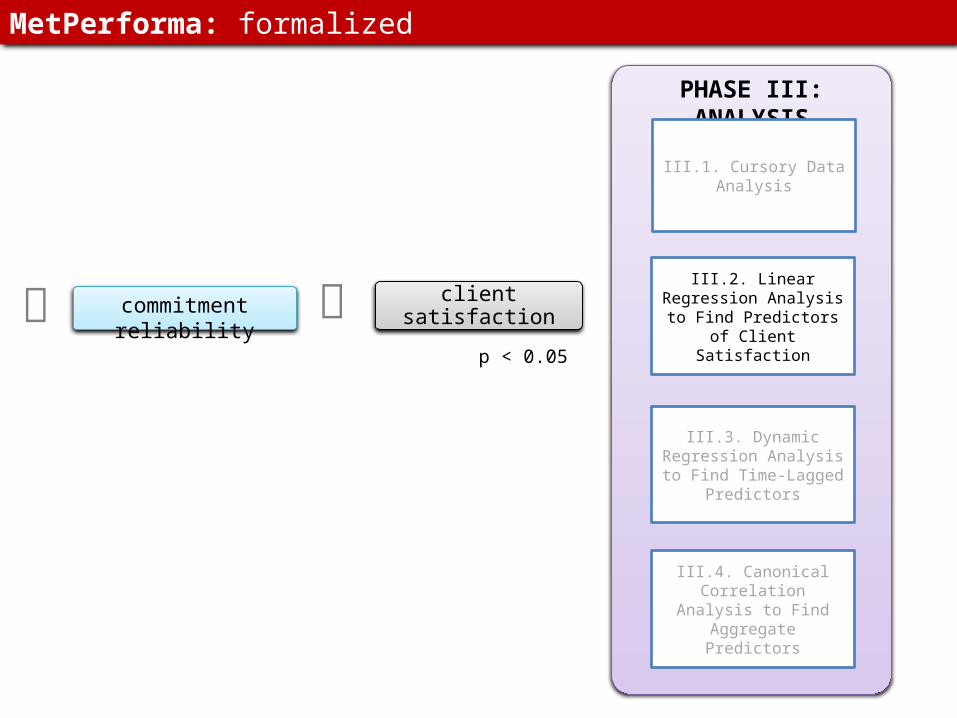
client satisfactioncommitment reliabilityp < 0.05
MetPerforma: formalized
PHASE III: ANALYSIS
III.2. Linear Regression Analysis to Find Predictors of
Client Satisfaction
III.1. Cursory Data Analysis
III.4. Canonical Correlation Analysis to Find Aggregate
Predictors
III.3. Dynamic Regression Analysis to Find Time-Lagged
Predictors
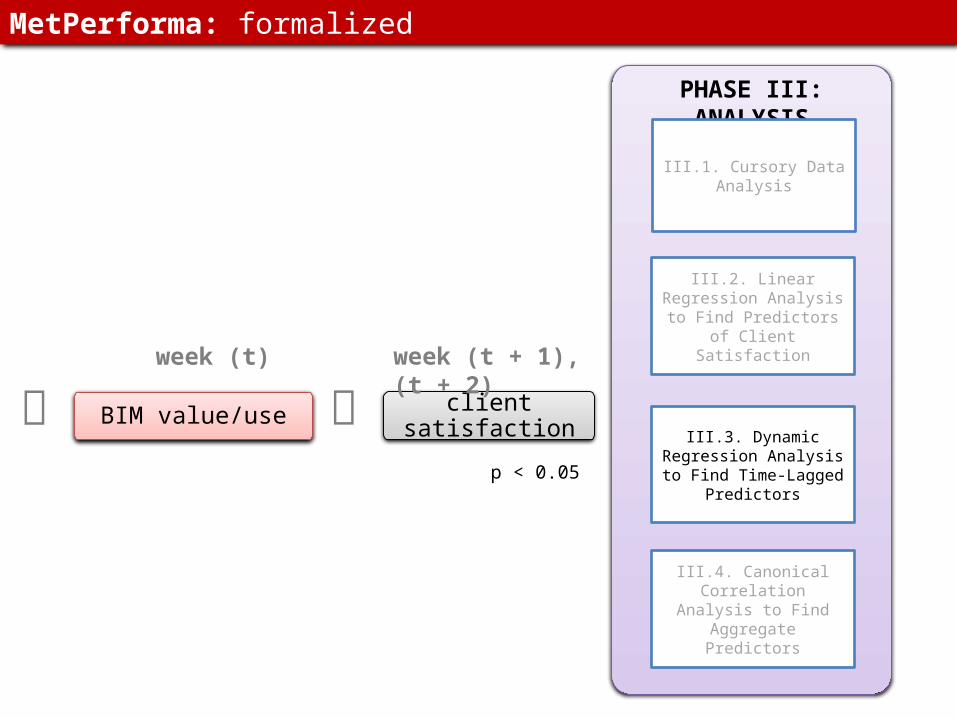
client satisfactionweek (t)
BIM value/use
week (t + 1), (t + 2)
p < 0.05
MetPerforma: formalized
PHASE III: ANALYSIS
III.2. Linear Regression Analysis to Find Predictors of
Client Satisfaction
III.1. Cursory Data Analysis
III.3. Dynamic Regression Analysis to Find Time-Lagged
Predictors
III.4. Canonical Correlation Analysis to Find Aggregate
Predictors
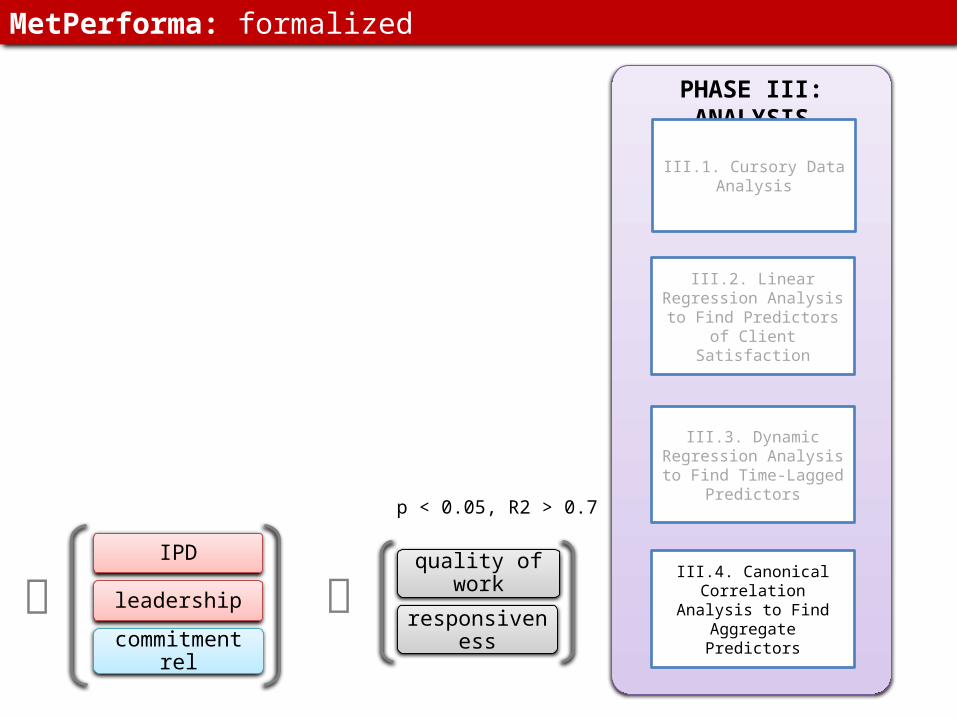
IPD
commitment rel
leadershipresponsiveness
quality of work
MetPerforma: formalized
p < 0.05, R2 > 0.7
PHASE III: ANALYSIS
III.2. Linear Regression Analysis to Find Predictors
of Client Satisfaction
III.3. Dynamic Regression Analysis to Find Time-
Lagged Predictors
III.1. Cursory Data Analysis
III.4. Canonical Correlation Analysis to Find Aggregate
Predictors
PHASE II: METRICS TRACKING AND FEEDBACK
II.2. Collect Metrics Data II.3. Provide Metric Feedback Dashboard to
Team
II.3.a. Generate Metric Graphs
based on Survey Results
II.3.b. Add Metric Survey Comments
from Team Members
II.3.c. Add Metric Goals and Traffic
Lights
II.3.d. Discuss Metric Results at Team Meetings
Add Moderators of Intervention:
II.2.a II.2.b II.2.c II.2.d II.2.e
PROJECT ENGINEER/COORDINATOR REPORTS:
PM/ESTIMATOR REPORTS:
SCHEDULER/SUPERINTENDENT
REPORTS:
ALL PROJECT TEAM MEMBERS
REPORT:
CLIENT TEAM REPORTS:
Quality
commitment reliability
commitment overrun
latency of critical issues
quality of design
understanding of design
Cost
TVD process conformanc
e
TVD process effectivenes
s
contingency use
effectiveness of value-creation process
Schedule
milestone conformanc
e
rate of constraints
removal
total float
work-plan objective
achievement
accuracy of schedule
deliverables
Organizatio
nIPD
conformance
innovation value
innovation use
meeting effectiveness
meeting efficiency
meeting participation
leadership effectiveness
Client Satisfaction
quality of management
quality of work
alignment of priorities
efficiency in resolving issues
transparency
trust and confidence
responsiveness
use of innovationsII.3.e. Interpret and
Communicate Metric Trends
II.1. Distribute Metric Surveys Weekly
II.1.a. Distribute Client Satisfaction Metric Surveys to
Client Team
II.1.b. Distribute Metric Surveys to
Rest of Project Team Members
PHASE I: DEVELOPMENT OF
METRICS
I.1. Identify Candidate Metrics from Literature
I.2. Identify Candidate Metrics from Project
Contract
I.3. Identify Existing Metrics to Track with
MetPerforma
I.4. Refine Metrics through Stakeholder
Review
MetPerforma
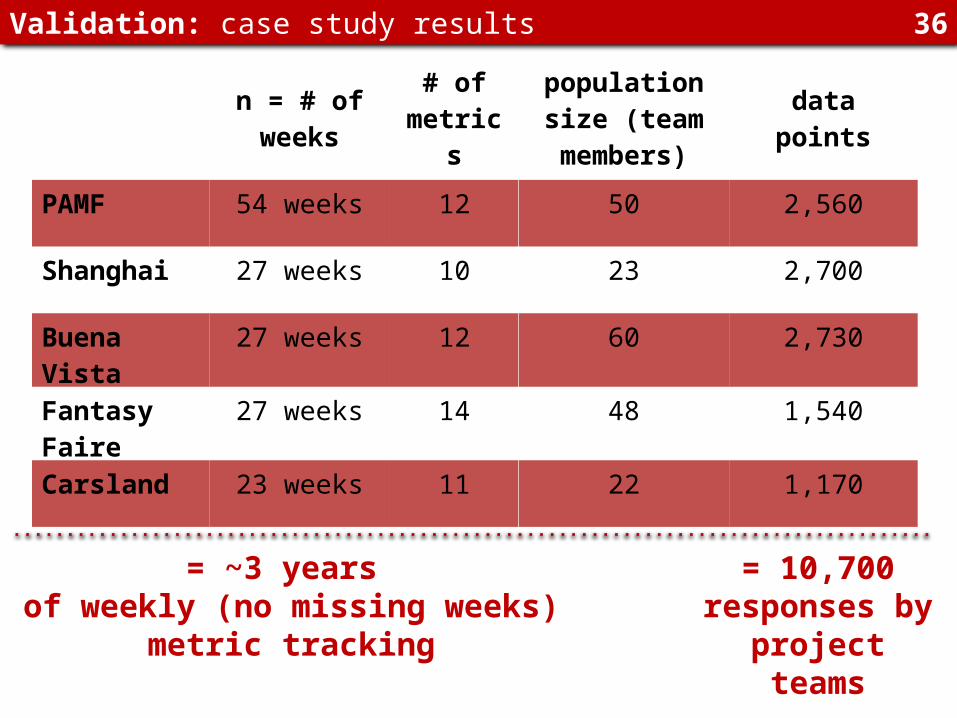
Validation: case study results 36
n = # of weeks # of metrics
population size (team members) data points
PAMF 54 weeks 12 50 2,560
Shanghai 27 weeks 10 23 2,700
Buena Vista 27 weeks 12 60 2,730
Fantasy Faire 27 weeks 14 48 1,540
Carsland 23 weeks 11 22 1,170
= ~3 years of weekly (no missing weeks) metric
tracking
= 10,700responses by project teams
8/21 9/4 9/18 10/2 10/16 10/30 11/13 11/27 12/11 12/25 1/8 1/22 2/5 2/190%
25%
50%
75%
100%
Meeting Appropriateness: average % of discussion items appropriate for this meeting
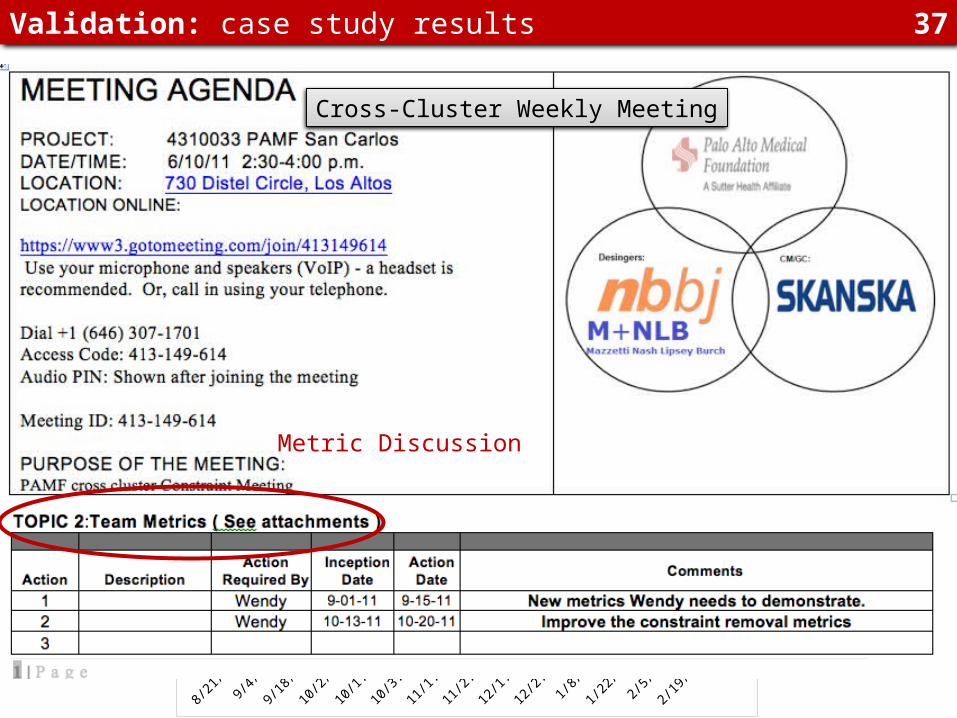
Validation: case study results 37
managers intervened as a result of MetPerforma
• project executive changed weekly team meeting agenda after seeing bad meeting ratings (Shanghai)
• project leaders initiated weekly metric discussions (all case studies)
• “I called the Core Group for several metric discussion meetings based on alarming feedback” ~Sutter PM (PAMF)
appropriateness of meeting agendas improved
Cross-Cluster Weekly Meeting
Metric Discussion
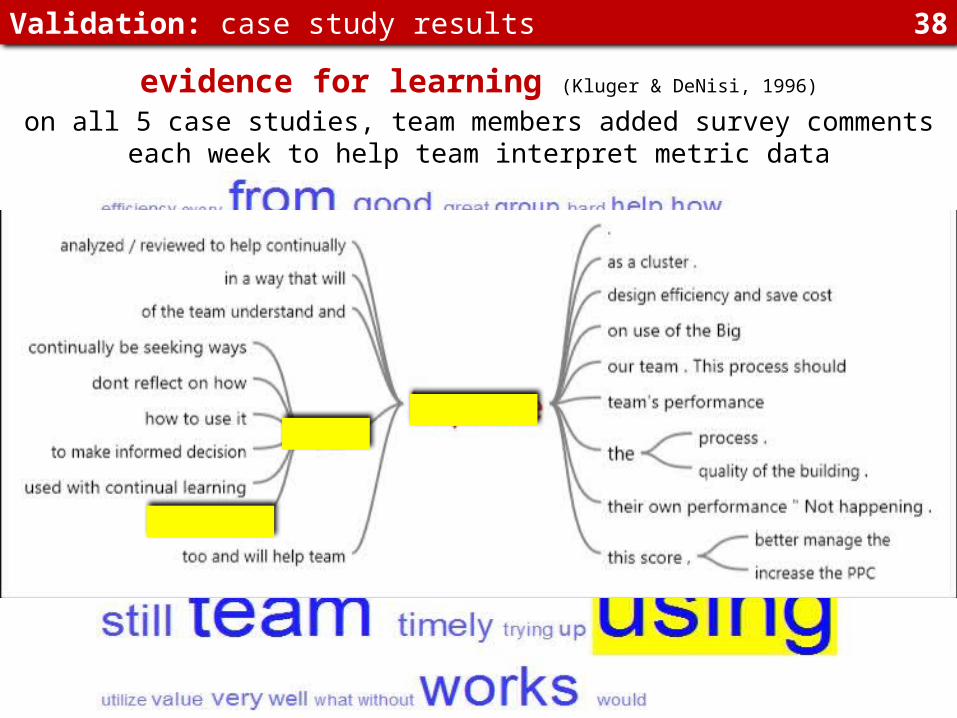
evidence for learning (Kluger & DeNisi, 1996)
on all 5 case studies, team members added survey comments each week to help team interpret metric data
Validation: case study results 38
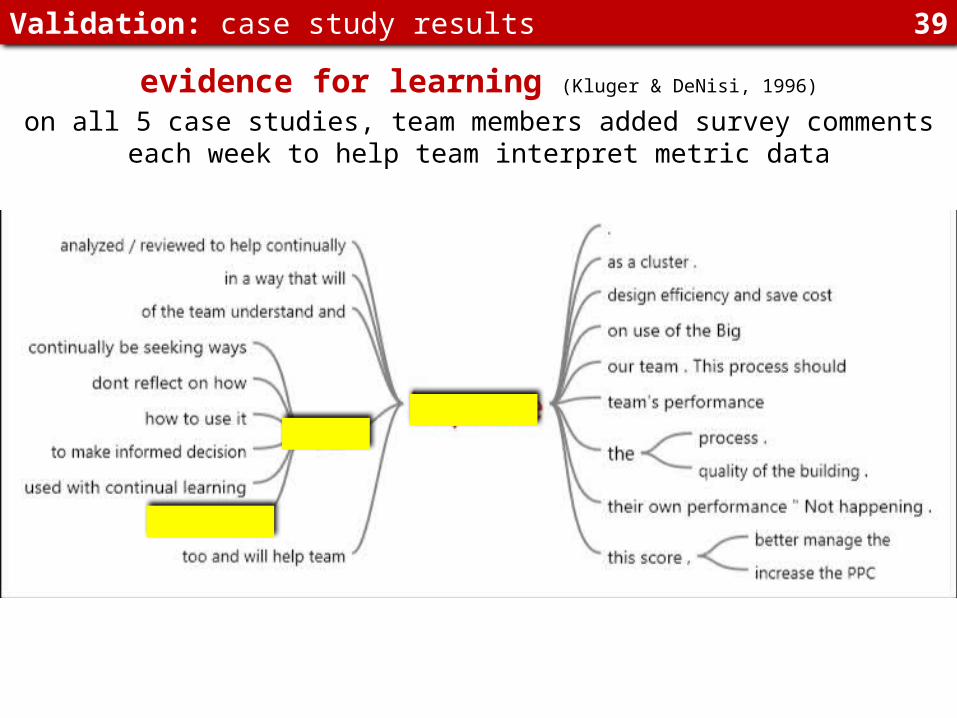
evidence for learning (Kluger & DeNisi, 1996)
on all 5 case studies, team members added survey comments each week to help team interpret metric data
Validation: case study results 39
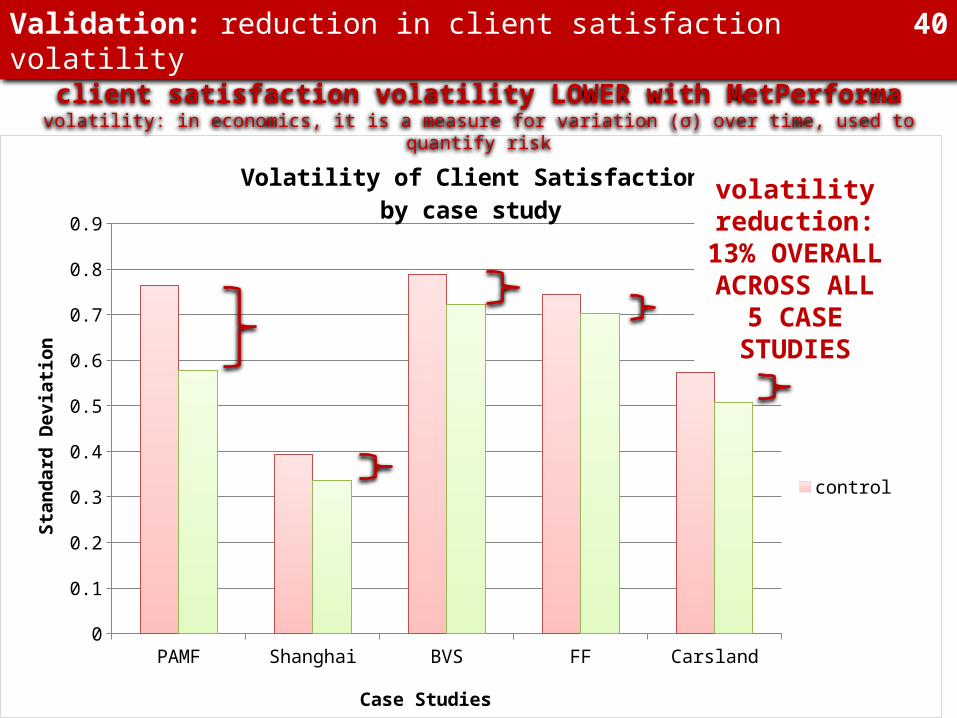
PAMF Shanghai BVS FF Carsland0
0.1
0.2
0.3
0.4
0.5
0.6
0.7
0.8
0.9
Volatility of Client Satisfactionby case study
control
experimental
Case Studies
Stan
dard
Dev
iatio
nValidation: reduction in client satisfaction volatility
client satisfaction volatility LOWER with MetPerformavolatility: in economics, it is a measure for variation (σ) over time, used to quantify risk
40
volatility reduction:
13% OVERALL ACROSS ALL 5 CASE STUDIES
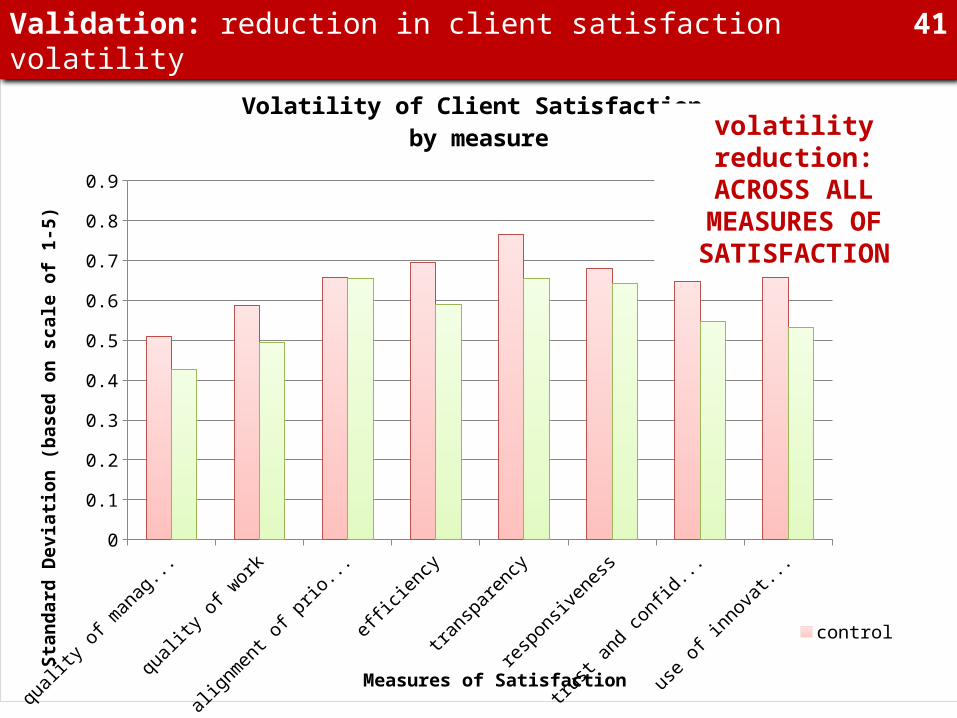
quality of m
anagement
quality of w
ork
alignment o
f prio
rities
efficiency
transp
arency
responsiv
eness
trust
and confidence
use of innovations
0
0.1
0.2
0.3
0.4
0.5
0.6
0.7
0.8
0.9
Volatility of Client Satisfaction by measure
control
experimental
Measures of Satisfaction
Stan
dard
Dev
iatio
n (b
ased
on
scal
e of
1-5
)Validation: reduction in client satisfaction volatility 41
volatility reduction:ACROSS ALL
MEASURES OF SATISFACTION
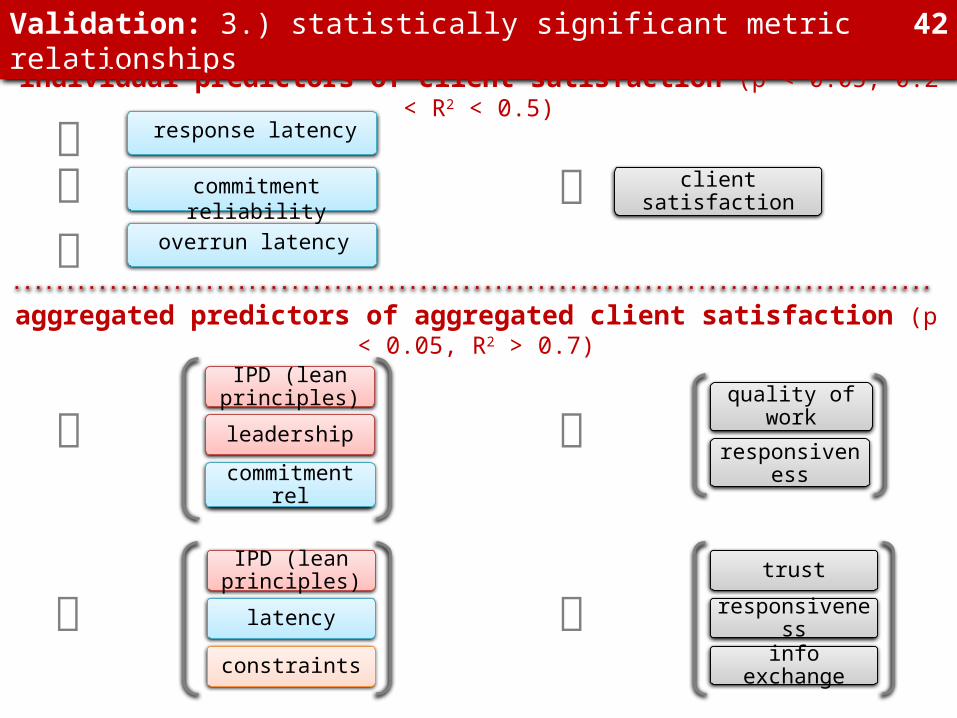
Validation: 3.) statistically significant metric relationships 42
individual predictors of client satisfaction (p < 0.05, 0.2 < R2 < 0.5)
aggregated predictors of aggregated client satisfaction (p < 0.05, R2 > 0.7)
commitment reliability
overrun latency
response latency
client satisfaction
IPD (lean principles)
commitment rel
leadership
IPD (lean
principles)
latency
constraints
responsiveness
quality of work
info exchange
trust
responsiveness
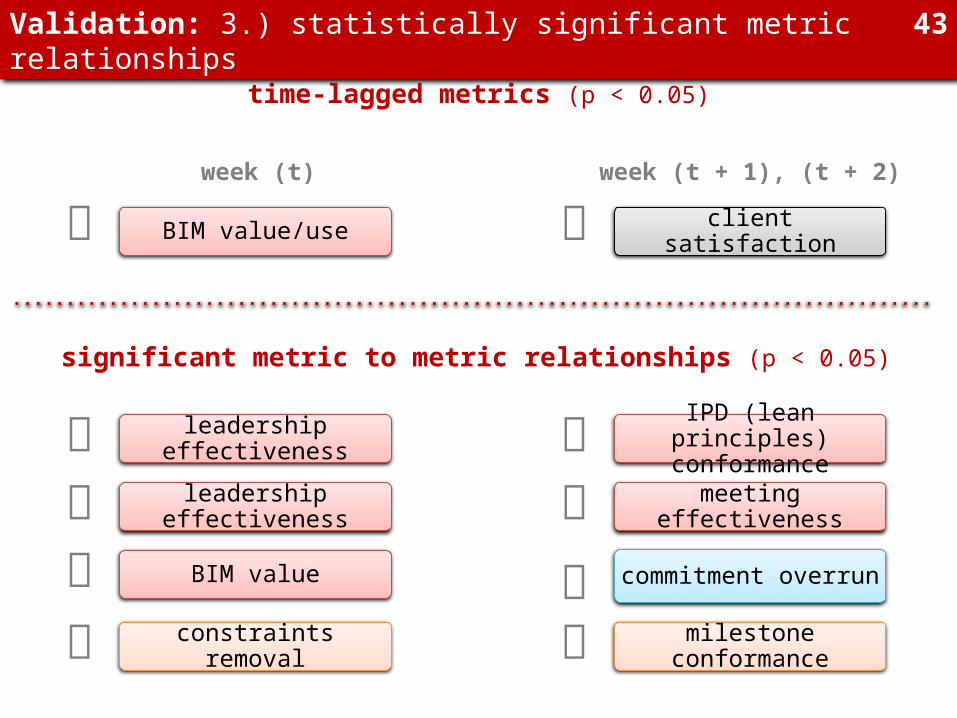
Validation: 3.) statistically significant metric relationships 43
time-lagged metrics (p < 0.05)
significant metric to metric relationships (p < 0.05)
client satisfactionweek (t)
BIM value/use
week (t + 1), (t + 2)
leadership effectiveness IPD (lean principles) conformance
leadership effectiveness meeting effectivenesscommitment overrun BIM value
constraints removal
milestone conformance
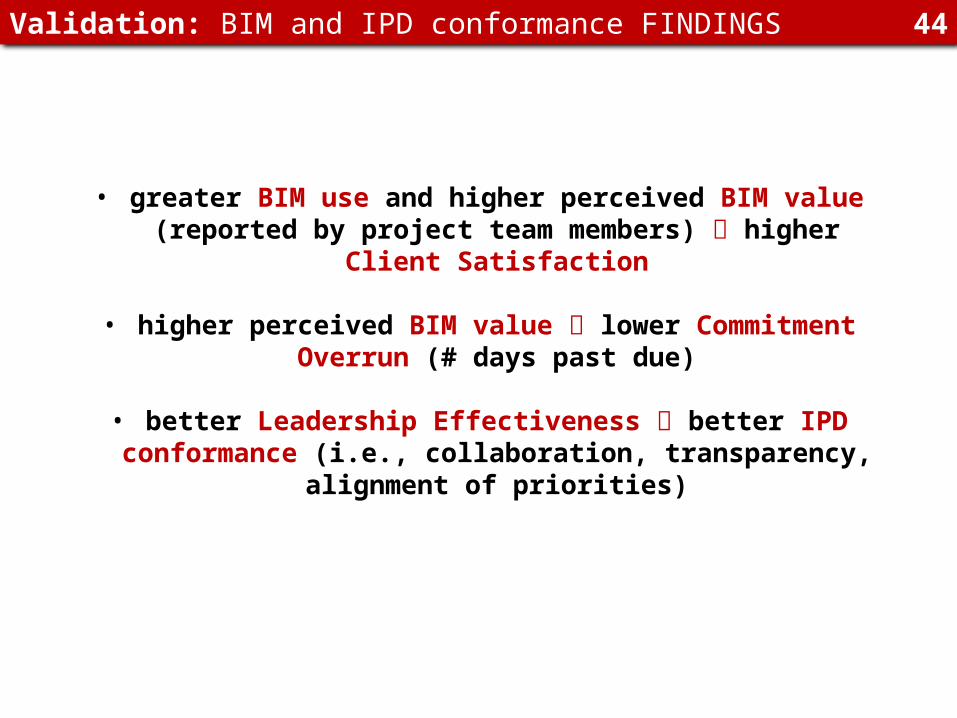
Validation: BIM and IPD conformance FINDINGS 44
• greater BIM use and higher perceived BIM value (reported by project team members) higher Client Satisfaction
• higher perceived BIM value lower Commitment Overrun (# days past due)
• better Leadership Effectiveness better IPD conformance (i.e., collaboration, transparency, alignment of priorities)
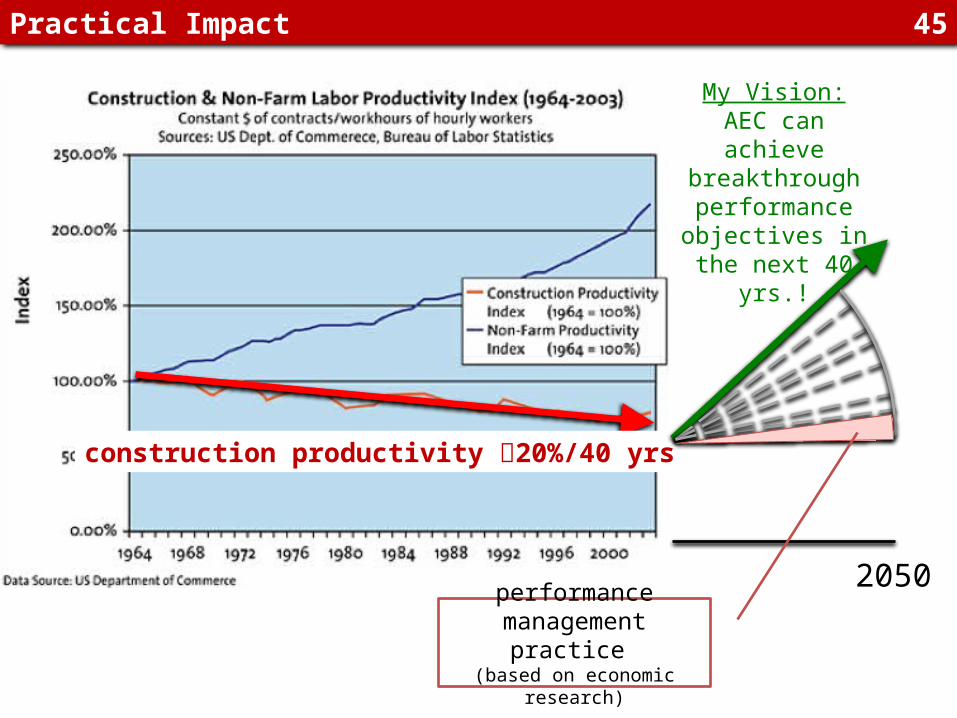
Practical Impact 45
project teams can implement MetPerforma to:
• reduce project risk/increase predictabilitygiven early detection of performance problems
• increase transparencygiven frequent, public feedback
• help achieve breakthrough performance objectivesgiven better performance management practice
construction productivity 20%/40 yrs
2050performance
management practice (based on economic research)
My Vision:AEC can achieve
breakthrough performance
objectives in the next 40 yrs.!