How Packaging Makes us Fat: Volume Estimation Heuristics...
26
1 How Packaging Makes us Fat: Volume Estimation Heuristics and Size Preferences (with Nailya Ordabayeva, Erasmus ) 16/5/2013 Pierre CHANDON L’Oréal Chaired Professor of Marketing, Innovation and Creativity. Director, INSEAD Social Science Research Center Overview of presentation How Packaging Makes us Fat Background Trends in package and portion sizes. The psychophysics of volume estimation. Perception of 1D vs. 3D Supersizing (Chandon & Ordabayeva 2009) Stronger underestimation of 3D vs. 1D supersizing Influences consumption and size choices. Predicting & Managing Downsizing Impressions (Ordabayeva & Chandon 2013) Additive change model predicts perceived downsizing. Additive change model can be used for “smart downsizing”. Asymmetries in judging size increases vs. decreases (ongoing work) Estimations, production of size increases, decreases. Effects of valence, reference level, expertise. Conclusions
Transcript of How Packaging Makes us Fat: Volume Estimation Heuristics...

1
How Packaging Makes us Fat: Volume Estimation Heuristics and Size Preferences
(with Nailya Ordabayeva, Erasmus )16/5/2013
Pierre CHANDON
L’Oréal Chaired Professor of Marketing, Innovation and Creativity.
Director, INSEAD Social Science Research Center
Overview of presentation
How Packaging Makes us Fat
Background Trends in package and portion sizes.
The psychophysics of volume estimation.
Perception of 1D vs. 3D Supersizing (Chandon & Ordabayeva 2009)
Stronger underestimation of 3D vs. 1D supersizing
Influences consumption and size choices.
Predicting & Managing Downsizing Impressions (Ordabayeva & Chandon 2013)
Additive change model predicts perceived downsizing.
Additive change model can be used for “smart downsizing”.
Asymmetries in judging size increases vs. decreases (ongoing work)
Estimations, production of size increases, decreases.
Effects of valence, reference level, expertise.
Conclusions

2
Background
Package and portion sizes aren’t what they used to be
Near Lake Tahoe, 2004?? oz
18996.5 oz
19006.5 oz
19156.5 oz
19576.5 oz
19676.5 oz
19076.5 oz
19256.5 oz
Background
No or Ambiguous Size Labels“Extra Large”
“Small” (Burger King)
“Medium” (McDonald’s)
Size branding impacts consumption
114
93
86Downsell Normal Grand King
Classic Petit Normal Grand
Upsell Mini Petit Normal
(Chandon et al. 2013)
Calories ordered

3
100 cl, 34 oz430 cal
80’s
120 cl, 40 oz516 cal
90’s
190 cl, 62 oz817 cal
00’s
19 cl, 6.5 oz81 cal
50 cl, 17 oz215 cal
25 cl 8.5 oz108 cal
40 cl, 14 oz172 cal
Background
Supersized Packages
France
94 cl, 32 oz62 cl, 21 oz35 cl, 12 oz
USA
Background
Product Range Effects
53
48
45
(Sharpe et al. 2008, Chandon et al. 2013)
“Vicious” range(without the smallest)
Extended range
« Virtuous » range(without the largestcup)
0 cl
6%94%
67%33%
Calories ordered

4
Background
Strong Consumer Reactance to DownsizingMarketers downsize to hide cost increases and reduce
packaging costs
From 18 to 16.3 oz.
Some consumers hate downsizing
70% oppose Bloomberg’s
proposed ban on drinks > 16 oz.
Consumer complain about downsizing from 16 to 12 oz.
Literature Review
Psychophysics of Volume Estimation
Size effects: The Empirical law of sensation
Size and volume estimations follow an inelastic power function of actual size People under-estimate actual size changes (Plateau 1872, Stevens 1986).
Shape effects
Lower elasticity for 3D objects (Teghtsoonian 1965; Frayman & Dawson 1981).
Elongated objects appear bigger (Raghubir & Krishna 1999, Wansink & van Ittersum 2003).
0
500
1000
1500
2000
2500
3000
0 500 1000 1500 2000 2500 3000
Est
imate
d S
ize
Actual Size
Squares (b=.8)
Lines (b=.9)
Cubes (b=.6)
ESTSIZE = a*(ACTSIZE)^b, where b<1
Unresolved issues
1. Is it the shape of the object or the shape of the volume change that matters (how many dimensions change)? (Chandon & Ordabayeva 2009)
2. Can we model and manage size impressions and acceptance of smaller portions? (Ordabayeva & Chandon 2013)
3. Are we as sensitive to size increases as size decreases? How do we estimate sizes? (ongoing work)

5
196
326 (actual)
154
124
0
100
200
300
400
0 100 200 300 400
Perc
eiv
ed
volu
me
(cl
)
Actual volume (cl)
Chandon & Ordabayeva 2009
Underestimation of Increasing Sizes, esp. in 3D
People underestimate volume change, especially when all 3D changes.
100% increase ≈ 60-70% perceived increase.
Similar results when asking about calories, weight, or volume.
3D: 160 (-51%)
1D: 241 (-26%)
S70 cl
M?
L?
XL?
1D: h =: +67%
3D: h, w, l = +19%
Chandon & Ordabayeva 2009
Effects on Dosage (Magnitude Production Task)
Task: Triple existing dose.
Results:
1D: Poured x 3.04
(1% overdose)
3D: Poured x 3.63
(+21% overdose)
Because volume changes appear smaller in 3D, people pour more into 3D conical glasses.
250 ml
1D:Cylindrical containers
3D:Conicalcontainers
100 ml20 ml

6
Chandon & Ordabayeva 2009
People are More Likely to Supersize in 1D and to Downsize in 3D
Control (55% choose red)
22 Cl, €.80
22 Cl, €.80
1D Supersizing(100% supersize)
33 Cl, €.80
22 Cl, €.80
3D Supersizing (68% supersize)
33 Cl, €.80
22 Cl, €.80
50 Cl, €.80
33 Cl, €.60
50 Cl, €.80
33 Cl, €.60
3D Downsizing(69% downsize)1D Downsizing
(48% downsize)
Original menu
50 Cl, €.80
50 Cl, €.60
Ordabayeva & Chandon 2013
Modeling Perceived Size
Two sources of error1. Biased estimation of changes in
individual dimensions (height, length, width)
People have biased estimates of each dimension but correctly multiply them (e.g., horizontal-vertical “T” illusion).
2. Biased integration rule
People don’t correctly multiply the changes in all three dimensions
1. Compounds changes in 2 (vs. 3) dimensions (surface area model)
2. Look at average change in each dimension (contour model)
3. Add instead of multiplying the % change in each dimension (addchange model).
Tests (and potential remedies)
Test whether people accurately estimate height, length, and width.
Test whether improved attention to dimensions helps.
Test effects of shape of size change (3D, vs. 2D, vs. 1D vs. elongation)
7
2.0
.50
1.74
.57
1.78
.56
1.59
.63
1.26
.79
0.0
0.5
1.0
1.5
2.0
0.0 0.5 1.0 1.5 2.0
Pre
dict
ed p
erce
ived
vol
ume
Actual volume
Multiplicative model
Ordabayeva & Chandon 2013
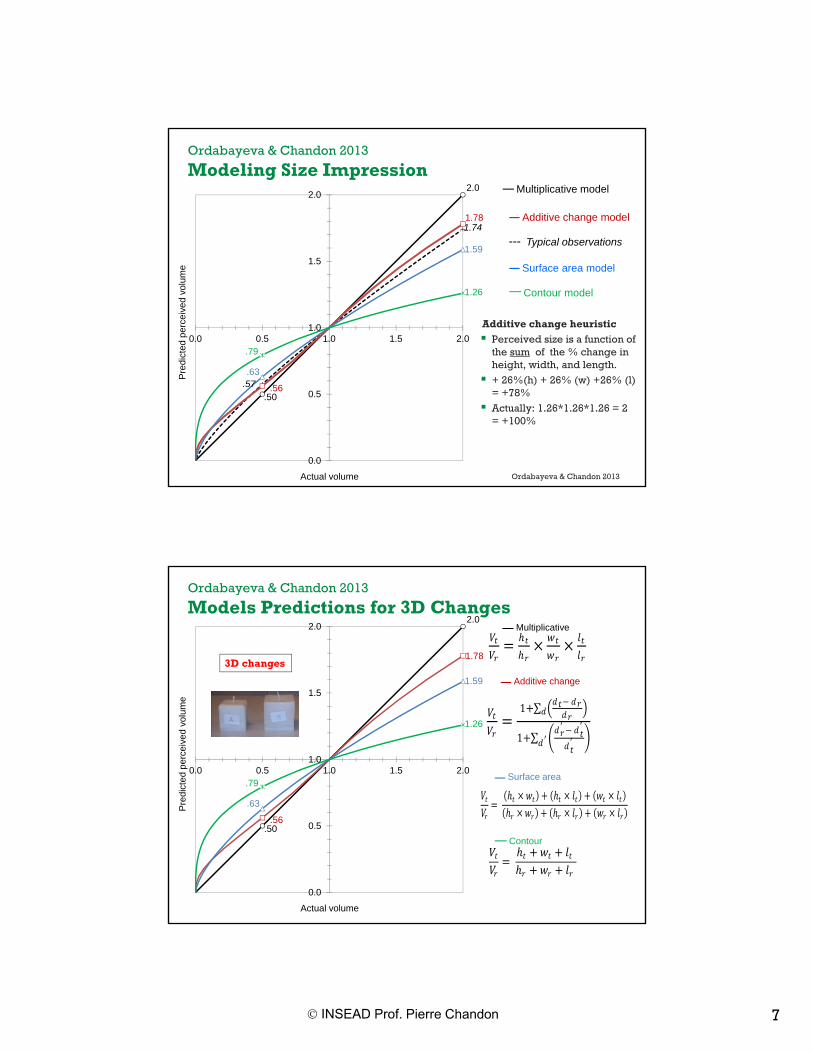
Modeling Size Impression
Additive change heuristic
Perceived size is a function of the sum of the % change in height, width, and length.
+ 26%(h) + 26% (w) +26% (l) = +78%
Actually: 1.26*1.26*1.26 = 2 = +100%
Ordabayeva & Chandon 2013
Contour model
Surface area model
Additive change model
Typical observations
Ordabayeva & Chandon 2013
Models Predictions for 3D Changes
3D changes
2.0
.50
1.78
.56
1.59
.63
1.26
.79
0.0
0.5
1.0
1.5
2.0
0.0 0.5 1.0 1.5 2.0
Pre
dict
ed p
erce
ived
vol
ume
Actual volume
Contour
1 ∑
1 ∑′ ′
′′
Multiplicative
Additive change
Surface area
8
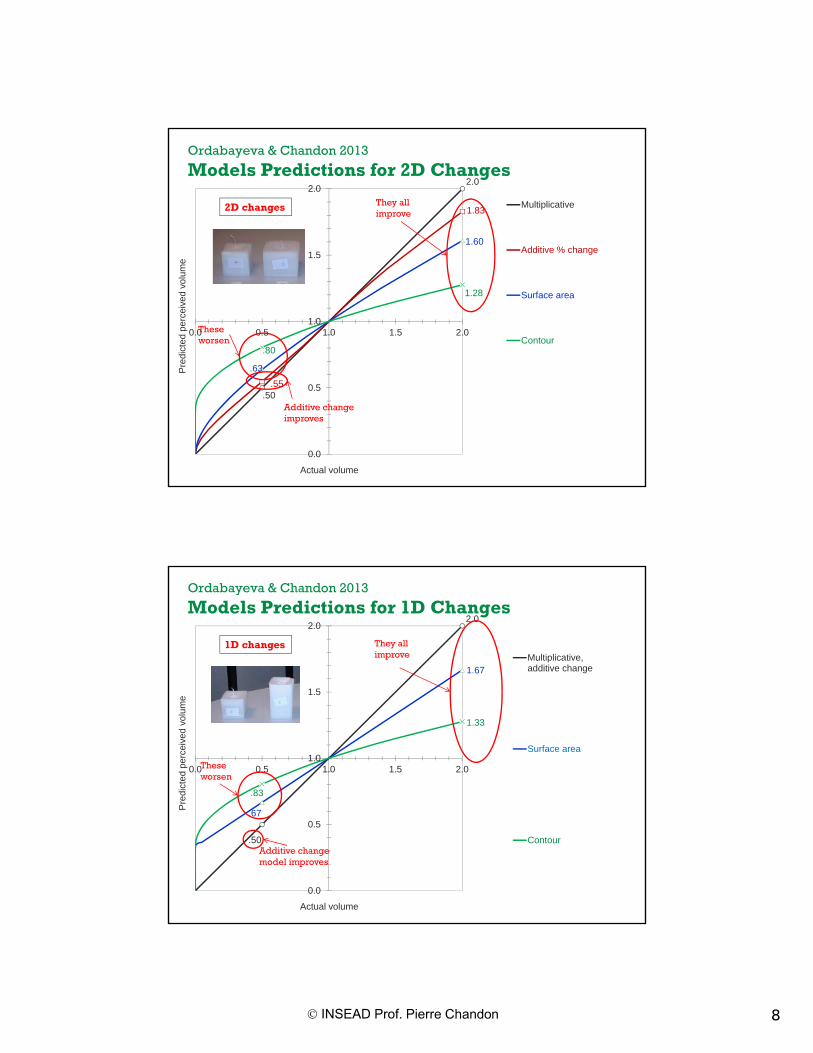
Ordabayeva & Chandon 2013
Models Predictions for 2D Changes2.0
.50
1.83
.55
1.60
.63
1.28
.80
0.0
0.5
1.0
1.5
2.0
0.0 0.5 1.0 1.5 2.0
Pre
dict
ed p
erce
ived
vol
ume
Actual volume
Multiplicative
Additive % change
Surface area
Contour
They all improve
These worsen
Additive change improves
2D changes
Ordabayeva & Chandon 2013
Models Predictions for 1D Changes2.0
.50
1.67
.67
1.33
.83
0.0
0.5
1.0
1.5
2.0
0.0 0.5 1.0 1.5 2.0
Pre
dict
ed p
erce
ived
vol
ume
Actual volume
Multiplicative,additive change
Surface area
Contour
They all improve
These worsen
Additive change model improves
1D changes

9
.85
1.00
1.051.16
0.5
1.0
1.5
2.0
0.5 1.0
Pre
dict
ed p
erce
ived
vol
ume
Actual volume
Multiplicative
Additive % change
Surface area
Contour
Ordabayeva & Chandon 2013
Models Predictions for Elongated Downsizing
Elongated downsizing where increase in height = sum of decrease in length and width.
100x100x100 => 150x80x80.
Additive change model predicts no detection of downsizing.
Other models predict increasing size perceptions!
1D (height only) 2D (width and length) 3D
Candles
Candies
Study 1: 1D vs. 2D vs. 3D DownsizingComparison of Volume Estimation Models
222 participants
Estimation mode: decomposition (first estimate each dimension, then total size) vs. holistic (estimate total size)
?(190g)
885g?
(317g)?
(530g)?
(190g)885g
?(317g)
?(530g)
?(190g)
885g?
(317g)?
(530g)
?(30g)
140g?
(50g)?
(84g)?
(30g)140g
?(50g)
?(84g)
?(30g)
140g?
(50g)?
(84g)

10
Study 1: 1D vs. 2D vs. 3D Downsizing
Accurate Estimations of Height, Width, Length
Estimates of single dimensions are accurate.
If anything, change in height, width, and length are overestimated.
These errors cannot explain the underestimation of size change.
Condition Total size Actual dimensions Estimated dimensions
Height Width Length Height Width Length
1D
1.00 1.00 1.00 1.00 1.00 1.00 1.00 .60 .60 1.00 1.00 .63 .94 .94 .36 .36 1.00 1.00 .39 .90 .87 .21 .21 1.00 1.00 .24 .87 .83
2D
1.00 1.00 1.00 1.00 1.00 1.00 1.00 .60 1.00 .77 .77 .94 .72 .73 .36 1.00 .60 .60 .92 .54 .57 .21 1.00 .46 .46 .91 .37 .46
3D
1.00 1.00 1.00 1.00 1.00 1.00 1.00 .60 .84 .84 .84 .81 .76 .78 .36 .71 .71 .71 .64 .59 .61 .21 .60 .60 .60 .51 .45 .48
Study 1: 1D vs. 2D vs. 3D DownsizingAdditive Change Model Fits Data Best
No difference between decomposition and holistic conditions

11
Study 2: 1D vs. Elongated Downsizing
“Smart” Package Downsizing Using the Predictions of the AddChange Model
885g?
(814g)885g
?(743g)
885g?
(673g)
16% downsizing 8% downsizing
1D downsizing
“Smart” downsizing
(dimensions calculated with the AddChange model
to predict no perceived change)
24% downsizing
• Half of 195 participants could weigh products by hand before estimation.• Two replications: Candles and soap. Visual aptitude and gender.
Study 2: 1D vs. Elongated Downsizing
Elongation Hides Volume Downsizing
.79
.87
.91
.98.99 1.00
.80
.88
.94
.91
.96
.68
.76
.84
.92
1.00
.68 .76 .84 .92 1.00
Est
imat
ed s
ize
(mul
tiple
of t
he r
efer
ence
)
Actual size (multiple of the reference)
1D downsizing;visual estimation only
Elongated downsizing; visualestimation only
1D downsizing;visual & haptic estimation
Elongated downsizing; visual& haptic estimation

12
Study 2: 1D vs. Elongated Downsizing
Elongation Hides Volume Downsizing
0.7
0.8
0.9
1
1.1
0.7 0.8 0.9 1 1.1
WT
P (
mul
tiple
of t
he o
rigin
al p
rice)
Actual size (multiple of the original size)
elongated visual only
visual + weight
visual + weight1D visual only
Same effects for WTP
Study 3: Using Perceptual Biases to Fight Overeating
Smart Downsizing with Real Products
A company wants to reduce quantity from 8 to 5 lbs. Test with professional packages and loyal adult consumers.
Comparison with competition
Choice vs. comp. 57% 46% 39%
Elongation (h) Elongation (w) Shorter (1D) Original (8lbs)

13
Excel Tool
Using AddChange Model to Choose Optimal Downsizing Dimensions
Excel Tool
Using AddChange Model to Choose Optimal Downsizing Dimensions
3D representation of the original and final objects

14
Current Puzzle:
Perception of Up- vs. Down-sizing
Are estimations of increasing sizes as elastic as the estimations of decreasing sizes?
190g 190g 190g?
(885g)?
(317g)?
(530g)?
(885g)?
(317g)?
(530g)?
(885g)?
(317g)?
(530g)
?(190g)
885g?
(317g)?
(530g)?
(190g)885g
?(317g)
?(530g)
?(190g)
885g?
(317g)?
(530g)
2D (width and length) 3D (height, width, length)1D (height only)
Downsizing
condition
Supersizing
condition
Current Puzzle:
Perception of Up- vs. Down-sizing
Replication with candies
30g?
(140g)?
(50g)?
(84g)
?(30g)
140g?
(50g)?
(84g)
2D (width and length) 3D (height, width, length)1D (height only)
Downsizing
condition
Supersizing
condition
?(30g)
140g?
(50g)?
(84g)?
(30g)140g
?(50g)
?(84g)
30g?
(140g)?
(50g)?
(84g)30g
?(140g)
?(50g)
?(84g)

15
Study 1
Size Estimates (all conditions)
3.2
1.2
0
1
2
3
4
5
0 1 2 3 4 5
Es
tim
ate
d s
ize
(m
ult
iple
of
the
sm
all
es
t s
ize
)
Actual size (multiple of the smallest size)
Downsizing: EST = 1.27×(ACT^.87)
Supersizing: EST = 1.01×(ACT^.74)
Lower elasticity and accuracy for estimation of increasing sizes than for estimations of decreasing sizes
Asymmetry parameter bdown/bup = 1.18
The loss aversion parameter in CPT is typically around 2.
Study 1
Size Estimates (1D vs. 2D vs. 3D)
0
1
2
3
4
5
0 1 2 3 4 5
Es
tim
ate
d s
ize
(m
ult
iple
of
the
sm
all
es
t s
ize
)
Actual size (multiple of the smallest size)
1D: Downsizing EST = .98×(ACT^1.04)
1D: Supersizing EST = 1.01×(ACT^.85)
2D: Downsizing EST = 1.22×(ACT^.91)
2D: Supersizing EST = 1.02×(ACT^.76)
3D: Downsizing EST = 1.62×(ACT^.71)
3D: Supersizing EST = 1.0 ×(ACT^.63)
Asymmetry (bdown/bup)1D: 1.222D: 1.203D: 1.13

16
Study 1
No Effect of Drawing Attention to Individual Dimensions (Decomposition condition)
0
1
2
3
4
5
0 1 2 3 4 5
Es
tim
ate
d s
ize
(m
ult
iple
of
the
sm
all
es
t s
ize
)
Actual size (multiple of the smallest size)
Hol: Downsizing EST = 1.24×(ACT^.88)
Hol: Supersizing EST = 1.01×(ACT^.74)
Dec: Downsizing EST = 1.29×(ACT^.87)
Dec: Supersizing EST = 1.01×(ACT^.74)
Supersizing condition
Downsizing condition
260 kcal ? (520 kcal)
? (130 kcal)
260 kcal
Study 2
With the Same Reference, Single Estimation
Procedure
Use same reference size.
Ask for single estimation.
Same factor change, up & down
Professional photos from market research company.
7 products: Rice, pasta, chips, currants, whipped cream, stuffed tomato, soup, salad.

17
Supersizing condition
Downsizing condition
56 Cal ? Cal
? Cal 56 Cal
Supersizing condition
Downsizing condition
50 Cal ? Cal
? Cal 50 Cal

18
Supersizing condition
Downsizing condition
164 Cal ? Cal
? Cal 164 Cal
Supersizing condition
Downsizing condition
316 Cal ? Cal
? Cal 316 Cal
19
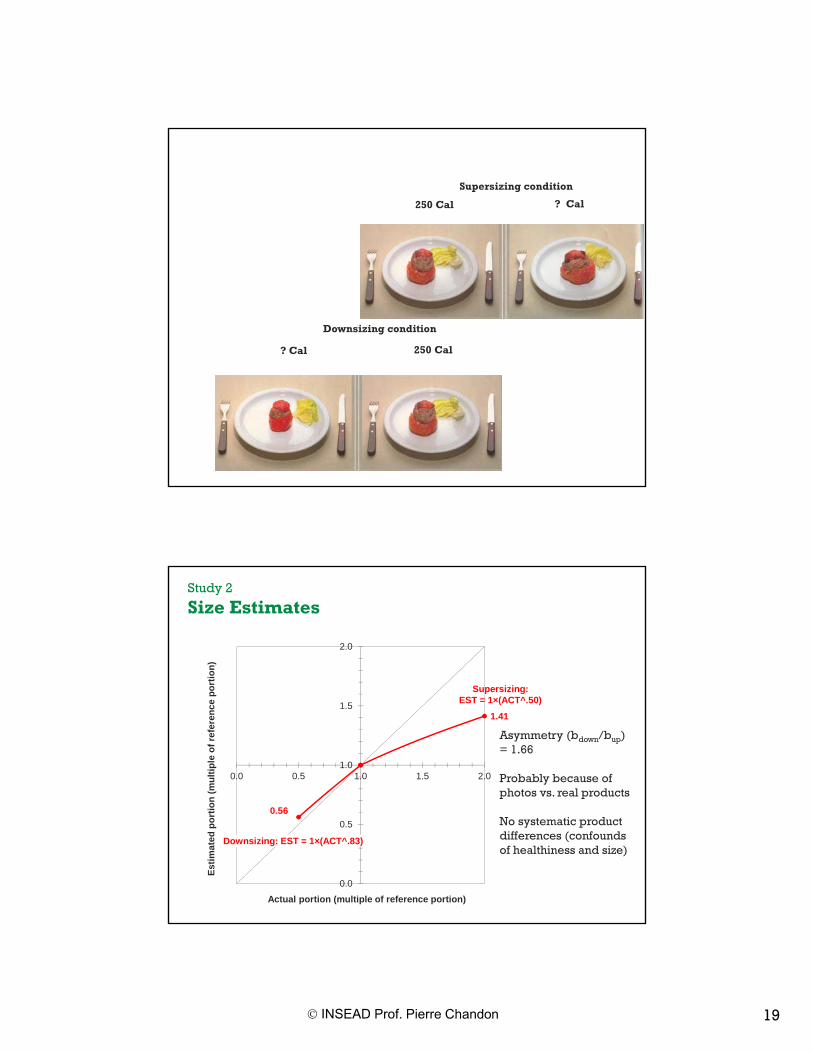
Supersizing condition
Downsizing condition
250 Cal ? Cal
? Cal 250 Cal
Study 2
Size Estimates
0.56
1.41
0.0
0.5
1.0
1.5
2.0
0.0 0.5 1.0 1.5 2.0
Est
imat
ed p
ort
ion
(m
ult
iple
of
refe
ren
ce p
ort
ion
)
Actual portion (multiple of reference portion)
Supersizing: EST = 1×(ACT^.50)
Downsizing: EST = 1×(ACT^.83)
Asymmetry (bdown/bup) = 1.66
Probably because of photos vs. real products
No systematic product differences (confounds of healthiness and size)

20
Study 3
Decoupling Size Direction and Valence
Valence manipulation (tasting)
Sugary or salty iced tea
Pleasant or disgusting JB
N = 145 participants
Magnitude estimation vs. production
Add or subtract 33%, then 67% (iced tea)
Add or subtract 45%, then 90% (JB)
Study 3
Decoupling Size Direction and Valence
?(-33%)
120ml
Iced tea Jelly Beans
Downsizing
Supersizing
?(-67%)
?(+33%)
120ml?
(+67%)
?(-45%)
105g?
(-90%)
?(+45%)
105g?
(+90%)

21
0.0
0.5
1.0
1.5
2.0
0.0 0.5 1.0 1.5 2.0
Est
imat
ed p
ort
ion
(m
ult
iple
of
refe
ren
ce p
ort
ion
)
Actual portion (multiple of reference portion)
Supersizing: EST = 1.0×(ACT^.65)
Downsizing: EST = 1.01×(ACT^1.16)
Study 3
Size Estimates
Asymmetry (bdown/bup) = 1.78
0.0
0.5
1.0
1.5
2.0
0.0 0.5 1.0 1.5 2.0
Est
imat
ed p
ort
ion
(m
ult
iple
of
refe
ren
ce p
ort
ion
)
Actual portion (multiple of reference portion)
estimation: unpleasant observed
estimation: pleasant observed
Pleasant Supersizing: EST = .98×(ACT^.70)
Pleasant Downsizing: EST = .97×(ACT^.98)
Unpleasant Supersizing: EST = 1.01×(ACT^.61)
Unpleasant Downsizing: EST = 1.01×(ACT^1.24)
Study 3
Pleasantness does not Influence Size Estimates

22
0.0
0.5
1.0
1.5
2.0
0.0 0.5 1.0 1.5 2.0
Pro
du
ced
po
rtio
n (
mu
ltip
le o
f re
fere
nce
po
rtio
n)
Actual portion (multiple of reference portion)
Supersizing: EST = 1.0×(ACT^1.04)
Downsizing: EST = .92×(ACT^.89)
Study 3
Lower Asymmetry for Size Production Task
Asymmetry (bup/bdown) = 1.17
0.0
0.5
1.0
1.5
2.0
0.0 0.5 1.0 1.5 2.0
Pro
du
ced
po
rtio
n (
mu
ltip
le o
f re
fere
nce
po
rtio
n)
Actual portion (multiple of reference portion)
dosage: unpleasant observed
dosage: pleasant observed
Unpleasant Supersizing: EST = .92×(ACT^1.12)
Pleasant Supersizing: EST = .99×(ACT^1.02)
Unpleasant Downsizing: EST = .92×(ACT^.88)
Pleasant Downsizing: EST = .87×(ACT^.77)
Study 3
Pleasantness does not Influence Size Production

23
Study 4
Expertise
136 cooking school students
Pasta:
165g (x 3): 55g or 495g
Sugar:
140g + 75% (35g) or – 75% (245g)
Study 4
Lower Asymmetry for Size Estimates of Experts
0.0
0.5
1.0
1.5
2.0
2.5
3.0
3.5
0.0 0.5 1.0 1.5 2.0 2.5 3.0 3.5
Pre
dict
ed p
erce
ived
vol
ume
Actual volume
estimation: observed
estimation: predicted
b = .84
b = .90
Asymmetry (bdown/bup) = 1.07
No effects of location, cooking experience, math aptitude

24
Study 4
Lower Asymmetry for Size Production of Experts
0.0
0.5
1.0
1.5
2.0
2.5
3.0
3.5
0.0 0.5 1.0 1.5 2.0 2.5 3.0 3.5
Pre
dict
ed p
erce
ived
vol
ume
Actual volume
production: observed
production: predicted
b = .88
b = .80
Asymmetry (bup/bdown) = 1.10
No effects of location, cooking experience, math aptitude
Explanations?
Attention? Drawing attention to height, width, length did not help.
Lower asymmetry for cooks, especially for magnitude production.
Future studies with training and feedback.
Estimation strategy? Multiplication is easier than fractionation.
Future studies with eye-movement analyses.
Motivation? Manipulating product valence did not help.
Approach/avoidance Approaching objects seem closer than receding ones (Lewin 1935).
Approaching noises have a higher pitch (Doppler 1942)
Approaching events seem closer than past ones (Caruso et al. 2013).

25
Summary
Key results
People underestimate size changes because they fail to compound changes across dimensions.
Not because of incorrect attention to changing dimensions.
Not because of failure to estimate each dimension.
This happens because people add instead of multiplying the changes in each dimension.
Size change perceptions are steeper and more linear for downsizing than for supersizing. Why?
Summary
This is how we can help: Provide salient size information in units that people understand and
complement with other sensory information (haptics).
To improve accuracy: linearize the volume estimation task from 3D to 2D to 1D.
To improve acceptance of downsizing: Elongate products. This works because people fail to compound the effects of two diminishing dimensions and compensate them with the steep increase in one dimension.

26
A Big Thank you!