‘How one can see what is not there’: Neural mechanisms of ...
144
‘How one can see what is not there’: Neural mechanisms of grapheme-colour synaesthesia Tessa M. van Leeuwen
Transcript of ‘How one can see what is not there’: Neural mechanisms of ...
‘How one can see what is not there’:
Neural mechanisms of grapheme-colour synaesthesia
Tessa M. van Leeuwen
Front cover: My synaesthesia for letters and digits, overlaid on the surface of a brain (brain image generated with SPM, www.fil.ion.ucl.ac.uk/spm). The research reported in this thesis was carried out at the Donders Institute for Brain, Cognition and Behaviour, Centre for Cognitive Neuroimaging, of the Radboud University Nijmegen, the Netherlands, with financial support from the Volkswagen-Foundation [grant number I/80 743]. ISBN 978-94-91027-10-9 Printed by Ipskamp Drukkers, Enschede, the Netherlands © Tessa M. van Leeuwen, 2011

‘How one can see what is not there’:
Neural mechanisms of grapheme-colour synaesthesia
Een wetenschappelijke proeve op het gebied van de Sociale Wetenschappen
Proefschrift
ter verkrijging van de graad van doctor aan de Radboud Universiteit Nijmegen
op gezag van de rector magnificus prof. mr. S.C.J.J. Kortmann, volgens besluit van het College van Decanen
in het openbaar te verdedigen op woensdag 14 september 2011 om 15:30 uur precies
door
Tessa Marije van Leeuwen
geboren op 26 juli 1980 te Leiderdorp

Promotor: Prof. dr. P. Hagoort Manuscriptcommissie: Prof. dr. M. Ullsperger Dr. R. Rouw (Universiteit van Amsterdam) Dr. R. Willems

Contents
1. Introduction: About synaesthesia 7
2. Colour specificity in the human V4 complex 21 3. Synaesthetic colour in the brain: Beyond colour areas 37
4. Effective connectivity determines the nature of subjective 63 experience in grapheme-colour synaesthesia: A brief communication
5. Altered colour processing as indicated by alpha band oscillations can 79 provide an explanation for grapheme-colour synaesthesia 6. Summary and Discussion 103 References 117 Nederlandse samenvatting/Dutch summary 127 Dankwoord/Acknowledgements 133 List of publications 137 Curriculum Vitae 139 Series Donders Institute for Brain, Cognition and Behaviour 141

Chapter 1 Introduction: About synaesthesia
D I GG I T S
AEIOUY
T H E AA L P H AA B E T
0123456789
V4
SPL
LSA
S Y S Y N A E S T H E S I A A E S T H E S I A
C O L O U R
B O T T O M - U P
T O P - D D O W N
R E P E T I T I O N S U P P R E S S I O N
C M
E E G
f M f M R I I
A L P H A
O W E R
O S C I L L A T I O N S
BRAIN
PROJE
TORS
ASSOCIATORS

Chapter 1
9
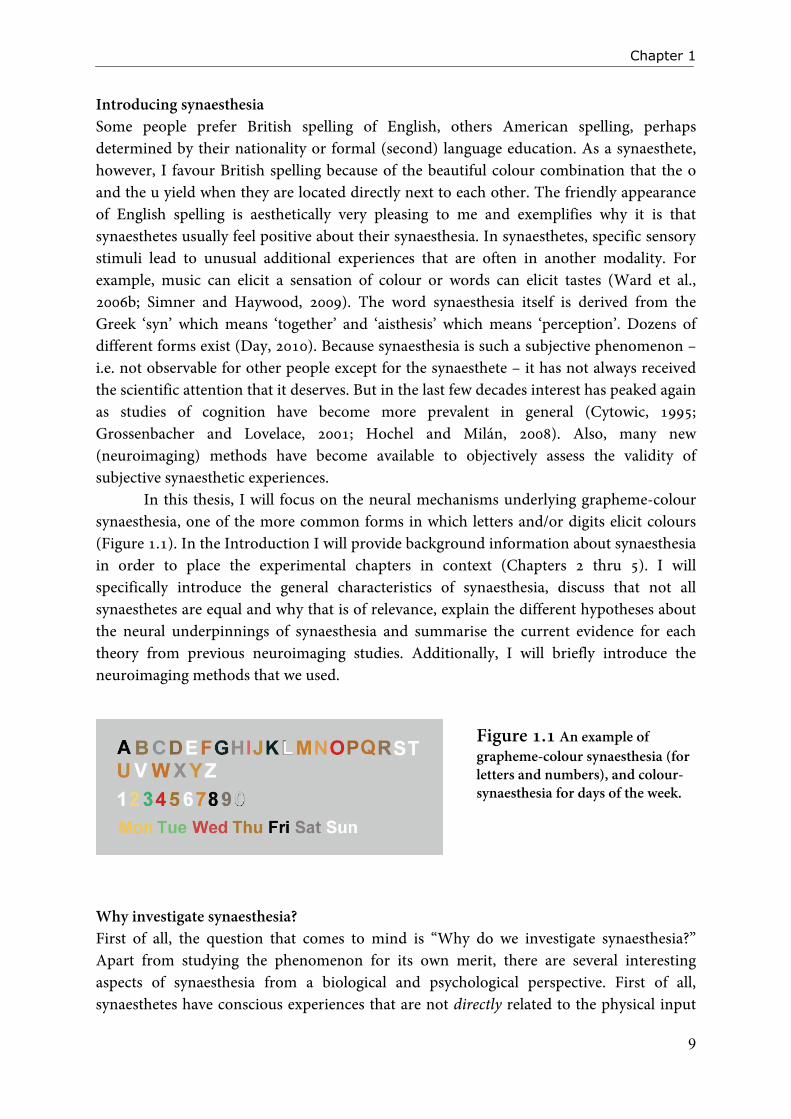
Introducing synaesthesia Some people prefer British spelling of English, others American spelling, perhaps determined by their nationality or formal (second) language education. As a synaesthete, however, I favour British spelling because of the beautiful colour combination that the o and the u yield when they are located directly next to each other. The friendly appearance of English spelling is aesthetically very pleasing to me and exemplifies why it is that synaesthetes usually feel positive about their synaesthesia. In synaesthetes, specific sensory stimuli lead to unusual additional experiences that are often in another modality. For example, music can elicit a sensation of colour or words can elicit tastes (Ward et al., 2006b; Simner and Haywood, 2009). The word synaesthesia itself is derived from the Greek ‘syn’ which means ‘together’ and ‘aisthesis’ which means ‘perception’. Dozens of different forms exist (Day, 2010). Because synaesthesia is such a subjective phenomenon – i.e. not observable for other people except for the synaesthete – it has not always received the scientific attention that it deserves. But in the last few decades interest has peaked again as studies of cognition have become more prevalent in general (Cytowic, 1995; Grossenbacher and Lovelace, 2001; Hochel and Milán, 2008). Also, many new (neuroimaging) methods have become available to objectively assess the validity of subjective synaesthetic experiences. In this thesis, I will focus on the neural mechanisms underlying grapheme-colour synaesthesia, one of the more common forms in which letters and/or digits elicit colours (Figure 1.1). In the Introduction I will provide background information about synaesthesia in order to place the experimental chapters in context (Chapters 2 thru 5). I will specifically introduce the general characteristics of synaesthesia, discuss that not all synaesthetes are equal and why that is of relevance, explain the different hypotheses about the neural underpinnings of synaesthesia and summarise the current evidence for each theory from previous neuroimaging studies. Additionally, I will briefly introduce the neuroimaging methods that we used. Why investigate synaesthesia? First of all, the question that comes to mind is “Why do we investigate synaesthesia?” Apart from studying the phenomenon for its own merit, there are several interesting aspects of synaesthesia from a biological and psychological perspective. First of all, synaesthetes have conscious experiences that are not directly related to the physical input
Figure 1.1 An example of grapheme-colour synaesthesia (for letters and numbers), and colour-synaesthesia for days of the week.

Introduction: About synaesthesia
10
to their brain. For a non-synaesthete, viewing a black A does not lead to the experience of a colour other than black, but for grapheme-colour synaesthetes it does; i.e. synaesthetes somehow become conscious of the colour (e.g. red) in the absence of direct ‘colour red’ input to the brain. If we compare the neural mechanisms of letter processing in non-synaesthetes and synaesthetes we can find out which neural machinery is involved in the conscious experience of the colour red for synaesthetes. Is it necessary that colour areas are activated, for instance, or are interactions between brain regions important for conscious experiences? The neural correlates of conscious awareness have been a long-standing problem in neuroscience (Frith et al., 1999; Block, 2005; Dehaene et al., 2006) and synaesthesia can function as a tool in this investigation (Cohen Kadosh and Henik, 2007). Secondly, synaesthesia is generic and has been shown to adhere to regular principles of cross-modal association, such as pitch-brightness and magnitude-brightness relationships (Ward et al., 2006b; Cohen Kadosh et al., 2007a). If synaesthesia is indeed an extreme manifestation of normal cross-modal perception and binding processes, synaesthesia may inform us about the neural mechanisms of normal cross-modal processing (Cohen Kadosh and Henik, 2007). Furthermore, grapheme-colour synaesthesia and other linguistic synaesthesias show a tight relationship with linguistic features such as phonemes, letter frequency, vowel-consonant differentiation, allophones, etc.; synaesthesia stresses the importance of these features in regular language processing (Simner, 2007). Although I will not go into the psycholinguistic aspects of synaesthesia in this thesis, it is possible that synaesthesia can inform us about normal language functioning. General characteristics Synaesthesia often appears like an exotic and rare condition to people who are unfamiliar with it, but it is estimated that >4% of the population (in Western societies, Henrich et al., 2010) might have synaesthesia (Simner et al., 2006). Coloured days of the week is the most common form, while grapheme-colour synaesthesia has an incidence of >1%. A female:male ratio as high as 6:1 has often been claimed (e.g. Baron-Cohen et al., 1996; Rich et al., 2005). These high ratios, however, were invariably derived from studies that relied on self-referral of synaesthesia; women are much more likely to come forward in such cases. In a random sample, Simner et al. (2006) found a much more equal female:male ratio of 1.1:1. As expected, the majority of participants in the experiments in this thesis were female (87.5%, 7:1 ratio). Varying from mildly (coloured days) to wildly (tasting shapes) exotic, many different forms of developmental synaesthesia exist. Developmental synaesthesia is present from childhood, not acquired through illness or neurological damage (Armel and Ramachandran, 1999; Beauchamp and Ro, 2008). Up to 77% of all forms may have colour as the concurrent synaesthetic experience (Simner et al., 2006). In this thesis I focused on grapheme-colour synaesthesia (see Figure 1.1 for an example) because it is a prevalent form (>1%); it is relatively easy to investigate with computer tasks and in a restricted scanner-environment; for this reason it is also one of the most researched forms, which allowed us to continue investigations where other researchers had left off.
Chapter 1
11
Several general characteristics of synaesthesia can be verified experimentally, serving as an objective criterion for the presence of developmental synaesthesia. First of all, synaesthesia is elicited automatically and involuntary and cannot be switched on and off by means of free will. This has been confirmed in various reaction time tasks in which grapheme-colour synaesthetes were asked to name out loud the ink colours in which letters were printed (e.g. Wollen and Ruggiero, 1983; Odgaard et al., 1999; Dixon et al., 2000; Mattingley et al., 2001). These colour naming tasks are variants of the ‘Stroop’ task, originally devised by Stroop (1935). Stroop showed that reading colour names (an automatic process) influenced the time it took to name out loud the ink colour in which the colour word was printed (e.g. ‘red’ printed in blue ink). In the synaesthetic variants of the Stroop-task the ink colours would either match with the colours of the synaesthesia for these letters (congruent condition) or would not match (incongruent condition). For instance, if the letter A would elicit a red colour for the synaesthete, but a blue A would be displayed, the right answer would be ‘blue’. Because the synaesthete also sees a red colour when viewing the A in blue ink colour, he or she will be slower in saying ‘blue’ due to the presence of two colours that cause a conflict when viewing the letter and naming the colour. In this situation it would help the synaesthete to ‘switch off’ the presence of the red synaesthetic colour, but slower reaction times for the incongruent condition for synaesthetes (and not controls) demonstrate that this is not possible. In this thesis, Stroop-like tasks are used to induce and measure colour interference for synaesthetes (Chapters 3 and 5). Stroop-like interference has also been demonstrated for other types of synaesthesia, e.g. sound-colour (Ward et al., 2006b) and musical notation-colour synaesthesia (Ward et al., 2006a), as well as for a case in which musical tone-intervals elicited taste (Beeli et al., 2005). Another special trait of synaesthesia is its idiosyncrasy, meaning that each synaesthete has his or her personal, unique synaesthetic perceptions that are often very detailed in nature (e.g. see Mills et al., 2002). Sir Francis Galton (1883/1996) already observed the minuteness with which synaesthetes described their colours: “(…) that the seers are invariably most minute in their description of the precise tint and hue of the colour. They are never satisfied, for instance, with saying ‘blue’, but will take a great deal of trouble to express or to match the particular blue they mean.” (p. 45). Recently it has become clear that some commonalities exist across grapheme-colour synaesthetes in the choice of their letter-colour associations (Day, 2005; Rich et al., 2005; Simner et al., 2005; Beeli et al., 2007; Smilek et al., 2007; Simner and Ward, 2008). These can be explained by a correlation between the frequency of the colour words and the frequency of grapheme use (Simner and Ward, 2008). Nonetheless, idiosyncrasy is an important trait of synaesthesia as the individual synaesthetic mappings remain highly stable throughout life (Simner and Logie, 2007). Tests of their consistency over time are considered a valid way to demonstrate the presence of developmental synaesthesia (e.g. Baron-Cohen et al., 1987; Baron-Cohen et al., 1993; Dixon et al., 2000; Mattingley et al., 2001; Palmeri et al., 2002). Usually, synaesthetes have test-retest overlap scores of 90% or higher even across long time periods (years), while matched controls score around 30-40% on average (across weeks). In

Introduction: About synaesthesia
12
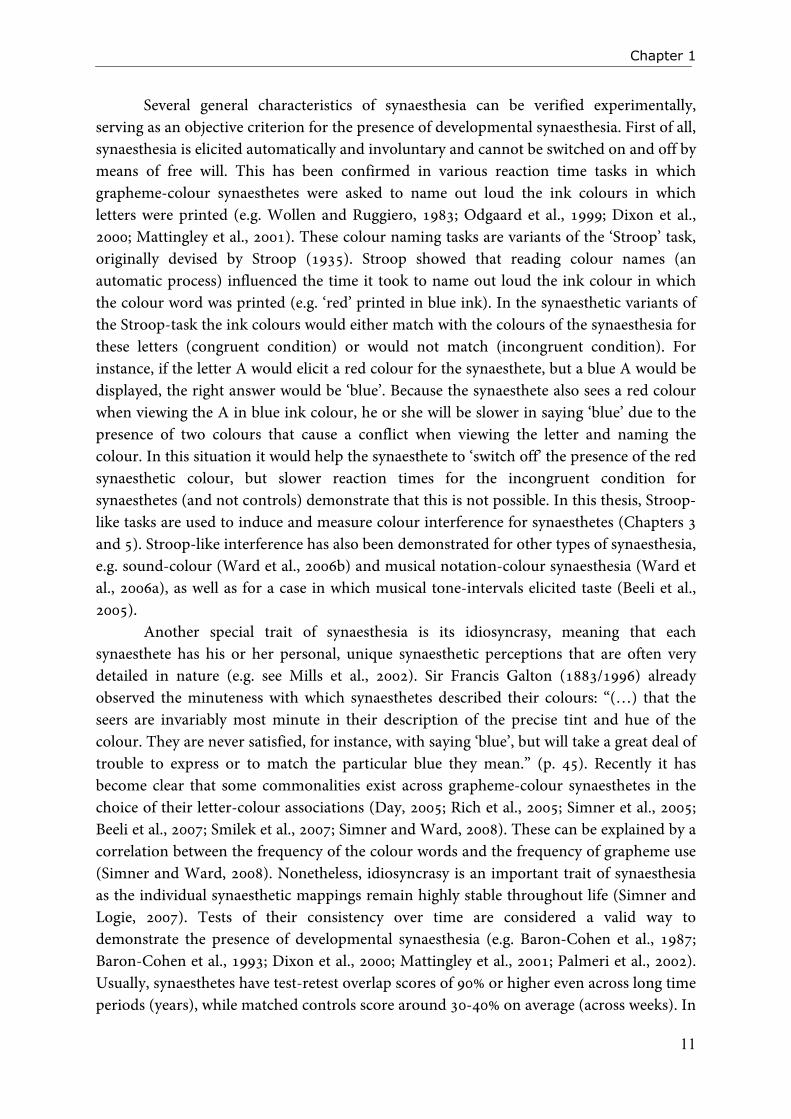
Chapters 3, 4, and 5 of this thesis consistency tests are used to show that the synaesthetic experiences of our participants are stable over time. As a side-note, you can compare the colour associations in Figure 1.1 with the colours of the graphemes on the cover of this thesis to assess the consistency of my own grapheme-colour synaesthesia across 6.5 years. Finally, synaesthesia runs in families, as higher prevalence rates amongst family members of synaesthetes indicate (Baron-Cohen et al., 1996; Rich et al., 2005; Ward and Simner, 2005, 48%, 36%, and 16%, respectively). The genetic basis for synaesthesia is not clear, however. X-linked transmission has been proposed due to the presumably high female:male ratio (Baron-Cohen et al., 1996; Smilek et al., 2002; Ward and Simner, 2005) but discordant male twins have also been identified, arguing against X-linked transmission (Smilek et al., 2005a). A recent genome-wide association study suggests that multiple genes and/or multiple modes of inheritance exist for audio-visual synaesthesias (Asher et al., 2009). Because the phenotype of synaesthesia may vary across generations (i.e. if a mother reports music-colour synaesthesia, her child may have grapheme-colour synaesthesia), it is believed that not the specific type of synaesthesia but the synaesthetic ability itself is heritable (Ward and Simner, 2005). In the Discussion (Chapter 6) of this thesis I will therefore address whether the neural mechanisms underlying grapheme-colour synaesthesia would be applicable to other forms as well: is there one common mechanism that can explain all variants of synaesthesia? Not all synaesthetes are equal Even though all grapheme-colour synaesthetes experience colours for letters and/or digits, not all synaesthetes experience their colours in the same way. It is important to take these individual differences into account during experiments, because they may influence experimental outcomes (Dixon and Smilek, 2005). Apart from possible differences in texture (Eagleman and Goodale, 2009) and idiosyncrasy of the colours, there are important individual differences in the exact spatial location where the colours are experienced. One group of synaesthetes (projectors) experience the colour ‘out there’, i.e. externally co-localised with the grapheme. Another group (associators) report that graphemes evoke a strong internal association of the colour. For an illustration of the two types see Figure 1.2 (Dixon et al., 2004). Projector synaesthetes describe their colour experiences as an overlay of colour on the grapheme (while still perceiving the physical ink colour), and some report that the colours are projected on a ‘mental screen’ that is placed a certain distance away from them (Ward et al., 2007). These ‘mental screen projectors’ are classified as associator synaesthetes by some researchers, but in my thesis I have classified all synaesthetes that reported to ‘see’ the colour ‘out there’ in a specific spatial location as projectors (i.e. when the synaesthesia was perceptual in nature, see Chapters 3-5). For associator synaesthetes, the colour association is more resembling of ‘knowing’ that a colour belongs to a grapheme. Dixon et al. (2004) compare associator synaesthesia to knowing that a traffic light stop-sign is red, even when seeing a black and white picture of a traffic light. Except that for synaesthetes the association with the colour is automatic and the colours are also highly specific in nature; this is not different for projector and associator synaesthetes.
Chapter 1
13
Whether a synaesthete is a projector or an associator is usually assessed with a questionnaire (e.g. Rouw and Scholte, 2007; Skelton et al., 2009) in which synaesthetes indicate how much they agree with statements that either agree with a projector (‘My synaesthetic colours take on the same shape as the letter that is on the paper’) or an associator viewpoint (‘I do not actually see the letter in colour, but I know which colour belongs to the letter’). Associator synaesthetes appear to be more common than projector synaesthetes (Dixon et al., 2004), but in this thesis, the majority of participants were classified as projectors (72%). Perhaps projector synaesthetes are more aware of their synaesthesia and therefore more likely to come forward to participate in complicated and time consuming neuroimaging experiments. Projector and associator synaesthetes can exhibit different results in experiments. In the past this has hampered data interpretation and has led to controversial results in the literature. For a number of synaesthetes perceptual effects resembling pre-attentional pop-out of colour were reported (Ramachandran and Hubbard, 2001b; Smilek et al., 2001; Palmeri et al., 2002), while other researchers failed to find that synaesthetes performed better at such visual search tasks (Edquist et al., 2006). Projectors and associators may show differential effects on synaesthetic Stroop-tasks (Dixon et al., 2004); the observed reaction time differences confirmed earlier classification on the basis of subjective descriptions of the synaesthetes’ experiences. Dixon et al. (2004) showed that projector synaesthetes experienced more interference from synaesthetically induced colours than from real colours, while for associator synaesthetes this pattern was reversed (see their Figure 1 with response times). With neuroimaging studies, differences in brain activity and brain structure have been found (Rouw and Scholte, 2007; Rouw and Scholte, 2010; van Leeuwen et al., 2010 (Chapter 3)). Rouw and Scholte (2007) found a correlation between white matter increase (increased structural connectivity) in right inferior temporal cortex and projector-associator status: projectors showed a larger white matter increase. In a later paper (Rouw and Scholte, 2010) they demonstrate that grey matter density is higher for projector in sensory areas while associators show a relative increase in grey matter in memory related areas. This reflects the perceptual and internally generated nature of projector and associator synaesthesia, respectively. In this thesis, I specifically look into the neural mechanisms behind projector and associator synaesthesia in Chapter 4. We show that effective connectivity between brain areas can determine the nature of the subjective
Figure 1.2 Projector and associator synaesthesia.
Introduction: About synaesthesia
14
synaesthesia experience. In Chapter 3 and 5 we also investigate the effect of projector-associator status on neural activity. In this thesis I will focus on the distinction between projector and associator synaesthesia, but a ‘higher versus lower’ classification of grapheme-colour synaesthetes also exists (Hubbard and Ramachandran, 2005). This is independent from the projector-associator distinction (Ward et al., 2007). Here, synaesthetes are divided according to the stage of grapheme processing at which their synaesthesia is elicited. For ‘lower’ synaesthetes, the synaesthetic colours are believed to be induced relatively early, even before recognition of the grapheme is complete (perceptual level). In ‘higher’ synaesthetes, the colour is not believed to occur before recognition of the grapheme is (almost) complete (conceptual level). That synaesthesia is elicited at the conceptual level is supported by the observation that for the majority of synaesthetes the meaning of a grapheme determines its colour. For instance in ambiguous figures (e.g. shapes that can be read as S or 5) the top-down interpretation of the grapheme determines which colour is perceived and can also direct Stroop interference effects (Myles et al., 2003; Dixon et al., 2006). On the other hand, Ramachandran and Hubbard (2001a) have demonstrated that graphemes can – in specific cases - already induce synaesthetic colour even when preceding overt recognition: in a crowding task, where letters were flanked with others letters, synaesthetic colour preceded recognition. Hubbard et al. (2005b) reported a positive correlation between activity in colour area V4 as measured with fMRI and performance on this crowding task. There is consensus that only a small percentage of grapheme-colour synaesthetes are actually lower synaesthetes (Hubbard and Ramachandran, 2005). Of all the participants in this thesis, only 2 (both projectors) reported some characteristics of lower synaesthesia. We did not focus on the higher-lower distinction in this thesis. Neural underpinnings of synaesthesia A number of different, sometimes overlapping hypotheses exist about the neural basis of synaesthesia. All neural models are developed on the basis of experimental data derived from grapheme-colour synaesthetes, but most also provide plausible explanations for other forms of synaesthesia. For grapheme-colour synaesthesia, the commonality is that all models attempt to explain how colour processing areas in the ventral-occipital cortex become activated during the experience of grapheme-colour synaesthesia. Many neuroimaging studies have demonstrated that colour areas are active during colour synaesthesia (Weiss et al., 2001; Nunn et al., 2002; Hubbard et al., 2005; Sperling et al., 2006). Although not all studies have been able to replicate these effects (Weiss et al., 2005), it is widely accepted that synaesthesia is associated with colour area activation. Parietal cortex is also considered important for eliciting full synaesthesia (Weiss et al., 2005; Esterman et al., 2006; Hubbard, 2007b; Muggleton et al., 2007; Weiss and Fink, 2009). In this section I will briefly introduce the most important neural models and the associated empirical (neuroimaging) evidence. An influential neural hypothesis is the cross-activation or cross-wiring model that was postulated by Ramachandran and Hubbard (2001a; 2001b). Inspired by the
Chapter 1
15
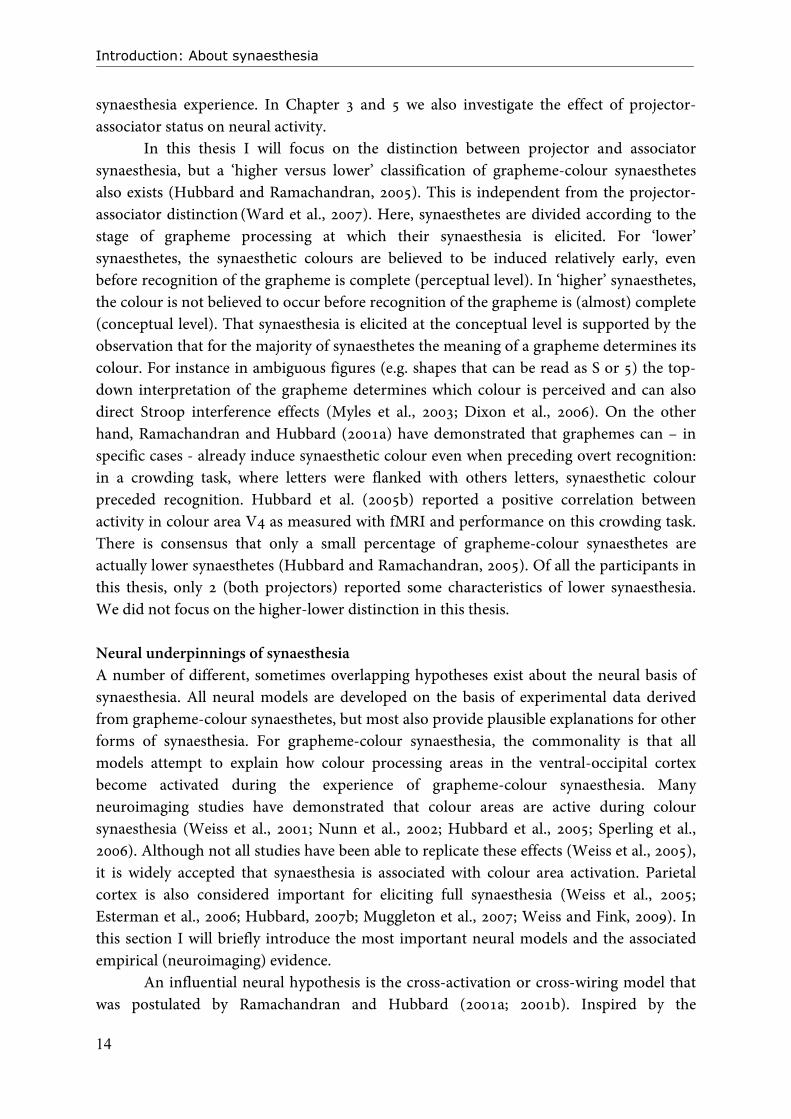
anatomical proximity of the visual word form area (grapheme area) and colour processing areas in ventral-occipital cortex, the authors suggest that grapheme-colour synaesthesia could be due to cross-activation between these brain regions (Figure 1.3, white arrow). They propose that increased anatomical connectivity underlies cross-activation. The enhanced connectivity is thought to originate because of decreased pruning of pre-existing anatomical connections during early development of the brain (Maurer, 1996; Maurer et al., 2006). In the neonatal brain, many connections between brain areas are present that are usually lost during development when they are insufficiently used, but in synaesthetes an increased number of connections are hypothesised to remain. Reduced pruning could happen in different pathways, thus explaining other forms of synaesthesia and the difference between ‘higher’ and ‘lower’ synaesthetes. For some forms of synaesthesia increased connectivity across longer pathways would be required (e.g. taste-colour associations); this difference in pathway length could explain why some forms of synaesthesia are more prevalent than others, i.e. more likely to occur (Simner et al., 2006). One prediction that follows from the cross-wiring hypothesis is that anatomical differences would exist between the brains of synaesthetes and the brains of non-synaesthetes, in or in the proximity of areas involved in synaesthesia. Neuroimaging studies that support the cross-wiring hypothesis show that anatomical differences do indeed exist between synaesthetes and non-synaesthetes: structural differences have been demonstrated for white matter (Rouw and Scholte, 2007) as well as for grey matter density (Weiss and Fink, 2009; Rouw and Scholte, 2010) and/or volume (Jäncke et al., 2009) in fusiform gyrus and parietal cortex (Weiss and Fink, 2009; Rouw and Scholte, 2010), favouring the view that synaesthesia is caused by anatomical differences in the brain. However, it cannot be easily determined whether the anatomical differences are the cause or the consequence of synaesthetic perception. Another prediction of the cross-wiring hypothesis would be that the grapheme area and the colour area are active close together in time or even simultaneously, if information from the grapheme area is directly cross-activating the colour area. No intermediate processing steps or brain regions would be required. Unfortunately the timing of activation is not easily assessed with fMRI because of the relatively poor time-resolution of this method (see BOX 1). Electroencephalography (EEG) or magnetoencephalography (MEG, BOX 2) would be more helpful in assessing the time-course of activation in ventral-occipital areas. Brang et al. (2010) did just that by looking at the timing of activity with MEG, within pre-defined grapheme and colour areas. They showed that activity in the colour area followed activity in the grapheme area by only 5 ms. Only projector synaesthetes were included in this study. Brang et al. (2010) formulate an updated version of the cross-wiring hypothesis named the cascaded cross-tuning model, in which numerous horizontal and feedback connections exist between grapheme areas and colour areas such that colour and form are allowed to interact already during early processing stages. In Chapter 4 of this thesis we use a powerful modelling technique (dynamic causal modelling, see BOX 1) that allowed us to successfully assess directionality in activation
Introduction: About synaesthesia
16
patterns within fMRI data. Our results suggest that for associator synaesthetes another pattern of activation exists.
As an alternative model, the disinhibited feedback hypothesis is widely supported. This model does not suppose differences in anatomy between synaesthetes and non-synaesthetes but hypothesises that changes in inhibitory processes between brain areas can explain synaesthesia (Grossenbacher, 1996; Grossenbacher and Lovelace, 2001). The rationale is that in the brain, all information is fed forward from initial sensory processing areas to areas higher in the cortical hierarchy. In these higher-order areas, cross-modal association and binding processes take place between different types of information (Corbetta et al., 1995; Robertson, 2003). The disinhibited feedback hypothesis proposes that after information has reached a multi-modal region, aberrant feedback is sent back to areas lower in the hierarchy from which the signal did not originate. I.e. in case of grapheme-colour synaesthesia information would leak back to colour areas (black arrows in Figure 1.3).
Predictions that follow from this model are that higher-order areas are involved in synaesthesia and therefore that activation is not confined to ventral-occipital (sensory) areas. Another prediction is that synaesthesia would not require a re-wired brain with special anatomical features, but that it would be possible to induce synaesthesia in all of us. The latter prediction is supported by hallucinogenic effects (pharmacological synaesthesia) that can occur after drug use (Hartman and Hollister, 1963; Aghajanian and Marek, 1999), although these experiences do not directly resemble the generic and idiosyncratic appearance of developmental synaesthesia. Support also comes from a study by Cohen Kadosh et al. (2009), in which the authors were successful in inducing associator-type grapheme-colour synaesthesia in a group of non-synaesthetes by means of post-hypnotic suggestion. Importantly, as I briefly mentioned before, many aspects of synaesthetic associations resemble normal cross-modal associations such as pitch-brightness (Ward et al., 2006b), magnitude-brightness (Cohen Kadosh et al., 2007a) and letter-frequency to colour-word-frequency relationships (Simner, 2007). This notion also supports the view
Figure 1.3 Neural hypotheses about the mechanisms of grapheme-colour synaesthesia. GR is the grapheme area and V4 is the colour area, located in ventral-occipital cortex (drawn on the left side of the brain for illustrative purposes only). SPL is the superior parietal lobe. The white arrow represents the cross-wiring hypothesis in its simplest form, while the black arrows constitutes the disinhibition model.
Chapter 1
17
that no special anatomy is required to create the associations that are manifest in synaesthesia, but that synaesthesia adheres to normal principles of cross-modal associations. Evidence that higher-order brain areas are involved in synaesthesia is derived from neuroimaging studies that have established involvement of left parietal and frontal areas in synaesthesia (Paulesu et al., 1995; Nunn et al., 2002; Weiss et al., 2005; Rouw and Scholte, 2007; van Leeuwen et al., 2010). Especially parietal cortex is a suitable candidate to function as a multi-modal region (Friedman-Hill et al., 1995; Robertson, 2003). With transcranial magnetic stimulation (TMS), it is possible to stimulate or inhibit brain regions (Pascual-Leone et al., 1998). TMS studies have demonstrated that when right parietal cortex is inhibited Stroop interference due to synaesthesia is abolished, indicating that the strength of synaesthesia is diminished (Esterman et al., 2006; Muggleton et al., 2007). This effect occurred for projector as well as associator synaesthetes. Although other explanations have been put forward to explain the involvement of parietal areas in synaesthesia (i.e. hyperbinding), there is substantial evidence that ventral-occipital areas alone are not enough to elicit full synaesthesia. As a variant of the disinhibition model, Smilek et al. (2001) have proposed that reentrant processing within fusiform and anterior temporal cortex could lead to synaesthetic colour percepts (see also Smilek and Dixon, 2002). The events in the model of Smilek and co-workers start from areas in posterior fusiform gyrus that process the form of the grapheme. Next, information is relayed to more anterior fusiform regions where grapheme meaning is being processed. Anterior fusiform areas would, in synaesthetes, then feed back information to colour processing areas in posterior fusiform gyrus along reentrant pathways, taking the identity of the digit into account. In a sense, the reentrant model can be seen as a more local variant of the disinhibition theory, without the explicit involvement of higher-order processing areas. Recently, the model was extended (Carriere et al., 2009) to include feed forward relay of colour information from posterior to more anterior fusiform areas during grapheme processing. These links were included because of evidence that in search displays, synaesthetes have trouble identifying incongruently coloured graphemes – this could be due to information relayed by the incongruent colour.
The most important feature of the reentrant model is that it provides a mechanism by which the identity of the grapheme explicitly influences the synaesthetic colour. In the cross-wiring theory for instance it is proposed that even shapes that have not been processed to the level of recognition can already elicit a colour (Ramachandran and Hubbard, 2001b). This could be equaled to ‘lower’ synaesthesia. In the reentrant model grapheme identity has an explicit role even though the graphemes do not have to be processed to the level of conscious awareness (for a review, see Smilek et al., 2005b). Studies with ambiguous stimuli that have two different meanings depending on the context have demonstrated that the top-down interpretation of the grapheme determines which colour is perceived (Myles et al., 2003; Dixon et al., 2006). That interpretation can influence colour for projector synaesthetes strongly argues for a role of non-physical characteristics of the grapheme in establishment of the colour (Smilek et al., 2001).

Introduction: About synaesthesia
18
BOX 1: Functional Magnetic Resonance Imaging (fMRI) With fMRI, it is possible to locate areas in the brain that are involved in a specific function: different mental processes may be represented in different brain regions or networks. Functional MRI is a non-invasive technique, which means that the individual whose brain is being investigated is not harmed in any way, e.g. no electrodes are inserted or radiation used. This makes fMRI a suitable technique for brain research in humans. An MRI scanner, as in the picture on the right, creates a very strong magnetic field (1.5-7.0 Tesla, about 60.000 times as strong as the earth magnetic field). By changing magnetic gradients and using oscillating electromagnetic fields, energy is transferred to atomic nuclei that are present in the brain; the signal that the nuclei emit when this energy is released again is measured. In functional MRI, we measure the level of blood oxygenation: the blood-oxygenation-level dependent (BOLD) contrast indicates which brain regions received more oxygen-rich blood due to being active. In an experiment with two conditions, for instance colour-present and colour-absent, we can determine which brain regions become more active when people see a colour by subtracting the fMRI images from the colour-absent condition from the colour-present condition. With fMRI we can determine rather precisely where something happened in the brain (~3 mm resolution), but it is hard to say exactly when something happened because the BOLD signal is an indirect and time-delayed (~6 s) measure of neural activity (Huettel et al., 2004). In this thesis we used fMRI in Chapters 2, 3, and 4. In Chapters 2 and 3, we use a variant of fMRI named fMRI-adaptation or repetition suppression. Both terms refer to the notion that the BOLD signal tends to be changed when a stimulus is repeated. For instance, when you see a picture of a house two times in a row, the BOLD signal in the parahippocampal place area may be lower the second time that the exact same house is shown (Henson, 2003). But the signal will only be affected by those aspects of the picture that are repeated; if the house retains its shape but the texture is changed in the second picture, only regions that are sensitive to the shape will show reduced BOLD signal. Repetition suppression can therefore assist in identifying very specialised brain regions. In Chapter 4, we explicitly model the activity in different brain regions with dynamic causal modelling (DCM). With DCM, interactions between brain regions are modelled in neurobiologically interpretable quantities such as the effective strength of synaptic connections among neuronal populations and their context-dependent modulation (Stephan et al., 2010). DCM is a hypothesis-driven method, which means that you cannot freely explore the brain for effects, but specific, a priori defined brain regions are entered into a model together and their interactions are specified. It is then possible to test which of two or more models provides the best posterior explanation of the observed (neuroimaging) data. With DCM, we can determine the direction of interactions between regions, i.e. which region exerts an influence over another region. We call this effective connectivity, different from functional connectivity measures in which only correlations between the time courses of different brain regions are demonstrated.
Recently, Hubbard (Hubbard, 2007b; Hubbard, 2007a) has put forward a two-stage (or integrated) model of grapheme-colour synaesthesia. In the model, perception of the synaesthetic colour and binding of the colour to the grapheme are modelled as separate processes; for the former, colour areas in fusiform gyrus are deemed crucial, for the latter the parietal cortex. This model is supported by influences of task demands on neural correlates of synaesthesia (e.g. see Weiss and Fink, 2009; van Leeuwen et al., 2010 (Chapter 3)). Hyberbinding in parietal regions has also been proposed as the underlying cause of

Chapter 1
19
synaesthesia (Robertson, 2003; Esterman et al., 2006). The role of parietal cortex in synaesthetic binding will be addressed in this thesis as well (Chapter 4). Outline of this thesis The goal of the research in this thesis was to unravel the neural mechanisms of synaesthesia, with special focus on functional activation pathways. One question that we set out to answer was whether synaesthetic colour is processed in exactly the same cortical location as real colour. Although colour area activation has been reported frequently, it is not clear whether synaesthetic colour is processed in exactly the same neuronal populations as real colour. We used the repetition suppression technique (BOX 1) in fMRI to investigate this: does the perception of a synaesthetically induced colour (i.e. J → orange) lead to a reduced BOLD effect for a subsequently presented real colour (an orange patch)? In Chapter 2 we first establish that repetition suppression can be induced for real colour in anterior V4 in the fusiform gyrus. This chapter therefore mainly deals with real colour processing. In Chapter 3, we take the next step and attempt to replicate similar repetition suppression effects for synaesthetic colour. Independently, we also establish main effects of synaesthesia in right V4 and in left superior parietal lobule. In Chapter 4, we apply dynamic causal modelling to our fMRI data to test whether a direct, bottom-up activation pathway (cross-wiring hypothesis) or an indirect, top-down activation pathway (disinhibition hypothesis) to colour area V4 is more likely to explain the experience of synaesthesia. We find that it is important whether a synaesthete is a projector or an associator: individual differences between synaesthetes differentiate the two pathways. Finally, in Chapter 5, we investigate whether there is evidence that synaesthesia is linked to functional disinhibition. With MEG (see BOX 2), we investigate patterns of alpha oscillations, an oscillatory rhythm of the brain that has been linked to functional inhibition. We assess alpha power while synaesthetes view synaesthetic - or real - colour. In Chapter 6 I summarise and reflect on the findings in this thesis and their significance in the search for the neural correlates of synaesthesia. BOX 2: Magnetoencephalography (MEG) and brain oscillations With MEG, we can measure brain activity with great temporal resolution (~1 ms) while it can also reach good spatial resolution (Hämäläinen et al., 1993). Like fMRI, MEG is a non-invasive technique and therefore also very suitable for cognitive brain research on humans. Neuronal activity in the brain creates electric currents. With MEG, we can pick up the weak magnetic fields that are produced by this electric activity when enough neurons (~ 1 million) are active simultaneously. The magnetic fields are measured by sensors called SQUID (superconducting quantum interference device) gradiometers. Because the magnetic signals to be picked up are very weak, the MEG system is usually placed in a magnetically shielded room to avoid interference by external magnetic fields. The good temporal resolution of MEG allows us to measure oscillatory neuronal synchronisation, and to discriminate different frequency bands of oscillatory activity. Oscillations in different frequency bands may have different functions (Buzsáki, 2006). For instance, the alpha rhythm (8-12 Hz) is very prominent when people have their eyes closed and the strength of alpha synchronization (alpha power) decreases when people open their eyes (Berger, 1929). Alpha oscillations have been linked to functional inhibition (Klimesch et al., 2007); we investigated whether alpha oscillations are important for synaesthesia.

Chapter 2 Colour specificity in the human V4 complex
D I GG I T S
AEI
UY
T H E AA L P H AA B E T
0123456789
V4V4
SPL
LSA
C O L O U R O L O U R
B O T T O M - U P
T O P - D D O W N
R E R E P E T I T I E T I T I O N S U S U P P R E S S I R E S S I O N
C M
A L P H A
O W E R
O S C I L L A T I O N S
BRAIN
PROJE
TORS
ASSOCIATORS
S Y N A E S T H E S I A
f M R I
E G
Colour specificity in the human V4 complex
22
Abstract The analysis of colour information in the human brain progresses from cone-opponent signals in the LGN to colour contrast computations in visual areas V1 and V2, and colour constancy operations in the human V4 complex. Colour information becomes more specialised throughout the subsequent processing stages, finally resulting in the ‘identification’ of individual hues. Here we investigated whether a functional subdivision in the specificity of colour coding exists within the human V4 complex. We hypothesised that neurons in the anterior part of the V4 complex (V4α), situated later in the processing hierarchy, would exhibit more specific coding for colour than neurons in the posterior part (V4). To be able to assess colour specificity in different parts of the V4 complex, we determined repetition suppression effects in fMRI in a priori defined regions of interest. For neurons with more specific colour tuning, we expected a reduction in the blood-oxygen-level dependent (BOLD) response to occur when the same colour was repeated (compared to the presentation of two different colours). Within bilateral V4α, but not in V4, we found a BOLD reduction effect for colour repetition. The results suggest that within bilateral V4α, neurons are more specifically tuned for colour than neurons in posterior V4. A slightly modified version of this chapter is submitted as: Tessa M. van Leeuwen, Karl Magnus Petersson, Oliver Langner, Mark Rijpkema, Peter Hagoort (submitted). Colour specificity in the human V4 complex: An fMRI repetition suppression study.
Chapter 2
23
Introduction The hierarchy of colour processing areas in the human brain starts from cone-opponent signals in the retina. Relayed by the lateral geniculate nucleus (LGN), colour information arrives at the primary visual cortex (V1) and area V2, where colour contrast is computed (Conway, 2009). Later visual area V4 and ‘globs’ of neurons in ventral occipital cortex (immediately anterior to V4) are deemed important for colour constancy and for the luminance-invariant coding of individual hues. Not only electrophysiological data from non-human primate studies (Zeki, 1980; Kusunoki et al., 2006; Conway et al., 2007; Matsumora et al., 2008; Stoughton and Conway, 2008; Kotake et al., 2009), but also neuroimaging and lesion studies in humans implicate the ‘V4 complex’ in higher order colour processing (McKeefry and Zeki, 1997; Bartels and Zeki, 2000; Bouvier and Engel, 2006; Barbur and Spang, 2008), where colour representation resembles perceptual colour space.
The posterior section of the human V4 complex (posterior fusiform gyrus) is referred to as V4; the anterior section (anterior fusiform gyrus) as V4α (McKeefry and Zeki, 1997; Bartels and Zeki, 2000). Other definitions have also been proposed for V4 (e.g. V8 (Hadjikhani et al., 1998), VO1 (Brewer et al., 2005)). V4 is active in passive colour tasks (Sakai et al., 1995; McKeefry and Zeki, 1997; Howard et al., 1998). Both subregions contribute to colour constancy operations (Bartels and Zeki, 2000; Barbur and Spang, 2008). In tasks demanding active colour manipulation, it is mainly V4α that is involved (Martin et al., 1995; Zeki and Marini, 1998; Beauchamp et al., 1999; Morita et al., 2004; Simmons et al., 2007). Murphey, Yoshor and Beauchamp (2008) have identified colour-specific neurons in V4α in one patient, using electrophysiological methods. Altogether these findings suggest a functional distinction between V4 and V4α. Here, we investigate whether V4 and V4α exhibit different colour tuning properties.
We performed a functional magnetic resonance imaging (fMRI) experiment in which we applied repetition suppression. In repetition suppression, a stimulus is presented more than once; the blood-oxygen-level dependent (BOLD) response evoked by the second and later presentations of the stimulus is (in general) reduced compared to the response evoked by the first presentation (Henson, 2003; Grill-Spector et al., 2006). Here, we investigated the repetition of colour. We hypothesised that in neurons with specific colour tuning, the repetition of the same colour would reduce the BOLD response more than the presentation of two different colours. Neurons with wider colour tuning would respond less specifically to one particular colour, and therefore show (some) repetition suppression not only when the same colour, but also when two different colours are presented subsequently. We hypothesised that the colour tuning specificity of neurons would increase when progressing from posterior (V4) to anterior (V4α) areas along the processing hierarchy.
Two fMRI studies have previously used repetition suppression, or fMRI-adaptation as it is also called, with the aim to identify regions in the ventral-occipital cortex that are selectively involved in colour processing (and not texture or form processing) (Cant et al., 2009; Cavina-Pratesi et al., 2010). In both studies, 3D-objects were used of which the form,
Colour specificity in the human V4 complex
24
texture, and colour could either stay identical from one stimulus presentation to the next (repetition suppression is expected), or be changed (no repetition suppression). Both studies found that the left anterior collateral sulcus, of which the stereotaxic coordinates correspond to left V4α, was more responsive when the colour of the objects changed between subsequent stimulus presentations; Cant et al. (2009) found similar effects in right fusiform gyrus while Cavina-Pratesi et al. (2010) also found effects in left lingual gyrus. It should be noted that in the study by Cant et al. (2009), the abovementioned regions were not solely selective to colour as they also responded to changes in texture. In neither study, effects were found in areas corresponding to right V4α. Taken together, these studies strongly suggest that left V4α contains neurons that are rather specifically tuned for colour such that they reduce their activity when that same colour is repeated. However, these studies yielded no clear evidence that the posterior fusiform gyrus (V4) exhibits similar colour specificity, independent of texture information. In our study, we explicitly test whether area V4 shows similar repetition suppression effects for colour as area V4α. We propose that neurons in V4α, situated later in the processing hierarchy, show more specific tuning for colour than neurons in V4 and that is why area V4α has been readily identified by repetition suppression paradigms and V4 has not been.
In our experiment we used simple patches of colour that were always of the same form and texture, minimising intrusion of these dimensions in the experiment. We use an active task to engage the participants. Because we wanted to investigate repetition suppression effects in both hemispheres and both sections of the V4-complex, we determined a priori regions of interest (ROIs) in anterior and posterior parts of the V4 complex to assess the effects in all of these regions. The ROIs were defined on the basis of findings from Bartels and Zeki (2000) and the coordinates of V4α corresponded to the reported effects by Cavina-Pratesi et al. (2010). We predicted that only in V4α, and not more posterior V4, the BOLD suppression effects would differ between repetitions of the same versus two different colours. Material and Methods Participants Forty subjects aged 18-38 (mean age 26.2 years, SD = 4.7 years, 4 males, 4 left-handed) participated. All participants completed a pre-screening questionnaire to assess their medical history, handedness and MRI-compatibility. All had normal or corrected to normal vision and reported no colour blindness, and were able to discriminate the stimulus colours. None reported a neurological or psychiatric disease. Informed consent was obtained (prior to scanning) after explanation of the experimental procedures. The study was approved by the local ethics committee, in accordance with the declaration of Helsinki. One participant was excluded prior to analysis after reassessment of her medical history, leaving 39 participants.
As the experiment was part of a larger study on synaesthesia (van Leeuwen et al., 2010 (Chapter 3)), 21 of the subjects were grapheme-colour synaesthetes (Hubbard and

Chapter 2
25
Ramachandran, 2005). The remaining 19 subjects were matched to the synaesthetes on sex, age, handedness, and educational level. Differences between the two subgroups were not found and hence both groups were collapsed for this study. Experimental design We applied a priming paradigm to obtain BOLD repetition suppression effects for colour. Both prime and target consisted of coloured squares. The colour of the prime was either the same colour (SC) as the target, a different colour (DC), or an achromatic colour (AC). Different repetition suppression effects were predicted for each condition. In the SC trials (for instance a red square followed by another red square) we hypothesised that the repetition of the prime colour in the target would lead to BOLD repetition suppression effects for the target square in neurons that are more selectively tuned for that colour. The overlap between neuronal processing of the colour of the prime and the colour of the target would lead to fMRI adaptation effects, reducing the BOLD response (Henson, 2003). In the DC trials the colour of the target differed from that of the prime (for instance a red square followed by a green square). We predicted that a repetition suppression effect in the DC condition would only occur if the different colours were (partly) processed by the same neuronal population; hence by neurons with a less specific colour tuning function. In areas containing many neurons that exhibit specific colour tuning, DC trials would not lead to large repetition suppression effects; different neurons would code for the prime and target colours, inducing a relatively large BOLD response. We expected that only in V4α, and not in V4, the SC condition would lead to more BOLD suppression (and hence less activation) than the DC condition; this follows from our hypothesis that V4α contains neurons that are more specifically tuned for colour than neurons in V4.
We included the achromatic colour condition as a control condition for which we expected no or very little repetition suppression. Here, the primes consisted of achromatic squares while the targets were chromatic squares (for instance a grey square followed by a red square). In colour sensitive regions (McKeefry and Zeki, 1997; Beauchamp et al., 1999) and neurons (Conway et al., 2007; Murphey et al., 2008), the responses to achromatic stimuli are typically much weaker than responses to chromatic stimuli, although they may be higher than baseline. We therefore predicted that the responses to the achromatic primes would affect the responses to the chromatic targets relatively little; little or no repetition suppression would occur for the AC trials, resulting in a relatively strong BOLD response for the coloured targets. For the SC and DC trials, we expected (some) repetition suppression to occur in all brain areas that respond to coloured stimuli. To assess the general responsiveness to colour in the V4 complex we therefore compared the effects of the AC condition to the effects of the collapsed SC and DC conditions.
In addition to the colour priming conditions, the design contained synaesthetic priming conditions of which the trials were intermixed with the colour priming trials. SC, DC, and AC manipulations were also present in the synaesthetic priming, but the primes consisted of black graphemes (single letters, digits, or symbols) instead of squares. The

Colour specificity in the human V4 complex
26
synaesthetic priming results will not be discussed in detail here and are reported elsewhere (van Leeuwen et al., 2010 (Chapter 3)); synaesthetic trials will be referred to as fillers.
During the experiment the participants indicated the colour of the target square with a button press: we used this active task because attention enhances the cortical responses to colour (Corbetta et al., 1991; Chawla et al., 1999). On the basis of previous findings we expected faster reaction times for the same colour trials, due to facilitating effects of the prime on target processing (Simon, 1988; Marangolo et al., 1993; DiPace et al., 1997). Additionally, we expected the different colour trials to cause reaction time interference due to the switch in colour from prime to target; in case any facilitating processes already occurred for the prime, these would have to be overcome at the time of the response to the different target colour. In the achromatic trials the achromatic prime was never informative of the target button to be pressed, because all the target colours were chromatic. We therefore expected that the reaction times for the different colour trials would be slower than those for the achromatic trials due to more interference from chromatic colour information from the prime. Materials and apparatus Colour stimuli were derived from idiosyncratic synaesthetic colours of the synaesthetic participants. Four colours were used for each participant: mainly red, green, blue and yellow. All coloured squares had a size of 2.1º x 2.1º of visual angle and were presented using Presentation (version 10.2, Neurobehavioral Systems Inc., www.neurobs.com). The background was light grey (full screen, 9.1 cd/m2). Stimuli were presented on a 44.5 x 33.5 cm display screen in the scanner tunnel, placed at a viewing distance of 60 cm (controlled by a Dell Pentium IV Windows XP computer, display mode 800 x 600 pixels at 60 Hz, projected by a EIKI X986 beamer). All colours appeared equally often in both the SC and DC conditions, and equally often as prime and target stimuli. The mean luminance of the coloured stimuli was 8.4 cd/m2 (SD = 10.3 cd/m2). Black, dark grey, light grey, and white squares were used as achromatic primes in the AC trials and their mean luminance was 7.5 cd/m2 (SD = 13.5 cd/m2), which did not differ significantly from that of the chromatic stimuli. Although the colours were used equally often in the SC and DC conditions (which constitutes our most important comparison), we wanted to avoid the possible confound of colour luminance in our analyses. We therefore, for each trial, calculated the absolute difference in luminance between the stimuli and the background luminance. We modelled this luminance difference explicitly during analysis of the fMRI data by including it as a parametric modulation value with each trial, which could capture any effects that could solely be ascribed to variance in luminance. Procedure SC, DC, and AC trials appeared in a ratio of 1:2:1 (48:96:48), for a total of 192 trials (and 192 filler trials). The 1:2:1 ratio was chosen such that the expectancy of a same colour trial matched the expectancy of any particular target colour (25%) as closely as possible, to

Chapter 2
27
minimise behavioural strategy effects. The stimuli were divided into four identical runs, each containing 12 SC, 24 DC, and 12 AC trials for both the colour priming and the filler trials, resulting in a total of 96 trials per run. Twenty-four null-events (20%, fixation only) were included in each run to avoid BOLD saturation. All stimuli were pseudo-randomised per run, with maximally 2 repetitions of prime type (SC, DC, or AC) and prime colour, maximally 3 repetitions of the same target colour, and maximally 5 repetitions of overall condition (colour or filler).
Each trial consisted of a prime that was displayed for 500 ms, followed by a blank screen for 100 ms (light grey background colour), and finally a target for 800 ms. During the jittered inter-trial-interval of 4-6 seconds a fixation cross was displayed. Participants were instructed to indicate the colour of the target squares fast but accurately by pressing one of four response buttons with the associated finger of their right hand. Each experimental colour was assigned to one of the response buttons.
First, each participant gave informed consent and completed 16 practice trials containing exemplars of all conditions. Response devices were a normal keyboard for the practice session and an MR-scanner compatible Lumitouch response box for the fMRI session. After the practice trials the fMRI session began, starting with a 5 minute structural scan to familiarise participants with the scanner noise. Next, the participants completed the first two runs of the priming experiment (12 minutes each, 380 images), and were then allowed to take a break for 10 minutes outside of the scanner. The last two priming runs followed after the break. During scanning participants wore sound-attenuating headphones to protect their hearing from the scanner noise. Image acquisition parameters MR data were acquired with a 3.0 Tesla Siemens TrioTim MR scanner and an 8-channel head array (Invivo). A single shot gradient echo-planar imaging (EPI) sequence was used to acquire functional MR images (33 slices, TE = 30 ms, TR = 2090 ms, flip angle = 80º, 224 mm FOV, 64 x 64 matrix, 3.5 x 3.5 mm voxel size, 3.0 mm slice thickness, .5 mm slice gap). Atlas-based registration (AutoAlign, Siemens (Van der Kouwe et al., 2005)) was applied for all EPI runs to ensure the same slice positions across all functional runs of one subject (also across the break). A high-resolution T1-weighted structural image was acquired for each subject (MPRAGE, TE = 2.96 ms, TR = 2300 ms, 256 mm FOV, 256 x 256 matrix, 1 mm3 resolution, acquisition time 5 minutes, accelerated with factor 2 by GRAPPA parallel imaging (Griswold et al., 2002)). Data analysis Behavioural data The reaction time data were analysed with a repeated measures ANOVA. Only correct trials were included. Reaction times that were more than two standard deviations away from the subject and condition mean were considered to be outliers and removed from the analysis. In cases of non-sphericity, a Greenhouse-Geisser correction was used to adjust the degrees of freedom (uncorrected degrees of freedom are reported).

Colour specificity in the human V4 complex
28
Imaging data MR data were preprocessed and analysed with SPM5 (Wellcome Department of Imaging Neuroscience, www.fil.ion.ucl.ac.uk/spm/software/spm5). Prior to analysis, the first five volumes of each subject were discarded to avoid transient T1 effects. To correct for head motion, the functional images of each subject were spatially realigned to the first image using a six parameter rigid body transformation for each image. Slice timing correction was applied and the images were normalised to the standard EPI template of SPM5 to allow for group inference. During normalisation the images were resampled to a 2x2x2 mm resolution. Finally, all images were spatially filtered using a 10 mm FWHM isotropic Gaussian filter.
Statistical analyses were based on the General Linear Model (GLM) framework. For each subject, the design matrix was constructed and the BOLD signal was modelled by the canonical haemodynamic response function (HRF). A high-pass filter (128 sec cut-off) was used to remove low-frequency effects, and global scaling was applied to remove various global effects of no interest. The design matrix consisted of regressors modeling each of the six experimental conditions (SC, DC, and AC conditions for colour and fillers) and one parametric modulation regressor for each of the six experimental regressors to model the luminance difference with the background. All events were modelled by the onset of the target squares. The six realignment parameters that were obtained during preprocessing were included in the model as covariates of no interest. Parameter estimates were obtained for each condition and each participant to generate relevant contrast images and allow for second-level random effects analysis. Coordinates are reported in MNI space in the order (x, y, z). Region of Interest analyses To assess repetition suppression effects in anterior and posterior parts of the V4 complex, we determined regions of interest (ROIs) on the basis of a review by Bartels and Zeki (2000). In Table 1 of the review, the minimum and maximum extend (in x, y, and z directions) of V4 and V4α activations are listed. We determined two (left and right hemisphere) ROIs in the anterior part of V4α (y=-50), and two ROIs in the posterior part of V4 (y=-80), at intermediate x and z coordinate positions. We added two ROIs at the V4α/V4 border (y=-65) to complete our survey of the V4 complex. The centre coordinates of each ROI were converted to MNI space (with tal2mni, derived from http://imaging.mrc-cbu.cam.ac.uk/imaging/MniTalairach) and ROIs (spheres with a 5 mm radius (10 mm diameter)) were subsequently created using MarsBaR (Brett et al., 2002). Table 2.1 lists the ROI centre coordinates and Figure 2.1 shows the ROI positions on an averaged brain.
To look at repetition suppression effects for colour in the different ROIs, we extracted the mean values of the parameter estimates for each priming condition (SC, DC, and AC) for each subject and for each selected ROI. First, we confirmed overall colour sensitivity in the V4 complex (in the left and right hemisphere) by comparing the BOLD effects for the SC and DC conditions with the AC condition. We then tested the specific

Chapter 2
29
hypothesis that the SC trials would lead to less activation (due to more repetition suppression) than DC trials in V4α, but not in V4; leading to an interaction effect. The mean parameter estimates of the ROIs were therefore subjected to a repeated measures ANOVA with the within-subjects factors region (V4α and V4) and prime type (SC and DC), separately for each hemisphere.
Table 2.1 Regions of interest in the V4 complex Region ROI centre coordinates
Left hemisphere Right hemisphere Anterior: V4α -32, -50, -22 32, -50, -24
Middle: V4α/V4 -30, -66, -22 30, -64, -22
Posterior: V4 -32, -82, -20 32, -82, -20
MNI coordinates (x, y, z) of the ROIs within different sections of the V4 complex. Coordinates are derived from Bartels and Zeki (2000, Table 1). Coordinates denote the centre of the spherical ROI (5 mm radius).
Results We excluded one participant from the analysis, due to an overall high error rate of 27.1% (the average error rates of the remaining participants (N=38) were 3.9% (SD = 4.3%)). Behavioural data We expected to see an effect of prime type (SC, DC, and AC) on the reaction times (RTs). Incorrect responses (for percentages see Figure 2.2) and outliers (5.8%) were discarded. The average RTs and error rates for each experimental condition are summarised in Figure 2.2. A repeated measures ANOVA of the RTs with the within-subjects factor prime type revealed a significant effect of prime type (F(2,74)=12.688, p<.001)1. Planned comparisons
Figure 2.1 Locations of regions of interest in the V4 complex. A) and B) Axial and sagittal brain slices, respectively, of representative participant (same as in Figure 2.5) illustrating the position of the six ROIs in the V4 complex in the fusiform gyrus. L = left, R = right. 1. L V4α; 2. L V4α/V4; 3. L V4; 4. R V4α, 5. V4α/V4; 6. R V4. For ROI coordinates see Table 2.1.

Colour specificity in the human V4 complex
30
showed that the RTs of the same colour condition were much faster than the RTs of the different colour condition (F(1,37)=20.228, p<.001, 56 ms faster) and also faster than the achromatic condition RTs (F(1,37)=5.436, p<.05, 30 ms faster). The RTs of the different colour condition were also significantly slower than the RTs of the achromatic trials (F(1,37)=13.959, p<.001, 25 ms slower). The results are in line with previous findings on colour priming (Simon, 1988; Marangolo et al., 1993) and show that a repetition of the prime colour in the target yields an RT advantage.
To check for speed-accuracy trade-offs, we calculated a repeated measures ANOVA with the within-subjects factor prime type for the error rates. We found a significant effect of prime type (F(2,74)=6.829, p<.05). Planned comparisons revealed an effect only for the AC condition in comparison to the SC (F(1,37)=8.090, p<.01) and DC conditions (F(1,37)=13.228, p<.001); there were less errors in the AC condition. SC and DC conditions did not differ in error rate (F(1,37)=.306, n.s.). The results indicate there was no speed-accuracy trade-off between the SC and the DC conditions, as there were no more errors in the SC condition.
fMRI data Region of Interest analyses First, we confirmed that colour-induced repetition suppression was indeed occurring for the SC and DC conditions in the left and right V4 complex. We averaged the BOLD effects of these conditions for each participant and compared them to the effects of the AC condition (collapsed across the 3 ROIs within each hemisphere). In both the left and right hemisphere, there was a significantly reduced BOLD response for the averaged SC-DC conditions compared to the AC condition (left: F(1,113)=13.634, p<.001; right: F(1,113)=22.563, p<.001), which is illustrated in Figure 2.3.
Next, in a repeated measures ANOVA with the factors region (V4α and V4) and prime type (SC and DC), we investigated a region by prime type interaction effect. In the left hemisphere, we found a significant interaction (F(1,74)=4.123, p<.05). There was no significant interaction in the right hemisphere (F(1,74)=.089, n.s.). Because we were interested in potential differences between the colour tuning properties of V4α and V4, we
Figure 2.2 Behavioural effects of colour priming. Reaction times for the same colour (light grey), different colour (dark grey) and achromatic colour (black) conditions. Error bars denote ± standard error of the mean. Percentages of incorrect responses are given for each condition. * (p<.05) and ** (p<.001) denote significant differences in reaction times (repeated measures ANOVA, N=38).

Chapter 2
31
analysed the ROIs in V4α and V4 separately. In left V4α, the SC condition showed a significantly lower BOLD effect than the DC condition (F(1,37)=19.952, p<.001), while in left V4, there was no effect of prime type (F(1,37)=.256, n.s.). The same pattern was found in the right hemisphere: right V4α (F(1,37)=6.778, p<.05), and right V4 (F(1,37)=2.260, n.s.).
0
1
2
3
4
5
6
7
8
9
SC & DC(colour)
AC(achrom.)
SC & DC(colour)
AC(achrom.)
The mean BOLD effects for the SC and DC conditions of each ROI are summarised in Figure 2.4. A marginal difference between the SC and DC conditions was present at the V4α/V4 border in the left hemisphere (F(1,37)=3.540, p<.068). On the right, there were no effects at the V4α/V4 border (F(1,37)=1.872, n.s.). Whole brain analyses To illustrate the distribution of brain regions that showed an adaptation effect for colour, the whole brain analysis of the contrast of AC trials compared to the averaged SC and DC conditions (overall effect of colour-induced repetition suppression) is summarised in Figure 2.5A and Table 2.2. It can be seen that colour-induced repetition suppression occurs in the bilateral V4 complex (fusiform gyrus, Figure 2.5A), as well as in the left cuneus and frontal regions. The effects in fusiform gyrus comprise V4α as well as more posterior V4. The comparison of the DC versus SC condition is also included (Figure 2.5B). This contrast was masked with brain regions that showed an overall adaptation effect for colour, to exclude effects in areas that did not show an overall colour adaptation effect. A significant effect in left fusiform gyrus was found, corresponding to the coordinates of area V4α, in line with previous repetition suppression studies (Cant et al., 2009; Cavina-Pratesi et al., 2010). In Figure 2.5C, the comparison of DC versus SC is shown for two representative individual subjects highlighting the anatomical position of the effects in fusiform gyrus. There were no significant whole brain effects of luminance.
Figure 2.3 Colour sensitivity in the left and right V4 complex. In the left and right hemisphere, we assessed the difference between the AC trials (achromatic primes, no repetition suppression expected) and the collapsed SC and DC trials (coloured primes, repetition suppression expected). A significant difference (** = p<.001) implies colour sensitivity of the area. Mean parameter estimates (N=38) across the 3 ROIs are plotted. Error bars depict ± standard error of the mean.

Colour specificity in the human V4 complex
32
0
1
2
3
4
5
6
7
8
9
10( )*
0
1
2
3
4
5
6
7
8
9
10
LEFT
RIGHT
z = -16
x = -36L
R z = -20
x = -30L
R
x = -34
x = -32
Figure 2.5 Whole brain results of colour priming. A) Sagittal (top) and axial (bottom) anatomical brain slices of a representative participant with the group effects (N=38) of the contrast of the achromatic condition versus the averaged different colour and same colour conditions (AC > (DC & SC)). The position of the effects in left and right fusiform gyrus is shown (see Table 2). Random effects analyses, whole brain threshold p<.001unc, extent threshold 200 voxels. L = left, R = right. B) Sagittal (top) and axial (bottom) brain slices of representative participant showing areas with a group effect (N=38) of stronger adaptation for the same colour condition than for the different colour condition (DC > SC, also see Table 2). Random effects analyses, whole brain threshold p<.001unc, extent threshold 100 voxels, corrected for search volume with the contrast in A. C) Sagittal brain slices of two single participants with the same contrast as in B, showing individual activation patterns in left fusiform gyrus. Whole brain threshold p<.05unc, extent threshold 50 voxels.
Figure 2.4 Colour tuning specificity in the V4 complex. Mean parameter estimates (N=38) for each ROI are plotted for the SC and DC conditions. Error bars depict ± standard error of the mean. * (p<.05) and ** (p<.001) denote significant effects, (*) denotes a marginal effect.

Chapter 2
33
Discussion Literature on colour processing in human ventral occipital cortex suggests that a functional division exists between more anterior (V4α) and posterior (V4) sections of the human V4 complex. In this study, we show a functional segregation of V4α and V4 on the basis of the colour adaptation properties of the neurons within the two sections. Our data suggest that in V4α, neurons are tuned for a smaller range of colours compared to neurons in V4. Although previous studies already reported repetition suppression for colour in areas corresponding to left V4α (Cant et al., 2009; Cavina-Pratesi et al., 2010) which is similar to own our whole brain results, our region of interest approach made it possible to additionally assess repetition suppression in the right hemisphere and in the posterior V4 complex. We were able to show that repetition suppression also occurs in right hemisphere V4α but not in more posterior sections of the V4 complex. A stronger specificity for colour in V4α is in line with the findings of Murphey et al. (2008), who identified colour-selective neurons in V4α by means of electrophysiological recordings in a patient suffering from
Table 2.2 Whole brain results of colour priming
Brain region K p MNI coordinates (x, y, z)
T-value
AC > (SC & DC)
L fusiform gyrus (BA 37/19) 1687 .000 -32, -50, -20 7.66
R fusiform gyrus (BA 37/19) 1805 .000 30, -52, -20 6.02
L cuneus/middle occipital gyrus (BA 18/19) 825 .001 -24, -82, 6 4.97
R cingulate gyrus (BA 31) 1170 .000 20, -40, 32 4.83
L medial frontal gyrus (BA 10) 312 .048 -14, 52, 8 4.53
L rolandic operculum 904 .000 -38, -16, 24 4.50
R medial frontal gyrus (BA 11) 495 .009 12, 56, -12 4.45
DC > SC*
L fusiform gyrus (BA 37) 188 .017 -32, -48, -22 4.19
-28, -56, -18 3.88
-24, -66, -14 3.67
fMRI whole brain results of colour priming (N=38, random effects analyses, whole brain threshold p<.001uncorrected, extent threshold 200 voxels). Cluster size (k), corrected P-values at cluster-level (p), MNI coordinates of local maxima and T-values are listed. Brodmann areas (BA) are in parentheses. R = right, L = left. *corrected for search volume (at whole brain threshold p<.001unc, extent threshold 100 voxels) with overall adaptation effect of AC > (SC & DC), to exclude effects in areas that did not show an overall colour adaptation effect.
Colour specificity in the human V4 complex
34
epilepsy. Electrical stimulation of the neurons that surrounded an inserted electrode led to the conscious perception of the same colour for which these neurons were selective, suggesting rather colour specific colour tuning in this area. Our results additionally demonstrate that this colour specificity does not occur to the same degree in V4, an area where Murphey et al. (2008) did not record. Although our paradigm is not suitable to determine whether neurons in V4α are actually responsive to only one particular colour, the localised effect that we see in V4α provides evidence for a functional subdivision between V4 and V4α.
Many studies report activity in area V4α when active colour manipulations and tasks are involved, like colour sequencing (Beauchamp et al., 1999), object colour (Martin et al., 1995; Zeki and Marini, 1998) and colour imagery (Howard et al., 1998). A direct link between colour awareness, perceptual knowledge about colour, and specific colour-selective neurons in the brain has been proposed (Barsalou et al., 2003; Goldberg et al., 2006; Simmons et al., 2007). The findings of Murphey et al. (2008) in V4α strongly support this idea. Our data and set-up do not allow us to conclude that V4α is involved in colour awareness or knowledge about colour, but our results do suggest that the finer tuning of colour neurons in V4α may lie at the basis for the importance of this area in active colour manipulations. Selective signalling for colour is a requirement for the specific assignment of a colour to an object or for making a decision about colour identity; this process may take place in V4α. It is unlikely that a lack of detection power caused the absence of colour-specific BOLD reduction effects in area V4. First of all, the anatomical locations of all our ROIs were well within the extent of locations of visual areas as listed in Bartels and Zeki (2000). Also, data from a separate colour viewing experiment in the same subjects indicate strong activation of overlapping fusiform areas (van Leeuwen et al., 2010 (Chapter 3)). It is therefore unlikely that a suboptimal location of the ROIs caused the absence of any effects. Furthermore, it was clear that V4 was engaged during our task. In the left hemisphere, there was no prime type effect in V4, but the overall BOLD response to the SC and DC conditions in V4 was actually higher than in V4α (F(1,75)=12.775, p<.001). Importantly, the areas in which our ROIs were located were responsive to colour overall (contrast of AC condition compared to average DC and SC conditions), as shown in Figure 2.3 and in the whole brain results (Figure 2.5 and Table 2.2). Our whole brain results show effects in bilateral fusiform gyrus which correspond very well to previous findings in the literature for the preference of chromatic over achromatic stimuli in ventral-occipital regions (Sakai et al., 1995; McKeefry and Zeki, 1997; Howard et al., 1998; Beauchamp et al., 1999; e.g. Bartels and Zeki, 2000; Mullen et al., 2007). In principle, we could have expected overall adaptation effects for colour (AC > (DC & SC) in more visual regions than only V4 and middle occipital gyrus. However, our stimuli were specifically designed to induce effects in brain regions involved in higher-order colour processing. The stimuli were rather small, and contained neither specific orientation, nor motion, nor texture, and the adaptation period was very brief; primary visual areas may not have been stimulated enough by our stimuli to show adaptation effects. Even though many visual

Chapter 2
35
regions are generally responsive to colour, the abovementioned brain regions actually prefer chromatic stimuli over achromatic stimuli (e.g. Bartels and Zeki, 2000; Mullen et al., 2007), which may explain why we find adaptation effects exactly in those regions.
It is also important to note that the pattern of brain activity in V4α was different from the pattern of behavioural priming in the reaction times. It is not the case that the repetition suppression effects in V4α are merely reflecting the behavioural task demands; the reaction times showed a clear interference effect for the different colour trials (Figure 2.2), while the brain activity in bilateral V4α was strongest for the achromatic condition, as expected for the repetition suppression effect (see Figure 2.3 for the collapsed data). Also, when we included reaction times into our model as an additional regressor, the pattern of brain activity in visual areas did not change (data not shown). This evidence indicates that the effects of the reaction times were independent from the perceptual effects of stimulus repetition. Horner and Henson (2008) researched the effects of response learning and stimulus repetition in the brain, and found that perceptual repetition suppression in posterior brain areas is independent of the task that the subjects were performing. Our data support this finding.
In future studies, the challenge will be to learn more about the spatial organisation of the human anterior colour centre. In macaque, Conway et al. (2007) have shown that colour-biased cells in the inferior temporal cortex, anterior to area V4, are organised in ‘globs’ of luminance-invariant cells, and are alternated with ‘interglob’ regions that contain non-luminance-invariant neurons. Perhaps neurons in V4α are also organised in such a pattern. Kotake et al. (2009) and Conway and Tsao (2009) have demonstrated that in macaque area V4, neurons are spatially organised by colour preference; a similar arrangement may be present in humans. A suggestion for future research would be to apply a repetition suppression paradigm in which the difference between the prime and target colour was varied gradually, to investigate the spatial arrangement of perceptually similar colours. Another promising method are fMRI studies in which multi-voxel pattern analysis is applied (Haynes and Rees, 2006). With this method, Parkes et al. (2009) have identified patches of cells with the same colour preference in primary visual cortex of humans, and Seymour et al. (2009) have shown that classification of voxels based solely on colour preference is possible in all early visual areas except V5/MT+. Likewise, Brouwer and Heeger (2009) have successfully classified stimulus colour in V1, V2, V3, V4, and VO1 (V4α is sometimes referred to as VO1 (Brewer et al., 2005)). Voxels in fMRI contain a very large amount of neurons, which is why the classification results do not exclude a patch-like clustering of colour responsive neurons in V4α. Importantly, Brouwer and Heeger (2009) also found that principal component scores (reflecting variation in the responses to different colours across voxels) in areas V4 and VO1 showed a progression through perceptual colour space, which was not found for other colour-responsive areas like V1. The results suggest a transformation in colour processing from V1 to a more perceptual colour representation in V4 and VO1, implying a spatial distribution of colours according to a perceptual similarity matrix.

Colour specificity in the human V4 complex
36
To summarise, our results suggest that a functional division can be made between visual areas V4 and V4α within the human V4 complex, with more specific colour tuning taking place in V4α. This functional division may underlie the role of V4α in tasks that require active manipulation of colour. Future studies will be able to reveal more details about the structural and functional organisation of the human V4 complex; multi-voxel pattern analysis, high resolution (f)MRI, refined repetition suppression techniques, and studies combining colour processing and behaviour will be useful tools to advance our understanding of human colour perception. Acknowledgements This work was supported by the Volkswagen-Foundation [grant number I/80 743]. __________________________________________________________________________ 1. Before looking at the within-subjects effects on the reaction times and error rates of the group of 38 participants, we verified there were no effects of subgroup (synaesthetic and non-synaesthetic). A main effect of subgroup was present in the reaction times (F(1,36)=4.825, p<.05); synaesthetes showed longer reaction times overall. This was presumably caused by an increase in overall task difficulty for synaesthetes due to the inclusion of the synaesthetic priming condition. There was no subgroup x prime type interaction, indicating that the priming effects did not differ across subgroups. Therefore the RT data of all 38 participants were combined. For the error rates, no main effect of subgroup and no subgroup x prime type interaction were found.
Chapter 3 Synaesthetic colour in the brain: Beyond colour areas
D I GG I T S
AEIOUY
T H E AA L P H AA B E T
0123456789
V4
SPL
LSA
C O L O U R
B O T T O M - U P
T O P - D D O W N
R E P E T I T I O N S U P P R E S S I O NR E P E T I T I O N S U P P R E S S I O N
C M
A L P H A
O W E R
O S C I L L A T I O N S
BRAIN
PROJE
TORS
ASSOCIATORS
S S Y N A E SE S T H E S E S I A
f M R I
E G

Synaesthetic colour in the brain: Beyond colour areas
38
Abstract In synaesthesia, sensations in a particular modality cause additional experiences in a second, unstimulated modality (e.g. letters elicit colour). Understanding how synaesthesia is mediated in the brain can help to understand normal processes of perceptual awareness and multisensory integration. In several neuroimaging studies, enhanced brain activity for grapheme-colour synaesthesia has been found in ventral-occipital areas that are also involved in real colour processing. Our question was whether the neural correlates of synaesthetically induced colour and real colour experience are truly shared. First, in a free viewing functional magnetic resonance imaging (fMRI) experiment, we located main effects of synaesthesia in left superior parietal lobule and in colour related areas. In the left superior parietal lobe, individual differences between synaesthetes (projector-associator distinction) also influenced brain activity, confirming the importance of the left superior parietal lobe for synaesthesia. Next, we applied a repetition suppression paradigm in fMRI, in which a decrease in the BOLD (blood-oxygenated-level-dependent) response is generally observed for repeated stimuli. We hypothesised that synaesthetically induced colours would lead to a reduction in BOLD response for subsequently presented real colours, if the neural correlates were overlapping. We did find BOLD suppression effects induced by synaesthesia, but not within the colour areas. Because synaesthetically induced colours were not able to suppress BOLD effects for real colour, we conclude that the neural correlates of synaesthetic colour experience and real colour experience are not fully shared. We propose that synaesthetic colour experiences are mediated by higher-order visual pathways that lie beyond the scope of classical, ventral-occipital visual areas. Feedback from these areas, in which the left parietal cortex is likely to play an important role, may induce V4 activation and the percept of synaesthetic colour. A slightly modified version of this chapter is published as: Tessa M. van Leeuwen, Karl Magnus Petersson, Peter Hagoort (2010). Synaesthetic colour in the brain: Beyond colour areas. A functional magnetic resonance imaging study of synaesthetes and matched controls. PLoS ONE, 5(8): e12074.
Chapter 3
39
Introduction If you would have digit-colour synaesthesia, every phone number would have its own unique colour-code – very helpful for memorisation. You would not know what it is like to see digits without an associated colour; to you, it would be completely natural to see that 2 is yellow and 3 is green, and it would have been that way for as long as you could have remembered (Hochel and Milán, 2008). Moreover, you would not be able to ignore the colours, or not see them. The colours would always be there, and always remain the same (Hochel and Milán, 2008). In people with synaesthesia, sensations in one sensory or cognitive modality lead to additional experiences in a second, unstimulated modality. A common form is grapheme-colour synaesthesia, in which letters and/or digits involuntarily (Wollen and Ruggiero, 1983; Baron-Cohen et al., 1987) elicit a specific, idiosyncratic colour (e.g. A elicits red). In this study, we investigate the neural correlates of grapheme-colour synaesthesia.
Neural explanations for synaesthesia include (local) anatomical hyperconnectivity (Maurer, 1996; Ramachandran and Hubbard, 2001b; Bargary and Mitchell, 2008), as well as disinhibited feedback mechanisms with an associated increase in functional connectivity (Grossenbacher and Lovelace, 2001; Smilek et al., 2001). In neuroimaging studies, deploying various different methods (e.g. functional magnetic resonance imaging, positron emission tomography, source localisation of electroencephalography data), enhanced brain activity for synaesthesia has been reported in ventral-occipital colour areas (Nunn et al., 2002; Hubbard et al., 2005; Rich et al., 2006; Sperling et al., 2006; Beeli et al., 2008) and in left parietal cortex (Paulesu et al., 1995; Nunn et al., 2002; Hubbard et al., 2005; Weiss et al., 2005; Beeli et al., 2008). Anatomical differences have also been found in these regions (Rouw and Scholte, 2007; Jäncke et al., 2009; Weiss and Fink, 2009). Recently, Hubbard (2007a; 2007b) has put forward a two-stage (or integrated) model of grapheme-colour synaesthesia. In the model, perception of the synaesthetic colour and binding of the colour to the grapheme are modelled as separate processes; for the former, colour areas in fusiform gyrus are deemed crucial, for the latter the parietal cortex. Parietal cortex is involved in spatial feature binding (Robertson, 2003; Ward et al., 2007) and inhibition of right parietal cortex with transcranial magnetic stimulation can disrupt synaesthesia (Esterman et al., 2006; Muggleton et al., 2007).
In spite of the neuroimaging findings and existing theories, the exact neuronal mechanisms underlying synaesthesia are still not well understood. The neural correlates of synaesthesia are of interest because people with synaesthesia experience sensations without receiving direct sensory input to warrant these sensations; still, their experience is very real and salient. Synaesthesia can provide insight into mechanisms of perceptual awareness, and inform us about how sensory inputs are combined in our brain. Here, our aim was to find out whether the experience of synaesthetically induced colour recruits exactly the same colour sensitive regions in the brain as real colour experience. Although synaesthesia related activity has been reported in colour processing areas (Hubbard et al., 2005b; Sperling et al., 2006), we explicitly tested whether synaesthetic colours can affect real colour processing in the brain. This would imply truly shared neural machinery. The
Synaesthetic colour in the brain: Beyond colour areas
40
outcomes would inform us about the level of visual processing at which colour experience induced by synaesthesia is mediated.
Behavioural studies show that synaesthetic colour experiences can influence the reaction times of judgments on real colour (Dixon et al., 2000; Mattingley et al., 2001; Smilek et al., 2001). Synaesthetically induced colour also resembles real colour perception in a wide range of perceptual tasks, for example perceptual crowding, visual grouping and visual search, apparent motion, and the watercolour effect (Ramachandran and Hubbard, 2001b; Palmeri et al., 2002; Kim and Blake, 2005; Kim et al., 2006). Synaesthetic colours may even adhere to early visual colour-opponency mechanisms (Solomon and Lennie, 2007). In a study by Nicolić, Lichti, and Singer (2007), incongruent Stroop colours were chosen to be maximally opponent to the colours that were induced by synaesthesia; larger interference effects were found for opponent colours than for non-opponent incongruent colours.
Together these findings suggest that synaesthetic colour perception shares at least several neural processing steps with real colour perception, possibly also in early visual areas. On the other hand, synaesthetes subjectively report that synaesthetic and real colours do not mix (Dixon et al., 2004), and that synaesthetically induced colours are difficult to express in real colour terms. Similarly, perceptual resemblance to real colour has not always been reproduced (e.g. in visual search, Edquist et al., 2006; Sagiv et al., 2006). Hong and Blake (2008) have shown that synaesthetic colours are not influenced by brightness contrast, do not induce hue cancellation, and do not affect real colour perception in equilibrium yellow settings. The authors therefore argued that the earliest neural correlates of synaesthetic colour perception must lie beyond primary visual cortex, an issue that we investigated further in the current study.
Our experiment was conducted on the basis of a previous study (Van Leeuwen et al., submitted (Chapter 2)) in which we demonstrated that the repetition of real colour induces repetition suppression effects in functional magnetic resonance imaging (fMRI): we found a decrease in the blood-oxygenated-level-dependent (BOLD) response for repeated stimuli (Henson, 2003; Grill-Spector et al., 2006). Repetition suppression (RS) can be regarded as a priming effect in the brain, and occurs when there is sufficient overlap in neuronal processing between the first (prime) and the second (target) stimulus. Given this assumption, RS is a sensitive method that allows for precise localisation of the representation of specific stimulus features. Please note that repetition suppression for stimulus features in sensory cortex can be completely independent from observable measures like reaction times (Horner and Henson, 2008). We have shown RS effects for real colour in visual area V4α (Van Leeuwen et al., submitted (Chapter 2)), in which colour processing is already past the first, colour-opponent stages (Bartels and Zeki, 2000). V4α can be regarded as a higher-order colour processing area. For the repetition of real colour, we found stronger RS effects for the condition in which the colour of the target square was congruent with the colour of the prime, than for the condition in which the prime and target colours were incongruent. In the current experiment (including the same subjects as the real colour study) we used graphemes as primes instead of coloured squares. The

Chapter 3
41
graphemes elicited a vivid synaesthetic colour for the synaesthetes, which could either be the same (congruent) or different (incongruent) from the physical colour of the subsequent target square. We predicted more RS effects for the congruent colour condition than for the incongruent colour condition in those brain areas where the neuronal processing of synaesthetically induced colours and real colours is (partly) shared. We compared the neural correlates of synaesthesia-colour priming to the effects obtained for real colour, to see whether synaesthetically induced colour led to similar RS effects as real colour.
To optimise our sensitivity we included a large cohort of synaesthetes (N=21) and matched controls. Apart from the congruent synaesthetic colour (CC) and incongruent synaesthetic colour (IC) conditions, a control condition was included in which the primes did not elicit a colour at all (non-inducing condition (NC)). No repetition suppression was predicted for NC trials, because in colour sensitive regions (McKeefry and Zeki, 1997; Beauchamp et al., 1999) the responses to achromatic stimuli (all stimuli were presented in black) are typically much weaker than responses to chromatic stimuli. The control participants did not experience synaesthesia for any of the prime stimuli; hence for the controls we did not predict any modulation of the BOLD response due to the manipulations in the primes. Participants indicated the colour of the target square with a button press, and reaction times were measured to compare the effects to previous behavioural findings for synaesthetic priming (Dixon et al., 2000; Mattingley et al., 2001).
We specifically predicted RS effects in ventral-occipital parts of the brain, in which grapheme and colour processing areas are located in close proximity (Ramachandran and Hubbard, 2001b). To help with the interpretation of our effects, we performed a functional localiser experiment (Experiment 1) in which we mapped grapheme and colour sensitive areas, and localised the main effects of synaesthesia. Graphemes that were inducing vivid synaesthetic colours were contrasted against non-inducing control graphemes to localise synaesthesia related activity (stimuli from both conditions were presented in black). False font stimuli (also presented in black), which resembled well known graphemes in visual complexity but did not have any meaning, were compared to the non-inducing control graphemes to help identify the neural correlates of grapheme processing. To map colour responses, we included a condition in which the non-inducing control stimuli were presented in colour instead of black. We also compared synaesthetic colour experience to real colour experience to capture the added quality of synaesthesia. The resulting activation patterns for graphemes and colours were used as volumes of interest (VOI) to restrict our search for colour-specific RS effects in the synaesthetic priming experiment (Experiment 2).
Synaesthesia also has a spatial component: projector synaesthetes report seeing the colours ‘on’ the grapheme, while associators do not and experience the colours in their ‘mind's eye’ (Dixon et al., 2004). In both Experiment 1 and 2, we investigated the influence of the synaesthetes’ projector-associator status on synaesthesia related brain activity: these individual differences can influence experimental results (Dixon et al., 2004; Hubbard et al., 2005b; Rouw and Scholte, 2007).
Synaesthetic colour in the brain: Beyond colour areas
42
Materials and Methods: Experiment 1 Localising synaesthesia, grapheme, and colour areas In Experiment 1 we identified grapheme areas, colour areas and synaesthesia-related areas in the brain, and investigated the effect of projector-associator status on synaesthesia-related activity. Participants Synaesthetes Twenty-one synaesthetes aged 18-37 (mean age 26 years, SD = 4.9 years, 2 men, 2 left-handed, 1 ambidextrous) participated. Selection was performed on the basis of a questionnaire that assessed synaesthetic experiences, medical history, and handedness (self-reported hand preference). From the general part of the questionnaire (30 questions on synaesthesia, comprising questions like “How long have you experienced synaesthesia?” and “Did the experience change over time?”), it was determined whether the participants fitted the profile for developmental synaesthesia. All synaesthetes experienced grapheme-colour synaesthesia since early childhood; 20 reported additional synaesthesias, for example time units inducing colour (n=18) and/or shapes (n=15), and sound-colour synaesthesias (n=8).
In the questionnaire synaesthetes reported the colour and intensity of their synaesthesia for 26 letters of the alphabet, digits 0-9, 15 familiar non-alphanumeric symbols (e.g. #, %) and 13 ‘false font’ stimuli (unfamiliar symbols derived from Cyrillic, Greek, and Arabic, not resembling Latin letters or numbers in shape). We tested the consistency of the synaesthetic experiences over time to verify genuine synaesthesia (Baron-Cohen et al., 1987; Baron-Cohen et al., 1993). A surprise re-test on 20 graphemes, taking place by phone 8-13 months (mean 11.0 months) after the initial study yielded an average consistency score of 91% (SD = 7.5%), similar to previously reported consistency scores (e.g. Baron-Cohen et al., 1993; Mattingley et al., 2001).
We characterised the synaesthetes on the basis of the spatial location of their colour experiences (Dixon et al., 2004; Ward et al., 2007). As classification criteria we used the participants’ detailed descriptions of the appearance of their synaesthesia, in which we explicitly asked them to describe the spatial location of their experiences. For clarity, we added 9 specific questions on the location and shape of the synaesthetic colours. Synaesthetes indicated how much they agreed (on a 5-point scale) to sentences that fitted either best with a projector, mental screen projector, or an associator viewpoint (similar to the procedure in (Rouw and Scholte, 2007)). The scores on this scale determined how they were characterised. Seven synaesthetes were classified as ‘projectors’, who experience the colour as an overlay projection on the graphemes themselves; 8 as ‘mental screen projectors’, whom experience the colours in external space but not on the graphemes (in some papers, these synaesthetes are referred to as associators, e.g. Ward et al. (2007)); and 6 as ‘associators’, who experience synaesthesia as a strong association between the grapheme and the colour.

Chapter 3
43
Controls Nineteen control participants aged 19-38 (mean age 26 years, SD = 4.7 years) who did not report synaesthesia were individually matched to the synaesthetes on sex, age (± 3 years), handedness, and educational level. Mean ages did not differ between the groups: t(18) = -1.46, n.s. Controls completed a pre-screening questionnaire to assess their medical history and handedness and were asked to associate a colour with 20 graphemes. Unannounced re-testing of the colour associations after 5-9 months (mean 6.6 months) yielded a consistency score of 32% (SD = 18%), which was significantly lower than the synaesthetes’ score; t(38) = 13.4, P<.001. All participants had normal or corrected to normal vision, reported no colour blindness and were able to discriminate the experimental colours. None reported a neurological or psychiatric disease. One participant was excluded prior to analysis after reassessment of her medical history, leaving 20 synaesthetes. Written informed consent was obtained from all participants prior to scanning and the study was approved by the local ethics committee of the Radboud University Nijmegen, in accordance with the Declaration of Helsinki. Materials Upon arrival each synaesthete indicated (with Microsoft Powerpoint) the synaesthetic colours for 10 customised graphemes selected from the questionnaire. Eight synaesthesia-inducing graphemes for which the chosen colours matched well to the experienced synaesthesia, and that elicited vivid colours, were chosen for the synaesthesia condition. For the non-inducing control condition we selected 8 graphemes that elicited no synaesthesia (as indicated in the questionnaire). For 14 synaesthetes, several (3.6 (SD = 1.4) on average) familiar non-alphanumeric symbols (e.g. #, %) were included in the non-inducing control condition because there were not enough non-inducing alphanumeric graphemes. Stimuli from the synaesthesia and the non-inducing conditions were presented in black. To create the colour condition, the non-inducing graphemes were displayed in random colours unrelated to synaesthetic experiences. Finally, 8 non-inducing, unfamiliar symbols with a visual complexity comparable to regular alphanumeric characters were chosen to constitute the false font condition (also presented in black). These symbols did not have any meaning, in contrast to frequently used alphanumeric symbols. For one grapheme-gender synaesthete, genders of the stimuli were divided equally across experimental conditions. Stimulus presentation Stimuli were presented against a light grey (full screen, 9.1 cd/m2) background, using Presentation (version 10.2, Neurobehavioral Systems Inc., www.neurobs.com). Non-colour stimuli were presented in black to ensure high contrast with the background, which may influence the strength of synaesthetic experiences (Hubbard et al., 2006). Bright, distinct colours were used for the colour condition (not luminance-matched to the other conditions). All alphanumeric graphemes were 2.0º tall while non-alphanumeric symbols

Synaesthetic colour in the brain: Beyond colour areas
44
ranged from 1.3º - 2.7º tall. Stimuli were presented in the centre of a 44.5 x 33.5 cm display screen in the scanner tunnel, placed at a viewing distance of 60 cm (controlled by a Dell Pentium IV Windows XP computer, display mode 800x600 pixels, 60 Hz, projected by a EIKI X986 beamer). Procedure Participants passively viewed pseudorandom blocks of A) 8 synaesthesia-inducing graphemes; B) 8 non-inducing control graphemes; C) 8 coloured non-inducing graphemes and D) 8 false font stimuli. Stimulus order within the blocks was randomised. Control participants viewed the same stimulus list as the synaesthete to whom they were matched. Each stimulus was presented for 1500 ms with a 500 ms inter-stimulus interval; between blocks, a central black fixation cross was presented for 10 seconds. Six blocks for each condition yielded a total runtime of 11 minutes (350 MR images). In addition to the standard sound-attenuating headphones, two synaesthetes who reported synaesthesia for the scanner sounds wore earplugs. Image acquisition MR data were acquired with a 3.0 Tesla Siemens TrioTim MR scanner and an 8-channel head array (Invivo). First, a high-resolution T1-weighted structural image was acquired for each participant (MPRAGE, TE = 2.96 ms, TR = 2300 ms, 256 mm FOV, 256 x 256 matrix, 1 mm3 resolution) with an acquisition time of 5 minutes, accelerated with factor 2 by GRAPPA parallel imaging (Griswold et al., 2002). A single shot gradient echo-planar imaging (EPI) sequence was used to acquire functional MR images (29 slices, TE = 30 ms, TR = 1840 ms, flip angle = 80º, 224 mm FOV, 64 x 64 matrix, 3.5 x 3.5 mm voxel size, 3.0 mm slice thickness, 0.5 mm slice gap). Data analysis MR data were preprocessed and analysed with SPM5 (Wellcome Department of Imaging Neuroscience, www.fil.ion.ucl.ac.uk/spm/software/spm5). Prior to analysis, the first 5 volumes of each subject were discarded to avoid transient T1 effects. To correct for head motion, images of each subject were spatially realigned to the first image using a six parameter rigid body transformation for each image. Slice timing correction was applied and the images were normalised to the standard EPI template of SPM5 to allow for group inference. Finally all images were spatially filtered using a 10 mm FWHM isotropic Gaussian filter.
Statistical analyses were performed on the basis of the General Linear Model (GLM) framework. For each subject the design matrix was constructed and the BOLD signal was modelled by the canonical haemodynamic response function (HRF). A high-pass filter (128 s cut-off) was used to remove low-frequency effects and global scaling was applied to remove various global effects of no interest. The effects of interest were modelled with boxcar responses (synaesthesia, non-inducing, colour, and false font blocks) and included in the design matrix in a blocked design. The six realignment parameters,
Chapter 3
45
obtained during preprocessing, were included in the model as covariates of no interest. Parameter estimates were obtained for each condition and each participant to generate relevant contrast images and allow for second-level random effects analysis. Coordinates of peak activity are reported in MNI coordinates in the order (x, y, z) and the initial threshold was P<.001uncorrected at the whole brain level, with a cluster-level statistic of P<.05FWEcorrected. Corresponding brain regions and Brodmann areas were retrieved from the Talairach Daemon database server (Lancaster et al., 1997) and verified with the SPM5 Anatomy toolbox (Eickhoff et al., 2005). Mean parameter estimates for Region of Interest (ROI) analyses were extracted using MarsBaR (Brett et al., 2002). Results and Discussion: Experiment 1 Nineteen synaesthetes and nineteen matched controls were included in the analysis of Experiment 1. One synaesthete was excluded because this participant was excluded from the analysis of Experiment 2 (see below); we preferred to keep the number of subjects identical across the two experiments. Localising grapheme areas Non-inducing control stimuli (graphemes) were contrasted to the false font stimuli to localise grapheme areas. In the absence of interaction effects between the groups (at whole brain P<.001uncorrected) the data were collapsed across synaesthetes and controls, and thresholded more stringently at whole brain P<.05FWEcorrected (N=38). An effect was found only in the right superior parietal lobe (Table 3.1), but no clusters were found in ventral-occipital cortex as was hypothesised. Several previous studies have reported enhanced activity for unfamiliar symbols (e.g. Korean letters) compared to letters (or pseudowords compared to words) in visual areas (Dehaene et al., 2002; Mechelli et al., 2003; Flowers et al., 2004; Pernet et al., 2005). We therefore computed the reverse contrast of false fonts compared to non-inducing control graphemes (N=38, whole brain P<.05FWEcorrected): we found bilateral clusters of activation in the inferior occipital gyrus (Brodmann areas 18/19) and in the anterior section (BA 37) of the fusiform gyrus (Table 3.1 and Figure 3.1A).
The effects for false font symbols corresponded to previous findings for written words (Dehaene et al., 2002) and letter and symbols (Flowers et al., 2004; Pernet et al., 2005) that are contrasted against baseline activity. However, our obtained activation pattern did not include the anterior left fusiform gyrus which is proposed to mediate sublexical properties of letters and words (Dehaene et al., 2005; Levy et al., 2008) and is influenced by word frequency (Kronbichler et al., 2004) and related to task accuracy (Garrett et al., 2000). Our results suggest that the increased activity for the false font symbols was largely caused by familiarity effects: although matched in visual complexity, the control graphemes were more frequent in written language. Free viewing conditions and the long stimulus exposure (1500 ms) may have induced additional processing for the unfamiliar symbols. The activation pattern for false fonts compared to control graphemes was used as a volume of interest (VOI) in our subsequent analyses, with the explicit note
Synaesthetic colour in the brain: Beyond colour areas
46
that we cannot claim that this VOI includes areas involved in processing of graphemes per se; rather, the VOI is capturing visual areas that are especially recruited during the complex and abstract visual analyses that underlie symbol and grapheme processing. Localising colour areas To localise colour areas we contrasted coloured graphemes with the (black) non-inducing control graphemes. Again, no interaction effects were found at whole brain P<.001uncorrected, meaning the effects were similar across both groups of participants, and the data were analysed across all 38 subjects (at whole brain P<.05FWEcorrected). Note that in this contrast, the effect of the graphemes themselves is cancelled out (identical stimuli in both conditions), leaving only the effect of colour. Bilateral clusters were obtained in the fusiform gyrus, located medially and ventrally from the areas involved in grapheme processing (Table 3.1 and Figure 3.1B), although there was partial overlap (Figure 3.1C). Although the coloured graphemes were not luminance-matched to the black non-inducing graphemes, our results (Table 3.1) corresponded very well to previous reports on colour sensitive areas (McKeefry and Zeki, 1997; Bartels and Zeki, 2000). The local maxima in the anterior fusiform gyri (BA 37) were within 5 mm of the reported anatomical location of anterior visual area V4α; the more posterior maxima in fusiform gyrus (BA 19) were within 5 mm of the location of V4 (Bartels and Zeki, 2000, Table 1). We concluded that the obtained activation pattern for colour (at P<.05FWEcorrected) could be used as a representative subset of colour sensitive areas (VOI) during further analyses. Localising synaesthesia areas To localise the effects of synaesthesia we identified brain regions with a positive interaction for synaesthetes compared to controls, for the contrast of synaesthetic graphemes compared to non-inducing control graphemes. This contrast represents the phenomenal experience of synaesthetic colour for synaesthetes that is additive over the stimulus effects for the controls. Note that any possible perceptual effects of the stimuli are cancelled out in this interaction test, because those effects are expected to be present for both groups. An interaction effect for synaesthetes was present within the ventral-occipital colour VOI (used as Small Volume Correction), located at (36, -76, -26) in the right posterior fusiform gyrus (see Table 3.1 and Figure 3.1D). The location of the effect is within the extent of colour area V4 as defined by Bartels and Zeki (2000, Table 1). The results confirm the role of ventral-occipital colour areas in synaesthetic colour experience (Nunn et al., 2002; Hubbard et al., 2005; Sperling et al., 2006).
Additionally we compared synaesthetic colour perception (synaesthesia condition) to real colour perception (colour condition) to investigate possible differences between the neural correlates. Here, it is the added synaesthetic quality of the experienced colour that would cause any additional effects for the synaesthesia condition for synaesthetes. A significant (whole brain P<.001uncorrected) positive interaction for synaesthetes compared to controls was found at (-24, -58, 46) in the left superior parietal lobule (see Table 1 and Figure 3.1E for details). No effects were found in ventral-occipital areas, also not within the

Chapter 3
47
colour VOI. Note that in the interaction test, possible perceptual effects of the stimuli (expected for both groups) are cancelled out. Increased BOLD fMRI effects for synaesthesia in the left parietal cortex were found previously by Weiss et al. (2005), while diffusion tensor imaging (DTI) and voxel-based morphometry (VBM) studies have shown
Table 3.1 Graphemes, colour, and synaesthesia in the brain. Brain region K P MNI (x,y,z) T-val
Non-inducing > False fonts (P<.05FWEcorrected, N=38)
R Supramarginal gyrus/Inf parietal lobule (BA 40) 68 0.001 50, -46, 36 6.15
False fonts > Non-inducing (P<.05FWEcorrected, N=38)
R Fusiform gyrus (BA 37) 1914 0.000 44, -60, -14 11.06
R Middle/Inf occipital gyrus (BA 18/19) 38, -84, -4 8.16
R Fusiform gyrus (BA 37) 34, -48, -22 8.11
L Inferior occipital gyrus (BA 18/19) 913 0.000 -38, -80, -8 8.30
L Fusiform/Inf occipital gyrus (BA 19) -40, -70, -14 7.38
L Cerebellum/L Fusiform gyrus (BA 37) 60 0.001 -34, -42, -30 5.95
L Fusiform gyrus (BA 37) -34, -52, -22 5.53
Coloured > Non-inducing (P<.05FWEcorrected, N=38)
R Fusiform gyrus (BA 37) 1294 0.000 34, -50, -22 10.11
R Fusiform gyrus (BA 19) 32, -76, -16 8.66
R Middle/Inf occipital gyrus (BA 18) 34, -86, -6 7.77
L Fusiform gyrus (BA 19) 1175 0.000 -30, -76, -16 8.89
L Fusiform gyrus (BA 37) -34, -54, -20 7.30
Interaction Synaesthetes > Controls for Synaesthesia > Non-inducing (P<.001unc, SVC)
R Fusiform gyrus (BA 19) 21 0.052 36, -76, -26 4.45
Interaction Synaesthetes > Controls for Synaesthesia > Coloured (P<.001uncorrected)
L Superior parietal lobule (BA 7) 712 0.001 -24, -58, 46 5.03
L Superior Occipital gyrus/Precuneus -22, -70, 38 4.11
L Inferior parietal lobule (BA 40) -42, -44, 48 4.02
fMRI results of localiser Experiment 1 (N=38 (synaesthetes N=19, controls N=19), random effects analyses, extent threshold ≥ 20 voxels, whole brain threshold: see table). Cluster size (k), corrected P-values at cluster-level (p), MNI coordinates of local maxima and T-values are listed. Brodmann areas (BA) are in parentheses. R = right, L = left, Inf = Inferior, SVC = Small Volume Correction.

Synaesthetic colour in the brain: Beyond colour areas
48
increased structural connectivity (Rouw and Scholte, 2007) and increased grey matter density (Weiss and Fink, 2009) in synaesthetes in this region. The cluster in the superior parietal lobule is located within a 5 mm radius of the main effect of synaesthesia in the fMRI study of Weiss et al. (2005).
In our data, the two contrasts involving synaesthesia led to different effects in the brain. The perception of synaesthetic colour led to increased activation in colour area V4. When contrasted against real colour perception, however, the added quality of the synaesthetic colour experience led to more activity in the left superior parietal lobe. Our results support the two-stage or integrated model of Hubbard (2007a; 2007b), in which fusiform gyrus (V4) is proposed to underlie the perception of the synaesthetic colour, while parietal cortex is hypothesised to induce a type of ‘hyperbinding’ that binds the colour and the grapheme. In our view, both regions are equally crucial for synaesthetic experience and we therefore prefer the term ‘integrated’ model. The ongoing processes in
Figure 3.1 Localising graphemes, colour, and synaesthesia in the brain. fMRI results of localiser Experiment 1. A-C. Coronal (left) and axial (right) slices (N=38 at whole brain P<.05FWEcorrected, extent threshold 20 voxels). A. Grapheme areas (false fonts > non-inducing graphemes). B. Colour areas (coloured graphemes > non-inducing graphemes). C. Grapheme (blue) and colour areas (yellow) overlaid. D-E. Effects of synaesthesia, showing positive interactions for synaesthetes (N=19 synaesthetes, N=19 controls), at whole brain P<.001uncorrected, extent threshold 20 voxels. D. Synaesthesia > non-inducing graphemes (dark pixels), coronal (left) and sagittal (right) slices, showing right fusiform gyrus activation. E. Synaesthesia > coloured graphemes (dark pixels), axial (left) and sagittal (right) slices, showing left (and right n.s.) superior parietal lobe activation. Left is depicted on the left. A subsection of this Figure is shown in colour on page 71.

Chapter 3
49
synaesthetic experience are likely to be based on a dynamic interplay between brain areas, and do not involve two clearly separate processing stages. Our parietal effect can be explained in terms of binding of the synaesthetic colour to the grapheme: in the colour condition, synaesthetes and controls needed to bind the physical colour of the non-synaesthetic grapheme to its spatial location (Esterman et al., 2006). But in the synaesthetic condition, no physical colour was present and hence for controls, no binding was necessary. Synaesthetes however did integrate the synaesthetic colour with the grapheme, leading to increased left parietal cortex activity for synaesthetes. We cannot exclude that the parietal effects we observe are due to other processes than binding, but previous findings concerning spatial feature binding in the parietal lobe make our interpretation very likely (Robertson, 2003; Esterman et al., 2006; Muggleton et al., 2007).
Importantly, no task requirements were present in our experiment which means no special focus was placed on any particular feature of the graphemes (e.g. shape, physical or synaesthetic colour). Cohen Kadosh et al. (2007b) have shown that task demands can influence fMRI effects of synaesthesia, an insight which can help to explain differential results of previous studies. In Hubbard et al. (2005b), for example, an italic versus upright discrimination task on the (synaesthesia inducing) graphemes may have enhanced the focus on low-level shape features; effects were predominant in visual areas (V4). In Weiss et al. (2005), participants actively reported synaesthetic experiences, enhancing attention to the synaesthetic quality of the colours; effects were found in left parietal cortex only. In our data we found both colour related (V4) and parietal effects, which illustrates that not only task demands, but also the specific aspect of synaesthesia that is under investigation can influence the outcome of neuroimaging experiments. Effect of projector-associator type As the spatial location of the synaesthetic colours can influence experimental outcomes (Dixon et al., 2004), we tested whether the BOLD effects for the synaesthetic condition differed between the projector-associator (PA) subgroups of the synaesthetes (projectors (N=7), mental screen projectors (N=7), and associators (N=5)). The clusters with effects of synaesthesia in right fusiform gyrus and the left superior parietal lobe (SPL) were used as regions of interest (ROIs). Please note that the ROIs were selected completely independent from subgroup status. Mean parameter estimates of each subject (synaesthesia condition) were calculated for each ROI; for neither ROI did we find a main effect of PA-subgroup (ANOVA, all n.s.), although the associator group showed marginally more activity in the left SPL than the mental screen projectors (F(1,11) = 3.435, P<.094). Materials and Methods: Experiment 2 Priming experiment In Experiment 2, we analysed repetition suppression effects for colour induced by synaesthesia, and investigated the effect of projector-associator status on synaesthesia-related activity.

Synaesthetic colour in the brain: Beyond colour areas
50
Participants All participants of Experiment 1 participated in Experiment 2. Written informed consent was obtained from all participants prior to scanning and the study was approved by the local ethics committee of the Radboud University Nijmegen, in accordance with the Declaration of Helsinki. Experimental design The priming task contained three synaesthetic priming conditions in which the primes induced a synaesthetic colour that was either congruent (CC) or incongruent (IC) compared to the target, or the primes did not induce a synaesthetic colour (NC). We hypothesised the largest BOLD repetition suppression effects (and hence the lowest BOLD response) would occur for the CC condition. The design also contained real colour priming conditions (CC, IC, and NC), of which the prime and target consisted of physically coloured (or achromatic, not coloured) squares; these trials were intermixed with the synaesthetic priming trials. The colour priming results were reported elsewhere (Van Leeuwen et al., submitted (Chapter 2)). Materials For each synaesthete, 4 graphemes that elicited distinct, vivid synaesthetic colours (mainly red, green, blue, and yellow) were selected from the stimuli of Experiment 1 and used as synaesthesia inducing primes in the CC and IC conditions. Four non-inducing graphemes (no synaesthesia) were selected as primes for the NC condition. For 13 synaesthetes, non-alphanumeric symbols (e.g. &, #) were included as non-inducing primes (2.2 (SD = 1.2) on average). Targets consisted of coloured squares in one of the 4 idiosyncratic synaesthetic colours. Control participants received the same stimulus lists as the synaesthete to whom they were matched. Stimulus presentation All grapheme and symbol stimuli were presented in the same manner as the non-coloured stimuli of Experiment 1. The coloured target squares measured 2.1º x 2.1º of visual angle and had a mean luminance of 8.4 cd/m2 (SD = 10.3 cd/m2). Colours were not isoluminant due to their idiosyncratic synaesthetic nature; however, all colours appeared equally often in CC, IC, and NC conditions, ruling out any BOLD effects due to overall luminance differences. Stimuli were presented with the same computer set-up as Experiment 1. Procedure Congruent, incongruent, and non-inducing trials appeared in a ratio of 1:2:1 (48:96:48), yielding 192 trials (and 192 colour condition trials). The 1:2:1 ratio was chosen such that the expectancy of a congruent trial closely matched the expectancy of any target colour (25%), to minimise behavioural strategy effects. Four identical runs were created, each containing 12 CC, 24 IC, and 12 NC trials from both the synaesthetic priming and the colour priming conditions (96 trials per run). Twenty-four null-events (20%, fixation only)

Chapter 3
51
were included in each run to avoid BOLD saturation. Stimuli were pseudo-randomised per run, with maximally 2 repetitions of prime type (CC, IC, or NC) and prime identity, maximally 3 repetitions of the target colour, and maximally 5 repetitions of overall condition (synaesthesia or colour).
In the fMRI experiment, one trial consisted of a prime (displayed for 500 ms), followed by a blank screen (100 ms, light grey background colour) and the target (duration 800 ms), and finally a jittered inter-trial-interval of 4-6 seconds (fixation cross). Participants were instructed to indicate the target colour fast but accurately by responding with the associated finger of their right hand; each colour corresponded to one response button. First, participants completed an offline practice set of 16 items (representing all conditions). Response devices were the keyboard for the practice session and an MR-scanner compatible Lumitouch response box for the fMRI experiment. The fMRI session began with the scans from Experiment 1, followed by two runs of the priming experiment (12 minutes each, 380 images). The final 2 priming runs were completed after a 10 minute break outside of the scanner. Participants wore sound-attenuating headphones and two synaesthetes wore additional earplugs to minimise scanner-induced synaesthesias. Computer version Following the fMRI session, participants completed a computer version of the priming experiment, to verify the behavioural effects obtained in the scanner and to compare the reaction times to the existing literature on synaesthetic priming. Materials and conditions were identical to the fMRI version, but null-events were excluded and the target squares remained on the screen until a response was given (up to a maximum of 4 seconds). Responses were followed by a 1000 ms fixation cross, and then the next trial. Randomisation criteria were unchanged. Four runs of ~5 minutes each were created. Stimuli were presented on a 15 inch iiyama LCD monitor at a viewing distance of 60 cm. The keyboard was used as response device. Image acquisition parameters MR data were collected on the same scanner as the data of Experiment 1. A single shot gradient echo-planar imaging (EPI) sequence was used to acquire functional MR images (33 slices, TE = 30 ms, TR = 2090 ms, flip angle = 80º, 224 mm FOV, 64 x 64 matrix, 3.5 x 3.5 mm voxel size, 3.0 mm slice thickness, 0.5 mm slice gap). Atlas-based registration (AutoAlign, Siemens (Van der Kouwe et al., 2005)) was applied for all EPI runs to ensure the same slice positions across all functional runs (before and after the break) of one subject. The T1 images from Experiment 1 were used as structural scans. Data analysis Behavioural data Reaction time (RT) data were analysed in a mixed design ANOVA. Incorrect trials and outliers (± 2 SD from the subject and condition mean) were excluded from analysis. Where

Synaesthetic colour in the brain: Beyond colour areas
52
the assumption of non-sphericity was violated, Greenhouse-Geisser correction was applied (uncorrected degrees of freedom are reported). Imaging data Functional MR data were preprocessed and analysed according to the same procedure as Experiment 1. The design matrix consisted of six regressors for the experimental conditions (CC, IC, and NC in both conditions), one regressor to model all incorrect trials, and six regressors of no interest for the motion parameters. Events were modelled by the onset of the target squares (event related). Analyses were performed at the whole brain level and the initial threshold for significance was a cluster-level statistic of P<.05FWEcorrected at the whole brain threshold of P<.001uncorrected. We used the grapheme and colour volumes of interest (VOIs) from Experiment 1 to aid in the interpretation of the whole brain effects.
Our research question explicitly addressed whether synaesthetic colour perception takes place in exactly the same brain areas as real colour perception. We therefore also performed region of interest (ROI) analyses in the same ROIs in which we found RS effects for real colour in our previous study (Van Leeuwen et al., submitted (Chapter 2)). ROI analyses are typically more sensitive than whole brain analyses. The three ROIs were located in left anterior fusiform gyrus, BA 37priming (-32,-50,-22), left posterior fusiform BA 19priming (-30,-66,-22), and right anterior fusiform BA 37priming (32,-50,-24). We included three additional ROIs, on the basis of the local maxima of the colour localiser of Experiment 1 (Table 1: coloured > non-synaesthetic graphemes); these ROIs also showed a main effect of real colour priming across the three conditions, and were located in left anterior fusiform BA 37localiser (-34,-54,-20), and right fusiform gyrus BA 37localiser (34,-50,-22) and BA 19localiser (32,-76,-16). ROIs (5 mm radius) were created with MarsBaR (Brett et al., 2002). For each ROI, the mean parameter estimates for each subject and condition were extracted and subjected to statistical analysis. Results: Experiment 2 One participant was excluded from analysis of Experiment 2 because she did not complete the task according to instructions. The remaining 19 synaesthetes and their 19 matched controls were included. Behavioural results RTs were analysed in an ANOVA with the between-subjects factor group (synaesthetes and controls), and the within-subjects factors place (fMRI and computer) and prime type (congruent, incongruent, and non-inducing). Incorrect responses (for percentages see Figure 3.2) and outliers (fMRI: synaesthetes 5.6%, controls 5.8%; computer: synaesthetes 4.6%, controls 4.7%) were removed prior to analysis. We found a main effect of place (F(1,36)=27.8, P<.001), caused by longer RTs in the scanner, but no main effect of group (F(1,36)=2.33, n.s.), thus the overall RTs were comparable across groups. Because no

Chapter 3
53
interactions with place were found for either group, data were collapsed across fMRI and computer sessions.
The collapsed data revealed a highly significant group x prime type interaction (F(2,148)=23.9, P<.001). We found a significant effect of prime type for synaesthetes (F(2,74)=27.5, P<.001), but not for controls (F(2,74)=1.83, n.s.). For synaesthetes the RTs in the congruent colour condition were 79 ms faster than those in the incongruent colour condition (F(1,37)=32.3, P<.001), and 69 ms faster than in the non-inducing condition (F(1,37)=33.2, P<.001). There were no other effects; the data are summarised in Figure 3.2. The pattern of RT effects indicates interference effects for synaesthetes for the IC and NC trials, comparable to previously reported reaction time effects for synaesthesia (Dixon et al., 2000; Mattingley et al., 2001).
The error rates were analysed to check for possible speed-accuracy trade-offs. A prime type x group ANOVA revealed an effect of prime type (F(2,148)=4.23, P<.05): separate group analyses revealed an effect of prime type for the controls only (F(2,74)=3.56, P<.05; synaesthetes F(2,74)=1.06, n.s.). The controls made slightly more errors in the IC condition than in the NC condition: F(1,37)=6.13, P<.05. The increased IC error rate suggests that the control subjects were learning the correct (congruent) prime-target associations during the experiment. fMRI results Whole brain analyses We first ascertained that there were no overall differences between synaesthetes and controls; a group x prime type factorial model revealed no main effect of group (at P<.001uncorrected). It is therefore unlikely that synaesthetes and controls made use of different strategies or that task difficulty affected the groups differently. Next, we tested whether the presence of synaesthesia-inducing primes (in congruent synaesthetic colour and
Figure 3.2 Reaction time effects of synaesthetic priming. RTs for the congruent (CC), incongruent (IC), and non-inducing (NC) conditions of the synaesthetic priming experiment, for synaesthetes (solid bars, N=19) and controls (shaded bars, N=19). Data are collapsed over fMRI and computer sessions. Error percentages are listed for each condition; ± error bars denote the standard error of the mean. ** (P<.001) indicate sign. effects.

Synaesthetic colour in the brain: Beyond colour areas
54
incongruent synaesthetic colour conditions) would lead to a general colour repetition suppression effect compared to the non-inducing primes (NC condition), for synaesthetes. Because repetition suppression would lower the BOLD response for CC and IC conditions, such an effect would lead to relatively higher BOLD activity for the NC condition compared to the combined CC and IC conditions. The interaction and main effects that we found for synaesthetes for this comparison (see Table 3.2) were not located within the pre-defined colour VOI but in the grapheme VOI; hence we cannot claim that synaesthesia induces repetition suppression for colour. The stronger activation for NC trials may be explained by the relatively infrequent occurrence of the individual non-inducing NC
Table 3.2 Synaesthetic priming effects in the brain. Brain region k P MNI (x,y,z) T
Interaction Synaesthetes > Controls for NC > CC&IC
R Superior frontal gryus (BA 9) 270 0.061 20, 34, 38 4.46
R Superior frontal gryus (BA 9) 20, 42, 34 3.86
L Superior frontal gyrus (BA 9/10) 386 0.019 -22, 42, 32 4.42
L Middle frontal gyrus (BA 9/8) -26, 28, 40 3.71
SVC: NC > (CC & IC) for Synaesthetes (grapheme VOI)
R Inferior temporal gyrus (BA 37/19) 257 0.002 48, -72, -8 4.51
R Fusiform/Inferior temporal gyrus (BA 37/20) 48, -56, -18 4.18
R Inferior temporal gyrus (BA 37/20) 48, -54, -22 4.08
L Fusiform/Inferior occipital gyrus (BA 37/19) 41 0.040 -44, -62, -12 3.75
IC > CC for Synaesthetes
R Superior frontal gyrus (BA 6) 886 0.000 26, 0, 52 4.70
R Precentral gyrus (BA 4/6) 44, -20, 58 4.08
R Postcentral gyrus (BA 4/3) 30, -32, 58 3.86
R Superior temporal gyrus (BA 21) 493 0.007 56, -6, -14 4.27
R Middle temporal gyrus (BA 21) 56, 2, -18 4.24
R Hippocampus 38, -12, -24 4.17
fMRI results of synaesthetic priming Experiment 2 (N=19 synaesthetes, N=19 controls). Random effects analyses, extent threshold ≥ 50 voxels, whole brain threshold P<.001uncorrected. Cluster size (k), corrected P-values at cluster-level (p), MNI coordinates of the local maxima and T-values are listed. Brodmann areas (BA) are in parentheses. R = right, L = left, NC = non-inducing condition, CC = congruent synaesthetic colour condition, IC = incongruent synaesthetic colour condition, SVC = Small Volume Correction, VOI = Volume of Interest.
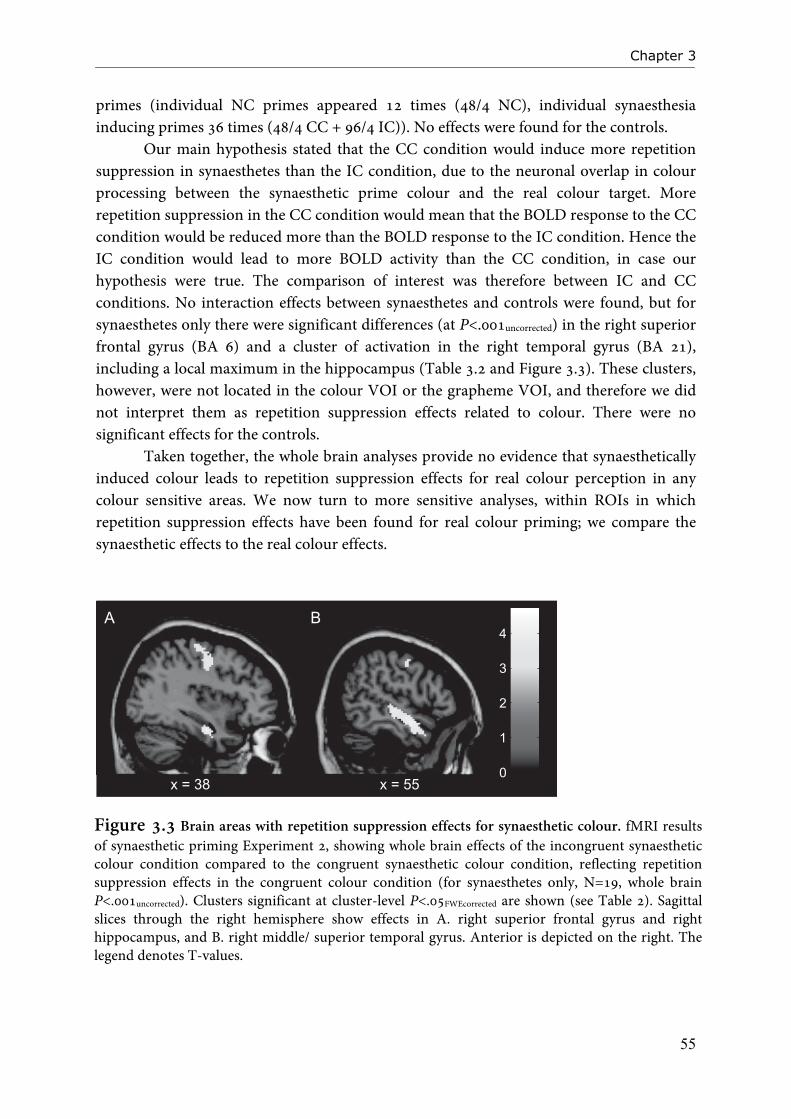
Chapter 3
55
primes (individual NC primes appeared 12 times (48/4 NC), individual synaesthesia inducing primes 36 times (48/4 CC + 96/4 IC)). No effects were found for the controls.
Our main hypothesis stated that the CC condition would induce more repetition suppression in synaesthetes than the IC condition, due to the neuronal overlap in colour processing between the synaesthetic prime colour and the real colour target. More repetition suppression in the CC condition would mean that the BOLD response to the CC condition would be reduced more than the BOLD response to the IC condition. Hence the IC condition would lead to more BOLD activity than the CC condition, in case our hypothesis were true. The comparison of interest was therefore between IC and CC conditions. No interaction effects between synaesthetes and controls were found, but for synaesthetes only there were significant differences (at P<.001uncorrected) in the right superior frontal gyrus (BA 6) and a cluster of activation in the right temporal gyrus (BA 21), including a local maximum in the hippocampus (Table 3.2 and Figure 3.3). These clusters, however, were not located in the colour VOI or the grapheme VOI, and therefore we did not interpret them as repetition suppression effects related to colour. There were no significant effects for the controls.
Taken together, the whole brain analyses provide no evidence that synaesthetically induced colour leads to repetition suppression effects for real colour perception in any colour sensitive areas. We now turn to more sensitive analyses, within ROIs in which repetition suppression effects have been found for real colour priming; we compare the synaesthetic effects to the real colour effects.
Figure 3.3 Brain areas with repetition suppression effects for synaesthetic colour. fMRI results of synaesthetic priming Experiment 2, showing whole brain effects of the incongruent synaesthetic colour condition compared to the congruent synaesthetic colour condition, reflecting repetition suppression effects in the congruent colour condition (for synaesthetes only, N=19, whole brain P<.001uncorrected). Clusters significant at cluster-level P<.05FWEcorrected are shown (see Table 2). Sagittal slices through the right hemisphere show effects in A. right superior frontal gyrus and right hippocampus, and B. right middle/ superior temporal gyrus. Anterior is depicted on the right. The legend denotes T-values.

Synaesthetic colour in the brain: Beyond colour areas
56
Region of interest analyses No significant group x prime type interaction, nor main effect of group were found in any of the 6 ROIs that we tested, but main effects of prime type were present in four ROIs. These were located in left anterior fusiform gyrus (BA 37priming: F(2,72)=6.08, P<.01 and BA 37localiser: F(2,72)=7.81, P<.001) and right anterior fusiform gyrus (BA 37priming: F(2,72)=3.39, P<.05 and BA 37localiser: F(2,72)=4.83, P<.05). Because we hypothesised differential effects would occur for synaesthetes and controls the data were split by group. Surprisingly, there were no effects of prime type for the synaesthetes in any ROI, indicating that the synaesthetic priming manipulation did not affect processing of real colour for synaesthetes. In two ROIs in the left anterior fusiform gyrus we encountered an unpredicted main effect of prime type for the control participants (BA 37priming: (F(2,36)=7.24, P<.01 and BA 37localiser: (F(2,36)=9.53, P<.001). Effects for the controls were driven by increased BOLD responses for the NC condition (see Figure 3.4), most likely due to the relatively infrequent occurrence of the individual primes in the NC condition.
In addition to regular ROI analyses, we also created individual ROIs with maximal colour sensitivity for each subject, to increase sensitivity. On the basis of the contrast of coloured graphemes compared to non-inducing control graphemes from Experiment 1, we successfully determined two ROIs (5 mm radius, one left lateralised, one right lateralised)
Figure 3.4 Region of interest analysis of repetition suppression effects for synaesthetic priming. The mean parameter estimates for ROIs in left anterior fusiform gyrus are plotted for synaesthetes (N=19, solid bars) and controls (N=19, shaded bars). Error bars depict ± the standard error of the mean and * (P<.05) and ** (P<.001) denote significant differences. CC = congruent, IC = incongruent synaesthetic colour condition; NC = non-inducing condition, L = left, fus = fusiform gyrus.
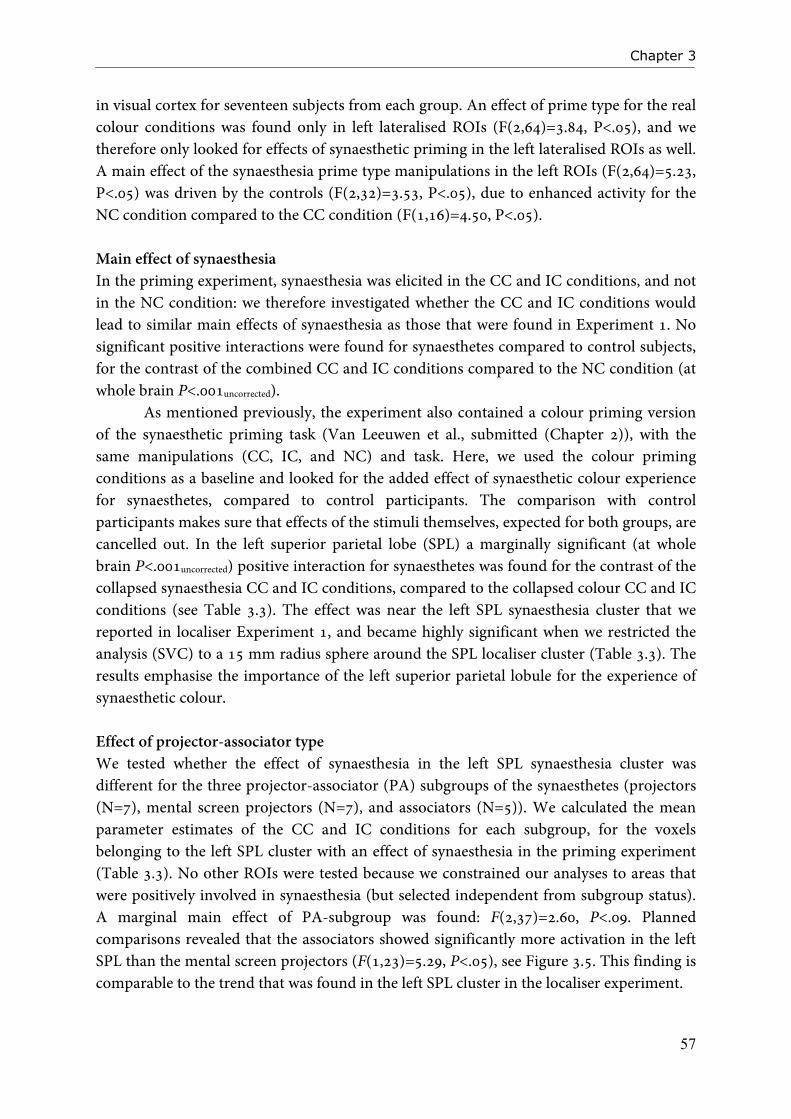
Chapter 3
57
in visual cortex for seventeen subjects from each group. An effect of prime type for the real colour conditions was found only in left lateralised ROIs (F(2,64)=3.84, P<.05), and we therefore only looked for effects of synaesthetic priming in the left lateralised ROIs as well. A main effect of the synaesthesia prime type manipulations in the left ROIs (F(2,64)=5.23, P<.05) was driven by the controls (F(2,32)=3.53, P<.05), due to enhanced activity for the NC condition compared to the CC condition (F(1,16)=4.50, P<.05). Main effect of synaesthesia In the priming experiment, synaesthesia was elicited in the CC and IC conditions, and not in the NC condition: we therefore investigated whether the CC and IC conditions would lead to similar main effects of synaesthesia as those that were found in Experiment 1. No significant positive interactions were found for synaesthetes compared to control subjects, for the contrast of the combined CC and IC conditions compared to the NC condition (at whole brain P<.001uncorrected). As mentioned previously, the experiment also contained a colour priming version of the synaesthetic priming task (Van Leeuwen et al., submitted (Chapter 2)), with the same manipulations (CC, IC, and NC) and task. Here, we used the colour priming conditions as a baseline and looked for the added effect of synaesthetic colour experience for synaesthetes, compared to control participants. The comparison with control participants makes sure that effects of the stimuli themselves, expected for both groups, are cancelled out. In the left superior parietal lobe (SPL) a marginally significant (at whole brain P<.001uncorrected) positive interaction for synaesthetes was found for the contrast of the collapsed synaesthesia CC and IC conditions, compared to the collapsed colour CC and IC conditions (see Table 3.3). The effect was near the left SPL synaesthesia cluster that we reported in localiser Experiment 1, and became highly significant when we restricted the analysis (SVC) to a 15 mm radius sphere around the SPL localiser cluster (Table 3.3). The results emphasise the importance of the left superior parietal lobule for the experience of synaesthetic colour.
Effect of projector-associator type We tested whether the effect of synaesthesia in the left SPL synaesthesia cluster was different for the three projector-associator (PA) subgroups of the synaesthetes (projectors (N=7), mental screen projectors (N=7), and associators (N=5)). We calculated the mean parameter estimates of the CC and IC conditions for each subgroup, for the voxels belonging to the left SPL cluster with an effect of synaesthesia in the priming experiment (Table 3.3). No other ROIs were tested because we constrained our analyses to areas that were positively involved in synaesthesia (but selected independent from subgroup status). A marginal main effect of PA-subgroup was found: F(2,37)=2.60, P<.09. Planned comparisons revealed that the associators showed significantly more activation in the left SPL than the mental screen projectors (F(1,23)=5.29, P<.05), see Figure 3.5. This finding is comparable to the trend that was found in the left SPL cluster in the localiser experiment.
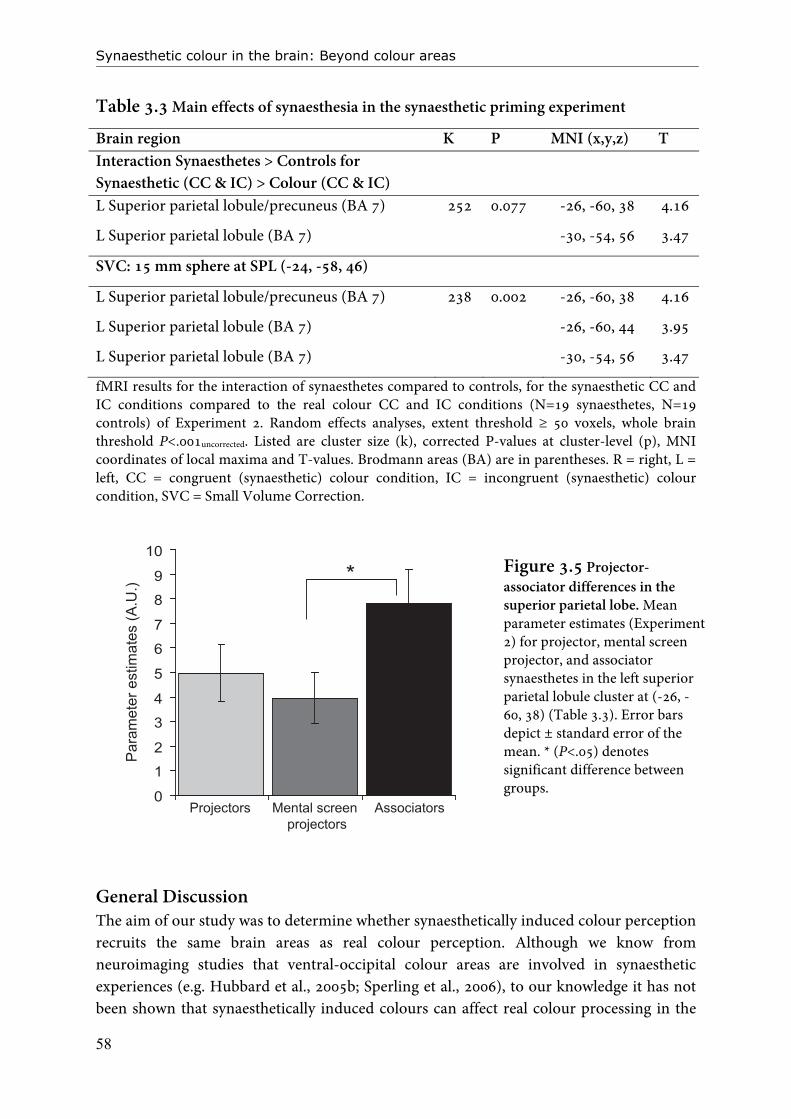
Synaesthetic colour in the brain: Beyond colour areas
58
Table 3.3 Main effects of synaesthesia in the synaesthetic priming experiment
fMRI results for the interaction of synaesthetes compared to controls, for the synaesthetic CC and IC conditions compared to the real colour CC and IC conditions (N=19 synaesthetes, N=19 controls) of Experiment 2. Random effects analyses, extent threshold ≥ 50 voxels, whole brain threshold P<.001uncorrected. Listed are cluster size (k), corrected P-values at cluster-level (p), MNI coordinates of local maxima and T-values. Brodmann areas (BA) are in parentheses. R = right, L = left, CC = congruent (synaesthetic) colour condition, IC = incongruent (synaesthetic) colour condition, SVC = Small Volume Correction.
General Discussion The aim of our study was to determine whether synaesthetically induced colour perception recruits the same brain areas as real colour perception. Although we know from neuroimaging studies that ventral-occipital colour areas are involved in synaesthetic experiences (e.g. Hubbard et al., 2005b; Sperling et al., 2006), to our knowledge it has not been shown that synaesthetically induced colours can affect real colour processing in the
Brain region K P MNI (x,y,z) T Interaction Synaesthetes > Controls for Synaesthetic (CC & IC) > Colour (CC & IC)
L Superior parietal lobule/precuneus (BA 7) 252 0.077 -26, -60, 38 4.16
L Superior parietal lobule (BA 7) -30, -54, 56 3.47
SVC: 15 mm sphere at SPL (-24, -58, 46)
L Superior parietal lobule/precuneus (BA 7) 238 0.002 -26, -60, 38 4.16
L Superior parietal lobule (BA 7) -26, -60, 44 3.95
L Superior parietal lobule (BA 7) -30, -54, 56 3.47
Figure 3.5 Projector-associator differences in the superior parietal lobe. Mean parameter estimates (Experiment 2) for projector, mental screen projector, and associator synaesthetes in the left superior parietal lobule cluster at (-26, -60, 38) (Table 3.3). Error bars depict ± standard error of the mean. * (P<.05) denotes significant difference between groups.

Chapter 3
59
brain. Such an influence would imply the neural machinery is truly shared between synaesthetic and real colours. In our synaesthetic priming experiment we applied a sensitive repetition suppression fMRI paradigm; we hypothesised that synaesthetic colours would reduce the subsequent BOLD response for real colours. We found no effects, and therefore no evidence for shared neural correlates between synaesthetically induced colour and real colour perception.
Behaviourally, the reaction time effects we obtained for synaesthetic priming were of the same order of magnitude (colour: 56 ms, synaesthesia: 79 ms) as previously established colour priming effects in the same subjects (Van Leeuwen et al., submitted (Chapter 2)). It follows that the physical colours of our target stimuli were matched closely enough to the idiosyncratic prime colours induced by synaesthesia to elicit strong behavioural interference. In the brain however, real colour priming induced repetition suppression effects in visual area V4α (Van Leeuwen et al., submitted (Chapter 2)), whereas we did not find any effects for synaesthetic priming, tested with the same number of stimuli and identical task. For synaesthetic priming we performed additional region of interest analyses, but to no avail. In our free viewing localiser experiment (Experiment 1) we did find an effect of synaesthesia in colour area V4. This indicates that V4 was positively involved in synaesthesia in our synaesthetes, and repetition suppression effects could in principle have been induced in the priming experiment. The number of stimuli in the localiser experiment and priming experiment were comparable; a difference in experimental power can therefore not explain the absence of effects in the priming study. The effect that we found for the non-inducing condition in control subjects (due only to frequency effects of the stimuli) also makes a lack of sensitivity unlikely. We therefore accept that synaesthetic colour processing indeed does not influence real colour processing in ventral-occipital areas in the brain.
In the reaction times, we found a priming effect for the congruent synaesthetic colour condition, in accordance with previous findings for synaesthetic priming (e.g. Dixon et al., 2000). The reaction times were faster when the synaesthetically induced colour of the prime matches with the colour of the target. The fact that we did not find repetition suppression effects in visual cortex for this comparison, suggests that the conflict that is induced by the non-matching colours in the incongruent condition is resolved elsewhere in the brain. In this sense, our fMRI data complement earlier behavioural studies that have only assessed reaction times without looking at the neural correlates. In the contrast of the incongruent versus the congruent condition in the brain (see Table 3.2) we observed activations in right superior frontal gyrus (motor-related areas) and right temporal gyrus, areas in which this conflict is possibly resolved. The finding that repetition suppression for stimulus features in sensory cortex can be independent from observable measures like reaction times and response learning has previously been demonstrated by Horner and Henson (Horner and Henson, 2008). In our localiser experiment (Exp. 1), we found increased BOLD activity for synaesthetic colour perception in the fusiform gyrus and increased activity for synaesthetic colour binding processes in left parietal cortex. These results are in line with the proposed
Synaesthetic colour in the brain: Beyond colour areas
60
neural correlates of synaesthesia in the integrated model put forward by Hubbard (2007b; 2007a). We can infer at which level of visual processing the neural correlates of synaesthetically induced colour could be encountered. Although behavioural studies show that synaesthetically induced colours can ‘behave’ like real colour (e.g. Nikolić et al., 2007), many of these studies were case studies, including participants who exhibited very strong, low-level synaesthesia (e.g. Ramachandran and Hubbard, 2001b). This may have resulted in potential overestimation of the perceptual effects of synaesthesia, and therefore of the earliest level of visual processing at which neural correlates of synaesthesia can be identified. In our study, the most low-level neural correlate of synaesthesia that we encountered was extrastriate visual area V4. Even in V4 and V4α, synaesthetically induced colours did not affect BOLD activity in the same way real colours did, implying that the neural machinery that is underlying synaesthetic colour experience is not organised in the same way as the neural machinery underlying real colour perception. Our results suggest that synaesthetic colours are mediated by higher-order (visual) processes, taking place beyond the realm of well-defined visual areas in ventral-occipital cortex. Feedback from these areas may induce V4 activation and the percept of synaesthetic colour, and the left superior parietal lobe most likely has an important role in this process. We propose that the pathways by which synaesthetically induced colour and real colour are processed by the brain are different in nature, even though both may result in V4 activation. Studies of functional and effective connectivity, in which the dynamic interplay between brain areas is modelled, may help to advance our understanding of the nature of the connections between brain areas that are involved in synaesthetic colour experiences. Electroencephalography (EEG) and magnetoencephalography (MEG) may provide valuable information about the time course with which synaesthesia-inducing stimuli are processed, considering that these methods have a very high time resolution. If it is possible to spatially localise the sources of EEG and MEG activity, these methods may also assist in determining the order in which brain regions are recruited during the experience of synaesthesia.
Several of our synaesthetes experienced the colours induced by synaesthesia in a specific spatial location (projectors), whereas for others they resembled strong associations (associators). In the left superior parietal lobule (SPL), we found significantly more activity for associator synaesthetes than for mental screen projectors. This finding is unexpected if one interpreted the spatial component of synaesthesia as reflecting the underlying binding processes to spatial reference frames (Esterman et al., 2006; Muggleton et al., 2007; Ward et al., 2007); for projector synaesthetes, the spatial reference frame of the colour is more explicit and hence may lead to increased BOLD responses. Alternatively, if associator synaesthetes build a spatial reference frame for their synaesthetic colours that differs largely from the way graphemes are presented on the experimental computer screen, the switching between spatial reference frames and increased difficulty in spatial binding may lead to increased SPL activity (Ward et al., 2007). Our data do imply that activity in the left superior parietal lobe is related to these individual differences.

Chapter 3
61
In summary, our data support an integrated model of synaesthesia, and suggest the specific aspect of synaesthesia that is under investigation (colour perception or the specific synaesthetic aspect of the colour) can influence experimental outcomes. The left superior parietal cortex is implied in the spatial reference frame of synaesthesia. Synaesthetically induced colours do not coincide with real colour perception in the brain, which suggests that synaesthetic colour perception is mediated in higher-order (visual) areas. Feedback, caused by either anatomical or functional connectivity, may induce activation of visual area V4. In the future, functional and effective connectivity methods and models may further elucidate the neural underpinnings of synaesthetic colour experiences. Acknowledgements This work was supported by the Volkswagen-Foundation [grant number I/80 743]. We thank all participants for their time and effort in participating, and Cretien van Campen and Tanja Nijboer for assistance with subject recruitment.

Chapter 4 Effective connectivity determines the nature of subjective experience in grapheme-colour synaesthesia: A brief communication
DD I GG I T S
AEIOUY
T H E AA L P H AA B E T
0123456789
V4
SPL
LSA
C O L O U R
B O T T O B O T T O M - - U P P
T O P - T O P - D D O O W N N
R E P E T I T I O N S U P P R E S S I O N
C C M
E G
f M R I
A L P H A
O W E R
S C I L L A T I O N S
BRAIN
PROJE
TORS
ASSOCIATORS
S Y N A E S T H E S I A
Effective connectivity determines the subjective experience of synaesthesia
64
Abstract Synaesthesia provides an elegant model to investigate neural mechanisms underlying individual differences in subjective experience. In grapheme-colour synaesthesia, written letters induce colour sensations, accompanied by activation of colour area V4. Competing hypotheses suggest that enhanced V4 activity during synaesthesia is either induced by direct bottom-up cross-activation from grapheme areas within the fusiform gyrus, or indirectly via higher-order parietal areas. Synaesthetes differ in the way synaesthetic colour is perceived: ‘projector’ synaesthetes experience colour externally co-localised with a presented grapheme, whereas ‘associators’ report an internally evoked association. Using dynamic causal modelling for fMRI we show that V4 cross-activation during synaesthesia was induced via a bottom-up pathway (within fusiform gyrus) in projector synaesthetes, but via a top-down pathway (via parietal lobe) in associators. These findings show how altered coupling within the same network of active regions leads to differences in subjective experience. Our findings reconcile the two most influential cross-activation accounts of synaesthesia. An adapted version of this chapter is accepted for publication as: Tessa M. van Leeuwen, Hanneke E.M. den Ouden, Peter Hagoort (accepted). Effective connectivity determines the nature of subjective experience in grapheme-color synesthesia. Journal of Neuroscience

Chapter 4
65
Although more and more is becoming clear about the neural mechanisms of consciousness (Dehaene et al., 2006), it has remained elusive what it is that determines the subjective content of conscious experience. This phenomenal consciousness is often considered to be the hard problem of consciousness (Block, 2005), also known as the qualia problem. Here, we present a potential mechanism that can explain individual differences in phenomenal consciousness in people with synaesthesia. In synaesthesia, specific sensory stimuli lead to unusual additional experiences; for example, music can elicit a sensation of colour, and words can elicit tastes (Ramachandran and Hubbard, 2001b; Hubbard, 2007a). Theories on the neural basis of synaesthesia focus on aberrant cross-activation between brain areas as a potential cause of these additional experiences (Grossenbacher and Lovelace, 2001; Ramachandran and Hubbard, 2001b; Hubbard, 2007b). We investigate grapheme-colour synaesthesia, where synaesthetes perceive a colour induced by written letters and/or digits (e.g. black letter ‘J’ elicits pink). The idiosyncratic synaesthetic colours appear automatically and remain stable during life. During the experience of grapheme-colour synaesthesia, brain activity is enhanced in retinotopic visual area V4, which is sensitive to colour stimuli, and in the superior parietal cortex (Hubbard et al., 2005; Weiss et al., 2005; van Leeuwen et al., 2010), an area higher up in the processing hierarchy that is involved in multi-modal integration. It is debated whether cross-activation of colour sensitive areas during synaesthesia results from direct influences from grapheme areas on colour areas within the fusiform gyrus (Ramachandran and Hubbard, 2001b), or whether cross-activation is induced indirectly through higher-order multi-modal areas like parietal lobe (Grossenbacher and Lovelace, 2001). One difficulty in distinguishing between possible mechanisms underlying synaesthesia, is that individual differences in the specific nature of the synaesthetic experience have complicated data interpretation. One group of synaesthetes (projectors) experience the colour ‘out there’, i.e. externally co-localised with the grapheme. Another group (associators) report that graphemes evoke a strong internal association of the colour (Dixon et al., 2004), see Figure 4.1. These differences in spatial location of the perceived colour can lead to differences in synaesthesia-induced Stroop interference (Dixon et al., 2004), in parietal lobe activation (van Leeuwen et al., 2010 (Chapter 3)), and in grey matter density in sensory and memory related areas (Rouw and Scholte, 2010). In this study we tested the hypothesis that the different subjective experiences of projectors and associators are due to differences in directed interactions (effective connectivity) within the network of areas involved in grapheme-colour synaesthesia. Nineteen grapheme-colour synaesthetes were scanned, using functional magnetic resonance imaging (fMRI), during free viewing of synaesthesia-inducing graphemes, non-inducing control graphemes, coloured control graphemes, and false font symbols (see Supplementary Methods on page 69). The majority of these synaesthetes were classified as
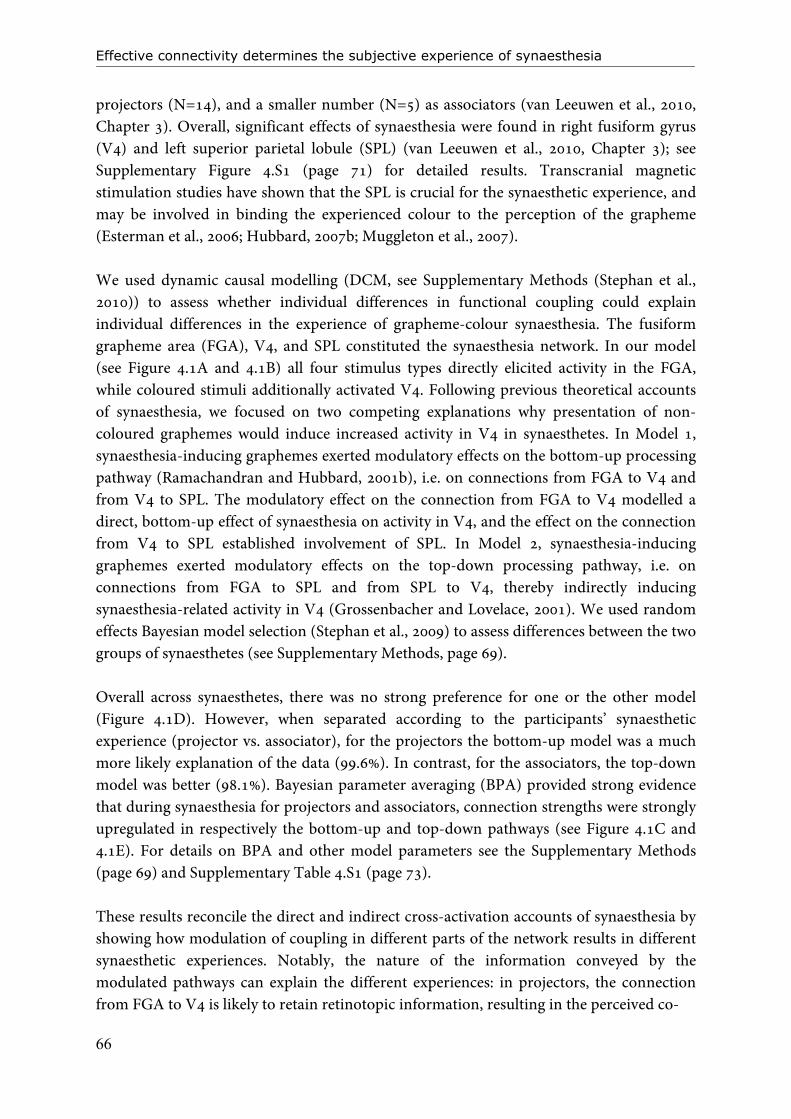
Effective connectivity determines the subjective experience of synaesthesia
66
projectors (N=14), and a smaller number (N=5) as associators (van Leeuwen et al., 2010, Chapter 3). Overall, significant effects of synaesthesia were found in right fusiform gyrus (V4) and left superior parietal lobule (SPL) (van Leeuwen et al., 2010, Chapter 3); see Supplementary Figure 4.S1 (page 71) for detailed results. Transcranial magnetic stimulation studies have shown that the SPL is crucial for the synaesthetic experience, and may be involved in binding the experienced colour to the perception of the grapheme (Esterman et al., 2006; Hubbard, 2007b; Muggleton et al., 2007). We used dynamic causal modelling (DCM, see Supplementary Methods (Stephan et al., 2010)) to assess whether individual differences in functional coupling could explain individual differences in the experience of grapheme-colour synaesthesia. The fusiform grapheme area (FGA), V4, and SPL constituted the synaesthesia network. In our model (see Figure 4.1A and 4.1B) all four stimulus types directly elicited activity in the FGA, while coloured stimuli additionally activated V4. Following previous theoretical accounts of synaesthesia, we focused on two competing explanations why presentation of non-coloured graphemes would induce increased activity in V4 in synaesthetes. In Model 1, synaesthesia-inducing graphemes exerted modulatory effects on the bottom-up processing pathway (Ramachandran and Hubbard, 2001b), i.e. on connections from FGA to V4 and from V4 to SPL. The modulatory effect on the connection from FGA to V4 modelled a direct, bottom-up effect of synaesthesia on activity in V4, and the effect on the connection from V4 to SPL established involvement of SPL. In Model 2, synaesthesia-inducing graphemes exerted modulatory effects on the top-down processing pathway, i.e. on connections from FGA to SPL and from SPL to V4, thereby indirectly inducing synaesthesia-related activity in V4 (Grossenbacher and Lovelace, 2001). We used random effects Bayesian model selection (Stephan et al., 2009) to assess differences between the two groups of synaesthetes (see Supplementary Methods, page 69). Overall across synaesthetes, there was no strong preference for one or the other model (Figure 4.1D). However, when separated according to the participants’ synaesthetic experience (projector vs. associator), for the projectors the bottom-up model was a much more likely explanation of the data (99.6%). In contrast, for the associators, the top-down model was better (98.1%). Bayesian parameter averaging (BPA) provided strong evidence that during synaesthesia for projectors and associators, connection strengths were strongly upregulated in respectively the bottom-up and top-down pathways (see Figure 4.1C and 4.1E). For details on BPA and other model parameters see the Supplementary Methods (page 69) and Supplementary Table 4.S1 (page 73). These results reconcile the direct and indirect cross-activation accounts of synaesthesia by showing how modulation of coupling in different parts of the network results in different synaesthetic experiences. Notably, the nature of the information conveyed by the modulated pathways can explain the different experiences: in projectors, the connection from FGA to V4 is likely to retain retinotopic information, resulting in the perceived co-

Chapter 4
67
SPL
V4
CGG
FGA
SPL
V4
SG
SG
SPL
V4
CGG
FGA
SPL
V4
SG SG
Bottom-up Top-down
A B
V4 to SPL
D E
−0.2 0 0.2 0.4 0.60
2
4
6
8
10
Pro
babi
lity
Den
sity
(AU
)Modulatory conn. (Hz)
FGA to SPL
−0.2 0 0.2 0.80
1
2
3
4
5
Prob
abilit
y D
ensi
ty (A
U)
Modulatory conn. (Hz)0.4 0.6
SPL to V4
−0.2 0 0.2 0.4 0.602468
101214
Pro
babi
lity
Den
sity
(AU
)
Modulatory conn. (Hz)
−0.2 0 0.2 0.4 0.60123456789
Pro
babi
lity
Den
sity
(AU
)
Modulatory conn. (Hz)
ABPROJECTORS ASSOCIATORS
C
ABAB
0 0.2 0.4 0.6 0.8 10
1
2
3
4
5
Pro
babi
lity
Den
sity
rTD (= 1−rBU)
p(rBU>0.5|y) = 0.756
p(rBU>0.5|y) = 0.996
p(rTD>0.5|y) = 0.981
All
Proj
Asso
FGA to V4
fixed connectionmodulatory inputdriving input
location of colour and grapheme. Thus, modulation of the bottom-up pathway explains why projector synaesthesia closely resembles external sensory experience. For associators,
Figure 4.1 Dynamic causal modelling of grapheme-colour synaesthesia. Projector-synaesthesia (left) and associator-synaesthesia (right). (A, B) Two DCMs to test for bottom-up (A, red) versus top-down (B, blue) modulation by synaesthesia-inducing graphemes (SG) within the fusiform grapheme area (FGA) / V4 / superior parietal lobe (SPL) synaesthesia-network (see also Figure 4.S1). G = all grapheme stimuli, CG = coloured graphemes. (D) Bayesian model selection (see Supplementary Methods, p.69): shaded areas represent the probability of the winning model to be better than the alternative model, given the data. rTD = 1-rBU, where r denotes the probability the observed data to be generated by that model given the model space. BU=bottom-up, TD=top-down. (C, E) Posterior probability density plots of the modulatory SG parameters: all parameters are larger than zero with 100.0% confidence (shaded area) across subjects, within each group (projectors N=10, associators N=5). See also Table 4.S1 (p.73).

Effective connectivity determines the subjective experience of synaesthesia
68
V4 is driven via SPL, where spatial information is represented in much less detail; this could explain why colour is not spatially co-located with the grapheme. This experience is reminiscent of visual imagery, in which top-down inputs drive visual areas leading to a representation ‘in the mind’s eye’ (Reddy et al., 2010). Our findings not only reconcile two opposing theories of synaesthesia, but also show that altered connectivity patterns in the brain are accompanied by differences in phenomenal consciousness. We propose that this principle holds beyond synaesthesia per se: the nature of conscious experience may be determined by how brain areas are functionally coupled. It has been demonstrated that synaesthetic experiences adhere to principles of normal perception (Ward et al., 2006b). Factors that determine the phenomenology of synaesthesia may, therefore, hold for perception in general. During mental imagery for example, the imagined scenes or objects do not induce the same vivid percepts as actually viewing them ‘out there’; they appear ‘in the mind’s eye’. This dichotomy in perception is closely reminiscent of the different subjective experiences of projectors and associators. Similar brain regions become active during mental imagery as during normal viewing or hearing; it is even possible to decode object categories (faces, houses) from ventral-temporal cortex during imagery (Stokes et al., 2009; Reddy et al., 2010). Crucially, however, the pathways by which these brain regions are activated differ. During actual perception, primary sensory areas are leading in forwarding information to higher areas, whereas during imagery, memory-based top-down signals are leading in inducing activity in sensory areas (Mechelli et al., 2004). In this study, we showed that even with identical input to the brain, the nature of subjective experiences is greatly affected by whether functional coupling is boosted in a bottom-up or top-down manner: either the percept is really ‘out there’ (bottom-up) or it is located ‘in the mind’s eye’ (top-down). More generally, our findings demonstrate that altered coupling between brain areas can underlie differential perceptual experiences and emphasise the importance of studying functional integration of brain areas. Acknowledgments This study was supported by a research grant from the Volkswagen-Foundation [grant number I/80 743]. We thank Klaas E. Stephan, Floris P. de Lange, and Benedikt Poser for comments on the manuscript.

Chapter 4
69
Supplementary information for Chapter 4
Effective connectivity determines the nature of subjective experience in grapheme-colour synaesthesia Supplementary Methods Supplementary Figure 4.S1 Supplementary Table 4.S1 Supplementary Discussion Supplementary methods Material and methods fMRI experiment The fMRI experiment on the basis of which the DCM analysis was performed is reported and described elsewhere (van Leeuwen et al., 2010 (Chapter 3)); here, we summarise the experimental design and the main outcomes. Nineteen grapheme-colour synaesthetes (mean age 26 ± 4.4 years, 2 men, 2 left-handed) and 19 controls matched on age, sex, education, and handedness (mean age 26 ± 4.7 years) participated. Genuine developmental grapheme-colour synaesthesia was established by an extensive synaesthesia questionnaire that assessed synaesthetic experiences, medical history, and handedness (self-reported hand preference). From the general part of the questionnaire (30 questions on synaesthesia, comprising questions like “How long have you experienced synaesthesia?” and “Did the experience change over time?”), it was determined whether the participants fitted the profile for developmental synaesthesia. Additionally, colour associations for 20 graphemes were retested by phone after 8-13 months. The average consistency score was 91%, which differed significantly from the score of the control participants (32.2%; t(18) = 13.2, p<0.001) (Hochel and Milán, 2008). Nine specific questions on the location and shape of the synaesthetic colours were used to characterise the synaesthetes as projectors or associators: synaesthetes indicated how much they agreed (on a 5-point scale) to sentences that fitted best with either a projector or an associator viewpoint (Rouw and Scholte, 2007). The scores were added for each class and the subjects assigned either a projector or an associator status. All subjects gave written informed consent prior to scanning and the study was approved by the local ethics committee. Idiosyncratic stimuli were selected for each synaesthete. Synaesthesia-inducing graphemes (SG), non-inducing control graphemes (NC), coloured control graphemes (CG), and false font symbols (F) were included in a free-viewing, pseudorandomised block design. There were 8 stimuli per condition and each stimulus was presented in black (except for the CG stimuli) for 1.5 s with an inter-stimulus-interval of 500 ms. This amounted to blocks of 16 seconds of stimulation, interleaved with 10 s rest periods (fixation cross). Each block was repeated 6 times, resulting in 24 blocks in total (11 minutes). MR images were collected with a 3 Tesla Siemens TrioTim MR scanner (EPI
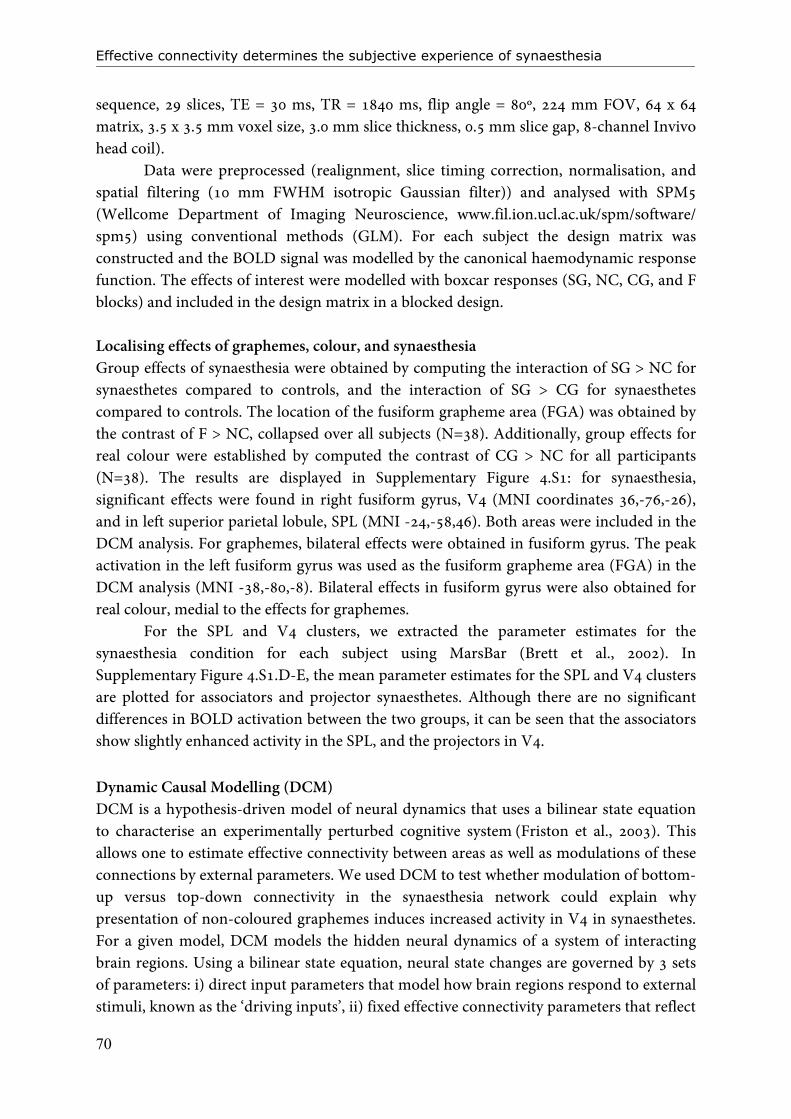
Effective connectivity determines the subjective experience of synaesthesia
70
sequence, 29 slices, TE = 30 ms, TR = 1840 ms, flip angle = 80º, 224 mm FOV, 64 x 64 matrix, 3.5 x 3.5 mm voxel size, 3.0 mm slice thickness, 0.5 mm slice gap, 8-channel Invivo head coil). Data were preprocessed (realignment, slice timing correction, normalisation, and spatial filtering (10 mm FWHM isotropic Gaussian filter)) and analysed with SPM5 (Wellcome Department of Imaging Neuroscience, www.fil.ion.ucl.ac.uk/spm/software/ spm5) using conventional methods (GLM). For each subject the design matrix was constructed and the BOLD signal was modelled by the canonical haemodynamic response function. The effects of interest were modelled with boxcar responses (SG, NC, CG, and F blocks) and included in the design matrix in a blocked design. Localising effects of graphemes, colour, and synaesthesia Group effects of synaesthesia were obtained by computing the interaction of SG > NC for synaesthetes compared to controls, and the interaction of SG > CG for synaesthetes compared to controls. The location of the fusiform grapheme area (FGA) was obtained by the contrast of F > NC, collapsed over all subjects (N=38). Additionally, group effects for real colour were established by computed the contrast of CG > NC for all participants (N=38). The results are displayed in Supplementary Figure 4.S1: for synaesthesia, significant effects were found in right fusiform gyrus, V4 (MNI coordinates 36,-76,-26), and in left superior parietal lobule, SPL (MNI -24,-58,46). Both areas were included in the DCM analysis. For graphemes, bilateral effects were obtained in fusiform gyrus. The peak activation in the left fusiform gyrus was used as the fusiform grapheme area (FGA) in the DCM analysis (MNI -38,-80,-8). Bilateral effects in fusiform gyrus were also obtained for real colour, medial to the effects for graphemes. For the SPL and V4 clusters, we extracted the parameter estimates for the synaesthesia condition for each subject using MarsBar (Brett et al., 2002). In Supplementary Figure 4.S1.D-E, the mean parameter estimates for the SPL and V4 clusters are plotted for associators and projector synaesthetes. Although there are no significant differences in BOLD activation between the two groups, it can be seen that the associators show slightly enhanced activity in the SPL, and the projectors in V4.
Dynamic Causal Modelling (DCM) DCM is a hypothesis-driven model of neural dynamics that uses a bilinear state equation to characterise an experimentally perturbed cognitive system (Friston et al., 2003). This allows one to estimate effective connectivity between areas as well as modulations of these connections by external parameters. We used DCM to test whether modulation of bottom-up versus top-down connectivity in the synaesthesia network could explain why presentation of non-coloured graphemes induces increased activity in V4 in synaesthetes. For a given model, DCM models the hidden neural dynamics of a system of interacting brain regions. Using a bilinear state equation, neural state changes are governed by 3 sets of parameters: i) direct input parameters that model how brain regions respond to external stimuli, known as the ‘driving inputs’, ii) fixed effective connectivity parameters that reflect

Chapter 4
71
D
E
V4
Par
. est
. (A
U)
SPL
y = -70
y = -72
z = 44 x = -24
z = -14
z = -24
Par
. est
. (A
U)
0.00
0.10
0.20
0.30
0.40
0.50
0.60
0.70
Projectors Associators
0.00
0.10
0.20
0.30
0.40
0.50
Projectors Associators
A
B
C
the coupling between modelled regions in the absence of input, the ‘endogenous or intrinsic connections’, and iii) changes of these connections induced by experimental conditions, or the ‘modulatory inputs’. This model of neural dynamics is combined with a haemodynamic model that describes the transformation of neural activity into a BOLD response. More details about DCM can be found elsewhere (Friston et al., 2003; Penny et al., 2004a; Stephan et al., 2008; Stephan et al., 2010).
Figure 4.S1 Functional magnetic resonance imaging results for synaesthesia and grapheme processing. Figure 4.S1 shows the anatomical locations of the group effects of graphemes, colour, and synaesthesia derived from the original fMRI experiment (Chapter 3), on the basis of which the DCM seed regions of the synaesthesia network in Figure 4.1 were chosen. (A) Coronal (left) and axial (right) slices (N=38 at whole brain P<.05FWEcor, extent threshold 20 voxels) showing bilateral fusiform activations for grapheme stimuli (false fonts (F) > non-inducing control graphemes (NC)). (B-C) Effects of synaesthesia, showing positive interactions for synaesthetes (N=19 synaesthetes, N=19 controls), at whole brain P<.001unc, extent threshold 20 voxels. (B) Synaesthesia-inducing graphemes (SG) > NC, coronal (left) and axial (right) slices, depicting activation of V4 in red, overlaid on activation for real colour in bilateral fusiform gyrus in yellow (coloured (CG) > NC, N= 38, P<.05FWEcorr, extent threshold 20). (C) SG > CG graphemes, axial (left) and sagittal (right) slices, showing left superior parietal lobe activation in purple. Left is depicted on the left. (D-E) Mean parameter estimates for projectors and associators in V4 and SPL clusters.

Effective connectivity determines the subjective experience of synaesthesia
72
The posterior probabilities of the parameters from the neural as well as the haemodynamic model are estimated from the measured BOLD data using a Bayesian inversion scheme that rests on an expectation-maximisation algorithm (Friston et al., 2003). The posterior distributions of the estimated parameters can then be used to test hypotheses about connection strengths, context-dependent connectivity changes, or the effect of activity in one region on coupling strength between two other regions. Here, we used Bayesian averaging of the posterior parameter estimates to draw inferences about these posterior distributions across subjects. This method is valid also for small numbers of subjects, where classical statistical approaches are inappropriate. In addition, several models can be compared (e.g. including or excluding a particular connection) to test which estimated model optimally describes the measured BOLD responses, using Bayesian model selection (as described below). DCM specification Based on previous GLM results (van Leeuwen et al., 2010 (Chapter 3)), we constructed a bilinear DCM including the FGA, V4, and SPL (Figure 4.1A and 4.1B). We compared two alternative models, both of which included direct inputs of all graphemes to FGA, and of coloured graphemes to V4. In addition to this basic architecture, the first (bottom-up) model included a connection from FGA to V4, and from V4 to SPL. In this model, the FGAV4SPL pathway was modulated by the synaesthetic experience, to test our hypothesis of bottom-up modulation within the synaesthesia network causing aberrant cross-activation of V4. The second (top-down) model included a connection from FGA to SPL, and reciprocal connections between V4 and SPL. The FGA SPLV4 pathway was modulated by the synaesthetic experience, to test our alternative hypothesis of top-down modulation within the synaesthesia network. Note that comparing DCMs with these connections is not equivalent to testing whether these connections do or do not exist anatomically, but rather whether these connections play a functional role in the process modelled. Following the notation in previous DCM publications (Friston et al., 2003; Stephan et al., 2008), the hidden neural dynamics of the areas x1-n in the tested models are described by the following equation:
CuxBuAdtdx n
j
jj +
+=
=1
)(
Here, x is the state vector, with each state variable representing the population activity in one region of the model (3 regions: FGA, V4, SPL). t is continuous time, and thus dx/dt is the change in activity in areas x over time t. The A-matrix represents the endogenous connection strengths between the modelled regions; x, u are the experimentally controlled inputs. As can be seen in Figure 4.1A and 4.1B, all graphemes and coloured graphemes

Chapter 4
73
enter as external inputs to the system into the FGA and V4 respectively, the weights of which are represented by the C-matrix. Furthermore, the synaesthesia inducing graphemes enter as modulatory inputs, reflected by the B-matrices (Friston et al., 2003).
DCM time series extraction The modelled networks included three areas (FGA, SPL, and V4), from which BOLD time series were extracted on an individual basis, to account for inter-subject variability in the exact locations of the activation maxima. The selection of time series was guided by both functional and anatomical criteria (Stephan et al., 2007). Voxels that exceeded a threshold of p<0.05uncorrected in the respective contrast of the GLM analysis and were located within 16 mm of the group maximum, but within the predefined anatomical gyrus, were included. For the FGA, the contrast of F > NC was used; for V4, the contrast of SG > NC; for SPL, the contrast of SG > CG. To summarise the regional time series, the first eigenvector across all suprathreshold voxels within 5 mm of the selected maximum was computed. Using these functional and anatomical restrictions, time series were extracted for all three areas
Table 4.S1 Probability, mean and variance of model parameters, derived from Bayesian parameter averaging Probability Mean Variance
Bottom-up model (projectors, N=10)
Modulatory connectivity FGA→V4 1.000 0.190 0.0011
Modulatory connectivity V4→SPL 1.000 0.358 0.0020
Fixed connection FGA→V4 1.000 0.194 0.0011
Fixed connection V4→SPL 0.997 0.102 0.0014
Top-down model (associators, N=5)
Modulatory connectivity FGA→SPL 1.000 0.360 0.0033
Modulatory connectivity SPL→V4 1.000 0.362 0.0075
Fixed connection FGA→SPL 1.000 0.427 0.0030
Fixed connection SPL→V4 0.910 0.116 0.0074
Fixed connection V4→SPL 0.992 -0.178 0.0055
Table 4.S1 lists the outcomes of Bayesian parameter averaging (BPA) for all parameters of the DCMs, for the winning model within each group. This table is related to Figure 4.1C and 4.1E, where the distributions of the modulatory connectivity parameters of each model are plotted as posterior probability density plots. We used Bayesian parameter averaging to assess our confidence (probability) that in the winning models, the posterior parameter estimates were different from zero (SPM8, http://www.fil.ion.ucl.ac.uk/spm/ software/spm8/). This effectively boils down to a weighted average of the parameter estimates of each individual, and is therefore valid also for the small sample of 5 associators (as opposed to classical frequentist statistics).
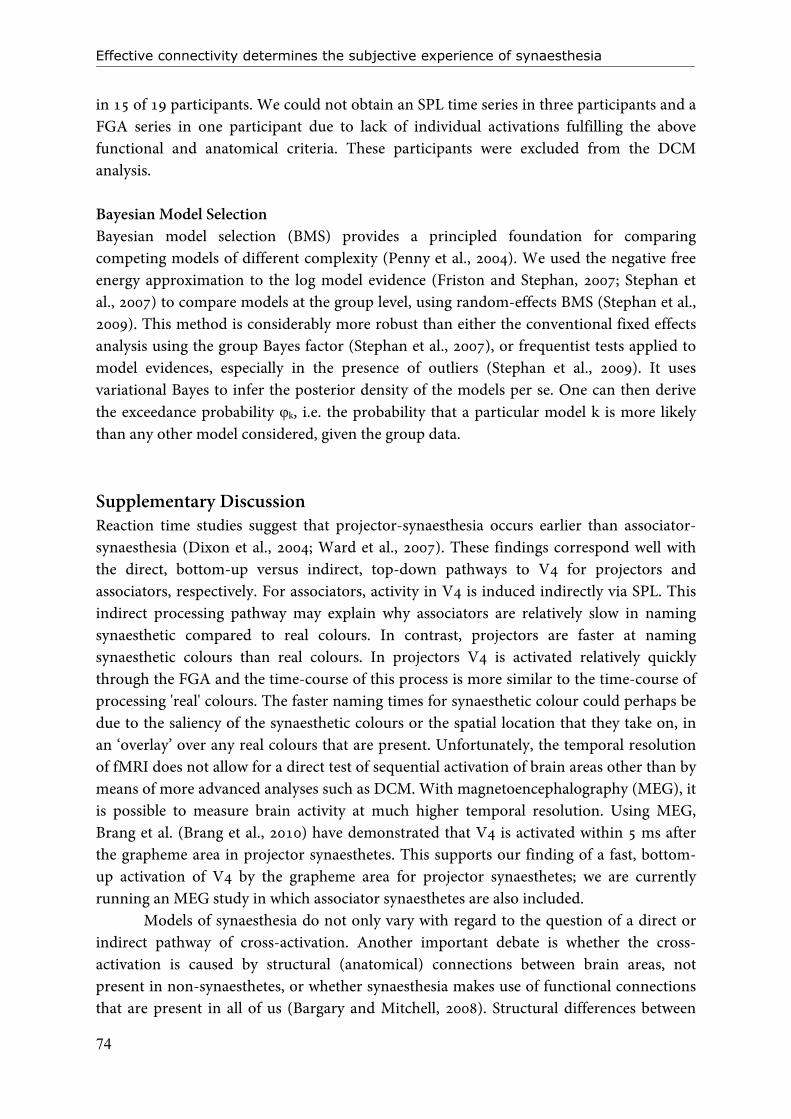
Effective connectivity determines the subjective experience of synaesthesia
74
in 15 of 19 participants. We could not obtain an SPL time series in three participants and a FGA series in one participant due to lack of individual activations fulfilling the above functional and anatomical criteria. These participants were excluded from the DCM analysis. Bayesian Model Selection Bayesian model selection (BMS) provides a principled foundation for comparing competing models of different complexity (Penny et al., 2004). We used the negative free energy approximation to the log model evidence (Friston and Stephan, 2007; Stephan et al., 2007) to compare models at the group level, using random-effects BMS (Stephan et al., 2009). This method is considerably more robust than either the conventional fixed effects analysis using the group Bayes factor (Stephan et al., 2007), or frequentist tests applied to model evidences, especially in the presence of outliers (Stephan et al., 2009). It uses variational Bayes to infer the posterior density of the models per se. One can then derive the exceedance probability φk, i.e. the probability that a particular model k is more likely than any other model considered, given the group data. Supplementary Discussion Reaction time studies suggest that projector-synaesthesia occurs earlier than associator-synaesthesia (Dixon et al., 2004; Ward et al., 2007). These findings correspond well with the direct, bottom-up versus indirect, top-down pathways to V4 for projectors and associators, respectively. For associators, activity in V4 is induced indirectly via SPL. This indirect processing pathway may explain why associators are relatively slow in naming synaesthetic compared to real colours. In contrast, projectors are faster at naming synaesthetic colours than real colours. In projectors V4 is activated relatively quickly through the FGA and the time-course of this process is more similar to the time-course of processing 'real' colours. The faster naming times for synaesthetic colour could perhaps be due to the saliency of the synaesthetic colours or the spatial location that they take on, in an ‘overlay’ over any real colours that are present. Unfortunately, the temporal resolution of fMRI does not allow for a direct test of sequential activation of brain areas other than by means of more advanced analyses such as DCM. With magnetoencephalography (MEG), it is possible to measure brain activity at much higher temporal resolution. Using MEG, Brang et al. (Brang et al., 2010) have demonstrated that V4 is activated within 5 ms after the grapheme area in projector synaesthetes. This supports our finding of a fast, bottom-up activation of V4 by the grapheme area for projector synaesthetes; we are currently running an MEG study in which associator synaesthetes are also included. Models of synaesthesia do not only vary with regard to the question of a direct or indirect pathway of cross-activation. Another important debate is whether the cross-activation is caused by structural (anatomical) connections between brain areas, not present in non-synaesthetes, or whether synaesthesia makes use of functional connections that are present in all of us (Bargary and Mitchell, 2008). Structural differences between
Chapter 4
75
the brains of synaesthetes and controls have been demonstrated for white matter tracts (Rouw and Scholte, 2007) as well as for grey matter density (Weiss and Fink, 2009; Rouw and Scholte, 2010) and/or volume (Jäncke et al., 2009) in fusiform gyrus and parietal cortex (Weiss and Fink, 2009; Rouw and Scholte, 2010), favouring the view that synaesthesia is caused by anatomical differences in the brain. However, it is not clear whether these anatomical differences precede or follow synaesthetic experiences: are they the cause or the consequence? Although our DCM models are inspired by plausible neurophysiological principles, they do not require strong assumptions about the substrate of the connections, i.e. whether these are anatomical or functional (Stephan et al., 2010). Therefore, this study cannot solve the debate whether changes in synaesthesia are purely functional, i.e. the anatomical network is the same, or whether there are structural differences in the network compared to non-synaesthetes (Bargary and Mitchell, 2008). The present study is the first to investigate changes in effective connectivity in synaesthesia, showing that alternative pathways of V4 activation lead to individual differences between synaesthetes. Interestingly, it was recently reported that projector synaesthetes exhibit increased gray matter compared to associators in brain regions related to sensory experiences (visual cortex, auditory cortex), while associators show increased gray matter in memory and multisensory related regions (hippocampus and angular gyrus) (Rouw and Scholte, 2010). Increased gray matter density in sensory areas for projector synaesthetes fits well with our finding that a bottom-up pathway is boosted during projector-synaesthesia. Likewise, for associators, memory related areas could be involved in the top-down boosting of the SPL by synaesthesia. The current findings describe detailed functional interactions between the different brain areas involved in synaesthesia, providing a functional role for the reported structural changes. We emphasize that the same network of brain regions is important for inducing synaesthesia in both projectors and associators, but that the directive interactions between these regions leads to the crucial difference in subjective experience. In order to elucidate the neural mechanisms of synaesthesia is it not only important to indicate which regions are active during the synaesthetic experience, but it is essential to show how these regions interact. Hubbard has proposed that pre-existing anatomical differences can explain differences in conscious experience (Hubbard, 2007b). We argue that differential patterns of functional connectivity, incorporating different brain areas in the information pathway, can do just that, although we do not exclude the possibility that different patterns of functional connectivity can eventually lead to associated anatomical differences. In our study, we have focused on the distinction between associator and projector synaesthetes, related to the spatial location of the concurrent colours that are experienced in grapheme-colour synaesthesia. A ‘higher versus lower’ classification of grapheme-colour synaesthetes also exists (Hubbard and Ramachandran, 2005), independent from the projector-associator distinction (Ward et al., 2007). Here, synaesthetes are divided according to the stage of grapheme processing at which their synaesthesia is elicited. For ‘lower’ synaesthetes, the synaesthetic colours are believed to be induced relatively early, even before recognition of the grapheme is complete (perceptual level). In ‘higher’
Effective connectivity determines the subjective experience of synaesthesia
76
synaesthetes, the colour is not believed to occur before recognition of the grapheme is (almost) complete (conceptual level). Evidence that synaesthesia is elicited at the conceptual level is based on the observation that for the majority of synaesthetes, the meaning of a grapheme determines its colour. For instance in ambiguous figures, (e.g. shapes that can be read as S or 5) the top-down interpretation of the grapheme determines which colour is perceived (Dixon et al., 2006). There is consensus that only a small percentage of grapheme-colour synaesthetes are actually lower synaesthetes (Hubbard and Ramachandran, 2005). In our study, only 2 out of 15 participants (both projectors) reported some characteristics of lower synaesthesia. Because of this small sample, we did not investigate the higher-lower distinction in our dataset. Currently, we have modelled FGA to represent the grapheme ‘recognition’ process and implicitly also model all processes that are associated with the function of FGA and might influence its activity; e.g. early visual areas, language areas. We can, however, speculate about how our effective connectivity models could also apply to lower synaesthetes. Hubbard and Ramachandran (Hubbard and Ramachandran, 2005) have hypothesised that for lower synaesthetes, cross-activation may occur between adjacent regions of the fusiform gyrus, whereas for higher synaesthetes, cross-activation may occur in parietal cortex (angular gyrus). In this paper, we show evidence that this hypothesis holds for the projector-associator distinction. However, within the framework of our bottom-up DCM model we can also accommodate the early sensory effects that occur in lower synaesthesia, such as the induction of apparent motion by synaesthetic colour (Kim et al., 2006) and differences in the vividness of synaesthesia across the visual field (Brang and Ramachandran, 2010). For lower synaesthetes, the cross-activation from the FGA to V4 could take place at a much earlier stage in the visual analysis of graphemes than for higher synaesthetes. In this situation, before grapheme recognition is complete, neurons that code for the shape of the grapheme could already induce activity in V4, leading to early sensory effects of the induced colours. We propose that for both projector and associator synaesthetes, the superior parietal lobe plays an important role in the establishment of synaesthesia. As can be seen in Figure 4.S1D and 4.S1E, V4 and the SPL show activation for both groups of synaesthetes, although there are small (n.s.) differences in overall activation between the groups. The SPL has been implicated in spatial binding of colour to form (Robertson, 2003), and also in the spatial reference frame of synaesthesia (Esterman et al., 2006; Muggleton et al., 2007). Transcranial magnetic stimulation (TMS) studies have shown that disruption of brain activity in the right parietal lobe abolishes interference effects of synaesthesia in a Stroop task (Esterman et al., 2006; Muggleton et al., 2007). This suggests that without contribution of the SPL, synaesthesia is not fully established, possibly because the final binding of the colours to the grapheme is not completed. This binding process would take place through convergence of information from the FGA and from V4 as is the case during normal processes of colour and form perception (Robertson, 2003). Our different model preferences for projectors and associators fit very well with a role of the SPL in spatial binding processes and hence in determining the spatial reference frame of synaesthetic
Chapter 4
77
colours. In case of projectors, the activity in V4 is established through activation of the FGA. Next, the grapheme and its associated colour are bound to the same spatial location in the SPL, similar to the binding process for a physically coloured grapheme; the information reaches the SPL through the same bottom-up channels. In case of associators, the enhanced activity in the SPL results in V4 activation, most likely due to excessive feedback that leaks to V4. The induced colours are then bound in the SPL, to an internally, top-down generated copy of the grapheme, similar to processes of mental imagery. Dependent on the available information, SPL is crucial to determine the spatial reference frame of synaesthetic experiences in both projectors and associators. Synaesthesia can provide valuable insights into normal processes of sensory integration. Our brain is continuously combining all incoming information into a plausible interpretation (Robertson, 2003), a process that can go awry if incoming information is not congruent. An example is the McGurk effect (McGurk and Macdonald, 1976), where different syllables are heard and viewed at the same time, leading to the perception of a third ‘illusory’ syllable. Similarly, ventriloquist (Bonath et al., 2007) and audiovisual (double flash) illusions (Shams et al., 2002) stem from a ‘best interpretation’ approach of our multi-sensory brain. Synaesthesia illustrates that available information is incorporated into an interpretation, regardless of the way in which this information is generated; i.e., as long as there is sufficient evidence for an event, like activity in V4 signaling the presence of colour, the evidence is incorporated. We now show that the manner in which the information arrives at the integrating level (for synaesthesia, it is the SPL), determines how it is perceived. We propose that if feedback and feedforward connections in the brain are misbalanced, leading to an altered flow of information, perception can also be affected. Schizophrenia may be an example of a disorder in which the boundaries between reality and imagery are faded. Our findings may be of use in the field of sensory substitution (or acquired synaesthesia), where the loss of one sense (e.g. vision) is compensated by substituting it by another (e.g. auditory information). The goal of sensory substitution for the blind is to induce veridical perception through auditory stimulation (Proulx et al., 2008; Ward and Meijer, 2010): we predict that if the auditory information is gated through a bottom-up pathway, including sensory areas, veridical perception is possible.


Chapter 5 Altered colour processing as indicated by alpha band oscillations can provide an explanation for grapheme-colour synaesthesia
D I GG I T S
AEI
UY
T H E AA L P H AA B E T
0123456789
V4
SPL
LSA
C O L O U R O L O U R
B O T T O M - U P
T O P - D D O W N
R E P E T I T I O N S U P P R E S S I O N
C M
E E G
A L L P P H H A O O W E E R
O S C I L L O S C I L L A T I O N S T I O N S
BRAIN
PROJE
TORS
ASSOCIAT
RS
f M R I
S Y N A E S T H E S I A
Synaesthesia and alpha band oscillations
80
Abstract People with grapheme-colour synaesthesia perceive colour when they read specific letters or digits. A proposed mechanism is disinhibited feedback, leading to cross-activation of brain areas that process colour and those that process shape. We used magnetoencephalography (MEG) to assess the role of oscillations in the alpha band (8-12 Hz) in synaesthesia. Synchronised alpha oscillations (increase in alpha power) have been linked to functional inhibition. In a cuing paradigm 11 synaesthetes and 11 matched controls covertly attended one of two grapheme stimuli positioned left and right of central fixation. A non-coloured grapheme (not inducing synaesthesia and displayed in dark gray) was always paired with a physically coloured, a synaesthesia-inducing, or a second non-coloured grapheme. After a sustained attention period, participants reported a colour change (validly or invalidly cued). This colour could be congruent or incongruent with the synaesthetes’ colour percept. As expected, in the non-coloured condition attentional allocation decreased reaction times for the validly cued side, accompanied by an alpha lateralisation in both synaesthetes and controls. Reaction times confirmed colour congruency effects due to synaesthesia for synaesthetes only. Synaesthetes and controls showed qualitatively different alpha lateralisation for coloured stimuli. While controls showed a general decrease in alpha power contralateral and ipsilateral to the coloured input, synaesthetes showed a specific decrease in alpha power contralateral to the location of the coloured stimulus (real or synaesthetic colour), and an ipsilateral alpha power increase. Importantly, lateralisation occurred also when the coloured stimulus was not cued, indicating that colour guides attention in synaesthetes and overrides cue information. This was confirmed by the reaction times. Finally, the stronger the observed alpha lateralisation, the stronger was the manifestation of synaesthesia. Our results show a qualitative difference in colour processing between synaesthetes and controls. We hypothesise that the location-specific, automatic shift of attention for colour in synaesthetes can possibly facilitate coupling of grapheme and colour during the development of synaesthesia. An adapted version of this chapter is submitted as: Tessa M. van Leeuwen*, Barbara F. Händel*, Peter Hagoort. Altered color processing as indicated by alpha band oscillations can provide an explanation for grapheme-color synesthesia. *equal contributors

Chapter 5
81
Introduction In people with grapheme-colour synaesthesia, the percept of a specific letter or digit causes the additional experience of colour, e.g. the letter J might elicit the colour orange. The colour percept is automatic, involuntary, and idiosyncratic (stable over time); this can be experimentally confirmed by Stroop-like reaction time tests of colour interference (Wollen and Ruggiero, 1983) and tests of the consistency of the colour associations over time (e.g. Baron-Cohen et al., 1987; van Leeuwen et al., 2010 (Chapter 3)). Enhanced brain activity during the experience of grapheme-colour synaesthesia has been reported in retinotopic visual area V4 which is sensitive to colour (Nunn et al., 2002; Hubbard et al., 2005b; Sperling et al., 2006; van Leeuwen et al., 2010). Superior parietal cortex is also involved (Weiss et al., 2005; Esterman et al., 2006; Muggleton et al., 2007; van Leeuwen et al., 2010), an area associated with multi-modal integration (Corbetta et al., 1995; Robertson, 2003). Although involvement of colour area V4 and the superior parietal cortex are important for establishing synaesthesia, it is less clear how activation in these regions is instantiated. It has been proposed that aberrant cross-activation underlies synaesthetic colour experience (Brang et al., 2010; van Leeuwen et al., accepted (Chapter 4)) and at least two possible mechanisms of cross-activation have been discussed. Ramachandran and Hubbard (2001b) propose that synaesthetes possess increased anatomical connections between the grapheme area and colour processing area in ventral-occipital cortex (Ramachandran and Hubbard, 2001a; Rouw and Scholte, 2007; Brang et al., 2010). The anatomical connection is hypothesised to lead to additional activation of the colour area in case the grapheme area is stimulated. A second hypothesis states that reduced inhibition (disinhibition) between brain areas could lead to increased or altered functional connectivity resulting in the experience of synaesthesia (Grossenbacher and Lovelace, 2001). The disinhibition model proposes that no abnormal anatomical pathways are necessary, but functional changes in inhibition lead to activation of additional brain areas: after information is combined in higher-order areas, excess feedback signals are generated (disinhibition). In case of grapheme-colour synaesthesia the excess feedback would lead to aberrant activation of colour area V4. Parietal cortex is an important multi-modal candidate area (Robertson, 2003; Esterman et al., 2006; Muggleton et al., 2007). In a variant of the disinhibition hypothesis, Smilek et al. (2001) have proposed that reentrant processing within the fusiform gyrus could lead to the percept of colour. During grapheme processing in anterior sections of the fusiform gyrus, information would be relayed to the posterior fusiform gyrus where colour is being processed. The reentrant hypothesis does not require the involvement of higher-order multi-modal areas. Neuroimaging evidence exists for both mechanisms of cross-activation. Diffusion tensor imaging and voxel-based morphometry analyses have revealed that there are anatomical differences in the brains of synaesthetes (Rouw and Scholte, 2007; Jäncke et al., 2009; Weiss and Fink, 2009; Rouw and Scholte, 2010). It has also been demonstrated, however, that synaesthesia can be induced in ‘normal’ controls by means of posthypnotic suggestion (Cohen Kadosh et al., 2009), by training letter-colour associations (Meier and Rothen, 2009), or by application of drugs (Hartman and Hollister, 1963; Aghajanian and

Synaesthesia and alpha band oscillations
82
Marek, 1999). These findings suggest that no abnormal anatomical connections are required to elicit synaesthesia. Synaesthetic experiences often resemble normal cross-modal associations such as pitch→lightness, which provides additional support for this view (Ward et al., 2006b). The question remains whether anatomical differences are the cause or the consequence of synaesthesia. Here, we focus on the role of inhibitory processes in the mechanisms underlying grapheme-colour synaesthesia. With functional magnetic resonance imaging (fMRI), it is difficult to distinguish whether activity is due to reduced inhibition or increased excitation. FMRI only provides information whether there is activity in a certain region or not; testing how this activity is modulated often requires specific hypotheses about the brain regions involved (Stephan et al., 2010). We therefore made use of magnetoencephalography (MEG), a measure with high temporal resolution. This enabled us to analyse specific oscillatory activity in the brain which has been argued to reflect inhibitory processes.
The oscillatory rhythm that has been linked to functional inhibition is the alpha rhythm, with a frequency around 10 Hz (Berger, 1929). There is strong evidence that synchronised alpha oscillations (leading to alpha power increases) can reflect active inhibition of task-irrelevant regions (for a review, see e.g. Klimesch et al., 2007). For instance, Fu et al. (2001) and Foxe et al. (1998) used an intermodal selective attention paradigm. They demonstrated that a cue, indicating an upcoming auditory stimulus, increased alpha activity over the parieto-occipital cortex in comparison to a cue indicating a visual target. Increases in alpha power have also been demonstrated over task-irrelevant regions during the retention period in visual (Jensen et al., 2002; Jokisch and Jensen, 2007) and auditory (Van Dijk et al., 2010) working memory tasks. Within the same sensory domain alpha power lateralises dependent on the location of relevant input. When covert visual attention is spatially directed and stimuli in the other visual hemifield have to be ignored, alpha power in occipital areas is increased contralaterally to the to-be-ignored stimuli, i.e. over task-irrelevant regions (Worden et al., 2000; Yamagishi et al., 2003; Kelly et al., 2006; Rihs et al., 2007). Haegens et al. (2010) showed an increase over somatosensory areas ipsilateral to the hand to which the task-specific somatosensory stimulation was applied.
A second line of evidence suggesting that alpha oscillations reflect inhibition is that modulation of alpha power is negatively correlated with perception. Low prestimulus alpha activity in visual areas is paralleled by good perceptual performance and fast reaction times in visual detection tasks, and vice versa (Ergenoglu et al., 2004; Thut et al., 2006; Hanslmayr et al., 2007; Van Dijk et al., 2008; Zhang et al., 2008). Moreover, elevated alpha power prior to stimulus onset can predict errors on a go-nogo task (Mazaheri et al., 2009). Within the visual domain there is strong evidence that the lateralisation of alpha power comprises an active increase in alpha power that inhibits processing of irrelevant items, associated with lower performance (Händel et al., in press). Transcranial magnetic stimulation (TMS) studies further support the link between alpha power and inhibition. It was shown that the excitability of the cortex as probed by TMS-induced phosphenes depends on alpha power; low pre-stimulation alpha led to more reliable perception of
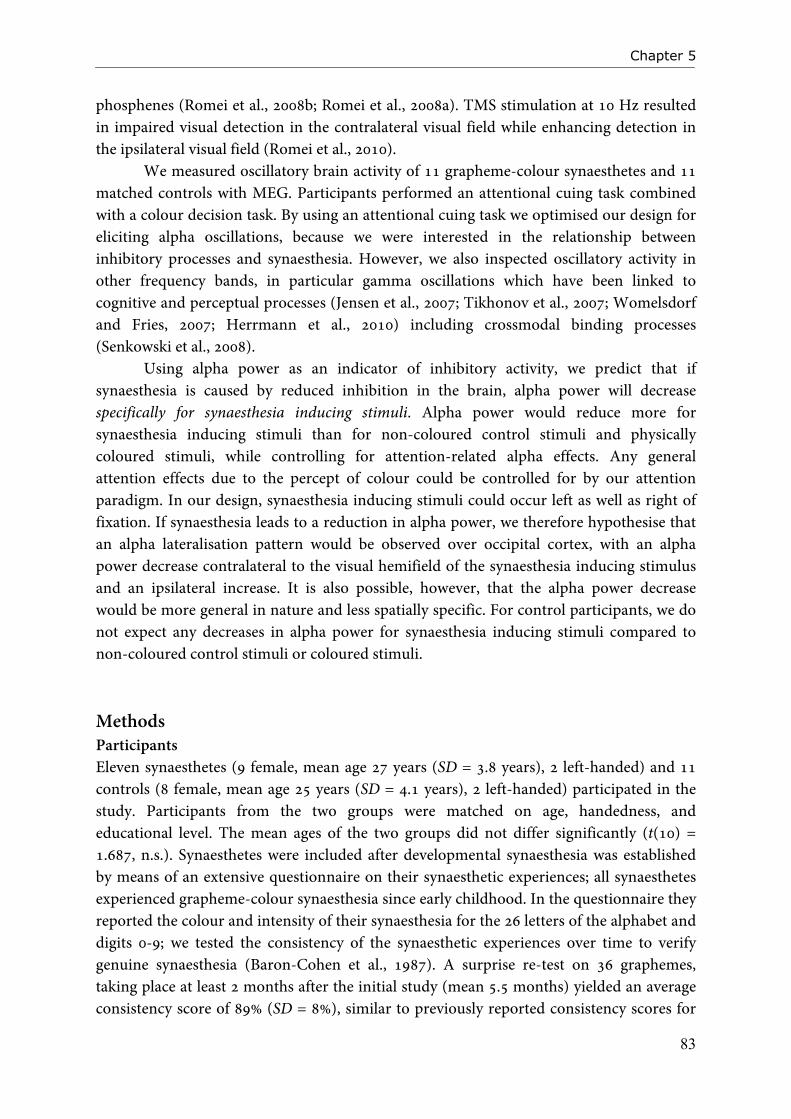
Chapter 5
83
phosphenes (Romei et al., 2008b; Romei et al., 2008a). TMS stimulation at 10 Hz resulted in impaired visual detection in the contralateral visual field while enhancing detection in the ipsilateral visual field (Romei et al., 2010).
We measured oscillatory brain activity of 11 grapheme-colour synaesthetes and 11 matched controls with MEG. Participants performed an attentional cuing task combined with a colour decision task. By using an attentional cuing task we optimised our design for eliciting alpha oscillations, because we were interested in the relationship between inhibitory processes and synaesthesia. However, we also inspected oscillatory activity in other frequency bands, in particular gamma oscillations which have been linked to cognitive and perceptual processes (Jensen et al., 2007; Tikhonov et al., 2007; Womelsdorf and Fries, 2007; Herrmann et al., 2010) including crossmodal binding processes (Senkowski et al., 2008). Using alpha power as an indicator of inhibitory activity, we predict that if synaesthesia is caused by reduced inhibition in the brain, alpha power will decrease specifically for synaesthesia inducing stimuli. Alpha power would reduce more for synaesthesia inducing stimuli than for non-coloured control stimuli and physically coloured stimuli, while controlling for attention-related alpha effects. Any general attention effects due to the percept of colour could be controlled for by our attention paradigm. In our design, synaesthesia inducing stimuli could occur left as well as right of fixation. If synaesthesia leads to a reduction in alpha power, we therefore hypothesise that an alpha lateralisation pattern would be observed over occipital cortex, with an alpha power decrease contralateral to the visual hemifield of the synaesthesia inducing stimulus and an ipsilateral increase. It is also possible, however, that the alpha power decrease would be more general in nature and less spatially specific. For control participants, we do not expect any decreases in alpha power for synaesthesia inducing stimuli compared to non-coloured control stimuli or coloured stimuli. Methods Participants Eleven synaesthetes (9 female, mean age 27 years (SD = 3.8 years), 2 left-handed) and 11 controls (8 female, mean age 25 years (SD = 4.1 years), 2 left-handed) participated in the study. Participants from the two groups were matched on age, handedness, and educational level. The mean ages of the two groups did not differ significantly (t(10) = 1.687, n.s.). Synaesthetes were included after developmental synaesthesia was established by means of an extensive questionnaire on their synaesthetic experiences; all synaesthetes experienced grapheme-colour synaesthesia since early childhood. In the questionnaire they reported the colour and intensity of their synaesthesia for the 26 letters of the alphabet and digits 0-9; we tested the consistency of the synaesthetic experiences over time to verify genuine synaesthesia (Baron-Cohen et al., 1987). A surprise re-test on 36 graphemes, taking place at least 2 months after the initial study (mean 5.5 months) yielded an average consistency score of 89% (SD = 8%), similar to previously reported consistency scores for
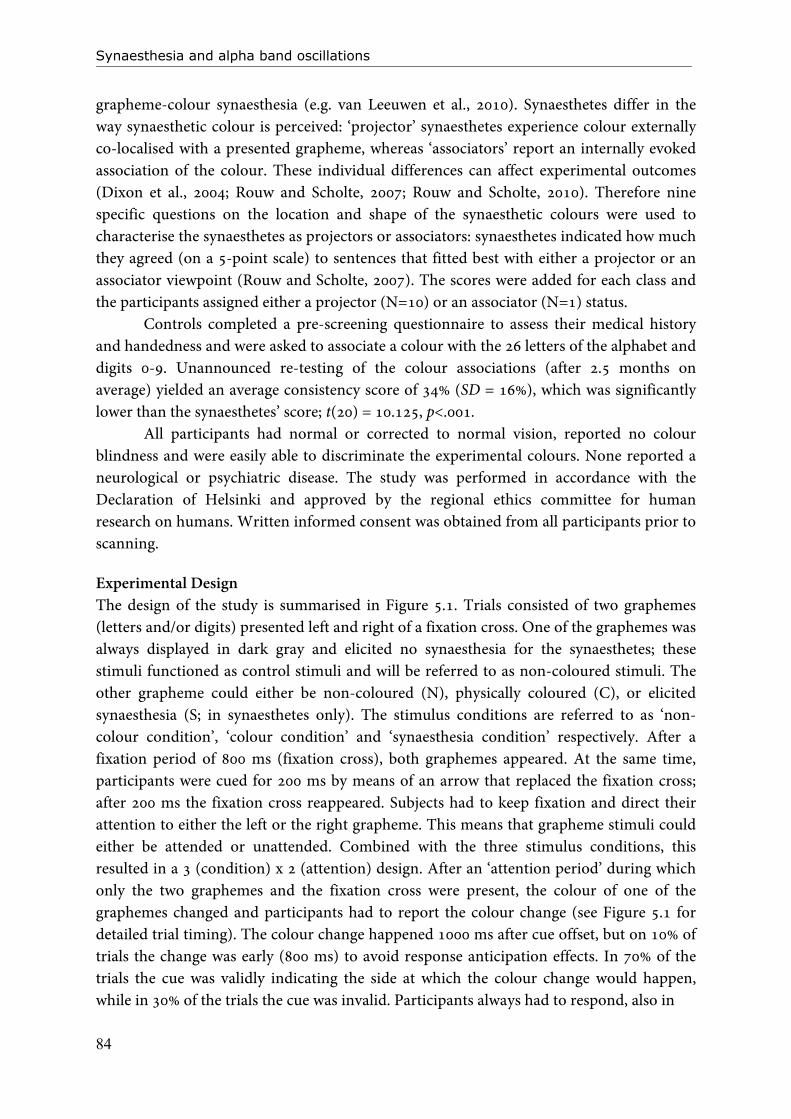
Synaesthesia and alpha band oscillations
84
grapheme-colour synaesthesia (e.g. van Leeuwen et al., 2010). Synaesthetes differ in the way synaesthetic colour is perceived: ‘projector’ synaesthetes experience colour externally co-localised with a presented grapheme, whereas ‘associators’ report an internally evoked association of the colour. These individual differences can affect experimental outcomes (Dixon et al., 2004; Rouw and Scholte, 2007; Rouw and Scholte, 2010). Therefore nine specific questions on the location and shape of the synaesthetic colours were used to characterise the synaesthetes as projectors or associators: synaesthetes indicated how much they agreed (on a 5-point scale) to sentences that fitted best with either a projector or an associator viewpoint (Rouw and Scholte, 2007). The scores were added for each class and the participants assigned either a projector (N=10) or an associator (N=1) status. Controls completed a pre-screening questionnaire to assess their medical history and handedness and were asked to associate a colour with the 26 letters of the alphabet and digits 0-9. Unannounced re-testing of the colour associations (after 2.5 months on average) yielded an average consistency score of 34% (SD = 16%), which was significantly lower than the synaesthetes’ score; t(20) = 10.125, p<.001. All participants had normal or corrected to normal vision, reported no colour blindness and were easily able to discriminate the experimental colours. None reported a neurological or psychiatric disease. The study was performed in accordance with the Declaration of Helsinki and approved by the regional ethics committee for human research on humans. Written informed consent was obtained from all participants prior to scanning. Experimental Design The design of the study is summarised in Figure 5.1. Trials consisted of two graphemes (letters and/or digits) presented left and right of a fixation cross. One of the graphemes was always displayed in dark gray and elicited no synaesthesia for the synaesthetes; these stimuli functioned as control stimuli and will be referred to as non-coloured stimuli. The other grapheme could either be non-coloured (N), physically coloured (C), or elicited synaesthesia (S; in synaesthetes only). The stimulus conditions are referred to as ‘non-colour condition’, ‘colour condition’ and ‘synaesthesia condition’ respectively. After a fixation period of 800 ms (fixation cross), both graphemes appeared. At the same time, participants were cued for 200 ms by means of an arrow that replaced the fixation cross; after 200 ms the fixation cross reappeared. Subjects had to keep fixation and direct their attention to either the left or the right grapheme. This means that grapheme stimuli could either be attended or unattended. Combined with the three stimulus conditions, this resulted in a 3 (condition) x 2 (attention) design. After an ‘attention period’ during which only the two graphemes and the fixation cross were present, the colour of one of the graphemes changed and participants had to report the colour change (see Figure 5.1 for detailed trial timing). The colour change happened 1000 ms after cue offset, but on 10% of trials the change was early (800 ms) to avoid response anticipation effects. In 70% of the trials the cue was validly indicating the side at which the colour change would happen, while in 30% of the trials the cue was invalid. Participants always had to respond, also in

Chapter 5
85
0.8 sec 0.2 sec 1.0 sec 0.2 sec
N S> N S N S
1.0 sec
FixationOnset cue
& graphemes Colour change Response
N N> N N N N
N C> N C N C
+
+
+
+
+
+
+
+
+
+
+
+
Attention period
1
2
3
Figure 5.1 Experimental design. The experiment consisted of three conditions. In the synaesthesia condition (row 1), one non-coloured (N) and one synaesthesia-inducing (S) stimulus (grapheme) were displayed. In the non-colour condition (row 2), two non-coloured stimuli were displayed. In the colour condition (row 3), one non-coloured and one coloured (C) stimulus were presented. Each trial started with a fixation period of 800 ms, after which the grapheme stimuli and a leftward or rightward cue appeared on the screen for 200 ms. Next, the cue was replaced with a fixation cross and the display remained unchanged for 1000 ms (or 800 ms in 10% of trials) which constituted the ‘attention period’. Subsequently, one of the two stimuli changed colour: in 70% of the cases, the colour change occurred on the cued side, in 30% of cases the cue was invalid. Stimuli could change with equal probability into 3 possible colours, where one colour matched the synaesthetic or real colour that was present during the attention period (congruent change). The other two possible colour changes were incongruent, allowing an assessment of colour interference effects due to synaesthesia for the synaesthetes. The colour change display was present for 200 ms. During the following 1 s fixation period (light grey fixation cross) participants had to report via a button press which colour was presented last. When the new trial began the fixation cross turned black again.
trials where the colour change happened on the uncued side, so that reaction times to both cued and uncued stimuli were measured. For synaesthetes, the colour change amounted to Stroop-like interference (Stroop, 1935) in the synaesthesia condition. The task was always the same (pressing a button corresponding to the colour change at the end of the trial). The presence of the coloured (colour condition) or colour-inducing stimuli (synaesthesia condition) interfered with the colour decision at the end of the trial. In the synaesthesia condition, the colour change at the end of the trial could either be congruent (33% of trials) or incongruent (67% of trials) with the synaesthetic colour that was present due to the synaesthesia-inducing grapheme. This task allowed us to detect colour interference induced by synaesthesia (e.g. Wollen and Ruggiero, 1983; Dixon et al., 2000; van Leeuwen et al., 2010 (Chapter 3)) and was the most important behavioural measure of synaesthesia. In the colour condition, the colour change could be congruent (33%) or incongruent (67%) with the physical colour of the grapheme that was displayed during the attention period. For control participants, only the

Synaesthesia and alpha band oscillations
86
congruency manipulation in the colour condition was relevant; colour changes in the synaesthesia condition did not contain a congruency manipulation for controls because synaesthesia was absent. In the non-colour condition, no colour information was present during the trial for either group, so there was no congruency manipulation at all. We ensured that each colour occurred equally often in each congruency condition and that congruent trials were not overrepresented, thus avoiding possible behavioural strategy effects.
In the colour condition, trials occurred in which coloured graphemes underwent congruent colour changes. In effect, this meant that in these trials, the colour stayed the same at the end of the attention period (e.g. if a red A was present on the left, and the colour change happened on the left and was congruent, it means that the A stayed red). Due to the different perceptual nature of these trials, the reaction times from these trials were excluded from the behavioural analysis. Not all congruent trials had to be excluded however. Trials in which the congruent colour changes happened on the non-colour side and not on the side of the coloured grapheme could be included (e.g. if a red A was present on the left, a non-coloured X on the right could undergo a congruent colour change into red). Per stimulus condition (non-colour, synaesthesia or colour) 432 trials were created; 108 trials for each attention condition (attended or unattended) and stimulus position (left or right). This yielded 1296 trials in total and an experimental duration of ~69 minutes. The cue validity, congruency, and early/late colour change manipulations were equally distributed over all conditions and stimuli, as were the experimental colours (3 colours). Stimuli were presented in pseudorandom order with maximally 5 repetitions of stimulus condition, left stimulus, right stimulus, cued side (attention condition), and target side. Invalid cues were allowed to repeat only 3 times, as were early occurrences of the colour change. Target colour (and thus target button) and target congruency were allowed to repeat 4 times. Stimuli were divided into 5 blocks of equal length, with short self-paced breaks in between the blocks. Prior to the MEG experiment participants performed a practice session of 200 items while seated in the MEG system. During the practice, participants’ responses were monitored by the experimenter for speed and accuracy, and participants received feedback from the experimenter where necessary. Including preparation of the participant and the practice session, the total experimental duration was 2:30 h. Stimuli and presentation settings Because synaesthesia is an idiosyncratic phenomenon, each synaesthete required a unique stimulus set. Graphemes were chosen from the questionnaire such that for each synaesthete we could present 3 graphemes that elicited vivid synaesthesia in 3 clearly distinct colours (synaesthesia condition). Additionally, 3 graphemes/symbols were chosen that elicited no synaesthesia (used for the non-colour and colour conditions; there was no interference between synaesthetic and real colour). In the non-colour/colour conditions sometimes non-alphanumeric symbols were included (e.g. #, &) in case all letters of the

Chapter 5
87
alphabet and all digits elicited synaesthesia. The control subjects received exactly the same stimulus list as the synaesthete to whom they were matched. Stimuli were presented against a light grey background (box of 21.5 x 12 cm, 456 cd/m2), using Presentation software (version 13.0, Neurobehavioural Systems Inc., www.neurobs.com). Stimuli from the non-colour and synaesthesia conditions were presented in dark grey. To ensure that there was no overall difference in luminance between stimulus conditions, the grey value of the non-coloured stimuli (non-colour and synaesthesia conditions) was matched to the average luminance of the 3 coloured stimuli (colour condition) that were chosen for each participant. Across all participants, the average luminance of the grapheme stimuli was 65 cd/m2 (SD = 28 cd/m2). All stimuli were 2 cm tall and were presented at positions 5.3 cm to the left and right from the centre of the screen. The translucent screen measured 50 x 37 cm, placed at a viewing distance of 70 cm. Stimulation was controlled by a Dell Pentium IV Windows XP computer (display mode 800x600 pixels, 60 Hz) and projected by a LCD beamer (EIKI)). MEG acquisition Neuromagnetic activity was recorded using a whole-head MEG system (CTF, Inc., Vancouver, Canada) containing 275 first-order axial magnetic gradiometers. Recording was continuous and the MEG was sampled at a rate of 600 Hz. Data was low pass filtered at 150 Hz and further detrended based on the whole trial. Line noise was attenuated using a 50 Hz notch filter. During all experiments, eye movements were recorded using horizontal and vertical EOG recordings. EOG recordings were used for the rejection of artifacts that were introduced by eye movements or blinks, by means of a threshold detection (4 times the z-value). The participant’s head location relative to the MEG sensors was measured before and after each session using marker coils placed at the nasion and the left and right ear canals. MEG data analysis All analyses were performed in MATLAB 7.5.0 (The MathWorks, Inc.) and the Fieldtrip software package (http://www.ru.nl/fcdonders/fieldtrip/), a Matlab-based toolbox for the analysis of electrophysiological data. Only trials which fell between a threshold of +/- 7 times the mean variance were included in further analysis which resulted in on average 1158 trials (SD = 152 trials) for each participant. In order to optimise analysis over subjects on the sensor level, axial gradiometer information was converted into planar gradients (Bastiaansen and Knosche, 2000; Van Dijk et al., 2008). The horizontal and vertical components of the planar gradients were estimated at each sensor location using the fields from the specific sensor and its neighboring sensors, and the power values for the horizontal and vertical components were summed after spectral analysis.
Time-frequency representations were calculated for the attention period (Figure 5.1). Analysis windows had a length of 0.5 s which was shifted in steps of 0.1 s, with a first centre point at 0.25 s after fixation onset (1.25 s into the trial) and the last one at 0.25 s

Synaesthesia and alpha band oscillations
88
before the to be detected colour change (1.75 s into the trial). Low frequency power (1-40 Hz) was calculated using a Hanning window and Fast Fourier Transforms (FFT). Frequency analyses started at 2 Hz increasing in steps of 2Hz. The high frequency power (40-120 Hz) was estimated using FFT and 9 slepian tapers resulting in a frequency smoothing of +/- 10 Hz. Frequency analyses started at 40 Hz and increased in steps of 4Hz. Time-frequency representations of the data were plotted to assess whether other frequency bands besides the alpha band required further analysis. Data was not baseline corrected and only correctly answered trials were included. We were interested in differences in oscillatory power in the alpha band that were induced by synaesthesia or colour. Hence, for each group and controlling for attention, we contrasted trials from the colour and synaesthesia conditions with trials from the non-coloured condition. In this way we could assess the effects of colour and synaesthesia while any general, stimulus related alpha effects were controlled for by subtracting the non-colour condition. Attention was always directed to the same hemifield in the comparisons to ensure the effects we observed were not due to attention. Attended and unattended stimuli were hence analysed separately. In Figure 5.1, it can be seen what this analysis would amount to in case the synaesthesia-inducing and coloured stimuli were presented on the right side of fixation and the attention cue was also to the right (attended condition). Contrasts were calculated for the synaesthesia condition (row 1 in Figure 5.1) minus the non-colour condition (row 2 in Figure 5.1). Oscillatory power effects that were induced by the attended synaesthesia-inducing stimulus on the right and which would be different from the effects for the attended non-colour stimulus on the right, would become visible in this contrast. Possible outcomes would be either a general or a localised, contralateral decrease (or increase) in alpha power due to the synaesthesia-inducing stimulus. If the effects in the synaesthesia condition would not differ from those in the non-colour condition, no specific differential localised pattern of alpha power should emerge. The analysis was repeated for trials in which attention was directed to the left, while the synaesthesia-inducing stimulus was on the right (unattended condition), which allowed us to assess the effects of attention. The analysis was also repeated for the attended and unattended condition while the synaesthesia-inducing stimulus was on the left. The analyses on stimuli in the other visual hemifield offered a sanity check on our data, since any possible alpha lateralisation effects should flip in the left-right direction as well. Thus, in total there were 4 comparisons for the synaesthesia condition (attended and unattended conditions, on the right and on the left). The same 4 comparisons were calculated for the colour condition, which made it possible to assess differences in frequency power that were due to the presence of colour per se under attended and unattended conditions. All analyses were performed for synaesthetes as well as controls.
To assess the lateralisation effects in the different conditions in a quantitative way, we compared the average alpha power values computed over left vs. right occipital sensors. In this way we obtained a measure of the strength of alpha power lateralisation for each manipulation. Lateralisation strength was calculated for each of the comparisons described above, i.e. for the synaesthesia and colour condition (contrasted with the non-colour

Chapter 5
89
condition) and for both attention conditions and both hemifields. The alpha power values for each group were subjected to a repeated measures ANOVA with the factors stimulus condition (synaesthesia/ colour), attention (attended/unattended) and hemifield (left/right presentation of coloured or synaesthesia inducing stimulus). Effects within the groups were further quantified by means of planned comparisons (paired t-tests). For synaesthetes only, we investigated whether the strength of behavioural colour interference that was induced by synaesthesia correlated with the lateralisation strength of alpha power over occipital sensors. This analysis was performed only for the synaesthesia condition in synaesthetes. Behavioural interference due to synaesthesia was estimated by calculating the reaction time difference between trials with congruent and trials with incongruent colour changes in the synaesthesia condition (including only correct and validly cued trials). The more negative the value, the stronger the effect of synaesthesia, i.e. the longer the reaction times in the incongruent trials due to interference. For the lateralisation strength of alpha power we used the difference in alpha power between left and right occipital sensors for two contrasts. The first was the difference between attended synaesthesia-inducing stimuli on the right and attended synaesthesia-inducing stimuli on the left; the second contrast was the difference between attended non-coloured stimuli on the right versus on the left, while the synaesthesia-inducing stimuli were present in the unattended hemifield. As explained in Figure 5.5, the larger the alpha power decrease contralateral to the attended side compared to the ipsilateral side, the more negative is the value. In the first comparison the side of attention coincides with the side of synaesthetic colour. In the second comparison, however, the effects of attention and synaesthetic colour can be dissociated. Results Behavioural results Figure 5.2 summarises the behavioural results. Reaction times from all 22 participants (11 synaesthetes, 11 controls) were entered into analyses of variance (ANOVA). Misses amounted to 2.4% (SD = 4.8%) of trials for synaesthetes, and 3.2% (SD = 3.1%) for controls (no group difference, t(20) = -0.476, n.s.). Outliers were removed prior to analysis by removing all reaction times that were faster than 250 ms or slower than 2000 ms (synaesthetes, 1.9%; controls, 0.4%, no group difference, t(20) = 0.906, n.s.). Correct and incorrect responses were included in the analyses, unless specified otherwise.
Overall accuracy was 89.6% (SD = 10.2%) for the synaesthetes and 90.9% (SD = 9.5%) for the control participants. The difference between groups was not significant (t(20) = -0.304, n.s.). Overall reaction times did not differ between the groups: synaesthetes, 721 ms (SD = 89 ms); controls, 726 ms (SD = 130 ms), t(20) = -0.106, n.s. It is therefore unlikely that there was an overall difference in task difficulty for the two groups. Also within the separate groups, there were no overall reaction time differences between the three stimulus conditions (synaesthesia, non-colour, colour).
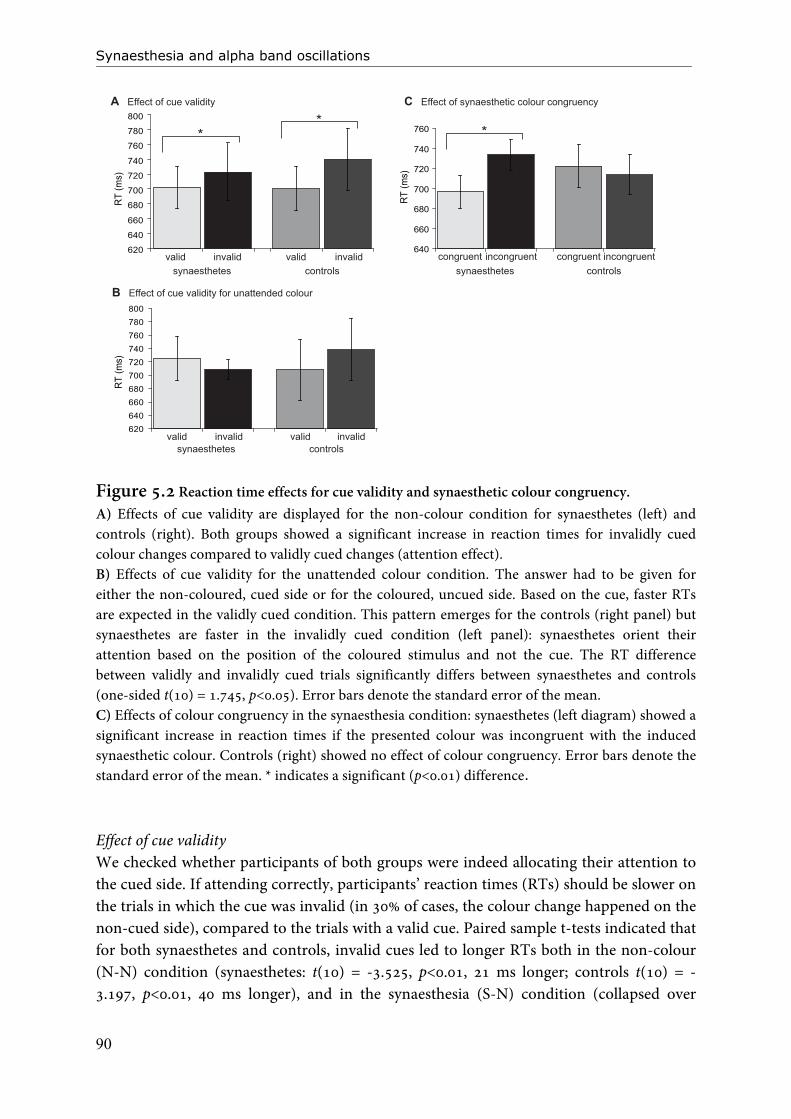
Synaesthesia and alpha band oscillations
90
RT (m
s)
620
640
660
680
700
720
740
760
780
800R
T (m
s)
controlssynaesthetes
A Effect of cue validity
valid valid invalidinvalid640
660
680
700
720
740
760
controlssynaesthetes
C Effect of synaesthetic colour congruency
congruent congruentincongruent incongruent
620640660680700720740760780800
RT (m
s)
controlssynaesthetesvalid valid invalidinvalid
B Effect of cue validity for unattended colour
Figure 5.2 Reaction time effects for cue validity and synaesthetic colour congruency. A) Effects of cue validity are displayed for the non-colour condition for synaesthetes (left) and controls (right). Both groups showed a significant increase in reaction times for invalidly cued colour changes compared to validly cued changes (attention effect). B) Effects of cue validity for the unattended colour condition. The answer had to be given for either the non-coloured, cued side or for the coloured, uncued side. Based on the cue, faster RTs are expected in the validly cued condition. This pattern emerges for the controls (right panel) but synaesthetes are faster in the invalidly cued condition (left panel): synaesthetes orient their attention based on the position of the coloured stimulus and not the cue. The RT difference between validly and invalidly cued trials significantly differs between synaesthetes and controls (one-sided t(10) = 1.745, p<0.05). Error bars denote the standard error of the mean. C) Effects of colour congruency in the synaesthesia condition: synaesthetes (left diagram) showed a significant increase in reaction times if the presented colour was incongruent with the induced synaesthetic colour. Controls (right) showed no effect of colour congruency. Error bars denote the standard error of the mean. * indicates a significant (p<0.01) difference. Effect of cue validity We checked whether participants of both groups were indeed allocating their attention to the cued side. If attending correctly, participants’ reaction times (RTs) should be slower on the trials in which the cue was invalid (in 30% of cases, the colour change happened on the non-cued side), compared to the trials with a valid cue. Paired sample t-tests indicated that for both synaesthetes and controls, invalid cues led to longer RTs both in the non-colour (N-N) condition (synaesthetes: t(10) = -3.525, p<0.01, 21 ms longer; controls t(10) = -3.197, p<0.01, 40 ms longer), and in the synaesthesia (S-N) condition (collapsed over
Chapter 5
91
congruency and attended side: synaesthetes t(10) = -2.978, p<0.05, 22 ms longer; controls t(10) = -2.326, p<0.05, 36 ms longer). There were no significant interactions between the groups. Figure 5.2A shows the reaction times for validly and invalidly cued trials in the non-colour condition. In the colour condition, an effect of cueing could only be established reliably for the control subjects. Synaesthetes showed a trend in the same direction (synaesthetes t(10) = -1.837, p=0.096, invalid trials 22 ms longer; controls t(10) = -2.385, p<0.05, invalid trials 34 ms longer). We further inspected the reaction times in the colour condition by looking at attended and unattended colour stimuli separately. This analysis revealed that synaesthetes were slower for invalidly cued trials only for the attended colour stimuli (t(10) = -2.367, p<0.05, 60 ms slower). The reaction times for the invalidly cued, unattended colour stimuli were faster than those for validly cued but non-coloured stimuli (t(10) = .817, n.s., 16 ms faster). Controls were slower for the invalidly cued trials for both the attended and unattended colour stimuli, although the effects were marginal in both comparisons (t(10) = -1.966, p=0.08, 38 ms slower; t(10) = -1.727, p=0.11, 30 ms slower, respectively).The results for the unattended colour stimuli are displayed in Figure 5.2B, in which the different RT pattern for synaesthetes and controls is clearly visible. A one-sided t-test confirmed that the differences between the two conditions were not the same for controls and synaesthetes (t(10) = 1.745, p<0.05).
Effect of (synaesthetic) colour congruency For the synaesthesia condition, we expected the congruency manipulation in the colour change to lead to an RT effect for synaesthetes, but not controls. Synaesthetes were expected to be slower on incongruent trials, due to colour interference effects caused by their synaesthetic colours. Only trials with a correct response were included in this analysis to get a good estimate of the interference that was induced by the incongruent colours. Data from both attention and both cue-validity conditions were included. As expected, an interaction of congruency x group was found in a repeated measures ANOVA (F(1,86) = 10.560, p<0.01), see the reaction time plots in Figure 5.2C. Synaesthetes were 37 ms slower when the observed colour change was incongruent with the synaesthetic colour elicited by the synaesthesia-inducing stimulus (t(43) = -3.042, p<0.01), while controls showed no difference between the two conditions (t(43) = 1.233, n.s.). This means that synaesthetes indeed experienced colour interference during the synaesthesia condition, in line with previous reaction time studies of synaesthesia (Wollen and Ruggiero, 1983; Mattingley et al., 2001). We can conclude that synaesthetic colour experiences were reliably elicited during the experiment. Interestingly, a significant congruency effect for synaesthetes was also present for the trials in which the synaesthesia-inducing stimulus was not attended (t(21) = -2.361, p<0.05).
In the colour condition, we expected both groups to show an effect of colour congruency. An effect of congruency was established for the synaesthetes (t(21) = -2.081, p<0.05) and a trend was present for the controls (t(21 = -1.908, p=0.070).
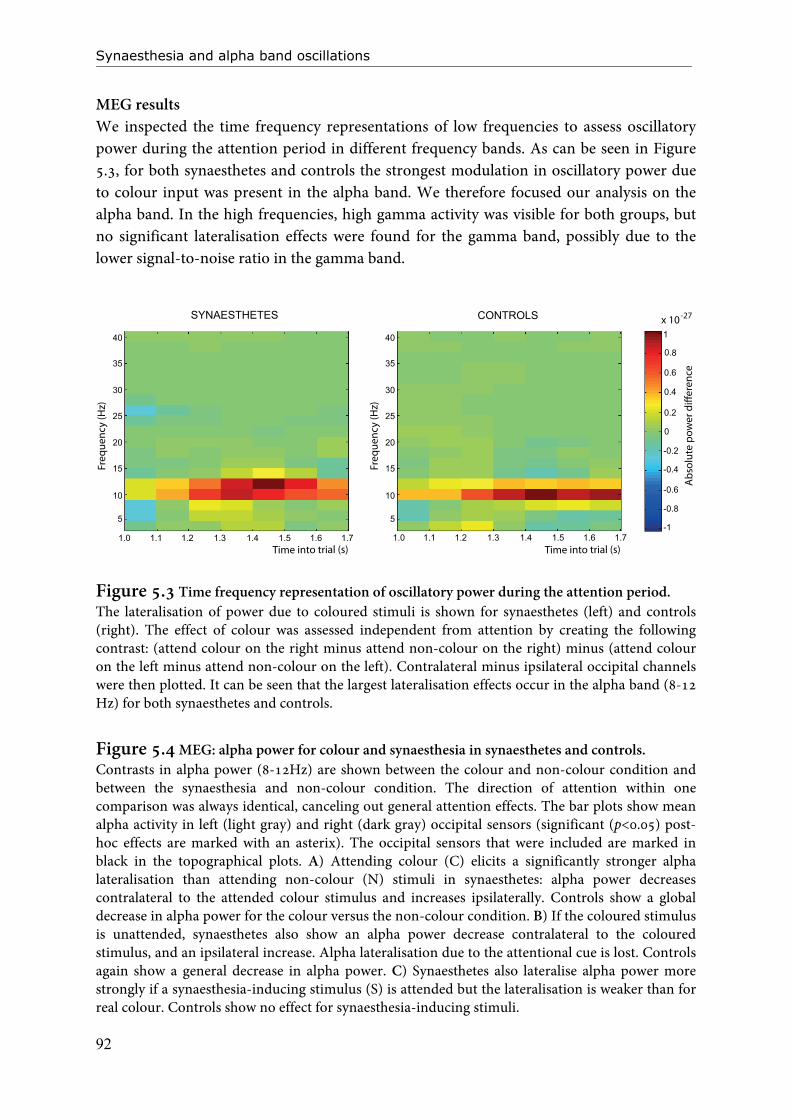
Synaesthesia and alpha band oscillations
92
MEG results We inspected the time frequency representations of low frequencies to assess oscillatory power during the attention period in different frequency bands. As can be seen in Figure 5.3, for both synaesthetes and controls the strongest modulation in oscillatory power due to colour input was present in the alpha band. We therefore focused our analysis on the alpha band. In the high frequencies, high gamma activity was visible for both groups, but no significant lateralisation effects were found for the gamma band, possibly due to the lower signal-to-noise ratio in the gamma band.
Fre
qu
en
cy
(H
z)
5
10
15
20
25
30
40
35
5
10
15
20
25
30
40
35
-1
-0.8
-0.6
-0.4
-0.2
0
1
0.8
0.6
0.4
0.2
Fre
qu
en
cy
(H
z)
SYNAESTHETES CONTROLS
1.0 1.1 1.2 1.3 1.4 1.5 1.6 1.7 1.0 1.1 1.2 1.3 1.4 1.5 1.6 1.7Time into trial (s) Time into trial (s)
Ab
solu
te p
ow
er
diff
ere
nce
x 10-27
Figure 5.3 Time frequency representation of oscillatory power during the attention period. The lateralisation of power due to coloured stimuli is shown for synaesthetes (left) and controls (right). The effect of colour was assessed independent from attention by creating the following contrast: (attend colour on the right minus attend non-colour on the right) minus (attend colour on the left minus attend non-colour on the left). Contralateral minus ipsilateral occipital channels were then plotted. It can be seen that the largest lateralisation effects occur in the alpha band (8-12 Hz) for both synaesthetes and controls.
Figure 5.4 MEG: alpha power for colour and synaesthesia in synaesthetes and controls. Contrasts in alpha power (8-12Hz) are shown between the colour and non-colour condition and between the synaesthesia and non-colour condition. The direction of attention within one comparison was always identical, canceling out general attention effects. The bar plots show mean alpha activity in left (light gray) and right (dark gray) occipital sensors (significant (p<0.05) post-hoc effects are marked with an asterix). The occipital sensors that were included are marked in black in the topographical plots. A) Attending colour (C) elicits a significantly stronger alpha lateralisation than attending non-colour (N) stimuli in synaesthetes: alpha power decreases contralateral to the attended colour stimulus and increases ipsilaterally. Controls show a global decrease in alpha power for the colour versus the non-colour condition. B) If the coloured stimulus is unattended, synaesthetes also show an alpha power decrease contralateral to the coloured stimulus, and an ipsilateral increase. Alpha lateralisation due to the attentional cue is lost. Controls again show a general decrease in alpha power. C) Synaesthetes also lateralise alpha power more strongly if a synaesthesia-inducing stimulus (S) is attended but the lateralisation is weaker than for real colour. Controls show no effect for synaesthesia-inducing stimuli.

Chapter 5
93
*
-6
-
4
-2
0
2
4
6
x 10
-28C
ON
TRO
LSSY
NA
ESTH
ETES
A B C
α-po
wer
C
N minus
N
N
C
N minus
N
N
S
N minus
N
N
N
C minus
N
N
N
S minus
N
N
N
C minus
N
N
−2
−1.5−1
−0.50x1
0−27 Le
ft
Rig
ht
−1.6
−1.2
−0.8
−0.40x1
0−27 Le
ft
Rig
ht
−0.6
−0.4
−0.20
0.2x1
0−2
7
Le
ft
Rig
ht
−0.6
−0.4
−0.20
x10−2
7
Le
ft
Rig
ht
−1.6
−1.2
−0.8
−0.40
x10−
27
−1.5−1
−0.50
x10−2
7
Le
ft
Rig
ht
Le
ft
Rig
ht
0
0.4
0.8
x10
−27
Le
ft
Rig
ht
*
−0.6
−0.4
−0.20
0.2
x10−2
7 Le
ft
Rig
ht
*
−0.1
50
0.150.3
x10−2
7
Le
ft
Rig
ht
−0.3
−0.2
−0.10
0.1
x10
−27 Le
ft
Rig
ht
*
−0.4
−0.20
0.2
0.4
x10−2
7 Le
ft
Rig
ht
*
−0.8
−0.6
−0.4
−0.20
x10−
27
*( )
Le
ft
Rig
ht
S
N minus
N
N
C
N minus
N
NN
C
minus
N
N
C
N minus
N
NN
C
minus
N
N
N
S minus
N
N
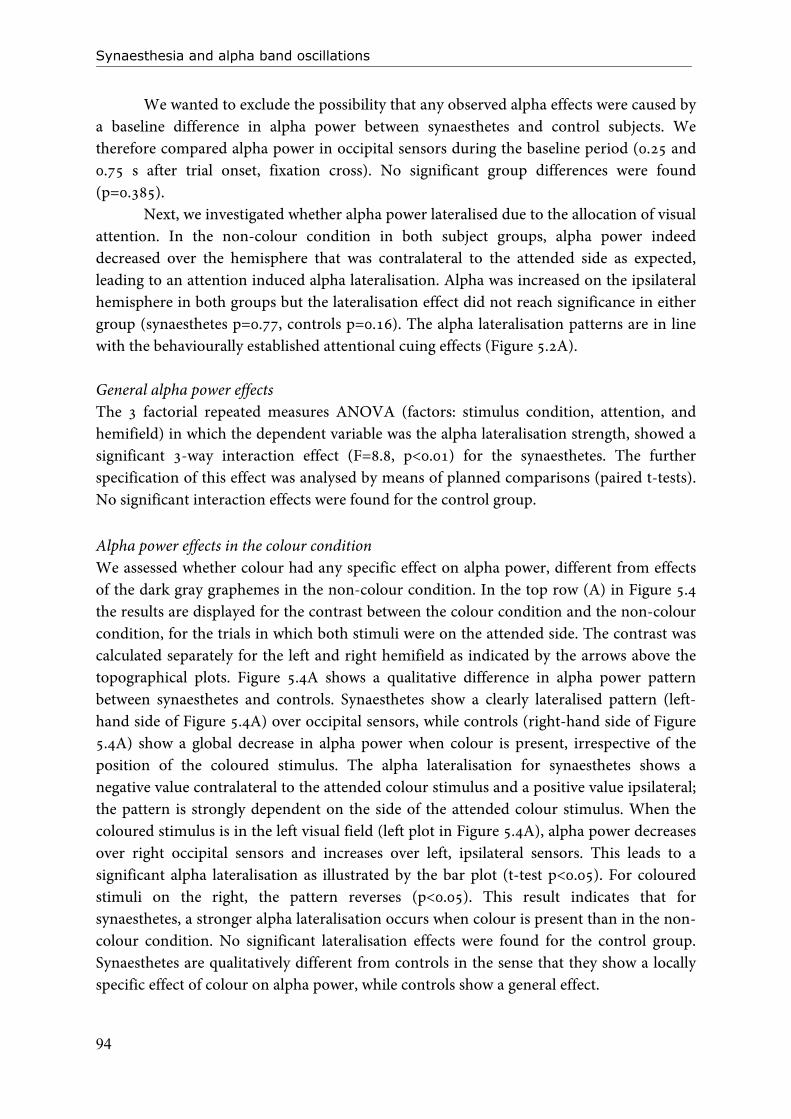
Synaesthesia and alpha band oscillations
94
We wanted to exclude the possibility that any observed alpha effects were caused by a baseline difference in alpha power between synaesthetes and control subjects. We therefore compared alpha power in occipital sensors during the baseline period (0.25 and 0.75 s after trial onset, fixation cross). No significant group differences were found (p=0.385). Next, we investigated whether alpha power lateralised due to the allocation of visual attention. In the non-colour condition in both subject groups, alpha power indeed decreased over the hemisphere that was contralateral to the attended side as expected, leading to an attention induced alpha lateralisation. Alpha was increased on the ipsilateral hemisphere in both groups but the lateralisation effect did not reach significance in either group (synaesthetes p=0.77, controls p=0.16). The alpha lateralisation patterns are in line with the behaviourally established attentional cuing effects (Figure 5.2A). General alpha power effects The 3 factorial repeated measures ANOVA (factors: stimulus condition, attention, and hemifield) in which the dependent variable was the alpha lateralisation strength, showed a significant 3-way interaction effect (F=8.8, p<0.01) for the synaesthetes. The further specification of this effect was analysed by means of planned comparisons (paired t-tests). No significant interaction effects were found for the control group.
Alpha power effects in the colour condition We assessed whether colour had any specific effect on alpha power, different from effects of the dark gray graphemes in the non-colour condition. In the top row (A) in Figure 5.4 the results are displayed for the contrast between the colour condition and the non-colour condition, for the trials in which both stimuli were on the attended side. The contrast was calculated separately for the left and right hemifield as indicated by the arrows above the topographical plots. Figure 5.4A shows a qualitative difference in alpha power pattern between synaesthetes and controls. Synaesthetes show a clearly lateralised pattern (left-hand side of Figure 5.4A) over occipital sensors, while controls (right-hand side of Figure 5.4A) show a global decrease in alpha power when colour is present, irrespective of the position of the coloured stimulus. The alpha lateralisation for synaesthetes shows a negative value contralateral to the attended colour stimulus and a positive value ipsilateral; the pattern is strongly dependent on the side of the attended colour stimulus. When the coloured stimulus is in the left visual field (left plot in Figure 5.4A), alpha power decreases over right occipital sensors and increases over left, ipsilateral sensors. This leads to a significant alpha lateralisation as illustrated by the bar plot (t-test p<0.05). For coloured stimuli on the right, the pattern reverses (p<0.05). This result indicates that for synaesthetes, a stronger alpha lateralisation occurs when colour is present than in the non-colour condition. No significant lateralisation effects were found for the control group. Synaesthetes are qualitatively different from controls in the sense that they show a locally specific effect of colour on alpha power, while controls show a general effect.
Chapter 5
95
We also tested whether the effects were dependent on attention. We therefore analysed alpha power effects for coloured stimuli that were presented on the unattended side, compared to non-colour stimuli on the unattended side (middle row (B) in Figure 5.4). For synaesthetes, the topographical plots (left side of Figure 5.4B) again show a lateralisation of alpha power. The lateralisation pattern is driven by the position of the coloured stimulus and not by the direction of the cue. There is a decrease in alpha power contralateral to the coloured stimulus compared to ipsilateral (attention right and colour left p<0.05, attention left and colour right: p=0.057). Independent of the attentional cue, alpha power in synaesthetes follows the coloured stimulus. This fits very well with our behavioural findings which showed that in synaesthetes, reaction times to invalidly cued but coloured stimuli were faster than those for validly cued, non-coloured stimuli. For controls, we see that the presence of colour again leads to a general reduction in alpha power (topographical plots on right-hand side in Figure 5.4B). The bar plots confirm the general decrease in alpha power for both contralateral and ipsilateral sensors. When attention is directed to the right, alpha power is decreased significantly (p<0.01) more on the right side than on the left side, but both hemispheres still show a decrease in alpha power. This pattern is clearly distinct from the lateralisation pattern shown by the synaesthetes. Alpha power effects in the synaesthesia condition For both groups, we investigated effects of synaesthesia on alpha power by contrasting the synaesthesia condition with the non-colour condition, again separately for each attended side. Figure 5.4C (left side of bottom row in Figure 4.4) illustrates that for synaesthetes, the alpha lateralisation patterns for synaesthesia inducing graphemes resemble those for physically coloured graphemes. There is a decrease in alpha power contralateral to the attended synaesthesia inducing stimulus compared to an attended non-colour stimulus. There is also an ipsilateral increase. When synaesthetes attend to the left, the difference between left and right occipital sensors becomes significant (p<0.05). When attention is directed to the right side the same pattern emerges, however it does not reach significance (p= 0.31). Controls show no effect for the synaesthesia-inducing stimuli (right-hand side of Figure 4.4C; left p= 0.22, right, p= 0.40).
We also analysed alpha power for synaesthesia inducing stimuli on the unattended side, and compared it to alpha power for non-coloured stimuli on the unattended side. Here, the alpha lateralisation patterns did not reach significance (plots not shown; synaesthetes: attention left, p>0.68, attention right, p>0.22; controls: attention left, p>0.53, attention right p>0.051). Correlation between alpha lateralisation and strength of synaesthesia For the synaesthetes, we investigated whether the strength of synaesthesia was related to the strength of the increased alpha lateralisation due to synaesthesia inducing stimuli (Figure 5.5). In Figure 5.5A, the results are displayed for the trials in which the synaesthesia-inducing stimulus was attended. Figure 5.5A shows a significant positive
Synaesthesia and alpha band oscillations
96
N S
+ -
S N
+-minus =
+-
left – right sensors
= negative
Negative values of alpha lateralisation if:S N
+ -
N S
+-minus =
+-
left – right sensors
= negative
Negative values if alpha decrease contralateral to cue:
S N N S left – right sensors
= positive
Positive values if alpha decrease contralateral to S:
+-+ -minus =
+ -
Alp
ha la
tera
lisat
ion
(left
- rig
ht)
Alp
ha la
tera
lisat
ion
(left
- rig
ht)
Synaesthesia strength (RT difference) Synaesthesia strength (RT difference)-250 -200 -150 -100 -50 -250 -200 -150 -100 -50
-6
-4
-2
0
2
x 10-28
-2
0
-1
1
x 10-27A B
0 50 0 50
Figure 5.5 Correlation between occipital alpha lateralisation and synaesthesia strength. The x-axis shows the difference between reaction times for the congruent and incongruent colour changes in synaesthesia trials. Negative values indicate a strong effect of synaesthesia (i.e. longer reaction times in the incongruent condition). On the y-axis the contrast in alpha power (8-12 Hz) between left minus right occipital sensors is plotted for 2 specific conditions. In A, the contrast depicts the difference in alpha power between attended synaesthesia inducing stimuli on the right vs. left. A negative contrast value of alpha power means a lateralisation in the direction of the cue and the attended synaesthesia inducing stimulus (see the schematic next to Figure 5.5A). In B, we plotted the contrast in alpha power for attended non-colour stimuli on the right vs. left, while a synaesthesia inducing stimulus is present on the opposite side. Here, positive values on the y-axis indicate that the alpha lateralisation does not follow the attentional cue but rather the side of the synaesthetic stimulus (see the schematic next to Figure 5.5B). Effects of attention and synaesthesia can be separated in this way. A) There is a significant positive correlation between alpha lateralisation and synaesthesia effect (p=0.03; R2: 0.41, slope=0.01e-27, trend line). This means that those subjects experiencing strong synaesthesia lateralise alpha more strongly (contrast is more negative) than those with a weak experience (see cartoon). Without the outlier (marked with a circle in the plot) who could possibly be driving the effect, the correlation is still close to significance (p=0.12, R2: 0.27, slope=0.187e-28). B) There is still a (marginal) correlation between synaesthesia strength and alpha lateralisation (p=0.07; R2: 0.32, slope=-0.033e-28, trend line). However, the slope is now flipped so that subjects with a stronger synaesthesia effect lateralise more strongly with respect to the synaesthesia stimulus than the cue (positive contrast value of alpha power). Excluding the outlier (marked with a circle) decreased the p-value (p=0.04, R2: 0.43, slope=-0.092e-28).
correlation between synaesthesia strength and the contrast in alpha power (p=0.03). Participants who experience strong colour interference from their synaesthesia lateralise alpha more strongly with respect to the synaesthesia inducing stimulus than those who exhibit weaker interference. This results in a negative value of the contrast in alpha power for strong synaesthesia. Without the outlier (marked with a circle in the plot) who could possibly be driving the effect, the correlation is still close to significance (p=0.12).
Chapter 5
97
For the unattended condition (Figure 5.5B), we again find a (marginal) correlation between the strength of synaesthesia and the lateralisation of alpha power (p=0.07). However, we can now see that the slope is flipped: synaesthetes with stronger effects of synaesthesia now show a positive value for the contrast in alpha power. This means that they lateralise with respect to the synaesthesia inducing stimulus instead of the cue (see the schematics besides Figure 5.5B for details). Excluding the outlier (marked with a circle) decreased the p-value (p=0.04). Please note that the data used for the two regression analyses is from a different subset of trials, and therefore independent. Discussion We addressed the role of alpha oscillations in grapheme-colour synaesthesia. In an attentional cuing paradigm that was combined with a behavioural colour decision task, we assessed alpha lateralisation effects for stimuli that were either non-coloured (i.e. displayed in dark gray and not inducing synaesthesia), induced synaesthesia, or were physically coloured. Synaesthetes showed qualitatively different patterns of alpha power than controls for coloured and for synaesthesia-inducing stimuli. Synaesthetes decreased alpha power contralateral to coloured stimuli in a locally specific way and increased alpha power ipsilaterally, compared to the non-colour condition. Controls showed location-unspecific decreases in alpha power due to coloured stimuli and lacked any alpha power increase. In synaesthetes the modulation in alpha power due to colour even overruled the effect of the attentional cue. In the synaesthesia condition, synaesthetes demonstrated an alpha lateralisation similar to the pattern induced by the colour condition, but the effects were weaker. Nevertheless, the strength of alpha lateralisation for synaesthesia-inducing stimuli correlated with the measured behavioural colour interference of synaesthesia. Controls showed no change in alpha modulation for synaesthesia inducing stimuli. Our study is the first to show synaesthesia and colour related differences in alpha band oscillations between synaesthetes and controls, and we discuss possible implications below.
It is striking that synaesthetes show qualitatively different alpha power modulations for coloured stimuli than control participants. Alpha modulation, specifically over occipital cortex, can be interpreted in the light of the alpha inhibition theory: alpha decreases if increased processing is required and increases for irrelevant stimuli (e.g. Klimesch et al., 2007). Similarly, attention can influence processing demands: attended input is processed more deeply while unattended input is processed less well. Attentional perceptual effects are shown to coincide with an alpha power decrease or increase, respectively (Worden et al., 2000; Yamagishi et al., 2003; Kelly et al., 2006; Rihs et al., 2007). Importantly, alpha lateralisation is present before the presentation of the to-be-processed stimulus, after an attentional cue has been presented. Alpha oscillations and attentional processes have therefore been argued to be strongly linked (for detailed discussion, see e.g. Haendel et al., in press).
Also in our study, alpha power is modulated by attention as already observed in the non-colour condition. In synaesthetes, the lateralisation of alpha power is strengthened in
Synaesthesia and alpha band oscillations
98
a location specific way if colour is present. An alpha power decrease contralateral to the attended coloured stimulus and a strong ipsilateral alpha power increase indicate that colour strongly captures attention in synaesthetes (Figure 5.4A). This interpretation is supported by the alpha modulations in the unattended colour condition (Figure 5.4B), which resemble the pattern of the attended condition even though the coloured stimuli were not cued. Hence, attention was allocated automatically to coloured stimuli in synaesthetes even when the cue was directed away from the coloured stimuli. In this situation, the attentional effect of colour even led to decreased reaction times for the invalidly cued, coloured stimuli, which supports our interpretation. In synaesthetes, alpha power and behavioural effects indicate that colour strongly guides attention in a spatially specific way.
In comparison, controls show a general decrease of alpha power for the colour condition compared to the non-colour condition. Although in Figure 5.4B we see that for controls there was a stronger decrease in alpha contralateral to the coloured stimulus and a weaker decrease ipsilaterally, there was no alpha power increase ipsilateral to the colour. This is a qualitative difference between synaesthetes and controls. The spatially unspecific alpha power decrease in control participants might be explained by a general increase in alertness if colour is present in the display. Colour has been shown to catch attention (Treisman and Gelade, 1980; Theeuwes, 1992) and increase the saliency of the input (Wichmann et al., 2002). Our findings fit well with previous MEG studies showing that attention to coloured input can modulate alpha activity (Müller and Keil, 2004; Snyder and Foxe, 2010). Synaesthetes and controls thus exhibit differences in colour processing: we propose that the altered colour processing of synaesthetes may play a role in the mechanisms underlying synaesthesia. Synaesthetes showed similar, but weaker alpha power modulations for synaesthetic colour compared to real colour. Controls showed no effects for synaesthesia inducing stimuli. That for synaesthetes the effects of synaesthesia inducing stimuli are similar to the effects of physically coloured stimuli indicates that the perception of synaesthetic colour is similar to real colour perception. Importantly, also here the alpha power decrease, and hence attentional allocation is spatially localised. The finding that alpha power effects for synaesthesia inducing stimuli are weaker than the effects for real colour argues against the proposed mechanism of increased disinhibition of feedback for synaesthesia (Grossenbacher and Lovelace, 2001), at least for projector synaesthetes. If increased disinhibition would have been a specific mechanism for synaesthesia, we would have expected a larger alpha decrease for synaesthesia inducing stimuli than for real colour stimuli (and preferably not even any decrease in the colour condition). Instead, our results show that real colour leads to strong alpha modulation specific for synaesthetes and that synaesthetic colour merely follows the same pattern. Additionally, the qualitative difference between synaesthetes and controls is the increased alpha power ipsilateral to the coloured stimuli and not the contralateral decrease (decreased inhibition). This also argues against the disinhibition hypothesis.

Chapter 5
99
In our analyses, we assessed oscillatory power over occipital cortex as this is where we saw the alpha modulations in our paradigm (see Figure 5.4). We have to note that in spite of our findings, we cannot fully exclude the disinhibition hypothesis as a mechanism of synaesthesia. It would be necessary to also assess oscillatory patterns over parietal cortex. After all, according to the disinhibition theory, multi-modal areas like parietal cortex are proposed to play a large role in synaesthesia (Grossenbacher and Lovelace, 2001). However, alpha patterns especially in multi-modal areas might be too weak to be picked up by MEG.
Similarly, our group of synaesthetes consisted of 10 projector synaesthetes and 1 associator, hence the different variants of synaesthesia were not represented equally well. Projectors experience their colours ‘out there’ as opposed to ‘in the mind’s eye’ while for associator synaesthetes, the elicited colours are not externally co-located with the grapheme. Effective connectivity analyses of the synaesthesia network suggest that different mechanisms are underlying projector and associator synaesthesia and that for associators, the disinhibition theory might be a plausible model of synaesthesia (van Leeuwen et al., accepted (Chapter 4)). We therefore also assessed the alpha effects for synaesthetes without the associator (N=10 projectors). Although with N=10 the effects in Figure 5.4B and 5.4C (only when attending to the left) were now marginal (p=0.09), the overall pattern of alpha lateralisation did not change for the colour and synaesthesia conditions. The qualitatively similar pattern for projectors only supports our interpretation of the data as not in favour of the disinhibition theory. A correlation between alpha lateralisation and behavioural colour interference for synaesthetes in the synaesthesia condition indicates that the observed alpha modulation for synaesthesia inducing stimuli is related to the percept of synaesthetic colour. The larger the alpha lateralisation for synaesthesia inducing stimuli, the stronger was the reported synaesthesia, as measured by the reaction times difference between congruently and incongruently coloured stimuli in the colour decision task. This correlation suggests that alpha modulation is linked to the experience of synaesthesia. It could be that attention is drawn to the synaesthesia inducing stimulus, thereby increasing behavioural interference, or that alpha modulations are related to synaesthesia in a more general sense, which is what we propose.
As our data do not seem to be directly supportive of the disinhibition theory for projector synaesthetes, we would like to propose a possible alternative mechanism of synaesthesia. In projector synaesthetes, colour leads to a spatially localised, automatic change in alpha power, interpreted as an allocation of attention. If, in synaesthetes, during development a grapheme and a colour are present at the same spatial location, attention will be automatically directed towards the colour in a spatially precise way. This in turn may facilitate binding processes between real colour and the grapheme: spatially localised attention is required for binding (Shafritz et al., 2002; Robertson, 2003; Treisman, 2005) and spatial co-localisation may enhance cross-modal coupling (Meyer et al., 2005). Once coupling between a specific grapheme and specific colour is strengthened, processing of the grapheme could lead to co-activation of colour areas. Such coupling might be

Synaesthesia and alpha band oscillations
100
specifically easy to form at a young age when brain structures are still flexible (Hensch, 2005; Bedny et al., 2010). Fitting with our hypothesis, Simner et al. (2009) and Hancock (2006) have shown that synaesthesia in children develops over time from chaotic grapheme-colour pairings into a system of fixed and consistent responses, rather than being fixed from early age. Further, synaesthetic colours led to similar alpha modulations as real colour, albeit less strong. Once a grapheme and colour are coupled, however, the allocation of attention also to synaesthetic colour could lead to a positive feedback loop: every time that synaesthesia is elicited the functional pathways connecting the grapheme and colour experience are strengthened, i.e. strengthened by use (Büchel and Friston, 1997; Caporale and Dan, 2008; Klink et al., 2010). Continuous reactivation of connections may induce anatomical changes in synaesthetes (Hensch, 2005; Noppeney et al., 2005; Bedny et al., 2010), most likely taking place during visual system specialisation and development.
The predictions raised by our hypothesis are well in line with the known literature on synaesthesia. With regard to anatomical changes in synaesthetes, increases in white matter and grey matter density for synaesthetes compared to non-synaesthetes have already been reported (Rouw and Scholte (2007; Jäncke et al., 2009; Weiss and Fink, 2009; Rouw and Scholte, 2010). At the same time, our hypothesis does not require that excessive anatomical connectivity is present to elicit synaesthesia in the first place; we predict that synaesthetic coupling is potentially possible in all of us as shown, in line with training and hypnosis studies, for instance (Elias et al., 2003; Cohen Kadosh et al., 2009; Meier and Rothen, 2009). Synaesthesia also adheres to principles of normal crossmodal perception (Sagiv et al., 2006b; Ward et al., 2006b; Cohen Kadosh et al., 2007a), suggesting that similar crossmodal processing and anatomical substrates are present for synaesthetes and non-synaesthetes. However, if not constantly reinforced, functional coupling of graphemes and colour in non-synaesthetes may disappear again.
If anatomical connections between the grapheme and the colour area are indeed strengthened in synaesthesia, this predicts fast co-activation of colour areas during synaesthesia. This prediction is supported by MEG, EEG and dynamic causal modelling studies (Beeli et al., 2008; Brang et al., 2010; van Leeuwen et al., accepted (Chapter 4)) showing that for projector synaesthetes, area V4 is active shortly after the grapheme area. Finally, the fact that our main finding suggests altered colour processing in synaesthetes is also in line with the literature. Many forms of synaesthesia have colour as the concurrent, induced experience (up to 77% of all forms of synaesthesia involve colour (Simner et al., 2006)). Enhanced memory for colour (Smilek et al., 2002; Mills et al., 2006), enhanced colour perception abilities (Yaro and Ward (2007) and altered EEG effects for coloured stimuli (Barnett et al., 2008; Goller et al., 2009) in synaesthetes have been reported before, supporting our finding of altered colour processing in synaesthetes.
Our findings are interesting with regard to the intricate relationship between synaesthesia and attention (Smilek et al., 2003; Mattingley et al., 2006; Sagiv et al., 2006a; Carriere et al., 2009). Behavioural studies have shown that synaesthetic colour can increase the efficiency

Chapter 5
101
of visual search tasks (Ramachandran and Hubbard, 2001b; Palmeri et al., 2002; Smilek et al., 2003; Carriere et al., 2009; Ward et al., 2010, but see Edquist et al., 2006, and Rothen and Meier, 2009). However, true pop-out effects have not been reported. Effects resembling pop-out may only happen when the synaesthesia inducing stimulus is in the focus of attention (Laeng et al., 2004; Sagiv et al., 2006a), suggesting that some spatial attention is necessary for synaesthesia to be elicited (Ward et al., 2007; Ward et al., 2010). Our behavioural results show that even when not fully attended, synaesthesia-inducing stimuli were causing behavioural interference on a Stroop task (Rich and Mattingley, 2003). At the same time, synaesthetes still followed the cue in the synaesthesia condition when the synaesthesia-inducing stimuli had to be ignored. Thus, unlike in the colour condition, attention was not attracted fully to the synaesthesia-inducing stimulus. But the correlation between alpha modulation and synaesthetic interference was significant for the attended as well as the unattended synaesthesia condition. Similarly, synaesthesia inducing stimuli in both the attended and unattended condition led to a contralateral decrease in alpha power, indicating that attention was allocated to the stimuli even when they were not explicitly cued. In short, we find that attention grabbing effects of synaesthesia inducing stimuli are not as strong as those of real colour stimuli. We argue that as soon as synaesthetic colour is elicited after grapheme processing has reached the appropriate level this colour can guide and capture attention. As far as we know, the neural correlates of attentional capture by synaesthesia-inducing stimuli have not been reported before. Our electrophysiological results suggest that colour (real as well as synaesthetic colour) automatically leads to the location-specific allocation of attention in synaesthetes. This points to a qualitative difference in colour processing between synaesthetes and controls. The location-specific automatic shift of attention to colour can possibly explain how colour is bound to the grapheme during the initial development of synaesthesia, a theory of which the predictions can be tested in future research.


Chapter 6 Summary and Discussion
D I GG I T S
AEIOUY
T H E AA L P H AA B E T
0123456789
V4
SPL
LSA
S Y S Y N A E S T H E S I A A E S T H E S I A
C O L O U R
B O T T O M M - U P
T O P - D D O W N
R E P E T I T I O N S U P P R E S S I O N
C M
E G
A L P H A
O W E R
O S C I L L A T I O N S
BRAIN
PROJE
TORS
ASSOCIATORS
f M R I

104

Chapter 6
105
Summary The goal of the research in this thesis was to unravel the neural mechanisms of synaesthesia. I investigated grapheme-colour synaesthesia in which letters and/or digits elicit colours. The two most influential neural hypotheses about the neural correlates of synaesthesia propose that it is caused either by increased anatomical connections between grapheme and colour areas (cross-wiring theory (Ramachandran and Hubbard, 2001b)), or by altered functional pathways from higher-order intermediate areas (disinhibited feedback theory (Grossenbacher and Lovelace, 2001)). Also, it is known that both colour areas and areas in the parietal lobe are involved in establishing synaesthesia (Hubbard, 2007a; Weiss and Fink, 2009). During our investigations, it was crucial to take individual differences between synaesthetes into account (e.g. Dixon et al., 2004); whereas ‘projector’ synaesthetes perceive their colours ‘out there’, ‘associators’ report a strong internal association of the colour. In the following paragraphs I briefly summarise our experiments. First, we investigated whether the neural correlates of synaesthesia-induced colour and real colour experience are truly shared. Although enhanced brain activity for synaesthesia in colour areas has been found (e.g. Hubbard et al., 2005b; Sperling et al., 2006), we wanted to know whether synaesthetic colour could (similarly to real colour) influence real colour processing in the brain. We applied repetition suppression in fMRI and hypothesised that if synaesthetic colour and real colour share the same neuronal representations, a synaesthetically induced colour should be affecting subsequent presentations of real colour. In that case the BOLD response to real colour should be decreased. Before we investigated synaesthesia-induced effects, we showed that repetition of real colour stimuli indeed decreased the BOLD response in colour sensitive regions (Chapter 2). A condition in which the same colour was sequentially presented two times (reduction in the BOLD response expected) was compared to a condition in which two different colours were shown (no reduction expected). In specifically defined regions of interest we found reductions of the BOLD response in bilateral V4α (anterior V4 complex) but not in V4, suggesting that neurons in V4α are more specifically tuned for colour than neurons in V4. After establishing repetition suppression for real colour in V4α, we repeated the experiment with synaesthetic colours (Chapter 3). After a letter or digit that induced synaesthesia, a coloured patch was presented in either the same colour as the synaesthetic colour (synaesthetic colour repetition) or a different colour (no repetition). We found no effects of synaesthetic colour repetition; there were no reductions of the BOLD response due to synaesthetic colour. We concluded that synaesthetic colour and real colour do not share exactly the same neuronal representation in the brain. Synaesthetically induced colour and real colour are possibly processed by different functional pathways, resulting in differences in the neuronal populations subserving both types of colour perception. We also performed a synaesthesia-localiser experiment (Chapter 3) in which participants passively viewed synaesthesia-inducing and control stimuli. We found effects of synaesthesia in right posterior fusiform gyrus (V4) and in the left superior parietal lobule (SPL), in line with previous studies (Nunn et al., 2002; Hubbard et al., 2005b; Weiss

Summary and Discussion
106
et al., 2005; Sperling et al., 2006; Beeli et al., 2008). Interestingly, we needed two different fMRI contrasts to identify both effects. Synaesthetic colour led to significantly more activity than the absence of colour, but only in colour sensitive area V4. Interestingly, synaesthetic colour compared to the presence of real colour led to significantly more activity only in SPL, reflecting the synaesthetic quality of colour perception. Many neuroimaging studies report activity in either colour sensitive areas or in parietal lobe. Our results suggest that these differences between studies may be due to the experimental task that was used or due to the aspect of synaesthesia that was under investigation (Cohen Kadosh et al., 2007b; Weiss and Fink, 2009). In Chapter 3, associator synaesthetes showed more activation of SPL than our group of ‘mental screen projectors’. We explicitly explored the individual differences between synaesthetes in Chapter 4, by studying patterns of connectivity within the synaesthesia network. We applied dynamic causal modelling for fMRI (Stephan et al., 2010) and created two models: in model 1, synaesthesia modulated a bottom-up, direct pathway of V4 activation via the grapheme area (cross-wiring theory) while in model 2, synaesthesia modulated a top-down, indirect pathway of V4 activation via SPL (disinhibition theory). Neither model was preferred when we compared the models across all synaesthetes. For projector synaesthetes however, the bottom-up model explained the data much better, while for the associators the top-down model was strongly preferred. We showed that subjective experiences of projectors and associators can be explained by differences in connectivity within the same network of areas. This principle may hold beyond synaesthesia alone. The results also suggest that there is a place for both cross-activation accounts of synaesthesia. A question remaining from Chapter 4 is whether synaesthesia is mediated by anatomical connections or functional, disinhibited pathways. An oscillatory rhythm that has been linked to functional inhibition is the 10 Hz alpha rhythm (Klimesch et al., 2007). Can alpha oscillations provide evidence for reduced inhibition as an underlying cause of synaesthesia? In Chapter 5, we used magnetoencephalography (MEG) and an attentional cuing paradigm to assess alpha power for synaesthetes and controls. For coloured stimuli, synaesthetes strongly lateralised alpha power, leading to a decrease in alpha power in the hemisphere contralateral to the coloured stimulus, and an ipsilateral increase. This pattern was seen independent of an attentional cue. Controls only showed general alpha decreases for colour. For synaesthetic colour, synaesthetes showed a similar but weaker alpha pattern than for real colour, and the alpha lateralisation correlated with behavioural reaction time interference due to synaesthesia. Because the observed decreases in alpha power are not specific for synaesthesia and are even stronger for real colour than for synaesthesia, we cannot interpret our results in terms of disinhibited feedback for synaesthetes. The results suggest that colour (real as well as synaesthetic) automatically leads to a location-specific allocation of attention in synaesthetes, which may facilitate binding processes between the colour and grapheme during the initial development of synaesthesia. Strengthening of functional coupling may eventually lead to increased anatomical connectivity in synaesthetes. Mainly projectors participated in the MEG study; it would be necessary to
Chapter 6
107
also study associator synaesthetes with MEG to see how the alpha lateralisation patterns would differ. Discussion If we consider all the findings in this thesis together, what would these contribute to the current understanding of the neural correlates of synaesthesia? I will discuss which neural mechanism is most plausible in the light of our findings, and propose explanations for the differences between projector and associator synaesthetes. Also, how can we use our insights to explain other forms of synaesthesia? Finally I will discuss future directions and outstanding issues in synaesthesia research. Proposed neural mechanism Results from our localiser experiment (Chapter 3) suggest that the perceptual experience of synaesthetic colour is generated in colour areas in the fusiform gyrus in ventral-occipital cortex. Although our results alone are not enough to conclude that activity in V4 is necessary for synaesthetic colour perception, our results support previous evidence for this hypothesis (Paulesu et al., 1995; Nunn et al., 2002; Hubbard et al., 2005b; Sperling et al., 2006). In the same localiser experiment, we showed that synaesthetic colour leads to stronger activity than real colour in the superior parietal lobe (SPL) for synaesthetes compared to controls. We propose that the SPL activity is due to increased binding processes for synaesthesia. The separation of the processing of physical colour and the binding processes that lead to the conscious perception of synaesthesia in two different anatomical locations is in line with the two-stage model of synaesthesia as proposed by Hubbard (Hubbard, 2007b; Hubbard, 2007a). It is also supported by other studies that demonstrate the necessity of SPL in synaesthetic binding (Esterman et al., 2006; Muggleton et al., 2007; Weiss and Fink, 2009). Thus, if we assume that we know which processes take place in both regions that are important for synaesthesia, the question that remains is how these processes happen. How are the different areas connected and working together to result in the experience of synaesthesia with all its idiosyncratic individual differences between synaesthetes? Projector synaesthetes From the priming experiment in Chapter 3 we have deduced that synaesthetic colour is not equivalent to real colour in terms of colour-induced fMRI-adaptation processes, and that synaesthetic and real colour are most likely not represented in exactly the same neurons. If different functional pathways lead to the activation of colour area V4 in synaesthetes, neurons with different local connectivity patterns or different functions within V4 may be involved in synaesthetic versus real colour. We know that V4 is not only involved in colour processing but is also important for form and texture perception (e.g. Cavina-Pratesi et al., 2010). Our dynamic causal modelling results (Chapter 4) strongly suggest that the pathway by which V4 is activated, ultimately determines the exact nature
Summary and Discussion
108
of the perceptual colour experience of the synaesthete. We therefore focus on the possible activation pathways and neural mechanisms related to V4 activation. For projector synaesthetes, we show that an effective connectivity model with direct coupling between the grapheme area and colour area – modulated by synaesthesia - explains the data the best (Chapter 4). Local connectivity within these sensory areas parallels the subjective reports given by projectors in which they describe that the synaesthetic colours are present at the location of the graphemes themselves and are perceptually real (Dixon et al., 2004). Sensory areas with a topographical organisation can mediate these localised subjective experiences. As shown by the pattern of alpha oscillations for coloured stimuli (Chapter 5), projector synaesthetes show altered processing of coloured stimuli. They automatically allocate attention to colour in a spatially selective way. We would like to emphasize that the differences in colour processing are related to attentional processes and not to the anatomical location of colour processing in synaesthetes (in Chapter 2, we found no group differences in location). We argue that local attention to colour, when coinciding with the location of a grapheme can lead to strengthening of local connections between grapheme and colour processing neurons. Strengthening of functional connections may eventually result in anatomical differences (Buchel and Friston, 1997; Draganski et al., 2004; Hensch, 2005; Noppeney et al., 2005; Bedny et al., 2010) between synaesthetes and non-synaesthetes. Connections that are strengthened during development may later resist pruning during brain maturation (Rakic et al., 1986; Bourgeois and Rakic, 1993; Luo and O'Leary, 2005), but the exact mechanism by which anatomy is changed in synaesthetes remains to be determined.
Increased grey matter density and volume have been found for synaesthetes compared to non-synaesthetes in parietal and ventral-occipital areas (Jäncke et al., 2009; Weiss and Fink, 2009; Rouw and Scholte, 2010). In ventral occipital areas there is evidence that white matter coherence correlates with projector-associator status; projectors show more coherent white matter structure indicating stronger anatomical connectivity (Rouw and Scholte, 2007). Also specifically in sensory areas, grey matter density is increased for projector versus associator synaesthetes (Rouw and Scholte, 2010). For projector synaesthetes, our findings and the previous literature suggest that the most likely neural mechanism of synaesthesia is anatomical cross-wiring in the fusiform gyrus. Neither patterns of alpha oscillations nor effective connectivity patterns suggest that reduced inhibition from parietal regions plays a significant role in projector synaesthesia. All results converge on a direct pathway from the grapheme to the colour area in fusiform gyrus, after which information is combined in superior parietal lobe. This interpretation is also supported by previous literature showing rapid activation of area V4 during projector synaesthesia (Beeli et al., 2008; Brang et al., 2010) and faster effects of synaesthetic colour in Stroop tasks for projector versus associator synaesthetes (Dixon et al., 2004; Ward et al., 2007). Associator synaesthetes

Chapter 6
109
For associator synaesthetes, however, our results cannot easily be interpreted in terms of V4 activation through direct local connections from the grapheme to the colour area. Instead, effective connectivity models demonstrate that for associators, activation first reaches parietal regions and V4 is activated only later by means of a top-down mechanism that resembles perceptual imagery (Chapter 4). Parietal regions are also activated more strongly during synaesthesia for associators (Chapter 3). Subjective experiences of associator synaesthetes (‘in the mind’s eye’) are in correspondence with the top-down, internally generated, mechanism of V4 activation. This finding emphasises once more that subjective experiences of synaesthetes are very important for the exact interpretation of experimental data (Smilek and Dixon, 2002; Dixon et al., 2004) and can directly reflect differential organisation of underlying brain networks (Chapter 4).
In our MEG study (Chapter 5), the number of associators was too small to provide conclusive information about the pattern of alpha oscillatory power for this group. We can, however, extrapolate from our results for projectors while keeping in mind the differences in subjective experience and different network organisation for associators. Together with knowledge from the existing literature, we can speculate which neural mechanism could explain associator synaesthesia. We have to keep in mind that associator synaesthesia is the type that is most frequent, and also inducible in non-synaesthetes (Cohen Kadosh et al., 2009; Meier and Rothen, 2009). Moreover, projector and associator synaesthesia are not two separate occurrences of the condition, but are both instances on a gliding scale. As already discussed in Chapter 3, some projectors (‘mental screen projectors’) project their colours onto an internally generated copy of the grapheme instead of onto the grapheme shape that is present on the paper. More intermediate forms of subjective experience have been reported (Ward et al., 2007). How, during the development of synaesthesia, does associator synaesthesia come to resemble mental imagery and rely on parietal regions for its elicitation? In Chapter 5 we show that when alpha lateralisation is increased in projector synaesthetes and hence attention is allocated to the synaesthetic colour in a more localised way, they experience more colour interference from their synaesthetic colours. From the work of Dixon et al. (2004) and Ward et al. (2007) we know that projector synaesthetes generally experience more interference from synaesthetic colour than from real colour and this pattern is reversed for associators. The authors have suggested this difference exists because associators do not experience their synaesthetic colours in the same place as the grapheme and hence experience less colour interference in the same spatial and attentional reference frame. It therefore appears highly probable that if associator synaesthetes would have been included in our MEG study they might not have shown strongly localised attentional/alpha power effects for synaesthetic colour. Alpha power decreases for synaesthesia inducing stimuli would perhaps have been less spatially specific; maybe intermediate between control participants and projector synaesthetes. A possibility is that colour-related decreases in alpha power are stronger for associator synaesthetes than for controls, but are less spatially localised than the effects of projectors. In a behavioural study with associator synaesthetes, Nijboer and Van der Stigchel (2009) have shown that synaesthesia-inducing
Summary and Discussion
110
graphemes did not induce visual capture in the same way as real colour, which may support our proposal that associator synaesthetes would not show a strong localized attentional effect for synaesthetic colour.
In projector synaesthetes, the highly localized attentional allocation to (synaesthetic) colour enables the strengthening of a very specific local coupling between neurons involved in grapheme and colour processing within the fusiform gyrus. This coupling may strengthen functional or anatomical connections that are already there by chance or by genetic disposition; in a developing brain many connections exist that do not normally survive until adulthood (Rakic et al., 1986; Bourgeois and Rakic, 1993; Luo and O'Leary, 2005). If for associators, attention is strongly upregulated for colour, but not in a spatially localised way, it may be harder in this case to establish a strong, local coupling between grapheme and colour based on shape and location. The grapheme and colour will both be processed and excess coupling can take place, but the colour representation is not clearly topographically localised and sensory in nature. We suggest that it is therefore the internal representation of the colour that becomes coupled to the grapheme i.e. the concept and a strong memory trace of the colour. Through re-activation of the grapheme-colour pairings, connections between the grapheme area and higher-order areas such as parietal lobe may be strengthened. Memory areas may also be involved; eventually, the strengthening of connections may induce a strong internal representation of the colour. As pointed out by Bargary and Mitchell (2008), feedforward connections in the brain lead to a tighter topography than feedback connections. If associator synaesthesia relies more on feedback from memory and associative areas, while projector synaesthesia is based on feedforward connections from the grapheme area, this may explain the difference in subjective experience of projectors and associators.
Our associator hypothesis fits well with the known literature. Rouw and Scholte (2010) have demonstrated that associator synaesthetes possess increased grey matter density in memory related areas compared to projector synaesthetes, implying that memory processes are involved and that an internally generated colour percept exists for associator synaesthetes. V4 may become active through this mechanism, fitting with the effective connectivity findings of top-down activation of V4 for associators (Chapter 4). Further studies will have to elucidate whether the information that reaches V4 in associators is due to excessive feedback or due to an abnormal feedforward sweep. Furthermore, several authors have demonstrated that it is possible to induce associator-like synaesthesia in non-synaesthetes (Elias et al., 2003; Cohen Kadosh et al., 2009; Meier and Rothen, 2009). If associator synaesthesia relies on strong coupling of an internal representation of colour with a grapheme, this could be possible in all of us if the appropriate association is trained, or is suggested while under the influence of hypnosis (Cohen Kadosh et al., 2009).
A question that remains is which factors determine whether someone develops into a projector or an associator synaesthete. Individual differences in the internal organisation of grapheme and colour areas and the functional coupling between them, already present in the developing synaesthetes’ brain, may influence the impact of upregulated attention

Chapter 6
111
for colour. Functional coupling between the regions could even be mediated by spurious anatomical connections that are to a certain extent present in all of us, but this remains to be determined. In projectors, internal organisation of the grapheme and colour area may be such that innate connections or functional coupling are stronger or more abundant, allowing colour information to strengthen local connections. In associators, the innate connectivity might be weaker in comparison, leading not to the strengthening of local connectivity, but to a more general coupling of colour with the grapheme. For non-synaesthetes, the connections are not strengthened because attention for colour is not upregulated; but they might still be present. This could explain why researchers have succeeded in inducing associator-like synaesthesia in non-synaesthetes (Cohen Kadosh et al., 2009; Meier and Rothen, 2009). Connections may in that case be functionally strengthened in a non-permanent way. Projector synaesthesia is less common and has not yet been induced in non-synaesthetes: we hypothesise that it relies on local, specific connections that are not easily influenced by training. Associator-synaesthesia is more resembling of colour imagery and therefore might be obtainable also for non-synaesthetes. Of course, many manifestations of synaesthesia take intermediate forms between the projector and associator variants; innate connectivity in the brain may be crucial for determining how synaesthesia is ultimately experienced. Implicit synaesthetes may be another indication that synaesthesia makes use of normal principles of cross-wiring. Implicit synaesthetes do not consciously experience synaesthesia but may score very high on a test – re-test for letter-colour synaesthesia, for instance (e.g. Ward et al., 2006b). There are also multiple crossmodal studies that show synaesthesia adheres to principles of normal crossmodal processes and thus, presumably, brain organisation (Simner et al., 2005; Sagiv and Ward, 2006; Ward et al., 2006b; Cohen Kadosh et al., 2007a). Local connectivity Another aspect of synaesthetic colour perception that suggests synaesthesia is mediated by anatomical connections, is the strong link that exists in some synaesthetes between grapheme shape and the associated colours; similarly shaped graphemes are linked with colours of similar hue (e.g. Mills et al., 2002; Sagiv and Robertson, 2005, see also Figure 1.1. on page 9). From Chapter 2 we have learned that colour-specific neurons are present in area V4α and recent literature on colour processing suggests that in the V4 complex (and in macaque area V4), colour-sensitive neurons are spatially organised according to perceptual similarity (Brouwer and Heeger, 2009; Conway and Tsao, 2009; Kotake et al., 2009). In close proximity of V4 lies the grapheme area as part of the visual word form area where visual word stimuli are processed. The visual word form area possesses an internal organisation of increasing stimulus complexity (lines to more complex symbols to variable handwritten stimuli, etc) and increasing levels of linguistic encoding (Dehaene et al., 2005; Vinckier et al., 2007; Levy et al., 2008). Moreover, preliminary results from multi-variate pattern analysis suggest that words with similar orthography lead to similar activation patterns in this region i.e. the local spatial organisation in the visual word form area may be determined by shape similarity of words and letters (Braet et al., 2010). Furthermore,

Summary and Discussion
112
area V4 itself is also important for form processing which might happen in separate subregions (e.g. Cavina-Pratesi et al., 2010; Tanigawa et al., 2010). If the grapheme area is spatially organised according to letter or word shape, and area V4 is organised according to perceptual colour similarity, local anatomical cross-wiring in synaesthetes may lead to connections between neurons that process similar letter shapes and neurons that process perceptually similar colours. If we consider the disinhibition theory, it cannot be ruled out that even if area V4 is activated by feedback mechanisms a structured shape-colour organisation may be possible. But multimodal regions are usually not as strongly topographically organised as sensory areas, which is why in this case, shape-colour correspondence may be harder to preserve. Considering these arguments, shape-colour correspondences in synaesthesia point to anatomical substrates of synaesthesia. If this organisational principle holds, and anatomical connections within fusiform gyrus are indeed slightly weaker for associator synaesthetes, we would predict that projector synaesthetes would show more shape-colour correspondences across letters than associator synaesthetes. An extensive review of letter-colour correspondences that have already been reported for projectors and associators in the literature may answer this question.
Another feature of synaesthesia that may be explained by differences in local connections between the grapheme area and V4 is the higher/lower distinction as proposed by Hubbard et al. (2005b) and Hubbard and Ramachandran (2005). This distinction is orthogonal to projector/associator differences (Ward et al., 2007) and addresses the level of grapheme processing at which synaesthesia is elicited i.e. at the level of shape (pre-recognition) or after grapheme identity is available. As mentioned above, there is evidence that the area that analyses grapheme and word stimuli is internally organised by increasing stimulus complexity and increasing levels of linguistic encoding (Dehaene et al., 2005; Vinckier et al., 2007; Levy et al., 2008). If cross-wiring in the fusiform gyrus happens at different anatomical locations that differ in the stage of linguistic processing this can explain early or late elicitation of synaesthetic colours. It should be mentioned that lower synaesthesia is not common and in our studies, no true lower synaesthetes were encountered. We can therefore not say anything definitive about this proposed mechanism. It can also not be excluded that basic shapes of letters already activate colour-sensitive neurons and that this information is subsequently used during further processing of the grapheme shape and identity: this is proposed by the reentrant theory (Smilek et al., 2001; Carriere et al., 2009) and in a slightly modified form by the cascaded cross-tuning model (Brang et al., 2010). Similarly, studies with ambiguous stimuli indicate that top-down interpretation of the grapheme influences synaesthetic colour also for projector synaesthetes (Myles et al., 2003; Dixon et al., 2006).
Other forms of synaesthesia Not all forms of synaesthesia are equally common. Grapheme-colour synaesthesia is currently being estimated to have a prevalence of around 1%, while time-colour synaesthesia may be as common as 2.8% (Simner et al., 2006), e.g. coloured days of the

Chapter 6
113
week. Time-space and number-space synaesthesias (Sagiv et al., 2006b) are also very common, although an exact estimate of their prevalence is not known. On the other hand, taste-shape synaesthesia and sound-taste synaesthesia are examples of far more rare variants (Cytowic, 1993; Beeli et al., 2005). It is interesting to speculate what could be the factors that explain differences in prevalence between synaesthesia types. At the same time, we know that the phenotype of synaesthesia may vary across generations, hence it is suggested that there is a common, heritable cause for all forms (Ward and Simner, 2005). Ideally, a neural hypothesis about the mechanism of synaesthesia would be able to explain both the differences and commonalities between synaesthesia types. Ramachandran and Hubbard (2001a) have suggested that if synaesthesia is mediated by anatomical connections, cortical distance between brain areas may explain why some forms of synaesthesia are more common than others. The areas for processing graphemes/shapes and colour are located very close together in ventral-occipital cortex at the back of the brain, while the area for processing taste, for instance, is located at the front of the brain. In order to connect the taste-area with the shape area at the back of the brain, long-distance connections would be necessary, which might be less probable to occur than relatively short connections from the grapheme to the colour area. The hypothesis is plausible and supported by the frequency of occurrence of various types of synaesthesia, for instance number-space synaesthesia, which is highly prevalent: in close proximity in parietal cortex, spatial as well as magnitude information is processed (Hubbard et al., 2005a). Pre-existing excessive connectivity or failure of inhibition between areas is seen as the main cause; the possible underlying (heritable) mechanism that causes excess connectivity is proposed to lie in the expression of neurotransmitters during development (Brang and Ramachandran, 2008) One striking fact is that most types of synaesthesia result in colour as the concurrent synaesthetic experience: in up to 77% of all forms and 95% of all instances, colour is induced (Simner et al., 2006). Why is colour so commonly present? Proximity of brain areas alone seems unlikely to be able to explain the percentage of synaesthesias involving colour. The results from our MEG study suggest that attentional mechanisms for colour are altered in synaesthetes (Chapter 5). If colour saliency is indeed different in synaesthetes, this may also explain why some forms of colour synaesthesia are relatively common. In daily life, the co-occurrence of colour and letters or numbers is not rare. Especially when people are young, coloured letters or refrigerator magnets are used to learn the alphabet (Hancock, 2006; Witthoft and Winawer, 2006) and may stimulate crossmodal coupling. Days of the week and other temporal sequences are very frequently encountered stimuli and the link to colours can be derived from calendars or diaries in colour. Also, semantics may play a role, e.g. banana→yellow; in Western society, colour perception is highly definable in language and important for object identification (Berlin and Kay, 1969). For other types of synaesthesia (e.g. music-colour synaesthesia, taste-colour), it is possible that crossmodal associations that exist in all of us (e.g. pitch-brightness, Ward et al., 2006b) allow synaesthetes to create special associations under the influence of colour saliency. The question that remains is what could be the heritable

Summary and Discussion
114
component, if synaesthetes possess altered attentional processing of colour. Would it be the attentional capture, i.e. the attention component, leading to abnormal saliency of an already very salient perceptual phenomenon? Colour is seen as one of the most attentional salient inputs to our sensory system (Treisman and Gelade, 1980). Or would the difference lie in colour processing, i.e. in the hardware of colour perception? Another possibility is that slightly enhanced attention for colour is combined with a heightened ability for crossmodal association, leading to extremely strong binding processes where non-synaesthetes would only show weak coupling. All these probabilities may lead to suggestions for candidate genes for exploratory genetics studies (Asher et al., 2009). Another very frequent synaesthesia type that does not (always) involve colour, is number-shape synaesthesia (Sagiv et al., 2006b). Also referred to as number-line synaesthesia, this type may be due to abnormal cross-wiring between space and magnitude processing regions in the parietal lobe (Hubbard et al., 2005a). Number-line synaesthetes visualise numbers (and often also time-units like years and decades) as if they are organised on a mental line, stretching out in the personal space surrounding them. Number-lines do not always include colour and altered colour processing cannot readily explain this type. We can, however, speculate that number-line synaesthesia may be due to altered spatial attentional processes, similar to the observed localised spatial attention for colour in Chapter 5. If in synaesthetes in general, attention operates in a more local, spatially specific way, it is possible that attention to numbers and other items in sequences is also more local. In this case, the relative position of numbers in space may become more important in order to process them in a sequence, making space an explicit part of number processing. It has been hypothesized (Baron-Cohen, 2006; Bor et al., 2007), in relation to autism spectrum disorder, that spatially focused attention can help to bind contiguous stimuli in a sequence together, and aid the chunking of such sequences. Similar processes may operate in synaesthetes, in which relatively small differences in spatial attention affect crossmodal coupling. To my knowledge as of yet, detailed (eye-movement) studies on local attention processes in synaesthetes have not been performed. The predictions would be that these synaesthetes would show altered, more localised spatial attention (e.g. different eye-movements when viewing sequences of information). With regard to neuroimaging studies, the predictions for number-line synaesthesia would be that parietal cortex is involved. In a case-study on a late-blind subject who experiences time-space synaesthesia, we have shown that parietal cortex is indeed activated (Niccolai et al., 2011, Niccolai et al., submitted). Relating synaesthesia to autism spectrum disorder and schizophrenia Although people with synaesthesia usually do not report any clinical problems due to their condition (but see Hochel and Milán, 2008, for possible negative aspects of synaesthesia), synaesthesia does share some traits with neurodevelopmental disorders like autism spectrum disorder (ASD) and schizophrenia. Synaesthesia is caused by altered connectivity patterns in the brain and major hypotheses about the impairments in ASD and schizophrenia suggest that dysfunctional interactions between brain regions may be the

Chapter 6
115
underlying cause. In ASD, high local connectivity may be combined with low long-range connectivity (Belmonte et al., 2004; Just et al., 2004; Noriuchi et al., 2010). In schizophrenia, there is evidence of abnormally high functional connectivity within the default mode network during rest and task (Pomarol-Clotet et al., 2008; Whitfield-Gabrieli et al., 2009), while structural connectivity as measured by white matter and grey matter density is decreased (Chua et al., 2007; Ellison-Wright et al., 2008). Long-range synchronisation is also impaired (e.g. Uhlhaas et al., 2006). In both disorders, impairments in audio-visual integration have been reported (Magnee et al., 2009). And where synaesthetes tend to bind different types of information together and ‘hyperbinding’ is proposed as a mechanism (Sagiv and Robertson, 2005), people suffering from schizophrenia have trouble with perceptual organisation, i.e. with combining different detailed sections of a picture into a coherent whole (Uhlhaas and Silverstein, 2005). We have also shown that in synaesthetes, attention for coloured stimuli may be altered, and have speculated that spatial attention in synaesthetes operates in a locally enhanced fashion. In ASD, it is known that patients have problems with social attention and with shifting attention (Belmonte, 2000), and facilitation effects (failure to inhibit) have been reported for coloured stimuli (Brian et al., 2003). In schizophrenia, there is evidence that patients have problems with both inhibiting distracting information and with focusing on relevant information (Gur et al., 2007). When investigating the mechanisms of synaesthesia, it is worthwhile to realize that attentional and connectivity problems in ASD and schizophrenia might be different instances on a scale of related mechanisms. Of course, studying the mechanisms of synaesthesia can equally provide new insights for the underlying cause of ASD and schizophrenia. Future outlook Even the current, already extensive existing literature on synaesthesia can not yet provide a complete picture of the phenomenon. Because of the relevance of synaesthesia for many other areas of research, unravelling the neural mechanisms is a worthwhile endeavour and will hopefully eventually lead to a full understanding of synaesthesia. The outstanding questions are not easy. Is synaesthesia based on anatomical connectivity, or is anatomical connectivity induced by strengthening of functional connections? Learning studies and studies of developing synaesthetes may provide an answer to this question. Another, very interesting area is the relationship between synaesthesia and consciousness. Past research has demonstrated that subjective experiences of synaesthetes are important for the interpretation of data, but what can synaesthesia itself teach us about consciousness? In other disorders of consciousness, e.g. hallucinations during psychosis, the boundaries between real and hallucinated perception are often faded. Synaesthetes are aware that their synaesthetic experiences are not similar to veridical perception. Yet they have perceptual experiences that are not based on physical stimuli. This dichotomy may provide an excellent opportunity for consciousness researchers to investigate what makes a conscious percept ‘real’. Similarly, in this thesis we show that intrinsic connectivity within a brain
Summary and Discussion
116
network determines conscious experiences; this knowledge can be of great value for studying the mechanisms of consciousness. Recent neuroimaging studies (Rouw and Scholte, 2010) and the effective connectivity study in this thesis (Chapter 4) have made clear that it is important to study how different brain regions interact during the experience of synaesthesia. Identifying single brain areas is no longer informative; it is the intrinsic organisation of the underlying network of brain areas that is necessary to explain the full subjective experience of synaesthesia. In the future, dynamic causal modelling, psycho-physiological interactions and other connectivity methods may be able to unravel the networks that underlie other types of synaesthesia besides grapheme-colour synaesthesia. Eventually, commonalities and differences between synaesthesia types may become clearer through connectivity studies and in turn inform geneticists about possible candidate mechanisms and genes to explore.
References
117
References Aghajanian GK, Marek GJ (1999) Serotonin and hallucinogens. Neuropsychopharmacol 21:S16-
S23. Armel KC, Ramachandran VS (1999) Acquired synesthesia in retinitis pigmentosa. Neurocase
5:293-296. Asher JE, Lamb JA, Brocklebank D, Cazier J-B, Maestrini E, Addis L, Sen M, Baron-Cohen S,
Monaco AP (2009) A Whole-Genome Scan and Fine-Mapping Linkage Study of Auditory-Visual Synesthesia Reveals Evidence of Linkage to Chromosomes 2q24, 5q33, 6p12, and 12p12. Am J Hum Genet 84:279-285.
Barbur JL, Spang K (2008) Colour constancy and conscious perception of changes of illuminant. Neuropsychologia 46:853-863.
Bargary G, Mitchell KJ (2008) Synaesthesia and cortical connectivity. Trends Neurosci 31:335-342. Barnett KJ, Foxe JJ, Molholm S, Kelly SP, Shalgi S, Mitchell KJ, Newell FN (2008) Differences in
early sensory-perceptual processing in synesthesia: A visual evoked potential study. NeuroImage 43:605-613.
Baron-Cohen S (2006) The hyper-systemizing, assortative mating theory of autism. Prog Neuro-Psychopharmacol Biol Psychiatry 30:865-872.
Baron-Cohen S, Wyke MA, Binnie C (1987) Hearing words and seeing colours: an experimental investigation of a case of synaesthesia. Perception 16:761-767.
Baron-Cohen S, Burt L, Smith-Laittan F, Harrison J, Bolton P (1996) Synaesthesia: prevalence and familiarity. Perception 25:1073-1079.
Bartels A, Zeki S (2000) The architecture of the colour centre in the human visual brain: new results and a review. Eur J Neurosci 12:172-190.
Bastiaansen MCM, Knosche TR (2000) Tangential derivative mapping of axial MEG applied to event-related desynchronization research. Clin Neurophysiol 111:1300-1305.
Beauchamp MS, Ro T (2008) Neural Substrates of Sound-Touch Synesthesia after a Thalamic Lesion. J Neurosci 28:13696-13702.
Beauchamp MS, Haxby JV, Jennings JE, DeYoe EA (1999) An fMRI version of the Farnsworth-Munsell 100-Hue test reveals multiple color-selective areas in human ventral occipitotemporal cortex. Cereb Cortex 9:257-263.
Bedny M, Konkle T, Pelphrey K, Saxe R, Pascual-Leone A (2010) Sensitive Period for a Multimodal Response in Human Visual Motion Area MT/MST. Curr Biol 20:1900-1906.
Beeli G, Esslen M, Jäncke L (2005) When coloured sounds taste sweet. Nature 434:38. Beeli G, Esslen M, Jancke L (2008) Time course of neural activity correlated with colored-hearing
synesthesia. Cereb Cortex 18:379-385. Belmonte M (2000) Abnormal Attention in Autism Shown by Steady-State Visual Evoked
Potentials. Autism 4. Belmonte M, Allen G, Beckel-Mitchener A, Boulanger L, Carper R, Webb S (2004) Autism and
Abnormal Development of Brain Connectivity. J Neurosci 24. Berger H (1929) Über das Elektroenkephalogramm des Menschen. Archiv für Psychiatrie und
Nervenkrankheiten 87 527-570. Berlin B, Kay P (1969) Basic Color Terms: Their Universality and Evolution. Berkeley, USA:
University of California Press. Block N (2005) Two neural correlates of consciousness. Trends Cogn Sci 9:46-52. Bonath B, Noesselt T, Martinez A, Mishra J, Schwiecker K, Heinze H-J, Hillyard SA (2007) Neural
Basis of the Ventriloquist Illusion. Curr Biol 17:1697-1703.
References
118
Bor D, Billington J, Baron-Cohen S (2007) Savant Memory for Digits in a Case of Synaesthesia and Asperger Syndrome is Related to Hyperactivity in the Lateral Prefrontal Cortex. Neurocase 13:311 - 319.
Bourgeois JP, Rakic P (1993) Changes of synaptic density in the primary visual-cortex of the macaque monkey from fetal to adult stage. J Neurosci 13:2801-2820.
Braet W, Wagemans J, Op de Beeck HP (2010) Distinct response patterns for individual words in the “visual word form area”. In: 16th Annual Meeting of the Organization for Human Brain Mapping. Barcelona, Spain.
Brang D, Ramachandran VS (2008) Psychopharmacology of synesthesia; the role of serotonin S2a receptor activation. Med Hypoth 70:903-904.
Brang D, Ramachandran VS (2010) Visual field heterogeneity, laterality, and eidetic imagery in synesthesia. Neurocase 16:169-174.
Brang D, Hubbard EM, Coulson S, Huang M, Ramachandran VS (2010) Magnetoencephalography reveals early activation of V4 in grapheme-color synesthesia. NeuroImage 53:268-274.
Brett M, Anton J-L, Valabregue R, Poline J-B (2002) Region of interest analysis using an SPM toolbox [Abstract]. 8th International Conference on Functional Mapping of the Human Brain, Sendai, Japan.
Brewer AA, Liu J, Wade AR, Wandell BA (2005) Visual field maps and stimulus selectivity in human ventral occipital cortex. Nat Neurosci 8:1102-1109.
Brian JA, Tipper SP, Weaver B, Bryson SE (2003) Inhibitory mechanisms in autism spectrum disorders: typical selective inhibition of location versus facilitated perceptual processing. J Child Psychol Psychiatry Allied Discip 44:552-560.
Brouwer GJ, Heeger DJ (2009) Decoding and Reconstructing Color from Responses in Human Visual Cortex. J Neurosci 29:13992-14003.
Buchel C, Friston KJ (1997) Modulation of connectivity in visual pathways by attention: Cortical interactions evaluated with structural equation modelling and fMRI. Cereb Cortex 7:768-778.
Büchel C, Friston KJ (1997) Modulation of connectivity in visual pathways by attention: cortical interactions evaluated with structural equation modelling and fMRI. Cereb Cortex 7:768-778.
Buzsáki G (2006) Rhythms of the brain. New York: Oxford University Press. Cant J, Arnott S, Goodale M (2009) fMR-adaptation reveals separate processing regions for the
perception of form and texture in the human ventral stream. Exp Brain Res 192:391-405-405. Caporale N, Dan Y (2008) Spike timing-dependent plasticity: A Hebbian learning rule. Annu Rev
Neurosci 31:25-46. Carriere JSA, Eaton D, Reynolds MG, Dixon MJ, Smilek D (2009) Grapheme-Color Synesthesia
Influences Overt Visual Attention. J Cogn Neurosci 21:246-258. Cavina-Pratesi C, Kentridge RW, Heywood CA, Milner AD (2010) Separate Processing of Texture
and Form in the Ventral Stream: Evidence from fMRI and Visual Agnosia. Cereb Cortex 20:433-446.
Chawla D, Rees G, Friston KJ (1999) The physiological basis of attentional modulation in extrastriate visual areas. Nat Neurosci 2:671-676.
Chua S, Cheung C, Cheung V, Tsang J, Chen E, Wong J, Cheung J, Yip L, Tai K, Suckling J, McAlonan G (2007) Cerebral grey, white matter and csf in never-medicated, first-episode schizophrenia. Schizophr Res 89:12-21.
Cohen Kadosh R, Henik A (2007) Can synaesthesia research inform cognitive science? Trends Cogn Sci 11:177-184.
Cohen Kadosh R, Henik A, Walsh V (2007a) Small is bright and big is dark in synaesthesia. Curr Biol 17:R834-R835.
Cohen Kadosh R, Cohen Kadosh K, Henik A (2007b) The neuronal correlate of bidirectional synesthesia: A combined event-related potential and functional magnetic resonance imaging study. J Cogn Neurosci 19:2050-2059.
References
119
Cohen Kadosh R, Henik A, Catena A, Walsh V, Fuentes LJ (2009) Induced Cross-Modal Synaesthetic Experience Without Abnormal Neuronal Connections. Psychol Sci 20:258-265.
Conway BR (2009) Color vision, cones, and color-coding in the cortex. Neuroscientist 15:274-290. Conway BR, Tsao DY (2009) Color-tuned neurons are spatially clustered according to color
preference within alert macaque posterior inferior temporal cortex. PNAS 106:18034-18039. Conway BR, Moeller S, Tsao DY (2007) Specialized color modules in macaque extrastriate cortex.
Neuron 56:560-573. Corbetta M, Shulman GL, Miezin FM, Petersen SE (1995) Superior Parietal Cortex Activation
During Spatial Attention Shifts and Visual Feature Conjunction. Science 270:802-805. Corbetta M, Miezin F, Dobmeyer S, Shulman G, Petersen S (1991) Selective and divided attention
during visual discriminations of shape, color, and speed: functional anatomy by positron emission tomography. J Neurosci 11:2383-2402.
Cytowic RE (1993) The Man Who Tasted Shapes. Cambridge: MIT Press. Cytowic RE (1995) Synesthesia: Phenomenology and neuropsychology. A review of current
knowledge. PSYCHE 2:http://psyche.cs.monash.edu.au/v2/psyche-2-10-cytowic.html. Day S (2010) Types of synesthesia. Retrieved from: http://homecomcastnet/~seanday/html/
typeshtm. Dehaene S, Cohen L, Sigman M, Vinckier F (2005) The neural code for written words: a proposal.
Trends Cogn Sci 9:335-341. Dehaene S, Le Clec HG, Poline JB, Le Bihan D, Cohen L (2002) The visual word form area: a
prelexical representation of visual words in the fusiform gyrus. Neuroreport 13:321-325. Dehaene S, Changeux JP, Naccache L, Sackur J, Sergent C (2006) Conscious, preconscious, and
subliminal processing: a testable taxonomy. Trends Cogn Sci 10:204-211. Dixon MJ, Smilek D (2005) The importance of individual differences in grapheme-color
synesthesia. Neuron 45:821-823. Dixon MJ, Smilek D, Merikle PM (2004) Not all synaesthetes are created equal: Projector versus
associator synaesthetes. Cogn Affect Behav Neurosci 4:335-343. Dixon MJ, Smilek D, Cudahy C, Merikle PM (2000) Five plus two equals yellow. Nature 406:365. Dixon MJ, Smilek D, Duffy PL, Zanna MP, Merikle PM (2006) The role of meaning in grapheme-
colour synaesthesia. Cortex 42:243-252. Draganski B, Gaser C, Busch V, Schuierer G, Bogdahn U, May A (2004) Changes in grey matter
introduced by training. Nature 427:311-312. Eagleman DM, Goodale MA (2009) Why color synesthesia involves more than color. Trends Cogn
Sci 13:288-292. Edquist J, Rich AN, Brinkman C, Mattingley JB (2006) Do synaesthetic colours act as unique
features in visual search? Cortex 42:222-231. Eickhoff SB, Stephan KE, Mohlberg H, Grefkes C, Fink GR, Amunts K, Zilles K (2005) A new SPM
toolbox for combining probabilistic cytoarchitectonic maps and functional imaging data. NeuroImage 25:1325-1335.
Elias LJ, Saucier DM, Hardie C, Sarty GE (2003) Dissociating semantic and perceptual components of synaesthesia: behavioural and functional neuroanatomical investigations. Cogn Brain Res 16:232-237.
Ellison-Wright I, Glahn D, Laird A, Thelen S, Bullmore E (2008) The anatomy of first-episode and chronic schizophrenia: An anatomical likelihood estimation meta-analysis. Am J Psych 165:1015-1023.
Ergenoglu T, Demiralp T, Bayraktaroglu Z, Ergen M, Beydagi H, Uresin Y (2004) Alpha rhythm of the EEG modulates visual detection performance in humans. Cogn Brain Res 20:376-383.
Esterman M, Verstynen T, Ivry RB, Robertson LC (2006) Coming unbound: disrupting automatic integration of synesthetic color and graphemes by transcranial magnetic stimulation of the right parietal lobe. J Cogn Neurosci 18:1570-1576.
References
120
Flowers DL, Jones K, Noble K, VanMeter J, Zeffiro TA, Wood FB, Eden GF (2004) Attention to single letters activates left extrastriate cortex. NeuroImage 21:829-839.
Foxe JJ, Simpson GV, Ahlfors SP (1998) Parieto-occipital similar to 10 Hz activity reflects anticipatory state of visual attention mechanisms. Neuroreport 9:3929-3933.
Friston KJ, Stephan KE (2007) Free-energy and the brain. Synthese 159:417-458. Friston KJ, Harrison L, Penny W (2003) Dynamic causal modelling. NeuroImage 19:1273-1302. Frith C, Perry R, Lumer E (1999) The neural correlates of conscious experience: an experimental
framework. Trends Cogn Sci 3:105-114. Fu KMG, Foxe JJ, Murray MM, Higgins BA, Javitt DC, Schroeder CE (2001) Attention-dependent
suppression of distracter visual input can be cross-modally cued as indexed by anticipatory parieto-occipital alpha-band oscillations. Cogn Brain Res 12:145-152.
Galton F (1883/1996) Colour Associations. In: Synaesthesia: Classic and Contemporary Readings (Harrison J, Baron-Cohen S, eds), pp 43-48. Oxford: Blackwell Publishers.
Garrett AS, Flowers DL, Absher JR, Fahey FH, Gage HD, Keyes JW, Porrino LJ, Wood FB (2000) Cortical activity related to accuracy of letter recognition. NeuroImage 11:111-123.
Goller AI, Otten LJ, Ward J (2009) Seeing Sounds and Hearing Colors: An Event-related Potential Study of Auditory-Visual Synesthesia. J Cogn Neurosci 21:1869-1881.
Grill-Spector K, Henson RNA, Martin A (2006) Repetition and the brain: neural models of stimulus-specific effects. Trends Cogn Sci 10:15-23.
Griswold MA, Jakob PM, Heidemann RM, Nittka M, Jellus V, Wang J, Kiefer B, Haase A (2002) Generalized autocalibrating partially parallel acquisitions (GRAPPA). Magn Reson Med 47:1202-1210.
Grossenbacher PG (1996) Perception and sensory information in synaesthetic experience. In: Synaesthesia: Classic and Contemporary Readings (Harrison J, Baron-Cohen S, eds). Oxford: Blackwell Publishers.
Grossenbacher PG, Lovelace CT (2001) Mechanisms of synesthesia: cognitive and physiological constraints. Trends Cogn Sci 5:36-41.
Gur RE, Turetsky BI, Loughead J, Snyder W, Kohler C, Elliott M, Pratiwadi R, Ragland JD, Bilker WB, Siegel SJ, Kanes SJ, Arnold SE, Gur RC (2007) Visual Attention Circuitry in Schizophrenia Investigated With Oddball Event-Related Functional Magnetic Resonance Imaging. Am J Psych 164:442-449.
Hadjikhani N, Liu AK, Dale AM, Cavanagh P, Tootell RBH (1998) Retinotopy and color sensitivity in human visual cortical area V8. Nat Neurosci 1:235-241.
Haegens S, Osipova D, Oostenveld R, Jensen O (2010) Somatosensory Working Memory Performance in Humans Depends on Both Engagement and Disengagement of Regions in a Distributed Network. Hum Brain Mapp 31:26-35.
Hämäläinen M, Hari R, Ilmoniemi RJ, Knuutila J, Lounasmaa OV (1993) Magnetoencephalography - Theory, instrumentation, and applications to noninvasive studies of the working human brain. Rev Mod Phys 65:413-497.
Hancock P (2006) Monozygotic twins' colour-number association: A case study. Cortex 42:147-150.
Händel BF, Haarmeier T, Jensen O (in press) Alpha Oscillations Correlate with the Successful Inhibition of Unattended Stimuli. J Cogn Neurosci 0:1-9.
Hanslmayr S, Aslan A, Staudigl T, Klimesch W, Herrmann CS, Bauml KH (2007) Prestimulus oscillations predict between and within subjects. Neuroimage 37:1465-1473.
Hartman AM, Hollister LE (1963) Effect of Mescaline, Lysergic-Acid Diethylamide and Psilocybin on Color-Perception. Psychopharmacologia 4:441-451.
Haynes J-D, Rees G (2006) Decoding mental states from brain activity in humans. Nat Rev Neurosci 7:523-534.
Hensch TK (2005) Critical period plasticity in local cortical circuits. Nat Rev Neurosci 6:877-888.
References
121
Henson RNA (2003) Neuroimaging studies of priming. Prog Neurobiol 70:53-81. Herrmann CS, Frund I, Lenz D (2010) Human gamma-band activity: A review on cognitive and
behavioral correlates and network models. Neurosci Biobehav Rev 34:981-992. Hochel M, Milán EG (2008) Synaesthesia: The existing state of affairs. Cogn Neuropsychol 25:93-
117. Hong SW, Blake R (2008) Early visual mechanisms do not contribute to synesthetic color
experience. Vision Res 48:1018-1026. Horner AJ, Henson RN (2008) Priming, response learning and repetition suppression.
Neuropsychologia 46:1979-1991. Hubbard EM (2007a) Neurophysiology of synesthesia. Curr Psychiatr Rep 9:193-199. Hubbard EM (2007b) A real red-letter day. Nat Neurosci 10:671-672. Hubbard EM, Ramachandran VS (2005) Neurocognitive mechanisms of synesthesia. Neuron
48:509–520. Hubbard EM, Manohar S, Ramachandran VS (2006) Contrast affects the strength of synesthetic
colors. Cortex 42:184-194. Hubbard EM, Piazza M, Pinel P, Dehaene S (2005a) Interactions between number and space in
parietal cortex. Nat Rev Neurosci 6:435-448. Hubbard EM, Arman AC, Ramachandran VS, Boynton GM (2005b) Individual differences among
grapheme-color synesthetes: Brain-behavior correlations. Neuron 45:975-985. Huettel SA, Song AW, McCarthy G (2004) Functional Magnetic Resonance Imaging. Sunderland,
MA, USA: Sinauer Associates, Inc. Jäncke L, Beeli G, Eulig C, Hanggi J (2009) The neuroanatomy of grapheme-color synesthesia. Eur
J Neurosci 29:1287-1293. Jensen O, Kaiser J, Lachaux JP (2007) Human gamma-frequency oscillations associated with
attention and memory. Trends Neurosci 30:317-324. Jensen O, Gelfand J, Kounios J, Lisman JE (2002) Oscillations in the alpha band (9-12 Hz) increase
with memory load during retention in a short-term memory task. Cereb Cortex 12:877-882. Jokisch D, Jensen O (2007) Modulation of gamma and alpha activity during a working memory
task engaging the dorsal or ventral stream. J Neurosci 27:3244-3251. Just M, Cherkassky V, Keller T, Minshew N (2004) Cortical activation and synchronization during
sentence comprehension in high-functioning autism: evidence of underconnectivity. Brain 127:1811-1821.
Kelly SP, Lalor EC, Reilly RB, Foxe JJ (2006) Increases in alpha oscillatory power reflect an active retinotopic mechanism for distracter suppression during sustained visuospatial attention. J Neurophysiol 95:3844-3851.
Kim C-Y, Blake R, Palmeri TJ (2006) Perceptual interaction between real and synesthetic colors. Cortex 42:195-203.
Klimesch W, Sauseng P, Hanslmayr S (2007) EEG alpha oscillations: The inhibition-timing hypothesis. Brain Res Rev 53:63-88.
Klink PC, Brascamp JW, Blake R, van Wezel RJA (2010) Experience-Driven Plasticity in Binocular Vision. Curr Biol 20:1464-1469.
Kotake Y, Morimoto H, Okazaki Y, Fujita I, Tamura H (2009) Organization of color-selective neurons in macaque visual area V4. J Neurophysiol 102:15-27.
Kronbichler M, Hutzler F, Wimmer H, Mair A, Staffen W, Ladurner G (2004) The visual word form area and the frequency with which words are encountered: evidence from a parametric fMRI study. NeuroImage 21:946-953.
Laeng B, Svartdal F, Oelmann H (2004) Does color synesthesia pose a paradox for early-selection theories of attention? Psychol Sci 15:277-281.

References
122
Lancaster JL, Rainey LH, Summerlin JL, Freitas CS, Fox PT, Evans AC, Toga AW, Mazziotta JC (1997) Automated labeling of the human brain: A preliminary report on the development and evaluation of a forward-transform method. Hum Brain Mapp 5:238-242.
Levy J, Pernet C, Treserras S, Boulanouar K, Berry I, Aubry F, Demonet JF, Celsis P (2008) Piecemeal recruitment of left-lateralized brain areas during reading: A spatio-functional account. NeuroImage 43:581-591.
Luo LQ, O'Leary DDM (2005) Axon retraction and degeneration in development and disease. Annu Rev Neurosci 28:127-156.
Magnee M, Oranje B, van Engeland H, Kahn RS, Kemner C (2009) Cross-sensory gating in schizophrenia and autism spectrum disorder: EEG evidence for impaired brain connectivity? Neuropsychologia 47:1728-1732.
Martin A, Haxby JV, Lalonde FM, Wiggs CL, Ungerleider LG (1995) Discrete cortical regions associated with knowledge of color and knowledge of action. Science 270:102-105.
Mattingley JB, Payne JM, Rich AN (2006) Attentional load attenuates synaesthetic priming effects in grapheme-colour synaesthesia. Cortex 42:213-221.
Mattingley JB, Rich AN, Yelland G, Bradshaw JL (2001) Unconscious priming eliminates automatic binding of colour and alphanumeric form in synaesthesia. Nature 410:580-582.
Maurer D (1996) Neonatal synaesthesia: implications for the processing of speech and faces. In: Synaesthesia: Classic and Contemporary Readings (Harrison J, Baron-Cohen S, eds), pp 224-242. Oxford: Blackwell Publishers.
Maurer D, Pathman T, Mondloch CJ (2006) The shape of boubas: sound–shape correspondences in toddlers and adults. Dev Science 9:316-322.
Mazaheri A, Nieuwenhuis ILC, van Dijk H, Jensen O (2009) Prestimulus Alpha and Mu Activity Predicts Failure to Inhibit Motor Responses. Hum Brain Mapp 30:1791-1800.
McGurk H, Macdonald J (1976) Hearing Lips and Seeing Voices. Nature 264:746-748. McKeefry D, Zeki S (1997) The position and topography of the human colour centre as revealed by
functional magnetic resonance imaging. Brain 120:2229-2242. Mechelli A, Gorno-Tempini ML, Price CJ (2003) Neuroimaging studies of word and pseudoword
reading: Consistencies, inconsistencies, and limitations. J Cogn Neurosci 15:260-271. Meier B, Rothen N (2009) Training grapheme-colour associations produces a synaesthetic Stroop
effect, but not a conditioned synaesthetic response. Neuropsychologia 47:1208-1211. Meyer GF, Wuerger SM, Rohrbein F, Zetzsche C (2005) Low-level integration of auditory and
visual motion signals requires spatial co-localisation. Exp Brain Res 166:538-547. Mills CB, Innis J, Westendorf T, Owsianiecki L, McDonald A (2006) Effect of a synesthete's
photisms on name recall. Cortex 42:155-163. Mills CB, Viguers ML, Edelson SK, Thomas AT, Simon-Dack SL, Innis J (2002) The color of two
alphabets for a multilingual synesthete. Perception 31:1371-1394. Morita T, Kochiyama T, Okada T, Yonekura Y, Matsumura M, Sadato N (2004) The neural
substrates of conscious color perception demonstrated using fMRI. Neuroimage 21:1665-1673.
Muggleton N, Tsakanikos E, Walsh V, Ward J (2007) Disruption of synaesthesia following TMS of the right posterior parietal cortex. Neuropsychologia 45:1582-1585.
Müller MM, Keil A (2004) Neuronal synchronization and selective color processing in the human brain. J Cogn Neurosci 16:503-522.
Murphey DK, Yoshor D, Beauchamp MS (2008) Perception matches selectivity in the human anterior color center. Curr Biol 18:216-220.
Myles KM, Dixon MJ, Smilek D, Merikle PM (2003) Seeing double: The role of meaning in alphanumeric colour synaesthesia. Brain Cogn 53:342-345.
References
123
Niccolai V, van Leeuwen T, Blakemore C, Stoerig P (2011) Colour and visual spatial perception in a blind subject: a case study on synaesthesia. . In: UK Synaesthesia Association Annual General Meeting and Conference. London, United Kingdom.
Niccolai V, van Leeuwen T, Blakemore C, Stoerig P (submitted) Colour and visual spatial perception in a blind subject: an fMRI case study on synaesthesia.
Nijboer TCW, Van der Stigchel S (2009) Is attention essential for inducing synesthetic colors? Evidence from oculomotor distractors. J Vision 9:9.
Nikolić D, Lichti P, Singer W (2007) Color opponency in synaesthetic experiences. Psychol Sci 18:481-486.
Noppeney U, Friston KJ, Ashburner J, Frackowiak R, Price CJ (2005) Early visual deprivation induces structural plasticity in gray and white matter. Curr Biol 15:R488-R490.
Noriuchi M, Kikuchi Y, Yoshiura T, Kira R, Shigeto H, Hara T, Tobimatsu S, Kamio Y (2010) Altered white matter fractional anisotropy and social impairment in children with autism spectrum disorder. Brain Res 1362:141-149.
Nunn JA, Gregory LJ, Brammer MJ, Williams SCR, Parslow DM, Morgan MJ, Morris RG, Bullmore ET, Baron-Cohen S, Gray JA (2002) Functional magnetic resonance imaging of synesthesia: activation of V4/V8 by spoken words. Nat Neurosci 5:371-375.
Palmeri TJ, Blake R, Marois R, Flanery MA, Whetsell WJ (2002) The perceptual reality of synesthetic colors. PNAS 99:4127-4131.
Paulesu E, Harrison J, Baron-Cohen S, Watson JD, Goldstein L, Heather J, Frackowiak RS, Frith CD (1995) The physiology of coloured hearing. A PET activation study of colour-word synaesthesia. Brain 118:661-676.
Penny WD, Stephan KE, Mechelli A, Friston KJ (2004) Comparing dynamic causal models. NeuroImage 22:1157-1172.
Pernet C, Celsis P, Demonet JF (2005) Selective response to letter categorization within the left fusiform gyrus. NeuroImage 28:738-744.
Pomarol-Clotet E, Salvador R, Sarro S, Gomar J, Vila F, Martinez A, Guerrero A, Ortiz-Gil J, Sans-Sansa B, Capdevila A, Cebamanos JM, McKenna PJ (2008) Failure to deactivate in the prefrontal cortex in schizophrenia: dysfunction of the default mode network? Psychol Med 38:1185-1193.
Rakic P, Bourgeois JP, Eckenhoff MF, Zecevic N, Goldman-Rakic PS (1986) Concurrent overproduction of synapses in diverse regions of the primate cerebral-cortex. Science 232:232-235.
Ramachandran VS, Hubbard EM (2001a) Synaesthesia - A window into perception, thought and language. J Consciousness Stud 8:3-34.
Ramachandran VS, Hubbard EM (2001b) Psychophysical investigations into the neural basis of synaesthesia. Proc R Soc London B 268:979-983.
Reddy L, Tsuchiya N, Serre T (2010) Reading the mind's eye: Decoding category information during mental imagery. NeuroImage 50:818-825.
Rich AN, Mattingley JB (2003) The effects of stimulus competition and voluntary attention on colour-graphemic synaesthesia. NeuroReport 14:1793-1798.
Rich AN, Bradshaw JL, Mattingley JB (2005) A systematic, large-scale study of synaesthesia: implications for the role of early experience in lexical-color associations. Cognition 98:53-84.
Rihs TA, Michel CM, Thut G (2007) Mechanisms of selective inhibition in visual spatial attention are indexed by alpha-band EEG synchronization. Eur J Neurosci 25:603-610.
Robertson LC (2003) Binding, spatial attention and perceptual awareness. Nat Rev Neurosci 4:93-102.
Romei V, Gross J, Thut G (2010) On the Role of Prestimulus Alpha Rhythms over Occipito-Parietal Areas in Visual Input Regulation: Correlation or Causation? J Neurosci 30:8692-8697.

References
124
Romei V, Rihs T, Brodbeck V, Thut G (2008a) Resting electroencephalogram alpha-power over posterior sites indexes baseline visual cortex excitability. Neuroreport 19:203-208.
Romei V, Brodbeck V, Michel C, Amedi A, Pascual-Leone A, Thut G (2008b) Spontaneous fluctuations in posterior alpha-band EEG activity reflect variability in excitability of human visual areas. Cereb Cortex 18:2010-2018.
Rothen N, Meier B (2009) Do Synesthetes Have a General Advantage in Visual Search and Episodic Memory? A Case for Group Studies. PLoS ONE 4:9.
Rouw R, Scholte HS (2007) Increased structural connectivity in grapheme-color synesthesia. Nat Neurosci 10:792-797.
Rouw R, Scholte HS (2010) Neural Basis of Individual Differences in Synesthetic Experiences. J Neurosci 30:6205-6213.
Sagiv N, Robertson LC (2005) Synesthesia and the binding problem. In: Synesthesia: Perspectives from cognitive neuroscience (Robertson LC, Sagiv N, eds), pp 90-107. New York: Oxford University Press.
Sagiv N, Ward J (2006) Crossmodal interactions: lessons from synesthesia. Visual Perception, Pt 2: Fundamentals of Awareness: Multi-Sensory Integration and High-Order Perception 155:259-271.
Sagiv N, Heer J, Robertson L (2006a) Does binding of synesthetic color to the evoking grapheme require attention? Cortex 42:232-242.
Sagiv N, Simner J, Collins J, Butterworth B, Ward J (2006b) What is the relationship between synaesthesia and visuo-spatial number forms? Cognition 101:114-128.
Senkowski D, Schneider TR, Foxe JJ, Engel AK (2008) Crossmodal binding through neural coherence: implications for multisensory processing. Trends Neurosci 31:401-409.
Seymour K, Clifford CWG, Logothetis NK, Bartels A (2009) The coding of color, motion, and their conjunction in the human visual cortex. Curr Biol 19:177-183.
Shafritz KM, Gore JC, Marois R (2002) The role of the parietal cortex in visual feature binding. PNAS 99:10917-10922.
Shams L, Kamitani Y, Shimojo S (2002) Visual illusion induced by sound. Cogn Brain Res 14:147-152.
Simmons WK, Ramjee V, Beauchamp MS, McRae K, Martin A, Barsalou LW (2007) A common neural substrate for perceiving and knowing about color. Neuropsychologia 45:2802-2810.
Simner J (2007) Beyond perception: synaesthesia as a psycholinguistic phenomenon. Trends Cogn Sci 11:23-29.
Simner J, Logie RH (2007) Synaesthetic consistency spans decades in a lexical-gustatory synaesthete. Neurocase 13:358-365.
Simner J, Ward J (2008) Synaesthesia, color terms, and color space - Color claims came from color names in Beeli, Esslen, and Jancke (2007). Psychol Sci 19:412-414.
Simner J, Haywood SL (2009) Tasty non-words and neighbours: The cognitive roots of lexical-gustatory synaesthesia. Cognition 110:171-181.
Simner J, Harrold J, Creed H, Monro L, Foulkes L (2009) Early detection of markers for synaesthesia in childhood populations. Brain 132:57-64.
Simner J, Ward J, Lanz M, Jansari A, Noonan K, Glover L, Oakley DA (2005) Non-random associations of graphemes to colours in synaesthetic and non-synaesthetic populations. Cogn Neuropsychol 22:1069-1085.
Simner J, Mulvenna C, Sagiv N, Tsakanikos E, Witherby SA, Fraser C, Scott K, Ward J (2006) Synaesthesia: the prevalence of atypical cross-modal experiences. Perception 35:1024-1033.
Skelton R, Ludwig C, Mohr C (2009) A novel, illustrated questionnaire to distinguish projector and associator synaesthetes. Cortex 45:721-729.
References
125
Smilek D, Dixon MJ (2002) Towards a synergistic understanding of synaesthesia. Combining current experimental findings with synaesthetes' subjective descriptions. Psyche 8:http://www.theassc.org/files/assc/2529.pdf.
Smilek D, Dixon MJ, Merikle PM (2003) Synaesthetic photisms guide attention. Brain Cogn 53:364-367.
Smilek D, Dixon MJ, Merikle PM (2005a) Synaesthesia: Discordant male monozygotic twins. Neurocase 11:363-370.
Smilek D, Dixon MJ, Merikle PM (2005b) Binding of graphemes and synesthetic colors in grapheme-color synesthesia. In: Synesthesia: Perspectives from cognitive neuroscience (Robertson LC, Sagiv N, eds), pp 74-89. New York: Oxford University Press.
Smilek D, Dixon MJ, Cudahy C, Merikle PM (2001) Synaesthetic photisms influence visual perception. J Cogn Neurosci 13:930-936.
Smilek D, Dixon MJ, Cudahy C, Merikle PM (2002) Synesthetic Color Experiences Influence Memory. Psychol Sci 13:548-552.
Snyder AC, Foxe JJ (2010) Anticipatory Attentional Suppression of Visual Features Indexed by Oscillatory Alpha-Band Power Increases: A High-Density Electrical Mapping Study. J Neurosci 30:4024-4032.
Solomon SG, Lennie P (2007) The machinery of colour vision. Nat Rev Neurosci 8:276-286. Sperling JM, Prvulovic D, Linden DEJ, Singer W, Stirn A (2006) Neuronal correlates of colour-
graphemic synaesthesia: a fMRI study. Cortex 42:295-303. Stephan KE, Marshall JC, Penny WD, Friston KJ, Fink GR (2007) Interhemispheric integration of
visual processing during task-driven lateralization. J Neurosci 27:3512-3522. Stephan KE, Penny WD, Moran RJ, den Ouden HEM, Daunizeau J, Friston KJ (2010) Ten simple
rules for dynamic causal modeling. NeuroImage 49:3099-3109. Stephan KE, Kasper L, Harrison LM, Daunizeau J, den Ouden HEM, Breakspear M, Friston KJ
(2008) Nonlinear dynamic causal models for fMRI. NeuroImage 42:649-662. Stokes M, Thompson R, Cusack R, Duncan J (2009) Top-Down Activation of Shape-Specific
Population Codes in Visual Cortex during Mental Imagery. J Neurosci 29:1565-1572. Stroop JR (1935) Studies of Interference in Serial Verbal Reactions. J Exp Psychol 18:643-662. Tanigawa H, Lu HD, Roe AW (2010) Functional organization for color and orientation in
macaque V4. Nat Neurosci 13:1542-1548. Theeuwes J (1992) Perceptual selectivity for color and form. Percept Psychophys 51:599-606. Thut G, Nietzel A, Brandt SA, Pascual-Leone A (2006) Alpha-band electroencephalographic
activity over occipital cortex indexes visuospatial attention bias and predicts visual target detection. J Neurosci 26:9494-9502.
Tikhonov A, Handel B, Haarmeier T, Lutzenberger W, Thier P (2007) Gamma oscillations underlying the visual motion aftereffect. NeuroImage 38:708-719.
Treisman A (2005) Synesthesia - implications for attention, binding, and consciousness. In: Synesthesia: Perspectives from cognitive neuroscience (Robertson LC, Sagiv N, eds), pp 90-107. New York: Oxford University Press.
Treisman AM, Gelade G (1980) Feature-Integration Theory of Attention. Cogn Psychol 12:97-136. Uhlhaas P, Silverstein S (2005) Perceptual Organization in Schizophrenia Spectrum Disorders:
Empirical Research and Theoretical Implications. Psychol Bull 131:618-632. Uhlhaas PJ, Linden DE, Singer W, Haenschel C, Lindner M, Maurer K, Rodriguez E (2006)
Dysfunctional long-range coordination of neural activity during Gestalt perception in schizophrenia. J Neurosci 26:8168-8175.
Van der Kouwe AJ, Benner T, Fischl B, Schmitt F, Salat DH, Harder M, Sorensen AG, Dale AM (2005) On-line automatic slice positioning for brain MR imaging. NeuroImage 27:222-230.
Van Dijk H, Nieuwenhuis IL, Jensen O (2010) Left temporal alpha band activity increases during working memory retention of pitches. Eur J Neurosci 31:1701-1707.
References
126
Van Dijk H, Schoffelen JM, Oostenveld R, Jensen O (2008) Prestimulus oscillatory activity in the alpha band predicts visual discrimination ability. J Neurosci 28:1816-1823.
van Leeuwen TM, Petersson KM, Hagoort P (2010) Synaesthetic Colour in the Brain: Beyond Colour Areas. A Functional Magnetic Resonance Imaging Study of Synaesthetes and Matched Controls. PLoS ONE 5:e12074.
van Leeuwen TM, den Ouden HEM, Hagoort P (accepted) Effective connectivity determines the nature of subjective experiences in grapheme-color synesthesia. J Neurosci.
Van Leeuwen TM, Petersson KM, Langner O, Rijpkema M, Hagoort P (submitted) Color tuning specificity in the human V4 complex: An fMRI repetition suppression study.
Vinckier F, Dehaene S, Jobert A, Dubus JP, Sigman M, Cohen L (2007) Hierarchical coding of letter strings in the ventral stream: Dissecting the inner organization of the visual word-form system. Neuron 55:143-156.
Ward J, Simner J (2005) Is synaesthesia an X-linked dominant trait with lethality in males? Perception 34:611-623.
Ward J, Tsakanikos E, Bray A (2006a) Synaesthesia for reading and playing musical notes. Neurocase 12:27-34.
Ward J, Huckstep B, Tsakanikos E (2006b) Sound-colour synaesthesia: to what extent does it use cross-modal mechanisms common to us all? Cortex 42:264-280.
Ward J, Li R, Salih S, Sagiv N (2007) Varieties of grapheme-colour synaesthesia: a new theory of phenomenological and behavioural differences. Conscious Cogn 16:913-931.
Ward J, Jonas C, Dienes Z, Seth A (2010) Grapheme-colour synaesthesia improves detection of embedded shapes, but without pre-attentive 'pop-out' of synaesthetic colour. Proc R Soc B-Biol Sci 277:1021-1026.
Weiss PH, Fink GR (2009) Grapheme-colour synaesthetes show increased grey matter volumes of parietal and fusiform cortex. Brain 132:65-70.
Weiss PH, Zilles K, Fink GR (2005) When visual perception causes feeling: enhanced cross-modal processing in grapheme-color synesthesia. NeuroImage 28:859-868.
Whitfield-Gabrieli S, Thermenos HW, Milanovic S, Tsuang MT, Faraone SV, McCarley RW, Shenton ME, Green AI, Nieto-Castanon A, LaViolette P, Wojcik J, Gabrieli JDE, Seidman LJ (2009) Hyperactivity and hyperconnectivity of the default network in schizophrenia and in first-degree relatives of persons with schizophrenia. PNAS 106:1279-1284.
Wichmann FA, Sharpe LT, Gegenfurtner KR (2002) The contributions of color to recognition memory for natural scenes. J Exp Psychol-Learn Mem Cogn 28:509-520.
Witthoft N, Winawer J (2006) Synesthetic colors determined by having colored refrigerator magnets in childhood. Cortex 42:175-183.
Wollen KA, Ruggiero FT (1983) Colored-letter synesthesia. J Ment Imagery 7:83-86. Womelsdorf T, Fries P (2007) The role of neuronal synchronization in selective attention. Curr
Opin Neurobiol 17:154-160. Worden MS, Foxe JJ, Wang N, Simpson GV (2000) Anticipatory biasing of visuospatial attention
indexed by retinotopically specific alpha-band electroencephalography increases over occipital cortex. J Neurosci 20:RC63 (61–66).
Yamagishi N, Callan DE, Goda N, Anderson SJ, Yoshida Y, Kawato M (2003) Attentional modulation of oscillatory activity in human visual cortex. NeuroImage 20:98-113.
Yaro C, Ward J (2007) Searching for Shereshevskii: What is superior about the memory of synaesthetes? Q J Exp Psychol 60:681-695.
Zeki S, Marini L (1998) Three cortical stages of colour processing in the human brain. Brain 121:1669-1685.
Zhang Y, Wang X, Bressler SL, Chen YH, Ding MZ (2008) Prestimulus cortical activity is correlated with speed of visuomotor processing. J Cogn Neurosci 20:1915-1925.
Nederlandse samenvatting Zien wat er niet is: De neurale mechanismen van grafeem-kleur synesthesie.
I J F E R S
AAEI
OUY
H E T AA L F AA B E T
0123456789
V4
SPL
LSA
S Y S Y N E S T H E S I E E S T H E S I E
C K L E U R
B O T T O M - U P
T O P - D D O W N
DC M
EG
A L P H A
O W E R
O S C I L L A T I E S
BREIN
PROJE
TORS
ASSOCIATORS
f M R I
f M R I - A A D A A P T A T I E

128
Nederlandse samenvatting
129
Inleiding
Het doel van het onderzoek in dit proefschrift was om de neurale mechanismen van grafeem-kleur synesthesie op te helderen. Grafeem-kleur synesthesie is een van de meest voorkomende vormen van synesthesie (zo’n 1 op de 20-50 mensen heeft het). Deze synestheten zien een kleur als ze een letter of cijfer lezen, ook al is de letter of het cijfer in zwart geprint. Tientallen andere vormen van synesthesie zijn bekend, ook erg zeldzame, zoals smaak-vorm synesthesie. Altijd is het zo, dat de specifieke prikkeling van één bepaald zintuig (bijvoorbeeld het horen van muziek) leidt tot ongewone extra waarnemingen (bijvoorbeeld het zien van kleur). Omdat alleen de synestheet zelf deze extra waarnemingen doet, is synesthesie een subjectief verschijnsel; het is niet makkelijk objectief te meten voor anderen. Synesthesie heeft daarom niet altijd de wetenschappelijke aandacht gekregen die het wél verdient. Tegenwoordig is onderzoek naar bewustzijn en cognitie algemeen geaccepteerd en maken nieuwe technieken zoals neuroimaging objectief onderzoek naar hersenprocessen tijdens synesthesie mogelijk.
Waarom is het interessant om synesthesie te onderzoeken? Synestheten hebben bewuste ervaringen die niet één-op-één zijn gerelateerd aan de informatie die hun brein binnenkomt. Bijvoorbeeld, ze nemen de kleur rood waar terwijl er alleen een zwarte letter A op het papier staat geprint. Door deze abnormale situatie te onderzoeken kunnen we beter begrijpen welke processen in ons brein nodig zijn om je bewust te worden van iets. Ook zijn veel vormen van synesthesie te vergelijken met de normale manier waarop mensen hun zintuigen combineren. Iedereen associeert bijvoorbeeld makkelijker hoge tonen met lichte kleuren en lage tonen met donkere kleuren dan andersom. Een hypothese is dat bij synestheten (met bijvoorbeeld toon-kleur synesthesie) deze ‘normale’ toon-kleur associaties expliciet worden en bewust waarneembaar zijn, als een extreme vorm van normale zintuigelijke samenwerking. Door synesthesie te onderzoeken, kunnen we zo meer te weten komen over hoe onze zintuigen normaliter informatie combineren. Niet alle mensen met grafeem-kleur synesthesie ‘zien’ hun synesthetische kleuren op dezelfde manier. Sommige synestheten zien de kleur echt op de letter, voor zich op het papier; deze synestheten noemen we ‘projectors’. Andere synestheten beleven de kleur meer als een associatie (‘associators’): ze weten dat een A rood is, maar zien dit niet expliciet voor zich. We weten dat deze individuele verschillen kunnen leiden tot verschillen in experimentele uitkomsten tussen groepen synestheten. In Hoofdstuk 4 van dit proefschrift heb ik onderzocht of projector- en associator-synesthesie ook in het brein van elkaar verschillen.
We weten dat in ieder geval het kleurengebiedje (V4) in de fusiform gyrus belangrijk is voor het tot stand komen van grafeem-kleur synesthesie. Dit gebiedje bevindt zich aan de achter- en onderkant van het brein (zie ook Figuur 1.3), in de ‘occipitale’ hersenkwab waar informatie die binnenkomt via de ogen wordt verwerkt (visuele cortex). Ook is de superior pariëtale lobule (SPL) belangrijk, een gebied in de pariëtale hersenkwab dat net als V4 achterin het brein ligt, maar meer bovenin. In dit gebied worden verschillende soorten informatie samengevoegd tot één kloppend geheel. Als de hersenactiviteit in dit gebied wordt verlaagd (bijvoorbeeld door middel van de techniek

Nederlandse samenvatting
130
transcraniële magnetische stimulatie (TMS)), worden de effecten van synesthesie minder sterk. Maar natuurlijk is nog niet alles bekend over hoe synesthesie werkt in het brein!
In dit proefschrift heb ik onderzocht of synesthetische kleuren op precies dezelfde manier worden verwerkt in het brein als echte kleuren – het kleurengebiedje wordt actief bij synesthesie, maar gebeurt dat op dezelfde manier als bij echte kleurwaarneming? Dit onderzoek staat beschreven in Hoofdstuk 2 en 3. De gebruikte techniek was functionele magnetische resonantie imaging (fMRI), dat is een techniek die geschikt is om te zien waar iets gebeurt in het brein. In Hoofdstuk 4 was de centrale vraag of de interacties tussen het kleurengebiedje en SPL verschillend zijn voor projector- en associator synestheten. Hiervoor gebruikte ik dynamic causal modelling, een techniek waarmee je hersenactiviteit kunt modelleren. Tot slot hebben we in Hoofdstuk 5 onderzocht of oscillaties in de elektromagnetische activiteit van het brein gerelateerd zijn aan synesthesie. Hiervoor gebruikten we magnetoencephalografie. In de volgende paragrafen vat ik de afzonderlijke hoofdstukken van mijn proefschrift samen.
Experimenten In hoofdstuk 2 en 3 onderzochten we of synesthetische kleur in precies hetzelfde gebied wordt verwerkt als echte kleur – we weten dat het kleurengebiedje is betrokken bij synesthesie, maar nog niet hoe dat precies gebeurt. We gebruikten de techniek ‘repetition suppression’ (herhaling-onderdrukking), waarmee je kunt onderzoeken of twee binnenkomende signalen in precies hetzelfde hersengebied worden geanalyseerd. Hierbij wordt een signaal (zoals een plaatje of letter) of een deel daarvan herhaald. Meestal is de hersenactiviteit voor de herhaalde stimulus lager dan voor de eerste stimulus, in precies die hersengebieden die belangrijk zijn voor de verwerking. Deze verlaagde activiteit komt door gewenningseffecten in het brein. Als synesthetische kleur en echte kleur in dezelfde hersencellen (neuronen) worden verwerkt, verwachten we dat het zien van een synesthetische kleur (bijvoorbeeld rood, opgeroepen door een A) zou leiden tot lagere hersenactiviteit voor een daarop volgende echte kleur (rood vlakje). In Hoofdstuk 2 hebben we laten zien dat dit principe werkt voor de herhaling van echte kleur. Als proefpersonen in de fMRI scanner tweemaal achter elkaar dezelfde kleur zagen (rood vlakje – rood vlakje), was de hersenactiviteit lager voor het tweede gekleurde vlakje dan wanneer twee verschillende kleuren elkaar opvolgden (rood vlakje – groen vlakje). Dit effect trad alleen op in het voorste deel van het kleurengebied V4. In Hoofdstuk 3 hebben we het fMRI experiment uit Hoofdstuk 2 herhaald, maar nu met synesthetische kleur. Na een letter of cijfer dat een synesthetische kleur opriep, lieten we een gekleurd vlakje zien dat óf dezelfde kleur had als de synesthetische kleur (kleurherhaling) óf een andere kleur (geen herhaling). We vonden geen effecten van de herhaling van synesthetische kleuren (in kleurverwerkingsgebieden). We concluderen daarom dat synesthetische kleur en echte kleur niet in precies dezelfde hersencellen worden verwerkt. Het is mogelijk dat de twee types kleurwaarneming via verschillende ‘routes’ het kleurengebied activeren, waardoor het niet precies dezelfde hersencellen zijn die synesthetische kleur en echte kleur verwerken.
Nederlandse samenvatting
131
In Hoofdstuk 3 hebben we in Experiment 1 ook gekeken welke hersengebieden actief werden voor synesthesie zelf. Synestheten keken in de scanner naar letters die sterke synesthesie opriepen (synesthesie conditie), letters/symbolen die geen synesthesie opriepen (controle conditie), en naar controle letters/symbolen in kleur. We vonden hogere activiteit voor de synesthesie conditie in zowel de rechter posterior fusiform gyrus (gebied V4) als in de linker superior pariëtale lobule (SPL), net zoals in eerdere studies gevonden is. Interessant was dat we twee verschillende vergelijkingen tussen condities nodig hadden in de fMRI analyses om beide effecten aan te tonen. Voor synesthetische kleur was er meer activiteit in V4 (en niet in SPL) dan voor niet-gekleurde controle letters. Maar synesthetische kleur vergeleken met gekleurde controle letters (dus het synesthetische aspect van de kleur) leidde juist tot meer activiteit in SPL (en niet in V4). Veel neuroimaging studies hebben tot nu toe óf SPL, óf V4 gevonden, maar niet vaak beide. Onze resultaten laten zien dat deze verschillen tussen studies misschien zijn veroorzaakt door de specifieke analyse of experimentele taak die werd gebruikt. In Hoofdstuk 4 gingen we dieper in op de verschillen tussen projector en associator synestheten. Behalve V4 en SPL is ook het visuele gebied waarin de vorm van letters wordt geanalyseerd onderdeel van het synesthesie-netwerk. In Hoofdstuk 4 hebben we gekeken of de volgorde waarin het letter-vorm gebiedje, V4 en SPL actief worden hetzelfde is voor projector en voor associator synestheten. Met dynamic causal modelling onderzochten we twee modellen, gebaseerd op de twee belangrijkste theorieën over het mechanisme van synesthesie in het brein. Volgens de cross-wiring theorie zijn er directe verbindingen tussen het letter-vorm gebiedje en V4 in de fusiform gyrus; SPL combineert dan later de signalen. In ons bottom-up model modelleerden we daarom een directe verbinding van het letter-vorm gebiedje naar V4 en een verbinding van V4 naar SPL. De sterkte van deze verbindingen was afhankelijk van synesthesie (zie ook Figuur 4.1A, blz. 69). Volgens de niet-geremde feedback theorie ontstaat synesthesie door het ‘lekken’ van feedback signalen uit gebieden zoals SPL. Bijvoorbeeld: het lettergebiedje signaleert naar SPL dat er een letter te zien is, maar de terugkoppeling vanuit SPL gaat óók naar kleurengebied V4. In ons top-down model beïnvloedt synesthesie daarom de informatiestroom van het letter-vorm gebiedje naar SPL, en van SPL naar V4 (Figuur 4.1B, blz. 69). In het top-down model wordt SPL eerder actief dan in het bottom-up model.
Toen we testten welke van de twee modellen het beste de fMRI data kon verklaren, vonden we geen verschil als we alle synestheten (projectors én associators) tegelijk analyseerden. Maar als we alleen voor de projectors keken, kon het bottom-up model de data veel beter verklaren dan het top-down model. Voor de associators was juist het top-down model veel beter. Dit is eigenlijk ook logisch: projectors zien de kleur op de letter zelf, op een precieze plaats in de ruimte, wat lijkt op ‘echt zien’. Dit past bij een directe verbinding tussen het lettergebiedje en V4 op het niveau van vorm-analyse, wat inderdaad gebeurt in de visuele cortex. Bij associators voelt synesthesie meer alsof de kleur bij de letter hoort, zoals bij het oproepen van herinneringen. Dit wordt ‘intern’ aangedreven door gebieden zoals SPL, die op een top-down manier visuele gebieden activeren. We laten met dit onderzoek zien dat subjectieve ervaringen afhankelijk zijn van de volgorde van

Nederlandse samenvatting
132
informatieverwerking in hetzelfde netwerk van hersengebieden. Dit heeft implicaties voor bewuste waarneming in het algemeen.
In Hoofdstuk 5 hebben we tenslotte onderzocht of oscillaties in hersenactiviteit rond 10 Hz, die het alpha ritme worden genoemd, een rol spelen bij synesthesie. Het alpha ritme is namelijk betrokken bij functionele inhibitie (onderdrukking) van hersengebieden, een proces dat verstoord zou kunnen zijn bij synesthesie (niet-geremde feedback theorie). We gebruikten magnetoencephalografie (MEG) om de synchronisatie van alpha oscillaties te meten. De sterkte van het alpha ritme wordt beïnvloedt door aandacht: meer aandacht betekent minder alpha en minder aandacht betekent meer synchrone alpha oscillaties, want meer inhibitie. We vonden dat voor synestheten, letters in echte kleur leidden tot een sterke vermindering van het alpha signaal, specifiek voor de plek waar de gekleurde letter te zien was. Dit effect was er óók als de gekleurde letter eigenlijk genegeerd moest worden, wat betekent dat kleur aandacht aantrekt in synestheten. Voor controle proefpersonen was er een heel algemene vermindering van het alpha signaal voor gekleurde letters, zonder specifieke locatie. Voor synesthetische letters en dus synesthetische kleur waren de effecten vergelijkbaar met die voor echte kleur, maar minder sterk. De alpha effecten in de synesthesie conditie hielden ook verband met de reactietijden voor synesthesie in deze studie. Omdat de vermindering in de sterkte van het alpha ritme niet specifiek was voor synesthesie en zelfs sterker was voor echte kleur, steunen onze resultaten niet de niet-geremde feedback theorie. Onze resultaten suggeren dat kleur automatisch leidt tot het richten van plaats-specifieke aandacht in synestheten, wat misschien wel het koppelen van een kleur aan een letter kan bevorderen tijdens het ontwikkelen van synesthesie. Aan dit experiment namen voornamelijk projector synestheten deel. Het zou erg interessant zijn om te kijken of dezelfde plaats-specifieke effecten optreden in associator synestheten. Vragen voor toekomstig onderzoek Helaas zijn niet alle neurale mechanismen van synesthesie op te helderen in één proefschrift. In vervolgonderzoek is het zaak om uit te vinden of synesthesie in de eerste plaats door anatomische verbindingen tussen hersengebieden veroorzaakt wordt (witte stof, ofwel afwijkende hardware) of dat er bij synestheten sprake is van versterkte functionele verbindingen tussen gebieden (afwijkende software). Dat heeft direct te maken met de vraag hoe koppelingen tussen de zintuigen tot stand komen tijdens het ‘ontstaan’ van synesthesie in de kinderjaren. Verder moet de samenwerking tussen hersengebieden ook voor andere vormen van synesthesie worden uitgezocht; hoe werkt dit voor muziek-kleur synesthesie, voor smaak-vorm synesthesie? Een heel interessante vraag betreft de genetische basis van synesthesie: welke genen veroorzaken synesthesie en hoe kan het overerven? Verder kan het vergelijken van synesthesie andere neurologische, aangeboren verschijnselen zoals autisme spectrum disorder (ASD) of schizofrenie nieuwe inzichten opleveren. In alle drie deze verschijnselen spelen aandacht, en connectiviteit tussen hersengebieden een rol.

Dankwoord
133
Dankwoord Het is bijna af! Iedereen die direct of indirect aan dit proefschrift heeft bijgedragen, door mee te schrijven, mee te denken, of door me af en toe broodnodige afleiding te bezorgen, bedankt! Als eerste wil ik Peter Hagoort bedanken dat hij mij heeft gevraagd voor dit synesthesieproject op het Donders. Peter, dankjewel voor je belangstelling voor synesthesie, ook al was het qua onderwerp een buitenbeentje in je groep, en voor het meedenken over het inpassen van mijn resultaten in ‘the big picture’. Dankjewel voor al je adviezen en inzichten en dat je deur altijd open stond, ondanks je drukke schema. En ook voor het creeëren van zo’n prima onderzoeksomgeving als het Donders, waar de lijntjes kort zijn en alle methoden en onderzoeksonderwerpen aan bod komen in meetings. Zo kon ik enorm veel leren ook buiten mijn eigen onderzoeksgebied. I would like to thank Prof. dr. Ullsperger, Dr. Romke Rouw and Dr. Roel Willems for investing their time to serve on my manuscript committee.
All the past and present people from the Neurocognition of Language group, Tineke, Miriam, Judith, Kirsten, Katrien, Cathelijne, Laura, Roel, Giosué, Huadong, Lin, Sarah, Caroline, Jana, thank you for listening to all my presentations despite the fact that my PhD topic was only language-related in the sense that it had to do with letters! Thank you for all the feedback and useful discussions during the Monday-NCL-PhD meetings. Karl Magnus, thank you for your advice and help with fMRI data analysis and data interpretation. Oliver and Mark; thank you for your (programming) help and advice on retinotopic mapping and for your comments on my first manuscript.
Hanneke, bedankt voor je enorme enthousiasme voor het DCM-synesthesie project en de talloze keren dat je weer een versie van het paper leesbaarder en vlotter hebt gemaakt! Ik vond het geweldig om samen met jou DCM los te laten op mijn data en keer op keer de mooie resultaten stand te zien houden, welke analyse we ook deden. Barbara, thank you for suggesting to look at the role of alpha oscillations in synaesthesia, which turned out to be such a relevant question and insightful project. Our deisgn was really too complicated but I am convinced this project will have a Happy End! My roommates Ali, Lucy, Joost, and Marloes, thank you for all the shared coffees, weekend-stories, humor, lunches, for sharing data-disasters & cool findings, for belly rubs and trips to the (men’s!) bathroom for water, for cheering me up after each rejection and for tolerating my slightly strange working hours... You were always there for me in so many ways, and you have made the Donders a great place for me to be every day again and again. I miss you guys! Zonder de fantastische hulp van de technische groep en de administratieve groep op het Donders was dit proefschrift er nooit gekomen. Paul, dankjewel dat je mij hebt leren scannen en dat je altijd klaar stond met raad en daad, bijvoorbeeld toen ik op zaterdag de sleutel van de Trio in de drop-box had gegooid, terwijl ik die op zondag weer nodig had... Tildie, dankjewel voor alle afspraken met Peter die jij voor mij hebt ingepland op de meest efficiente manier. Bram, Erik, Marek, Sander, Arthur, Sandra, Nicole, dank
Dankwoord
134
jullie wel dat jullie deur altijd open was, en voor alle snelle antwoorden en hulp die ik heb gekregen op grote en kleine vragen. I would like to thank all the people from the Oxford and Düsseldorf groups who were involved in projects from the VolksWagenStiftung grant: Petra Stoerig for our continued fruitful collaboration; Colin Blakemore, Michael Proulx, and Meng Liang for very helpful discussions about my data and plans for further experiments; Valentina Niccolai for her inspiring enthusiasm for synaesthesia and all the hard work on the questionnaire and case-study projects; Eva Ludowig for her work on the vOICe project, and students Katrin, Michael, Janine, and Katia for many many car trips, driving participants for the Düsseldorf project back and forth between Nijmegen and Düsseldorf.
Asifa, thank you for inviting me to give a talk at the MPI in 2008 and introducing me to totally different ways to look at synaesthesia. I hope our latest FieldManual entry will finally pay off! Mark and Büşra, thank you for the shared work on the Arabic project!
Tanja en Cretien, hartelijk dank voor jullie onmisbare hulp bij het rekruteren van synestheten als proefpersoon, en Tanja voor hele nuttige discussies over mijn data. Alle deelnemers aan mijn onderzoek ben ik ontzettend dankbaar dat ze bereid waren om – soms meerdere keren – aan mijn niet-zo-comfortabele en lange experimenten mee te doen. Miriam, ik vind het geweldig dat je mijn paranimf wilt zijn! Dankjewel voor alle gezellige lunches, pauzes, goede gesprekken, samen rennen, teveel om op te noemen. Tineke, dankjewel voor alle gezamenlijke pauzes, conferenties, en gesprekken over ‘commuting’ en nog veel meer. Katrien, ik zal nooit de datum vergeten waarop je Davis uit het asiel hebt gehaald! Lindsey, het was altijd enorm gezellig om met je bij te kletsen en dankjewel dat je tijdens CNS op ‘de biggen’ hebt gepast. Bram en Tjarda, dank jullie wel voor jullie gastvrijheid en spontaniteit, jullie zijn lieverds! Huadong, thank you for continuing the L2CON project where I left off; it is so much work but very interesting and I hope the final results will be super. Er zijn teveel andere mensen om op te noemen die het Donders voor mij ‘Donders’ maakten, Nienke, Hanneke, Cathelijne, Anne, René, Pieter, Benedikt, Miriam, Eelke, Inge, Lennart, Atsuko, Jan-Mathijs, Esther en Jurrian, Frauke, Ingrid, Mark, Guido, Marcel, OC-leden en Donders-Discussions-Committee leden, en vele, vele anderen, dankjewel voor jullie bijdrage aan mijn hele fijne tijd op het Donders.
Bram, Sabine, Atsuko, and all the other Movie Club members, thank you for all the good times we had transforming the Oval Office into a movie theatre and of course enjoying M&M’s (and the movie!). De Running Club, Miriam, Bram, Anne, Esther, Miriam e.v.a., dank jullie wel voor de mentale stok achter de deur om elke week te gaan rennen! We hebben heel veel lol gehad met de Batavierenrace en Veluweloop. Alle mensen waarmee ik op conferentie ben geweest, Tineke, Marieke, Esther, Marloes, Joost, Nienke, en vele anderen, bedankt voor de gezelligheid en het samen toerist zijn in het buitenland.
Kaisa, Mareen, and Dan, it was great to share the figure skating practices at Triavium with you! Because skating was on Wednesdays, Kaisa and I missed almost all the Donders Christmas Parties because we insisted on attending skating practice instead... Erik, Petra en Miriam, wat was het leuk om Skating Clinics voor het Donders te organiseren! Met zijn allen op de schaats, geweldig.

Dankwoord
135
Lucia, and all the people from my new lab in Frankfurt, thank you for the very warm welcome and all the kind help I have received during my first months. Thank you for making me feel at home at the MPIH so quickly. The positive atmosphere in the lab really helps me to move forward and makes all the travelling worthwhile! Alle mensen die Nijmegen voor mij tot een thuis hebben gemaakt bedankt! De leden van Elnoséqué heel erg bedankt voor het fijne zingen, de gezellige borrels in de Mug en de Aqsies. Lisa, het was ontzettend gezellig om dichtbij je te wonen in Nijmegen, helaas is Enschede wat verder... Dankjewel voor alle keren dat je op mijn biggetjes hebt gepast! Tessa, het was heel gezellig om je vaak te zien toen je nog in Nijmegen woonde.
Marleen, Lisa, Tessa, Ilana & Robert, Babs, Aline, Tamara, Lisette, dank jullie wel voor alle fijne weekenden samen, de trips naar cons, alle emails en chatsessies, uitjes en vooral heel veel gezelligheid! Ik vind het ontzettend jammer dat ik jullie de laatste jaren zo weinig zie door de afstanden en mijn week-weekend-gesplitste leven, maar ik hoop jullie meer te zien nu het proefschrift in ieder geval uit de weg is.
Lieve Petra en Date, zonder jullie had mijn leven er nu ongetwijfeld heel anders uit gezien! Dank jullie wel voor jullie vriendschap, belangstelling, de gezellige weekenden weg en de vakanties samen. Marjolein en Alexander, bedankt voor jullie vriendschap! Mijn ooms en tantes, mijn nichtjes en (bijna-)neven en aanhang, vrienden, kennissen, ontzettend veel dank voor jullie interesse, de goede gesprekken op verjaardagen en andere gezellige bijeenkomsten en vooral voor de nodige ontspanning die dat met zich meebracht! Agaath en Jochgem, en Alies en Marc, heel erg bedankt voor al jullie warme belangstelling voor mijn proefschrift, werk en welzijn, en voor alle gezellige en heel ontspannen weekenden met zijn allen in Scheemda of elders, waar ik even mijn werk los kon laten. Dank jullie wel!
Lieve Casper en Marlijn, wat zitten we nu allemaal in hetzelfde schuitje! Het is heel fijn dat we zoveel ervaringen uit kunnen wisselen, ook over de mindere leuke kanten van de wetenschap. Cas, heel erg bedankt dat je mijn paranimf wilt zijn. Ook een groot dankjewel voor het zijn van pilot-proefpersoon voor mijn experimenten! Marlijn, nu ik ook in Duitsland werk heb ik nog veel meer respect voor jouw beslissing, het is niet de weg van de minste weerstand! Dankjewel voor je belangstelling, alle gezellige chatsessies en ik hoop je in de toekomst heel veel meer te zien. Lieve paps en mams, wat fijn dat jullie mij altijd vrij hebben gelaten in mijn studie- en beroepskeuzes, maar goede adviezen en duwtjes in de goede richting hebben gegeven waar nodig. Dankjewel voor alle keren dat jullie bereid waren om mee te denken of te helpen als ik ergens mee zat, van cavia-crises tot lastige beslissingen over grote en kleine dingen... Al had dit hele proefschrift vol gestaan met dingen waarvoor ik jullie dankbaar ben, dan was de lijst nog steeds bij lange na niet af!
Lieve Jan Date, dankjewel voor alles... Dankjewel voor al je steun, je interesse, je begrip voor de vreemde kanten van mijn beroep, je genuanceerde mening en je relativeringsvermogen, waarmee alles altijd weer in perspectief valt (‘alles is relatief’). Ik vind het heerlijk om bij je te zijn, en hoop dat nog heel lang te mogen zijn.

List of publications
136

List of publications
137
List of publications Van Leeuwen TM, Den Ouden HEM, Hagoort P (accepted). Effective connectivity
determines the nature of subjective experience in grapheme-color synesthesia. Journal of Neuroscience
Van Leeuwen TM, Petersson KM, Hagoort P (2010). Synaesthetic Colour in the Brain: Beyond Colour Areas. A Functional Magnetic Resonance Imaging Study of Synaesthetes and Matched Controls. PLoS ONE 5(8): e12074. doi: 10.1371/journal.pone.0012074 Liang M*, Van Leeuwen TM*, Proulx MJ (2008). Propagation of brain activity during audiovisual integration. Journal of Neuroscience 28(36), 8861– 8862. *equal contributors Vajda I, Lankheet MJM, Van Leeuwen TM, Van de Grind WA (2002). On the velocity
tuning of area 18 complex cell responses to moving textures. Visual Neuroscience 19(5), 651-59.
Manuscripts submitted for publication Van Leeuwen TM, Petersson KM, Langner O, Rijpkema M, Hagoort P. Colour tuning
specificity in the human V4 complex: An fMRI repetition suppression study. Van Leeuwen TM, Lamers M, Petersson KM, Rietveld T, Gussenhoven C, Poser B and Hagoort P. Prosody and information structure: An fMRI study. Van Leeuwen TM*, Händel BF*, Hagoort P. Altered color processing as indicated by alpha
oscillations can provide an explanation for grapheme-color synesthesia. *equal contributors Niccolai V, Van Leeuwen TM, Jennes J, Stoerig P. Modality and variability of the
synaesthetic experience: An internet investigation of synaesthesia. Niccolai V, Van Leeuwen TM, Blakemore C, Stoerig P. Colour and visual spatial
perception in a blind subject: an fMRI case study on synaesthesia. Manuscripts in preparation Van Leeuwen TM. Individual differences in synaesthesia. To appear in: Oxford Handbook of Synaesthesia (Simner, J, Hubbard, EM, eds). Oxford University Press

Curriculum Vitae
138

Curriculum Vitae
139
Curriculum Vitae
Tessa van Leeuwen was born on the 26th of July, 1980, in Leiderdorp, the Netherlands. She attended secondary education (VWO) at the Montessori Lyceum Herman Jordan in Zeist and started studying Biology at the University of Utrecht in 1998. After a project on the cat’s visual system, her interest in the brain brought her to the Donders Institute for Brain, Cognition and Behaviour in Nijmegen. There she made use of fMRI to investigate bilingual language processing in the brain, under supervision of Dr. Walter van Heuven and Prof. dr. Peter Hagoort. After completing her master’s thesis in 2004 she worked as a research assistant at the Brain and Attention Research Lab of the University of British Columbia, Vancouver, Canada, under supervision of Prof. dr. Alan Kingstone and Dr. Daniel Smilek. In 2005 she was a research assistant at the Donders Institute in Nijmegen, under supervision of Prof. dr. Peter Hagoort, working on language processing.
In 2006 she started her PhD research on the neural mechanisms of synaesthesia, also carried out at the Donders Institute under supervision of Prof. dr. Peter Hagoort. The focus of her PhD project was on the brain areas and brain dynamics that underlie this fascinating phenomenon. The results of this research are reported in this thesis. During and after her PhD she collaborated with Dr. Asifa Majid and Mark Dingemanse from the Max Planck Institute for Psycholinguistics, Nijmegen, to study the manifestation of synaesthesia in non-literate societies and in the Arabic language. Since February 2011 she is a postdoctoral researcher at the Department of Neurophysiology of the Max Planck Institute for Brain Research, in Frankfurt am Main, Germany. She works with Dr. Lucia Melloni, using MEG to study brain dynamics during bottom-up and top-down visual information processing in synaesthetes and schizophrenia patients.

Series Donders Institute
140
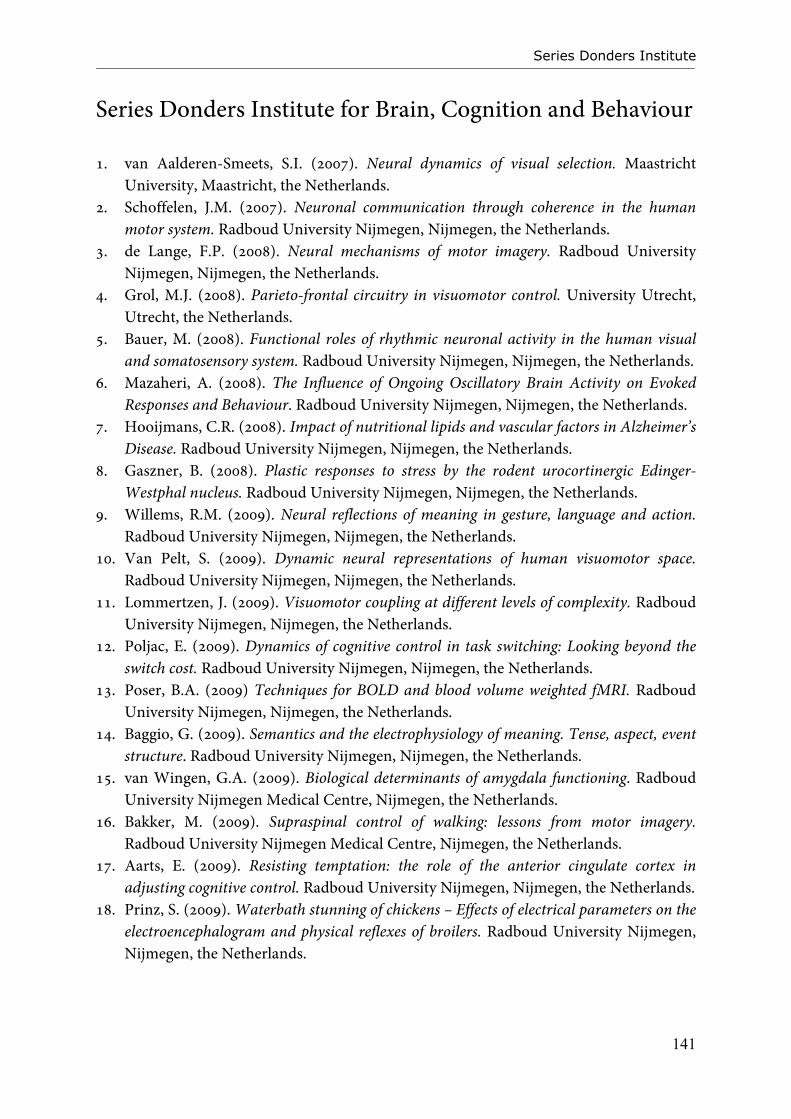
Series Donders Institute
141
Series Donders Institute for Brain, Cognition and Behaviour
1. van Aalderen-Smeets, S.I. (2007). Neural dynamics of visual selection. Maastricht University, Maastricht, the Netherlands.
2. Schoffelen, J.M. (2007). Neuronal communication through coherence in the human motor system. Radboud University Nijmegen, Nijmegen, the Netherlands.
3. de Lange, F.P. (2008). Neural mechanisms of motor imagery. Radboud University Nijmegen, Nijmegen, the Netherlands.
4. Grol, M.J. (2008). Parieto-frontal circuitry in visuomotor control. University Utrecht, Utrecht, the Netherlands.
5. Bauer, M. (2008). Functional roles of rhythmic neuronal activity in the human visual and somatosensory system. Radboud University Nijmegen, Nijmegen, the Netherlands.
6. Mazaheri, A. (2008). The Influence of Ongoing Oscillatory Brain Activity on Evoked Responses and Behaviour. Radboud University Nijmegen, Nijmegen, the Netherlands.
7. Hooijmans, C.R. (2008). Impact of nutritional lipids and vascular factors in Alzheimer’s Disease. Radboud University Nijmegen, Nijmegen, the Netherlands.
8. Gaszner, B. (2008). Plastic responses to stress by the rodent urocortinergic Edinger-Westphal nucleus. Radboud University Nijmegen, Nijmegen, the Netherlands.
9. Willems, R.M. (2009). Neural reflections of meaning in gesture, language and action. Radboud University Nijmegen, Nijmegen, the Netherlands.
10. Van Pelt, S. (2009). Dynamic neural representations of human visuomotor space. Radboud University Nijmegen, Nijmegen, the Netherlands.
11. Lommertzen, J. (2009). Visuomotor coupling at different levels of complexity. Radboud University Nijmegen, Nijmegen, the Netherlands.
12. Poljac, E. (2009). Dynamics of cognitive control in task switching: Looking beyond the switch cost. Radboud University Nijmegen, Nijmegen, the Netherlands.
13. Poser, B.A. (2009) Techniques for BOLD and blood volume weighted fMRI. Radboud University Nijmegen, Nijmegen, the Netherlands.
14. Baggio, G. (2009). Semantics and the electrophysiology of meaning. Tense, aspect, event structure. Radboud University Nijmegen, Nijmegen, the Netherlands.
15. van Wingen, G.A. (2009). Biological determinants of amygdala functioning. Radboud University Nijmegen Medical Centre, Nijmegen, the Netherlands.
16. Bakker, M. (2009). Supraspinal control of walking: lessons from motor imagery. Radboud University Nijmegen Medical Centre, Nijmegen, the Netherlands.
17. Aarts, E. (2009). Resisting temptation: the role of the anterior cingulate cortex in adjusting cognitive control. Radboud University Nijmegen, Nijmegen, the Netherlands.
18. Prinz, S. (2009). Waterbath stunning of chickens – Effects of electrical parameters on the electroencephalogram and physical reflexes of broilers. Radboud University Nijmegen, Nijmegen, the Netherlands.
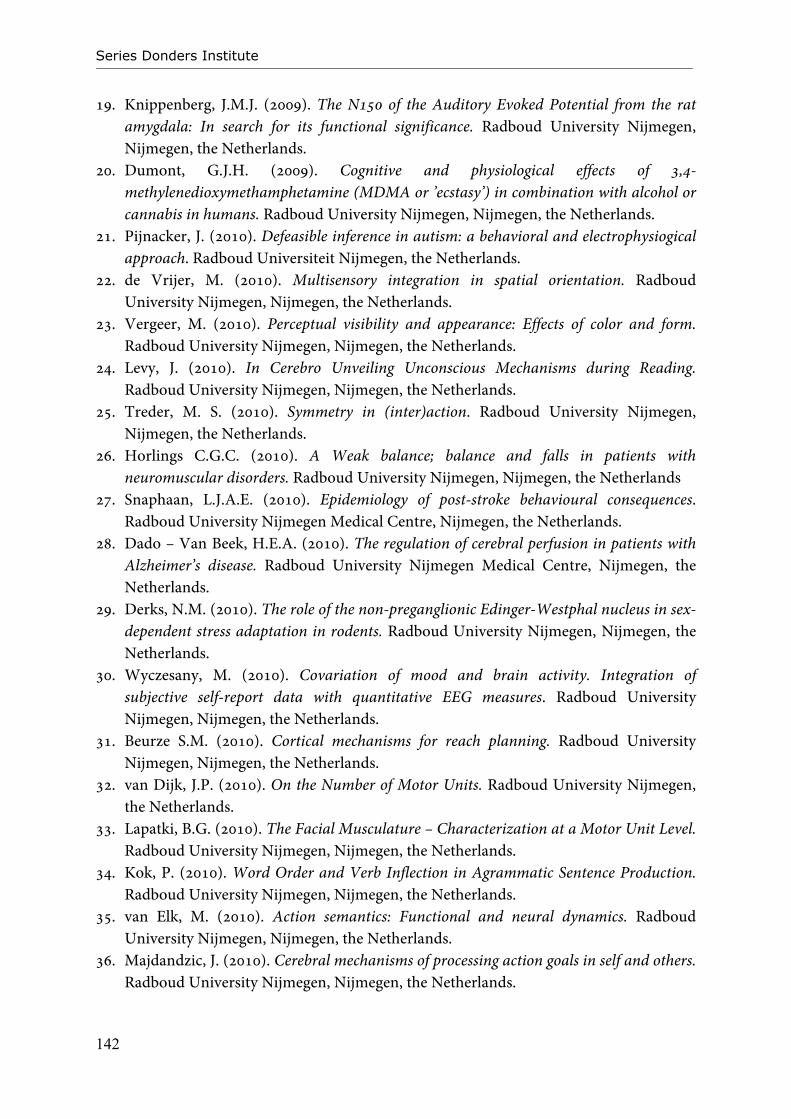
Series Donders Institute
142
19. Knippenberg, J.M.J. (2009). The N150 of the Auditory Evoked Potential from the rat amygdala: In search for its functional significance. Radboud University Nijmegen, Nijmegen, the Netherlands.
20. Dumont, G.J.H. (2009). Cognitive and physiological effects of 3,4-methylenedioxymethamphetamine (MDMA or ’ecstasy’) in combination with alcohol or cannabis in humans. Radboud University Nijmegen, Nijmegen, the Netherlands.
21. Pijnacker, J. (2010). Defeasible inference in autism: a behavioral and electrophysiogical approach. Radboud Universiteit Nijmegen, the Netherlands.
22. de Vrijer, M. (2010). Multisensory integration in spatial orientation. Radboud University Nijmegen, Nijmegen, the Netherlands.
23. Vergeer, M. (2010). Perceptual visibility and appearance: Effects of color and form. Radboud University Nijmegen, Nijmegen, the Netherlands.
24. Levy, J. (2010). In Cerebro Unveiling Unconscious Mechanisms during Reading. Radboud University Nijmegen, Nijmegen, the Netherlands.
25. Treder, M. S. (2010). Symmetry in (inter)action. Radboud University Nijmegen, Nijmegen, the Netherlands.
26. Horlings C.G.C. (2010). A Weak balance; balance and falls in patients with neuromuscular disorders. Radboud University Nijmegen, Nijmegen, the Netherlands
27. Snaphaan, L.J.A.E. (2010). Epidemiology of post-stroke behavioural consequences. Radboud University Nijmegen Medical Centre, Nijmegen, the Netherlands.
28. Dado – Van Beek, H.E.A. (2010). The regulation of cerebral perfusion in patients with Alzheimer’s disease. Radboud University Nijmegen Medical Centre, Nijmegen, the Netherlands.
29. Derks, N.M. (2010). The role of the non-preganglionic Edinger-Westphal nucleus in sex-dependent stress adaptation in rodents. Radboud University Nijmegen, Nijmegen, the Netherlands.
30. Wyczesany, M. (2010). Covariation of mood and brain activity. Integration of subjective self-report data with quantitative EEG measures. Radboud University Nijmegen, Nijmegen, the Netherlands.
31. Beurze S.M. (2010). Cortical mechanisms for reach planning. Radboud University Nijmegen, Nijmegen, the Netherlands.
32. van Dijk, J.P. (2010). On the Number of Motor Units. Radboud University Nijmegen, the Netherlands.
33. Lapatki, B.G. (2010). The Facial Musculature – Characterization at a Motor Unit Level. Radboud University Nijmegen, Nijmegen, the Netherlands.
34. Kok, P. (2010). Word Order and Verb Inflection in Agrammatic Sentence Production. Radboud University Nijmegen, Nijmegen, the Netherlands.
35. van Elk, M. (2010). Action semantics: Functional and neural dynamics. Radboud University Nijmegen, Nijmegen, the Netherlands.
36. Majdandzic, J. (2010). Cerebral mechanisms of processing action goals in self and others. Radboud University Nijmegen, Nijmegen, the Netherlands.

Series Donders Institute
143
37. Snijders, T.M. (2010). More than words – neural and genetic dynamics of syntactic unification. Radboud University Nijmegen, Nijmegen, the Netherlands.
38. Grootens, K.P. (2010). Cognitive dysfunction and effects of antipsychotics in schizophrenia and borderline personality disorder. Radboud University Nijmegen Medical Centre, Nijmegen, the Netherlands.
39. Nieuwenhuis, I.L.C. (2010). Memory consolidation: A process of integration – Converging evidence from MEG, fMRI and behavior. Radboud University Nijmegen Medical Centre, Nijmegen, the Netherlands.
40. Menenti, L.M.E. (2010). The right language: differential hemispheric contributions to language production and comprehension in context. Radboud University Nijmegen, Nijmegen, the Netherlands.
41. van Dijk, H.P. (2010). The state of the brain: how alpha oscillations shape behaviour and event related responses. Radboud University Nijmegen, Nijmegen, the Netherlands.
42. Meulenbroek, O.V. (2010). Neural correlates of episodic memory in healthy aging and Alzheimer’s disease. Radboud University Nijmegen, Nijmegen, the Netherlands.
43. Oude Nijhuis, L.B. (2010). Modulation of human balance reactions. Radboud University Nijmegen, Nijmegen, the Netherlands.
44. Qin, S. (2010) Adaptive memory: imaging medial temporal and prefrontal memory systems. Radboud University Nijmegen, the Netherlands.
45. Timmer, N.M. (2011). The interaction of heparan sulfate proteoglycans with the amyloid β protein. Radboud University Nijmegen, Nijmegen, the Netherlands.
46. Crajé, C. (2011). (A)typical motor planning and motor imagery. Radboud University Nijmegen, Nijmegen, the Netherlands.
47. van Grootel, T.J. (2011). On the role of eye and head position in spatial localisation behaviour. Radboud University Nijmegen, Nijmegen, the Netherlands.
48. Lamers, M.J.M. (2011). Levels of selective attention in action planning. Radboud University Nijmegen, Nijmegen, the Netherlands.
49. Van der Werf, J. (2011). Cortical oscillatory activity in human visuomotor integration. Radboud University Nijmegen, Nijmegen, the Netherlands.
50. Scheeringa, R. (2011). On the relation between oscillatory EEG activity and the BOLD signal. Radboud University Nijmegen, Nijmegen, the Netherlands.
51. Bögels, S. (2011). The role of prosody in language comprehension: when prosodic breaks and pitch accents come into play. Radboud University Nijmegen, Nijmegen, the Netherlands.
52. Ossewaarde, L. (2011). The mood cycle: hormonal influences on the female brain. Radboud University Nijmegen, Nijmegen, the Netherlands.
53. Kuribara, M. (2011). Environment-induced activation and growth of pituitary melanotrope cells of Xenopus laevis. Radboud University Nijmegen, Nijmegen, the Netherlands.
54. Helmich, R.C.G. (2011). Cerebral reorganization in Parkinson’s disease. Radboud University Nijmegen, Nijmegen, the Netherlands.

Series Donders Institute
144
55. Boelen, D. (2011). Order out of chaos? Assessment and treatment of executive disorders in brain-injured patients. Radboud University Nijmegen, Nijmegen, the Netherlands.
56. Koopmans, P.J. (2011). fMRI of cortical layers. Radboud University Nijmegen, Nijmegen, the Netherlands.
57. van der Linden, M.H. (2011). Experience-based cortical plasticity in object category representation. Radboud University Nijmegen, Nijmegen, the Netherlands.
58. Kleine, B.U. (2010). Motor unit discharges - Physiological and diagnostic studies in ALS. Radboud University Nijmegen Medical Centre, Nijmegen, the Netherlands.
59. Paulus, M. (2011). Development of action perception: Neurocognitive mechanisms underlying children’s processing of others’ actions. Radboud University Nijmegen, Nijmegen, the Netherlands.
60. Tieleman, A.A. (2011). Myotonic dystrophy type 2. A newly diagnosed disease in the Netherlands. Radboud University Nijmegen Medical Centre, Nijmegen, the Netherlands.
61. van Leeuwen, T.M. (2011). ‘How one can see what is not there’: Neural mechanisms of grapheme-colour synaesthesia. Radboud University Nijmegen, Nijmegen, the Netherlands.