How New York City Reduced Mass Incarceration · How New York City Reduced Mass Incarceration: ......
28
How New York City Reduced Mass Incarceration: A Model for Change? JANUARY 2013 James Austin, President, JFA Institute Michael Jacobson, President & Director, Vera Institute of Justice Foreword By Inimai Chettiar, Brennan Center for Justice at New York University School of Law at New York University School of Law
Transcript of How New York City Reduced Mass Incarceration · How New York City Reduced Mass Incarceration: ......

How New York City Reduced Mass Incarceration: A Model for Change?JANUARY 2013
James Austin, President, JFA InstituteMichael Jacobson, President & Director, Vera Institute of JusticeForeword By Inimai Chettiar, Brennan Center for Justice at New York University School of Law
at New York University School of Law

How New York CitY reduCed Mass iNCarCeratioN2
About the Authors
Dr. James Austin is the President of the JFA Institute. He is the former director of the Institute on Crime, Justice and Corrections at George Washington University in Washington, DC. He serves, or has recently served, as director for several large U.S. Department of Justice-funded research and evaluation programs and has served as the project director of the Bureau of Justice Assistance projects. He provides technical assistance to state and local jails, probation, parole, and prison systems. He was an expert witness in the landmark Supreme Court decision, Brown v. Plata, which mandated the state of California to reduce its prison population. Dr. Austin has authored numerous publications, including co-authoring (with John Irwin) It’s About Time: America’s Imprisonment Binge. (4th Edition), Wadsworth, 2011.
He was named by the American Correctional Association as its 1991 recipient of the Peter P. Lejin’s Research Award, and received the Western Society of Criminology Paul Tappin Award for outstanding contributions in the field of criminology. Dr. Austin holds a Ph.D. in sociology.
Michael P. Jacobson is the President and Director of the Vera Institute of Justice. He joined Vera as its fourth director in January 2005. He was a professor at the City University of New York Graduate Center and the John Jay College of Criminal Justice. He was the New York City Correction Commissioner from 1995 to 1998 and the City’s Probation Commissioner from 1992 to 1996. Prior to that, he worked in the New York City Office of Management and Budget from 1984 to 1992 where he was the Deputy Budget Director. He is the author of Downsizing Prisons: How to Reduce Crime and End Mass Incarceration (NYU Press 2005). He serves as chair of the New York City Criminal Justice Agency. Dr. Jacobson holds a Ph.D. in sociology.
Foreword Contributor
Inimai Chettiar is the Director of the Justice Program at the Brennan Center for Justice at NYU School of Law. Ms. Chettiar is one of the nation’s leading experts on cost-benefit analysis and criminal law. Prior to the Brennan Center, she coordinated the ACLU’s state legislative strategy to end overincarceration in states across the country. She was also a fellow at the Center for American Progress, an attorney the Institute for Policy Integrity, and a litigator at Debevoise & Plimpton LLP. Ms. Chettiar has published extensive scholarship on criminal law, fiscal policy, and racial inequalities. She holds a B.A. cum laude in political science and psychology from Georgetown University and a J.D. cum laude from the University of Chicago School of Law. She is a member of the Society for Benefit Cost Analysis, American Law Institute Model Penal Code Committee, U.S. Department of Justice Pretrial Justice Task Force, and American Correctional Association.

3
Foreword Inimai Chettiar
Several remarkable things have happened in New York’s crime and crime policy over the past 20 years. Some of these changes have been very visible, and others less so.
As in the rest of the country, crime and violence in the state plummeted dramatically. New York City reported the largest decline in crime. Meanwhile, the New York Police Department shifted its policing practices beginning in the 1990s, starting with the implementation of “broken windows” policing and morphing into the now infamous “stop-and-frisk” practices. These practices focus law enforcement resources on petty crimes or violations.
During this same time period, the entire incarcerated and correctional population of the City – the number of people in jails and prisons, and on probation and parole – dropped markedly. New York City sending fewer people into the justice system reduced mass incarceration in the entire state. This change was much less publicly noticed but just as noteworthy as the other two shifts. Though other states have decreased their prison populations, New York is the first state documented to have decreased its entire correctional population.
Are there connections between these three shifts – a decrease in crime, a decrease in the correctional population, and a sharp increase in controversial police practices? What factors contributed to these shifts? What about the costs of these shifts? Have they been evaluated and weighed against the benefits?
In this report, leading criminologists James Austin and Michael Jacobson take an empirical look at these powerful social changes and any interconnections. Examining data from 1985 to 2009, they conclude that New York City’s “broken windows” policy did something unexpected: it reduced the entire correctional population of the state. As the NYPD focused on low-level arrests, it devoted fewer resources to felony arrests. At the same time, a lowered crime rate – as an additional factor – meant that fewer people were committing felonies.
This combination led to fewer felony arrests and therefore fewer people entering the correctional system. Other policies – like programs that stopped punishing people with prison if not necessary – also contributed to this population drop.
New York’s drop in the correctional population was almost derailed in 1994 when the federal government paid states to create laws increasing prison sentences. Congress used the power of the purse to pull states in this direction in spite of evidence showing that increased prison time does not decrease crime or recidivism. The drop in New York’s corrections population would have occurred more quickly had the state not enacted such laws and increased prison stays.
This report poses a host of difficult questions for those who defend “broken windows” policing as well as those who find fault with it. Though the New York strategy identified by Austin and Jacobson has benefits, it also has costs. Focusing police resources on petty crimes, predominantly in neighborhoods of color, creates a host of economic and social costs for those arrested and their families. At the same time, this move actually contributed to a decrease in mass incarceration.
The data in this report tells us a lot, but there are still questions. The increase in low-level arrests did not bring down the correctional population; rather, the decrease in felony arrests did. Had the number of misdemeanor arrests decreased, the

How New York CitY reduCed Mass iNCarCeratioN4
correctional population would have declined more steeply. To what extent New York City’s policing strategy contributed to the drop in the crime rate is a complex question unanswered by the data in this report.
This report also does not evaluate the NYPD’s “stop-and-frisk” policy. It analyzes data in years before this practice became systemic. It also does not analyze the effects of the reforms to the notorious Rockefeller drug laws, since those reforms were enacted after the documented drop in correctional population.
Austin and Jacobson’s study comes at a critical juncture, when the United States is starting to reconsider its crime policy. With 2.3 million people behind bars and more than 25 percent of the country with criminal records, mass incarceration has become a national epidemic.1 Half of the people in state prisons are there for nonviolent offenses; half the people in federal prisons are there for drug offenses.2 At least 30 percent of new prison admissions are for violations of parole; and more than 20 percent of those incarcerated have not been convicted and are simply awaiting trial.3
In a policy area historically marked by rancor and recrimination, Austin and Jacobson offer something vital to lawmakers and advocates: facts. As state and federal governments begin to discuss how to reduce their incarcerated populations, this report offers empirical data to evaluate one model for change. The New York experience provides some vital lessons:
>Theories abound about why the national crime rate dropped, but the New York experience shows that mass incarceration is not necessary to decrease crime.
>Police practices have a monumental impact on mass incarceration. The police are almost always the first point of contact between an individual and the criminal justice system.
>Ending mass incarceration entails more than simply reducing prison populations. It requires reducing the entire correctional population – meaning the number of people arrested, in jails awaiting trial, in prisons serving sentences, and on probation and parole.
>Federal, state, and local policies can work together – or against each other – to create a drop in corrections populations. Federal funding streams can be a key mechanism affecting the size of state correctional systems.
>All criminal justice policies have costs and benefits that should be fully identified and weighed before implementation. This practice would be a marked shift from typical policymaking.
We hope this report will help lawmakers and advocates develop rational and effective criminal justice policies that keep Americans safe while shrinking the widening net of mass incarceration.

5
ContentsForeword
Executive Summary
8 I. Decline In New York Prison Population
9 A. Drop In New York City Admissions
10 B. Increase In Statewide Length Of Stay
14 II. Decline In New York Parole, Probation, And Jail Populations
17 III. Delayed Effect On State Corrections Budget
18 IV. Accompanying Drop In New York City’s Crime Rate And Shift In Arrest Policy
25 Conclusion
26 End Notes

How New York CitY reduCed Mass iNCarCeratioN6
New York is one of the first states to significantly reduce its entire correctional population. It reduced the number of people in prison and jail, and on probation and parole. This drop was driven exclusively by declines in New York City’s correctional population. Other jurisdictions in the state did not experience similar declines. This reduction occurred as the crime rate sharply declined in New York, showing that increasing imprisonment or other forms of correction are not needed to enjoy a lower crime rate.
This report concludes that a change in New York City’s policing strategy created this drop. Beginning in the 1990s, the New York Police Department shifted toward making more arrests for misdemeanors and fewer arrests for felonies. At the same time, the crime rate – and therefore actual commission of felonies – dropped. This drop in felony arrests is what contributed to the drop in the correctional population. The increase in misdemeanor arrests contributed to a small increase in the correctional population. However, taken together, these two shifts created a huge drop in the correctional population. This result demonstrates why local policies are just as vital to reducing mass incarceration as state legislation, and how every state could benefit from a strategy that incorporates both levels of reform.
Analyzing primary data from 1985 to 2009, this report finds the following key facts:
reduCtion in Prison PoPulAtion
1. The New York State prison population declined by 17 percent from approximately 71,000 people in 2000 to 59,000 in 2009. Declines in the New York City prison population drove the decline for the entire state.
2. Much of the decline in the prison population occurred as the number of people sentenced to state prison for felonies (prison admissions) from New York City began to decline in 1992. Conversely, prison admissions increased for felony convictions outside of New York City.
3. Prison disposition rates (cases in which defendants were sent to prison) in New York City declined from about 22 percent in 1994 to 15 percent by 2008. The main causes of this drop were the use of “conditional discharge,” and the expansion of programs to divert drug offenders to alternatives to prison. Prison disposition rates in non-New York City counties actually increased from 14 percent to 18 percent over the same period.
4. Sentence lengths and time served in prison in New York City and the state as a whole increased from 1990 to 2010. The federal government’s Violent Crime Control and Law Enforcement Act of 1994 was one driver of this increase. That law provided over $9 billion in prison construction funds to states if they increased their length of sentence through “truth-in-sentencing” laws. Congress passed this law despite evidence showing that such laws do not decrease crime or recidivism. New York alone received over $216 million by passing such laws. The state prison population would have declined more dramatically had these “truth-in-sentencing” laws not been enacted.
reduCtion in PArole, ProbAtion, And JAil PoPulAtions
5. The state probation population declined 19 percent from 150,000 in 1998 to 122,000 by 2008. Fewer probation sentences in New York City, where the probation population declined 43 percent, from 77,000 in 1998 to 44,000 in 2008, drove this decline. During the same time period, the probation population remained stable outside of New York City.
Executive Summary
7
6. Similarly, the state parole population declined 22 percent, from 54,000 in 1997 to 42,000 in 2008, with all of the reduction occurring in New York City.
7. The New York City jail system declined 40 percent, from nearly 22,000 in 1991 to 13,200 in 2009.
8. Declines in the New York City non-prison correctional population drove the decline for the entire state.
delAyed eFFeCt on budget
9. Despite the decline in the state prison population, the annual operating budget of the New York Department of Correctional Services increased from $1.6 billion in Fiscal Year 1998-99 to $2.5 billion in Fiscal Year 2006-07. This occurred because the state did not close any facilities, although it had housed 8,000 fewer people than in 2000.
10. Only in 2008 did the corrections budget stabilize. Beginning in 2011, the state closed 10 prisons as well as many other camps, dorms, and housing units.
11. There is evidence that the reduced prison population created a safer prison system with less violence to inmates and staff.
reduCtion in Crime And shiFt in Arrest PoliCy
12. From 1988 to 2008, the number of felonies reported by New York City to the FBI dropped from 719,887 to 198,419 – a remarkable 72 percent reduction. Outside of New York City, the number of crimes declined by half as much, only 38 percent.
13. The primary driver of the drop in correctional population in New York was the significant decrease in felony arrests in New York City. Jurisdictions outside of New York City did not experience a similar shift in arrests.
14. NYPD’s shifting resources toward misdemeanor arrests as part of the “broken windows” policing model contributed to the decrease in the felony arrests. A drop in the number of felonies committed generally also contributed to the correctional population decrease. Fewer felony arrests led fewer people to enter prison, probation, or parole rolls.
15. A policy simply increasing misdemeanor arrests while keeping felony arrest and indictments constant would not reduce correctional populations.
16. Other factors, such as New York’s various diversion programs, also contributed to the correctional population decline.
From a policy view, the New York experience shows what legal scholars such as Franklin E. Zimring have noted, that police practices “matter.”4 A shift in these local practices can have a dramatic impact on reducing state correctional populations while enhancing public safety and encouraging a drop in the crime rate. Such shifts can have complex results. When evaluating the big picture, reducing mass incarceration in New York may be worth more misdemeanor arrests. There also may be ways to implement police practices that do not increase misdemeanor rates. States that seek to reduce mass incarceration should embrace a balanced, data-driven policy selection process that involves both state and local action.

How New York CitY reduCed Mass iNCarCeratioN8
I. Decline in New York Prison PopulationAll correctional populations are the result of two key factors – admissions and length of stay (LOS). A jurisdiction’s correctional population is the function of the following formula:
(Admissions x Length of stAy) = CorreCtionAL PoPuLAtion.
As either or both of these two population drivers change, so too will the resulting correctional population. While this is a straight-forward formula, it masks the various factors and decisions that produce an admission or a LOS. In order to propose reforms that would lower correctional populations, it is important to understand these various factors and dynamics that have fueled the historic increases in population.
Like most states, New York’s prison population began to increase steadily beginning in the 1970s. However, New York reached its peak in 2000 with about 71,500 people and has since declined by 17 percent to 59,000 people in 2009. Conversely, the national state prisoner population has continued to increase at a steady but gradually declining rate (Figure 1). So one must ask: Did prison admissions or length of stay (or a combination of the two) reduce New York’s prison population?
Figure 1. Prisoners Under Jurisdictions of the States, 1985 – 2010
0
10,000
20,000
30,000
40,000
50,000
60,000
70,000
80,000
0
200,000
400,000
600,000
800,000
1,000,000
1,200,000
1,400,000
1985 1986 1987 1988 1989 1990 1991 1992 1993 1994 1995 1996 1997 1998 1999 2000 2001 2002 2003 2004 2005 2006 2007 2008 2009 2010
New
Yor
k
US
Tota
l
Figure 1. Prisoners Under the Jurisdictions of the States 1985-2010
US Total NY Prison
Source: Sourcebook of Criminal Justice Statistics, On Line and BJS NPS Prisoner Reports 2000 – 2010.

9
A. droP in new york City Admissions
Nationally, parole violations and new commitments are two of the most common categories for people admitted to the prison system. A new commitment is an individual who was not under parole supervision at the time he or she was convicted of a new crime. A sizeable portion of new commitments, however, include people who were under probation supervision at the time they either were convicted of a new felony or violated the terms of supervision. People who violate probation or parole supervision can account for more than half of total prison admissions.
As shown in Figure 2, the number of new commitments began to decline in 1992, eight years before the prison population began to decline. Since 1992, the number of new court commitments declined by 36 percent from 25,000 to 16,000 per year.
Figure 2. New York Prison Population and Admissions, 1985 – 2008
0
10,000
20,000
30,000
40,000
50,000
60,000
70,000
80,000
0
5,000
10,000
15,000
20,000
25,000
30,000
1985 1986 1987 1988 1989 1990 1991 1992 1993 1994 1995 1996 1997 1998 1999 2000 2001 2002 2003 2004 2005 2006 2007 2008
Dai
ly P
riso
n Po
pul
atio
n
Pris
on A
dm
issi
ons
and
Par
ole
Vio
lato
rs
Parole Violations New Commitments Total Prisoners
Source: Primary data from New York Department of Corrections and Community Supervision, 2009 – 2010.

How New York CitY reduCed Mass iNCarCeratioN10
Figure 3. Length of Stay for First Release by Major Crime Category, 1985 – 2010
20
30
40
50
60
70
80
90
1985 1986 1987 1988 1989 1990 1991 1992 1993 1994 1995 1996 1997 1998 1999 2000 2001 2002 2003 2004 2005 2006 2007 2008 2009 2010
Leng
th o
f St
ay in
Mon
ths
Total LOS
Violent Felony
Property
Drugs
Coercive
Source: Primary data from New York Department of Corrections and Community Supervision, 2009 – 2010.
b. inCreAse in stAtewide length oF stAy
Why did the prison population continue to increase for eight years before it began to decline? In New York, it was due to a steady increase in the LOS. As shown in Figure 3, the LOS steadily increased beginning after 1990, when it averaged 28 months.5 By 2004 the LOS had increased to nearly 44 months, a 57 percent increase. More recently, in 2010, it increased yet again.
A partial explanation for this increase is a greater proportion of people entering prison convicted of violent crimes while the number of people convicted of non-violent crimes (especially drug crimes) has declined (see Figure 4). But even for those convicted of violent crimes, the LOS has steadily increased (see Table 1).

11
Table 1. New York State Prison Length of Stay (In Months) by Major Crime Category, 1990 – 2010
YEAR VIOLENT FELONY OTHER COERCIVE DRUG OFFENSES PROPERTY OTHER TOTAL RELEASES
1990 40.5 25.3 22.2 21.7 27.9
1991 42.4 26.7 24.2 21.5 29.4
1992 42.6 26.9 25.3 21.8 30.2
1993 45.2 27.5 26.1 21.7 31.4
1994 47.1 28.1 27.3 22.4 32.7
1995 46.9 29.9 27.5 22.6 32.6
1996 48.7 29.3 29.2 22.8 33.4
1997 52.4 30.6 30.2 23.4 34.5
1998 57.7 33.1 29.8 23.6 35.5
1999 60.8 33.4 29.6 25.0 36.6
2000 64.0 35.9 32.3 26.3 39.8
2001 69.9 36.7 34.6 26.1 43.0
2002 71.8 37.1 33.7 25.7 43.5
2003 73.4 36.9 35.5 26.0 44.4
2004 71.7 36.3 35.5 25.6 43.8
2005 72.3 36.8 35.9 24.9 43.8
2006 74.9 36.9 31.4 26.2 43.3
2007 79.5 35.7 29.8 25.3 43.4
2008 77.9 36.9 28.6 25.8 43.2
2009 77.6 37.1 30.0 26.2 44.6
2010 81.3 37.0 32.6 27.2 47.2
Source: Primary data from New York Department of Corrections and Community Supervision, 2009 – 2010.
This increase in the LOS is largely due to New York state enacting a number of “truth-in-sentencing” laws since 1995 that require people convicted of certain violent crimes to serve six-sevenths (approximately 85 percent) of their imposed sentences. Prior to 1995, all prisoners were sentenced under an indeterminate sentencing structure.6 The state also added burglary in the 1st and 2nd degree – which typically involve burglary in an occupied building – to the violent crime category, increasing the LOS for those crimes too.
This move to increase the LOS was driven in part by a 1994 federal law titled the Violent Crime Control and Law Enforcement Act. This law, signed by President Clinton, provided more than $9 billion in prison construction funds to states that would increase the LOS to 85 percent of the imposed sentence for people convicted of violent crimes.7 This was done despite little if any scientific evidence that longer prison terms would reduce either crime or recidivism rates. New York alone received over $216 million for passing “truth-in-sentencing” laws. These funds were also used to open the New York Department of Corrections and Community Supervision’s (DOCCS) innovative Willard Drug Treatment Center prison.

How New York CitY reduCed Mass iNCarCeratioN12
The DOCCS mitigated the effects of the growing LOS through its Merit Time Program (MTP). Enacted in 1997, the MTP allows people convicted of certain non-violent offenses to receive a one-sixth reduction in their minimum sentence for indeterminate sentences or one-sixth off their determinate sentence.8 To receive merit time, one must participate in a program – such as obtaining a GED, a substance abuse treatment certificate, or a vocational training certificate – or perform 400 hours on a community work crew.
Between 1997 through the end of 2006, approximately 24,000 inmates were released on average six months earlier through the MTP. In 2003, the state expanded eligibility for the MTP to include people convicted of high level drug crimes. With about 2,700 people released six months early each year, the MTP is reducing the total prison population by approximately 1,350 people annually.
The types of crimes for which people were sentenced to prison also helps explain the overall increase in the LOS. Figure 4 shows that prison admissions for drug crimes dropped the most since 1992 compared to other crimes. Although admissions declined for violent crimes (from 8,600 in 1992 to about 5,000 in 2008), drug crime admissions dropped as well, from 11,250 to about 5,000 over that same period, a 55 percent decrease. Conversely property crime admissions steadily increased.
From 1999 to 2008, the LOS for violent felony offenses increased by 17 months, whereas the LOS for other crime categories remained relatively stable (see Table 1). Therefore, substantial increases in the LOS for violent offenses outweighed the decline in admissions for these crimes. The increase in overall LOS was largely due to increases in the LOS for violent crimes.
Figure 4. Prison Admissions by Violent, Drug and Property Offenses, 1985 – 2008
0
2,000
4,000
6,000
8,000
10,000
12,000
1985 1986 1987 1988 1989 1990 1991 1992 1993 1994 1995 1996 1997 1998 1999 2000 2001 2002 2003 2004 2005 2006 2007 2008
Pris
on A
dm
issi
ons
Per
Year
Violent Felony
Drug Admissions
Property/Other
Source: Primary data from New York Department of Corrections and Community Supervision, 2009 – 2010.
13
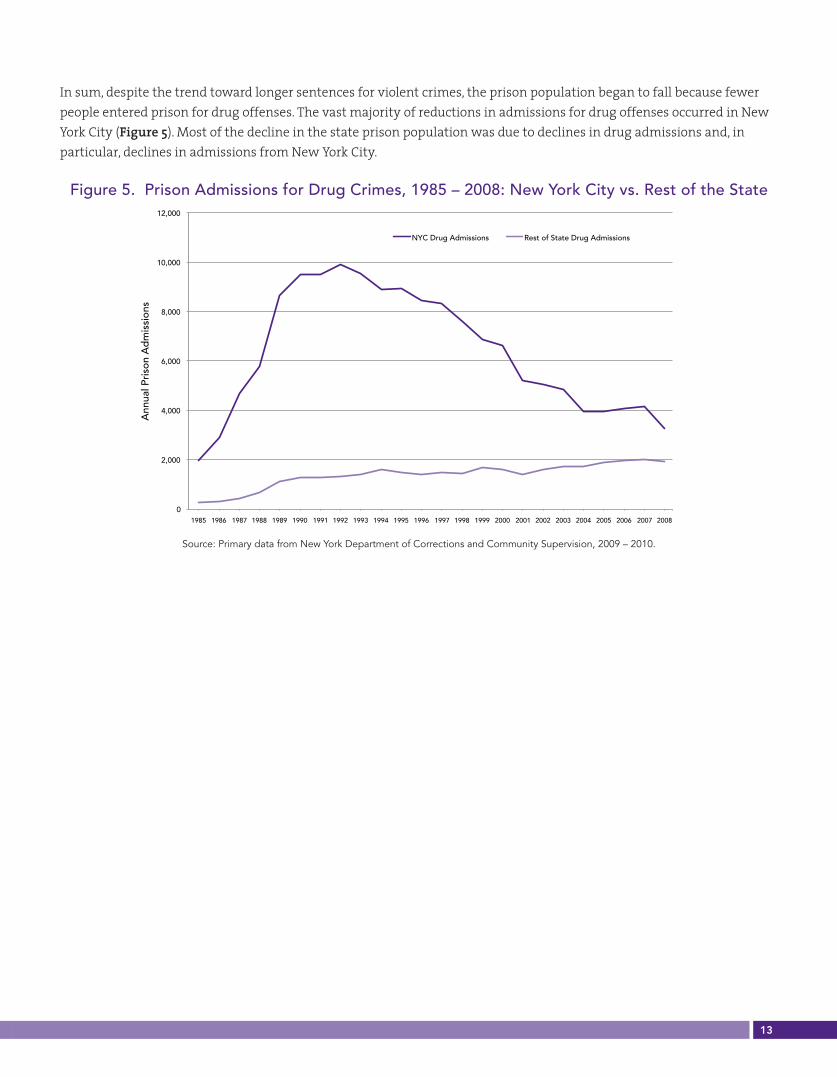
In sum, despite the trend toward longer sentences for violent crimes, the prison population began to fall because fewer people entered prison for drug offenses. The vast majority of reductions in admissions for drug offenses occurred in New York City (Figure 5). Most of the decline in the state prison population was due to declines in drug admissions and, in particular, declines in admissions from New York City.
Figure 5. Prison Admissions for Drug Crimes, 1985 – 2008: New York City vs. Rest of the State
0
2,000
4,000
6,000
8,000
10,000
12,000
1985 1986 1987 1988 1989 1990 1991 1992 1993 1994 1995 1996 1997 1998 1999 2000 2001 2002 2003 2004 2005 2006 2007 2008
Ann
ual P
riso
n A
dm
issi
ons
NYC Drug Admissions Rest of State Drug Admissions
Source: Primary data from New York Department of Corrections and Community Supervision, 2009 – 2010.

How New York CitY reduCed Mass iNCarCeratioN14
The city’s Drug Treatment Alternatives Program (DTAP) may also have contributed to this decline. In DTAP, an individual is convicted but the sentence is delayed. If the individual completes a court ordered drug treatment, his or her felony conviction is often reduced to a misdemeanor or the charges are dismissed with no prison time. As a result of these major trends, the state prison population increasingly consisted of persons convicted of non-drug crimes and from jurisdictions outside of New York City (Figure 6).
Figure 6. Prison Population by Crime Category, 1985 – 2009
0
5,000
10,000
15,000
20,000
25,000
30,000
35,000
40,000
1985 1986 1987 1988 1989 1990 1991 1992 1993 1994 1995 1196 1997 1998 1999 2000 2001 2002 2003 2004 2005 2006 2007 2008 2009
Pris
oner
s in
Cus
tod
y
Violent Felony Drugs Property/Others
Source: Primary data from New York Department of Corrections and Community Supervision, 2009 – 2010.
II. Decline in New York Parole, Probation, and Jail Populations
The same differential growth and decline between New York City and the rest of the state also occurred for probation, jail, and parole populations. Figure 7 shows the historic growth patterns for the probation system for New York City and the rest of the state. The state probation population declined significantly beginning in 1998, from 150,000 to 122,000 people by 2008, a 19 percent decrease. Like the decline in the state prison population, this reduction was limited to people sentenced to probation in New York City, which saw its probation population decline from 77,000 to 44,000 over this period. During the same time period, the probation population outside of New York City remained stable.

15
Figure 7. Probation Populations, 1985 – 2008
0
20,000
40,000
60,000
80,000
100,000
120,000
140,000
160,000
180,000
1985 1986 1987 1988 1989 1990 1991 1992 1993 1994 1995 1996 1997 1998 1999 2000 2001 2002 2003 2004 2005 2006 2007 2008
NYC Rest of State Total
Source: Primary data from New York Division of Criminal Justice Services, 2009 – 2010.
Similarly, the state parole population declined since 1997, from 54,000 to 42,000 in 2008, due to fewer parolees from New York City. The number of people on parole supervision who had served prison terms from New York City declined from 36,000 to 23,000 (Figure 8).
Finally, the New York City jail system population declined significantly, from nearly 22,000 in 1991 to 13,200 as of 2009, a 40 percent decrease. While non-New York City jail data is only available from 1999, that information shows a slight increase in jail populations (Figure 9).
In summary, while every correctional population in New York State declined, these reductions occurred only because these populations declined in New York City.

How New York CitY reduCed Mass iNCarCeratioN16
Figure 8. Parole Populations, 1996 – 2008: New York City vs. Rest of the State
0
10,000
20,000
30,000
40,000
50,000
60,000
1996 1997 1998 1999 2000 2001 2002 2003 2004 2005 2006 2007 2008
NYC Rest of State Total
Source: Primary data from New York Department of Corrections and Community Supervision, 2009 – 2010.
Figure 9. Jail Populations, 1985 – 2008: New York City vs. Rest of the State
0
5,000
10,000
15,000
20,000
25,000
1985 1986 1987 1988 1989 1990 1991 1992 1993 1994 1995 1996 1997 1998 1999 2000 2001 2002 2003 2004 2005 2006 2007 2008
NYC Rest of State
Source: Primary data from New York Division of Criminal Justice Services, 2009 – 2010.
17
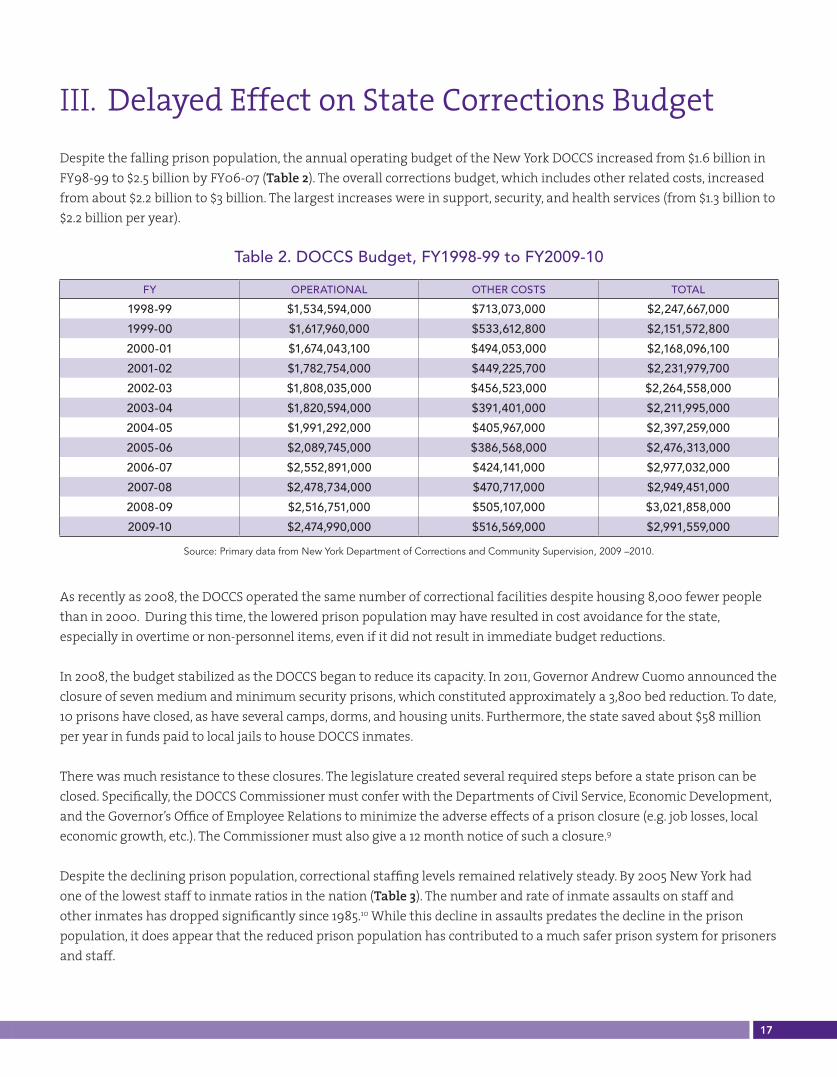
III. Delayed Effect on State Corrections Budget Despite the falling prison population, the annual operating budget of the New York DOCCS increased from $1.6 billion in FY98-99 to $2.5 billion by FY06-07 (Table 2). The overall corrections budget, which includes other related costs, increased from about $2.2 billion to $3 billion. The largest increases were in support, security, and health services (from $1.3 billion to $2.2 billion per year).
Table 2. DOCCS Budget, FY1998-99 to FY2009-10
FY OPERATIONAL OTHER COSTS TOTAL
1998-99 $1,534,594,000 $713,073,000 $2,247,667,000
1999-00 $1,617,960,000 $533,612,800 $2,151,572,800
2000-01 $1,674,043,100 $494,053,000 $2,168,096,100
2001-02 $1,782,754,000 $449,225,700 $2,231,979,700
2002-03 $1,808,035,000 $456,523,000 $2,264,558,000
2003-04 $1,820,594,000 $391,401,000 $2,211,995,000
2004-05 $1,991,292,000 $405,967,000 $2,397,259,000
2005-06 $2,089,745,000 $386,568,000 $2,476,313,000
2006-07 $2,552,891,000 $424,141,000 $2,977,032,000
2007-08 $2,478,734,000 $470,717,000 $2,949,451,000
2008-09 $2,516,751,000 $505,107,000 $3,021,858,000
2009-10 $2,474,990,000 $516,569,000 $2,991,559,000
Source: Primary data from New York Department of Corrections and Community Supervision, 2009 –2010.
As recently as 2008, the DOCCS operated the same number of correctional facilities despite housing 8,000 fewer people than in 2000. During this time, the lowered prison population may have resulted in cost avoidance for the state, especially in overtime or non-personnel items, even if it did not result in immediate budget reductions.
In 2008, the budget stabilized as the DOCCS began to reduce its capacity. In 2011, Governor Andrew Cuomo announced the closure of seven medium and minimum security prisons, which constituted approximately a 3,800 bed reduction. To date, 10 prisons have closed, as have several camps, dorms, and housing units. Furthermore, the state saved about $58 million per year in funds paid to local jails to house DOCCS inmates.
There was much resistance to these closures. The legislature created several required steps before a state prison can be closed. Specifically, the DOCCS Commissioner must confer with the Departments of Civil Service, Economic Development, and the Governor’s Office of Employee Relations to minimize the adverse effects of a prison closure (e.g. job losses, local economic growth, etc.). The Commissioner must also give a 12 month notice of such a closure.9
Despite the declining prison population, correctional staffing levels remained relatively steady. By 2005 New York had one of the lowest staff to inmate ratios in the nation (Table 3). The number and rate of inmate assaults on staff and other inmates has dropped significantly since 1985.10 While this decline in assaults predates the decline in the prison population, it does appear that the reduced prison population has contributed to a much safer prison system for prisoners and staff.
How New York CitY reduCed Mass iNCarCeratioN18
Table 3. Employee and Inmate Numbers and Ratios, 2005
EMPLOYEES INMATESSTAFF TO
INMATE RATIO
US 445,055 1,430,208 1:3.2
California 47,881 169,988 1:3.5
Florida 23,038 86,705 1:3.8
New York 31,573 63,855 1:2.0
Texas 38,097 163,556 1:4.3
Source: James J. Stephan, Bureau of Justice Statistics, U.s. Dep’t Of Justice, Bulletin No. Ncj 222182, Census of State and Federal Correctional Facilities (2005),
available at http://bjs.ojp.usdoj.gov/content/pub/pdf/csfcf05.pdf.
IV. Accompanying Drop in New York City’s Crime Rate and Shift in Arrest Policy
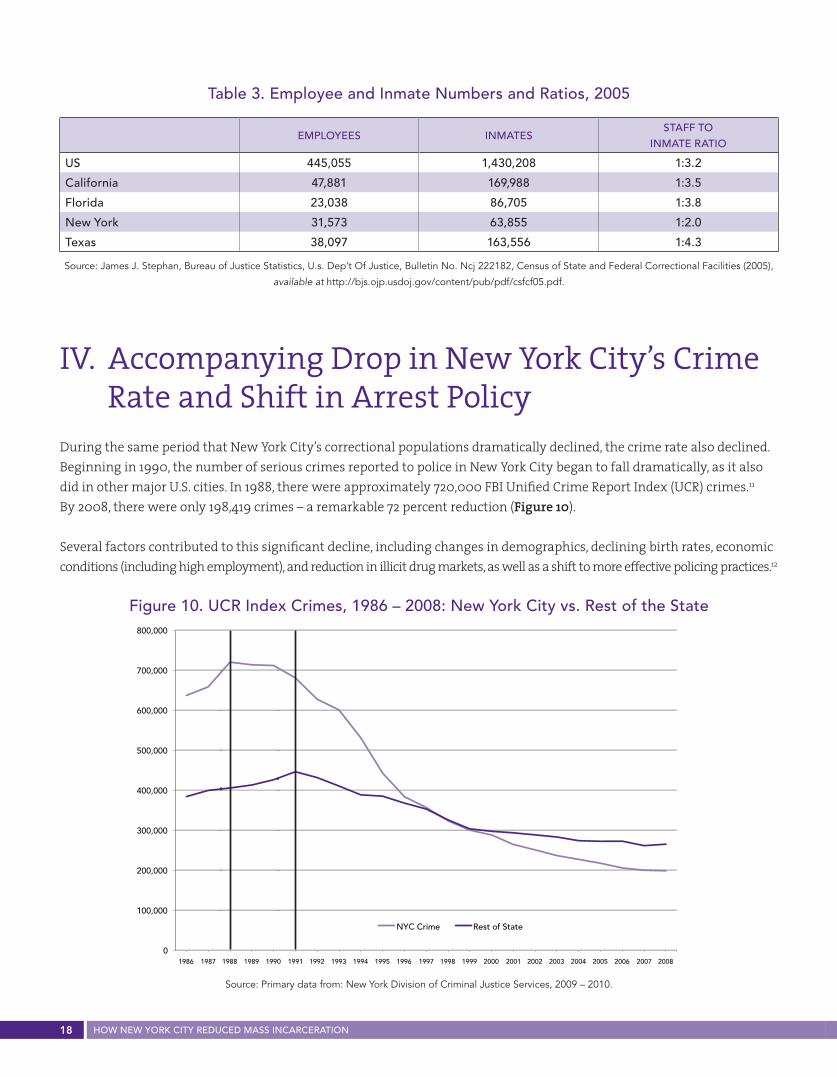
During the same period that New York City’s correctional populations dramatically declined, the crime rate also declined. Beginning in 1990, the number of serious crimes reported to police in New York City began to fall dramatically, as it also did in other major U.S. cities. In 1988, there were approximately 720,000 FBI Unified Crime Report Index (UCR) crimes.11 By 2008, there were only 198,419 crimes – a remarkable 72 percent reduction (Figure 10).
Several factors contributed to this significant decline, including changes in demographics, declining birth rates, economic conditions (including high employment), and reduction in illicit drug markets, as well as a shift to more effective policing practices.12
Figure 10. UCR Index Crimes, 1986 – 2008: New York City vs. Rest of the State
0
100,000
200,000
300,000
400,000
500,000
600,000
700,000
800,000
1986 1987 1988 1989 1990 1991 1992 1993 1994 1995 1996 1997 1998 1999 2000 2001 2002 2003 2004 2005 2006 2007 2008
NYC Crime Rest of State
Source: Primary data from: New York Division of Criminal Justice Services, 2009 – 2010.

19
As shown in Table 4, New York City, compared to the United States as a whole, had significantly lower rates of crime and correctional supervision by 2008. The rates of jail and probation supervision in New York City are extremely low compared to national rates. The state prison rate for New York City would be even lower had the state not increased the LOS, which is now one of the nation’s highest.
Table 4: New York City and United States Crime and Use of Corrections Per 100,000 Population, 2008
ATTRIBUTE NYC US
Crime Rates Per 100,000
Total 2,378 3,667
Violent 580 455
Corrections Rates Per 100,000
Prison 369 445
Jail 162 258
Probation 538 1,397
Parole 285 240
Total Corrections Rate 1,354 2,340
Source: FBI Uniform Crime Reports and Bureau of Justice Statistics, 2008.
But one should not conclude that reductions in the crime rate produced the drop in the correctional population. New York state jurisdictions outside New York City experienced a 38 percent drop in crime, without reducing the number of people sentenced to state and local correctional systems. Furthermore, the other 49 states and the District of Columbia have also reported significant reductions in their crime rates, some as much as New York City, but have not reduced their correctional populations.13
One key difference between New York City and other jurisdictions is evident in arrest data. As shown in Figure 11, while overall arrests increased slightly since 1985, there was a major shift from felony to misdemeanor arrests. In the early 1990s, the NYPD began to slowly but steadily decrease the number of felony arrests and simultaneously increase the number of misdemeanor arrests. By 2008, felony arrests had significantly declined while misdemeanor arrests had significantly increased. The reduction in felony arrests coincides with the drop in prison admissions noted earlier (see Figure 2), which predated the drop in correctional populations by several years. Because this shift only occurred in New York City, the rest of the state did not experience similar reductions in correction populations (Figure 12).

How New York CitY reduCed Mass iNCarCeratioN20
Figure 11. New York City Arrests for Misdemeanors and Felonies, 1985 – 2008
0
50,000
100,000
150,000
200,000
250,000
300,000
350,000
400,000
1986 1987 1988 1989 1990 1991 1992 1993 1994 1995 1996 1997 1998 1999 2000 2001 2002 2003 2004 2005 2006 2007 2008
Total Felony Misd.
Source: Primary data from New York Division of Criminal Justice Services, 2009 – 2010.
Figure 12. Non-New York City Arrests for Misdemeanors and Felonies, 1985 – 2008
0
50,000
100,000
150,000
200,000
250,000
300,000
1986 1987 1988 1989 1990 1991 1992 1993 1994 1995 1996 1997 1998 1999 2000 2001 2002 2003 2004 2005 2006 2007 2008
Ad
ult
Arr
ests
Per
Yea
r
Felony Misd. Total Arrests
Source: Primary data from New York Division of Criminal Justice Services, 2009– 2010.

21
Arrests for misdemeanor drug crimes in New York City increased more than arrests for other misdemeanor crimes (Figure 13). Further, felony drug arrests dropped significantly since 1986 while misdemeanor drugs arrests in New York City more than doubled (Figure 14).
Figure 13. New York City Misdemeanor Arrests, 1986 – 2008
0
20,000
40,000
60,000
80,000
100,000
120,000
1986 1987 1988 1989 1990 1991 1992 1993 1994 1995 1996 1997 1998 1999 2000 2001 2002 2003 2004 2005 2006 2007 2008
Mis
dem
eano
r A
rres
ts P
er Y
ear
Drug Property Other
Source: Primary data from New York Division of Criminal Justice Services, 2009 – 2010.
Figure 14. New York City Drug Arrests, 1986 – 2008
0
20,000
40,000
60,000
80,000
100,000
120,000
1986 1987 1988 1989 1990 1991 1992 1993 1994 1995 1996 1997 1998 1999 2000 2001 2002 2003 2004 2005 2006 2007 2008
Dru
g A
rres
ts P
er Y
ear
Felony Drug Arrests Misd. Drug Arrests
Source: Primary data from New York Division of Criminal Justice Services, 2009 – 2010.
How New York CitY reduCed Mass iNCarCeratioN22
The reduction in felony arrests should not be viewed as a decision by the NYPD to ignore serious crime. Rather, it reflects a shift in police strategies to focus on so-called “quality of life”, “zero tolerance”, or “broken windows” police strategies.14 These policies focus law enforcement resources on misdemeanor crimes such as loitering, trespassing, and vagrancy. Notably, these changes in NYPD practices post-date the beginning of the crime rate decline.
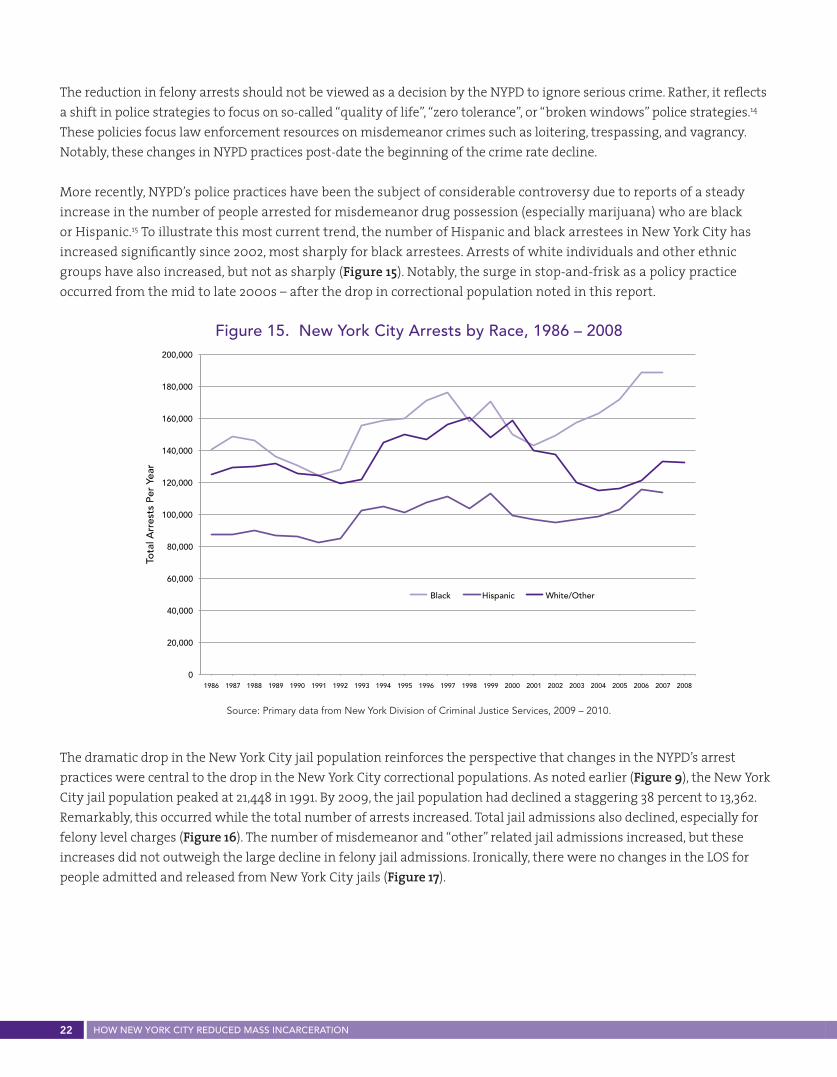
More recently, NYPD’s police practices have been the subject of considerable controversy due to reports of a steady increase in the number of people arrested for misdemeanor drug possession (especially marijuana) who are black or Hispanic.15 To illustrate this most current trend, the number of Hispanic and black arrestees in New York City has increased significantly since 2002, most sharply for black arrestees. Arrests of white individuals and other ethnic groups have also increased, but not as sharply (Figure 15). Notably, the surge in stop-and-frisk as a policy practice occurred from the mid to late 2000s – after the drop in correctional population noted in this report.
Figure 15. New York City Arrests by Race, 1986 – 2008
0
20,000
40,000
60,000
80,000
100,000
120,000
140,000
160,000
180,000
200,000
1986 1987 1988 1989 1990 1991 1992 1993 1994 1995 1996 1997 1998 1999 2000 2001 2002 2003 2004 2005 2006 2007 2008
Tota
l Arr
ests
Per
Yea
r
Black Hispanic White/Other
Source: Primary data from New York Division of Criminal Justice Services, 2009 – 2010.
The dramatic drop in the New York City jail population reinforces the perspective that changes in the NYPD’s arrest practices were central to the drop in the New York City correctional populations. As noted earlier (Figure 9), the New York City jail population peaked at 21,448 in 1991. By 2009, the jail population had declined a staggering 38 percent to 13,362. Remarkably, this occurred while the total number of arrests increased. Total jail admissions also declined, especially for felony level charges (Figure 16). The number of misdemeanor and “other” related jail admissions increased, but these increases did not outweigh the large decline in felony jail admissions. Ironically, there were no changes in the LOS for people admitted and released from New York City jails (Figure 17).

23
Figure 16. New York City Jail Admissions by Most Serious Charge, 1994 – 2009
0
20,000
40,000
60,000
80,000
100,000
120,000
140,000
1994 1995 1996 1997 1998 1999 2000 2001 2002 2003 2004 2005 2006 2007 2008 2009
All Felonies All Misd. All Other Annual Admissions
Jail
Ad
mis
sion
s
Source: Primary data from New York City Department of Corrections, 2009 – 2010.
Figure 17. New York City Jail Length of Stay (in days) by Felony and Misdemeanors, 1996 – 2009
0
10
20
30
40
50
60
70
80
90
1996 1997 1998 1999 2000 2001 2002 2003 2004 2005 2006 2007 2008 2009
Leng
th o
f St
ay in
Day
s
Felony Misd. Total
Source: Primary data from New York City Department of Corrections, 2009 – 2010.

How New York CitY reduCed Mass iNCarCeratioN24
In summary, the reduction in felony arrests by the NYPD explains why all forms of correctional supervision dropped. Fewer people arrested for felonies led to fewer people in prison, and on probation or parole. Even though the volume of arrests actually increased, courts are less able to sentence people to prison, keep them in jail on pretrial detention status, or sentence them to probation. This lowering of the prison, jail, probation, and parole populations of the city brought down the correctional population of the entire state.
Also, there was a sharp decline in the prison disposition rate within New York City. As shown in Table 5, between 1993 and 2008 there was a 50 percent decline in the prison disposition rate for felony convictions in New York City. Outside of New York City, there was no such decline.
Table 5. Prison Disposition Rates for Felony Convictions, 1993 & 2008
REGION 1993 2008
New York City 27% 13%
Rest of the State 17% 18%
Total 22% 15%
Source: Primary data from: New York State Division of Criminal Justice Services, 2009 – 2010.
The drop in the prison disposition rate in New York City coincided with an increase in the use of “conditional discharge,” which is a form of diversion (Figure 18). The prosecutor reaches an agreement with the defendant early on in the pretrial process that if the defendant agrees to enter into treatment (usually drug treatment) and complete that program without incurring subsequent arrests, the original charges are dropped. However, according to Manhattan District Attorney staff, conditional discharges are not offered to any defendant who may serve a prison term if convicted. Thus, the greater use of conditional discharge may not be related to the overall decline in prison dispositions (Figure 18).16
Figure 18. Felony Dispositions by Type, 1986 – 2008
0
5,000
10,000
15,000
20,000
25,000
1986 1987 1988 1989 1990 1991 1992 1993 1994 1995 1996 1997 1998 1999 2000 2001 2002 2003 2004 2005 2006 2007 2008
Felo
ny D
isp
osiit
ons
Per
Year
Prison Probation Cond Discharge
Source: Primary data from New York Division of Criminal Justice Services, 2009 – 2010.

25
New York City has a wide array of alternatives to incarceration programs funded by New York State, New York City, and local foundations aimed at reducing the prison disposition rate. These programs are operated by the following entities:
> Center for Alternative Sentencing and Employment Services (CASES);
> Center for Community Alternatives (CCA);
> Center for Employment Opportunities (CEO);
> Fortune Society;
> Project Greenhope;
> Palladia;
> Osborne Association; and
> Women’s Prison Association (WPA).
Such a vibrant and mature array of alternative programs does not exist outside of New York City, which may explain why the prison disposition rate for non-New York City counties did not decline, but actually increased slightly from 17 percent to 18 percent over the same period. The percentage of felony arrests resulting in a “conditional discharge” has not increased in these other jurisdictions.
Much of the decline in the correctional population is linked directly to a decline in the number of people arrested for felony level crimes. This decline in felony arrests was due, in large part, to changes in police practices carried out by the New York Police Department beginning in the early 1990s.
ConclusionThe declines in New York State’s prison population as well as the New York City jail population are due largely to a reduction in the number of people being arrested for felony level crimes. Greater use of non-prison sanctions by New York City courts also contributed to the decline. The New York City and overall New York prison population decline would have occurred much sooner had the state legislature not been incentivized by the federal government to adopt “truth-in-sentencing” laws that increased the length of imprisonment.
These results show that policy changes at the local level can have a dramatic and lasting impact on state prison as well as jail, probation, and parole populations. Further, the decline in the state prison population was not initially associated with a decline in prison costs. In fact, the state prison budget increased significantly while the prison population declined. Only in recent years has the DOCCS budget stabilized, and prisons begun to close.
The New York experience has two important lessons for efforts to reduce the national epidemic use of mass incarceration. First, changes in policy at the local level (especially police policy) can have a dramatic impact on all forms of correctional supervision and imprisonment. Thus, efforts that only focus on reform at the state level of government are incomplete and may not be as effective as those coupled with locally initiated reforms. Second, both incarceration and crime rates can be reduced. Thus, the argument that lowering prison and jail populations will necessarily trigger increases in crime rates are patently false.

How New York CitY reduCed Mass iNCarCeratioN26
1 The 2.3 million figure is the sum of the total prisoners under the jurisdiction of state and federal correctional facilities at the end of 2011 (1,598,780) and the total number of people confined in county and city jails in June 2011 (735,601). E. Ann CArson & WilliAm J. sAbol, burEAu of JustiCE stAtistiCs, u.s. DEp’t of JustiCE, bullEtin no. nCJ 239808, prisonErs in 2011, at 1 (2012), available at http://bjs.ojp.usdoj.gov/content/pub/pdf/p11.pdf; toDD D. minton, burEAu of JustiCE stAtistiCs, u.s. DEp’t of JustiCE, bullEtin no. nCJ 237961, JAil inmAtEs At miDyEAr 2011, at 1 (2012), available at http://bjs.ojp.usdoj.gov/content/pub/pdf/jim11st.pdf. According to The National Employment Law Project (NELP) there were about 65 million Americans with some sort of criminal record in 2008. miChEllE nAtviDAD roDrEguEz & mAuriCE EmsEllEm, thE nAt’l Emp’t lAW proJECt, 65 million pEoplE ‘nEED not Apply’: thE CAsE for rEforming CriminAl bACkgrounD ChECks for EmploymEnt, at 3 n.2 (2011), available at http://www.nelp.org/page/-/65_Million_Need_Not_Apply.pdf?nocdn=1. NELP estimated that this number accounted for approximately 27.8% of the adult population. Id.
2 In 2011, approximately 47% of state prisoners were incarcerated for non-violent offenses. CArson & sAbol, supra note 1, at 9. Approximately 48% of sentenced federal prisoners were held for drug crimes as of 2011. Id. at 10.
3 As of 2011, approximately 22% of individuals incarcerated in state and federal prisons as well as city and county jails were held without conviction. See CArson & sAbol, supra note 1, at 6 (stating that 96% of all federal and state prisoners were post-conviction in 2011); minton, supra note 1, at 7 (stating that 60.6% of all those in city and county jail were unconvicted as of June 2011). In 2011, approximately 30% of all federal and state prison admissions were for parole violations. See CArson & sAbol, supra note 1, at 11. Parole violations include all conditional release violators returned to prison for either violations of the conditions of release or for new crimes. Id.
4 See generally frAnklin E. zimring, thE City thAt bECAmE sAfE: nEW york’s lEssons for urbAn CrimE AnD its Control (2012).
5 The amount of time served presented in Figure 3 includes the amount of time a person spends in the local jails as part of the pretrial process and awaiting transfer to the state prison. In 2010, the average amount of time served in the local jails prior to be transferred to the state prison system averaged about 7 months.
6 See n.y. DEp’t of Corrs. AnD Cmty. supErvision, 2007 rElEAsEs: thrEE yEAr post rElEAsE folloW-up, at 1 n.2 (2010), available at http://www.doccs.ny.gov/Research/Reports/2012/2007_releases_3yr_out.pdf (stating that prisoners sentenced prior to the Sentencing Reform Act of 1995 received indeterminate sentences while violent offenders sentenced after 1995 received determinate sentences); see also N.Y. pEnAl lAW § 70.02 (McKinney 2012) (codifying part of the Sentencing Reform Act of 1995 and defining categories of felony offenses that require determinate sentences).
7 The Violent Crime Control and Law Enforcement Act became law in 1994. Violent Crime Control and Law Enforcement Act of 1994, Pub. L. No. 103–322, 108 Stat. 1786 (codified as amended in scattered sections of 42 U.S.C.). It also provided for 100,000 new police officers, and $6.1 billion in funding for prevention programs. The bill was originally written by then Senator Joe Biden of Delaware and signed into law by President Bill Clinton.
8 n.y. DEp’t of Corr. sErvs., mErit timE progrAm summAry oCtobEr 1997 – DECEmbEr 2006, at 2 (2007), available at http://www.doccs.ny.gov/Research/Reports/2007/Merit_Time_Through_2006.pdf. Those with serious discipline infractions and those convicted of a violent felony, a homicide or a sex offense are excluded from this program. Id.
9 E-mail from Anthony J. Annucci, Exec. Deputy Comm’r, N.Y. Dep’t of Corrs. and Cmty. Supervision, to James Austin, President, JFA Inst. (Nov. 27, 2012) (on file with authors).
10 See Bert Useem, Right-Sizing Corrections in New York, 12 Just. rEs. & pol’y 89 (2010).
11 The FBI Uniform Crime Reporting Program collects offense information for: murder, nonnegligent manslaughter, forcible rape, robbery, aggravated assault, burglary, larceny-theft, motor vehicle theft, and arson. fED. burEAu of invEstigAtion, uniform CrimE rEporting hAnDbook 8 (2004), available at http://www.fbi.gov/about-us/cjis/ucr/additional-ucr-publications/ucr_handbook.pdf.
12 Several studies examined why the crime rate declined in New York City and elsewhere. The general consensus is that a variety of factors or trends contributed to the decline, including more effective police practices that occurred in New York City and other locations. See John E. Eck & Edward R. Maguire, Have Changes in Policing Reduced Violent Crime? An Assessment of the Evidence, in thE CrimE Drop in AmEriCA 207, 207–65 (Alfred Blumstein & Joel Wallman eds., 2d ed. 2006) (summarizing these studies); see also AnDrEW kArmEn, nEW york murDEr mystEry: thE truE story bEhinD thE CrimE CrAsh of thE 1990s (2000) (providing a succinct summary for various factors and trends contributing to movements in the New York City crime rate).
13 Eck & Maguire, supra note 12, at 207–65.
14 The “broken windows” theory was originally presented in 1982 as an article published by The Atlantic. George L. Kelling & James Q. Wilson, Broken Windows: The Police and Neighborhood Safety, thE AtlAntiC, Mar. 1982, http://www.theatlantic.com/magazine/archive/1982/03/broken-windows/304465/.
15 In 2010, black New Yorkers were seven times more likely than white individuals to be arrested for marijuana possession. Harry G. Levine, The Epidemic of Pot Arrests in New York City, AltErnEt, Aug. 9, 2009, http://www.alternet.org/story/141866/the_epidemic_of_pot_arrests_in_new_york_city. Latino individuals were four times more likely to be arrested than white individuals. Id. In 2008, New York City police arrested 40,300 for small marijuana possession, constituting about 12% of arrests for all crimes. Id. Of these arrests, 87% were black or Latino. Id.
16 Interview with Cyrus R. Vance, Jr., New York Cnty. Dist. Attorney, in N.Y.C., N.Y. (2010).
endnotes
© Vera Institute of Justice, Brennan Center for Justice and JFA Institute 2013. All rights reserved.
Additional copies are available from the Vera Institute of Justice, 233 Broadway, 12th Floor, New York, NY 10279, (212) 334-1300. Brennan Center for Justice, 161 Avenue of the Americas, 12th Floor, New York, NY 10013, (646) 292-8310.
Electronic versions are posted on VERA’s website, wwww.vera.org and the Brennan Center’s website, www.brennancenter.org.
The Vera Institute of Justice is an independent nonprofit organization that combines expertise in research, demonstration projects, and technical assistance to help leaders in government and civil society improve the systems people rely on for justice and safety.
The Brennan Center for Justice at New York University School of Law is a nonpartisan public policy and law institute that improves the systems of democracy and justice.
The JFA Institute is a nonprofit agency whose staff has over 30 years experience assisting jurisdictions around the country to implement more effective criminal justice policies.
ACknowledgements & disClAimer
The authors would like to thank the tremendous assistance and cooperation received from the following people who provided both data and insights for this report:
Terry Salo, New York Division of Criminal Justice Services;Robert Maccarone, New York Department of Criminal Justice Services;Vincent Schiraldi, New York City Probation Department;Anthony J. Annucci, Paul Korotkin, Elizabeth Staley, New York State Department of Corrections and Community Supervision;Marshall Clement, Council of State Government; Eric Sorenson, New York City Department of Correction;Mary Crowley and Melissa Cipollone, Vera Institute of Justice; Michael Waldman, John Kowal, Inimai Chettiar, Jeanine Plant-Chirlin, Desiree Ramos Reiner, Kimberly Lubrano, John Ablan, Gabriel Solis, and Meghna Philip, Brennan Center for Justice at NYU School of Law.
Jim Austin, Michael Jacobson, and the JFA Institute would like to thank the Pew Center on the States Public Safety Performance Project, the Council of State Governments (CSG), Justice Center, and the Public Welfare Foundation for their generous support. The Brennan Center – which provided editing for design and release – gratefully acknowledges the Democracy Alliance Partners, Ford Foundation, The JPB Foundation, Open Society Foundations, Public Welfare Foundation, Vital Projects Fund and William B. Wiener, Jr. Foundation for their generous support. Any views or opinions presented in this report are solely those of the authors and do not necessarily represent those of New York Division of Criminal Justice Services, New York State Department of Corrections and Community Supervision, Pew, CSG, NYU, or the Brennan Center.

James Austin and Michael Jacobson, How New York City Reduced Mass
Incarceration: A Model for Change? New York, NY: Vera Institute of Justice, 2012.
b r e n n a n c e n t e rf o r j u s t i c eat New York University School of Law
161 Avenue of the Americas12th FloorNew York, NY 10013646-292-8310www.brennancenter.org
Washington, DC Office5 Walter Houp Court, NEWashington, DC 20002
California Office2540 Cayman RoadMalibu, CA 90265310-867-0569www.jfa-associates.com
Vera Institute of Justice233 Broadway, 12th FloorNew York, NY 10279Tel: (212) 334-1300Fax: (212) 941-9407
Washington DC Office1100 First St. NE, Suite 950Washington, DC 20002Tel: (202) 465-8900Fax: (202) 408-1972
New Orleans Office546 Carondelet St.New Orleans, LA 70130Tel: (504) 593-0937Fax: (212) 941-9407
Los Angeles Office707 Wilshire Blvd., Suite 3850 Los Angeles, CA 90017Tel: (213) 223-2442Fax: (213) 955-9250