How Much Do ETFs Influence Stocks? - LPAC Online
8
TRADING STRATEGY (212 ( Victor Lin + 1 212 325 5281 [email protected] Tradin Trading Strategy How Much do ETFs Influence Stocks? Market Commentary 20 March 2012 ETFs in Media Cross-hairs Despite the lack of statistical evidence, ETFs have been blamed for exacerbating market volatility, high equity correlations, and maliciously influencing single stocks. To start off 2012, both volatility and correlation have fallen significantly and now ETFs are being blamed for low volumes. In an earlier report addressing the topic of higher correlations (see ETFs and Correlation: The Chicken or the Egg? ), we noted that ETF assets (just over $1 trillion) were a mere fraction of the total stock market. Furthermore, only about 40% of ETF assets actually track U.S. equities. The remainder tracks foreign equities, bonds, or commodities. Exhibit 1: U.S. Equity and Value Traded Breakdowns $0 $2,000 $4,000 $6,000 $8,000 $10,000 $12,000 $14,000 $16,000 $18,000 $20,000 Jan-06 Jun-06 Nov-06 Apr-07 Sep-07 Feb-08 Jul-08 Dec-08 May-09 Oct-09 Mar-10 Aug-10 Jan-11 Jun-11 Nov-11 Assets ($billions) Breakdown of US Equity Assets Key Points Despite the lack of statistical evidence, ETFs have been blamed in various media reports for exacerbating market volatility, high equity correlations, and influencing single stock returns. In this report, we attempt to provide analysis that would seem to show that ETFs don’t influence trading in single stocks as much as one might be led to believe. Our consultations and analysis of ETF flows and intraday trading have led us to believe that perhaps on average 15% of ETF trading actually results in trading in the underlying. We contend that the growth of ETFs has coincided with a shift to a more macro- oriented and uncertain economic environment than the market has experienced in recent memory. ETFs Passive Mutual Funds Active Mutual Funds Rest of US equities market cap 0% 10% 20% 30% 40% 50% 60% 70% 80% 90% 100% Mar.2000 Sep.2000 Mar.2001 Sep.2001 Mar.2002 Sep.2002 Mar.2003 Sep.2003 Mar.2004 Sep.2004 Mar.2005 Sep.2005 Mar.2006 Sep.2006 Mar.2007 Sep.2007 Mar.2008 Sep.2008 Mar.2009 Sep.2009 Mar.2010 Sep.2010 Mar.2011 Sep.2011 All stocks Stocks ~ 43% Futures ~ 42% ETPs ~15% Exhibit 2: ETF $Value Traded Remains High Even as Correlation Has Fallen 0% 5% 10% 15% 20% 25% 30% 35% 40% 45% 0% 10% 20% 30% 40% 50% 60% 70% 80% 90% Jan‐00 Jan‐01 Jan‐02 Jan‐03 Jan‐04 Jan‐05 Jan‐06 Jan‐07 Jan‐08 Jan‐09 Jan‐10 Jan‐11 Jan‐12 ETF % of all $Value Traded Correlation ETF Usage vs Realized Correlation ETF % of all $Value Traded 1M Realized Correlation Future ETFs Source: Credit Suisse: Trading Strategy, Bloomberg From a trading perspective, ETF dollar volume is still small in comparison to futures, which trades as much as the cash market does on a daily basis, and are also an index-linked product. Perhaps most indicative, ETF value traded has remained relatively high even as correlation has plummeted recently. In spite of these statistics, the media still claims ETFs are exhibiting some malevolent influence on the markets – often based on anecdotal evidence. In our report, we attempt to quantify this impact. Source: Credit Suisse Trading Strategy
Transcript of How Much Do ETFs Influence Stocks? - LPAC Online

TRADING STRATEGY
(212 (
Victor Lin
+ 1 212 325 5281 [email protected]
TradinTrading Strategy How Much do ETFs Influence Stocks?
Market Commentary 20 March 2012
ETFs in Media Cross-hairs Despite the lack of statistical evidence, ETFs have been blamed for exacerbating market volatility, high equity correlations, and maliciously influencing single stocks. To start off 2012, both volatility and correlation have fallen significantly and now ETFs are being blamed for low volumes.
In an earlier report addressing the topic of higher correlations (see ETFs and Correlation: The Chicken or the Egg?), we noted that ETF assets (just over $1 trillion) were a mere fraction of the total stock market. Furthermore, only about 40% of ETF assets actually track U.S. equities. The remainder tracks foreign equities, bonds, or commodities.
Exhibit 1: U.S. Equity and Value Traded Breakdowns
$0
$2,000
$4,000
$6,000
$8,000
$10,000
$12,000
$14,000
$16,000
$18,000
$20,000
Jan-
06
Jun-
06
Nov-
06
Apr-0
7
Sep-
07
Feb-
08
Jul-0
8
Dec-
08
May
-09
Oct-0
9
Mar
-10
Aug-
10
Jan-
11
Jun-
11
Nov-
11
Asse
ts ($
billio
ns)
Breakdown of US Equity Assets
Key Points Despite the lack of statistical evidence, ETFs
have been blamed in various media reports for exacerbating market volatility, high equity correlations, and influencing single stock returns.
In this report, we attempt to provide analysis that would seem to show that ETFs don’t influence trading in single stocks as much as one might be led to believe.
Our consultations and analysis of ETF flows and intraday trading have led us to believe that perhaps on average 15% of ETF trading actually results in trading in the underlying.
We contend that the growth of ETFs has coincided with a shift to a more macro-oriented and uncertain economic environment than the market has experienced in recent memory.
ETFs Passive Mutual Funds
Active Mutual Funds Rest of US equities market cap
0%10%20%30%40%50%60%70%80%90%
100%
Mar.
2000
Sep.2
000
Mar.
2001
Sep.2
001
Mar.
2002
Sep.2
002
Mar.
2003
Sep.2
003
Mar.
2004
Sep.2
004
Mar.
2005
Sep.2
005
Mar.
2006
Sep.2
006
Mar.
2007
Sep.2
007
Mar.
2008
Sep.2
008
Mar.
2009
Sep.2
009
Mar.
2010
Sep.2
010
Mar.
2011
Sep.2
011
All stocks
Stocks ~ 43%
Futures ~ 42%
ETPs ~15%Exhibit 2: ETF $Value Traded Remains High Even as Correlation Has Fallen
0%
5%
10%
15%
20%
25%
30%
35%
40%
45%
0%
10%
20%
30%
40%
50%
60%
70%
80%
90%
Jan‐00
Jan‐01
Jan‐02
Jan‐03
Jan‐04
Jan‐05
Jan‐06
Jan‐07
Jan‐08
Jan‐09
Jan‐10
Jan‐11
Jan‐12
ETF % of all $V
alue
Trade
d
Correlation
ETF Usage vs Realized Correlation
ETF % of all $Value Traded
1M Realized Correlation
Future ETFs
Source: Credit Suisse: Trading Strategy, Bloomberg
From a trading perspective, ETF dollar volume is still small in comparison to futures, which trades as much as the cash market does on a daily basis, and are also an index-linked product. Perhaps most indicative, ETF value traded has remained relatively high even as correlation has plummeted recently. In spite of these statistics, the media still claims ETFs are exhibiting some malevolent influence on the markets – often based on anecdotal evidence. In our report, we attempt to quantify this impact.
Source: Credit Suisse Trading Strategy

TRADING STRATEGY
Do ETFs cause trading in the underlying? There’s a misconception that every ETF trade (or a very high percentage of trades) results in an equivalent wave of the underlying stocks being traded as well. While ETF trades can result in trading of the underlying due to a market maker’s need to hedge or when arbitragable discounts/premiums to NAV appear, often this is not the case as:
• ETFs can be sourced from existing inventory or on the open market.
• Hedges for an ETF may be constructed using futures, options, optimized stock baskets, other ETFs, or a combination
Our consultations and analysis below have led us to believe that perhaps on average 15% of ETF trading actually results in trading in the underlying. Below we list several reasons why trading in the underlying may be less than one might think.
Exhibit 3: Creations/Redemptions relatively small
$‐
$5
$10
$15
$20
$25
$30
$35
0%
10%
20%
30%
40%
50%
60%
70%
80%
Billion
sCreations/redemptions relatively small One area where the underlying must be traded is the process of creations/redemptions. However, this activity is typically small in relation to capacity. In looking at the popular IWM (a good example since it is one of the largest ETFs and consists of small cap stocks, which are comparatively less liquid), net creation/redemption activity averages only 3% of underlying dollar volume and didn’t noticeably increase even as correlation spiked upward last year. While this is a net number and the gross number would represent a higher percentage, the gross activity is not likely to be several magnitudes larger.
Underlying $ Volume (Right axis)
Ratio of Net Create/Redeems to Underlying $ Volume (Left axis)
Russell 2000 1M Correlation
Arb trading less than what might be expected 21 per. Mov. Avg. (Ratio of ETF to Underlying $ Volume (Left axis))
Another reason someone may trade the underlying and the ETF simultaneously is to profit from discrepancies between the ETF and its NAV using the creation/redemption process. Note that in practice the ETF needs to be rich versus the ask or cheap versus the bid of the NAV. When the ETF trades higher (lower) than the ask (bid), an arbitrageur could simultaneously buy (sell) the underlying stocks and create to sell (buy to redeem) the ETF to lock in a profit.
Source: Credit Suisse Trading Strategy
Our intraday study (1-minute increments) of various ETFs found that they traded so efficiently that they were rarely at levels that would entice an arbitrageur to create/redeem and trade the underlying stocks. The exhibit below shows IWM trading within the NAV spread over the course of a day (see Appendix for more examples).
Exhibit 4: ETF Trading Happens Within NAV Spread
Arbitrageur
Bid Offer
Arbitrageur
Unfavorable Fair ValueUnfavorableUnfavorable Fair ValueFair Value UnfavorableUnfavorable
NAV-IV
Stock Spread
25.13 25.16Bids here will
create profit for
an arbitrager!!
ETF Spread
Naturals will
trade inside the
spread
ETF SpreadETF SpreadETF Spread
Naturals will
trade inside the
spread
Company SharesCompany
SharesCompany SharesCompany
SharesCompany SharesCompany
SharesCompany SharesCompany
Shares
BidBid
BidBid
BidBid
BidBid
Bid
OfferOffer
OfferOffer
OfferOffer
OfferOffer
Offer
LastLast
LastLast
LastLast
LastLastLast
Company SharesCompany
SharesCompany SharesCompany
SharesCompany SharesCompany
SharesCompany SharesCompany
Shares
Company SharesCompany
SharesCompany SharesCompany
SharesCompany SharesCompany
SharesCompany SharesCompany
Shares
BidBid
BidBid
BidBid
BidBid
Bid
BidBid
BidBid
BidBid
BidBid
Bid
OfferOffer
OfferOffer
OfferOffer
OfferOffer
Offer
OfferOffer
OfferOffer
OfferOffer
OfferOffer
Offer
LastLast
LastLast
LastLast
LastLastLast
Exhibit 5: ETF Trading vs NAV Bid/Ask for IWM
ETF rich: buy stocks, create & sell ETF
ETF cheap: sell stocks, buy ETF & redeem
Source: Credit Suisse Trading Strategy
Traded prices
Source: Credit Suisse: Trading Strategy, Bloomberg, February 6, 2012
2
TRADING STRATEGY
Suggests more naturals inside the spread The relative lack of arbitrage opportunities suggests that there are more natural buyers and sellers trading inside the spread that don’t ever need to trade the underlying basket of stocks. In addition to strategic buyers/sellers, statistical arbitrage is tremendously popular as traders exploit statistical relationships between ETFs (and futures, stocks, etc). In fact, this is likely the reason that ETF spreads are as tight as they are ( as we covered in a previous report, Covering the Spread) even for international ETFs whose underlying are not trading during all U.S. hours.
End of Day Impact Overstated There is also a strong belief that ETFs affect stocks even more at the end of the trading day. However, this seems counter to what we observe in the microstructure of the market. Compared to regular stocks, ETFs actually tend to trade more at the open and less at the end of the trading day. There’s a couple factors that contribute to this:
Exhibit 6: Volume curves for Stocks and ETFs
Source: Credit Suisse Trading Strategy
• As macro oriented tools, ETFs are often traded closer to the open in response to overnight and morning economic news. Additionally, as popular hedging tools investors may need to readjust positions depending on their views for the day.
• Another factor that contributes to less end of day trading is simple logistics. As the trading day comes to an end, ETF market markets have less time to hedge and/or arbitrage ETF positions. Moreover, there’s no way to accurately predict MOC quantities and prices. As a result, ETF market makers actually tend to widen spreads and be more risk adverse towards the market close.
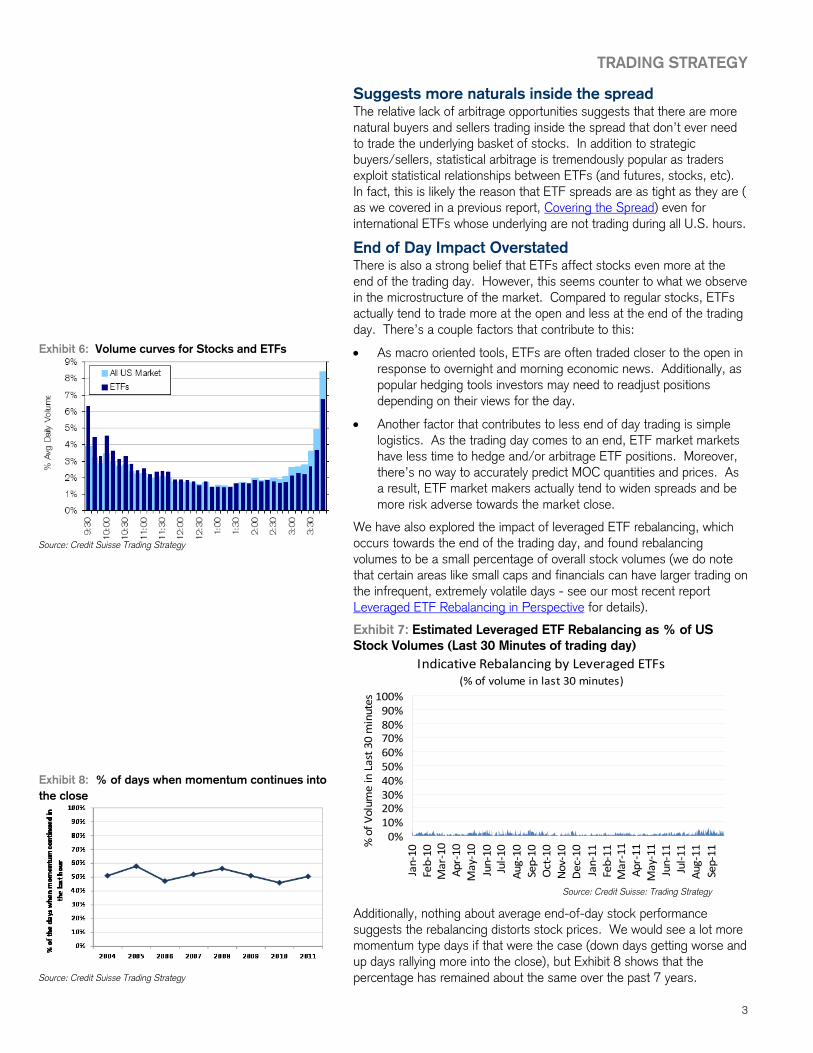
We have also explored the impact of leveraged ETF rebalancing, which occurs towards the end of the trading day, and found rebalancing volumes to be a small percentage of overall stock volumes (we do note that certain areas like small caps and financials can have larger trading on the infrequent, extremely volatile days - see our most recent report Leveraged ETF Rebalancing in Perspective for details).
Exhibit 7: Estimated Leveraged ETF Rebalancing as % of US Stock Volumes (Last 30 Minutes of trading day)
Indicative Rebalancing by Leveraged ETFs(% of volume in last 30 minutes)
0%10%20%30%40%50%60%70%80%90%100%
Jan‐10
Feb‐10
Mar‐10
Apr‐10
May‐10
Jun‐10
Jul‐10
Aug‐10
Sep‐10
Oct‐10
Nov‐10
Dec‐10
Jan‐11
Feb‐11
Mar‐11
Apr‐11
May‐11
Jun‐11
Jul‐11
Aug‐11
Sep‐11
% of V
olum
e in Last 30 minutes
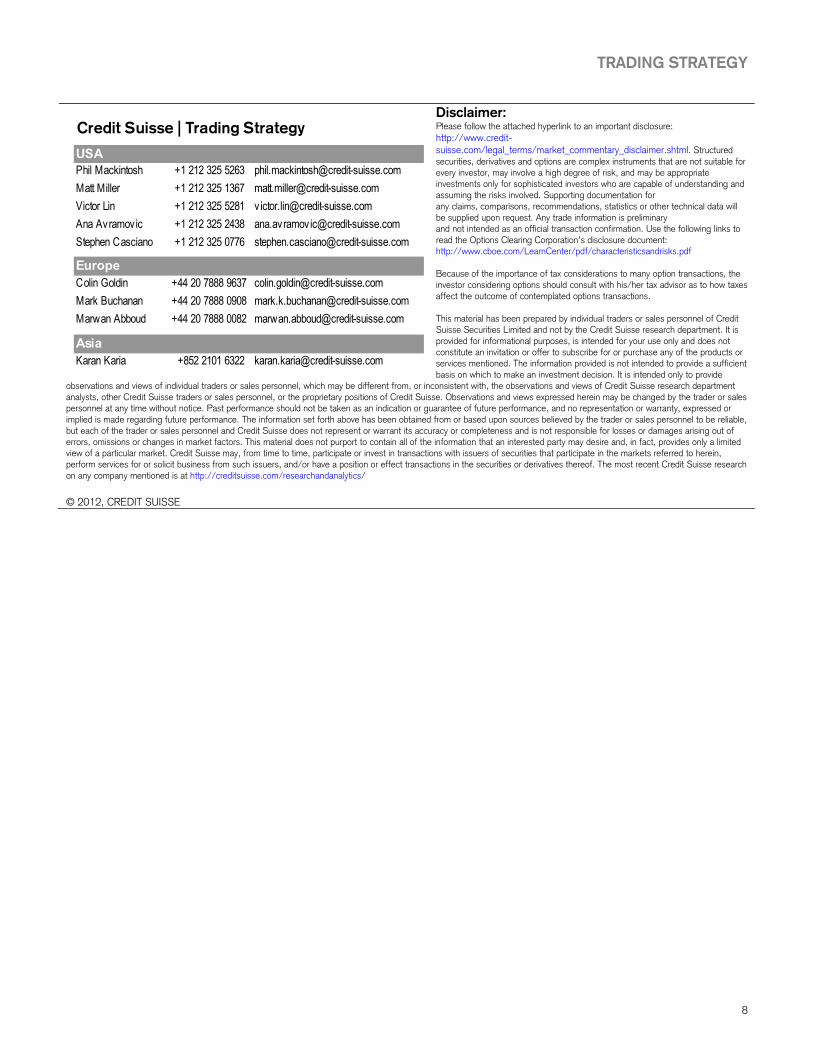
Exhibit 8: % of days when momentum continues into the close
Source: Credit Suisse Trading Strategy
Source: Credit Suisse: Trading Strategy
Additionally, nothing about average end-of-day stock performance suggests the rebalancing distorts stock prices. We would see a lot more momentum type days if that were the case (down days getting worse and up days rallying more into the close), but Exhibit 8 shows that the percentage has remained about the same over the past 7 years.
3

TRADING STRATEGY
ETF trading and alpha opportunities Exhibit 9: ETF trading vs Stock Dispersion (R2000) – Size and color of circles correspond to index return Potential alpha not lower because of ETF trading
One of the prevailing thoughts is that when ETFs are traded more frequently, this causes higher correlations and makes it more difficult for active managers to outperform. While correlation is an important factor, stock dispersion is perhaps a better overall indicator of the actual alpha potential available to managers as it measures how far apart stock returns are. Note that stock return dispersion is proportional to volatility and inversely proportional to correlation.
4
In Exhibit 9 we again highlight IWM, plotting daily cross sectional stock dispersion in the Russell 2000 against relative trading in IWM for 2011. We find that dispersion levels are high even when the ETF is highly traded; similarly, dispersion is low when the ETF is more lightly traded. Therefore, it doesn’t appear that more ETF trading is associated with any loss of alpha potential.
Looking further back in history, small cap stock dispersion doesn’t appear to be strongly related to ETF trading and has been relatively flat since the financial crisis in ’08-’09. Moreover, stock dispersion was in decline from 2003-2007 even as ETF trading started to grow exponentially.
Exhibit 10: Cross Sectional Stock Dispersion History (Russell 2000)
$0 ‐
10 $50
$100
$150
$200
$250
$300
20
30
40
50
60
70
80
ETF Va
lue Trad
ed
Billion
s
k Re
turn Dispe
rsion (1M)
Stoc
$ Value Traded Stock Dispersion
Source: Credit Suisse: Trading Strategy, Bloomberg
Therefore, in terms of average small cap alpha opportunity, 2011 was not particularly different than most years in the past (see Exhibits 10 and 11) with the exception of bear markets (2000-2002, 2008-2009). Ironically, those bear market years offered the greatest alpha potential at times when investors were most likely to reduce risk. In looking at the past 20 years, we observe that:
• Statistically, cross sectional stock dispersion in small caps wasn’t that much different in prior decades.
• Bear markets tend to shock markets into elevated correlation regimes, suggesting that macro fears don’t subside quickly.
• While volatility has come down from ’08-’09 crisis levels, 2011 ranks third highest in average realized 1M volatility – even higher than in 2000. This suggests a a significant amount of investor uncertainty and risk stemming from the crisis have yet to go away.
0.15 0.20 0.25 0.30 0.35 0.40 0.45 0.50 0.55 0.60 0.65Dollar Volume Ratio ETF:Underlying
0.01
0.02
0.03
0.04
0.05
0.06
-0.0871 0.0666Index Retu..
Source: Credit Suisse Trading Strategy, Bloomberg
Exhibit 11: Cross Sectional Stock Dispersion (R2000)
0.05 0.10 0.15 0.20 0.25 0.30 0.35 0.40 0.45Correlation
0.00
0.05
0.10
0.15
0.20
0.25
0.30
0.35
0.40
0.45
0.50
2012
2011
High Dispersion
Low Dispersion
2010
2008
2009
2000
1995
2002
Bear markets
Source: Credit Suisse Trading Strategy

TRADING STRATEGY
• So far in 2012, both volatility and correlation have declined close to levels in ’03-’07, when there were similar claims of the death of alpha. Back then, ETFs weren’t large enough to be a factor.
Risk adjusted alpha on the decline So if stock dispersion is relatively similar to the past, what about the higher volatility/correlation regime has made it difficult for fund managers to find alpha? As the market has become more volatile (relative to history), most measures of risk like tracking error and portfolio volatility increase as well. It’s very possible that managers have limited their alpha opportunities by having limited or even reduced their notional exposure to maintain risk limits.
Exhibit 12: Risk Adjusted Return (Top and Bottom Decile, Volatilty normalized at 20%)
Exhibit 12 effectively shows how returns over the years changed if a manager with perfect prediction of top and bottom decile stocks in the S&P 500 kept a constant level of risk (20% portfolio volatility). Since the average volatility of stocks has risen over time, the manager’s expected returns have shrunk.
Similarly, Exhibit 13 shows alpha (again measured by the return differential between the top decile and bottom decile of stocks) normalized by index volatility of the Russell 2000. We can see that the amount of alpha per unit of risk has been on the decline since the ‘90s – well before ETFs took off in popularity. Furthermore, the risk-adjusted alpha has remained fairly constant the past 5 years even as ETF trading has grown exponentially.
Exhibit 13: Risk adjusted return in R2000 (Top and Bottom Decile)
0
50
100
150
200
250
‐ 2 4 6 8
10 12 14 16 18
Avg 1M
Return Differen
tial b
/w to
p an
d bo
ttom
decile
Avg 1M
Return Differen
tial b
/w to
p an
d bo
ttom
decile
(normalized
by
inde
x volatility
)
Exhibit 14: Small cap ETF inflows vs small cap outperformance
1Y Mov Avg (Risk Adj Alpha) 1Y Mov Avg (Alpha)
$(3)
$(2)
$(1)
$‐
$1
‐4%
‐3%
‐2%
‐1%
0%
$2
$3
$4
$5
1%
2%
3%
4% Source: Credit Suisse: Trading Strategy, Bloomberg
5
ETF trading and active managers underperformance During the recent market rally, there were reports that speculated ETF trading caused small cap active managers to underperform their benchmark. Logically, ETF inflows and hedging from trading would have to affect stocks that active managers did not own differently than stocks they were more likely to own for this to happen. Sm
all Cap
ETF Flows
Wee
kly
Billion
s
Return
First, we looked at small cap ETF inflows and found little correlation (40%) between weekly ETF inflows and small cap outperformance versus the S&P 500. This alone would seem to suggest that it wasn’t ETF inflows that were causing smaller caps to outgain larger caps.
Small Cap Weekly FlowsSecond, we compared the average beta of the small cap stocks with the highest and lowest percentages (by % of market cap) of ETF ownership. The 200 small cap companies with the highest percentage of ETF
Russell 2000 Weekly Outperformance vs S&P 500
Source: Credit Suisse Trading Strategy, Bloomberg

TRADING STRATEGY
ownership had a beta of 1.54 versus the S&P 500 (using daily returns over the past 6 months). The 200 companies with the lowest percentage ownership had a beta of 1.5. If ETF flows really did move the underlying, we would expect to see a more significant difference between these two sets of stocks (especially in a trending market). This minimal difference would seem to suggest that ETF ownership does not significantly influence stock returns.
Exhibit 15: Beta of R2 stocks with highest and lowest ETF ownership
1
1.1
1.2
1.3
1.4
1.5
R2 Highest ETF ownership R2 Lowest ETF ownersh
1.6
1.7
p
Beta (daily, last 6 months vs S&P 500)
Correlation is a Measure of Macro Risk If not ETFs, then why are correlation levels so high compared to the past? To that point we look towards a policy uncertainty index developed by Baker, Bloom and Davis built on aspects of economic policy uncertainty including:
• Frequency of references to economic uncertainty and policy in the Google news media catalog (normalized for growth of the internet)
i• Number of federal tax code provisions set to expire in future years
Source: Credit Suisse Trading Strategy • The extent of disagreement among ecnomic forecasters over future
federal government purchases and the future CPI price level
As Exhibit 16 shows, this macro risk index is a much better fit with equity correlations than the growth of ETF assets. Consequently, beta oriented tools such as ETFs and futures have been a better fit for the current investment environment.
Exhibit 16: Political Uncertainty Index and S&P 500 Correlation
Source: Measuring Economic Policy Uncertainty (Baker, Bloom, Davis), www.policyuncertainty.com,
Credit Suisse Trading Strategy
6

TRADING STRATEGY
Appendix Intraday ETF Trades vs NAV Spread for Popular ETFs
SPY trades seem to fluctuate more between the NAV bid and ask than our previous IWM example. However, this is largely due to the fact that the NAV spread is much smaller – which is logical since these are generally more liquid, large cap stocks.
7
At first glance, there appears to be more arbitrage opportunities in XLE. However, note how miniscule the NAV’s bid-ask spread is (generally only a penny or two wide) and the fact that the ETF itself usually trades a penny wide as well. The trades that occur outside the NAV spread are typically less than half a cent beyond the bid or ask.
Another example of a small cap ETF trading well within the NAV spread. The fact that it trades so tightly within the NAV bid and ask even though the average small cap spread is relatively high demonstrates how efficient ETFs can be.
Data Sourced From: Credit Suisse: Trading Strategy, Bloomberg, February 6, 2012
TRADING STRATEGY
8
Disclaimer: Please follow the attached hyperlink to an important disclosure: http://www.credit-suisse.com/legal_terms/market_commentary_disclaimer.shtml. Structured securities, derivatives and options are complex instruments that are not suitable for every investor, may involve a high degree of risk, and may be appropriate investments only for sophisticated investors who are capable of understanding and assuming the risks involved. Supporting documentation for any claims, comparisons, recommendations, statistics or other technical data will be supplied upon request. Any trade information is preliminarand not intended as an official transaction confirmation. Use the following links to read the Options Clearing Corporation’s disclosure document: http://www.cboe.com/LearnCenter/pdf/characteristicsandrisks.pdf
y
Because of the importance of tax considerations to many option transactions, the investor considering options should consult with his/her tax advisor as to how taxes affect the outcome of contemplated options transactions. This material has been prepared by individual traders or sales personnel of Credit Suisse Securities Limited and not by the Credit Suisse research department. It is provided for informational purposes, is intended for your use only and does not constitute an invitation or offer to subscribe for or purchase any of the products or services mentioned. The information provided is not intended to provide a sufficient basis on which to make an investment decision. It is intended only to provide
observations and views of individual traders or sales personnel, which may be different from, or inconsistent with, the observations and views of Credit Suisse research department analysts, other Credit Suisse traders or sales personnel, or the proprietary positions of Credit Suisse. Observations and views expressed herein may be changed by the trader or sales personnel at any time without notice. Past performance should not be taken as an indication or guarantee of future performance, and no representation or warranty, expressed or implied is made regarding future performance. The information set forth above has been obtained from or based upon sources believed by the trader or sales personnel to be reliable, but each of the trader or sales personnel and Credit Suisse does not represent or warrant its accuracy or completeness and is not responsible for losses or damages arising out of errors, omissions or changes in market factors. This material does not purport to contain all of the information that an interested party may desire and, in fact, provides only a limited view of a particular market. Credit Suisse may, from time to time, participate or invest in transactions with issuers of securities that participate in the markets referred to herein, perform services for or solicit business from such issuers, and/or have a position or effect transactions in the securities or derivatives thereof. The most recent Credit Suisse research on any company mentioned is at http://creditsuisse.com/researchandanalytics/ © 2012, CREDIT SUISSE
USAPhil Mackintosh +1 212 325 5263 phil.mackintosh@crediMatt Miller +1 212 325 1367 matt.miller@credit-suisVictor Lin +1 212 325 5281 victor.lin@credit-suisseAna Avramovic +1 212 325 2438 ana.avramovic@creditStephen Casciano +1 212 325 0776 stephen.casciano@cre
EuropeColin Goldin +44 20 7888 9637 colin.goldin@Mark Buchanan +44 20 7888 0908 mark.k.buchaMarwan Abboud +44 20 7888 0082 marwan.abb
AsiaKaran Karia +852 2101 6322 [email protected]
Credit Suisse | Trading Strategy
t-suisse.comse.com.com-suisse.comdit-suisse.com