How much cancer can we cure with the immune...
31
IMMUNOTHERAPY: TRANSFORMATION OF THERAPIES FOR BLOOD CANCER How much cancer can we cure with the immune system? Drew M. Pardoll, MD, PhD Abeloff Professor of Oncology, Medicine, Pathology and Molecular Biology and Genetics Co-Director, Cancer Immunology and Hematopoiesis Program The Sidney Kimmel Comprehensive Cancer Center Johns Hopkins University School of Medicine Baltimore, MD
Transcript of How much cancer can we cure with the immune...

IMMUNOTHERAPY: TRANSFORMATION OF THERAPIES FOR BLOOD CANCER
How much cancer can we cure with the immune system?
Drew M. Pardoll, MD, PhDAbeloff Professor of Oncology, Medicine, Pathology and Molecular Biology and Genetics Co-Director, Cancer Immunology and Hematopoiesis Program The Sidney Kimmel Comprehensive Cancer Center Johns Hopkins University School of Medicine Baltimore, MD
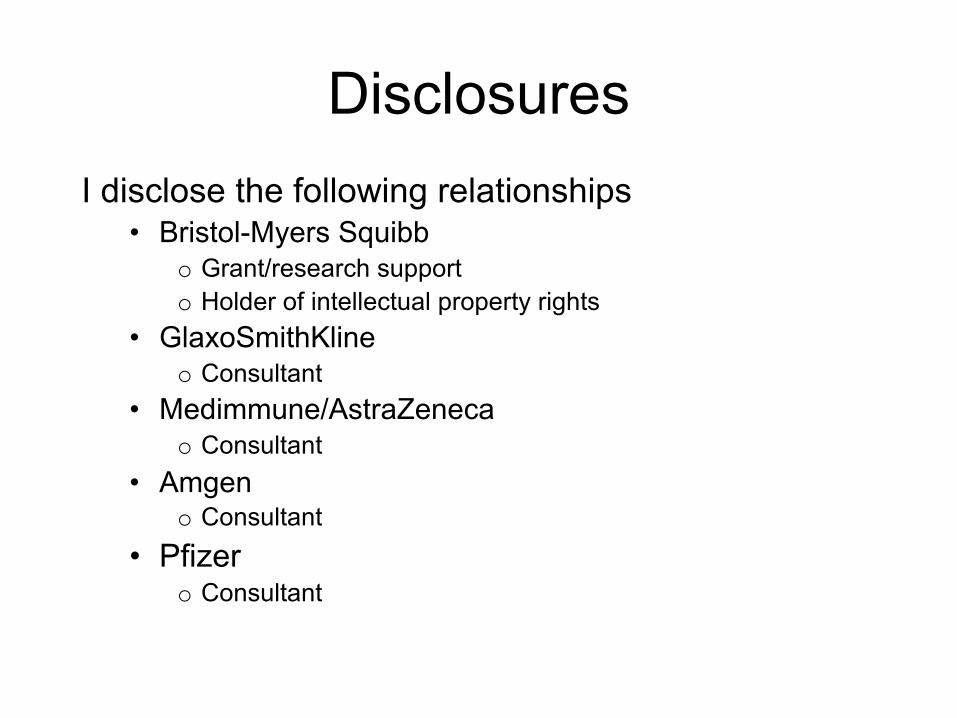
DisclosuresI disclose the following relationships
• Bristol-Myers Squibb o Grant/research supporto Holder of intellectual property rights
• GlaxoSmithKline o Consultant
• Medimmune/AstraZenecao Consultant
• Amgeno Consultant
• Pfizero Consultant

The PerfectAnticancerAgent
DiversityT cells - 1018
Antibodies - 1022
SpecificityCan distinguish asingle methyl group
WeaponryNO, superoxides,HOCl, H2O2,FasL, TRAIL, Perforin,Granzyme B,Myeloperoxidase,Complement,Phagocytes

“Ten years fromtoday, >50% of patients with inoperable cancer will be receiving immunotherapy”-Drew Pardoll January, 2014
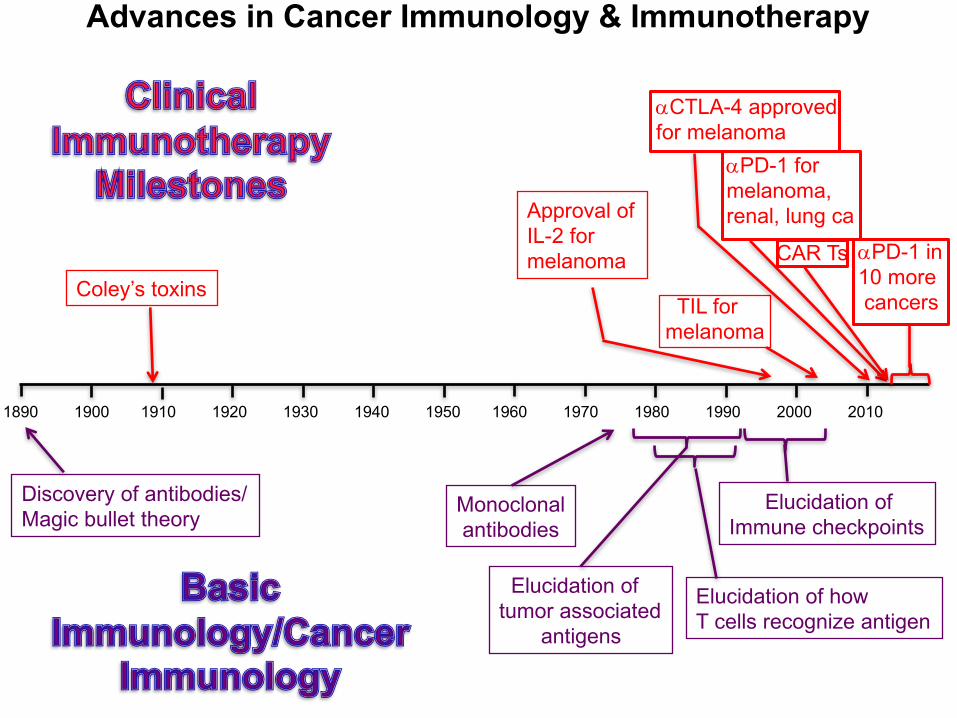
1890 1900 1910 1920 1930 1940 1950 1960 1970 1980 1990 2000 2010
Discovery of antibodies/Magic bullet theory
Monoclonalantibodies
Elucidation oftumor associated
antigens
Elucidation ofImmune checkpoints
Elucidation of howT cells recognize antigen
Coley’s toxins
Approval of IL-2 for melanoma
TIL formelanoma
aCTLA-4 approvedfor melanoma
aPD-1 formelanoma,renal, lung ca
aPD-1 in10 morecancers
CAR Ts
Advances in Cancer Immunology & Immunotherapy

ImmuneResponse
The amplitude of immune responses is determined by a balance of positive signals (antigen+costimulation)
and negative forces (immune checkpoints)
IMMUNE CHECKPOINTS = BRAKESCTLA-4 Treg PD-1 LAG3 … (>25)
Vaccines
IMMUNIZATION = ACCELERATORSignal 1 – Antigen Signal 2 – Costimulation (CD28 …)
Checkpointblockade

Pardoll 2012
Ant
igen
pre
sent
ing
cell
or tu
mor
cel
l
T cell
Targeting immune
regulatory pathways in
cancer therapy
Inhibition of immune
checkpoints, or stimulation of
immune enhancers, with monoclonal
antibodies or small molecules
Activation(cytokines, lysis, prolif.,
migration)
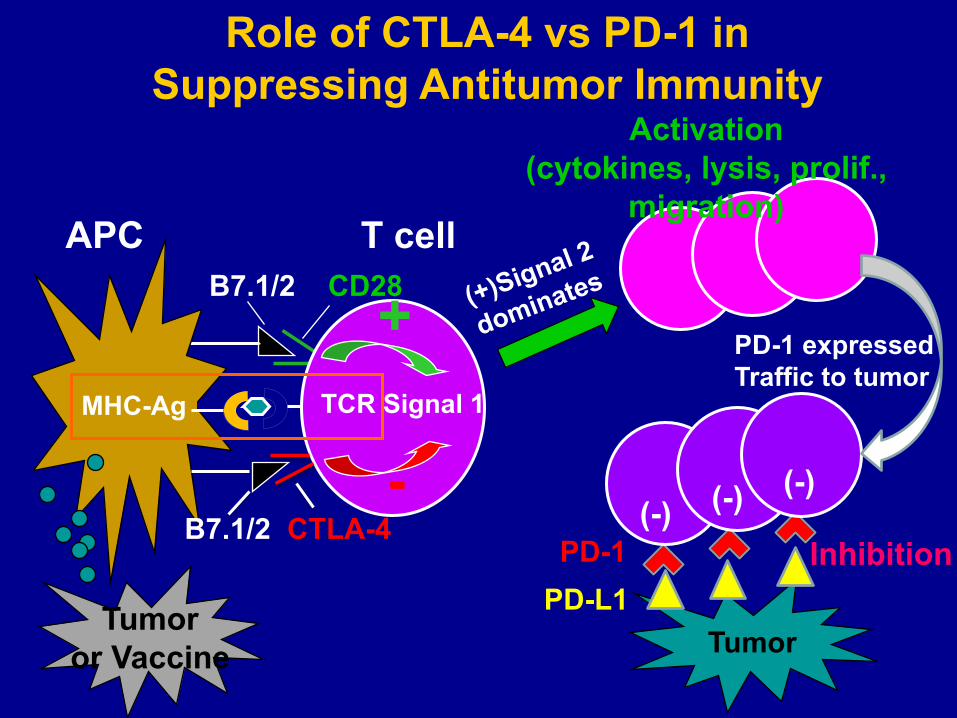
Role of CTLA-4 vs PD-1 in Suppressing Antitumor Immunity
TumorPD-L1PD-1
(-)(-) (-)
Inhibition
PD-1 expressedTraffic to tumor
APC T cellB7.1/2 CD28
TCR Signal 1MHC-Ag
Tumoror Vaccine
B7.1/2 CTLA-4
+
-
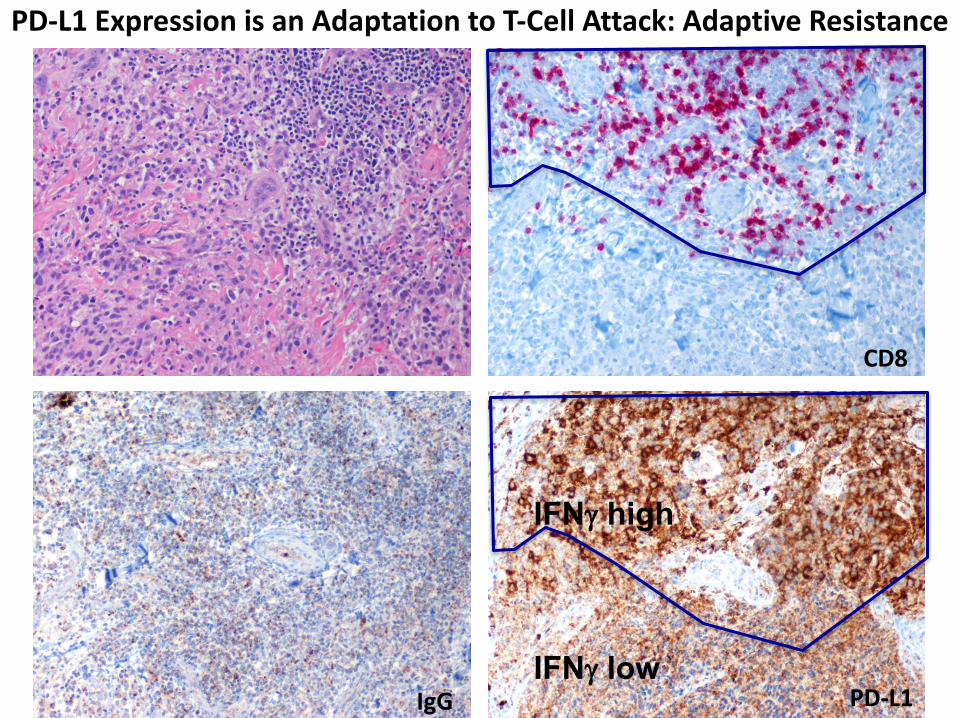
CD8
IgG PD-L1
PD-L1ExpressionisanAdaptationtoT-CellAttack:AdaptiveResistance
IFNg high
IFNg low

Long-term Survival of Patients With Melanoma Receiving Immune
Checkpoint-Blocking Drugs
0 1 2 3 4 5 6 7 8 9 10
100
90
80
70
60
0
50
40
30
20
10Ove
rall
Surv
ival
(%)
Years
IPI (Pooled analysis – mixture of 1st & 2nd line)NIVO Monotherapy (Second-Fourth line)NIVO Monotherapy (First line)
At 5 yr,50% willhave died

Duration of Response and Overall SurvivalLung Cancer
NSCLC Respondersa,b by Histology
Time (Week)0 8 16 24 32 40 48 56 64 72 80 88 96 104 112 120 128 136 144 152 160
Vertical line at 96 weeks = maximum duration of continuous nivolumab therapy
a Responses were assessed by modified RECIST v1.0bAll efficacy analyses based on data collected as of September 2013
Squa
mou
sN
on-s
quam
ous
Duration of response up to discontinuation of therapyOngoing responseTime to responseResponse duration following discontinuation of therapy
0 3 6 9 12 15 18 21 24 27 30 33 36 39 42 45 48 51 54 57
0.0
0.1
0.2
0.3
0.4
0.5
0.6
0.7
0.8
0.9
1.0
Months Since Initiation of Treatment
129 111 82 66 48 35 31 28 20 9 4 3 3 3 2 1 1 1 0 0
Subjects at RiskTotal
All Treated Subjects with NSCLC
Died/Treated Median (95% CI)94/129 9.90 (7.80,12.40)
Prop
ortio
n Su
rviv
al Median OS: 9.9 Months (7.8, 12.4)
1 year OS Rate 42% (48 pts at risk)
2 year OS Rate 24% (20 pts at risk)
At 4 yr,85% willhave died

EGFR, Stat3Raf/MEK
TumorDendritic
Cell
Treg
Tumor-specific
CTL
MF/MDSC
PD-L1
PD-L1
Tumor Antigens
The Hostile Immune Microenvironment of the Tumor Is All Druggable
IL10,TGFb
IL-35Neuritin
IDOArginaseiNOS
PD-1LAG-3Tim3TIGIT
T helperCell
Foxp3
Tbet
HLANeuropilinCTLA4TIGIT
GITR
“Help” topromote CTL
Adenosine
A2aR
Nivolum
ab*Solid*Tumors***************
***
(Topalian)et)al.)NEJM)2012)
Nivolum
ab*Melanoma*******************))
(Weber)ASCO)2013)
Nivolum
ab*Melanoma*****************))
(Grosso)et)al.)ASCO)2013)
MPDL3280a*Solid*Tumors))))))))))))))))))))))))
(Herbst)et)al)ASCO)2013)
MPDL3280a*M
elanoma*******************
(Hamid)et)al)ASCO)2013)
MPDL3280a*NSCLC***************************)
(Sorial)et)al)ECC)2013)
Pembrolizumab*M
elanoma**)))))))))))))))
(Daud)et)al)AACR)2014)
Pembrolizumab*NSCLC************))))))))
(Gandhi)et)al)AACR)2014)
MPDL3280a*Bladder****)))))))))))))))))))))))
(Powels)et)al)ASCO)2014)
Pembrolizumab*Head*&
*Neck*
(Selwert)et)al)ASCO)2014)
Pembrolizumab*M
elanoma*****)
(Ribas)et)al)ASCO)2014)
n=) 42 44 34 94 30 53 113 129 65 55 411
Response*Rates
Unselected 21% 32% 29% 22% 23% 23% 40% 19% 26% 18% 40%
PDQL1)+ 36% 67% 44% 39% 27% 46% 49% 37% 43% 46% 49%
PDQL1)− 0% 19% 17% 13% 20% 15%* 13% 11% 11% 11% 13%
Intra-Tumoral PD-L1 Expression Predicts Response to PD-1/PD-L1 Blockade – 4 FDA-Approved Tests
Presented by: Margaret Callahan
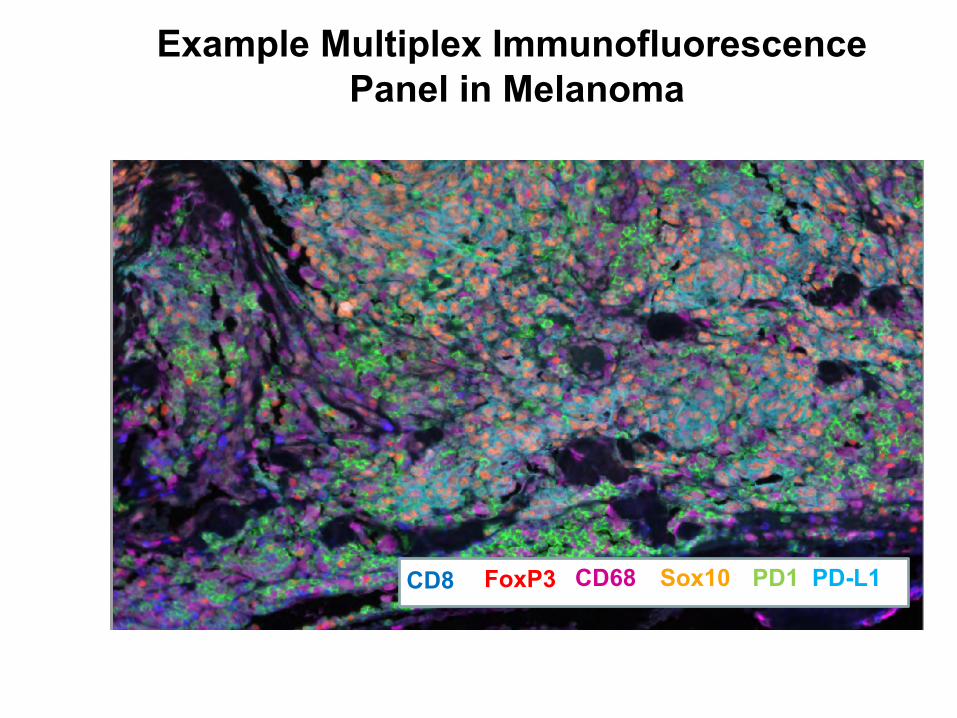
PD-L1PD1Sox10CD68FoxP3CD8
Example Multiplex Immunofluorescence Panel in Melanoma
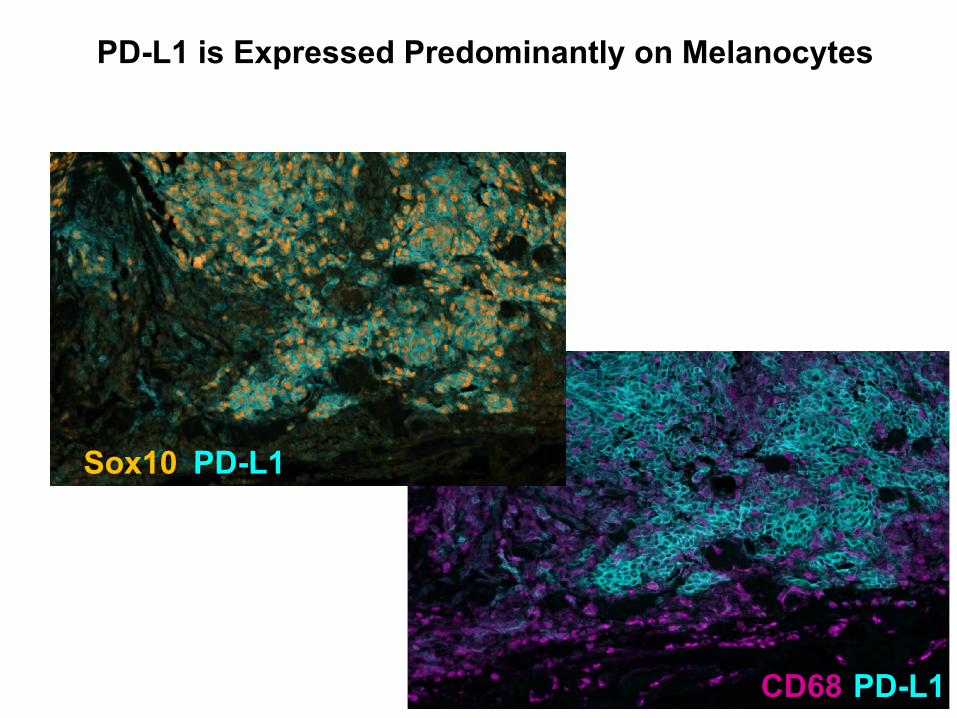
CD68 PD-L1
Sox10 PD-L1
PD-L1 is Expressed Predominantly on Melanocytes

CD8+ Cytotoxic T Cells (Yellow) Touching CD68+ Macrophages (Pink)
Phenotype Total Touching Count %Cytotoxic T Cells 549 macrophages 106 19.3%
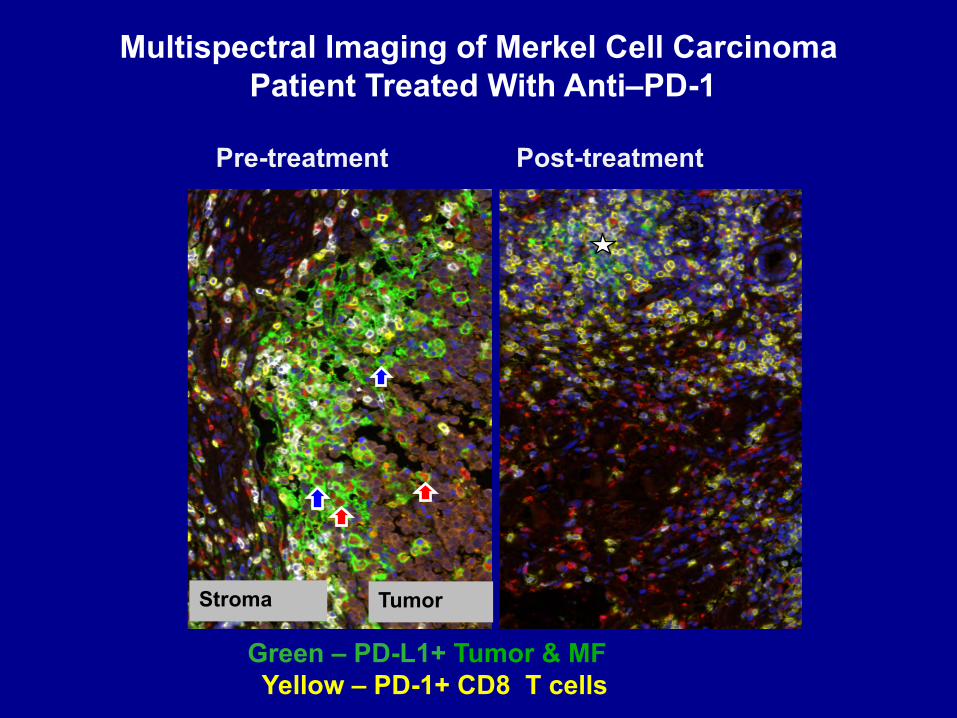
Multispectral Imaging of Merkel Cell Carcinoma Patient Treated With Anti–PD-1
Pre-treatment Post-treatment
Stroma Tumor
Green – PD-L1+ Tumor & MF Yellow – PD-1+ CD8 T cells
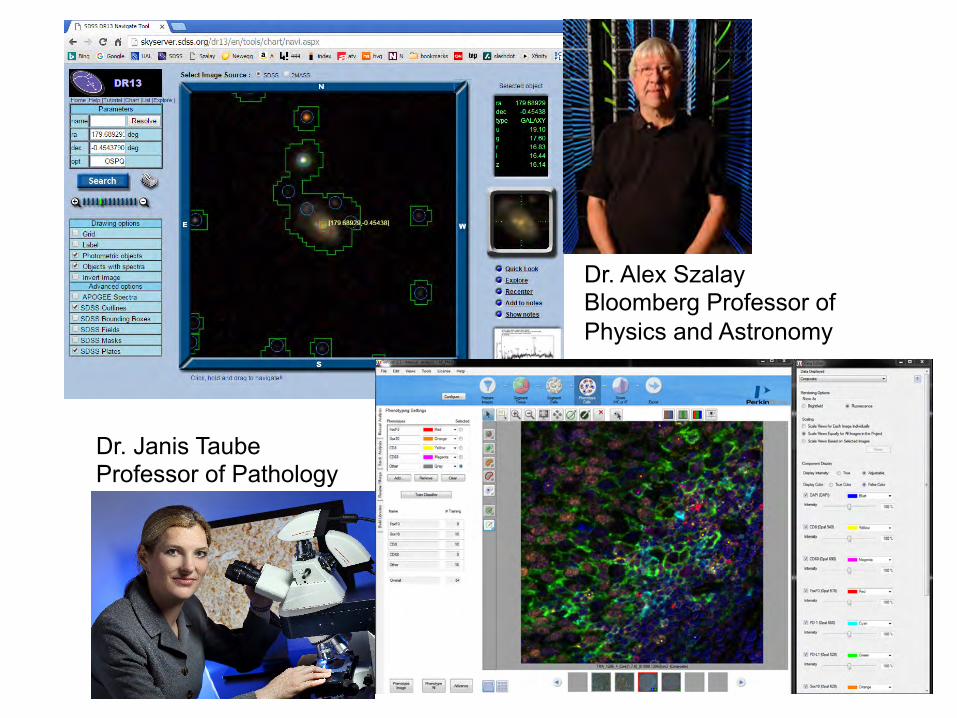
Dr. Alex SzalayBloomberg Professor of Physics and Astronomy
Dr. Janis TaubeProfessor of Pathology

Can a tumor’s genetics affect its microenvironment
and, as follows, its response to immunotherapy?
**
**
**
*
**
*
Tumor Tumor-specific T cell
Tumor-specific T cell
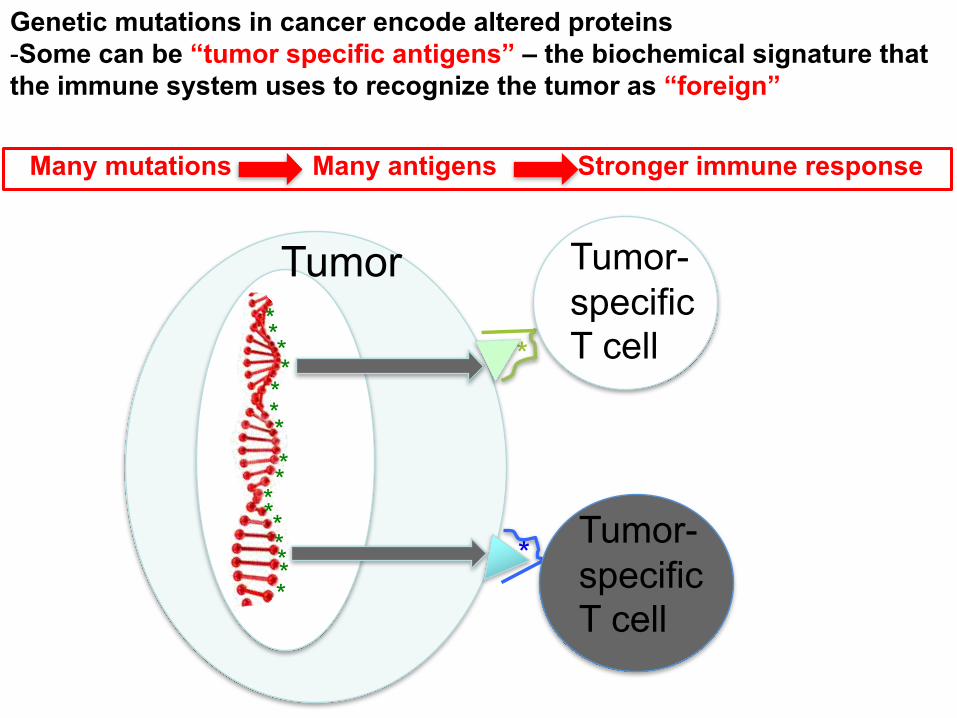
Genetic mutations in cancer encode altered proteins-Some can be “tumor specific antigens” – the biochemical signature that the immune system uses to recognize the tumor as “foreign”
*
*
****
**
Many mutations Many antigens Stronger immune response
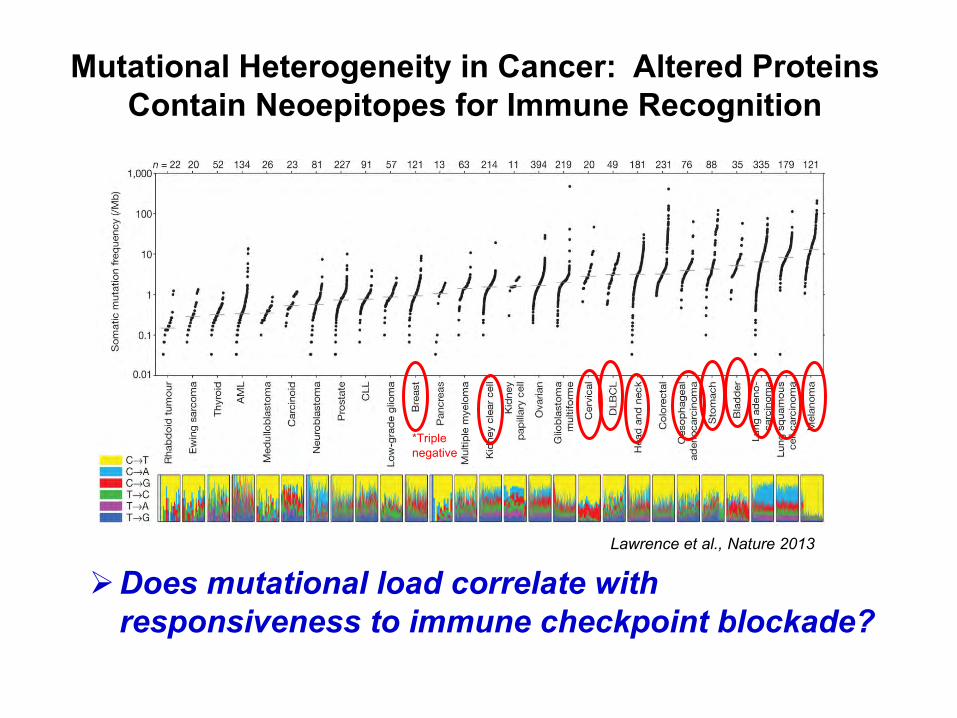
Mutational Heterogeneity in Cancer: Altered Proteins Contain Neoepitopes for Immune Recognition
ØDoes mutational load correlate with responsiveness to immune checkpoint blockade?
Lawrence et al., Nature 2013
*Triplenegative
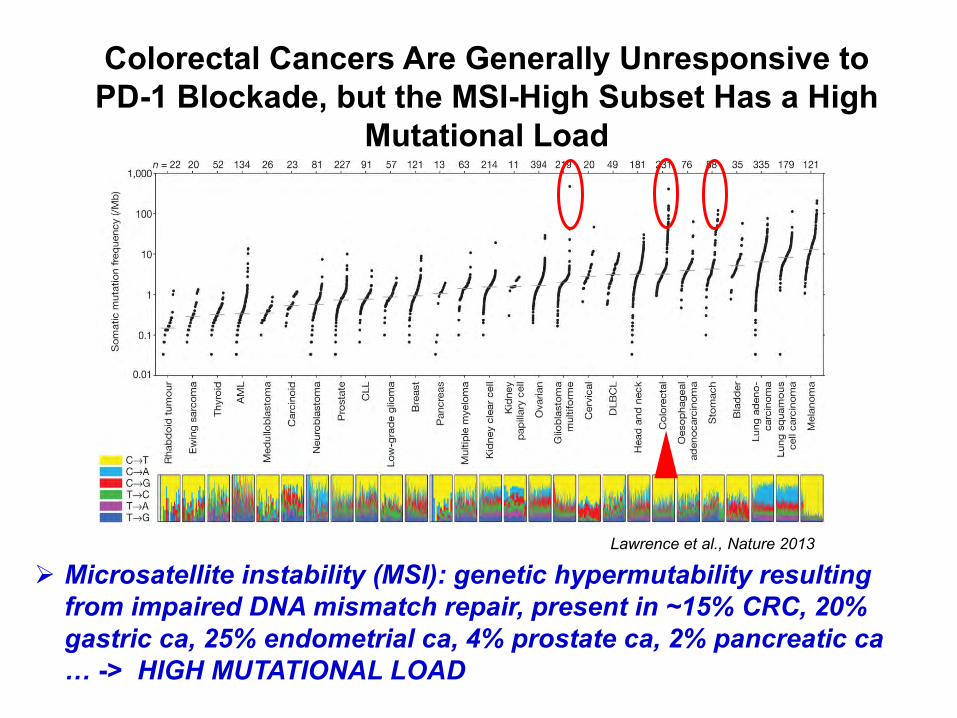
Colorectal Cancers Are Generally Unresponsive to PD-1 Blockade, but the MSI-High Subset Has a High
Mutational Load
Ø Microsatellite instability (MSI): genetic hypermutability resulting from impaired DNA mismatch repair, present in ~15% CRC, 20% gastric ca, 25% endometrial ca, 4% prostate ca, 2% pancreatic ca … -> HIGH MUTATIONAL LOAD
Lawrence et al., Nature 2013

Objective ResponsesMMR-deficient CRC MMR-proficient
CRC MMR-deficient
non-CRC N 13 25 10
Objective Response Rate 62% 0% 60%
Disease Control Rate 92% 16% 70%
-100
-50
0
50
100M M R -p ro fic ie n t C R C
M M R -d e fic ie n t C R C
M M R -d e fic ie n t n o n -C R C
% C
ha
ng
e f
rom
Ba
se
lin
e S
LD
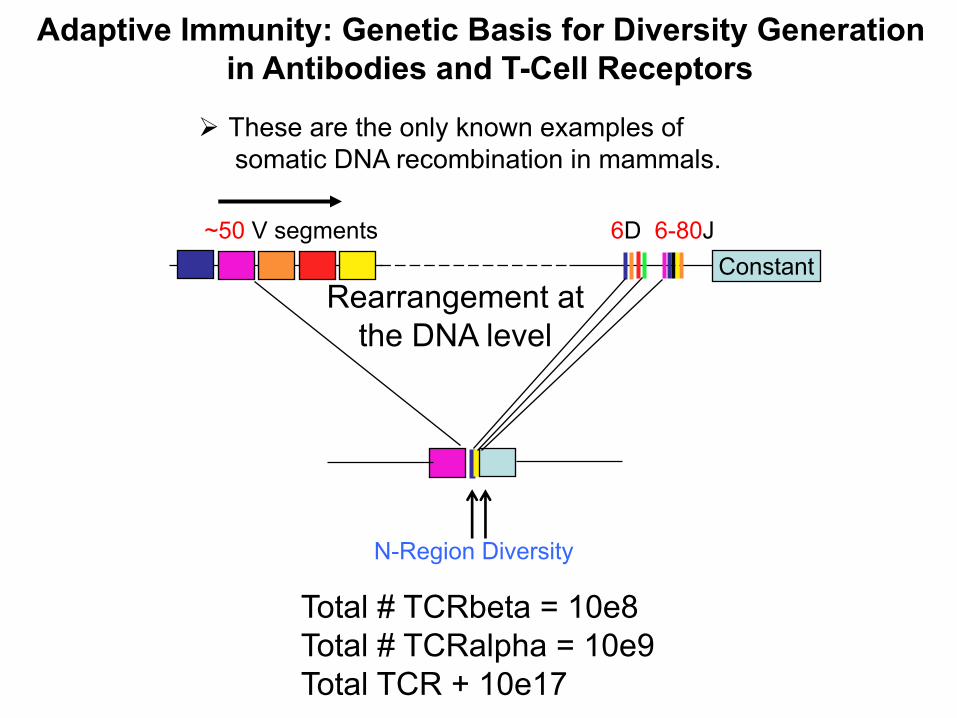
~50 V segments 6D 6-80J
Adaptive Immunity: Genetic Basis for Diversity Generationin Antibodies and T-Cell Receptors
Rearrangement atthe DNA level
Ø These are the only known examples of somatic DNA recombination in mammals.
Constant
N-Region Diversity
Total # TCRbeta = 10e8Total # TCRalpha = 10e9Total TCR + 10e17
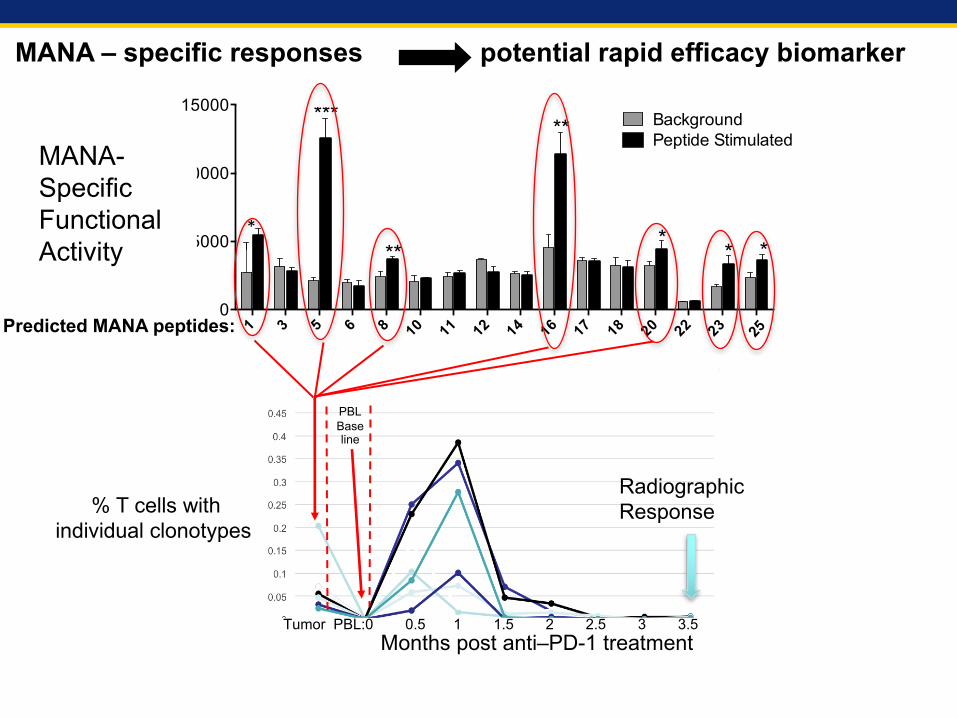
% T cells withindividual clonotypes
T cell Clones:
PBLBaseline
RadiographicResponse
Tumor PBL:0 0.5 1 1.5 2 2.5 3 3.5 Months post anti–PD-1 treatment
1 3 5 6 8 10 11 12 14 16 17 18 20 22 23
No pep, C
EF0
5000
10000
15000
20000
Peptide
SFC
/106
T ce
lls
SFCBackgroundPeptide Stimulated
*
**
**
**
1 3 5 6 8 10 11 12 14 16 17 18 20 22 23
No pep, C
EF0
5000
10000
15000 Activity
Peptide
Act
ivity
BackgroundPeptide Stimulated
***
*****
**
*"
Mul$ple'MANA*specific'T'cell'responses'a4er'an$*PD*1'
MANA-Specific FunctionalActivity
MANA – specific responses potential rapid efficacy biomarker
Predicted MANA peptides:
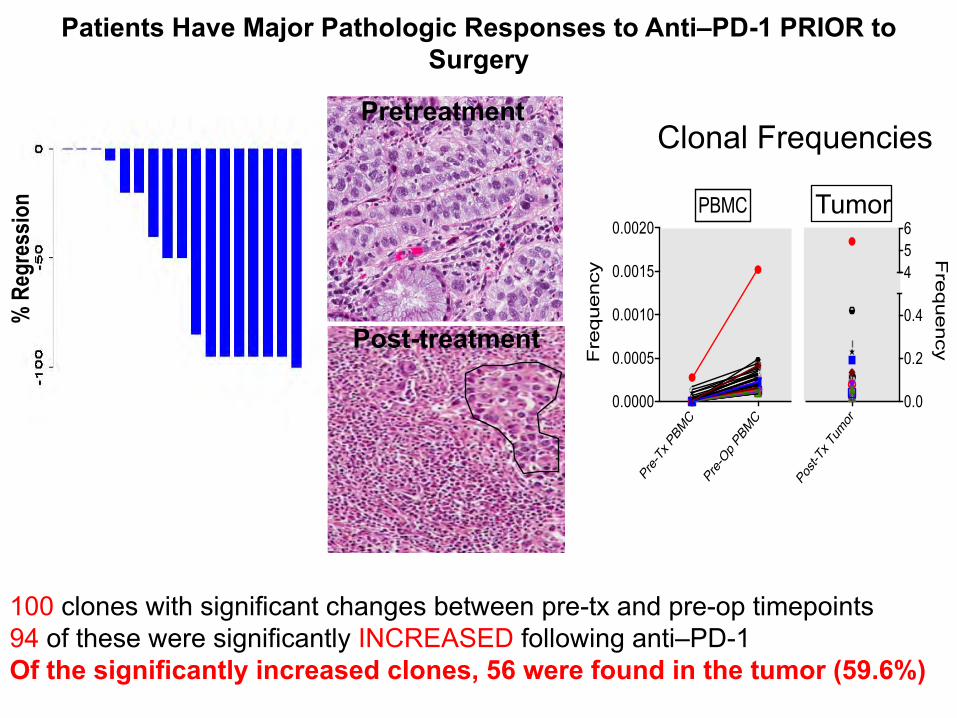
Patients Have Major Pathologic Responses to Anti–PD-1 PRIOR to Surgery
100 clones with significant changes between pre-tx and pre-op timepoints94 of these were significantly INCREASED following anti–PD-1Of the significantly increased clones, 56 were found in the tumor (59.6%)
Pre-Tx
PBM
C
Pre-Op P
BMC
0.0000
0.0005
0.0010
0.0015
0.0020
Fre
quency
Post-
Tx Tum
or0.0
0.2
0.4
456
Fre
quency
PBMC TissueTumor
Neoadjuvant+an,-PD-1+in+NSCLC++++++++++++++++++–+44%+major+pathologic+response+rate+
Pre$nivo)
Post$)nivo)
Neoadjuvant+an,-PD-1+in+NSCLC++++++++++++++++++–+44%+major+pathologic+response+rate+
Pre$nivo)
Post$)nivo)
Pretreatment
Post-treatment
% R
egre
ssio
n
Clonal Frequencies

ER
TAP
MHCclassI
PD-1PD-L1
TCR
TumorCell T-Cell
Wholeexomesequencing
TumorandmatchedPBLDNA
Somaticsequencevariations
Mutationassociatedneoantigencandidates
T-Cellpurification
Mutation AssociatedNeoAntigen Functional
ExpansionofSpecificTcells
Assayofautologous
T-Cellactivation
TCRsequencing
PBL
SynthesizePeptides
Neoantigenprediction:• Antigenprocessing• Epitopeabundance• MHCbinding
STPSASPLSVPLSVIQCLQKHLEVRCPR
EIDLPRELEYELEY
STPSASPLSVPLSVIQCLQKHLEVRCPR
MANAFEST: MANA Functional Expansion of Specific T Cells

1 2 3 4 5 6 7 8 9 10 11 12 16 21 22 23 24 25 26 27 28 29 30 31 32 36 41 45 56 61
LLLDVPTAAV - shared Ag
No Peptide
Uncultured T cellsTumor
0.0
0.2
0.4
0.6
TCR
V-be
ta fre
quen
cy(m
etasta
tic re
spon
der 3
001)
CASTQGGYGYTFCASSLRSGLGYGYTFCASSLGRWRTQPQHFCSARAVGGEHQPQHFCASSFRGEDTGELFFCATRPGGSFYEQYFCASSLVLQGPSPLHFCASSLQGANSPLHFCASSFQGNYGYTF
pMANA1- inducedTCR-beta CDR3s
Predicted MANA ordered by algorithm
MANAFEST picks up MANA-specific responses NOT seen with ELISPOTeven in patient whose tumor has only 30 exomic mutations
1 2 3 4 5 6 7 8 9 10 11 12 16 21 22 23 24 25 26 27 28 29 30 31 32 36 41 45 56 61
LLLDVPTAAV - shared Ag
No Peptide
Uncultured T cellsTumor
0
1
2
3
4
5
TCR V
-beta f
reque
ncy(m
etasta
tic res
pond
er 300
1)
CASSWGTGLNTEAFFCASSPGRGGNQPQHFCASSPRVGSPQHFCASSHRGGRDGEKLFFCASSLAGLLGYTFCASSYDRGNQPQHFCASSGNRVYSPLHFCAIKESTNEKLFFCASSRTGPHEKLFFCASSPLGSGGEAFF
CSARDPGQNYGYTFCASSPGTGAREQYFCASSVGTVGEQYFCASSQSGVPGTEAFFCSVAFSGANVLTFCASGWTGGYGYTFCASSARLEDTQYFCSARRASGATDTQYFCASSLLRPGQGNIQYF
pMANA25-inducedTCR-beta CDR3s

1) Whole exome sequencing
2) Define antigenic peptides(Algorithm, mass spec of eluted peptides, T-cell assays)
3) Synthesize peptides
3) Formulate into vaccine
3) Clinical trials (+ anti–PD-1)
Personalized Peptide Vaccines
Ø >100 Candidate MANA Ø Algorithms highly imperfectØ T cell assays too insensitive
Which peptides?
Scientific challenge

Conclusions• Patients contain a vast repertoire of T cells
capable of recognizing their tumor• Multiple druggable inhibitory pathways in the
TME account for tumor immune resistance →biomarker-driven combinatorial therapy
• Lots of mutations: higher tumor antigenicity• Sensitive assays suggest that anti-tumor
response is broad and shallow even in patients with lower mutational load
• Identification of these responses → personalized immunotherapy

Blloomberg~Kimmel Institute for Cancer Immunotherapy at Johns Hopkins
Thanks to patients and collaborating clinical trial centers.Supported by BMS, Melanoma Research Alliance, NCI, SU2C-AACR-CRI,
Barney Fdn., Bloomberg Foundation, and others