How Many Can Be Joint? Supporting Joint Duty Assignments · iv How Many Can Be Joint? Supporting...
128
How Many Can Be Joint? Supporting Joint Duty Assignments Jlii4I.t» Magaret C. Harr ell John R Schänk Harry J. Thie Clifford M. Graf II Paul Steinberg RAND ,.",S6 j€5OT*r *3&&*SW*^miBa*.^ *- !.___ ^i^JsA** National Defense Research Institute
Transcript of How Many Can Be Joint? Supporting Joint Duty Assignments · iv How Many Can Be Joint? Supporting...

How Many Can Be Joint?
Supporting Joint Duty
Assignments Jlii4I.t»
Magaret C. Harr ell
John R Schänk
Harry J. Thie
Clifford M. Graf II
Paul Steinberg
RAND
,.",S6 j€5OT*r
*3&&*SW*^miBa*.^■*- !.___ ^i^JsA**
National Defense Research Institute

The research described in this report was sponsored by the Joint Staff and was conducted in RAND's National Defense Research Institute, a federally funded research and development center supported by the Office of the Secretary of Defense, the Joint Staff, and the defense agencies, Contract No. MDA903-90-C-0004.
Library of Congress Cataloging in Publication Data
HarrclL Margaret C. How many can be joint? : supporting joint duty assignments /
Margaret C. Harrell, John F. Schänk, Harry J. Thie, Clifford M. Graf II. Paul Steinberg,
p. cm ''Prepared for the Joint Staff." ■'MR-593-JS." Includes bibliographical references (p. ). ISBN 0-8330-2297-0 (alk. paper) 1. United States—Armed Forces—Officers on detached service.
2. Unified operations (Military science) I. Schänk. J. II. Thie. Harry. III. United States. Joint Chiefs of Staff. Joint Staff. IV. Title. UB413.H37 1996 355.3 '3—dc20 95-33169
C1P
© Copyright 1996 RAND
All rights reserved. No part of this book may be reproduced in any form by any electronic or mechanical means (including photocopying, recording, or information storage and retrieval) without permission in writing from RAND.
RAND is a nonprofit institution that helps improve public policy through research and analysis. RAND's publications do not necessarily reflect the opinions or policies of its research sponsors.
Published 1996 by RAND 1700 Main Street, P.O. Box 2138, Santa Monica, CA 90407-2138
RAND URL: http://wwwr.rand.org/ To order RAND documents or to obtain additional information,
contact Distribution Services: Telephone: (310)451-7002; Fax: (310) 451-6915; Internet: [email protected]

How Many Can Be Joint?
Supporting Joint Duty
Assignments
Magaret C. Harrell John E Schänk
Harry J. Thie Clifford M. Graf II
Paul Steinberg
STATEMENT X ^BprorsxS ior gzsus release
Prepared for the
Joint Staff
National Defense Research Institute
RAND Approved for public release; distribution unlimited
DTIG QUALITY EXPECTED 1
PREFACE
Title IV of the Goldwater-Nichols DoD Reorganization Act of 1986 specified a system of joint officer management, including manage- ment policies, promotion objectives, and educational and experience requirements. The intent of the personnel provision was to enhance the quality, stability, and experience of officers in joint assignments (those assignments to organizations outside an officer's individual military service that address issues involving multiple services or other nations), which, in turn, would improve the performance and effectiveness of joint organizations.
In 1987, the Secretary of Defense published a list of joint duty as- signment positions. In developing this Joint Duty Assignment List (JDAL), the Secretary limited joint duty positions to those filled by officers in the pay grades of 0-4 (major, or lieutenant commander in the Navy) and above. All such positions in certain organizations (Office of the Secretary of Defense, the Joint Staff, and the unified commands) and a maximum of 50 percent of defense agency posi- tions were included as joint duty assignments.
The 1993 National Defense Authorization Act requested a reexami- nation of the rules implementing the Goldwater-Nichols legislation. The Joint Staffs Director of Manpower and Personnel requested RAND to provide information and analysis to assist in conducting the study mandated by Congress and to evaluate alternative policy choices for the size and composition of the JDAL and for joint officer management. To accomplish this, RAND researchers examined is- sues on both the demand side and the supply side of officer man- agement. This report describes the results and recommendations of

iv How Many Can Be Joint? Supporting Joint Duty Assignments
the supply-side analysis. A companion document, MR-574-JS, Who Is Joint? Reevaluating the Joint Duty Assignment List, describes the results and recommendations of the demand-side analysis. MR-622- JS, Identifying and Supporting Joint Duty Assignments: Executive Summary, presents recommendations and observations based on the research results of both studies.
The research was conducted under the Forces and Resources Policy Center of the National Defense Research Institute, a federally funded research and development center sponsored by the Office of the Secretary of Defense, the Joint Staff, and the defense agencies. The report should be of interest to policymakers and organizations con- cerned with military (especially joint) officer management.

CONTENTS
Preface iii
Figures ix
Tables xi
Summary xv
Acknowledgments xix
Abbreviations and Acronyms xxi
Chapter One INTRODUCTION 1 Background 1
Goldwater's and Nichols'Concerns About Officers .... 1 The Goldwater-Nichols Department of Defense
Reorganization Act of 1986 2 Personnel Provisions of the Act 4
Research Objectives and Approach 6 Defining Supportability of JD As 7
Organization of the Report 9
Chapter Two THE BROADER ISSUES OF SUPPORTABILITY:
ASSIGNMENTS AND CAREERS 11 Introduction 11 Assignments: Numbers, Grade, and Skill of Outside-
Service Personnel Authorizations 11

vi How Many Can Be Joint? Supporting Joint Duty Assignments
The Problem of Numbers of People 12 The Problem of Numbers by Grade 13 The Problem of Numbers by Skill 14
Careers 15 Fitting Joint Tours into Officer Career Paths 16
Summary 20
Chapter Three MANAGING QUALITY OFFICERS TO MEET PROMOTION
OBJECTIVES 21 Background 21 Making Promotion Policy Comparisons More Valid 23
Using Skill-Based Comparisons 23 Reporting Annual Board Data and the Boards' Moving
Averages 27 Changing Categories for Comparison 28
Making Comparisons Simpler 33 Limiting Comparisons to Promotion to 0-5 and 0-6 ... 33 Combining Promotion Zones 34
Conclusions About Managing Quality 34
Chapter Four PRODUCING SUFFICIENT JSOs AND JSO NOMs FOR
JPME ALLOCATIONS 37 Background 37 Why Joint Specialty Officers Are Produced 38 How the Services Produce JSOs and JSO Noms 39
JPME as a Prerequisite to JSO/JSO Norn 42 JSOs and JSO Noms Present Separate Production
Problems 43 Services Can Produce an Adequate Supply of JSOs to Fill
1000 Billets 45 JSO Noms Constrain the Size of the JDAL 49 Conclusions About Size of JDAL That Can Be Supported . . 54
Chapter Five CONCLUSIONS AND RECOMMENDATIONS 57 Conclusions 57 Recommendations 58

Contents vii
Appendix A. PROGRAMMED MANNING 61 B. DoD IMPLEMENTATION OF GOLDWATER-
NICHOLS 65 C. JSO/JPME MODEL 69 D. RESULTS OF RESPONSES TO THE SURVEY'S
OPINION QUESTIONS 89
Bibliography 113

FIGURES
2.1. Endstrength Versus Programmed Manning 13 2.2. Estimated Distribution of Selected Occupations 15 4.1. Four Ways To Be Designated a JSO 41 4.2. Navy JSOs/JSO Eligibles 46 4.3. Army JSOs/JSO Eligibles 46 4.4. Air Force JSOs/JSO Eligibles 47 4.5. Marine Corps JSOs/JSO Eligibles 47 C.l. Example Stocks 71 C.2. Example Flows 71 C.3. Example Auxiliary 72 C.4. Four Ways To Be Designated a JSO 73 C.5. The JSO Model 74 C.6. JPME Attendance in the JPME to JDA Process 75 C.7. JSO Noms in the JPME to JSO Process 77 C.8. The JPME to JSO Process 81 C.9. Beginning of the COS Exception Process 84
CIO. The COS Exception Process 86 C.ll. The JSO Process 87 C.12. Example Model Output 88 D.I. Summary of Responses to Opinion Questions 90

TABLES
2.1. General and Flag Officer JDAL Billets 19 3.1. Current Promotion Comparisons 22 3.2. Notional Promotion Comparisons 24 3.3. Recommended Promotion Comparisons 32 4.1. Current Critical Occupational Specialties 40 4.2. 1994 JPME Quotas by Service 42 4.3. Distribution of Critical Billets, Noncritical Joint
Billets, and JPME Quotas Among the Services 49 4.4. Effect of Assignment Policy on JDAL Supportability .. 51 4.5. Maximum JDAL Resulting from Changes to Policy or
Parameters 53 4.6. Maximum JDAL Resulting from Changes
to the Law 54 A.l. Army Active Duty Selected Grade Management 62 A.2. Air Force Active Duty Selected Grade Management .. 62 A.3. Marine Corps Active Duty Selected Grade
Management 63 A.4. Navy Active Duty Selected Grade Management 63 B.l. Composition of the JDAL by Service and Pay Grade .. 66 B.2. Critical Joint Positions by Activity 67 C.l. Annual JPME Quota 76 C.2. JPME Attendance 77 C.3. Values for JPME Leaks 78 C.4. Officers Who Proceed from JPME to JDAs (JPME
Grads to JDAs) 79 C.5. JPME Graduates Who Serve as JSO Noms 80 C.6. Retirement and Quit Rate 81 C.7. Annual JSO Selects 82

xii How Many Can Be Joint? Supporting Joint Duty Assignments
C.8. COS Exceptions 84 C.9. COS Exceptions to JPME 85
CIO. JSO Separation 87 D.I. Question 19: Responses by Grade 92 D.2. Question 19: Responses by Type of Organization ... . 93 D.3. Question 19: Responses by Skill Group 93 D.4. Question 19: Responses by Current
Joint Assignment 94 D.5. Question 20: Responses by Grade 94 D.6. Question 20: Responses by Type of Organization ... . 95 D.7. Question 20: Responses by Skill Group 95 D.8. Question 20: Responses by Current
Joint Assignment 96 D.9. Question 21: Responses by Grade 96
D.10. Question 21: Responses by Type of Organization .... 97 D.H. Question 21: Responses by Skill Group 97 D.12. Question 22: Responses by Grade 98 D.13. Question 22: Responses by Service 98 D.14. Question 22: Responses by Skill 99 D.15. Question 22: Responses by Current Joint
Assignment 99 D.16. Question 23: Responses by Grade 100 D.17. Question 23: Responses by Service 100 D.18. Question 23: Responses by Skill Group 101 D.19. Question 23: Responses by Current Joint
Assignment 101 D.20. Question 24: Responses by Grade 102 D.21. Question 24: Responses by Service 102 D.22. Question 24: Responses by Skill Group 103 D.23. Question 24: Responses by Current
Joint Assignment 103 D.24. Question 25: Responses by Grade 104 D.25. Question 25: Responses by Service 104 D.26. Question 25: Responses by Skill Group 105 D.27. Question 26: Responses by Grade 105 D.28. Question 26: Responses by Service 106 D.29. Question 26: Responses by Skill Group 106 D.30. Question 27: Responses by Grade 107 D.31. Question 27: Responses by Service 107 D.32. Question 27: Responses by Type of Organization .... 108

Tables xiii
D.33. Question 27: Responses by Current Joint Assignment 108
D.34. Question 28: Responses by Grade 109 D.35. Question 28: Responses by Service 109 D.36. Question 28: Responses by Skill Group 110 D.37. Question 29: Responses by Grade 110 D.38. Question 29: Responses by Service Ill D.39. Question 29: Responses by Current
Joint Assignment Ill

SUMMARY
INTRODUCTION
The Goldwater-Nichols Department of Defense (DoD) Reorgani- zation Act of 1986 directed a broad range of organizational and functional changes to improve the ability of the military services to carry out successful joint military operations. However, from the act's initial implementation, the defense agencies and the services have raised numerous concerns about its provisions and procedures. Congress recognized these concerns and tasked DoD to revisit the implementation of the Goldwater-Nichols legislation. The conferees of the 1993 National Defense Authorization Act reviewed the proce- dures, both statutory and regulatory, for designating a position as a joint duty assignment and concluded that "the time has come to re- consider the joint duty assignment list, particularly with respect to Defense Agencies."
In response to a request by the Director of Manpower and Personnel of the Joint Staff (JS/J-1), RAND examined the joint officer manage- ment that forms the basis of the response to the congressional direc- tives. To respond to Congress effectively, the research approached the issue of joint officer management from both the demand and supply sides. The goal of the demand-side research was to recom- mend a procedure for measuring the joint content of a position; the goal of the supply-side research was to determine how many of the positions with joint content the services could support. This report describes the results of the supply-side analysis.

xvi How Many Can Be Joint? Supporting Joint Duty Assignments
CONDUCTING THE SUPPLY-SIDE ANALYSIS
Five major factors affect supportability:
• The promotion objectives specified in the law
• The requirement that 50 percent of the Joint Duty Assignment List (JDAL) positions above the grade of 0-3 be filled by Joint Specialty Officers (JSOs) or JSO nominees (Noms)
• The requirement that all critical billets be filled by JSOs
• The Joint Professional Military Education (JPME) quotas avail- able to each service
• The service assignment policies for JSOs and JPME graduates.
The first factor requires the services to make sure that their "quality" officers are shared between the service and joint worlds, a potential personnel management problem. The remaining four factors place constraints on service supportability of joint assignments.
IMPLICATIONS OF SUPPORTABILITY ANALYSES
Personnel management problems arise from the difficulties the ser- vices experience in meeting the promotion policy objectives accord- ing to the promotion measurements established by Goldwater- Nichols. The comparisons are complicated and oblique, and do not necessarily reflect or measure the actual objectives established by Goldwater-Nichols. If the measurements were changed, the services could more easily satisfy them within the objectives framework. In addition, the current designation and assignment practices would become more supportive of the legislation's overall objectives be- cause they would no longer cater solely to meeting the promotion measurements.
The real constraint on the number of billets outside of service orga- nizations (which we call "outside-service" billets) that receive joint credit is the services' ability to produce sufficient joint specialists to fulfill the 50 percent requirement. The demands for JSOs and for JSO Noms are two separate problems. The services need to develop suf- ficient numbers and types of JSOs to fill the 1000 critical Joint Duty Assignments (JDAs), but they also have to have sufficient JSO Noms

Summary xvii
to fill noncritical JDAs. These problems are interrelated, although the dynamics of the two problems are not immediately evident. That is, every change to the available quantity or types of JSOs or any change to the number of critical positions they fill has an impact on the noncritical portion of the JDAL and on the JSO Noms required to fill these positions. Likewise, any change to the size of the pool of JSO Noms will affect the services' capability to select JSOs. Conversely, if critical positions are decreased, the overall JDAL can stay the same size if JSOs are used in noncritical positions.
Current service policies can produce sufficient JSOs to fill the 1000 critical positions. Any difficulties in having sufficient JSOs will arise in the next seven years, before recently improved policies become evident in the pool of available JSOs. The services can also produce sufficient JSO Noms to fill the current JDAL. The maximum JDAL supportable with the current JPME1 output and service policies is approximately 9900 positions above the grade of 0-3. Thus, the ser- vices can adequately support any of the potential JDAL sizes dis- cussed in MR-574-JS, which discusses the demand side of the ques- tion of officer management.2
The JDAL could be further increased if the throughput of the existing JPME schools were increased, if alternative credit for JPME were allowed, if more JPME graduates were assigned to JDAs, or if more JSOs were assigned to noncritical billets. In addition, if the 50 percent rule3 were decreased or if the number of allowable critical occupational specialty (COS) exceptions were increased, more positions could receive joint credit. In fact, with minor changes to law and policy, it is likely that the services could support all outside- service positions with joint content, which would make more officers eligible for general and flag officer (G/FO) rank and make it easier to
1In this report, JPME generally refers to JPME Phase II. Chapter Three provides more details. 2MR-574-JS surveyed positions; suggested a method for determining which positions, based on their joint content, should be included on the JDAL; and provided three exemplary JDALs for purposes of discussion and analysis. The lists ranged in size from 5900 to 9300. However, the demand-side analysis found that a very large percentage of the billets surveyed include joint content, and that all of the positions surveyed could be included on a JDAL. 3Goldwater-Nichols required 50 percent of the positions on the JDAL above the grade of 0-3 be filled by JSOs or JSO Noms.

xviii How Many Can Be Joint? Supporting Joint Duty Assignments
fit a joint assignment into the career path of quality officers by increasing assignment flexibility. Having a larger JDAL does not increase the number of officers serving in outside-service positions; these billets already exist and provide joint experience, although the officers filling these positions are not currently receiving joint credit.
RECOMMENDATIONS
Based on these results, we make the following recommendations:
• Implement the largest JDAL supportable with JSOs and JSO Noms.
• If 0-3s are to receive joint credit, do not include them in the promotion comparisons.
• Change the promotion comparisons to increase their validity and make them simpler by including in the reports both the annual board data and a moving average, and by combining the below- zone, within-zone, and above-zone comparisons; also, change the law to reflect more appropriate comparisons.
• Strive to assign at least 95 percent of the Armed Forces Staff College (AFSC) graduates to a joint billet immediately following completion of JPME.
• Reevaluate the JPME system. Increasing the AFSC faculty to bring the school to full capacity or granting JPME credit to alternative educational programs would increase the numbers of JSOs and JSO Noms.
• Reexamine changes to the 50 percent rule and the 12.5 percent limit on allowable COS Exceptions.

ACKNOWLEDGMENTS
The authors wish to thank the staff of the Director for Manpower and Personnel (J-l) of the Joint Staff for their support, particularly Navy Captains Howard Nesbitt and Grant Fulkerson; Commanders David Logsdon, Thomas Davilli, and Cynthia Yarosh; Major Diane Larson; and Martin Banks. Lieutenant Colonel John Hamlin of the Office of the Secretary of Defense contributed to our understanding of the Goldwater-Nichols legislation. Additionally, many officers in all the military services helped us to understand how officers' careers are managed and how those careers are affected by joint duty assign- ments. In particular, we are indebted to the officers from each ser- vice who at various times served on the J-l Study Group; they pro- vided not only details of service personnel policies and practices but also data that allowed us to develop and validate models of joint as- signments and promotion. We are also grateful to RAND colleagues Al Robbert and Robert Howe for their constructive review of this re- port.
We are aware that not all service personnel managers will support the views expressed in this report. These are our views and do not represent the policy of the Department of Defense or the individual military departments.

ABBREVIATIONS AND ACRONYMS
AFSC Armed Forces Staff College CINC Commander-in-Chief CJDA Critical Joint Duty Assignment COS Critical Occupational Specialty DoD Department of Defense G/FOs General/flag officers GAO Government Accounting Office HQS Headquarters ICAF Industrial College of the Armed Forces IG Inspector General JDA Joint Duty Assignment JDAL Joint Duty Assignment List JDAMIS Joint Duty Assignment Management Information
System JPME Joint Professional Military Education JS Joint Staff JSO Joint Specialty Officer JSO Noms JSO nominees MEPD Military Education Policy Document NWC National War College OSD Office of the Secretary of Defense USA U.S. Army USAF U.S. Air Force USMC U.S. Marine Corps USN U.S. Navy WHS Washington Headquarters Service

Chapter One
INTRODUCTION
BACKGROUND
Goldwater's and Nichols' Concerns About Officers
Barry Goldwater states in his autobiography1 that military experi- ences in World War II led him to believe that the military services did not work well together. More recent problems with joint operations, such as the failed hostage rescue mission in Iran and the invasion of Grenada, led him to a serious examination of joint service capabili- ties. The common perception of the time, supported by the testi- mony of numerous witnesses in the hearings that led to the passage of the Goldwater-Nichols legislation,2 was that the military services had little respect for joint service or for assignments outside their individual service organizations. They typically sent second-rate of- ficers to such assignments and removed them as quickly as possible. Joint assignments were not desired by military officers, who viewed them as a hindrance in their service career progression.
'Barry M. Goldwater and Jack Casserly, Goldwater, Doubleday, New York, 1988 (especially Chapter 11, Duty-Honor-Country, pp. 334-361). 299th Congress, 1st Session, Defense Organization: The Need for Change, Senate Print 99-86, Committee on Armed Services, United States Senate, October 16, 1985, and 99th Congress, 2nd Session, Reorganization of the Department of Defense, Hearings Before the Investigations Subcommittee on Armed Services, HASC No. 99-53, House of Representatives, 1987.

How Many Can Be Joint? Supporting Joint Duty Assignments
Goldwater and Nichols felt that military officers, especially the gen- eral and flag officers,3 had little understanding or appreciation of the policies, procedures, operations, or capabilities of the other services. As a result, they had little experience in, or knowledge of, the conduct of joint operations. Realizing that future contingencies would almost always involve two or more military services acting together, the authors of the Goldwater-Nichols legislation felt strongly that something had to be done to instill a joint culture (i.e., attitudes, values, and beliefs about joint service) among the officer corps—a culture that would lead to an appreciation and understanding of how the services could and should operate together in future conflicts.
The Goldwater-Nichols Department of Defense Reorganization Act of 1986
The Goldwater-Nichols Department of Defense (DoD) Reorga- nization Act of 1986 directed a broad range of organizational and functional changes to improve the ability of the military services to carry out successful joint military operations. Provisions in the act directed the Secretary of Defense to develop a definition of a Joint Duty Assignment (JDA) and to publish a Joint Duty Assignment List (JDAL). This list includes those positions at organizations, outside the individual services, that address issues involving multiple ser- vices or other nations where the assigned officer gains a "significant experience in joint matters."
Title IV of the act contains the personnel-related provisions, includ- ing management policies, promotion objectives, and education and experience requirements for officers assigned to JDAs. The major provisions of Title IV are contained in Chapter 38 of Title 10 of the United States Code.
The original implementation of Goldwater-Nichols, the one used to- day, applied a broad-brush approach. Joint duty consideration was limited to pay grades of 0-4 or higher. All such positions in some or-
3The officer corps is typically divided into three groups by pay grade: company grade (0-1 [lieutenants and ensigns] to 0-3 [captains and Navy lieutenants]), field grade (0-4 [majors and lieutenant commanders] to 0-6 [colonels and Navy captains]), and general and flag officers (0-7 to O-10).
Introduction
ganizations (Office of the Secretary of Defense (OSD), the Joint Staff (JS), and the unified commands) and half of the positions in each defense agency were placed on the JDAL. The law specifically pro- hibited positions in individual service organizations from receiving joint duty credit. This original implementation led to a list of approx- imately 8300 positions designated as JDAs.
From the initial implementation of Goldwater-Nichols, concerns were raised by numerous organizations. The defense agencies ex- pressed their concern that only half of their positions would qualify for joint assignments whereas all the positions in other organizations were on the JDAL. The services felt that certain positions within the services (which we call "in-service" positions) had a joint content and should be considered for the JDAL. Finally, examples were noted of positions on the Joint Staff or the unified commands (where all positions above the grade of 0-3 were granted joint duty credit) that had little or no joint content.
The services also expressed their concerns about meeting the various constraints and promotion objectives specified by the law. They felt that it was difficult to qualify a sufficient number of officers to meet the "50 percent" rule of Goldwater-Nichols that required that at least half the positions on the JDAL above the grade of 0-3 be filled by Joint Specialty Officers (JSOs) or officers nominated as JSOs (JSO Noms).4
They also found it hard to manage their "quality" officers to ensure that sufficient numbers served in joint duty positions. These dual is- sues of developing JSOs and managing quality officers to meet cer- tain promotion objectives are the two predominant problems that constrain service support of positions on the JDAL.
During the ensuing years, some minor modifications were made— such as a reduction in the tour length of joint duty assignments5—
4Goldwater-Nichols created the classification of JSO to ensure a pool of officers with joint education and experience. Although there are several paths that lead to the des- ignation, the majority of JSOs have completed their Joint Professional Military Education (JPME), Phase II, and then a joint duty tour. They are then selected by their service for the designation and are approved by the Secretary of Defense. JSO Noms have completed JPME, and are currently serving their first joint tour. 5Title IV initially specified that JDA tours average at least three and one-half years for field grade officers and at least three years for general and flag officers. These tour
4 How Many Can Be Joint? Supporting Joint Duty Assignments
but the basic stipulations of the law remain as originally written. The designation of positions that qualify for joint duty has also remained constant over the several years since the JDAL was first published.
Recent reductions in military personnel strength have exacerbated the problems faced by the services. The personnel demands of joint organizations have grown, while the number of officers available to meet those demands has decreased. As a result, the services find it increasingly difficult to "share" their high-quality officers between the joint and service worlds.
Personnel Provisions of the Act
The personnel provisions of the DoD Reorganization Act of 19866 can be described as an effort to meet the following five objectives:
• Increase the quality of officers in joint assignments;
• Ensure that officers are not disadvantaged by joint service;
• Ensure that general and flag officers (G/FOs) are well-rounded in joint matters;
• Enhance the stability and increase the joint experience of officers in joint assignments; and
• Enhance the education of officers in joint matters and strengthen the focus of professional military education in preparing officers for JDA positions.
These objectives play an important role in assessing how many offi- cers can be joint because they set the boundaries for assessing sup- portability within current law and policy. If changes to law and pol- icy are suggested, such changes must be within the framework of Goldwater-Nichols.
lengths were later amended to three years for field grade officers and two years for general and flag officers. 699th Congress, Second Session, 1986, Department of Defense Reorganization Act of 1986, P.L. 99-433, in United States Code Congressional and Administrative News, Volume 1, West Publishing Co., St. Paul, Minn., Title IV—Joint Officer Personnel Policy.

Introduction
Title IV contained "protections" written into the law to achieve the first two objectives. These protections took the form of promotion rate comparisons. The law specified that the promotion rate be as follows:
• Officers holding the designation of JSO7 should average at least as high as the average of officers in the same service and com- petitive group who were serving or had served on the service headquarters staff.
• Officers who were serving on, or had served on, the Joint Staff should meet the same standard.8
• Officers who were serving in, or had served in, other JDAs should average at least as high as the service-wide average for officers in the same service and competitive group.
The law requires that the Secretary of Defense provide a report to Congress, at least semiannually, on the promotion rates of officers in the various categories outlined above. If the promotion rates fail to meet the legal objectives, the Secretary must provide information on specific failures and describe actions or plans to prevent future failures.
To ensure that general and flag officers are well-rounded in joint matters, the law requires that officers complete a JDA before they are promoted to the grade of 0-7. Furthermore, many of the general and flag officer positions on the JDAL are designated as critical billets. The law requires that these critical positions be filled by Joint Specialty Officers who have not only completed a prior joint tour, but have also completed JPME.
The requirement of a prior joint tour before promotion to 0-7 and the need to ensure that the promotion objectives are met require careful management of officer careers and of the officers assigned to JDAs. Service personnel managers must identify all officers with a chance of promotion to G/FO rank and ensure that they have a joint
The JSO designation remains with an officer throughout his career, regardless of whether he is currently serving in a joint billet. 8By policy, officers who were serving in or had served in the Office of the Secretary of Defense should also meet this standard.
6 How Many Can Be Joint? Supporting Joint Duty Assignments
tour. Also, "quality" officers must be shared between the services and the joint world.
RESEARCH OBJECTIVES AND APPROACH
Congress has recognized these concerns and has recently asked DoD to revisit the implementation of Goldwater-Nichols.9 Section 932 of Public Law 102-484 (National Defense Authorization Act for Fiscal Year 1993) requires that "The Secretary of Defense, after consultation with the Chairman of the Joint Chiefs of Staff, shall conduct a study of military officer positions that are designated as joint duty assign- ments pursuant to section 661 of Title 10, United States Code, and other provisions of the law." In turn, the Director of Manpower and Personnel (J-l) of the Joint Staff, who has responsibility for develop- ing the DoD response to the congressional directive, asked RAND to conduct research on joint officer management to assist in forming the basis for that response, including recommendations for a new implementation of the legislation that involves potential changes to the law and to OSD and service policies, while preserving the law's objectives.
To respond effectively to the congressional directive, the research approached the issue of joint officer management from both the de- mand and supply sides. The goal of the demand-side research was to recommend a procedure for measuring the joint content of a posi- tion. Based on data received from a survey of the positions nomi- nated as candidates for JDAs, it was found that almost all those in the nominated positions spend at least a portion of their time working on joint matters. Absent any constraints from current law or policies, almost all the billets surveyed could be placed on a new JDAL."1 10
9The conferees of the 1993 Nationai Defense Authorization Act reviewed the statutory and regulatory procedures for designating a position as a joint duty assignment and concluded that "the time has come to reconsider the joint duty assignment list, par- ticularly with respect to Defense Agencies." The conferees felt the 50 percent alloca- tion had some unfortunate results. They believed it necessary to examine each de- fense agency position to determine the correctness of its designation. Also, they raised the issue of reallocating JDA percentages among the agencies. The conferees regarded the exclusion of assignments within an officer's own Military Department as correct but were amenable to considering exceptions. 10See MR-574-JS, Who Is Joint? Reevaluating the Joint Duty Assignment List, 1996.

Introduction
This report focuses on the results of the supply-side analysis. The goal of the research was to determine how many of the positions with joint content the services could support. This was accomplished through three main tasks:
• Identify the number of joint positions the services can support based on current law and policy;
• Identify the portions of the law or of the service or DoD policies that constrain the number of joint positions the services can support;
• Identify changes to law or policy and determine the effect on supportability of those changes.
We accomplished our assessment by interacting with the services, OSD, and the Joint Staff to understand their views on supportability and on the various constraints affecting it.11 We also built analytic tools to examine potential changes to law and policy.
Defining Supportability of JDAs
We formulated our research on supportability to identify the relevant issues from several perspectives and to discover the major operative factors. In general, we define "supportability" as the ability of the services to assign an officer with the required grade and skill to a position. Supportability of JDAs must consider four relevant issues:
• The overall assignment problem—matching "faces" to "spaces." The overall assignment problem has been exacerbated by the drawdown, but this report will indicate that this is not a relevant factor in deciding whether a position can be on the JDAL.
• The career path problem—fitting a joint duty assignment in the career path of quality officers and qualifying sufficient candi- dates for general and flag selection through a joint assignment at some point on a career path. The career path problem is not permanently resolvable without major changes to the officer ca-
11While this analysis considered and incorporated the input of the services, OSD, and the Joint Staff, the conclusions and recommendations stated within this document are the views of the authors only.

8 How Many Can Be Joint? Supporting Joint Duty Assignments
reer management system; it requires substitution of a joint duty assignment for a service assignment in career paths of certain individual officers and substitution of a service assignment for a joint duty assignment for other officers. This issue raises ques- tions of opportunity costs and position effectiveness that are not answered in this study.
• The quality distribution problem—filling joint duty billets with quality officers comparable to those in service billets. Quality distribution is measured by flawed promotion comparisons that lead to counterproductive assignment and designation practices. This report suggests that promotion comparisons should be legally changed, and the service policies that implement these comparisons should be readdressed.
• The stocks and flows problem—building sufficient inventories (stocks) of officers who have certain attributes (gained through constrained resources) for assignment (flow) to positions con- strained by demands for certain kinds of officers.
Five major factors affect supportability:
• The promotion objectives specified in the law;
• The requirement that 50 percent of the JDAL positions above the grade of 0-3 be filled by JSOs or JSO Noms;
• The requirement that all critical billets be filled by JSOs;
• JPME quotas available to each service;
• Service assignment policies for JSOs and JPME graduates.
The first factor creates a personnel management problem for the services to make sure that their "quality" officers are shared between the service and joint worlds. The remaining four factors place con- straints on service supportability of joint assignments.
This report will explore whether stocks of officers can be built within the constraints of current law and policy to support assignments to joint duty positions. Changes to law and policy that would allow more positions to be supported will also be examined.

Introduction
ORGANIZATION OF THE REPORT
Chapter Two focuses on the broad issues of supportability—assign- ments and careers. Chapter Three discusses the quality distribution problem—managing quality officers to meet promotion policy objec- tives. Chapter Four analyzes how the constraints on JSOs and JSO Noms affect stocks and flows. Chapter Five summarizes conclusions from the analysis and presents recommendations.
Several appendices present details on aspects of the research. Appendix A provides data on the mismatch of inventory and autho- rizations by grade and numbers, which contributes to services' problems in filling all billets, regardless of whether they receive joint credit. Appendix B provides information on the current implemen- tation of the Goldwater-Nichols legislation. Appendix C describes the model used in our assessment. Appendix D provides results from a set of opinion questions included in the survey instrument.

Chapter Two
THE BROADER ISSUES OF SUPPORTABILITY: ASSIGNMENTS AND CAREERS
INTRODUCTION
During our analysis, the services identified a number of problems they felt constrained the size of the JDAL. Some do constrain JDAL size, whereas others are unrelated to JDAL size. Although each might make it more difficult to support any JDAL, the services have policy options available. For example, the number of positions that are awarded JDA status because they have significant joint content does not affect the numbers, grades, or skills of positions in organizations outside an officer's own service. The policy choice is which posi- tions—inside and outside the service—get priority for fill with certain officers, whether on the JDAL or not. In this chapter, we assess the identified problems and how those problems may or may not make supportability more difficult (but do not constrain the number of positions given joint duty credit).
ASSIGNMENTS: NUMBERS, GRADE, AND SKILL OF OUTSIDE-SERVICE PERSONNEL AUTHORIZATIONS
The services currently face supportability problems in the broad context of assigning officers. The supply of officers is less than the total demand for officers, both in total numbers and by grade and skill. The total demand for officers comes from service organizations and from organizations outside the services. When supply does not equal demand, the services must set "priority" rules to determine which demands are satisfied. Information from the services and the Joint Staff suggests that approximately 85 percent of the positions on
11

12 How Many Can Be Joint? Supporting Joint Duty Assignments
the current JDAL have an officer assigned, a percentage not dissimi- lar to the services' fill rates for their own positions.
The Problem of Numbers of People
In all the services, there are too few people for positions that the ser- vices are supposed to fill. This is not a new problem, nor one that is uniquely caused by including certain positions on a JDAL. Number of positions on the JDAL is not an issue of adding or deleting overall authorizations for officers; it is an issue of apportioning outside- service positions between JDA and non-JDA. Moving a position to the JDAL does not create a new demand for an officer and, likewise, removing a position from the JDAL does not lessen the demand on the services for personnel. For example, the Marine Corps has recog- nized this in its own study of supportability by stating that a differ- ently sized JDAL will not alter the ability of the joint commands to obtain officers with needed skills and grades but will only modify the types of officers who receive joint credit. Regardless of whether a position is designated as a JDA, the services should be filling autho- rized positions (programmed manning1) with people of the right grade and skill.
Moreover, the services claim an inability to fill joint duty positions during a drawdown period in which people are being involuntarily and voluntarily separated. The reason for this seeming conundrum is that end strength (people) is currently decreasing faster than the number of overall positions. This only exacerbates the long-standing problem of more positions than people. Thus, the services cannot fill all positions because there are fewer people than positions.2 The decision of which positions will remain empty while others are filled, however, reflects the service priorities, and can be adjusted to fill joint duty positions.
1 See Appendix A. 2Department of Defense, FY1995 Manpower Requirements Report, May 1994, and its several appendices contain data that demonstrate this as well as the distribution of grade inventory against requirements.

The Broader Issues of Supportability: Assignments and Careers 13
The Problem of Numbers by Grade
Given programmed manning, each service distributes grades across those positions. Required grades are the number of positions that require an officer in the grade shown. Grade shortages can occur for two reasons: (1) an absolute shortage of officers or (2) a maldistribu- tion of grades, in that the service has enough officers in the aggregate but not of the correct grades.
The Army, Air Force, and Marine Corps lack enough officers to meet stated needs, particularly at the grades of 0-4, 0-5, and 0-6, where as of FY 94 they have 85 percent, 81 percent, and 91 percent of their programmed grade strengths, respectively. The Navy has a maldis- tribution of officers among the grades, with proportionally more 0-5 and less 0-4 than authorized. Aggregate grade strengths for all ser- vices are shown in Figure 2.1. In total, the services have authorized about 100,000 positions in the grades of 0-4 to 0-6, of which about 12,000 or 12 percent are outside-service positions.
60,000
50,000
40,000
RANDMR593-2.1
S 30,000 o a.
20,000
10,000 -
I I Authorized
I I Endstrength
0-6 0-5
Grade
0-4
Figure 2.1—Endstrength Versus Programmed Manning

14 How Many Can Be Joint? Supporting Joint Duty Assignments
The Problem of Numbers by Skill
The services lack officers with the skills required by the JDAL for sev- eral reasons. There are instances in which the requirements of the JDAL change more quickly than the skill composition of the service. As an extreme example, the services are unlikely to be able to fulfill the requirement for Middle East specialists immediately, given the sudden change from the need for Soviet intelligence specialists. The services are additionally constrained by the skills of junior officers. It takes time not only to train a Middle East specialist but to develop an officer into the 0-4 or 0-5 required for the JDA.
In another scenario, the services may have the officers with the skills required by the billet, but these officers may not have JPME qualifi- cations. This problem has decreased significantly as the services have changed their policies for selecting JPME attendees, who now better reflect the skill requirements of JDAs. It is worth noting, how- ever, that the current JSO population is, to some degree, a reflection of the JPME selection process of several years ago, which was less proactive in selecting attendees with the appropriate skills.
Figure 2.2 shows that position career fields in the grades of 0-4 to 0-6 outside the services do not exactly match those within the services. Particular differences are seen in three DoD occupational codes—tactical operations, intelligence, and scientists and profes- sionals, which includes educators. DoD policy requires that the services develop officers to fill all positions, so skill shortages should be ameliorated over time. However, especially in periods of rapid change, skill shortages can occur as the mix of skills required—in and outside service—changes.
Often, concern about lacking the correct kind of people for the JDAL is a reassertion of the quality distribution problem. In other words, the services may have officers with the necessary skills, but they are not the kinds of officers that the services will promote at a high rate, and thus not the kinds of officers they want to assign to joint billets or select for JSO because of the promotion policy objectives. We will examine the impact of promotion policy in the next chapter.

03
35
30
25
20
© o o3 15
10
5
The Broader Issues of Supportability: Assignments and Careers 15
RANDMR593-2.2
33%
I I Services 0-4-0-6
EZ3 Outside-service 0-4-0-6
24%
15%
6% I
13% 14% 14% 12%
Tactical Intelligence Engineering Scientists Administrators Supply, operations and and procurement,
maintenance professionals allied
Figure 2.2—Estimated Distribution of Selected Occupations
CAREERS
To ensure that general and flag officers are well-rounded in joint matters, the law requires that officers complete a JDA before they are promoted to the grade of 0-7. Furthermore, many of the general and flag officer positions on the JDAL are designated as critical billets. The law requires that these critical positions be filled by Joint Specialty Officers (who have not only completed a prior joint tour, but have also completed JPME).
The requirement of a prior joint tour before promotion to 0-7 and the need to ensure that promotion objectives are met require careful management of officer careers and of the officers assigned to JDAs. Service personnel managers must identify all officers with a chance of promotion to general and flag rank and ensure that they have a joint tour. Also, they must select officers for assignment to JDAs such that the "quality" officers are shared between the services and the joint world.

16 How Many Can Be Joint? Supporting Joint Duty Assignments
Is there an opportunity cost to sharing "quality" officers? Certainly, if the services are providing more quality officers to outside-service billets after the Goldwater-Nichols legislation than before, the ser- vices could claim the cost is a drain of quality officers from their own billets. In the aggregate, across all services, approximately 16 percent of 0-6s, 17 percent of 0-5s, 11 percent of 0-4s, and 3 percent of 0-3s serve in outside-service billets at any given time. Not all of these outside billets need to be filled with quality officers, only an equi- table share of those on the JDAL.3 The other relevant question is which billet—inside or outside service—that is filled with a quality officer provides the greatest overall military effectiveness. A study that answers these questions has not been done to our knowledge, and this study was not designed to do so. However, one might infer that Goldwater-Nichols mandated the sharing of quality officers between, for example, the loint Staff and service headquarters (irrespective of the "cost" to the service) because of the view that Joint Staff billets provide at least equal military effectiveness to ser- vice headquarters billets and more effectiveness than other service billets.
Fitting Joint Tours into Officer Career Paths
Career paths have to be carefully managed because all officers are required to serve a joint tour to be eligible for promotion to G/FO. Thus, all quality officers should have a joint tour. (However, the con- verse is not true—not all officers assigned to joint tours need to be quality, only an equitable share.) While each of the services has its own definition of what constitutes a "quality" officer, we infer from Goldwater-Nichols a quite simple definition: Quality officers are those who are promoted to the next higher grade. Before the fact, quality officers are those who are most likely to be promoted to the higher grade. The assignment choices are (1) which officers will serve in outside-service positions, (2) which will serve in outside-
3Because there are approximately six years between promotions and tour lengths average about three years, many more officers can be rotated between inside- and outside-service billets than the percentages imply. There is also a cumulative effect in that most officers serve only one outside-service tour and therefore the proportion of officers with such tours increases at higher grades.

The Broader Issues of Supportability: Assignments and Careers 17
service JDAL positions and thus get joint credit, and (3) when those assignments will occur.
While services want officers identified as strong candidates for gen- eral and flag officer rank to receive a joint tour, they also may have difficulty finding time for officers to serve such a joint tour, much less attend Joint Professional Military Education (JPME) and serve a joint tour. The services feel that there are service-specific experiences, such as unit command, that are more important to an officer's ca- reer. However, a choice must be made to trade a nonservice tour for a joint tour. Another study4 examined alternative career structures that might make it easier to accommodate more diverse experiences in careers. For example, longer careers would make it easier for all officers to fit joint assignments into careers, because it would allow joint assignments to be additive rather than substitutive for some- thing already on the career path. However, within the current career lengths, a joint tour must be "fit into" the career path for quality offi- cers, which means that such an officer will serve one less service tour and another officer will serve one less joint tour.5
Many officers feel that joint assignments can be fit into their careers. Only 31 percent of officers surveyed6 who answered the question agreed or strongly agreed with the statement that it is difficult to fit a joint duty assignment into the normal career path. Moreover, 62
4Harry J. Thie and Roger A. Brown, Future Career Management Systems for U.S. Mili- tary Officers, RAND, MR-470-OSD, 1994. 5Questions of marginal impact are not addressed here. For example, a quality officer who would have served an outside-service tour prior to Goldwater-Nichols (as many quality officers did) would see no difference in his career path. A quality officer who would not have served prior to Goldwater-Nichols does see a changed career path. But so does the officer who is now displaced from a joint tour into a service tour. In all cases, assignments remain a zero-sum game: the total number of them does not change but at the margins one officer is "switching" an assignment with another. However, it is not in reality a direct assignment switch because the detailers (assignment managers) adjust priority of fill for quality officers to meet overall desired service priorities for such fills. Under Goldwater-Nichols, there is likely to be a marginal gain of quality to the joint world, but it should only be to a level of quality equal to the service world's, and it only changes to the extent that equality did not previously exist. 6The survey was sent to over 15,000 positions identified as candidates for joint duty assignments. The majority of officers surveyed are currently serving in joint positions. Appendix D provides more detail on the opinion questions contained in the survey and the responses to these questions.

18 How Many Can Be Joint? Supporting Joint Duty Assignments
percent of officers who answered an additional question agreed or strongly agreed (another 18 percent were neutral) with the statement that they expected their present assignment (outside-service) to con- tribute significantly to performance in future service assignments. Additionally, the Air Force found that in their volunteer assignment system, the joint jobs that were difficult to fill were those that did not get joint duty credit.
The relevant question for supportability is, "Does a large or a small JDAL make it easier to fit a JDA assignment into the career paths of a fixed number of quality officers?" The answer is that it is easier to fit joint assignments into career paths of quality officers if there are more such assignments with joint credit (but without a larger num- ber of overall outside-service assignments) because there is greater flexibility for assignment managers (detailers). It is easier to choose the billet and the timing for the assignment. Thus, the more joint positions that exist, the easier it becomes to qualify the needed num- ber of officers under Goldwater-Nichols to constitute a sufficiently large selection pool for promotion to G/FO. Designating more of the outside-service positions as joint (but not increasing the number of positions outside the services or the number of quality officers who need such assignments) provides greater flexibility for personnel assignment managers. There are more positions available for the fixed number of quality officers, and more officers who serve in an outside billet can receive joint credit. In addition, an increase in the number of joint positions to receive JDA credit would alleviate current morale problems. These problems exist because of the large number of officers serving in joint positions who do not receive joint credit.7
To minimize the time spent away from service-specific experience, several of the services meet the joint requirement by assigning cer- tain officers to a JDA as a Critical Occupational Specialty (COS) Exception JSO Nom.8 As a result, the officer receives credit for a joint
7Only 16 percent of the officers surveyed during the demand portion of this study dis- agreed with the following statement: "Morale problems will exist if joint duty credit is awarded for some positions in my immediate organization but not others." See Table D.30. 8Officers with certain warfighting skills can be JSO Noms without having first com- pleted JPME. These are COS Exception JSO Noms. At least one service designates ev-

The Broader Issues of Supportability: Assignments and Careers 19
tour and helps fill the JSO Nom billets required by the 50 percent rule, without having attended JPME. In addition, COS officers are re- quired to serve only two years—rather than three—in the billet.9
However, although a single joint tour as a COS Exception JSO Nom does fulfill the minimum requirement for promotion to G/FO, it does not qualify the officer for many of the highest-ranking outside- service positions, which require a JSO. Table 2.1 shows the high proportion of general and flag officer billets that require a JSO. Thus, while an officer who serves a brief joint tour as a COS Exception JSO Nom is eligible for promotion to G/FO, many higher-ranking positions to which they might be assigned require the officer to have attended JPME.10 However, most of the general and flag officers have attended senior service college. If the services differentially assigned officers with a previous COS Exception tour (but not JPME II) to National War College (NWC) or Industrial College of the Armed Forces (ICAF), the services could increase the number of general and flag officers qualified for a JSO designation.
Table 2.1
General and Flag Officer IDAL Billets
0-7 0-8 0-9 O-10
JDAL JSO JDAL JSO JDAL JSO JDAL JSO
Total 115 28 Percentage 6% 1.4%
75 33 11% 5%
31 21 20% 14%
20 19 58% 55%
NOTE: Percentage compares that grade.
DAL and JSO (critical) positions with all positions at
ery COS officer as a JSO Nom during the initial JDA tour. Although this exceeds the 12.5 percent that may be credited toward fulfilling the Goldwater-Nichols 50 percent requirement for JSOs and JSO Noms in JDAs, it is perceived as benefiting morale. Conversely, any officer, whether serving as a JSO Nom or not, who serves a full tour in a JDA meets the eligibility requirements for promotion to general or flag officer rank. 9This is referred to as a "COS takeout," whereby a COS officer serving in a JDA may be given credit for a full joint tour after only two years in the position. Although the constraints on the numbers of COS exceptions (that can be counted toward meeting JSO/JSO Nom requirements) and COS takeouts is the same (12.5 percent of the JDAL), that does not mean that the two are equivalent or synonymous. 10While the JPME requirement can be waived, the total number of waivers cannot exceed 10 percent of the total promoted in that grade. Given the small numbers of of- ficers promoted to the higher grades, the waiver is not a good bet.

20 How Many Can Be Joint? Supporting Joint Duty Assignments
SUMMARY
The shortages of people in the aggregate and by grade and skill are not caused by the JDAL and will not be affected by changing the size of the JDAL. DoD policy requires that all authorized positions be filled, and the size of the JDAL does not change the number of au- thorized positions. Goldwater-Nichols did not create additional billets for officers; it only specified that certain positions in organiza- tions outside the services be designated as "joint." If the joint desig- nation is removed from a position, the demand remains (although the service priority to fill the position may change); likewise, desig- nating a position as a JDA does not create an additional demand. While services may have fewer personnel than billets, and while there may be some degree of difficulty developing and assigning offi- cers of the appropriate grade and skill to billets, these problems are not directly affected by the size or composition of the JDAL. The extent to which each of the services assigns the correct officers to outside-service billets (including JDAs) is, in the end, a matter of priority.
When services express concern that they have trouble scheduling an officer both to attend JPME and to serve in a joint billet, they implic- itly mean that it is hard to fit both positions in because other experi- ences are thought more important. Finding time for joint assign- ments is necessary for promotion to 0-7. Additionally, finding time for joint education is necessary for that officer to serve later in many of the general and flag officer billets. Providing this qualification to the needed number of promising officers in the most flexible way for the services would argue for the largest list otherwise supportable by the services.
We next examine how promotion policy comparisons affect support- ability of the JDAL, how the calculations used for the promotion comparisons are flawed, and how these comparisons should be changed to meet the intent of Goldwater-Nichols more accurately.

Chapter Three
MANAGING QUALITY OFFICERS TO MEET PROMOTION OBJECTIVES
BACKGROUND
If all quality officers need to serve joint assignments, it follows that these officers must be identified and managed to that end. The Goldwater-Nichols legislation mandated certain promotion policy objectives to measure compliance with the objectives of sharing quality officers and not disadvantaging officers with joint experience. Because the promotion comparisons are at best complex and at worst invalid, certain misperceptions and behaviors exist that make management of quality officers more difficult than it need be. These practices appear prudent given the promotion measurements, but are actually contrary to the overall objectives of Goldwater-Nichols. Among the misperceptions are that all officers in joint tours have to be quality (promoted) and that an officer needs a joint tour to be promoted (below 0-7). Among the counterproductive behaviors is refusing to designate quality officers in the "Other Joint" category of assignments as JSOs because such designation will make it more dif- ficult to meet the promotion comparison mandated by law.
Goldwater-Nichols mandates that certain promotion policy objec- tives be met to achieve the objectives of ensuring distribution of quality officers between joint and service positions and not disad- vantaging those who have served in JDAs.1 The comparisons are to
1There is evidence that this is succeeding. Only 31 percent of officers who answered the survey question agreed or strongly agreed with the statement that officers in a JDA
21

22 How Many Can Be Joint? Supporting Joint Duty Assignments
be made by grade and competitive category and are shown in Table 3.I.2
In general, we concluded, as discussed below, that the comparative promotion statistics are complex and hard to comprehend, inconsis- tent over time and across services, and may not present a true pic- ture of compliance with Goldwater-Nichols objectives. Moreover, they can lead to certain counterproductive practices in designation of JSOs and their assignment to JDAs. For example, a service might influence the promotion comparison of JSO to Service HQS by desig- nating as a JSO an officer who has the necessary qualifications and who is likely to be promoted, but without the intent of using this offi- cer in a future joint assignment. Or a service might not designate as a JSO an officer who is serving in a position in the Other Joint category and who is likely to be promoted because that officer would then no longer count as a selectee in the Other Joint category. Or a service might attempt to ensure meeting the objective by assigning only likely-to-be-promoted officers to all, or most, JDAs. While the latter might be welcome by joint organizations, it was not the intent of Goldwater-Nichols to assign quality officers disproportionately to joint positions. Goldwater-Nichols was designed to compel the ser- vices to share quality officers and not disadvantage officers who had joint experience.
The promotion objectives do not affect the size of a JDAL because, in the extreme, the services could adjust their own promotion processes to achieve the objectives. But doing so might require significant
Table 3.1
Current Promotion Comparisons
JSO > Service HQS JS > Service HQS
Other Joint > Board Average
are not as competitive for promotion as their contemporaries in comparable service positions. See Table D.20. 2Chairman of the Joint Chiefs of Staff Instruction 1330.02, January 7, 1994, prescribes the format and rules for the comparisons.

Managing Quality Officers to Meet Promotion Objectives 23
cultural changes in some services and create counterproductive per- sonnel management practices in others. Thus, we examined alter- native comparisons within existing law and policy, as well as changes to law or policy, to make promotion comparisons either more valid3
or simpler—while still hewing to the Goldwater-Nichols objectives. Certain changes might discourage using counterproductive practices in designating JSO and assignment of officers.
MAKING PROMOTION POLICY COMPARISONS MORE VALID
We examined three changes:
• Using skill-based comparisons;
• Reporting annual promotion board data and the boards' moving averages; and
• Changing categories for comparison.
While the theoretical merits of using skill-based comparisons to im- prove validity are difficult to achieve in practice for the reasons stated below, reporting moving averages and changing categories for comparison do make the measurements more valid.
Using Skill-Based Comparisons
The services state that skill distributions affect the validity of results because officers in certain skills are likely to be selected for promo- tion at higher rates, which can skew overall comparisons. As the fol- lowing example demonstrates, it is true that if certain skills with below-average selection rates (or vice versa) represent a greater pro- portion of their service's joint promotion eligibles than of their total service promotion eligibles, they can bias aggregated comparisons.
3We use validity in two senses. The first is statistical validity. To achieve legitimate comparisons, the cell sizes—the numbers of officers in numerators and denominators of percentages—must be large enough. While there is no exact number that holds in all cases, 30 is often used as a rule of thumb. The other type of validity deals with measuring what is intended, which in this case is compliance with Goldwater-Nichols objectives.

24 How Many Can Be Joint? Supporting Joint Duty Assignments
As shown in the notional example of Table 3.2, a service did not achieve, in the aggregate, the required measure of other joint pro- motions equal to or greater than the promotion board average. However, when the data are disaggregated into two skills, the com- parisons are favorable. The objectives were achieved, but the math- ematics of combining the skills causes the skill with the greater num- bers to "overweight" the aggregated data.
One way to solve this skill imbalance problem that affects the validity of results is to make the comparisons by skill. This might be effected by using more competitive categories as the Navy does, by using promotion floors as the Army does, by disaggregating into COS and non-COS skills for comparison, or by comparing individual service skills.
Currently, comparisons are required by competitive category. A ser- vice Secretary may define as many competitive categories as desired. Once defined, promotion competitions take place at each grade within these competitive categories. Different selection rates may apply to each competitive category. The Navy uses approximately 13 competitive categories for the Goldwater-Nichols promotion com- parisons.4 The other services each tend to use one large category.5
So one suggestion would be to use more competitive categories as the Navy does to better achieve skill comparisons.
Another suggestion would be to use floors within a competitive cate- gory for joint duty service as the Army now does for particular skills.
Table 3.2
Notional Promotion Comparisons
Other Joint Board Average
Considerec Selected Percent Considered Selected Percent
Total
Skill A Skill B
150
50 100
70
30 40
47
60 40
350
200 150
180
120 60
51
60 40
4In the future, the Navy will have all COS officers in one competitive category.
There are additional competitive categories used by the Navy and by the other services, but these are not part of the Goldwater-Nichols comparisons.

Managing Quality Officers to Meet Promotion Objectives 25
Uniquely among the services, the Army uses promotion floors by skill within a competitive category to ensure that sufficient fully qualified officers of a certain skill are selected to meet requirements for that skill in the higher grade. After officers are judged on a best-qualified basis, the Army determines whether the skill floors have been met. If not, the most-qualified officers of the needed skill are placed on the list and displace officers of another skill. This continues until all floors are met. (At one time, the Army also did this for minority and gender purposes.)
In some respects, the Army does through skill floors what the Navy does through competitive categories: makes skill-based selections. If the difficulty in achieving promotion objectives is related to offi- cers being disadvantaged by joint duty (e.g., a service is not suffi- ciently crediting the joint experience), a service could use a promo- tion floor to select officers who are serving in, or who have served in, JDAs to ensure that the correct number of officers are selected to meet the goal. Although this would meet the promotion objective comparison after the fact, it would not necessarily achieve the objec- tive of ensuring an equitable distribution of quality in joint assign- ments if the problem was a quality maldistribution.
The Marine Corps does not use the skill floor concept as directly as the Army, but precepts for its promotions boards have introduced a similar concept for meeting the promotion policy objectives. An ar- ticle in Marine Corps Gazette6 discusses such use, as well as the trend to making more skill-based comparisons for promotion.
The third suggestion is to use skill comparisons for the promotion policy objectives. This potential change in the law is derived from the previous two suggestions. Rather than creating and using multi- ple competitive categories or mandating JDA floors within competi- tive categories, the nature of the comparison would be changed from "grade and competitive category" to "grade and skill." Allowing the comparison to be made by skill resolves the skill distribution issue and places emphasis more directly on the objectives of sharing qual- ity and not being disadvantaged by a joint assignment. Skills could be aggregated by such categories as the one-digit Air Force level or by
Major Paul L. Tomlinson, "How Joint Officer Management Legislation Is Dividing Our Officer Corps," Marine Corps Gazette, October 1994, pp. 25-31.

26 How Many Can Be Joint? Supporting Joint Duty Assignments
Army branch. Alternatively, the DoD occupational codes at the one- digit level might be used, or it could be a COS versus non-COS com- parison.
All these suggestions have procedural disadvantages that make them difficult to implement. For example, if more competitive categories were used by the other services, more promotion boards would have to be convened. Also, the cultures of the other services are not as tuned to multiple competitive categories as the Navy's is. Addi- tionally, if discrete skill comparisons were made, depending on grade and service, such skill comparisons could lead to small cell sizes that do not yield meaningful comparisons.
To test these suggestions, we examined data from four promotion boards in two services and aggregated the data in different ways. Based on that examination, it is not clear that skill-related compar- isons, as a rule, would improve validity. While completely disaggre- gated skill comparisons would be the most valid if large enough cell sizes of officers considered for promotion existed, such cell sizes do not exist in reality. For example, for an Army promotion board, 4 of 16 branches had fewer than 30 officers considered. Small cell sizes become even more obvious when the total considered for promotion is spread into the appropriate organizational category. For example, every Army branch but one in the Joint Staff category had fewer than 10 officers considered for promotion, and the one exception had only 16 officers; in the JDA category, all branches had fewer than 40 offi- cers considered and 11 of 16 had fewer than 30.
Additionally, aggregating skills on some basis to create meaningful cell sizes for comparison depends for validity on consistent homo- geneity of the aggregations with respect to promotion outcomes. Our examination of skill aggregations (e.g., COS versus non-COS) leads us to conclude that, as a rule, there are not consistently ho- mogenous promotion results. For example, in the Army board with an overall selection rate of 44 percent, COS selection rates ranged by branch from 57 percent to 28 percent, whereas non-COS selection rates by branch ranged from 71 percent to 27 percent.
We were unable to find any practical way to disaggregate by skill that led to more valid comparisons. At some grades and at some times, COS skills have higher promotion rates, while at other times, they do

Managing Quality Officers to Meet Promotion Objectives 27
not. In some categories used for comparison, certain Army branches have higher promotion outcomes; in others, they do not. While us- ing skill comparisons has theoretical value, the value is difficult to achieve in reality. However, we leave this potential improvement open; if a service is able to disaggregate skills in a valid way, the idea has merit.7
Reporting Annual Board Data and the Boards' Moving Averages
Variations over time in the quality of officers assigned to joint posi- tions and the randomness of the process may result in occasionally missed promotion objectives unless an inordinate number of quality officers are assigned. Using moving averages over several years can overcome year-to-year variations and randomness, eliminate small cell sizes, and provide a truer picture of service compliance with Goldwater-Nichols objectives.
One of the difficulties suggested to us is that for any particular pro- motion board, the level of "quality" of officers with joint or service duty might be different from a past or future promotion board. Also, quality at time of promotion includes performance in the current assignment, and performance above or below expectation might dif- fer between joint and service duty. In essence, the distribution of quality or of promotion requirements is not consistent over time. Thus, a service could be legitimately achieving the objectives if mea- sured over a longer period of time, even though it may not be doing so for one particular promotion board. Additionally, in some ser- vices, only small numbers of officers are in the zone for comparison, and this can skew percentage comparisons because of the small cell sizes.
Certain measurement techniques are well suited for comparing data over periods of time. Allowing the comparative statistics to be calcu- lated on the basis of a three- , four- , or five-board moving average dampens the board-to-board fluctuations that might occur as part of normal promotion processes. With a moving average, data from the
7The Air Force has recently adopted a new skill coding scheme that may allow for valid cell sizes.
28 How Many Can Be Joint? Supporting Joint Duty Assignments
most recent board are added to the promotion comparison and data from the oldest board are removed. The moving average is the basis for the comparison. The change represents a way to "tune" the mea- surement system, but a service would still have to meet the promo- tion comparison for most years to achieve a moving average compar- ison. Adopting moving averages does eliminate the small cell size and year-to-year variation problem, but it makes the comparisons themselves more oblique, because each board would no longer be directly observable. For that reason, we believe that the services should provide both current and moving averages to demonstrate compliance with Goldwater-Nichols.
Changing Categories for Comparison
Goldwater-Nichols mandates the comparison of officers in certain categories to determine compliance with the stated objectives of sharing quality officers and not disadvantaging officers who serve in joint positions. These comparisons were shown in Table 3.1. The following discussion evaluates each of the three current promotion policy comparisons for their relation to the objective, their validity, and potential changes and improvements. In addition, we recom- mend how these measurements should be calculated, to prevent fu- ture confusion and inconsistency.
Change JSO > Service HQS to JSO > Non-JSO (Service School Graduates). The first comparison is designed to assess whether offi- cers with joint experience and education are disadvantaged because of the time in their career spent acquiring this experience.8 Thus, the comparison measures whether JSOs are promoted at an equal or greater rate than those officers who have served in Service HQS. A JSO retains the designation for his entire career, whether or not he
8The design of this first comparison as established in Title X may be interpreted by some to suggest that Goldwater-Nichols intended all JSOs to be quality officers. However, the original language of the committee, which preceded the specific promotion comparisons, indicates that JSOs were not necessarily intended to all be quality officers. Rather, the joint specialty was designed to ensure the joint experience and joint education of a certain number of the officers serving in joint assignments. Should JSOs serve on the Joint Staff, they are required to be of a quality commensurate with officers serving on the headquarters staff, but that is measured in a later comparison.

Managing Quality Officers to Meet Promotion Objectives 29
has served in a joint position since his last promotion. Thus, the JSO designation is assigned to a particular individual. In contrast, the Service HQS designation is applied only to officers who have served in such billets within the grade being promoted. Thus, the mea- surement of JSO to Service HQS is a nonequivalent comparison be- tween individual officers designated throughout their careers and officers identified by particular billets. This person-to-billet compar- ison is difficult to satisfy and is not necessarily indicative of whether JSOs are being disadvantaged compared to officers without the joint experience and education. Thus, we recommend revising the com- parison to measure JSOs against a peer group of non-JSOs. The rele- vant peer group could be all non-JSOs who have attended interme- diate or senior service school in residence because almost all JSOs have this characteristic. This equivalent comparison would accu- rately assess whether JSOs are being disadvantaged by their invest- ment in a joint experience compared with a well-defined peer RTOUD of non-JSOs.
To calculate this measurement, the data base of officers being con- sidered for promotion is split into JSO and non-JSO. Officers who have been designated as JSO at any time in their career are counted appropriately as considered and selected. Non-JSO officers who have attended intermediate or senior service school in residence are similarly counted, and the two mutually exclusive groups of officers are compared. The percentage of each of these officers being pro- moted is reported. The suggested comparison is shown below:
JSOs > non-JSOs (service school graduates),
which is calculated as
JSOs promoted ^ non-JSOs (svc school grads) promoted JSOs considered non-JSOs (svc school grads) considered
for promotion for promotion
The data base is recombined following this comparison.
Continue to Use Joint Staff > Service HQS but Clarify the Cal- culation. The second two comparisons are designed to ensure that the services share their quality officers with the joint community This objective assesses whether Joint Staff billets have been filled by

30 How Many Can Be Joint? Supporting Joint Duty Assignments
quality officers at an equal or greater rate than billets in Service HQS. This is an equivalent measurement; it compares individuals identified by joint staff billets to officers identified by Service HQS billets. This billet-to-billet comparison should continue unchanged.
We will clarify the mechanics of this measurement, however. First, any officers who have served neither in the Joint Staff nor in their Service HQS are eliminated from consideration. Next, the officers who have served on the Joint Staff and/or the Service HQS are tallied, by billet, in either or both categories as many times as is appropriate. For example, if an officer served two Joint Staff tours and once in Service HQS, he is counted three times. (The purpose of this comparison is to assess the number of times that quality has been assigned to either organization; thus, whether two quality officers are assigned to the Joint Staff or one quality officer serves two tours is irrelevant.) This provides the denominators for each side of the comparison. Next, those officers who have served in either Joint Staff or Service HQS billets and who have been promoted are counted to provide the numerator. Once again, officers are counted as many times as they served in either organization. If the example officer discussed above was promoted, he is counted three times in the numerators also: twice in the joint staff numerator and once in the Service HQS numerator. The resulting comparison is shown below:
Joint Staff > Service HQS,
which is calculated as
JS billet fills by officers Svc HQS billet fills by officers who were subsequently who were subsequently
promoted > promoted Total JS billet fills by " Total Svc HQS billet fills by
officers considered for officers considered tor promotion promotion
Change Other Joint > Board Average to Any Joint > All Other. This final comparison was designed to measure aspects of both objec- tives First, that officers who served in less prestigious joint organi- zations than the Joint Staff were not disadvantaged upon their return

Managing Quality Officers to Meet Promotion Objectives 31
to the service, and second, that these joint organizations other than Joint Staff were receiving their appropriate share of quality officers. Unfortunately, the current design of the comparison masks whether the services are actually meeting these objectives. Currently, both JSOs and Joint Staff officers are eliminated from the left side of this comparison. But they are included on the right side, within board average. Thus, if high-quality JSOs are serving in joint organizations other than Joint Staff, the services do not receive any credit. To the extent that Joint Staff officers and JSOs are promoted at higher rates (and in the boards we examined this was true), it becomes difficult, if not impossible, to achieve this comparison.
We recommend that this comparison be altered to reflect actual as- signment and promotion behavior more accurately. Changing the comparison to compare all officers who are serving or have served as a group at current grade in a joint billet other than Joint Staff against all officers who served in a service billet other than Service HQS pro- vides a more valid assessment of service policies and behavior. Joint Staff billets and Service HQS billets have been excluded because they are explicitly addressed in the previous comparison, and because the typically higher promotion rates of those officers may distort the comparison. However, of the total group being compared, the num- ber of officers with service on the Joint Staff and officers with tours in Service HQS is reasonably small,9 so that including them in the mea- surement should minimally change the result; it would be slightly more indicative to exclude them. However, for the sake of making the comparison simpler while still improving the validity of the com- parison, we propose that all officers who have served in a joint billet be compared against all other officers.
To satisfy this measurement, the services will have to send some share of quality officers to all joint billets and promote the officers who served in joint positions at the same rate at which they promote officers who do not serve in joint positions. If, however, the compar- ison is not satisfied, it will provide inferences, but not specific rea- sons, as to the inappropriate policies/behavior. For example, this measurement will confirm whether or not officers with joint service
9For example, in one service 10 percent of candidates to the grade of 0-6 had served on the Joint Staff, whereas 30 percent of such candidates had served in Service HQS.

32 How Many Can Be Joint? Supporting Joint Duty Assignments
have been disadvantaged, but it will not clarify whether officers with multiple joint tours have been disadvantaged. Likewise, it will not measure whether quality officers were assigned to joint billets more often than they were assigned to service billets; it will only measure whether quality officers were assigned to joint billets at all.
To make this comparison, the complete data base would be split into two mutually exclusive categories: officers who served in at least one joint billet, and officers who did not serve in any joint billet. The de- nominator of the joint figure would be all officers who served in joint billets, each counted only once, regardless of how many joint tours they served. Of that group, those who were promoted would com- prise the numerator. Once again, each officer is counted only once. Likewise, the denominator of the nonjoint figure would include all officers considered for promotion who had not served in a joint billet within that grade. The numerator is the subset of these officers pro- moted. Each officer is counted only once in the numerator and once in the denominator. The resulting comparison is:
Any joint > All other,
which is calculated as
Officers who served in at least Officers who did not serve in one joint billet and who any joint billet and who were
were subsequently promoted subsequently promoted Officers who served in at least _ Officers who did not serve in
one joint billet and were any joint billets and were considered for promotion considered for promotion
The revised promotion comparisons are shown in Table 3.3.
Table 3.3
Recommended Promotion Comparisons
Current Comparisons Recommended Comparisons JSO> Service HQS JSO>non-JSO JS > Service HQS JS > Service HQS Other Joint > Board Average Any joint > all other

Managing Quality Officers to Meet Promotion Objectives 33
MAKING COMPARISONS SIMPLER
We examined two changes that would make comparisons simpler— limiting comparisons to promotion to 0-5 and 0-6 and combining promotion zones—and believe both changes can simplify the entire process of measuring compliance to the Goldwater-Nichols objec- tives of sharing quality and not disadvantaging officers with joint ex- perience.
Limiting Comparisons to Promotion to 0-5 and 0-6
If 0-3s are included on the JDAL, they should be excluded from pro- motion comparisons because of considerations dealing with their management and their promotions from 0-3 to 0-4. 0-3s would not likely be JSOs, and our data show that 0-3s have no billet requirements on the Joint Staff and very few on the OSD staff. Thus, the only meaningful comparison would be Other Joint (which included unified commands and defense agencies) to Other Service. Moreover, there is precedent for excluding 0-3s; 0-3s are excluded from the 50 percent JDAL fill rule. Finally, since there has been limited time to identify quality officers before the grade of 0-4, it is difficult to make conclusions about sharing quality and disadvantaging officers before that grade. Thus, little information is gleaned about the Goldwater-Nichols objectives by including 0-3 to 0-4 promotions.
Promotion to grade 0-7 and above could also be excluded, since other provisions of Goldwater-Nichols require joint experience at selection for G/FO rank. In the future, 100 percent of such promo- tions should be from those with joint experience. Moreover, the cell sizes above the grade of 0-6 become progressively smaller, making valid comparisons unlikely. For these reasons, the meaningful grades for comparative purposes to determine if Goldwater-Nichols objectives are being met appear to be promotion to 0-5 and to 0-6. Alternatively, since waivers are allowed, the number of "good of the service" waivers that excuse the lack of joint experience for promo- tion to 0-7 should also be included in the report as a measure of compliance.

34 How Many Can Be Joint? Supporting Joint Duty Assignments
Combining Promotion Zones
The above- and below-zone categories are difficult to compare statis- tically because of the small numbers of officers selected from each. The promotion comparisons should follow the logic used in OSD promotion opportunity calculations.10 Only officers in the promo- tion zone should be included in the denominator of promotion com- parisons. Above- and below-zone selectees should be added appro- priately to in-zone selectees to create the numerator that is divided by the in-zone considered to get the percentage selected. This pro- vides the most useful information about the sharing of quality and not disadvantaging those with joint experience.
CONCLUSIONS ABOUT MANAGING QUALITY
The services could be forced to achieve existing promotion policy objectives using the currently specified comparisons. However, the cost of doing so requires changing long-standing service procedures for promotion and continuing counterproductive practices in desig- nating and assigning JSOs. In addition, the current measurements will fail to indicate when services are actually meeting some of the Goldwater-Nichols objectives. Achieving the Goldwater-Nichols ob- jectives could be measured, and the existing service promotion pro- cedures could be continued, if the promotion policy objectives and comparisons were changed to be simpler and more valid.
We recommend the following changes to the law:
• Compare officers with the joint specialty to a peer group of offi- cers without it;
• Compare officers in any joint duty assignments to peer group of- ficers in all other assignments; and
• Compare only to grade 0-5 and 0-6 promotions.
10DoD Directive 1320.12, Defense Officer Promotion Program. Promotion oppor- tunity benchmarks are expressed in terms of selections as a percentage of in-zone eli- gibles, with recognition that above- and below-zone selections are at the expense of in-zone eligibles.

Managing Quality Officers to Meet Promotion Objectives 35
The remaining suggestions could be implemented by the services by altering DoD policies.
These changes would improve both personnel management of qual- ity officers and compliance with the Goldwater-Nichols objectives to make a JDAL of any size more easily supported. The remaining con- clusions and recommendations in this analysis assume that the promotion comparison problems discussed herein are resolved. The next chapter discusses JSO and JSO Nom issues that constrain JDAL size.

Chapter Four
PRODUCING SUFFICIENT JSOs AND JSO NOMs FOR
JPME ALLOCATIONS
BACKGROUND
The services designate JSOs in sufficient numbers to fill JSO require- ments (essentially, the critical positions) and generally are reluctant to designate more JSOs than needed because of the promotion tracking reporting requirements discussed earlier. Thus, JSOs are selected as need is perceived, and that need is related to filling va- cancies in critical JDA positions. The constraint to the number of outside-service positions that receive joint credit is the number of JSOs and JSO Noms the services can produce, which is generally not the number currently being selected. Service assignment policies for JPME graduates have improved considerably during the past year. However, in many cases the positive results of these policy changes, such as an increase in the efficient use of JPME graduates, is not yet evident in JSO production because of the four- to seven-year lag from cause to effect.1 Our analysis reflects these current, improved policies.
It takes approximately three to four years to fulfill the JSO requirements for JPME and a JDA. However, most officers serve a service tour while they are being selected and approved as JSOs. Thus, it takes 4 to 7 years for an officer to become eligible and serve as a JSO.
37

38 How Many Can Be Joint? Supporting Joint Duty Assignments
Here, we demonstrate that:
• JSOs and JSO Noms present separate production problems;
• Services can produce sufficient JSOs to fill the 1000 critical bil- lets;
• JSO Noms constrain the size of the JDAL; and
• JSO Noms are constrained by JPME throughput.
This chapter discusses why and how the services develop JSOs and JSO Noms, quantifies the service production capability, and relates that production to the supportability of a JDAL.
WHY JOINT SPECIALTY OFFICERS ARE PRODUCED
Before attempting to understand how joint specialists—which in- clude both JSOs and JSO Noms—are produced, it helps to understand why they are produced. Although the focus is on individual officer experience, the intent appears to be directed toward improving the overall experience level of joint organizations. This was expressed during the preliminary hearings of the Goldwater-Nichols legislation as the following:
Given the demanding nature of joint duty assignments, it would ap- pear appropriate to establish a joint duty career specialty. This would provide an opportunity to develop a small cadre of military officers who have demonstrated abilities for and interest in joint duty. This cadre would provide for better continuity, more objec- tivity, and greater experience in the handling of joint matters.2
Thus, Goldwater-Nichols established a new classification of officers to enhance the stability and increase the joint experience of officers in joint assignments, as well as to enhance the education of officers in joint matters and strengthen the focus of professional military ed- ucation in preparing officers for JDA positions. JSOs were to be "particularly trained in and oriented toward joint matters." The un-
2Defense Organization: The Need for Change, Senate Print 99-86, Committee on Armed Services, United States Senate, October 16,1985, p. 227.

Producing Sufficient JSOs and JSO Noms for JPME Allocations 39
derlying rationale for joint specialists is to provide experienced offi- cers in joint assignments.
Services select their own JSO Noms.3 Two types of officers fit the JSO Nom category. The majority of JSO Noms are officers who have completed JPME and are serving in their first joint tour. Title IV also provided special considerations for "warfighters," specifying that the Secretary of Defense identify those types of officers who needed to concentrate on developing, maintaining, and then passing on to others specific warfighting skills. The services had argued strongly that these critical occupational specialty (COS) skills were critical and complex and that time away from such operational (i.e., service) billets would quickly cause those skills to deteriorate. It was there- fore established that officers who possessed these skills could qualify as a JSO Nom without the required JPME education.4 Table 4.1 shows the current specialties in each of the services that qualify as COS.
Goldwater-Nichols requires 50 percent of the positions on the JDAL above the grade of 0-3 be filled by JSOs or JSO Noms.5 The law al- lows the services to fill not more than 12.5 percent (25 percent of the 50 percent) of the total JDAL positions with COS Exception JSO Noms (COS officers who have not completed JPME but who have been designated as a JSO Nom).
HOW THE SERVICES PRODUCE JSOs AND JSO NOMs
There are four paths or career tracks that lead to a JSO designation, as displayed in Figure 4.1. The typical path is the top one: an officer attends JPME first, serves a joint duty tour as a JSO Nom, and even-
3JSO Noms, as well as JSOs, are entered into the Joint Duty Assignment Management Information System (JDAMIS), which tracks officers with joint experience in compli- ance with the Goldwater-Nichols legislation. 4Officers with a COS were also allowed to leave their initial joint assignment after 24 months. That two-year assignment would fulfill the tour requirement for JSO, and, as will be discussed shortly, it would fulfill the JDA tour requirement for appointment to general and flag officer. In addition, COS officers were also permitted to reverse the order of the prerequisites needed to become a JSO. That is, COS officers could first serve in a JDA and then attend a JPME school in order to be selected as a JSO. 5We will refer to this constraint as the "50 percent rule."

40 How Many Can Be Joint? Supporting Joint Duty Assignments
Table 4.1
Current Critical Occupational Specialties
Army Air Force Navy Marine Corps
Air Defense Artillery Air Weapons Dir. Aviation Artillery3
Artillery Missile Operations
SEALs Aviation
Armor Navigator Special Operations3
Engineers
Aviation Operations Mgmta
Submarined Infantry
Combat Engineers Pilot Surface Tanks/AAV
Infantry Space Operations3
Air Control/ Support
Special Operations Anti-aira
SOURCE: Secretary of Defense, Annual Report to the President and the Congress, January 1993, Table D-2. Specialties with a severe shortage of trained officers.
tually is designated a JSO. The vast majority of officers on this path go directly from JPME to a JDA. A small number of JPME graduates (the percentage varies by service) serve a service tour after complet- ing JPME, and may or may not subsequently serve a joint tour.
Another path that can lead to an officer becoming a JSO is for COS officers to serve a joint tour first and then attend JPME. Although three of the four services appear to use the maximum number of COS Exceptions (12.5 percent of the JDAL), few COS Exceptions (approximately 10 each year from all the services) actually attend JPME after their joint tour. Thus, most COS officers who serve as JSO Noms do not become eligible for selection to JSO.
These first two paths are notable for several reasons. First, the first path produces the majority of JPME attendees. Second, these are the only two paths that produce JSO Noms. In addition, the first path creates the majority of JSOs.

Producing Sufficient JSOs and JSO Noms for JPME Allocations 41
*>*
Service tour
JPME 1 JDA tour as JSO nom -<
JDA tour as JSO nom/COS
Exception JPME —
JDA tour JPME
JDA tour
JDA tour
1
\
RAHDMR593-4.1
Figure 4.1—Four Ways To Be Designated a JSO
The last two paths are less frequently used, and require a waiver by the Secretary of Defense. One is essentially similar to the COS Exception path and is appropriate for non-COS officers who served in a JDA and later in their career attended JPME. The other path is for an officer who qualifies by completing two joint tours without attending JPME. This path is particularly suited to officers who have a specialty in high demand on the JDAL (but not in their service). The number of out-of-sequence and two-tour waivers cannot exceed 10 percent of the number of same-grade JSOs selected for that fiscal year.

42 How Many Can Be Joint? Supporting Joint Duty Assignments
JPME as a Prerequisite to JSO/JSO Nom
With the exception of the fourth path above, JPME is a prerequisite for JSO/JSO Noms. JPME Phase II is the joint professional education required prior to selection as a JSO. JPME II is also required for des- ignation as a JSO Nom (excluding COS Exception JSO Noms). To preclude confusion, when we subsequently refer to "JPME," we are referring to JPME Phase II.
Four curricula satisfy the requirement for JPME II: Armed Forces Staff College (AFSC) Intermediate, Armed Forces Staff College Senior, the National War College (NWC), and the Industrial College of the Armed Forces (ICAF). Both of the AFSC courses require completion of a service college at the intermediate or senior level (JPME Phase I), and both courses are three months long. NWC and ICAF programs are approximately ten months long and satisfy all requirements for JPME I and II. Quotas for each of the courses for 1994 are shown in Table 4.2.
The two AFSC courses are structured to accommodate 900 students annually. The current allocation of 792 seats is a reflection of insuf- ficient manning of military faculty positions. The services have re- quested higher quotas for students, but additional faculty needed to support the higher quotas have not been assigned. The Military Education Policy Document (MEPD),6 the guiding policy of the Chairman of the Joint Chiefs of Staff for military education, specifies that AFSC should achieve a student-faculty ratio of not more than 4
Table 4.2
1994 JPME Quotas by Service
Curricula Army Navy Air Force Marine Corps Total
NWC 43 30 41 11 125
ICAF 60 43 58 11 172
AFSC (Int) 240 150 273 39 702
AFSC (Sr) 21 39 24 6 90
Total 364 262 396 67 1089
6Chairman of the Joint Chiefs of Staff, Military Education Policy Document, CM-1618- 93, March 1993.

Producing Sufficient JSOs and JSO Noms for JPME Allocations 43
to 1 for quality instruction. Although some of the faculty shortages at AFSC are being addressed by hiring civilians, there will continue to be insufficient faculty to support the MEPD stated maximum annual AFSC student throughput of 900.7 Language in the FY 1995 Authorization Act required upgrading AFSC's war-gaming and library facilities to make them comparable to service colleges. Construction of a war-gaming center would add classroom space, thus increasing the physical capacity of the college.
AFSC Intermediate quotas are allocated proportionate to a service's representation on the JDAL. However, as we will see later, continua- tion rates, assignment policy, the allocation of critical billets, and other factors also affect a service's need for JPME quotas. Senior course quotas (AFSC, NWC, and ICAF) reflect a balance between service requests and school capacity.
The current JPME process—i.e., the requirement for JPME I and JPME II—is the direct result of the Skelton Report,8 the major rec- ommendations of which were incorporated into the FY 1990 Defense Authorization Act and into the MEPD. Changes to the JPME process were put in place in the last quarter of FY 1990, which means that the graduates of those initial classes were finishing their initial 36-month JDA tours at the end of FY 1993. Thus, although the policies have been in place for at least four years, officers who have fulfilled the educational requirements have only recently become available for joint service and eventual selection as a JSO.
JSOs AND JSO NOMs PRESENT SEPARATE PRODUCTION PROBLEMS
As we examined the various problems stated by the services (and obvious from current service policies and practices), it became evi- dent that JSO production is actually two separate problems. The services need to develop sufficient numbers and types of JSOs to fill
7The current throughput maximum of 900 is apparently based on the number of seminar rooms and the difficulty in optimizing a schedule that depends on input from schools graduating students from ten-month programs. 8Committee on Armed Services, House of Representatives, Report of the Panel on Military Education of the One Hundredth Congress, 101st Congress, 1st Session, Committee Print No. 4, April 21,1989.

44 How Many Can Be Joint? Supporting Joint Duty Assignments
critical JDAs, but they also have to have sufficient JSO Noms to fill noncritical JDAs. These problems are interrelated, but the dynamics of the two problems are not immediately evident. That is, every change to the available quantity or types of JSOs or any change to the number of critical positions they fill has an impact on the noncritical portion of the JDAL and on the JSO Noms required to fill these posi- tions. Likewise, any change to the size of the pool of JSO Noms will affect the services' capability to select JSOs.
To examine the problems of JSO and JSO Nom development, we de- veloped a system dynamics model to represent the current and po- tential future service policies pertaining to these processes. The model was intended to identify the JSO and JSO Nom production ca- pability, highlight the dynamics between the processes, and identify policy changes that affected the services' capability to support a JDAL.9 A more detailed explanation of the model and data used for each service is provided in Appendix C.
Several insights emerged from using this model. First, while the ser- vices have associated their perceived problem in developing JSOs with the quantity of JPME quotas, it is actually the number of JSO Noms that is directly constrained by JPME. This is discussed in detail below. In addition, whereas more JPME quotas would alleviate some of the JSO Nom shortage, in fact more efficient JPME selection and post-JPME assignment policies recently developed by the services have improved the availability and numbers of JSO Noms considerably.
Second, JSO Nom figures are easily calculated, because the number of JSO Noms is directly related to JPME, the development process is relatively short, and the assignment to a JDA is often inherent in the selection to JPME. JSO production is less obviously apparent and is highly dependent upon other factors, such as officer retention rates, for each of the services.
9Service-speciflc versions of the model were developed using data provided by each of the services. Where possible, we familiarized analysts from each of the services with the model assumptions, calculations, and output. Where assumptions differed, the model was altered to reflect the service comments.

Producing Sufficient JSOs and JSO Noms for JPME Allocations 45
Third, the requirements for JSOs and JSO Noms are interactive. Because JSOs are selected from JSO Noms, any reduction in JSO Noms decreases the pool from which JSOs are selected. In addition, some billets, the noncritical JDAs, can be filled by either JSOs or JSO Noms. Less obviously, but perhaps more important, reducing the number of critical billets does not measurably affect the ability to support the overall JDAL, because the previously critical positions will either be filled by JSO Noms or, given limited numbers of JSO Noms, will likely still be filled with JSOs.
SERVICES CAN PRODUCE AN ADEQUATE SUPPLY OF JSOs TO FILL 1000 BILLETS
Title IV specified that the Secretary designate at least 1000 of the positions on the JDAL as Critical Joint Duty Assignment (CJDA) posi- tions that must be filled by JSOs. These positions were to be identi- fied by examining each joint duty position and designating those for which, considering the duties and responsibilities of the position, it was "highly important that the occupant be particularly trained in, and oriented toward, joint matters." Congress allowed the services to select a number of "transition" JSOs based on their prior duties and experience. These transition JSOs initially filled the critical bil- lets and still remain a large segment of all the JSOs within the indi- vidual services.
The services require "sufficient" JSOs to fill critical billets, but there are varying opinions of what is "sufficient." In general, the services seemed to agree that they could not operate with a selectivity ratio10
of less than 3:1 (i.e., three officers who could be assigned for each critical billet). 5:1 would make it easier to fill the billets, and 7:1 or more was better. Model results displayed in Figures 4.2 through 4.5 indicate that the services can accumulate enough JSOs (or officers eligible to be selected as JSOs) to fill the critical billets for which they are responsible with at least a 5:1 selectivity ratio, which should be
10Analysts in some of the services use this concept to measure supportability, and we have extended the concept into our all-service analysis. The selectivity ratio repre- sents the number of officers—either JSOs or those eligible to become JSOs because they have met all requirements except formal designation—available to fill all critical positions.

46 How Many Can Be Joint? Supporting Joint Duty Assignments
RANDMR593-4.2
o
2,000
1,800
1,600
1,400
1,200
1,000
800
600
400
200
0
- Navy ^rTTTT/ffi ^B - 1B1III -
V//A JSO eligibles
1 1JSOs
I i I i ! i I i I i I r I i I ill 1 I 1 I 1 _i_
7:1
3:1
1 3 5 7 9 11 13 15 17 19 21 23 25
Years in future
15
o
ö o
to IT
Figure 4.2—Navy JSOs/JSO Eligibles
RANDMf)593--f.3
3,500
3,000
2,500
2,000 =.
1,500
1,000
500
0
Army
&m JSO eligibles
I IJSOs
' ' ' ' ' ' ' ' > . I . I . I , I i I , i i i ,
1 3 5 7 9 11 13 15 17 19 21 23 25
Years in future
Figure 4.3—Army JSOs/JSO Eligibles

Producing Sufficient JSOs and JSO Noms for JPME Allocations 47
RMIDMRS93-4.4
o
03
E
1 3 5 7 9 11 13 15 17 19 21 23 25
Years in future
Figure 4.4—Air Force JSOs/JSO Eligibles
800 RAUDMR593-4.5
400
300
200
100
0
V77Z JSO eligibles
F~1 JSOs
■^"•'- '"■■' ''' ' ' ' '•"'' "■'-•='«" -■ ■"' ' ' ' ' ■■'■ ' ■
7:1 M
5:1 o 3:1 I rr
1 3 5 7 9 11 13 15 17 19 21 23 25
Years in future
Figure 4.5—Marine Corps JSOs/JSO Eligibles

48 How Many Can Be Joint? Supporting Joint Duty Assignments
sufficient. This means there are at least five officers available to fill each critical billet. The graphs indicate—in the shaded areas—the projected pool of JSOs, given a continuation of current policies. Additionally, the pool of officers who will be eligible for JSO is repre- sented by the cross-hatched areas. Eligibles are officers who have completed JPME and a joint tour but have not been selected for JSO.
There are several caveats to the graphical representations. The high number of JSOs shown for the current and near-term years is mis- leading. These JSOs include large numbers of transition JSOs, who were, in many cases, selected without adequate attention to the skill needs of critical positions they might fill. Thus, many of the transi- tion JSOs may not satisfy the existing billet requirements. These transition JSOs are also separating from the service at a high rate, which is reflected in the data between years 1 and 7. Thus, the 1998- 2001 period, when most of the transition JSOs will have separated, will be the most difficult for the services to sustain adequate num- bers of appropriate JSOs.11 Because of the time involved to develop a JSO, the current improved policies of the services will not be evident in the future available pool of JSOs for some four to seven years, thus increasing the sensitivity in the near years to having sufficient JSO stocks.
Many of the JSO eligibles in the near term shown in the figures have not been selected as JSOs, because they served joint tours and/or at- tended JPME before the services had enacted their current selective policies. Thus, many of these officers may be deemed inappropriate for JSO selection because of the promotion policy constraints or their skill designation. This is less true of the JSO eligibles shown after the 4-7 year mark. Given the recommended solution to the promotion policy concerns, most of these officers can be considered appropriate for JSO, and thus they can be used to forecast the services' capability to support the critical billets.
The difference among the services is especially evident in Figure 4.3, which displays the Army's capability to produce JSOs and JSO eligi- bles. The Army is the only service that does not recover to better
nIn addition, if any analytical assumptions, such as forecasted separation rates, change, the 4-7 year period might appear less favorable.

Producing Sufficient JSOs and JSO Noms for JPME Allocations 49
than a 7:1 selectivity ratio in the long term. Since Army personnel policies appear similar to the other services, the difference in out- comes suggests that the Army may be responsible for a dispropor- tionate number of critical billets compared with their noncritical billets and their JPME quotas. A comparison of each service's share of critical billets, JPME quotas, and noncritical JDA billets confirms this imbalance. These figures are shown in Table 4.3.
Table 4.3
Distribution of Critical Billets, Noncritical Joint Billets, and JPME Quotas Among the Services
Critical Billets Noncritical JDAs JPME Quota Service (% of total) (% of total) (% of total)
Army 39 35 34 Navy 19 21 24 Air Force 36 38 36 Marine Corps 6 6 6
JSO NOMs CONSTRAIN THE SIZE OF THE JDAL
Because projections indicate that the services will have an adequate supply of JSOs to fill the 1000 critical billets now on the JDAL, the maximum supportable number of joint content positions can be cal- culated from the ability of the services to produce JSO Noms. This ability depends highly on JPME seats, but is also affected by tour lengths, COS Exceptions, and service assignment policies.
These calculations begin with the 50 percent rule. Because the JDAL12 must be 50 percent filled by JSO Noms and JSOs, the follow- ing equation reflects the JDAL in algebraic form:
112 JDAL = JSOs + JSO Noms
12When we refer to the size of the JDAL, we follow current DoD policy of excluding grade 0-3. A more precise statement would be the number of positions on the JDAL above the grade of 0-3.

50 How Many Can Be Joint? Supporting Joint Duty Assignments
In this case, JSOs represent any JSOs serving on the JDAL, whether in critical or noncritical billets. JSO Noms include both the JPME grads who proceed to a joint billet and COS Exceptions who have not completed JPME but are still serving as JSO Noms. Therefore, the equation can be expressed as:
112 JDAL = JSOs in JDAs + JPME grads in JDAs + COS Exceptions
Whereas the JSOs are supplied from the pools of officers (discussed above) who remain JSOs for the rest of their career, JSO Noms are produced continually and are considered Noms only while they are serving in their joint billet. The number of JSO Noms is constrained by the annual JPME output and the service policies that assign JPME graduates to joint billets. With an average JDA tour length of three years, one-third of the list turns over every year.13 Therefore, the annual JPME output must support one-third of the JDAL, minus those positions filled by JSOs and COS Exceptions. In other words, if the entire JDAL turned over every three years, there would be three years of JPME graduates available to support all the billets. The equation below reflects the dependence upon three years of JPME by inserting a "3" to create the formula for the maximum size of the JDAL.
1/2 maximum JDAL = JSOs in JDAs + 3 JPME grads to JDAs + COS Exceptions
13Title IV initially specified that the duration of JDA tours average at least three and one-half years for field grade officers and at least three years for general and flag officers. These tour lengths were later amended to three years for field grade officers and two years for general and flag officers. Certain exclusions are allowed in calculating tour lengths. Our analysis suggests that total exclusions reduce the actual average tour for all field grade officers serving in JDAs to approximately two years and nine months. Our analysis also indicates that JPME graduates serve an average tour length of approximately two years and 11 months. These calculations are based upon the events within a particular year, and the current tour length exclusions are likely to decrease as the drawdown effort decreases—and hence the number of retirements and separations stabilize—and as overseas JDAs decrease. While year-to-year fluctuations will occur, this analysis has adopted a long-term focus that minimizes the effect of any individual year fluctuations in data. We use three years as a nominal average tour length for this analysis, and address the effect of different average tour lengths upon the size of a supportable JDAL in Table 4.5.

Producing Sufficient JSOs and JSO Noms for JPME Allocations 51
Because the total number of COS Exceptions is limited to 12.5 per- cent (or 1/8) of the JDAL, and very few COS Exceptions return to JPME, the equation becomes:
1/2 maximum JDAL = JSOs in JDAs + 3 JPME grads in JDAs + 1/8 JDAL
Basic algebra provides the following progression of equations:
3/8 maximum JDAL = JSOs in JDAs + 3 JPME grads in JDAs
Maximum JDAL = 8/3 JSOs in JDAs + 8 JPME grads in JDAs
which can be expressed as:
Maximum JDAL = 2.67 JSOs in JDAs + 8 JPME grads in JDAs
This equation reflects the relationship between JPME and the maxi- mum supportable JDAL. Stated more simply, it says that under the assumption that 1000 JSOs serve in critical or noncritical JDAs,14 the maximum JDAL is equal to 2670 plus eight times the number of JPME grads who are assigned to JDAs each year.
This relationship is used to produce Table 4.4, which indicates the maximum JDAL, given different assumptions about JPME output and the service assignment policies for JPME graduates.
Table 4.4
Effect of Assignment Policy on JDAL Supportability
Current JPME Capacity JPME Assignment Policy
JSO Noms
Resulting JDAL
JSO Noms
Resulting JDAL
Maximum (100%) Legal minimum (50%) Realistic (83%)
1,089 545 904
11,382 7,030 9,902
1,197 599 994
12,246 7,462
10,622
14Analysis in the previous subsections demonstrates that there are sufficient JSOs or JSO eligibles for this to be true.

52 How Many Can Be Joint? Supporting Joint Duty Assignments
The maximum number of JPME graduates that could be assigned to JDAs is the total quota of either 1089 (current size of JPME and 100 percent assignment to JDA, as shown in Table 4.2) or 1197 (if JPME is increased to full capacity and 100 percent are assigned to JDA). The 100 percent assignment policy is admittedly an unreasonable expec- tation, given the need for NWC and ICAF graduates within the ser- vices. The legal minimum assignment policy is 50 percent, also shown in the table, and leads to the minimum number of JPME graduates. However, three of the four services assign 80-84 percent of JPME graduates to JDAs immediately following JPME completion. Further, when the JPME graduates who serve in service assignments before assignment to a JDA are included in the numbers, all of the services have a 80-85 percent assignment policy.15 Thus, we have adopted 83 percent as a realistic assignment policy for JPME gradu- ates after education. This policy translates to a 50 percent joint as- signment rate for NWC and ICAF graduates and a 95 percent joint assignment rate for AFSC graduates.
Given the 1994 JPME quota of 1089 and the current 1000 critical bil- lets, the maximum supportable size of the JDAL within current law is approximately 11,380 positions. This number could be increased by 864 positions to 12,246 if the AFSC had the faculty to support the full JPME capacity.16 However, for the reasons stated above, the maximum realistic JDAL within current law and policy is approxi- mately 9900 (given current JPME quotas and assignment percent- ages), or 10,600 if JPME is increased to full capacity with current assignment percentages. The maximum size of the JDAL can be in- creased by moving to higher assignment percentages or to full JPME capacity. It could also be increased by assigning more JSOs to non- critical billets17 or by increasing average tour length. The sensitivity of different tour lengths is shown in Table 4.5, which provides the range of JDALs that would be supportable with different average tour lengths and different JPME capacities. The first row provides the
15See Tables C.4 and C.5. 16We estimate that this would require about ten more instructors. 17The maximum JDAL would increase by 2.67 for each additional JSO assigned to a noncritical position. Conversely, if the number of critical billets were less than 1000 and JSOs were not assigned to noncritical billets, the maximum JDAL would decrease by 2.67 for each such officer.

Producing Sufficient JSOs and JSO Noms for JPME Allocations 53
Table 4.5
Maximum JDAL Resulting from Changes to Policy or Parameters3
JDAL JDAL JDAL Resulting Resulting Resulting
from from from Reduced Current Capacity
Resulting JPME of JPME of JPME of Tour Length Equation 980 1089 1197
2.75 years MaxJDAL = 2.67 JSOs in (2 years, 9 JDAs + 7.33 JPME grads in months) JDAs 8,632 9,296 9,952
3 years MaxJDAL = 2.67 JSOs in JDAs + 8 JPME grads in JDAs 9,177 9,902 10,622
3.25 years MaxJDAL = 2.67 JSOs in (3 years, 3 JDAs + 8.67 JPME grads months) in JDAs 9,722 10,508 11,284
aAssuming 1000 JSOs serving in JDAs and 83 percent assignment of JPME graduates to JDAs.
supportable JDAL with an average JDA tour length of 2.75 (two years, nine months) for JPME graduates given the current JPME quotas, a reduced capacity, or the increased capacity. The next two rows pro- vide the figures for average tour lengths of 3 years and of 3.25 years (three years, three months). Given the expressed difficulty of fitting a joint tour into a career, however, we do not view increasing the aver- age tour lengths to longer than three years as a likely means of sup- porting a larger JDAL.
Moreover, the maximum supportable JDAL could be increased even further by changing the law as it pertains to any combination of
• alternative means for meeting the JPME requirement;18
18For example, if officers in one service who attended either the intermediate or senior service school of another service were given credit for JPME, the maximum JDAL could increase by a factor of eight for each such officer who followed his or her education with a JDA.

54 How Many Can Be Joint? Supporting Joint Duty Assignments
• decreasing the 50 percent requirement for JSOs and JSO Noms in JDAs;19and
• increasing the maximum allowable percentage of COS Excep- tions to above 12.5 percent.20
The impact of these potential changes is shown in Table 4.6, which includes potential changes to the law, the resulting equation express- ing the maximum JDAL, and the resulting maximum JDAL. The magnitude of these changes could be increased for a much larger JDAL. These numbers are intended only as an example of the maxi- mum JDAL that could become supportable with fairly small changes to the current law.
Table 4.6
Maximum JDAL Resulting from Changes to the Law
Change to Law Resulting Equation Resulting
JDALa
40% rule (rather than 50%) MaxJDAL = 3.64 JSOs in JDAs + 10.91 JPME grads in JDAs 13,501
20% COS Exceptions MaxJDAL = 3.33 JSOs in JDAs + 10 JPME grads in JDAs 12,369
40% rule and 15% COS Exceptions
MaxJDAL = 5 JSOs in JDAs + 15 JPME grads in JDAs 18,558
aAssuming 1000 JSOs serving in JDAs and the current JPME quotas and assignment policy.
CONCLUSIONS ABOUT SIZE OF JDAL THAT CAN BE SUPPORTED
With this set of assumptions about assignment policies, tour lengths, COS Exceptions, and JSOs, the services could realistically support approximately 9900 positions on the JDAL above the grade of 0-3,
19If the requirement were 49 percent, the equation would become Maximum JDAL = 2.74 JSOs in JDAs + 8.22 JPME grads in JDAs. If the requirement were 40 percent, the equation would become Maximum JDAL = 3.64 JSOs in JDAs + 10.91 JPME grads in JDAs. 20If the COS Exception percent were increased to 25 percent, the equation would become Maximum JDAL = 4 JSOs in JDAs + 12 JPME grads in JDAs.

Producing Sufficient JSOs and JSO Noms for JPME Allocations 55
given the current law and policy. The maximum realistic support- able JDAL above the grade of 0-3 could increase to approximately 10,600 if AFSC throughput increased to its originally planned levels.
Moreover, there are policy alternatives or alternatives that require changes to law that would allow the services to support all outside- service positions that have joint content. The most reasonable op- tions to accomplish this support would be some combination of changes to the law that would allow for alternative means for meeting the JPME requirement, for decreasing the 50 percent requirement, and for increasing the percentage of allowed COS Exceptions.

Chapter Five
CONCLUSIONS AND RECOMMENDATIONS
CONCLUSIONS
The problems the services have experienced meeting the promotion policy objectives established by Goldwater-Nichols are largely a re- sult of the measurements themselves. The comparisons are compli- cated, oblique, and do not necessarily reflect or measure the actual objectives established by the Goldwater-Nichols legislation. If the measurements were changed to be more valid, the services would have an easier time satisfying them within the objectives framework. Further, the current counterproductive practices in designation and assignment that occur because of the promotion measurements would likely cease. The following supportability conclusions assume the promotion comparison problems discussed in Chapter Three are resolved.
The real constraint on the number of outside-service billets that re- ceive joint credit is the services' ability to produce sufficient joint specialists to fulfill the 50 percent requirement. The demands for JSOs and for JSO Noms are separate but dynamic and interrelated problems. Any reduction in the use of either type of joint specialist increases the demand for the other. Thus, a decrease in the number of critical positions that use only JSOs, without an accompanying de- crease in the total JDAL, will not make the JDAL easier to support. Conversely, if critical positions are decreased, the overall JDAL can stay the same size if JSOs are used in noncritical positions.
Current service policies can produce sufficient JSOs to fill the 1000 critical positions. If the services have difficulties in producing suffi-
57

58 How Many Can Be Joint? Supporting Joint Duty Assignments
cient JSOs, however, the difficulties will arise in the next seven years, before recently improved policies are realized in the pool of available JSOs. The services can also produce sufficient JSO Noms to fill the current JDAL. The maximum JDAL supportable with the current JPME output and service policies is approximately 9900 positions above the grade of 0-3. Thus, the services can adequately support any of the potential JDAL sizes discussed in Who Is Joint? Reevaluating the Joint Duty Assignment List (MR-574-JS), which dis- cusses the demand side of the question of officer management.
The JDAL could be further increased if the existing JPME schools' throughput increased, if alternative credit for JPME were allowed, if more JPME grads were assigned to JDAs, or if more JSOs were assigned to noncritical billets. In addition, if the 50 percent rule were decreased or if the number of allowable COS Exceptions were increased, more positions could receive joint credit. In fact, with minor changes to law and policy such as these, it is likely that the services could support a JDAL including all outside-service positions with joint content. This would increase flexibility in making assignments for officers to become eligible for G/FO and in making it easier to fit a joint assignment into the career path of quality officers; improve the perceived equity of assignments to outside-service positions; and facilitate implementation. Having a larger JDAL would not increase the number of officers experienced in joint matters, because officers are already serving in the outside-service positions that provide joint experience—but are not getting credit for it.
RECOMMENDATIONS
Several recommendations emerge from this assessment. First, in accordance with existing law and policy, the services should implement the largest JDAL supportable with JSOs and JSO Noms (i.e., the services must be capable of filling at least 50 percent of the billets on the JDAL with JSOs or JSO Nominees). Our analysis shows that, within existing law and policy, the maximum list could include as many as 9900 positions above the grade of 0-3. 0-3 and service positions with joint content could increase the maximum size of the list without overly stressing service supportability.

Conclusions and Recommendations 59
Second, were 0-3s to receive joint credit, they should not be in- cluded in the promotion comparisons. 0-3s are too junior in grade to predict their future career performance accurately. 0-3s cannot qualify as JSOs, so the exclusion would not disrupt the JSO promo- tion comparisons. In addition, most 0-3s do get promoted to 0-4. Finally, there is precedent for excluding 0-3s from some joint cate- gories: 0-3 positions are not included in the 50 percent measure of the JDAL that requires JSOs and JSO Noms.
Third, the promotion comparisons should be changed to increase their validity and make them simpler. The reports should include both annual promotion board data and a moving average and should combine the below-zone, within-zone, and above-zone compar- isons. This could be done without changing the current law. Further, the law should be changed to reflect more appropriate com- parisons. The Joint Staff should continue to be compared only to Service HQS; however, JSOs should be compared to a comparable peer group of non-JSOs, and officers serving any joint assignments should be compared only to officers in all other assignments. In addition, the promotion comparisons need only include promotions to grades of 0-5 and 0-6 to provide a valid indicator of whether the services are meeting the objectives of Goldwater-Nichols.
Fourth, all services should strive to assign at least 95 percent of AFSC graduates to a joint billet immediately following completion of JPME. Most of the services already do this and should continue their cur- rent policies.
Fifth, the JPME system should be reevaluated. Increasing the throughput at AFSC or granting JPME credit to alternative educa- tional programs would increase the services' JSO and JSO Nom pro- duction capability.
And sixth, changes to the 50 percent rule and the 12.5 percent limit on allowable COS Exceptions should also be reexamined. These changes would each increase the size of a supportable JDAL.

Appendix A
PROGRAMMED MANNING
The services are in a drawdown period in which people are being in- voluntarily and voluntarily separated, only exacerbating the long- standing problem of more positions than people.1
The DoD uses a concept of programmed manning, which recognizes that 100 percent fill of the programmed manpower structure may not always be desirable or achievable within fiscal and personnel con- straints. Thus, programmed manning represents those billets in the manpower structure that the services plan to fill. Programmed manning is a concept used by all the services, although they have different names for it. The Army uses the term force structure al- lowance; the Navy uses distributable billets; the Air Force uses as- signed strength; the Marine Corps uses chargeable strength.2
Under programmed manning, each service distributes grades across positions. Required grades are the number of positions that require an officer in the grade shown. We have shown in the tables below those grades that comprise the bulk of officers assigned to positions outside their service. Grade shortages can occur for two reasons: (1) an absolute shortage of officers or (2) a distribution of grades such that the service has enough officers in the aggregate but not enough of the correct grades.
department of Defense, FY1995 Manpower Requirements Report, May 1994, contains data that demonstrate this as well as the maldistribution of grade inventory against requirements.
department of Defense, FY 1995 Manpower Requirements Report, May 1994, p. A-2.
61

62 How Many Can Be Joint? Supporting Joint Duty Assignments
The Army, Air Force, and Marine Corps lack enough officers to meet stated needs, particularly at the grades of 0-4, 0-5, and 0-6. See Tables A.l through A.3. The Navy figures in Table A.4 indicate a maldistribution of officers among the grades.
Table A. 1
Army Active Duty Selected Grade Management
Manpower 0-6 0-5 0-4 0-3
FY 94 required 4385 10542 17258 29194
FY 94 beg strength 3892 9188 15538 26592
FY 94 end strength 3851 9015 14638 27664
FY 95 required 4342 10596 16892 27425
FY 95 end strength 3815 9020 14343 26852
FY 95 end strength as % of req 88% 85% 85% 98%
NOTE: Required is defined as the number of positions that require an active duty officer in the grade shown.
Table A.2
Air Force Active Duty Selected Grade Management
Manpower 0-6 0-5 0-4 0-3
FY 94 required 4822 13182 20762 37013
FY94begstr 4351 11181 16758 37181
FY94endstr 4264 10873 16292 34557
FY 95 required 4600 13008 20225 35924
FY95endstr 4138 10680 15985 32008
FY95/FY95req 90% 82% 79% 89%
NOTE: Funded requirements (aggregate billets) are redistributed by grade as authorizations because of the need to meet legal limits on strengths in grade. Required grades are from the January 1994 manpower requirements file and from the FY 93/94 Officer Grades Allocation.
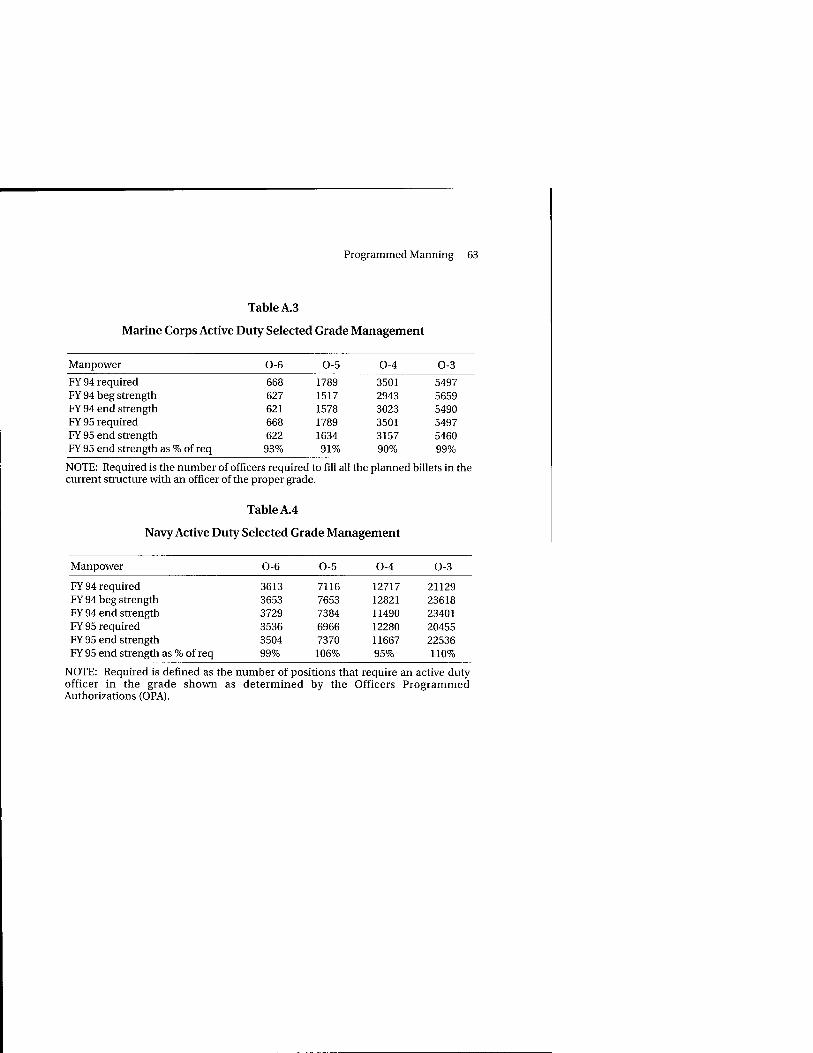
Programmed Manning 63
Table A.3
Marine Corps Active Duty Selected Grade Management
Manpower 0-6 0-5 0-4 0-3
FY 94 required 668 1789 3501 5497 FY 94 beg strength 627 1517 2943 5659 FY 94 end strength 621 1578 3023 5490 FY 95 required 668 1789 3501 5497 FY 95 end strength 622 1634 3157 5460 FY 95 end strength as % ofreq 93% 91% 90% 99%
NOTE: Required is the number of officers required to fill all the planned billets in the current structure with an officer of the proper grade.
Table A.4
Navy Active Duty Selected Grade Management
Manpower 0-6 0-5 0-4 0-3
FY 94 required FY 94 beg strength FY 94 end strength FY 95 required FY 95 end strength FY95 end strength as % ofreq 99% 106% 95% 110%
NOTE: Required is defined as the number of positions that require an active duty officer in the grade shown as determined by the Officers Programmed Authorizations (OPA).
3613 7116 12717 21129 3653 7653 12821 23618 3729 7384 11490 23401 3536 6966 12280 20455 3504 7370 11667 22536

Appendix B
DoD IMPLEMENTATION OF GOLDWATER-NICHOLS
Most of the provisions written into Title IV were not really new. As a 1990 DoD study of its provisions stated:
Almost every provision can be traced back to specific problems, both real and perceived, noted by the Congress over the past forty years. Many provisions that became law existed in DoD policy directives prior to 1986; however, Congress was convinced that these directives were not rigorously followed.. }
The law required the Secretary of Defense to define the term Joint Duty Assignment and to publish a Joint Duty Assignment List of qualified positions. The Secretary of Defense defined a joint duty assignment as
an assignment to a designated position in a multi-Service or multinational command or activity that is involved in the integrated employment or support of the land, sea, and air forces of at least two of the three Military Departments. Such involvement includes, but is not limited to, matters relating to national military strategy, joint doctrine and policy, strategic planning, contingency planning, and command and control of combat operations under a unified command.2
1 Office of the Secretary of Defense (Force Management and Personnel), Report on the Study of Joint Officer Management Initiatives, draft, April 1990, p. 28.
Joint Chiefs of Staff, Joint Officer Management, JCS Admin Publication 1.2, Washington, D.C., June 30,1989.
65

66 How Many Can Be Joint? Supporting Joint Duty Assignments
The original implementation of the law, and the one that is still used today, reflects a compromise aimed at producing a JDAL of approximately 8000 positions. Part of the problem was the degree of uncertainty and subjectivity that surrounded the definitions of joint matters and joint duty assignments. A rather broad-brush approach was taken. Joint assignments were limited to grades of 0-4 (major or lieutenant commander) and higher. This limitation was a DoD policy, since the law specifically allowed 0-3s (captains and Navy lieutenants) to be considered for joint duty credit.
All of the positions at the grades of 0-4 and above at the Joint Staff, the Office of the Secretary of Defense, and the unified commands were placed on the JDAL. Half of the positions at each defense agency were permitted joint credit. The specific defense agency positions on the JDAL were identified by each agency. Finally, the 1000 critical billets were allocated on more or less a fair-share basis to the above organizations. Each organization identified the specific billets that would be considered critical.
The current JDAL has grown to more than 9000 positions. The billets on the list change constantly as organizations add or delete positions. As one benchmark of the JDAL, Table B.l shows the composition of the list by service and grade as of November 1994. The distribution by type of activity for the same time period is shown in Table B.2.
Table B.l
Composition of the JDAL by Service and Pay Grade
Grade USA USN USAF USMC Total
0^1 1103 679 1330 197 3309 0-5 1390 792 1416 246 3844 0-6 602 397 743 74 1716 0-7+ 75 61 78 12 234 Total 3170 1929 3467 529 9103
NOTE: JDAL 94-1, as of November 1994.

DoD Implementation of Goldwater-Nichols 67
Table B.2
Critical Joint Positions by Activity
Percentage of Present Critical Joint Joint Positions That
Activity Joint Positions Positions Are Critical
Combatant commands 4950 513 10.3 Joint Staff 766 90 11.7 OSD 406 25 6.1 Defense agencies 1925 234 12.1 Other joint activities 822 50 6.1 Generals/admirals 234 97 41.4 Total 9103 1009 11.1
NOTE: JDAL94-1, as of November 1994.

Appendix C
JSO/JPME MODEL
INTRODUCTION
The JSO/JPME model represents the process by which each of the services develops Joint Specialty Officers (JSOs). A systems dynamics software package, ithink,1 was used in developing this model for several reasons. First, the software is graphically based and easy to explain. It thus facilitated our interaction with individuals, such as officers from each of the services, who did not have modeling exper- tise but could nevertheless understand our model framework and as- sumptions. Second, using systems dynamics requires an under- standing of the system as it is modeled. Therefore, the development itself taught us a great deal about the JSO process. Finally, the model graphics served as an excellent tool to explain the JSO process to oth- ers.
Overall, the model served two purposes for our analysis: it identified and illustrated the process by which JSOs are developed, and it quantified this same process. The model should be of use to policy- makers or analysts who require an understanding of the processes by which JSOs and JSO nominees (JSO Noms) are developed and used and the tool which supported the analysis represented in the main body of this report.
Following the publication of this work, the model will remain ap- propriate for two different kinds of analysis. In a static environment,
J©High Performance System, Inc. All rights restricted.
69

70 How Many Can Be Joint? Supporting Joint Duty Assignments
with a determined JDAL, the model is a tool that can provide an un- derstanding of the interaction between JSO and JSO Nom processes and the policies pertaining to each process. In these instances, the JSO model could support trade-off analysis to assess the Joint Professional Military Education (JPME) quotas or other service poli- cies. In a dynamic environment, the JSO model can be used to assess lists of different sizes and the degree to which each service could support a new list, given variations in the existing laws, restrictions, and policies, such as those pertaining to the number of COS Exceptions, JPME quotas, and the utility rate of JPME graduates.
This appendix introduces system dynamics theory, explains the as- sumptions and calculations in the model, discusses the input pro- vided by the services and the differences between service policies, and describes some of the relationships between the processes and process elements captured within the model.
BASIC PRINCIPLES OF SYSTEM DYNAMICS
Stocks
Stocks and flows are the primary building blocks of systems struc- tures in systems dynamics. Stocks are most easily explainable as things, or accumulations of things. In the case of the JSO model, stocks represent accumulations of people, such as JSOs. There are, however, different kinds of stocks. The JSO model uses reservoir stocks and conveyer stocks. Reservoir stocks accumulate people until an event is specified. For example, JSOs remain JSOs until they retire or leave the service. Conveyer stocks retain their content only for an established period of time and then empty automatically. A conveyer stock is used to represent joint billets. For example, if the average duration of a joint tour is three years, the conveyer stock rep- resenting joint billets will retain an officer in a joint billet only for three years and will then release him to the next stage of the process. These duration values can, of course, be changed, and they vary from conveyer to conveyer. Figure C.l illustrates the symbols used to rep- resent reservoir and conveyer stocks.

JSO/JPME Model 71
RANDMH593-C.f
Conveyer Reservoir
Figure C.l—Example Stocks
Flows
Flows represent activity, or movement, into and out of stocks. In any representation of a system, stocks and flows are mutually dependent, because stocks can neither accumulate nor empty without a flow. Figure C.2 illustrates a stock, in this case JSOs, with both inflow (selection as JSO) and outflow (retirement or other separation). Because it is not necessary in this example to specify the source of the inflow or the destination of the outflow, cloud symbols are used to begin and end this chain.
Another way to think of stocks and flows would be as "facts" and "policies." In other words, the stocks represent facts that are a result of policies. For example, the number of JSOs is a fact that reflects the policy of the annual number of JSOs selected. Whereas there are some constraints on the number of people who could be JSOs, there is still a range of values possible for the policy of selecting JSOs. The stock of existing JSOs is a reflection of the policy, or inflow, estab- lished to select JSOs. There will frequently be more than one flow, or
QTN>
JSOs
JSO selection (inflow)
0^^ RANDMR593-C.2
^>Q
JSO retirement (outflow)
Figure C.2—Example Flows
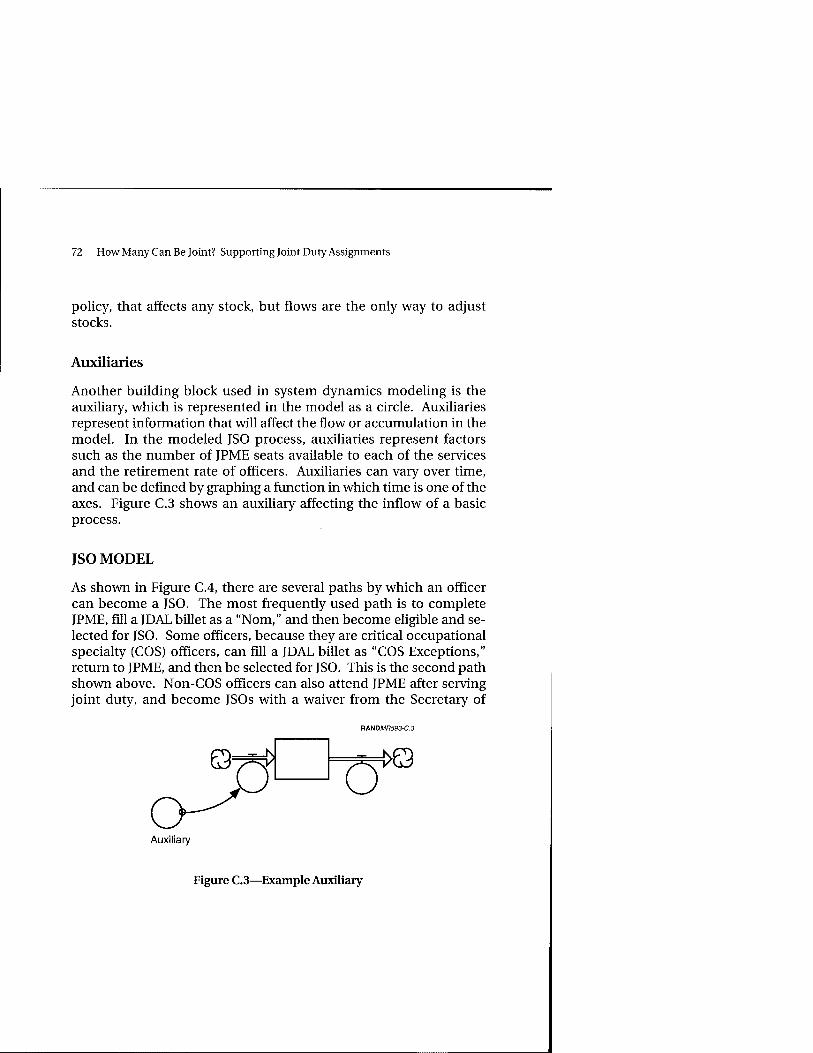
72 How Many Can Be Joint? Supporting Joint Duty Assignments
policy, that affects any stock, but flows are the only way to adjust stocks.
Auxiliaries
Another building block used in system dynamics modeling is the auxiliary, which is represented in the model as a circle. Auxiliaries represent information that will affect the flow or accumulation in the model. In the modeled JSO process, auxiliaries represent factors such as the number of JPME seats available to each of the services and the retirement rate of officers. Auxiliaries can vary over time, and can be defined by graphing a function in which time is one of the axes. Figure C.3 shows an auxiliary affecting the inflow of a basic process.
JSO MODEL
As shown in Figure C.4, there are several paths by which an officer can become a JSO. The most frequently used path is to complete JPME, fill a JDAL billet as a "Nom," and then become eligible and se- lected for JSO. Some officers, because they are critical occupational specialty (COS) officers, can fill a JDAL billet as "COS Exceptions," return to JPME, and then be selected for JSO. This is the second path shown above. Non-COS officers can also attend JPME after serving joint duty, and become JSOs with a waiver from the Secretary of
RMDMR593-C.3
Auxiliary
Figure C.3—Example Auxiliary

JSO/JPME Model 73
Service tour
JPME
1 '
JDA tour as JSO nom
JSO eligibles
JDA tour as JSO nom/COS
Exception JPME COS JSO
eligibles
( JSOs
JDA tour
JPME
r SECDEF
waiver
> *7~ JDA tour
JDA tour
SECDEF waiver
)
RANDMR593-C.4
Figure C.4—Four Ways To Be Designated a JSO
Defense.2 In addition, officers can serve two joint tours and then be selected as JSOs if the JPME requirement is waived by the Secretary of Defense. Because all JSO Noms, and the majority of eventual JSOs, follow the first two paths, those are the processes we concentrated upon in the JSO model, shown in Figure C.5.3
2These officers will not have served as "Noms," given that they were neither JPME graduates nor COS officers at the time of their joint duty. 3In actuality, although several of the services assign maximum numbers of "COS Exceptions" as JSO Noms, very few of these officers return to JPME to become eventual JSOs. This was learned as we gathered data and modeled the process. This path is included in the model because of the large number of Noms in this path, and not because this process produces large numbers of JSOs. It is, however, useful to recognize this path as an effective means of filling the nominee positions, were there a shortage of JPME seats and thus JPME graduates.

74 How Many Can Be Joint? Supporting Joint Duty Assignments
JPME to JDA process RANDMH593-C.5
JPME Slots
JPME Leaks
JPME Grads
JPME
^ JPME, r\
Returns vV Attendees
Retirement and Quit Rate —, Loss and Quit F
Increase in
JSO Eligibles
r~\ JSO yV Separation
Annual JSO
Selects
COS Exception process
Figure C.5—The JSO Model
The model can be divided into three basic processes, which interact to form the larger system portrayed in Figure C.5. The first of these processes is that by which most JSO Noms and JSOs are developed. In this sequence, officers attend JPME, then serve in a JDA as a nominee before becoming eligible for selection to JSO. This is the path shown in the upper-left portion of the model illustration and discussed below as "JPME to JDA process." The path shown in the lower-left portion of the model is that by which COS officers serve in JDAs as Noms without having completed JPME first. This process is referred to below as the "COS Exception process." Finally, the pro- cess shown on the right of the diagram is that by which JSOs are se- lected, accumulate, and attrite. This final process is discussed below as the "JSO process."

JSO/JPME Model 75
JPME to JDA Process
This portion of the model addresses the first path shown in Figure C.4 and results in most of the JSO Noms and JSOs. The officers who follow this in-sequence path attend JPME and then are assigned ei- ther to a JDA or a non-JDA. If they do not serve in a joint billet im- mediately after JPME, they may or may not be assigned to a JDA later in their career. When the officers who serve in a JDA as JSO Noms complete their tour, they are eligible to be selected as JSOs.
Most JSO Noms attend JPME, serve in a JDA as JSO Noms, and then become eligible for selection as JSOs. This modeled process begins with the number of officers sent to JPME. Figure C.6 shows this por- tion of the JPME to JSO process. Note that one element, the COS to JPME flow, is shaded. It affects the JPME Attendance, as will be shown, but is actually part of the COS Exception process, which will be discussed separately.
JPME Attendance represents the number of officers who can be as- signed to JPME. This is influenced by three elements, represented in the model by JPME Slots, Other Attendees, and COS to JPME. JPME
RAHDMR593-C.6
JPME Slots ^^
R JPME Attendance
Other Attendees
COS to JPME
Figure C.6—JPME Attendance in the JPME to JDA Process

76 How Many Can Be Joint? Supporting Joint Duty Assignments
Slots is the number of seats available for each of the services. The JPME quotas used are listed in Table C.l. Other Attendees represents officers attending the school who will not become JSO Noms or con- tribute to JSO development. Examples would include officers who are already JSOs; officers with skills not represented on the JDAL, such as health professionals; and foreign officers. Other Attendees might also represent the small number of unintentionally unused quota, such as officers who do not show. COS to JPME will be dis- cussed in more detail later, but this flow represents COS officers who served in a JDA as COS Exceptions, and then returned to JPME to be- come eligible for selection to JSO. They are deleted from JPME Attendance, because although they do occupy a seat in JPME, they are tracked in a different process of this model.
JPME Attendance is calculated in the model as the total quota of JPME seats available to the service, less the number of Other Attendees and COS to JPME, or:
JPME Attendance = JPME Slots - Other Attendees - COS to JPME
The data used for each of the services, and the resulting value of JPME Attendance, are shown in Table C.2.
The model is continued from JPME Attendance in Figure C.7. JPME Attendance is the inflow to JPME Attendees, a conveyer stock that represents officers currently in JPME. The model calculates in time
Tabled
Annual JPME Quota
Curricula Army Navy Air Force Marine Corps Total
NWC 43 30 41 11 125 ICAF 60 43 58 11 172 AFSC (Int) 240 150 273 39 702 AFSC (Sr) 21 39 24 6 90 Service share of
total quotas 34% 24% 36% 6% Total 364 262 396 67 1089

JSO/JPME Model 77
Table C.2
JPME Attendance
Army Navy Air Force Marine Corps
JPME quota Other attendees COS to JPME JPME attendance
364 6 0
358
262 5 5
252
396 5 2
389
67 4 1
62
RMiDMR593-C7
JPME Slots
JPME Leaks
JPME
"fl
^D Attendees
u
JPME Grads
o JPME Returns
«?=»
3t
^~. «am. ID,n.z JSONoms O * * n™ inJDAs V_W JPME Attendance Grads to
^^__jf \ JDAs
Other Attendees
COS to JPME
Figure C.7—JSO Noms in the JPME to JSO Process
increments of one year, so just as JPME Attendance is the number of seats available in a single year, JPME Attendees represents the offi- cers actually in JPME in a given year. After completing JPME, officers continue to one of two kinds of assignments: either they continue to a JDA as JSO Noms, or they return to a non-JDA in their service. JSO Noms in JDAs is the conveyer stock representing JSO Noms serving in JDAs. JPME Grads represents the accumulation of those officers

78 How Many Can Be Joint? Supporting Joint Duty Assignments
who return to their services after JPME rather than filling a JDA. Some of these officers will serve in a joint position in the future, and therefore there is a flow, JPME Returns, to represent this later joint assignment.
There is one inflow to JPME Attendees, JPME Attendance, which was defined above, and two outflows, JPME Leaks and JPME Grads to JDAs. The duration of JPME Attendees is only one year, so the con- tent of JPME Attendees is always the value of JPME Attendance. All officers have to pass from JPME Attendees to either JSO Noms in JDAs or JPME Grads. The calculation of these flows is vital to under- standing the resources of JSO Noms that each service develops.
The number of officers who proceed from JPME to a JDA was pro- vided by each of the services. Thus, JPME Leaks is calculated as:
JPME Leaks = JPME Attendees - JPME Grads to JDAs
Because JPME Attendees is less than the total quota of seats for each of the services,4 the value of JPME Leaks is calculated from this lesser number rather than from the total quota of JPME for each of the services. Table C.3 shows the values of JPME Leaks for each of the services. For example, the Marine Corps has 67 JPME seats, of which 62 are tracked in the model (see Table C.2). We know that 54 officers continue to JDAs and 8 officers return to their service. Thus, JPME Leaks is set to 13 percent, permitting 87 percent, or 54 of 62 JPME graduates, to pass through JPME Grads to JDAs. This leakage includes the relatively small percentage of officers who attend AFSC
Table C.3
Values for JPME Leaks
Service JPME Attendees JPME Leaks
Army Navy Air Force Marine Corps
358 252 389
62
21% 22%
7% 13%
4As shown in Table C.2.

JSO/JPME Model 79
but do not continue to a JDA as well as the relatively larger percent- age of NWC and ICAF attendees who do not then serve in a joint as- signment. JPME Leaks is represented in the model, and in Table C.3, as a fraction of JPME Attendees. JPME Grads to JDAs, the flow of offi- cers to JDAs following JPME, is the balance of JPME Leaks.
The number of officers continuing from JPME to a JDA is shown in Table C.4 as a percentage of the total JPME quota, for comparison with the legal minimum of officers who must continue to a JDA. The legal minimum is 50 percent of the JPME quota for that service. The difference among the services is notable. Three of the services make efficient use of their JPME graduates, largely through policies that relate selection for JPME to selection for a JDA.
JPME Returns is the flow representing those officers who serve in a JDA at some later point after having filled a service billet. Our dis- cussions with the services indicated that this tends to be a small number for most of the services. The Army, Air Force, and Marine Corps reported two, four, and one, respectively. In short, if officers do not serve in a JDA immediately following JPME, they are unlikely to return to joint duty, largely because of the current efficient use of JPME graduates among these services. Such a high percentage of JPME graduates do fill JDAs that it would be difficult to increase that number. In fact, the three services indicated they send only those officers to AFSC who have already been designated for a JDA. The officers who do not fill JDAs after JPME are mostly NWC and ICAF graduates, who tend to be more senior, and if they do not immedi- ately serve in a joint position, they have less career time remaining in which to do so. The Navy, however, reports that 20 previous JPME graduates return to a joint billet each year. This compensates for the
Table C.4
Officers Who Proceed from JPME to JDAs (JPME Grads to JDAs)
JPME Legal Actual % JPME Service Quota Minimum Number Quota
Army 364 178 291 80 Navy 262 131 196 75 Air Force 396 198 332 84 Marine Corps 67 34 54 81

80 How Many Can Be Joint? Supporting Joint Duty Assignments
Navy's less efficient use of JPME graduates immediately upon gradu- ation. Table C.5 represents the total percentage of JPME graduates who serve a joint tour as JSO Noms following JPME completion. These numbers are different from those in Table C.4 only because they include officers who served in intervening service assignments. Thus, the Navy is the only service that shows a significant increase from Table C.4.5
If officers who have graduated from JPME do not ever serve in a joint billet, they accumulate in JPME Grads until they retire or separate from the service. Thus, as shown in Figure C.8, the outflow from JPME Grads is called Loss, and it is equal to the Retirement and Quit Rate attributed to that service.
The Retirement and Quit Rate was calculated separately for each of the services, based on the current planned loss of officers in the 0-4, 0-5, and 0-6 pay grades, and adjusted according to service downsiz- ing plans.6 In other words, the percentage of 0-4 to 0-6 officers separating from the service was calculated from the Active Duty Officer Management Flow Plan for FY 1994.7 This separation rate was gradually decreased in the near future to reflect the stabilizing likely to occur once the downsizing is complete. The number of years until the separation rate stabilizes reflects the amount of
Table C.5
JPME Graduates Who Serve as JSO Noms
Service JPME Quote i Actual Number % JPME Quota
Army 364 293 80 Navy 262 216 82 Air Force 396 336 85 Marine Corps 67 55 82
5While this number is useful for policy planning, it should not be confused with the legal requirements depicted in Table C.4. In other words, the law requires 50 percent of JPME graduates to serve in a joint billet immediately following JPME. 6There is uncertainty inherent in these loss rates, and any model output should clearly state the loss rate assumptions. 7Department of Defense, Manpower Requirements Report, Manpower Flow Annex, FY 1994, Washington, D.C., June 1993.

JSO/JPME Model 81
JPME Leaks
JPME Grads
RANDMH593-C.S
JPME
JPME Slots
JPME Returns
Attendees
Loss Retirement and
Quit Rate
43SUO O JSO
Increase in Eligibles
JSO Separation
JSO Noms JPME injDAs
JPME Attendance Grads to || _^ JDAs
Eligibles
Other Attendees
{£3
Annual Eligibles JSO
©^X) Loss Selects
JSO Norn Loss
Retirement and Quit
Rate
COS to JPME
Figure C.8—The JPME to JSO Process
downsizing that has already occurred in the particular service. The separation rate calculated from the Active Duty Management Flow Plan (FY 1994) and the loss rates used for the outflow from JPME Grads is shown in Table C.6. The last rate shown is also used for the seventh and later years.
Table C.6
Retirement and Quit Rate (percentage)
Year Army Navy Air Force Marine Corps
Management Plan 11.9 20.94 15.8 12.95 1 (FY94) 12 20 15 13 2 (FY95) 11 15 12 11 3 (FY96) 10 14 10 10 4 (FY97) 10 13 10 9 5 (FY98) 10 12 10 9 6 (FY99) 10 10 10 9

82 How Many Can Be Joint? Supporting Joint Duty Assignments
Let us return to the officers who do serve in JDAs after completing JPME. JSO Noms in JDAs is a conveyer stock, which automatically releases officers after they have served a designated amount of time. The tour length is adjustable, but was assumed to average three years for this study. After those three years, some officers leave the service; the Retirement and Quit Rate shown in Table C.6 is also used as the JSO Nom Loss.
Those officers who complete a JDA following JPME and do not leave the service are eligible to be selected as a JSO. These officers are represented in the JSO Eligibles stock, which accumulates officers until they are selected as JSOs or they separate from the service. Annual JSO Selects8 includes only those officers who have completed JPME prior to serving in a JDA and are then selected as JSOs. This value was provided by the services to reflect their current practice as well as their future intent. The values used are shown in Table C.7.
By the time an officer has completed JPME and a JDA, he will likely have more years of service than those officers serving in JDAs. In addition, many of the officers who are currently JSOs (or eligible to become JSOs) are senior in their careers and still representative of the transition JSOs. Thus, the loss rate, JSO Separation, applied to JSO Eligibles and JSOs is greater than the Retirement and Quit Rate discussed earlier. Discussions with analysts both inside and outside the services elicited wide variation in potential loss rates for JSOs.
Table C.7
Annual JSO Selects
Army Navy Air Force Marine Corps
138 91
120 49 (or 90% of officers eligible)
aOnly includes officers who completed JPME, served as JSO Noms, and were then selected as JSOs. The table does not, for example, include the out-of-sequence path or any waivers.
8The model can be easily adjusted so that every officer eligible to become a JSO is au- tomatically selected.
JSO/JPME Model 83
While we are generally satisfied with a loss rate about 2 percentage points higher than that used for less senior officers, we are aware that other analysts would recommend a higher loss rate. As stated before, basic assumptions about predicted loss rates are key to any conclusions drawn from the model output. In addition, to the extent that these loss rates can be controlled by service policies—for example, to make continued service more attractive to JSOs—they should be adjusted to reflect the effect of varying policies.
In conclusion, this first process in the model represents those officers who attend JPME and then either serve in a JDA or return to a non- joint tour. If they do not serve in a JDA immediately following JPME, they may be assigned to a joint tour at some later date. If not, they eventually leave the service. If these officers do serve in a JDA and do not retire or separate from the service, they are then eligible to be selected as JSOs. They are either selected as JSOs at a later date, or they eventually leave the service. This describes the in-sequence path to JSO that we have called the "JPME to JDA process."
COS Exception Process
The second process represented within the model by which officers can become JSOs is the "COS Exception process," shown earlier in Figure C.5. Officers with a Critical Occupational Specialty designa- tion can serve in a JDA as JSO Noms, without first having completed JPME. To become eligible to be a selected as a JSO, however, they have to return to JPME. Having completed both a JDA and JPME, they become eligible to be selected as a JSO. The following discus- sion details the assumptions and calculations of the COS Exception process.
Figure C.9 illustrates the beginning of the COS Exception process. Every year, a certain number of officers assigned to JDAs as JSO Noms are COS Exceptions. Goldwater-Nichols limits the total number of these officers who count as JSO Noms to 12.5 percent of the total JDAL. The remaining officers are counted as part of the 50 percent of the list that does not have to be filled by JSOs or JSO Noms. The value used in the model for COS Exceptions was limited

84 How Many Can Be Joint? Supporting Joint Duty Assignments
RANDMR593-C.9
Noms COS Exceptions in JDAs
COS in JPME
°C7 COS Exceptions
ST"» Ü COS to JPME
COS Leaks
Figure C.9—Beginning of the COS Exception Process
by the 12.5 percent rule.9 Table C.8 shows the annual number of officers assigned to JDAs as COS Exceptions. The difference in values between the USMC and the other three services is notable. Whereas the other services report maximum use of COS Exceptions to have enough JSO Noms, the Marine Corps minimizes their use of the COS Exception policy. This seems to indicate that Marine Corps policies have maximized the use of their JPME graduates in JDAs, and there is enough excess in their JPME share of quotas that they do not need
Table C.8
COS Exceptions
Army 386 Navy 240 Air Force 445 Marine Corps 4
9When queried for the number of COS Exceptions, most of the services reported numbers greater than 12.5 percent of their portion of the list. Although only the 12.5 percent can count to fill the JSO and JSO Noms requirement, the services do not have to determine which officers are counted on which side of the list. Thus, every COS of- ficer can believe himself to be a JSO Nom.

JSO/JPME Model 85
the additional JSO Noms they could designate by assigning officers as COS Exceptions.10
Noms COS Exceptions in JDAs represents the conveyer stock of those JSO Noms in JDAs who are COS Exceptions. The duration of this conveyer can be adjusted to reflect differing policies or assumptions about the average tour length of these officers. If the service makes full use of the "COS takeout" policy, which permits COS officers to serve only 24 months, then COS Exceptions, the annual number of COS officers assigned to JDAs as JSO Noms, will increase to fill the billets as they empty. Adjusting the value of this conveyer does not affect the rate of JSO production.11 It is currently set to a default of three years, so the value of the stock is always equal to three times the input shown in Table C.8.
When COS officers complete their JDA, they might attend JPME to become eligible for selection to JSO. Table C.9 shows that the cur- rent number of COS officers who attend JPME after serving in a JDA as COS Exceptions is very small. These numbers are the values used for COS to JPME.
COS in JPME is a conveyer stock that represents only the officers in JPME who were previously COS Exceptions.12 The COS Exceptions
Table C.9
COS Exceptions to JPME
Army 0 Navy 5 Air Force 2 Marine Corps 1
10Thus, almost all Marine Corps JSO Noms have completed JPME, far exceeding the Goldwater-Nichols education requirements for JSO Noms. 11 If the services sent a large number of these officers to JPME after they completed their JDA, then the rate at which they were sent would increase if their tour duration was decreased. This would increase the proportion of JPME officers who were previ- ous COS Exceptions, but would not increase the capacity or graduation rate of JPME. 12Many officers in JPME before serving a JDA are also COS officers; they are not in- cluded in this stock.

86 How Many Can Be Joint? Supporting Joint Duty Assignments
who do not attend JPME pass through COS Leaks. Because it is not important for this model whether they return to service billets or leave the service, those who retire or separate are not distinguished from the other officers who do not continue to JPME. Thus, COS Leaks = 1 - COS to JPME, and COS to JPME is set by the specific ser- vice data shown in Table C.9.
Once these officers complete JPME, they automatically progress to COS JSO Eligibles, as shown in Figure CIO. COS JSO Eligibles is simi- lar to the JSO Eligibles stock in the other process. COS JSO Eligibles accumulate until they are either selected for JSO or leave the service. Once again, the separation rate used is JSO Separation, the rate also used for JSOs and other JSO eligibles, as discussed above. COS JSO Selects is generally equal to Increase in COS Eligibles. The assump- tion is that the services would not return COS officers to JPME after completion of a JDA unless they were designated for JSO selection. Thus, COS JSO Eligibles does not accumulate many officers.
JSO Process
The entire JSO process is shown in Figure C.ll. The stock of JSOs is increased annually by Annual JSO Selects and COS JSO Selects. The stock of JSOs accumulates officers until they leave the service at the rate of JSO Separation.
Noms COS Exceptions in JDAs
COS in JPME
COS JSO Eligibles
RANDMR593-C. 10
COS Exceptions
COS JSO
COS - Selects
Eligibles Loss \zS
JSO Separation
COS Leaks
Figure CIO—The COS Exception Process

JSO/JPME Model 87
RANDMR593-C.I»
COS JSO Selects JSO Separation
Figure C. 11—The JSO Process
The figures used for JSO Separation are shown in Table CIO. These percentages are slightly higher than the other retirement rates used, because a large number of the current JSOs are transition JSOs at the end of their careers.
MODEL OUTPUT
The JSO/JPME model provides output in graphical and tabular form for any of the stocks or rates. Figure C.12 is the graphical output
Table CIO
JSO Separation (percentage)
Year Army Navy Air Force Marine Corps
1 (FY94) 14 20 17 15 2 (FY95) 12 15 16 14 3 (FY96) 10 14 14 13 4 (FY97) 10 13 12 12 5 (FY98) 10 12 10 11 6 (FY99) 10 10 10 10 7 (FYOO) 10 10 10 9

How Many Can Be Joint? Supporting Joint Duty Assignments
RANDMH593-C. (2
50.00
Figure C. 12—Example Model Output
from the USMC model. The curves are identified by number and la- bels located at the top of the figure. Each curve is charted to a unique Y-axis scale, which is listed along the left side of the graph. The graph shown in Figure C.12 indicates that as the current transi- tion JSOs leave the service, the number of USMC JSOs will drop sharply for the next few years. The decrease then becomes more gradual before the stock finally levels off above 511. The other plot represents the JSO eligibles, officers who qualify for and could be se- lected as JSOs. This model run was based upon an initial value of zero. Thus, the curve representing JSO eligibles represents the de- velopment and accumulation of these officers. This figure is in- tended as an example of the graphical output available from the model. The results from the model runs are provided in Chapter Four.

Appendix D
RESULTS OF RESPONSES TO THE SURVEY'S OPINION QUESTIONS
The survey sent to all candidate positions gathered three types of data. Questions 1 through 11 addressed the attributes of the person filling the position, including grade, service, and skill designations. Questions 12 through 18 asked about the duties and responsibilities of the position, including the amount of time spent working on mat- ters involving multiple services or other nations. Finally, questions 19 through 29 solicited various opinions from the respondents about joint duty assignments. This appendix presents summary statistics on the responses to the opinion questions.
The survey respondents were asked to indicate how much they agreed or disagreed with specific questions by indicating one of the following five responses: strongly agree, agree, neither disagree nor agree, disagree, strongly disagree. For each of the opinion questions, the tables in this appendix summarize the responses in several ways—by grade, by service, by selected DoD occupational skill group, by organizational group, and by whether the respondent is currently on the Joint Duty Assignment List.1 Some small cells are not shown separately in the data but are included in the total of all responses.
Figure D.l summarizes the responses to the opinion questions. It aggregates the "strongly agree/agree" and "disagree/strongly dis- agree" responses and orders the questions by the greatest differences between the two. The tables that follow (D.1-D.39) give more detail
JThe grade, service, and functional skill are the requirements placed on the billet. These may not match the grade, service, and functional skill of the respondent.
89

90 How Many Can Be Joint? Supporting Joint Duty Assignments
20
Percentage
40
Q25: Other service can do job
Q27: Morale hurt if JDA to some
Q28: Job helps for future
Q29: More interest in JDA
Q22: JDA are sought after
Q19:JPME
Mm
«$&•$$$&$.
>.'■■ •?:-.'.-r .. v,-^- .»-:--v.n.y:- --j»>*.!
Q20: Job needs prior JDA ^W^M^M s-^^Wi^W^:^'
X
60
RANDMH593-D.»
80
I I Strongly agree/agree
Q24: JDA loss WkK »';•■,- '■' • ■ : J. . , ■ •■c--"" promotable pvfey;^-?^vu>mj .■?, v>-..^ .y.-.t: .• -1
Q23: JDA noton «, ^■■■■■■HBn career path ligs-^g^v-sVgt1 ■■■»■- ■-. -.< '-'■■xi
Disagree/strongly disagree
Q21:Job
civilianized p^^-:^M^fi^-'-fa#^r-^^&fe^j^sfe'i j
Q26: Job is se,vice ^m^^m^myw^w^^wm^^m^m specific mKvwmmmmj^^m^tmmti^if^vmmmsfwmm'jmiBmsamiw*
Figure D.l—Summary of Responses to Opinion Questions

Results of Responses to the Survey's Opinion Questions 91
about each question and show responses by grade, service, organi- zation, and occupation.
In general, the vast majority of respondents perceived that the billets were fungible across services—that is, an officer of one service could perform the position/responsibility as well as an officer of another service (Q25). This opinion has import in deciding how to allocate billets across services.
Most officers agreed that morale problems will exist if joint duty credit is awarded for some positions in an immediate organization but not for others (Q27). This opinion affects how any JDAL is im- plemented in organizations.
Most officers expect that their serving in a candidate JDAL billet will contribute significantly to performance in future service assignments (Q28). This opinion could be interpreted to mean that the culture of jointness has begun to take hold, because it reflects an opinion that "jointness" matters even in service careers.
A majority of officers believe that their service's interest in assigning officers to JDAs has increased (Q29) and that joint duty assignments are highly sought after by career officers (Q22). These responses also appear to reflect the growing culture of jointness and awareness of the importance of such assignments in careers.
Nearly a majority of officers believe that JPME is essential to performing successfully in this billet (Q19). Slightly more officers believe that the officer in the billet should have had a prior JDA (Q20). For both questions, much stronger agreement exists for billets now on the JDAL. These opinions are useful in assessing criticality of positions in that JSOs are expected to have JPME and a prior JDA before filling a critical billet.
The next two questions must be interpreted carefully because the "disagrees" have a positive impact. More officers disagree than agree that officers serving in a JDA are not as competitive for promotion as their contemporaries in comparable service positions (Q24). Additionally, more officers, and a majority of them, disagree than agree that it is difficult to fit a JDA in the normal career path (Q23). These responses indicate that joint assignments can be made to fit

92 How Many Can Be Joint? Supporting Joint Duty Assignments
into career paths and that officers do not believe they will be disad- vantaged in promotion by such assignments.
While far more officers disagree that the duties and responsibilities of the billet could be performed just as effectively by a civilian, nearly 25 percent of officers agree with this statement (Q25).
Finally, over 70 percent of the respondents disagree that the posi- tion/responsibility requires unique knowledge of one service and could not be performed by an officer of another service (Q26). This is a mirror image of the first question in the figure (Q25) and illustrates the general fungibility of billets across services.
Question 19: Joint professional military education is essential to performing successfully in this billet
Table D.l
Question 19: Responses by Grade
Opinion of Those Who Answered
Strongly Neither Agree/ Strongly No Grade Agree Agree Disagree Disagree Disagree Answer
0-3 7% 23% 23% 32% 14% 1% 0-4 16% 30% 19% 22% 13% 0% 0-5 21% 34% 16% 19% 10% 0% 0-6 26% 35% 16% 17% 6% 1% 0-7+ 20% 41% 17% 16% 5% 0% All 18% 31% 18% 22% 11% 0%

Results of Responses to the Survey's Opinion Questions 93
Table D.2
Question 19: Responses by Type of Organization
Opinion of Those Who Answered
Neither Strongly Agree/ Strongly No
Organization ; Agree Agree Disagree Disagree Disagree Answer
Joint Staff 22% 37% 15% 17% 9% 0% Warfighting CINCs 20% 31% 18% 21% 10% 0% Supporting CINCs , 14% 30% 17% 25% 14% 1% WHSa/OSD : 18% 34% 17% 19% 12% 0% Defense agencies 15% 29% 20% 24% 12% 1% In-service 24% 35% 21% 16% 5% 1% All others 18% 30% 17% 24% 11% 0% All responses 18% 31% 18% 22% 11% 0% aWashington Headquarters Service.
Table D.3
Question 19: Responses by Skill Group
Opinion of Those Who Answered
Neither Strongly Agree/ Strongly No
Skill Group Agree Agree Disagree Disagree Disagree Answer
Tactical operations 21% 32% 16% 21% 11% 0% Intelligence 17% 30% 19% 22% 12% 1% Engineer/maintenance 15% 30% 20% 24% 11% 0% Scientists/professional 18% 32% 19% 20% 12% 0% Supply/procure/allied 17% 31% 19% 22% 10% 1% Administration 14% 29% 20% 26% 11% 1% All responses 18% 31% 18% 22% 11% 0%

94 How Many Can Be Joint? Supporting Joint Duty Assignments
Table D.4
Question 19: Responses by Current Joint Assignment
Opinion of Those Who Answered
Position Strongly Agree Agree
Neither Agree/
Disagree Disagree Strongly \No Disagree Answer
On current JDAL 21% 34% 16% 19% 10% 0% Not on JDAL 12% 27% 22% 27% 12% 1% All responses 17% 31% 18% 22% 11% 0%
Question 20: The person assigned to this billet should have prior knowledge of other services' or nations' military operations and capabilities gained through a prior joint duty assignment.
Table D.5
Question 20: Responses by Grade
Opinion of Those Who Answered
Strongly Neither Agree/ Strongly No Grade Agree Agree Disagree Disagree Disagree Answer
0-3 5% 19% 21% 39% 16% 1% 0-4 11% 24% 20% 33% 12% 0% 0-5 17% 27% 20% 26% 9% 0% 0-6 26% 33% 16% 20% 6% 1% 0-7+ 29% 37% 14% 15% 5% 0% All 18% 26% 19% 30% 10% 1%

Results of Responses to the Survey's Opinion Questions 95
Table D.6
Question 20: Responses by Type of Organization
Opinion of Those Who Answered
Neither Agree/ Strongly No
Organization Strongly J« Lgree Agree Disagree Disagree Disagree Answer
Joint Staff 14% 24% 22% 29% 12% 0% WarfightingCINCs 17% 28% 18% 28% 8% 0% Supporting CINCs 10% 23% 19% 35% 14% 1% WHS/OSD 15% 30% 22% 23% 11% 0% Defense agencies 12% 25% 20% 31% 11% 1% In-service 20% 35% 19% 21% 5% 1% All others 18% 23% 19% 30% 10% 0% All responses 15% 26% 19% 30% 10% 1%
Table D.7
Question 20: Responses by Skill Group
Opinion of Those Who Answered
Neither Strongly Agree/ Strongly No
Skill Group Agree Agree Disagree Disagree Disagree Answer
Tactical operations 16% Intelligence 17% Engineer/maintenance 11% Scientists/professional 18% Supply/procure/allied 13% Administration 10% All responses 15%
25% 18% 30% 11% 0% 31% 19% 25% 8% 1% 25% 19% 33% 12% 1% 25% 19% 30% 8% 0% 24% 22% 30% 11% 1% 24% 21% 33% 12% 1% 26% 19% 30% 10% 1%

96 How Many Can Be Joint? Supporting Joint Duty Assignments
Table D.8
Question 20: Responses by Current Joint Assignment
Opinion of Those Who Answered
Position Strongly Agree Agree
Neither Agree/ Disagree Disagree
Strongly Disagree
No Answer
On current JDAL Not on JDAL All responses
18% 10% 15%
27% 24% 26%
19% 20% 19%
28% 33% 30%
9% 12% 10%
0% 1% 1%
Question 21: The duties and responsibilities of this billet could be performed just as effectively by a civilian.
Table D.9
Question 21: Responses by Grade
Opinion of Those Who Answered
Strongly Neither Agree/ Strongly No Grade Agree Agree Disagree Disagree Disagree Answer
0-3 16% 23% 10% 22% 29% 1% 0-4 10% 16% 8% 25% 41% 0% 0-5 7% 12% 8% 25% 47% 0% 0-6 5% 8% 5% 22% 61% 1% 0-7+ 3% 6% 3% 14% 74% 0% All 9% 15% 8% 24% 44% 0%

Results of Responses to the Survey's Opinion Questions 97
Table D.10
Question 21: Responses by Type of Organization
Opinion of Those Who Answered
Neither Strongly Agree/ Strongly No
Organization Agree Agree Disagree Disagree Disagree Answer
Joint Staff 6% 9% 6% 21% 59% 0% Warfighting CINCs 7% 12% 6% 24% 51% 0% Supporting CINCs 10% 18% 8% 24% 40% 1% WHS/OSD 7% 14% 6% 28% 45% 1% Defense agencies 14% 20% 11% 25% 30% 1% In-service 3% 6% 5% 21% 66% 0% All others 7% 11% 6% 24% 52% 0% All responses 9% 15% 8% 24% 44% 0%
Table D. 11
Question 21: Responses by Skill Group
Opinion of Those Who Answered
Neither Strongly Agree/ Strongly No
Skill Group Agree Agree Disagree Disagree Disagree Answer
Tactical operations 5% 8% 5% 21% 61% 0% Intelligence 11% 17% 11% 26% 36% 1% Engineer/maintenance 13% 23% 9% 3% 32% 0% Scientists / profSessional 8% 5% 9% 26% 42% 0% Supply/procure/allied 9% 15% 8% 26% 41% 1% Administration 12% 18% 8% 27% 36% 1% All responses 9% 15% 8% 24% 44% 0%

98 How Many Can Be Joint? Supporting Joint Duty Assignments
Question 22: Joint duty assignments are highly sought after by career officers.
Table D. 12
Question 22: Responses by Grade
Opinion of Those Who Answered
Strongly Neither Agree/ Strongly No Grade Agree Agree Disagree Disagree Disagree Answer
0-3 23% 40% 24% 11% 3% 20% 0-4 17% 38% 24% 16% 5% 15% 0-5 13% 37% 23% 21% 6% 11% 0-6 14% 41% 19% 20% 6% 8% 0-7+ 17% 43% 24% 15% 2% 17% All 16% 38% 23% 18% 5% 24%
Table D. 13
Question 22: Responses by Service
Opinion of Those Who Answered
Neither Strongly Agree/ Strongly No
Service Agree Agree Disagree Disagree Disagree Answer
Army 12% 34% 25% 22% 7% 14% Navy 17% 36% 22% 19% 6% 12% Air Force 18% 43% 22% 14% 3% 13% Marine Corps 15% 36% 28% 16% 6% 14% All responses 16% 38% 23% 18% 5% 14%

Results of Responses to the Survey's Opinion Questions 99
Table D. 14
Question 22: Responses by Skill
Opinion of Those Who Answered
Neither Strongly Agree/ Strongly No
Skill Group Agree Agree Disagree Disagree Disagree Answer
Tactical operations 16% 41% 22% 17% 5% 11%
Intelligence 15% 37% 24% 18% 6% 18%
Engineer/maintenance 18% 38% 24% 15% 4% 19%
Scientists/professional 11% 36% 25% 22% 6% 13% Supply/procure/allied 16% 40% 22% 17% 4% 10% Administration 19% 36% 21% 19% 5% 12%
All responses 16% 38% 23% 18% 5% 14%
Table D.15
Question 22: Responses by Current Joint Assignment
Opinion of Those Who Answered
Position Strongly Agree Agree
Neither Agree/
Disagree Strongly
Disagree Disagree No
Answer
On current JDAL NotonJDAL All responses
13% 20% 16%
38% 39% 38%
23% 23% 23%
20% 6% 13% 4% 18% 5%
10% 18% 14%

100 How Many Can Be Joint? Supporting Joint Duty Assignments
Question 23: It is difficult to fit a joint duty assignment in the normal career path of an officer like me.
Table D. 16
Question 23: Responses by Grade
Opinion of Those Who Answered
Strongly Neither Agree/ Strongly No Grade Agree Agree Disagree Disagree Disagree Answer
0-3 7% 20% 23% 40% 10% 20% 0-4 9% 21% 17% 43% 10% 15% 0-5 10% 22% 16% 41% 11% 11% 0-6 10% 24% 13% 39% 14% 8% 0-7+ 8% 29% 13% 38% 12% 17% All 9% 22% 17% 41% 11% 14%
Table D. 17
Question 23: Responses by Service
Opinion of Those Who Answered
Neither Strongly Agree/ Strongly No
Service Agree Agree Disagree Disagree Disagree Answer
Army 9% 22% 17% 41% 10% 15% Navy 14% 25% 15% 36% 10% 12% Air Force 6% 19% 18% 44% 13% 13% Marine Corps 10% 25% 17% 41% 8% 14% All responses 9% 22% 17% 41% 11% 14%

Results of Responses to the Survey's Opinion Questions 101
Table D. 18
Question 23: Responses by Skill Group
Opinion of Those Who Answered
Skill Group Strongly Neither Agree/ Strongly No Agree Agree Disagree Disagree Disagree Answer
Tactical operations 9% Intelligence 6% Engineer/maintenance 7% Scientists/professional 9% Supply/procure/allied 11% Administration 10% All responses 9%
26% 17% 38% 9% 11% 13% 18% 47% 17% 18% 20% 19% 44% 11% 19% 22% 16% 42% 11% 13% 23% 16% 40% 11% 10% 22% 17% 42% 10% 12% 22% 17% 41% 11% 14%
Table D.19
Question 23: Responses by Current Joint Assignment
Opinion of Those Who Answered
Position Strongly Agree Agree
Neither Agree/
Disagree Strongly No
Disagree Disagree Answer
On current JDAL 10% 22% 20% 38% 10% 10% Not on JDAL 20% 39% 23% 13% 4% 18% All responses 9% 22% 17% 41% 11% 14%

102 How Many Can Be Joint? Supporting Joint Duty Assignments
Question 24: Officers serving in a joint duty assignment are not as competitive for promotion as their contemporaries in comparable service positions.
Table D.20
Question 24: Responses by Grade
Opinion of Those Who Answered
Strongly Neither Agree/ Strongly No Grade Agree Agree Disagree Disagree Disagree Answer
0-3 9% 15% 35% 33% 9% 20% 0-4 12% 19% 29% 32% 9% 15% 0-5 15% 21% 24% 31% 9% 11% 0-6 12% 20% 19% 38% 11% 8% 0-7+ 5% 13% 19% 46% 17% 17% All 12% 19% 26% 33% 9% 14%
Table D.21
Question 24: Responses by Service
Opinion of Those Who Answered
Neither Strongly Agree/ Strongly No
Service Agree Agree Disagree Disagree Disagree Answer
Army 14% 21% 26% 30% 8% 15% Navy 15% 19% 25% 31% 10% 13% Air Force 9% 17% 27% 37% 10% 13% Marine Corps 17% 20% 28% 26% 10% 14% All responses 12% 19% 26% 33% 9% 14%

Results of Responses to the Survey's Opinion Questions 103
Table D.22
Question 24: Responses by Skill Group
Opinion of Those Who Answered
Neither Strongly Agree/ Strongly No
Skill Group Agree Agree Disagree Disagree Disagree Answer
Tactical operations 13% 19% 25% 34% 9% 11%
Intelligence 13% 20% 28% 31% 8% 18%
Engineer/maintenance 10% 17% 28% 36% 10% 19%
Scientists/professional 16% 23% 29% 25% 6% 14%
Supply/procure/allied , 11% 19% 27% 34% 9% 10%
Administration 12% 19% 25% 42% 10% 12%
All responses 12% 19% 26% 33% 9% 14%
Table D.23
Question 24: Responses by Current Joint Assignment
Opinion of Those Who Answered
Position Strongly
Agree Agree
Neither Agree/
Disagree Disagree Strongly No Disagree Answer
On current JDAL NotonJDAL All responses
14% 10% 12%
21% 16% 19%
24% 30% 26%
33% 34% 33%
9% 10% 10% 18% 9% 14%

104 How Many Can Be Joint? Supporting Joint Duty Assignments
Question 25: My position/responsibility could be performed by an officer of another service.
Table D.24
Question 25: Responses by Grade
Opinion of Those Who Answered
Strongly Neither Agree/ Strongly No Grade Agree Agree Disagree Disagree Disagree Answer
0-3 30% 51% 5% 9% 4% 19% 0-4 29% 45% 5% 13% 8% 14% 0-5 28% 46% 5% 14% 8% 11% 0-6 33% 42% 3% 11% 10% 8% 0-7+ 30% 37% 3% 13% 18% 17% All 29% 46% 5% 12% 8% 13%
Table D.25
Question 25: Responses by Service
Service
Opinion of Those Who Answered
Strongly Neither Agree/ Strongly No Agree Agree Disagree Disagree Disagree Answer
Army 28% 47% Navy 33% 39% Air Force 27% 49% Marine Corps 33% 40% All responses 29% 46%
5% 12% 7% 14% 5% 13% 9% 12% 5% 12% 7% 13% 5% 13% 9% 14% 5% 12% 8% 13%

Results of Responses to the Survey's Opinion Questions 105
Table D.26
Question 25: Responses by Skill Group
Opinion of Those Who Answered
Neither Strongly Agree/ Strongly No
Skill Group Agree Agree Disagree Disagree Disagree Answer
Tactical operations : 24% 42% 5% 18% 11% 11% Intelligence '■■ 33% 48% 48% 9% 6% 17% Engineer/maintenance ; 31% 52% 5% 8% 4% 18% Scientists/professional 28% 48% 5% 13% 6% 13% Supply/procure/allied 27% 47% 6% 13% 8% 9% Administration 33% 45% 5% 11% 6% 12% All responses 29% 46% 5% 12% 8% 13%
Question 26: My position/responsibility requires unique knowledge of my own service and could not be performed by an officer of another service.
Table D.27
Question 26: Responses by Grade
Opinion of Those Who Answered
Strongly Neither Agree/ Strongly No Grade Agree Agree Disagree Disagree Disagree Answer
0-3 4% 8% 9% 49% 30% 19% 0-4 8% 12% 9% 42% 28% 15% 0-5 8% 13% 8% 43% 27% 11% 0-6 10% 11% 6% 41% 32% 8% 0-7+ 17% 13% 5% 33% 32% 17% All 8% 12% 8% 43% 29% 13%

106 How Many Can Be Joint? Supporting Joint Duty Assignments
Table D.28
Question 26: Responses by Service
Opinion of Those Who Answered
Strongly Neither Agree/ Strongly No Service Agree Agree Disagree Disagree Disagree Answer
Army 7% 11% 9% 44% 28% 14% Navy 10% 12% 8% 38% 32% 12% Air Force 7% 12% 7% 47% 27% 13% Marine Corps 11% 13% 8% 35% 33% 14% All responses 8% 12% 8% 43% 29% 13%
Skill Group
Table D.29
Question 26: Responses by Skill Group
Opinion of Those Who Answered
Neither Strongly Agree/ Strongly No Agree Agree Disagree Disagree Disagree Answer
Tactical operations 12% 17% 9% 41% 22% 11% Intelligence 6% 9% 8% 45% 31% 17% Engineer/ maintenance 3% 9% 7% 49% 31% 18% Scientists/professional 7% 9% 9% 45% 30% 14% Supply/procure/allied 8% 13% 9% 44% 26% 9% Administration 6% 11% 8% 42% 34% 12% All responses 8% 12% 8% 43% 29% 13%

Results of Responses to the Survey's Opinion Questions 107
Question 27: Morale problems will exist if joint duty credit is awarded for some positions in my immediate organization but not for others.
Table D.30
Question 27: Responses by Grade
Opinion of Those Who Answered
Strongly Neither Agree/ Strongly No
Grade Agree Agree Disagree Disagree Disagree Answer
0-3 29% 36% 21% 11% 3% 19%
0-4 29% 35% 20% 13% 4% 14%
0-5 32% 36% 17% 11% 4% 11%
0-6 30% 37% 15% 14% 4% 8%
0-7+ 29% 31% 14% 23% 3% 17%
All 30% 36% 18% 12% 4% 13%
Table D.31
Question 27: Responses by Service
Opinion of Those Who Answered
Neither Strongly Agree/ Strongly No
Service Agree Agree Disagree Disagree Disagree Answer
Army 29% 37% 18% 13% 3% 14% Navy 29% 34% 20% 12% 5% 12%
Air Force 31% 36% 18% 13% 3% 13%
Marines 28% 35% 19% 11% 7% 14% All Responses 30% 36% 18% 12% 4% 13%
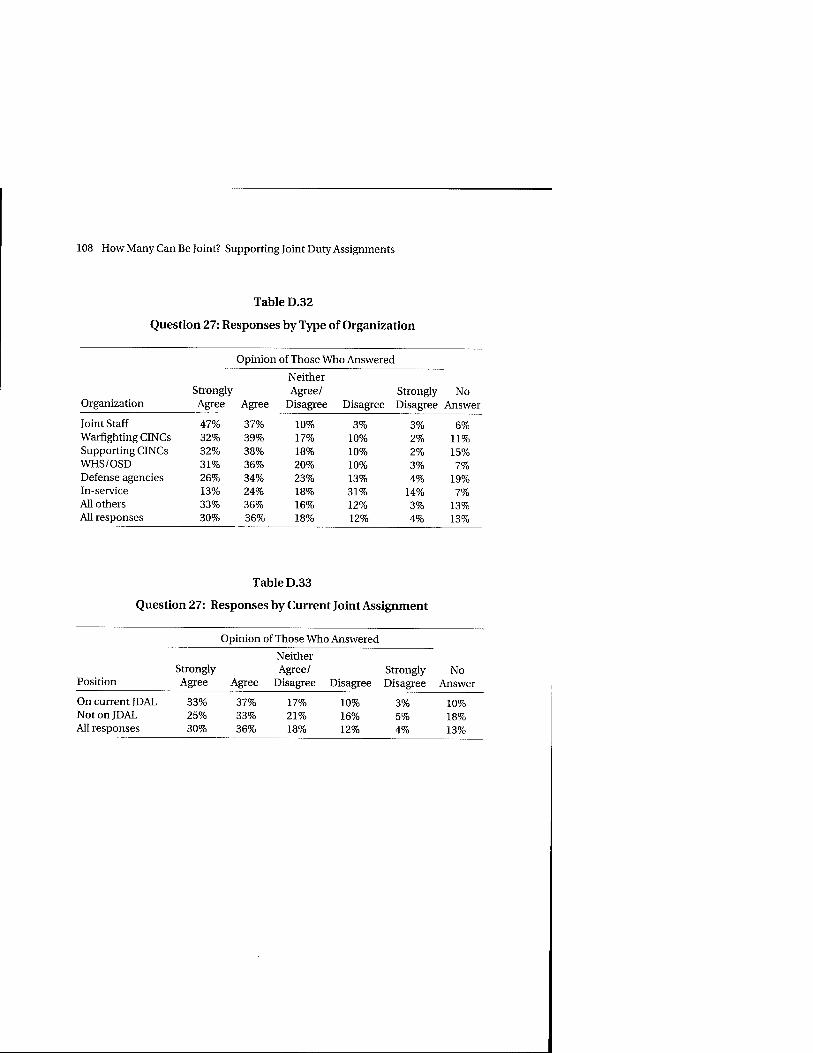
108 How Many Can Be Joint? Supporting Joint Duty Assignments
Table D.32
Question 27: Responses by Type of Organization
Opinion of Those Who Answered
Neither Strongly Agree/ Strongly No
Organization Agree Agree Disagree Disagree Disagree Answer
Joint Staff 47% 37% 10% 3% 3% 6% Warfighting CINCs 32% 39% 17% 10% 2% 11% Supporting CINCs 32% 38% 18% 10% 2% 15% WHS/OSD 31% 36% 20% 10% 3% 7% Defense agencies 26% 34% 23% 13% 4% 19% In-service 13% 24% 18% 31% 14% 7% All others 33% 36% 16% 12% 3% 13% All responses 30% 36% 18% 12% 4% 13%
Table D.33
Question 27: Responses by Current Joint Assignment
Opinion of Those Who Answered
Position Strongly Agree Agree
Neither Agree/
Disagree Strongly
Disagree Disagree No
Answer
On current JDAL Not on JDAL All responses
33% 25% 30%
37% 33% 36%
17% 21% 18%
10% 3% 16% 5% 12% 4%
10% 18% 13%

Results of Responses to the Survey's Opinion Questions 109
Question 28: I expect my present assignment to contribute significantly to my performance in my future service assignments.
Table D.34
Question 28: Responses by Grade
Opinion of Those Who Answered
Strongly Neither Agree/ Strongly No Grade ; Agree Agree Disagree Disagree Disagree Answer
0-3 29% 41% 15% 9% 6% 19% 0-4 24% 37% 18% 12% 10% 15% 0-5 21% 37% 19% 13% 10% 11% 0-6 23% 38% 18% 12% 8% 8% 0-7+ 35% 42% 14% 4% 5% 17% All 24% 38% 18% 12% 9% 14%
Table D.35
Question 28: Responses by Service
Opinion of Those Who Answered
Neither Strongly Agree/ Strongly No
Service Agree Agree Disagree Disagree Disagree Answer
Army 21% 38% 19% 13% 9% 15% Navy 24% 33% 20% 11% 11% 12% Air Force 26% 41% 16% 10% 7% 13% Marine Corps 26% 35% 16% 13% 10% 14% All responses 24% 38% 18% 12% 9% 14%

110 How Many Can Be Joint? Supporting Joint Duty Assignments
Table D.36
Question 28: Responses by Skill Group
Opinion of Those Who Answered
Neither Strongly r Agree/ Strongly No
Skill Group Agree Agree Disagree Disagree Disagree Answer
Tactical operations 22% 38% 18% 13% 10% 11% Intelligence 24% 38% 19% 10% 9% 17% Engineer/maintenance 24% 39% 18% 12% 7% 18% Scientists/professional 21% 38% 17% 13% 11% 14% Supply / pro cure / allied 28% 39% 17% 10% 7% 9% Administration 24% 37% 18% 11% 9% 12% All responses 24% 38% 18% 12% 9% 14%
Question 29: My service's interest in assigning officers to joint duty assignments has increased.
Table D.37
Question 29: Responses by Grade
Opinion of Those Who Answered
Strongly Neither Agree/ Strongly No Grade Agree Agree Disagree Disagree Disagree Answer
0-3 7% 28% 49% 10% 5% 20% 0-4 13% 35% 35% 11% 6% 15% 0-5 13% 39% 29% 12% 8% 11% 0-6 17% 46% 20% 11% 6% 9% 0-7+ 36% 39% 15% 5% 6% 17% All 13% 36% 33% 11% 7% 14%

Results of Responses to the Survey's Opinion Questions 111
Table D.38
Question 29: Responses by Service
Opinion of Those Who Answered
Neither Strongly Agree/ Strongly No
Service Agree Agree Disagree Disagree Disagree Answer
Army 12% 39% 33% 10% 6% 15% Navy 21% 42% 21% 10% 7% 12% Air Force 10% 32% 39% 13% 7% 13% Marine Corps 16% 37% 30% 10% 7% 14% All responses 13% 36% 33% 11% 7% 14%
Table D.39
Question 29: Responses by Current Joint Assignment
Opinion of Those Who Answered
Position Strongly Agree Agree
Neither Agree/
Disagree Disagree Strongly Disagree
No Answer
On current JDAL Not on JDAL All responses
14% 11% 13%
41% 29% 36%
27% 41% 33%
11% 11% 11%
7% 6% 7%
10% 18% 14%

BIBLIOGRAPHY
99th Congress, First Session, Defense Organization: The Need for Change, Senate Print 99-86, Committee on Armed Services, United States Senate, October 16,1985.
99th Congress, Second Session, Reorganization of the Department of Defense, Hearings Before the Investigations Subcommittee of the Committee on Armed Services, HASC No. 99-53, House of Representatives, 1987.
99th Congress, Second Session, Department of Defense Reor- ganization Act of 1986, P.L. 99-433, in United States Code Congressional and Administrative News, Volume 1, West Publishing Co., St. Paul, Minn., 1986.
99th Congress, Second Session, Legislative History—Department of Defense Reorganization Act of 1986, in United States Code Congressional and Administrative News, Volume 4, West Publishing Co., St. Paul, Minn., 1986.
100th Congress, First Session, Department of Defense Authorization Act for Fiscal Year 1988, P.L. 100-180, in United States Code Congressional and Administrative News, Volume 1, West Publishing Co., St. Paul, Minn., 1987.
100th Congress, Second Session, National Defense Authorization Act for Fiscal Year 1989, Report of the Committee on Armed Services, House of Representatives, Report 100-563, April 4,1988.
100th Congress, Second Session, Department of Defense Autho- rization Act for Fiscal Year 1989, P.L. 100-456, in United States
113

114 How Many Can Be Joint? Supporting Joint Duty Assignments
Code Congressional and Administrative News, Volume 1, West Publishing Co., St. Paul, Minn., 1988.
101st Congress, First Session, Department of Defense Authorization Act for Fiscal Year 1990, P.L. 101-189, in United States Code Congressional and Administrative News, Volume 1, West Publishing Co., St. Paul, Minn., 1989.
102nd Congress, Second Session, Department of Defense Autho- rization Act for Fiscal Year 1990, P.L. 102-484, in United States Code Congressional and Administrative News, Volume 2, West Publishing Co., St. Paul, Minn., 1992.
103rd Congress, First Session, National Defense Authorization Act for Fiscal Year 1994, Conference Report to Accompany H.R. 2401, House of Representatives, Report 103-357, November 10, 1993.
103rd Congress, First Session, National Defense Authorization Act for Fiscal Year 1994, Report to the Committee on Armed Services, Senate, Report 103-112, July 27,1993.
Anderberg, Michael R., Cluster Analysis for Applications, Academic Press, San Diego, Calif., 1973.
Assistant Secretary of Defense (Force Management and Policy), Joint Duty Positions Pertaining to Title TV of the DoD Reorganization Act, Memorandum for the Under Secretaries of Defense, etc., Washington, D.C., December 4,1986.
Assistant Secretary of Defense (Force Management and Personnel), Report on the Study of Joint Officer Management Initiatives, Washington, D.C., April 1990.
Assistant Secretary of Defense (Force Management and Personnel), Restructured Joint Officer Program, Memorandum for the Assistant Secretary of the Army (Manpower and Reserve Affairs), etc., Washington, D.C., November 18, 1991.
Assistant Secretary of Defense (Manpower, Reserve Affairs, and Logistics), Assignment of Joint Tours of Duty, Department of Defense Directive 1320.5, July 26, 1978.

Bibliography 115
Chairman of the Joint Chiefs of Staff, Implementation of Title TV, DoD Reorganization Act, Memorandum, CM-683-87, April 14, 1987.
Chairman of the Joint Chiefs of Staff, Report on the Roles, Missions, and Functions of the Armed Forces of the United States, CM-1584- 93, February 1993.
Chairman of the Joint Chiefs of Staff, Military Education Policy Document, CM-1618-93, March 23,1993.
Chairman of the Joint Chiefs of Staff, Review of Promotion Selection Board Results by the Chairman of the Joint Chiefs of Staff, Instruction, CJCSI 1330.02, January 7,1994.
Coats, Lieutenant Colonel Julius E., Joint Duty Prerequisite for Promotion to 0-7 (Brigadier General), U.S. Army War College, Carlisle Barracks, Penn., March 13,1989.
Committee on Armed Services, House of Representatives, Report of the Panel on Military Education of the One Hundredth Congress, 101th Congress, First Session, Committee Print No. 4, April 21, 1989 [The SkeltonReport].
Department of Defense, Manpower Requirements Report, Manpower Flow Annex, FY1994, Washington, D.C., June 1993.
Deputy Secretary of Defense, Additional Guidelines for Admin- istration of Joint Duty Assignment QDA) Programs, Memorandum for the Secretaries of the Military Departments, etc., Washington, D.C., August 22, 1988.
Deputy Secretary of Defense, Additional Guidelines for the Imple- mentation and Administration of the Joint Officer Management Programs, Memorandum for the Secretaries of the Military Departments, etc., Washington, D.C., June 19,1989.
Deputy Secretary of Defense, Additional Guidelines for the Imple- mentation of Title IV, DoD Reorganization Act of 1986, Memorandum for the Secretaries of the Military Departments, etc., Washington, D.C., February 4,1988.
Deputy Secretary of Defense, Career Guidelines and Oversight Procedures for Joint Specialty Officers and Other Officers Serving in

116 How Many Can Be Joint? Supporting Joint Duty Assignments
Joint Duty Assignments, Memorandum for the Secretaries of the Military Departments, etc., Washington, D.C., July 22,1987.
Deputy Secretary of Defense, Revised Definitions for Dual-Hat and Cross-Department Joint Duty Assignments, Memorandum for the Secretaries of the Military Departments, etc., Washington, D.C., February 27,1989.
Deputy Secretary of Defense, Scientific and Technical Qualifications List, Memorandum for the Secretaries of the Military Departments, etc., Washington, D.C., November 20,1987.
Deputy Secretary of Defense, Title IV, DoD Reorganization Act of 1986, Memorandum for the Secretaries of the Military Depart- ments, etc., Washington, D.C., May 21, 1987.
Fuller, Craig S., The Navy and Jointness: No Longer Reluctant Partners? Thesis, Naval Postgraduate School, Monterey, Calif., December 1991.
General Accounting Office, Defense Personnel: Status of Imple- menting Joint Assignments for Military Leaders, GAO/NSIAD-91- 50BR, January 1991.
General Accounting Office, Military Personnel: Designation of Joint Duty Assignments, Report to Congressional Requesters, B-232940, February 1990.
Goldwater, Barry M., and Jack Casserly, Goldwater, Doubleday, New York, 1988 (especially Chapter 11, Duty-Honor-Country, pp. 334- 361).
Hearings, House of Representatives, Committee on Armed Services, Investigations Subcommittee, Washington, D.C., May 1,1987.
Joint Chiefs of Staff, Joint Officer Management, JCS Admin Publi- cation 1.2, Washington, D.C., June 30, 1989.
Maze, Rick, "Lawmakers Reluctantly Endorse Joint Duty Waivers," Air Force Times, August 30, 1993, p. 9.
Office of the Assistant Secretary of Defense (Force Management and Personnel), "Report on the Study of Joint Officer Management Initiatives," draft, April 1990.

Bibliography 117
Savage, Colonel Dennis M., Joint Duty Prerequisite for Promotion to General/Flag Officer, U.S. Army War College, Carlisle Barracks, Penn., March 24,1992.
Schänk, John F., Harry Thie, Jennifer Kawata, Margaret C. Harrell, Clifford Graf, and Paul Steinberg, Who Is Joint? Reevaluating the Joint Duty Assignment List, RAND, MR-574, 1995.
Senate Armed Forces Committee, "Joint Officer Personnel Policy" and "Joint Duty Credit for Equivalent Duty in Operations Desert Shield/Desert Storm," National Defense Authorization Act for Fiscal Year 1994, Washington, D.C., July 27,1993.
Syllogistics, Inc., Analysis of Current and Alternative Provisions of Title W: Joint Officer Personnel Policy, May 1989.
Thie, H., and R. A. Brown, Future Career Management Systems for U.S. Military Officers, RAND, MR-470-OSD, 1994.
Tomlinson, Major Paul L., "How Joint Officer Management Legislation Is Dividing Our Officer Corps," Marine Corps Gazette, October 1994, pp. 25-31.
Under Secretary of Defense (Personnel and Readiness), Joint Duty Assignment Study (Interim Report), June 1994.