
THE DISCOVERY OF OIL AND HOW IT MAY AFFECT LABOUR DYNAMICS IN THE NORTH.
Upload
eria-economic-research-institute-for-asean-and-east-asiaCategory
view
13download
6description

ERIA-DP-2015-48
ERIA Discussion Paper Series
How Labour Market Policies Affect
Innovation and Trade Competitiveness
Siwage Dharma NEGARA*
The Indonesian Institute of Sciences (LIPI), The Institute of
Southeast Asian Studies (ISEAS)
July 2015
Abstract: Endogenous growth theory postulates that innovation is one of the key
drivers of technological progress and productivity growth of a country.
Technological improvements stemming from firms’ innovative activities can
contribute to a country’s overall productivity and export competitiveness. For
innovation to flourish, it necessitates an environment that is conducive to firms
conducting risky innovative activities. Studies show that public policies, including
labour market policies, can influence the operating conditions and institutional
structures of firms to foster innovation that leads to productivity gains. However, the
literature indicates that there is mixed empirical evidence on the impact of labour
market policies on firms’ incentives to innovate.
This paper argues that more flexible labour market policies that do not constrain
workers’ adjustments and mobility will have positive associations with a country’s
technological innovation competitiveness. In addition, innovation competitiveness
affects a country’s productivity and trade competitiveness. Using a balanced panel
of OECD and non-OECD countries, this study offers simple empirical models to
measure the relationship between labour market policies and innovation capacity;
and between innovation capacity and trade competitiveness. The main findings show
that countries with more flexible labour market policies have higher levels of
innovation competitiveness. In addition, the paper finds evidence of a positive
correlation between innovation competitiveness and trade competitiveness.
Key words: Labour market policies, innovation, trade, competitiveness, labour
market flexibility
JEL Classification: F16, J08, J38, J63, O31, O38
* Researcher at the Economic Research Center of the Indonesian Institute of Sciences (P2E-LIPI)
and visiting fellow at the Institute of Southeast Asian Studies (ISEAS). Email:
[email protected]. This study is commissioned by the Economic Research Institute for ASEAN
and East Asia (ERIA).

1
1. Introduction
Endogenous growth theory postulates that innovation is one of the key drivers of
technological progress and productivity growth of a country (Romer, 1990; Aghion
and Howitt, 2005). Technological improvement stemming from a firm’s innovative
activities can lead to more efficient production processes and generate better quality
outputs. In an increasingly competitive global economy, innovation capacity is crucial
for firms to improve productivity and hence sustain their export competitiveness (Aw
et al., 2009; Cassiman et al., 2010).
Innovation requires an environment that is conducive to support firms to conduct
innovative activities. Studies show that public policies, including labour market
policies, can influence the operating conditions and institutional structures of firms to
foster innovation that leads to productivity gains. Several OECD studies in this area
suggest that different regulatory environments may explain performance differentials
between countries, or between industries with regard to innovation (OECD, 2002;
OECD, 2009).
Certain regulatory policies may affect firms’ incentives to innovate. For example,
regulations that restrict competition (e.g., creating entry barriers or operational
restrictions), or limit the ability of firms to adjust their workforce (e.g., stricter hiring
and firing rules), can adversely affect incentives to innovate. This in turn could hinder
the process of technological transfer and deny the economy potential productivity
improvements.
Labour market policies can influence the allocation of resources across firms and
sectors in the economy. They affect firms’ choices over labour inputs, investments,
technology, and outputs (Boeri et al., 2008). Different labour market policies induce
greater or lesser adjustment costs for firms to reallocate workers, thus affecting overall
economic efficiency. An efficient labour market is defined as one that ensures the
flexibility to shift workers from one production activity to another at low cost (World
Economic Forum, 2014). Efficiency in the labour market is critical in ensuring that
labour is assigned to its most effective use in the production process. An efficient
labour market provides opportunities for firms to foster innovation activities, which
may involve labour replacement or job reallocation, without excessive social

2
disruption. In this paper, the term ‘efficient and flexible labour market’ is used
interchangeably.
The literature on the impact of labour market policies on firms’ incentives to
innovate provides mixed empirical evidence. Some studies find that less-stringent
labour market policies are associated with stronger innovation competitiveness
(OECD, 2002; Saint-Paul, 2002; Barbosa and Faria, 2011; Murphy, et al., 2013;
Griffith and Macartney, 2014). Conversely, other studies also find that stricter labour
market policies can foster innovation and lead to greater country-level economic
growth. They argue that stringent labour market policies that limit firms’ ability to
dismiss workers, act as an ‘insurance device’ for firms not to punish employees when
certain innovative activities fail. In turn, this increases workers’ incentives to engage
in innovative activity (Acharya et al., 2010; Tang, 2012).
Countries at different development stages have different labour market
requirements, which influence their respective labour market policies. This paper
attempts to construct a set of balanced panels consisting of OECD and non-OECD
countries to investigate the relationship between labour market policies and countries’
innovation capacity. In addition, it also looks at how the latter relates to countries’
trade competitiveness. It argues that a more efficient labour market characterised by
less-rigid labour market policies stimulates innovation. In turn, higher innovation
positively impacts countries’ trade competitiveness.
The paper is organised as follows. Section 2 reviews selected studies examining
the relationship between labour market policies, and innovation intensity and
performance. Section 3 proposes simple empirical models to test the relationship
between labour market policies and countries’ innovation competitiveness. Section 4
discusses the data used for the estimation and presents some stylised facts. Section 5
discusses the empirical findings, whilst Section 6 concludes the paper.

3
2. Literature Review
There are several studies assessing the relationship between labour market policies
and innovation. This literature survey was not meant to be exhaustive, but rather to
provide an assessment of the current state of knowledge and highlight the existing
knowledge gaps where future research might be focused. It is important to note that
most, if not all, of the studies assessing the relationship between labour market policies
and innovation primarily focus on Organisation for Economic Co-operation and
Development (OECD) member countries. Availability of good quality firm- and
industrial-level data in OECD countries may explain this trend. However, for non-
OECD countries, especially for developing countries in Southeast Asia, there is lack
of (or in many cases non-existent) good quality microdata on innovation and
productivity (Lee and Narjoko, 2015).
Labour market policies vary from country to country. In general, these policies
aim to achieve social (rather than economic) objectives, such as providing employment
protection measures for workers. Employment protection policies are primarily
introduced to protect workers from adverse labour market risks, such as lay-offs or
low-paid earnings. Empirically, these policies vary widely across and within countries
(see Botero et al., 2004 for detailed discussion of each policy). To protect the earnings
of the lowest level of workers, some governments set minimum wages.1 In addition,
some governments also set regulations such that employers must provide extra benefits
to their workers, including training, health care, paid vacations, maternity leave, etc.
To protect workers from lay-off, some governments provide unemployment insurance
for those who lose their jobs.2 Alternatively, some governments prefer to set
regulations that restrict firms’ ability to dismiss employees at will.
1For examples, several countries, such as Australia, the United States, France, Chinese Taipei,
Japan, South Korea, China, the United Kingdom, Thailand, Malaysia, and Indonesia, implement
minimum wage systems. The arguments for minimum wage policy are to ensure low wage workers
having a minimum living standard; to prevent employers from exploiting low-skilled workers; to
increase purchasing power of low wage workers; and to compel employers to raise efficiency and
productivity, amongst others. 2 The US, Chinese Taipei, Japan, South Korea, and China also operate unemployment insurance
benefits, which are not linked to the minimum wages. Australia operates an unemployment
assistance system, in which benefit rates are set below the earnings of minimum wage workers.
France operates both systems.
4
The existing literature suggests that the relationship between labour market
policies and innovation capacity can be both positive and negative. On the one hand,
a stricter labour market policy provides job security; hence this should increase
incentives for workers to invest in firm-specific human capital and to be more engaged
in innovation activities (see Acharya et al., 2010). On the other hand, a stricter labour
market policy, which causes higher hiring and firing costs, will increase the cost for
firms that need to adjust their workforce in relation to innovation activities. This in
turn will discourage firms from conducting significant innovative activities (see Saint-
Paul, 2002; Bassinini and Ernst, 2002; Barbosa and Faria, 2011).
Murphy et al. (2013) identify two channels through which labour market policies
(employment protection regulations) may affect innovation. The first channel is linked
through human capital investment. In this channel, labour market policy is likely to
increase the probability of workers engaging in firm-specific or industry-specific
skills. It also increases the probability of workers engaging in innovation activities
(Murphy et al., 2013, p.5). Furthermore, a stricter labour market policy is likely to
increase workers’ bargaining power and their incentives to invest in firm-specific
skills. Acharya et al. (2010) found that stronger employment protection regulations
had a positive impact on innovation at the industry level. It also led to relatively more
innovation in the innovation-intensive industries than in traditional industries.
Acharya et al. (2010) find that stronger employment protection laws not only
foster innovation but also lead to greater country-level economic growth. They argue
that regulations governing the dismissal of workers are the only dimension of labour
laws that enhance firm-level innovation and country-level economic growth (Acharya
et al., p.23). They explain that employment protection laws impose limits on firms’
ability to dismiss workers. This acts as an ‘insurance device’ encouraging firms not to
punish their workers as a result of an unsuccessful innovative project. Consequently,
this incentivises workers to increase their investment in innovative projects relative to
their investment in routine projects. Therefore, stringent employment protection laws
encourage firms to find innovative projects in order to be more value-enhancing than
routine projects.
Tang (2012) shows that cross-country differences in labour market policies shape
the pattern of international trade, with a focus on workers’ skill acquisition. Similar to

5
Acharya et al. (2010), Tang also finds that countries with more protective labour laws
export relatively more in firm-specific skill-intensive sectors through both the
intensive and extensive margins of trade.3
Contrary to Acharya et al. (2010) and Tang (2012) findings, Barbosa and Faria
(2011) find that stricter labour market policy leads to less innovation intensity at the
industry level in European countries. They find that in European countries that have
rigid labour market policy, the innovation intensity decreases by 1.89 for a unit
increase in the indicator of employment rigidity holding other variables constant (see
Barbosa and Faria, 2011, p. 20). These findings are in line with Bassanini and Ernst
(2002), who investigated the impact of product and labour market regulations on
innovation by using a set of OECD indicators on the regulatory framework on a cross-
section of 18 OECD countries and 18 manufacturing industries. Their results show a
positive association between more flexible labour market policies and research and
development (R&D) intensity, which is used as proxy for innovation.
The second channel through which labour market policy may affect innovation is
through firms’ adjustment costs when they need to adjust against idiosyncratic shocks
(Murphy et al., 2013).4 In this case, a more rigid labour market policy inflates hiring
and firing costs for firms. As a result, this is likely to discourage innovative activities
that require adjustments or reallocations of labour. The adjustment cost will be
relatively higher in technologically advanced industries (Saint-Paul, 2002). Stricter
employment protection regulations discourage firms from experimenting with new
technologies with higher returns, but also with higher adjustment costs. Empirically,
employment protection restrictions are more costly in industries with rapid
technological change, such as ICT. Therefore, countries with stricter employment
protection regulations are likely to specialise in industries with a lower rate of technical
change (Murphy, et al., p.5).
A study by Pierre and Scarpetta (2006) find that innovative firms are the most
negatively affected by stricter labour market policies. Griffith and Macartney (2014)
find that multinational firms are likely to locate more innovation activities in countries
3 The intensive margin refers to the export volume per firm, whilst the extensive margin refers to
the number of exporting firms. 4 Idiosyncratic shocks that affect individual firm can be natural, social, economic, political, or
environmental.

6
with stricter employment protection policies. However, the same firms locate more
technologically advanced innovation activities in countries with less-stringent
employment protection policies. Furthermore, Murphy et al. (2013) find that the
effects of labour market policies on innovation vary by industry and country depending
on factors such as lay-off propensity, technological intensity, skills intensity,
competition pressures, openness, and other labour market institutions, such as wage-
setting institutions. They find that a more rigid labour market policy leads to
significantly lower innovation intensity in industries with higher job reallocation rates
or higher probability of dismissal. In addition, Murphy et al. find that innovation
intensity was higher in industries with higher import competition and in industries with
less rigid product market regulations. Furthermore, in countries with abundant human
capital, innovation intensity was higher in human capital-intensive industries.
Meanwhile, in countries with abundant physical capital, innovation intensity was
higher in physical capital-intensive industries. These results are aligned with Saint-
Paul (2002) and Griffith and Macartney (2014). In summary, the empirical literature
on the relationship between labour market policies and innovation provides a mixed
and complicated picture. The overall evidence leans slightly towards a positive
association between more flexible labour market policies and innovation capacity.
With regard to the relationship between innovation and trade competitiveness,
studies find a positive association between innovation capacity and firms’ exports. For
examples, Wagner (2007), Aw et al. (2009) and Cassiman, et al. (2010) find evidence
on the link between product innovation, productivity and exports. In this case,
innovation policy targeted at enhancing productivity is likely to be important for
improving firms’ exporting competitiveness. However, using the Slovenian microdata,
Damijan, et al. (2010) find a reverse causal direction in which exporting induces
process innovation and, in turn, affects the productivity growth relationship. This
finding suggests that firms with past exporting experience have a higher probability of
being more productive due to process innovation. Therefore, the link between
innovation and exporting seems fairly robust, and existing studies show that the
direction of causality can be both ways. Along these lines, Lee and Narjoko 2015
review some micro-data studies on the relationship between innovation and trade
competitiveness measured by exporting capability for five developing countries from

7
Southeast Asia, namely, Indonesia, Malaysia, the Philippines, Thailand, and Viet Nam.
They conclude that most existing studies in the region are not able to pinpoint the
direction of causality between innovation and exporting capability, most likely due to
data constraints. However, there is strong evidence that the incidence of innovation is
positively correlated with firms’ exporting performance. In addition, they find that
foreign competition in domestic markets is also important for innovation.
3. Data, Empirical Model, and Variables
3.1. Data
To investigate whether cross-country variations in labour market policies can
explain differences in innovation intensity, we constructed a set of panel data of 32
countries covering the period 2009-13. The data set includes seven ASEAN member
states, all members of the BRICS (Brazil, Russia, India, China, and South Africa), 16
OECD countries, plus Argentina, Hong Kong, Mexico and Pakistan (Table 1). The
selection of countries tries to capture all different stages of development as discussed
in the Global Competitiveness Report (WEF, 2014).
As can be seen from Table 1, ASEAN member states’ levels of development vary
from factor-driven economies such as Cambodia to innovation-driven economies such
as Singapore. As mentioned above, countries with different development levels have
different labour market requirements. Therefore, this influences their respective labour
market policies. In addition, countries with different development levels have different
innovation intensities and capacities. In view of this, combining such a wide
development level within a panel increases the variation in our data. Due to the lack
of data, three ASEAN member states, namely, Brunei Darussalam, Lao PDR, and
Myanmar, cannot be included in the panel estimation.

8
Table 1: Countries Covered in the Panel Data Set
Stage 1:
Factor-driven
economies
Transition
from stage 1
to stage 2
Stage 2:
Efficiency-
driven
economies
Transition
from stage 2
to stage 3
Stage 3:
Innovation-driven
economies
Cambodia
(CMB)
India
(IND)
Pakistan
(PAK)
Viet Nam
(VNM)
Philippines
(PHP)
China
(CHN)
Indonesia
(IDN)
South Africa
(SAF)
Thailand
(THL)
Argentina
(ARG)
Brazil
(BRZ)
Malaysia
(MLY)
Mexico
(MEX)
Russia
(RUS)
Turkey
(TUR)
Australia (AUS)
Canada (CAN)
Finland (FIN)
France (FRA)
Germany (GER)
Greece (GRE)
Hong Kong (HKG)
Italy (ITA)
Japan (JPN)
South Korea (KOR)
New Zealand (NZ)
Portugal (POR)
Singapore (SIN)
Spain (SPN)
Sweden (SWE)
United Kingdom (UK)
United States (US)
Note: The classification of countries follows the development stages in the Global
Competitiveness Report 2014–2015 published by the World Economic Forum. Country codes are
shown in parentheses.
As a proxy for innovation intensity, this paper uses scores data for innovation
competitiveness published by the World Economic Forum (WEF) since 2005. The
Global Competitiveness Index (GCI) published by WEF is designed to measure both
microeconomic and macroeconomic foundations of national competitiveness. It is a
composite index consisting of 12 pillars of competitiveness, namely, institutions,
infrastructure, macroeconomic environment, health and primary education, higher
education and training, goods market efficiency, labour market efficiency, financial
market development, technological readiness, market size, business sophistication,
and innovation. Each pillar consists of several indicators. The indicators are derived
using a standardised survey targeted to over 14,000 business executives in 144
countries. Similar to other perception surveys, there is a potential subjectivity bias in
the data. Nevertheless, the Global Competitiveness Index is a valuable data set that
can easily be used in a quantitative way, especially when other alternative standardised
measures on innovation and labour market policy are not readily available as in most

9
developing countries. Moreover, the opinions of business executives are invaluable in
understanding the factors that determine business competitiveness.
In addition to innovation scores data, the paper also uses alternative proxies for
innovation, including the number of patents filed by residents at the national office,
the number of venture capital deals, and the number of people employed in knowledge-
intensive services from the Global Innovation Index published by Cornell University,
INSEAD, and the World Intellectual Property Organization (WIPO).
It is important to note that comparable cross-country firm-level data on innovation
are relatively limited in the non-OECD countries, including in the Southeast Asian
region. So far, there is no standardised industry- or firm-level survey on innovation
activity and intensity within ASEAN member states. In view of this, it is critical for
countries in ASEAN to improve the availability and quality of their micro-data on
innovation to be on a par with OECD countries.
Lee and Narjoko (2015) explain that there are two types of innovation measures,
namely, innovation input and innovation output. The most widely used measure of
innovation input is R&D expenditure. As for innovation outputs, the patents count data
have been widely used to measure innovation intensity. However, there are drawbacks
to using either R&D expenditure or the number of patents to measure innovation
intensity. R&D expenditure cannot capture the output side of the innovation process.
In addition, R&D expenditure is only one of several inputs for innovation. Meanwhile,
patents only measure invention rather than innovation and cannot capture many non-
patented inventions and innovations.5 In addition, the use of patents to protect
inventions varies across industries. Nevertheless, the advantage of using innovation
indicators from GCI is that they capture both input and output measures of innovation,
namely, the capacity for innovation, the quality of scientific research institutions,
company spending on R&D, university–industry R&D collaboration, government
procurement of advanced technology products, availability of scientists and engineers,
patent applications, and intellectual property protection.
As a proxy for labour market policies, this paper uses scores data for labour market
efficiency published by the GCI and cost of redundancy dismissal from the World
5 See Kleinknecht et al. 2002 for detailed discussion about the weakness of each innovation
indicator.

10
Bank’s Doing Business. Specifically, the labour market policies index covers two
components, namely, the flexibility and the efficiency of the labour market. The
flexibility of a labour market is measured by indicators of: cooperation in labour-
employer relations; flexibility of wage determination; hiring and firing practices; costs
of redundancy dismissal; and the effect of taxation on incentives to work. The higher
the score of labour market efficiency, the more efficient the labour market is, implying
a less-rigid labour market policy. Meanwhile, the cost of redundancy dismissals
measures the strictness of regulations in terms of dismissal for a regular and a
temporary contract (Murphy et al., 2013, p. 3).
Table 2 describes each variable used in the empirical model, data sources and the
expected impact on innovation.
Table 2: Variables Acronyms, Description and Expected Impact
on Innovation
Variable Description Expected Impact
Innov Dependent variable, measured by the innovation
scores (weighted average of capacity for innovation;
quality of scientific research institutions; company
spending on R&D; university–industry collaboration
in R&D; government procurement of advanced
technology products; availability of scientists and
engineers; PCT patent applications and intellectual
property protection), values vary between 1 and 7
from least to most innovative environment.
Source: Global Competitiveness Index, World
Economic Forum
Patent Dependent variable, measured by weighted scores of
number of patent filed by resident at national office
(per billion GDP, 2005 PPP$), values vary between 0
and 100 from least to most patent application.
Source: World Intellectual Property Organization
(WIPO), Global Innovation Index.
Empkw Dependent variable, measured by weighted scores of
employment in knowledge-intensive services (% of
workforce), values vary between 0 and 100 from
least to most knowledge employment.
Source: ILO, Global Innovation Index.
Vencap Dependent variable, measured by weighted scores of
venture capital per investment location: number of
deals (per trillion GDP, 2005 PPP$), values vary
between 0 and 100 from least to most venture deals.
Source: Thomson Reuters, Global Innovation Index.

11
Lxport Dependent variable, measured by log of country
exports.
Source: World Bank, World Integrated Trade
Solution (WITS) database.
Lbreffi Independent variable (alternative for lmefi),
measured by weighted scores of cost of redundancy
dismissal (sum of notice period and severance pay
for redundancy dismissal in salary weeks), values
vary between 0 and 100 from most to least costly.
Source: World Bank, Global Innovation Index.
+/-
Lmefi Independent variable, measured by weighted scores
of labour market efficiency (cooperation in labour-
employer relations; flexibility of wage
determination; hiring and firing practices;
redundancy costs; effect of taxation on incentives to
work; pay and productivity; reliance on professional
management; country capacity to retain and attract
talent, and female participation in labour force),
values vary between 1 and 7 from least to most
efficient and flexible labour market.
Source: Global Competitiveness Index, World
Economic Forum
+/-
Gmefi Independent variable, measured by weighted scores
of goods market efficiency (domestic and foreign
competition), values vary between 1 and 7 from least
to most healthy market competition. Source: Global
Competitiveness Index, World Economic Forum
+
Institut Independent variable (alternative for gmefi),
measured by weighted scores of institutional
environment (weighted average of property rights,
ethics and corruption, undue influence, government
efficiency, security, corporate ethics, and
accountability), values vary between 1 and 7 from
least to most conducive institutional environment.
Source: Global Competitiveness Index, World
Economic Forum
+
Highed Independent variable, measured by weighted scores
of higher education and training quality, values vary
between 1 and 7 from low to high quality of higher
education and training environment.
Source: Global Competitiveness Index, World
Economic Forum
+
Macro Independent variable, measured by weighted scores
of stability of macroeconomic environment, values
vary between 1 and 7 from least to most stable
macroeconomic environment.
Source: Global Competitiveness Index, World
Economic Forum
+
Mktsize Independent variable, measured by weighted scores
of market size (domestic and foreign market size),
+/-

12
values vary between 1 and 7 from smallest to largest
market size.
Source: Global Competitiveness Index, World
Economic Forum
Techred Independent variable (alternative for highed),
measured by weighted scores of technological
readiness (technological adoption and ICT use),
values vary between 1 and 7 from least to most agile
economy to adopt existing technologies to enhance
the productivity of its industries. Source: Global
Competitiveness Index, World Economic Forum
+
Infras Independent variable (alternative for techred),
measured by weighted scores of infrastructure
quality (weighted average of transport, electricity
and telephony infrastructure), values vary between 1
and 7 from least to most extensive and efficient
infrastructure.
Source: Global Competitiveness Index, World
Economic Forum
+
Openness Independent variable, measured by weighted scores
of applied tariff rate (weighted mean, all products
(%)), values vary between 0 and 100 from least to
most open economy.
Source: World Bank, Global Innovation Index.
+
It is important to note that the innovation scores from the GCI focus on
technological innovation capacity. Technological innovation is not related to skills,
know-how, or organisational conditions. The importance of technological innovation
in improving standards of living is well documented. Technological breakthroughs
have been the basis of many of productivity gains that modern economies currently
enjoy. For example, technological innovation in ICT has led the digital revolution
which, in turn, has benefitted modern economies in terms of increasing productivity
and efficiency. The digital revolution would have never happened without
technological innovation, which has significantly transformed the ways in which
things are done, and opened a wider range of new opportunities in terms of products
and services development.
Technological innovation is particularly important for economies approaching the
frontiers of knowledge. At this stage of development, the possibility of generating
more value by merely integrating and adapting exogenous technologies tends to
disappear. For firms in those countries that have reached this innovation stage of
development, they must design and develop cutting-edge products and processes to
maintain a competitive edge and move towards even higher value-added activities.

13
This advancement requires an environment that is conducive to innovative activities
and supported by both the public and the private sectors. It needs sufficient investment
in R&D, especially by the private sector; the presence of high-quality scientific
research institutions that can generate the basic knowledge needed to build the new
technologies; extensive collaboration in research and technological developments
between universities and industry; and the protection of intellectual property (WEF
2014, pp.8–9).
Table 3 reports some descriptive statistics of the dependent and independent
variables used in the empirical analysis. Part I of the table reports the summary
statistics, whereas Part II reports the summary of correlation coefficients amongst
selected variables.

14
Table 3: Descriptive Statistics of Dependent and Independent Variables
Part I: Summary statistics
Part II: Correlation coefficients amongst selected variables
The correlation matrix shows that there is a high positive correlation between the
institutional environment (institute) and goods market efficiency (gmefi). The
institutional environment is determined by the legal and administrative framework
within which firms and government interact to generate wealth. Meanwhile, goods
market efficiency is determined by healthy market competition and demand conditions
(customer orientation and buyer sophistication).
There is also a high positive correlation between infrastructure quality (infra) and
higher education quality (highed); between infrastructure quality and technological
readiness (techred); and between higher education quality and technological readiness.
Infrastructure quality is measured by how extensive and efficient the infrastructure a

15
country has. A well-developed transport and communications infrastructure network,
quality of roads, railroads, ports, electricity supplies and telecommunications network,
all are critical for effective functioning of an economy. Considering the correlation
between variables, our choice of explanatory variable in the estimation avoids putting
together highly correlated variables. All in all, the correlation matrix shows that none
of these variables are perfectly collinear.
3.2. Some stylised facts
Figure 1 depicts the trend scores of labour market efficiency based on the GCI.
Overall, the global trend shows that employment protection has been increasing in
some countries and declining in others. In the data, Argentina, Italy, Pakistan, and
Turkey are classified as the strictest countries in terms of labour market policies
(measured by lower scores for labour market efficiency), whilst Singapore, Hong
Kong, the US, and the UK are classified as the least strict countries for labour market
policies (higher scores for labour market efficiency).
Figure 1: Cross-country Labour Market Efficiency Trend, 2009–2013
Source: Author’s calculation based on Global Competitiveness Index 2009-2013.
34
56
34
56
34
56
34
56
34
56
34
56
2009 2010 2011 2012 2013 2009 2010 2011 2012 2013 2009 2010 2011 2012 2013 2009 2010 2011 2012 2013
2009 2010 2011 2012 2013 2009 2010 2011 2012 2013
ARG AUS BRZ CAN CHN CMB
FIN FRA GER GRE HKG IDN
IND ITA JPN KOR MEX MLY
NZ PAK PHP POR RUS SAF
SIN SPN SWE THL TUR UK
US VNM
lmefi
yearGraphs by country

16
Figure 2 shows the trend scores of innovation capacity based on the GCI. Overall,
the global trend shows that innovation intensity has been increasing in some countries
and also declining in others. Finland, Japan, Germany, and the US lead in global
innovation competitiveness, whilst Cambodia, Argentina and Pakistan seem to be
laggards in innovation.
Figure 2: Cross-country Innovation Scores Trend, 2009–2013
Source: Author’s calculation based on Global Competitiveness Index 2009–2013.
Figure 3 depicts a positive association between labour market efficiency (lmefi)
and innovation capacity. The figure shows that countries such as Singapore, the US,
and the UK, are relatively advanced in terms of innovation performance and relatively
flexible in terms of labour market policies. This pattern remains unchanged when we
use a different proxy for labour market efficiency, namely, the cost of redundancy
dismissal (lbrefi).
34
56
34
56
34
56
34
56
34
56
34
56
2009 2010 2011 2012 2013 2009 2010 2011 2012 2013 2009 2010 2011 2012 2013 2009 2010 2011 2012 2013
2009 2010 2011 2012 2013 2009 2010 2011 2012 2013
ARG AUS BRZ CAN CHN CMB
FIN FRA GER GRE HKG IDN
IND ITA JPN KOR MEX MLY
NZ PAK PHP POR RUS SAF
SIN SPN SWE THL TUR UK
US VNM
inn
ov
yearGraphs by country

17
Figure 3: Labour Market Efficiency and Innovation Capacity, 2013
Source: Authors’ calculation based on Global Competitiveness Index.
Figures 4 to 6 show that labour market efficiency has a positive association with
the number of patents filed in the national office, the number of venture capital deals,
and the number of people employed in knowledge-intensive services.
THL
SAF
ARG
RUS
CHN
KOR
US
TURMEX
SWE
SIN
POR
PAK
NZ
BRZ
VNM
ITA
UK
HKG
JPN
MLY
GER
SPN
FIN
IDN
PHP
FRA
CAN
GRE
IND
CMB
AUS
34
56
Inn
ova
tion
3 4 5 6labour market efficiency
innov Fitted values

18
Figure 4: Labour Market Efficiency and Number of Patents Filed, 2013
Source: Authors’ calculation based on Global Innovation Index and Global Competitiveness
Index.
Figure 5: Labour Market Efficiency and Number of Venture Deals, 2013
Source: Authors’ calculation based on Global Innovation Index and Global Competitiveness
Index.
THLSAFARG
RUS
CHNKOR US
TUR
MEX
SWE
SIN
POR
PAK
NZ
BRZ
VNM
ITA
UK
HKG
JPN
MLY
GER
SPN
FIN
IDN PHP
FRA
CAN
GREIND
CMB
AUS
02
04
06
08
01
00
num
ber
of p
ate
nt
3 4 5 6labour market efficiency
patent Fitted values
THLSAFARGRUSCHNKOR
US
TUR MEX
SWESIN
POR
PAK
NZ
BRZVNMITA
UK
HKGJPNMLY
GER
SPN
FIN
IDN
PHP
FRA
CAN
GRE
IND
CMB
AUS
-50
05
01
00
num
ber
of ve
ntu
re d
eals
3 4 5 6labour market efficiency
vencap Fitted values

19
Figure 6: Labour Market Efficiency and Employment
in Knowledge-intensive Services, 2013
Source: Authors’ calculation based on Global Innovation Index and Global Competitiveness
Index.
Figure 7 shows that the relationship between labour market efficiency (lmefi) and
trade openness also seems positive. A more efficient labour market is associated with
greater openness to trade. Similarly, Figure 8 shows that the relationship between
innovation and trade competitiveness (measured by the natural logarithm of export
value) is also positive. A more innovative country is associated with greater export
competitiveness.
THL
SAFARG
RUS
CHN
KOR
US
TUR
MEX
SWE
SIN
POR
PAK
NZ
BRZ
VNM
ITA
UK
HKG
JPN
MLY
GER
SPN
FIN
IDN
PHP
FRA CAN
GRE
CMB
AUS
02
04
06
08
01
00
num
ber
of e
mp
loym
en
t in
kno
wle
dge
secto
r
3 4 5 6labour market efficiency
empkw Fitted values

20
Figure 7: Trade Openness and Labour Market Efficiency, 2013
Source: Authors’ calculation based on Global Innovation Index and Global Competitiveness
Index.
Figure 8: Trade Competitiveness and Innovation, 2013
Source: Authors’ calculation based on Global Innovation Index and Global Competitiveness
Index.
THLSAF
ARGRUS
CHN
KOR
US
TUR
MEX
SWE
SIN
POR
PAK
NZ
BRZ
VNM
ITA UK
HKG
JPN
MLY
GERSPN FIN
IDN
PHP
FRACAN
GRE
IND
CMB
AUS
60
70
80
90
100
trad
e o
pen
ne
ss
3 4 5 6labour market efficiency
open Fitted values
THL
SAFARG
RUS
CHN
KOR
US
TUR
MEX
SWE
SIN
POR
PAK
NZ
BRZ
VNM
ITA UKHKGJPN
MLY
GER
SPN
FIN
IDN
PHP
FRACAN
GRE
IND
CMB
AUS
81
01
21
41
6
log
expo
rt
3 4 5 6innovation
lxprt Fitted values

21
3.3. Empirical Model
We are interested in examining how much variation in labour market policies
relate to variation in innovation capacity. For this purpose, we propose a simplified
version of Acharya, et al. (2010) fixed effect model, as follows:
Innovit = αit +β*Lmefiit +γ*Xit +μi + εit (1)
The dependent variable, Innovit, represents innovation competitiveness in country i at
time t. Lmefiit represents labour market efficiency in country i at time t. Higher values
of this variable correspond to more efficient labour markets, implying more flexible
labour market policies. Xit is a set of control variables including institutional
environment, infrastructure quality, macroeconomic condition, higher education
quality, goods market efficiency, and market size of country i at time t. μit controls for
unobserved country-specific characteristics, and εit is a disturbance term capturing
unobservable variables affecting innovation. The country fixed effects control for
time-invariant unobserved factors at the country level.6
The parameters of interest are β coefficients on the labour market efficiency
indicators. Model 1 assumes that labour market policies affect the way resources are
allocated, and hence the efficiency and flexibility of the overall labour market. This in
turn leads to either higher or lower country innovation capacity.
Table 3 shows the estimation results for equation (1) using the innovation scores
measure as the dependent variables. The β coefficient for the labour market efficiency
(lmefi) is positive and significant. This result indicates that as the score of labour
market efficiency increases (less rigid labour market policies), a country’s innovation
score increases, holding other things constant. The estimate for β coefficient remains
positive and significant when we control for additional variables, such as higher
education quality, the institutional environment, infrastructure quality, market size,
openness and interaction term (openness*lmefi). The latter tries to capture the
possibility of non-linearity in the model specification. As column 4 and 5 show that
the effect of labour market efficiency on innovation is higher when we include the
6 Due to lack of standardised industrial data, the model cannot control for industrial
heterogeneity.

22
openness and interaction terms. In this case, the degree of openness matters for
innovation.
The estimated coefficient for higher education is positive and significant for
different model specification. This means higher education quality is positively
associated with innovation. In view of this, policy that supports the quality of higher
education is crucial for improving country’s innovation competitiveness. Other
significant determinant for innovation is infrastructure quality. Columns 2–4 show that
better infrastructure quality is associated with higher innovation competitiveness.
Meanwhile, columns 1, 2, and 5 show that estimated coefficients on goods market
efficiency are positive and significant, meaning that more efficient goods market
policies (more domestic and foreign competition) are associated with higher
innovation capacity. This result is in line with other previous findings (see Aghion et
al., 2005; Barbosa and Faria, 2011).
Table 3: Fixed Effect Regressions Results: Innovation Capacity
as Dependent Variable
Dependent variable:
Innovation capacity scores
1 2 3 4 5
Lmefi
Gmefi
Highed
Infra
Mktsize
Openness
Open*Lmefi
Techred
0.232**
(0.099)
0.362**
(0.136)
0.371***
(0.112)
0.225***
(0.079)
0.290**
(0.109)
0.451***
(0.089)
0.296***
(0.082)
0.108
(0.122)
0.288**
(0.112)
0.388 ***
(0.098)
0.158
(0.286)
1.718***
(0.401)
0.150
(0.117)
0.284**
(0.112)
0.378***
(0.091)
0.019***
(0.006)
-0.323***
(0.089)
1.643***
(0.409)
0.311**
(0.144)
0.312***
(0.109)
0.019***
(0.006)
-0.308***
(0.090)
0.114**
(0.066)
Constant
-0.395
(0.786)
-0.469
(0.626)
-1.847
(1.514)
-2.744***
(0.877)
-2.170**
(0.984)
N
Rho
Prob > F
160
0.946
0.000
160
0.952
0.000
160
0.950
0.000
160
0.953
0.000
160
0.945
0.000 Notes: Robust standard errors are in parentheses. Based on them ***, **,* mean coefficients statistically significant at 1%, 5%, and 10% level, respectively. See Table 2 for the detailed description of the variables. Source: Author’s calculation.

23
The Hausman test is conducted to choose between the fixed effect and random
effect model. The Hausman test rejects the null hypothesis, i.e., that the unique error
(ui) is not correlated with the regressors.7 Therefore, the fixed effect is selected for
equation (1).
Different proxies for innovation are also tested in the estimation of equation (1).
Table 4 shows the results of fixed effect regression on equation (1) using different
proxies for dependent variable, namely the number of venture deals (vencap) and the
number of people employed in knowledge-intensive services (empkw) as the
dependent variables. Similar to previous results, the β coefficient for the labour market
efficiency (lmefi) remains positive and significant. However, we cannot find a
significant association between labour market policies and the number of patents filed
in the national office. This is probably due to weaknesses of the patent data.8
7 See the Appendix for the Hausman test results. 8 Firms in different industries and countries have different propensities to patent and that the value
of a patent is heterogeneous across countries (see Griffith and Macartney, 2014, p.141).

24
Table 4: Fixed Effect Regressions Results: Venture Capital Deals and
Employment in Knowledge Services as Dependent Variable
Dependent variable:
Venture capital deals
Dependent variable:
Employment in knowledge
services
1 2 3 4
Lmefi
Gmefi
Mktsize
Highed
Infra
2.490***
(0.471)
-3.247***
(0.656)
-5.038***
(1.804)
2.136***
(0.472)
-2.059***
(0.774)
-4.032**
(1.781)
-1.552***
(0.546)
-0.379
(0.531)
0.357**
(0.150)
-0.532***
(0.197)
2.708***
(0.482)
0.341**
(0.156)
-0.535**
(0.247)
2.677***
(0.486)
-0.196
(0.177)
0.199
(0.173)
Constant
33.818***
(9.482)
34.175***
(9.185)
9.417***
(2.536)
-9.205***
(2.554)
N
Rho
Prob > F
145
0.973
0.000
145
0.974
0.000
155
0.989
0.000
155
0.989
0.000
Notes: Robust standard errors are in parentheses. Based on them ***, **,* mean coefficients
statistically significant at 1%, 5%, and 10% level, respectively. See Table 2 for the detailed
description of the variables.
Source: Author’s calculation
It is important to note that our fixed-effect model is likely to suffer from an
endogeneity problem. An important concern stems from the fact that changes in a
country's labour market policies are likely to be correlated with changes in other
unobserved factors. To address this endogeneity problem, we run a dynamic panel-
data using the Arellano-Bond method by including the lag of the dependent variable
to control for other unobserved factors.
Table 5 shows the results of the Arellano-Bond dynamic panel-data estimation.
The results corroborate the findings from previous models (compared with Table 3).
Our estimation results show that a more efficient labour market is associated positively
with innovation capacity. The estimate for β coefficient remains positive and
significant when we control for additional variables, such as higher education quality,
the institutional environment, infrastructure quality, institutional quality and openness
(columns 3-5). We find that improved goods market efficiency (more competition),
better infrastructure quality, and improved institutional quality, are all positively
correlated with a country’s innovation performance. It is important to note that a higher

25
education variable becomes non-significant after including more control variables,
namely, infrastructure and institutional quality. This is probably due to the strong
positive correlation between higher education and these two variables. The
insignificant sign of the openness variable and the lag of innovation are rather
puzzling.
Table 5: Arellano-Bond Dynamic Panel-data Estimation
Dependent variable:
Innovation capacity scores
1 2 3 4 5
Lmefi
Gmefi
Mktsize
Highed
Infra
Institut
Macro
Openness
Innov (t-1)
0.222***
(0.074)
0.549***
(0.125)
0.181*
(0.097)
-0.181
(0.154)
0.243***
(0.085)
0.537***
(0.134)
0.227
(0.346)
0.190*
(0.103)
-0.253
(0.197)
0.210**
(0.092)
0.237*
(0.134)
0.168
(0.306)
0.105
(0.090)
0.436***
(0.117)
0.195*
(0.105)
-0.220
(0.182)
0.234**
(0.095)
0.230*
(0.139)
0.294
(0.317)
0.100
(0.094)
0.468***
(0.119)
0.192*
(0.109)
-0.056
(0.043)
-0.315*
(0.186)
0.201**
(0.085)
0.243*
(0.133)
0.101
(0.088)
0.430***
(0.114)
0.199*
(0.103)
0.001
(0.002)
-0.195
(0.154)
Constant
0.457
(0.711)
-0.505
(1.625)
-1.423
(1.472)
-1.617
(1.517)
-0.700
(0.611)
N
Prob>Chi2
96
0.000
96
0.000
96
0.000
96
0.000
96
0.000
Notes: ***, **,* mean coefficients statistically significant at 1%, 5%, and 10% level,
respectively. See Table 2 for the detailed description of the variables.
Source: Author’s calculation
In addition, we also test whether labour market policies and innovation will have
an effect on a country’s trade competitiveness.
Lxportit = αit +β*Innovit-1 + γ*Lmefiit +δ*Xit +μit + εit (2)
The dependent variable, Lxportit, represents trade competitiveness measured by the
natural logarithm of country i’s exports at time t. Innovit-1 represents innovation

26
intensity in country i at time t-1. A potential caveat that should be kept in mind, due to
data constraints, is that we can only use a one-year lag. This one-year lag is probably
too short for innovation to show any meaningful impact on a country’s trade
competitiveness. Xit is a set of control variables of country i at time t. μit controls for
unobserved country-specific characteristics and εit is an idiosyncratic error term.
Our hypothesis is that a more efficient labour market is associated with greater
innovation. And greater innovation is, in turn, associated with a country’s trade
competitiveness measured by its exports. Again, this is a rather bold simplification of
the reality in which innovation may indirectly affect productivity and export
competitiveness. Nevertheless, we are interested in finding preliminary evidence that
overall innovation scores could be higher or lower in countries with more efficient
labour markets.
To capture the dynamic nature of innovation relative to export competitiveness,
we then estimate equation (2) with fixed and random effect models and perform the
Hausman test. As stated above, trade competitiveness is measured by the natural
logarithm of a country’s exports value (see Table 2 description). Table 6 shows that a
different model specification leads to different choices between the fixed or random
effect. The Hausman test selects the random effect for the model without goods market
policy variable (gmefi) (see column 1 and 2). While it selects the fixed effect for the
model with goods market policy variable (see column 3 and 4). Overall, the estimation
results show that the lag variable of innovation is positively associated with export
competitiveness. The estimated coefficient for innovation variable remains consistent,
positive and significant across different model specifications. In addition,
technological readiness and goods market competition policy are associated with
higher exports. Meanwhile, a more flexible labour market policy is associated with
lower exports. This result contradicts our hypothesis about the impact of labour market
policy on trade competitiveness.

27
Table 6: Exploring the Relationship between Innovation
and Trade Competitiveness
Dependent variable:
Log exports
1
(F.E)
2
(R.E)
3
(F.E)
4
(R.E)
Lmefi
Gmefi
Techred
Innov (t-1)
-0.212**
(0.082)
0.178***
(0.066)
0.195**
(0.083)
-0.186**
(0.080)
0.194***
(0.064)
0.237***
(0.080)
-0.237***
(0.080)
0.319**
(0.127)
0.103
(0.071)
0.165**
(0.081)
-0.216***
(0.079)
0.303**
(0.125)
0.121*
(0.069)
0.204***
(0.079)
Constant
11.547***
(0.542)
11.190***
(0.536)
10.676***
(0.630)
10.407***
(0.620)
N
Rho
Prob > F or
Prob>Chi2
128
0.991
0.000
128
0.991
0.000
128
0.992
0.000
128
0.991
0.000
Hausman Test Prob >Chi2 = 0.173
Cannot reject Ho. Use random
effect
Prob >Chi2 = 0.000
Reject Ho. Use fixed effect
Notes: Standard errors are in parentheses. Based on them ***, **,* mean coefficients statistically
significant at 1%, 5%, and 10% level, respectively.
Source: Author’s calculation
Conclusions
This paper investigates the relationship between labour market policies and
innovation. Most of the studies in this area have been undertaken for OECD member
countries. This study attempts to fill in the knowledge gap by expanding the analysis
to include both OECD and non-OECD countries, including some of the Southeast
Asian countries. The data used in the estimation come from the Global
Competitiveness Report and the Global Innovation Index. A set of balanced panel data
is constructed including 32 countries covering the period 2009–2013. Data availability
limits our empirical model in two ways. First, it is related to the difficulty of finding
reliable and standardised innovation data at the firm or industry level for developing
countries. Second, it is related to the difficulty of finding good proxies for labour
market policy, as there is substantial heterogeneity in labour market policies across

28
countries. Due to institutional complexity, there is no perfect proxy for labour market
policy. The use of labour market efficiency indicators from the Global Competivenesss
Index (GCI) should therefore be treated with caution.
Despite these challenges, GCI data nevertheless provide valuable information
when better alternative standardised measures on innovation and labour market policy
are not easily available in most countries. In this case, opinions from business
executives are instrumental in understanding the factors behind business
competitiveness. This study finds some preliminary evidence that a more efficient
labour market (more flexible labour market policy) is positively correlated with
innovation. Innovation competitiveness in turn leads to a country’s trade
competitiveness. Our results are robust even after controlling for other explanatory
variables. The quality of higher education is positively associated with a country’s
innovation competitiveness. Therefore, policies that support improving higher
education quality are crucial for economies that want to develop their innovation
competitiveness. Other important determinants for innovation are infrastructure
quality and goods market policies (more domestic and foreign competition). The two
are positively correlated with innovation. The country-level analysis in this paper
demonstrates the average correlation between labour market efficiency and
innovation. However, it does not take into account structural differences across
industries/sectors. Subject to data availability, future research should be directed
towards understanding variances of labour market efficiency and innovation between
different industries and sectors across countries.
On trade aspects, we find some preliminary evidence that past innovation is
positively associated with trade competitiveness. This is in line with some previous
studies that find a positive link between innovation and exporting (Wagner, 2007; Aw
et al. 2009; Cassiman et al. 2010). We cannot find a significant positive association
between labour market policies and trade competitiveness. However, we postulate that
there may be an indirect link between labour market policies and trade
competitiveness—one that our simple model fails to capture.
Research on labour market policies and innovation is still limited in the region.
We hope that future research will fully explore the relationship between labour market
policies and innovation in developing countries in the Southeast Asian region using

29
good quality firm-level data. As ASEAN will soon start implementing the ASEAN
Economic Community characterised by the free flow of skilled labour amongst others,
there is a greater need to assess how labour market policies in one member state may
affect other countries, and also how they affect innovation in the region. In addition, it
is important to collect better quality micro-data to test the relationship between
innovation, productivity and firms’ exporting competitiveness. Innovation policy
targeted at enhancing productivity, especially in export-oriented sectors, is likely to be
important, but empirical evidence in this area is still lacking in ASEAN.
References
Acharya, V., R. Baghai-Wadji, and K. Subramarian (2013), ‘Labour Laws and
Innovation’, Journal of Law and Economics 56, pp.997–1037.
Aghion, P. and P. Howitt (2005), ‘Growth with Quality-Improving Innovations: An
Integrated Framework’, in Handbook of Economic Growth by P. Aghion and
S.N. Durlauf, eds., Vol. 1A, Chapter 2, 67–110. Amsterdam: Elsevier.
Aw, B.Y., M.J. Roberts, and D.Y. Xu (2009), ‘R&D Investment, Exporting, and
Productivity Dynamics’, NBER Working Paper Series No. 14670, Cambridge,
MA: National Bureau of Economic Research.
Barbosa, N. and A.P. Faria (2011), ‘Innovation across Europe: How Important Are
Institutional Differences’, Research Policy 40, pp.1157–1169.
Bassanini, A., and E. Ernst (2002), ‘Labour Market Institutions, Product Market
Regulation, and Innovation: Cross-Country Evidence’, OECD Department of
Economics Working Paper No. 316. Paris: OECD.
Bassanini, A., L. Nunziata, and D. Venn (2009), ‘Job Protection Legislation and
Productivity Growth in OECD countries’, Economic Policy 24(58), pp.351–
402.
Boeri, T. , B. Helppie, and M. Macis (2008), ‘Labor Regulations in Developing
Countries: A Review of the Evidence and Directions for Future Research’,
World Bank SP Discussion Paper No. 0833. Washington, DC: World Bank.
Botero, J., S. Djankov, R. La Porta, F. Lopez-De-Silanes, and A. Shleifer (2004), ‘The
Regulation of Labor’, Quarterly Journal of Economics 119(4), pp.1339–1382.
Cassiman, B., E. Golovko, and E. Martinez-Ros (2010), ‘Innovation, Exports and
Productivity’, International Journal of Industrial Organization 28, pp.372–
376.
Damijan, J.P., C. Kostevc, and S. Polanec (2010), ‘From Innovation to Exporting or
Vice Versa?’, The World Economy, pp.374–398.
30
Djankov, S. and R. Ramalho (2009), ‘Employment Laws in Developing Countries’,
Journal of Comparative Economics 37, pp.3–13.
Griffith, R. and G. Macartney (2014), ‘Employment Protection Legislation,
Multinational Firms, and Innovation’, Review of Economics and Statistics 96
(1), 135–150.
Kleinknecht, A., K. van Montfort, and E. Brouwer (2002), ‘The Non-trivial Choice
Between Innovation Indicators’, Economics of Innovation and New
Technology, 11(2), pp. 109–121.
Lee, C. and D. Narjoko (2015), ‘Escaping the Middle‐Income Trap in Southeast Asia:
Micro Evidence on Innovation, Productivity, and Globalization’, Asian
Economic Policy Review 10, pp.124–147.
Manning, C. (2004), ‘Labour Regulation and the Business Environment: Time to Take
Stock’, in Basri, M.C., and P. van der Eng (eds.) Business in Indonesia, New
Challenges, Old Problems. Singapore: Institute of Southeast Asian Studies.
Murphy, G., I. Siedschlag, and J. McQuinn (2013), ‘Employment Protection and
Innovation Intensity’, Neujobs Working Paper No. D6.4.
Nicoletti, G. et al. (2001), ‘Product and Labour Markets Interactions in OECD
Countries’, OECD Economics Department Working Papers No. 312, OECD
Publishing.
OECD (2002), Economic Outlook, 1(71), June.
OECD (2005), OSLO Manual, 3rd edition. Paris: OECD.
OECD (2009), Innovation in Firms: A Microeconomic Perspective. Paris: OECD.
OECD (2013), Innovation in Southeast Asia. Paris: OECD.
Pierre, G and S. Scarpetta (2006), ‘Employment protection: Do Firms’ Perceptions
Match with Legislation?’ Economics Letters 90, pp. 328–334.
Romer, P.M. (1990), ‘Endogenous Technological Change’, Journal of Political
Economy, 98(5), pp.S71–102.
Saint-Paul, G. (2002), ‘Employment Protection, International Specialization and
Innovation’, European Economic Review 46, pp.375–395.
Scarpetta, S. and T. Tressel (2004), ‘Boosting Productivity via Innovation and
Adoption of New Technologies: Any Role for Labour Market Institutions?’,
World Bank Policy Research Working Paper 3273. Washington, DC: World
Bank.
Tang, H. (2012), ‘Labor Market Institutions, Firm-specific Skills and Trade Patterns’,
Journal of International Economics 87, pp.337–351.
Venn, D. (2009), ‘Legislation, Collective Bargaining and Enforcement: Updating the
OECD Employment Indicators’, OECD Social, Employment and Migration
Working Papers No. 89.
Wagner, J. (2007), ‘Exports and Productivity: A Survey of the Evidence from Firm-
level Data’, The World Economy, 30(1), pp.60–82.

31
World Economic Forum (WEF) (2014), The Global Competitiveness Index 2014-
2015. Available at:
http://www3.weforum.org/docs/WEF_GlobalCompetitivenessReport_2014-
15.pdf
Yang C.-H. and Y.-H. Chen (2012), ‘R&D, productivity & exports: Plant-level
evidence from Indonesia’, Economic Modelling 29(2), pp.208–216.

32
Appendix: Hausman Test Results
Dependent variable:
Innovation capacity
1
(F.E)
2
(R.E)
3
(F.E)
4
(R.E)
Lmefi
Gmefi
Mktsize
Highed
Infra
Macro
0.296***
(0.071)
0.108
(0.114)
0.158
(0.219)
0.288***
(0.082)
0.388**
(0.080)
0.275***
(0.060)
0.198**
(0.093)
0.135
(0.086)
0.307***
(0.073)
0.297***
(0.067)
0.297***
(0.072)
0.109
(0.115)
0.165
(0.232)
0.288 ***
(0.082)
0.387***
(0.081)
-0.003
(0.034)
0.276***
(0.060)
0.204**
(0.099)
0.139
(0.086)
0.307***
(0.074)
0.294***
(0.067)
-0.009
(0.032)
Constant
-1.847
(1.160)
-1.685***
(0.565)
-1.868
(1.189)
-1.681***
(0.565)
N
Rho
Prob > F or
Prob>Chi2
160
0.950
0.000
160
0.935
0.000
160
0.950
0.000
160
0.934
0.000
Hausman Test Prob >Chi2 = 0.000
Reject Ho. Use fixed effect
Prob >Chi2 = 0.000
Reject Ho. Use fixed effect
Notes: Standard errors are in parentheses. Based on them ***, **,* mean coefficients statistically
significant at 1%, 5%, and 10% level, respectively.

33
Dependent variable:
Number of venture deals
1
(F.E)
2
(R.E)
3
(F.E)
4
(R.E)
Lmefi
Gmefi
Mktsize
Highed
Infra
2.490***
(0.471)
-3.247***
(0.656)
-5.038***
(1.804)
2.880***
(0.332)
-2.486***
(0.415)
-0.107
(0.290)
2.136***
(0.472)
-2.059***
(0. 774)
-4.032**
(1.781)
-1.552***
(0.546)
-0.379
(0.531)
2.826***
(0.073)
-2.753***
(0.515)
-0.239
(0.293)
-0.601
(0.388)
0.679**
(0.332)
Constant
33.818***
(9.482)
2.357***
(2.250)
34.175***
(9.185)
4.043*
(2.369)
N
Rho
Prob > F or
Prob>Chi2
145
0.973
0.000
145
0.701
0.000
145
0.974
0.000
145
0.693
0.000
Hausman Test Prob >Chi2 = 0.000
Reject Ho. Use fixed effect
Prob >Chi2 = 0.000
Reject Ho. Use Fixed effect
Notes: Standard errors are in parentheses. Based on them ***, **,* mean coefficients statistically
significant at 1%, 5%, and 10% level, respectively.

34
Dependent variable:
Employment in knowledge services
1
(F.E)
2
(R.E)
3
(F.E)
4
(R.E)
Lmefi
Gmefi
Mktsize
Highed
Infra
0.357**(0.150)
-
0.532***(0.19
7)
2.708***
(0.482)
0.157 (0.137)
0.002 (0.172)
0.648***(0.19
4)
0.341**(0.156)
-0.535**
(0.247)
2.677***
(0.486)
-0.196 (0.177)
0.199 (0.173)
0.135 (0.134)
-0.369*
(0.215)
0.316*(0.162)
0.147 (0.161)
0.383***(0.14
7)
Constant
-9.417***
(2.536)
-0.351 (1.273) -
9.205***(2.55
4)
0.534 (1.108)
Observation
s
Rho
Prob > F or
Prob>Chi2
155
0.989
0.000
155
0.935
0.006
155
0.989
0.000
155
0.884
0.000
Hausman
Test
Prob >Chi2 = 0.000 (Reject Ho)
Use fixed effect
Prob >Chi2 = 0.000 (Reject Ho)
Use fixed effect Notes: Standard errors are in parentheses. Based on them ***, **,* mean coefficients statistically
significant at 1%, 5%, and 10% level, respectively.

35
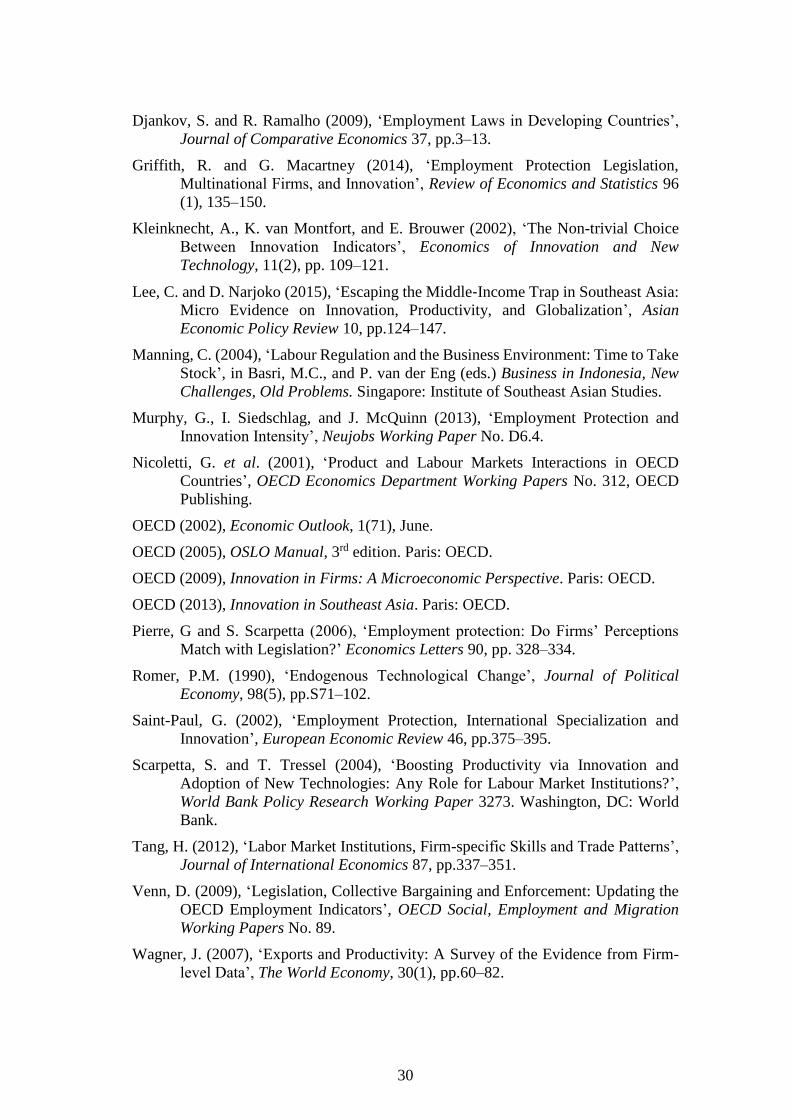
ERIA Discussion Paper Series
No. Author(s) Title Year
2015-48
Siwage Dharma
NEGARA
How Labour Market Policies Affect Innovation and
Trade Competitiveness
July
2015
2015-47
Hank LIM, Bernard
AW, LOKE Hoe
Yeong
AEC Scorecard Phase IV: Furthering the
Implementation of the AEC Blueprint Measures
The Singapore Country Report
June
2015
2015-46
Saowaruj
RATTANAKHAMFU
Sumet
ONGKITTIKUL
Nutthawut
LAKSANAPUNYAK
UL
Nichamon
THONGPAT
Natcha O-CHAROEN
Thailand Country Study
ASEAN Economic Community
Blueprint Mid-term Review Project
June
2015
2015-45 Koji KUBO Evolving Informal Remittance Methods of
Myanmar Migrant Workers in Thailand
June
2015
2015-44 Philippa DEE Monitoring the Implementation of Services Trade
Reform towards an ASEAN Economic Community
May
2015
2015-43 Shandre
THANGAVELU
FDI Restrictiveness Index for ASEAN:
Implementation of AEC Blueprint Measures
May
2015
2015-42
Rully PRASSETYA
and Ponciano S.
INTAL, Jr.
AEC Blueprint Implementation Performance and
Challenges: Standards and Conformance
May
2015
2015-41 Ponciano INTAL Jr. AEC Blueprint Implementation Performance and
Challenges: Trade Facilitation
May
2015
2015-40
Fukunari KIMURA,
Tomohiro
MACHIKITA, and
Yasushi UEKI
Technology Transfer in ASEAN Countries: Some
Evidence from Buyer-Provided Training Network
Data
May
2015
36
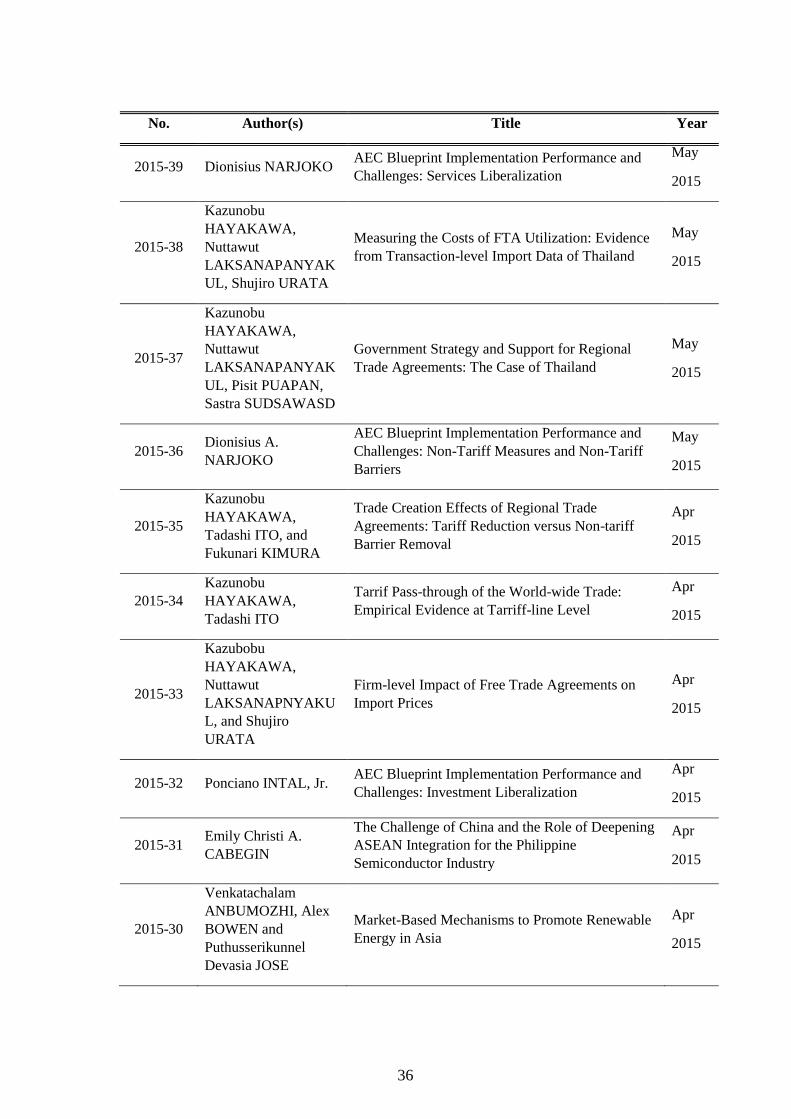
No. Author(s) Title Year
2015-39 Dionisius NARJOKO AEC Blueprint Implementation Performance and
Challenges: Services Liberalization
May
2015
2015-38
Kazunobu
HAYAKAWA,
Nuttawut
LAKSANAPANYAK
UL, Shujiro URATA
Measuring the Costs of FTA Utilization: Evidence
from Transaction-level Import Data of Thailand
May
2015
2015-37
Kazunobu
HAYAKAWA,
Nuttawut
LAKSANAPANYAK
UL, Pisit PUAPAN,
Sastra SUDSAWASD
Government Strategy and Support for Regional
Trade Agreements: The Case of Thailand
May
2015
2015-36 Dionisius A.
NARJOKO
AEC Blueprint Implementation Performance and
Challenges: Non-Tariff Measures and Non-Tariff
Barriers
May
2015
2015-35
Kazunobu
HAYAKAWA,
Tadashi ITO, and
Fukunari KIMURA
Trade Creation Effects of Regional Trade
Agreements: Tariff Reduction versus Non-tariff
Barrier Removal
Apr
2015
2015-34
Kazunobu
HAYAKAWA,
Tadashi ITO
Tarrif Pass-through of the World-wide Trade:
Empirical Evidence at Tarriff-line Level
Apr
2015
2015-33
Kazubobu
HAYAKAWA,
Nuttawut
LAKSANAPNYAKU
L, and Shujiro
URATA
Firm-level Impact of Free Trade Agreements on
Import Prices
Apr
2015
2015-32 Ponciano INTAL, Jr. AEC Blueprint Implementation Performance and
Challenges: Investment Liberalization
Apr
2015
2015-31 Emily Christi A.
CABEGIN
The Challenge of China and the Role of Deepening
ASEAN Integration for the Philippine
Semiconductor Industry
Apr
2015
2015-30
Venkatachalam
ANBUMOZHI, Alex
BOWEN and
Puthusserikunnel
Devasia JOSE
Market-Based Mechanisms to Promote Renewable
Energy in Asia
Apr
2015
37
No. Author(s) Title Year
2015-29 Venkatachalam
ANBUMOZHI
Low Carbon Green Growth in Asia: What is the
Scope for Regional Cooperation?
Apr
2015
2015-28 Tan LI and Larry D.
QIU
Beyond Trade Creation: Free Trade Agreements
and Trade Disputes
Mar
2015
2015-27 Mai Anh NGO Exporting and Firm-Level Credit Constraints –
Evidence from Ghana
Mar
2015
2015-26
Sunghoon CHUNG,
Joonhyung LEE,
Thomas OSANG
Did China Tire Safeguard Save U.S. Workers? Mar
2015
2015-25
Esther Ann BØLER,
Beata JAVORCIK,
Karen Helene
ULLTVEI-MOE
Globalization: A Woman’s Best Friend? Exporters
and the Gender Wage Gap
Mar
2015
2015-24 Tristan Leo Dallo
AGUSTIN and Martin
SCHRÖDER
The Indian Automotive Industry and the ASEAN
Supply Chain Relations
Mar
2015
2015-23 Hideo KOBAYASHI
and Yingshan JIN The CLMV Automobile and Auto Parts Industry
Mar
2015
2015-22 Hideo KOBAYASHI Current State and Issues of the Automobile and Auto
Parts Industries in ASEAN
Mar
2015
2015-21 Yoshifumi
FUKUNAGA
Assessing the Progress of ASEAN MRAs on
Professional Services
Mar
2015
2015-20 Yoshifumi
FUKUNAGA and
Hikari ISHIDO
Values and Limitations of the ASEAN Agreement
on the Movement of Natural Persons
Mar
2015
2015-19 Nanda NURRIDZKI Learning from the ASEAN + 1 Model and the ACIA
Mar
2015
2015-18
Patarapong
INTARAKUMNERD
and Pun-Arj
CHAIRATANA and
Preeda
CHAYANAJIT
Global Production Networks and Host-Site
Industrial Upgrading: The Case of the
Semiconductor Industry in Thailand
Feb
2015
2015-17 Rajah RASIAH and
Yap Xiao SHAN
Institutional Support, Regional Trade Linkages and
Technological Capabilities in the Semiconductor
Industry in Singapore
Feb
2015

38
No. Author(s) Title Year
2015-16 Rajah RASIAH and
Yap Xiao SHAN
Institutional Support, Regional Trade Linkages and
Technological Capabilities in the Semiconductor
Industry in Malaysia
Feb
2015
2015-15 Xin Xin KONG, Miao
ZHANG and Santha
Chenayah RAMU
China’s Semiconductor Industry in Global Value
Chains
Feb
2015
2015-14 Tin Htoo NAING and
Yap Su FEI
Multinationals, Technology and Regional Linkages
in Myanmar’s Clothing Industry
Feb
2015
2015-13 Vanthana NOLINTHA
and Idris JAJRI
The Garment Industry in Laos: Technological
Capabilities, Global Production Chains and
Competitiveness
Feb
2015
2015-12 Miao ZHANG, Xin
Xin KONG, Santha
Chenayah RAMU
The Transformation of the Clothing Industry in
China
Feb
2015
2015-11
NGUYEN Dinh Chuc,
NGUYEN Ngoc Anh,
NGUYEN Ha Trang
and NGUYEN Ngoc
Minh
Host-site institutions, Regional Production Linkages and Technological Upgrading: A study of Automotive Firms in Vietnam
Feb
2015
2015-10
Pararapong
INTERAKUMNERD
and Kriengkrai
TECHAKANONT
Intra-industry Trade, Product Fragmentation and Technological Capability Development in Thai Automotive Industry
Feb
2015
2015-09 Rene E. OFRENEO Auto and Car Parts Production: Can the Philippines Catch Up with Asia
Feb
2015
2015-08
Rajah RASIAH, Rafat
Beigpoor
SHAHRIVAR,
Abdusy Syakur AMIN
Host-site Support, Foreign Ownership, Regional Linkages and Technological Capabilites: Evidence from Automotive Firms in Indonesia
Feb
2015
2015-07 Yansheng LI, Xin Xin
KONG, and Miao
ZHANG
Industrial Upgrading in Global Production Networks: Te Case of the Chinese Automotive Industry
Feb
2015
2015-06 Mukul G. ASHER and
Fauziah ZEN Social Protection in ASEAN: Challenges and Initiatives for Post-2015 Vision
Feb
2015
2015-05 Lili Yan ING, Stephen
MAGIERA, and
Anika WIDIANA
Business Licensing: A Key to Investment Climate Reform
Feb
2015
2015-04
Gemma ESTRADA,
James ANGRESANO,
Jo Thori LIND, Niku
MÄÄTÄNEN,
William MCBRIDE,
Donghyun PARK,
Fiscal Policy and Equity in Advanced Economies: Lessons for Asia
Jan
2015

39
No. Author(s) Title Year
Motohiro SATO, and
Karin SVANBORG-
SJÖVALL
2015-03 Erlinda M.
MEDALLA Towards an Enabling Set of Rules of Origin for the Regional Comprehensive Economic Partnership
Jan
2015
2015-02
Archanun
KOHPAIBOON and
Juthathip
JONGWANICH
Use of FTAs from Thai Experience
Jan
2015
2015-01 Misa OKABE Impact of Free Trade Agreements on Trade in East Asia
Jan
2015
2014-26 Hikari ISHIDO Coverage of Trade in Services under ASEAN+1 FTAs
Dec
2014
2014-25 Junianto James
LOSARI
Searching for an Ideal International Investment Protection Regime for ASEAN + Dialogue Partners (RCEP): Where Do We Begin?
Dec
2014
2014-24 Dayong ZHANG and
David C. Broadstock
Impact of International Oil Price Shocks on Consumption Expenditures in ASEAN and East Asia
Nov
2014
2014-23 Dandan ZHANG,
Xunpeng SHI, and Yu
SHENG
Enhanced Measurement of Energy Market Integration in East Asia: An Application of Dynamic Principal Component Analysis
Nov
2014
2014-22 Yanrui WU Deregulation, Competition, and Market Integration in China’s Electricity Sector
Nov
2014
2014-21 Yanfei LI and
Youngho CHANG
Infrastructure Investments for Power Trade and Transmission in ASEAN+2: Costs, Benefits, Long-Term Contracts, and Prioritised Development
Nov
2014
2014-20 Yu SHENG, Yanrui
WU, Xunpeng SHI,
Dandan ZHANG
Market Integration and Energy Trade Efficiency: An Application of Malmqviat Index to Analyse Multi-Product Trade
Nov
2014
2014-19
Andindya
BHATTACHARYA
and Tania
BHATTACHARYA
ASEAN-India Gas Cooperation: Redifining India’s “Look East” Policy with Myanmar
Nov
2014
2014-18 Olivier CADOT, Lili
Yan ING How Restrictive Are ASEAN’s RoO?
Sep
2014
2014-17 Sadayuki TAKII Import Penetration, Export Orientation, and Plant Size in Indonesian Manufacturing
July
2014

40
No. Author(s) Title Year
2014-16 Tomoko INUI, Keiko
ITO, and Daisuke
MIYAKAWA
Japanese Small and Medium-Sized Enterprises’ Export Decisions: The Role of Overseas Market Information
July
2014
2014-15 Han PHOUMIN and
Fukunari KIMURA
Trade-off Relationship between Energy Intensity-thus energy demand- and Income Level: Empirical Evidence and Policy Implications for ASEAN and East Asia Countries
June
2014
2014-14 Cassey LEE The Exporting and Productivity Nexus: Does Firm Size Matter?
May
2014
2014-13 Yifan ZHANG Productivity Evolution of Chinese large and Small Firms in the Era of Globalisation
May
2014
2014-12
Valéria SMEETS,
Sharon
TRAIBERMAN,
Frederic
WARZYNSKI
Offshoring and the Shortening of the Quality
Ladder:Evidence from Danish Apparel
May
2014
2014-11 Inkyo CHEONG Korea’s Policy Package for Enhancing its FTA
Utilization and Implications for Korea’s Policy
May
2014
2014-10 Sothea OUM,
Dionisius NARJOKO,
and Charles HARVIE
Constraints, Determinants of SME Innovation, and
the Role of Government Support
May
2014
2014-09 Christopher
PARSONS and Pierre-
Louis Vézina
Migrant Networks and Trade: The Vietnamese
Boat People as a Natural Experiment
May
2014
2014-08
Kazunobu
HAYAKAWA and
Toshiyuki
MATSUURA
Dynamic Tow-way Relationship between
Exporting and Importing: Evidence from Japan
May
2014
2014-07 DOAN Thi Thanh Ha
and Kozo KIYOTA
Firm-level Evidence on Productivity Differentials
and Turnover in Vietnamese Manufacturing
Apr
2014
2014-06 Larry QIU and
Miaojie YU
Multiproduct Firms, Export Product Scope, and
Trade Liberalization: The Role of Managerial
Efficiency
Apr
2014
2014-05 Han PHOUMIN and
Shigeru KIMURA
Analysis on Price Elasticity of Energy Demand in
East Asia: Empirical Evidence and Policy
Implications for ASEAN and East Asia
Apr
2014
2014-04 Youngho CHANG and
Yanfei LI
Non-renewable Resources in Asian Economies:
Perspectives of Availability, Applicability,
Acceptability, and Affordability
Feb
2014
2014-03 Yasuyuki SAWADA
and Fauziah ZEN Disaster Management in ASEAN Jan

41
No. Author(s) Title Year
2014
2014-02 Cassey LEE Competition Law Enforcement in Malaysia Jan
2014
2014-01 Rizal SUKMA ASEAN Beyond 2015: The Imperatives for Further
Institutional Changes
Jan
2014
2013-38 Toshihiro OKUBO,
Fukunari KIMURA,
Nozomu TESHIMA
Asian Fragmentation in the Global Financial Crisis Dec
2013
2013-37 Xunpeng SHI and
Cecilya MALIK
Assessment of ASEAN Energy Cooperation within
the ASEAN Economic Community
Dec
2013
2013-36 Tereso S. TULLAO,
Jr. And Christopher
James CABUAY
Eduction and Human Capital Development to
Strengthen R&D Capacity in the ASEAN
Dec
2013
2013-35 Paul A. RASCHKY
Estimating the Effects of West Sumatra Public
Asset Insurance Program on Short-Term Recovery
after the September 2009 Earthquake
Dec
2013
2013-34
Nipon
POAPONSAKORN
and Pitsom
MEETHOM
Impact of the 2011 Floods, and Food Management
in Thailand
Nov
2013
2013-33 Mitsuyo ANDO Development and Resructuring of Regional
Production/Distribution Networks in East Asia
Nov
2013
2013-32 Mitsuyo ANDO and
Fukunari KIMURA
Evolution of Machinery Production Networks:
Linkage of North America with East Asia?
Nov
2013
2013-31 Mitsuyo ANDO and
Fukunari KIMURA
What are the Opportunities and Challenges for
ASEAN?
Nov
2013
2013-30 Simon PEETMAN Standards Harmonisation in ASEAN: Progress,
Challenges and Moving Beyond 2015
Nov
2013
2013-29 Jonathan KOH and
Andrea Feldman
MOWERMAN
Towards a Truly Seamless Single Windows and
Trade Facilitation Regime in ASEAN Beyond 2015
Nov
2013
2013-28 Rajah RASIAH
Stimulating Innovation in ASEAN Institutional
Support, R&D Activity and Intelletual Property
Rights
Nov
2013

42
No. Author(s) Title Year
2013-27 Maria Monica
WIHARDJA
Financial Integration Challenges in ASEAN
beyond 2015
Nov
2013
2013-26 Tomohiro MACHIKIT
A and Yasushi UEKI
Who Disseminates Technology to Whom, How,
and Why: Evidence from Buyer-Seller Business
Networks
Nov
2013
2013-25 Fukunari KIMURA
Reconstructing the Concept of “Single Market a
Production Base” for ASEAN beyond 2015
Oct
2013
2013-24
Olivier CADOT
Ernawati MUNADI
Lili Yan ING
Streamlining NTMs in ASEAN:
The Way Forward
Oct
2013
2013-23
Charles HARVIE,
Dionisius NARJOKO,
Sothea OUM
Small and Medium Enterprises’ Access to Finance:
Evidence from Selected Asian Economies
Oct
2013
2013-22 Alan Khee-Jin TAN Toward a Single Aviation Market in ASEAN:
Regulatory Reform and Industry Challenges
Oct
2013
2013-21
Hisanobu SHISHIDO,
Shintaro SUGIYAMA,
Fauziah ZEN
Moving MPAC Forward: Strengthening Public-
Private Partnership, Improving Project Portfolio
and in Search of Practical Financing Schemes
Oct
2013
2013-20
Barry DESKER, Mely
CABALLERO-
ANTHONY, Paul
TENG
Thought/Issues Paper on ASEAN Food Security:
Towards a more Comprehensive Framework
Oct
2013
2013-19
Toshihiro KUDO,
Satoru KUMAGAI, So
UMEZAKI
Making Myanmar the Star Growth Performer in
ASEAN in the Next Decade: A Proposal of Five
Growth Strategies
Sep
2013
2013-18 Ruperto MAJUCA
Managing Economic Shocks and Macroeconomic
Coordination in an Integrated Region: ASEAN
Beyond 2015
Sep
2013
2013-17
Cassy LEE and
Yoshifumi
FUKUNAGA
Competition Policy Challenges of Single Market
and Production Base
Sep
2013
2013-16 Simon TAY Growing an ASEAN Voice? : A Common Platform
in Global and Regional Governance
Sep
2013

43
No. Author(s) Title Year
2013-15
Danilo C. ISRAEL
and Roehlano M.
BRIONES
Impacts of Natural Disasters on Agriculture, Food
Security, and Natural Resources and Environment
in the Philippines
Aug
2013
2013-14 Allen Yu-Hung LAI
and Seck L. TAN
Impact of Disasters and Disaster Risk Management
in Singapore: A Case Study of Singapore’s
Experience in Fighting the SARS Epidemic
Aug
2013
2013-13 Brent LAYTON Impact of Natural Disasters on Production
Networks and Urbanization in New Zealand
Aug
2013
2013-12 Mitsuyo ANDO
Impact of Recent Crises and Disasters on Regional
Production/Distribution Networks and Trade in
Japan
Aug
2013
2013-11 Le Dang TRUNG Economic and Welfare Impacts of Disasters in East
Asia and Policy Responses: The Case of Vietnam
Aug
2013
2013-10
Sann VATHANA,
Sothea OUM, Ponhrith
KAN, Colas
CHERVIER
Impact of Disasters and Role of Social Protection
in Natural Disaster Risk Management in Cambodia
Aug
2013
2013-09
Sommarat
CHANTARAT, Krirk
PANNANGPETCH,
Nattapong
PUTTANAPONG,
Preesan RAKWATIN,
and Thanasin
TANOMPONGPHAN
DH
Index-Based Risk Financing and Development of
Natural Disaster Insurance Programs in Developing
Asian Countries
Aug
2013
2013-08 Ikumo ISONO and
Satoru KUMAGAI
Long-run Economic Impacts of Thai Flooding:
Geographical Simulation Analysis
July
2013
2013-07
Yoshifumi
FUKUNAGA and
Hikaru ISHIDO
Assessing the Progress of Services Liberalization in
the ASEAN-China Free Trade Area (ACFTA)
May
2013
2013-06
Ken ITAKURA,
Yoshifumi
FUKUNAGA, and
Ikumo ISONO
A CGE Study of Economic Impact of Accession of
Hong Kong to ASEAN-China Free Trade
Agreement
May
2013
2013-05 Misa OKABE and
Shujiro URATA The Impact of AFTA on Intra-AFTA Trade May

44
No. Author(s) Title Year
2013
2013-04 Kohei SHIINO How Far Will Hong Kong’s Accession to ACFTA
will Impact on Trade in Goods?
May
2013
2013-03
Cassey LEE and
Yoshifumi
FUKUNAGA
ASEAN Regional Cooperation on Competition
Policy
Apr
2013
2013-02
Yoshifumi
FUKUNAGA and
Ikumo ISONO
Taking ASEAN+1 FTAs towards the RCEP:
A Mapping Study
Jan
2013
2013-01 Ken ITAKURA
Impact of Liberalization and Improved
Connectivity and Facilitation in ASEAN for the
ASEAN Economic Community
Jan
2013
2012-17
Sun XUEGONG, Guo
LIYAN, Zeng
ZHENG
Market Entry Barriers for FDI and Private
Investors: Lessons from China’s Electricity Market
Aug
2012
2012-16 Yanrui WU Electricity Market Integration: Global Trends and
Implications for the EAS Region
Aug
2012
2012-15 Youngho CHANG,
Yanfei LI
Power Generation and Cross-border Grid Planning
for the Integrated ASEAN Electricity Market: A
Dynamic Linear Programming Model
Aug
2012
2012-14 Yanrui WU, Xunpeng
SHI
Economic Development, Energy Market
Integration and Energy Demand: Implications for
East Asia
Aug
2012
2012-13
Joshua AIZENMAN,
Minsoo LEE, and
Donghyun PARK
The Relationship between Structural Change and
Inequality: A Conceptual Overview with Special
Reference to Developing Asia
July
2012
2012-12
Hyun-Hoon LEE,
Minsoo LEE, and
Donghyun PARK
Growth Policy and Inequality in Developing Asia:
Lessons from Korea
July
2012
2012-11 Cassey LEE Knowledge Flows, Organization and Innovation:
Firm-Level Evidence from Malaysia
June
2012
2012-10
Jacques MAIRESSE,
Pierre MOHNEN,
Yayun ZHAO, and
Feng ZHEN
Globalization, Innovation and Productivity in
Manufacturing Firms: A Study of Four Sectors of
China
June
2012

45
No. Author(s) Title Year
2012-09 Ari KUNCORO
Globalization and Innovation in Indonesia:
Evidence from Micro-Data on Medium and Large
Manufacturing Establishments
June
2012
2012-08 Alfons
PALANGKARAYA
The Link between Innovation and Export: Evidence
from Australia’s Small and Medium Enterprises
June
2012
2012-07 Chin Hee HAHN and
Chang-Gyun PARK
Direction of Causality in Innovation-Exporting
Linkage: Evidence on Korean Manufacturing
June
2012
2012-06 Keiko ITO Source of Learning-by-Exporting Effects: Does
Exporting Promote Innovation?
June
2012
2012-05 Rafaelita M.
ALDABA
Trade Reforms, Competition, and Innovation in the
Philippines
June
2012
2012-04
Toshiyuki
MATSUURA and
Kazunobu
HAYAKAWA
The Role of Trade Costs in FDI Strategy of
Heterogeneous Firms: Evidence from Japanese
Firm-level Data
June
2012
2012-03
Kazunobu
HAYAKAWA,
Fukunari KIMURA,
and Hyun-Hoon LEE
How Does Country Risk Matter for Foreign Direct
Investment?
Feb
2012
2012-02
Ikumo ISONO, Satoru
KUMAGAI, Fukunari
KIMURA
Agglomeration and Dispersion in China and
ASEAN:
A Geographical Simulation Analysis
Jan
2012
2012-01 Mitsuyo ANDO and
Fukunari KIMURA
How Did the Japanese Exports Respond to Two
Crises in the International Production Network?:
The Global Financial Crisis and the East Japan
Earthquake
Jan
2012
2011-10
Tomohiro
MACHIKITA and
Yasushi UEKI
Interactive Learning-driven Innovation in
Upstream-Downstream Relations: Evidence from
Mutual Exchanges of Engineers in Developing
Economies
Dec
2011
2011-09
Joseph D. ALBA,
Wai-Mun CHIA, and
Donghyun PARK
Foreign Output Shocks and Monetary Policy
Regimes in Small Open Economies: A DSGE
Evaluation of East Asia
Dec
2011
2011-08
Tomohiro
MACHIKITA and
Yasushi UEKI
Impacts of Incoming Knowledge on Product
Innovation: Econometric Case Studies of
Technology Transfer of Auto-related Industries in
Developing Economies
Nov
2011

46
No. Author(s) Title Year
2011-07 Yanrui WU Gas Market Integration: Global Trends and
Implications for the EAS Region
Nov
2011
2011-06 Philip Andrews-
SPEED
Energy Market Integration in East Asia: A
Regional Public Goods Approach
Nov
2011
2011-05 Yu SHENG,
Xunpeng SHI
Energy Market Integration and Economic
Convergence: Implications for East Asia
Oct
2011
2011-04
Sang-Hyop LEE,
Andrew MASON, and
Donghyun PARK
Why Does Population Aging Matter So Much for
Asia? Population Aging, Economic Security and
Economic Growth in Asia
Aug
2011
2011-03 Xunpeng SHI,
Shinichi GOTO
Harmonizing Biodiesel Fuel Standards in East Asia:
Current Status, Challenges and the Way Forward
May
2011
2011-02 Hikari ISHIDO
Liberalization of Trade in Services under
ASEAN+n :
A Mapping Exercise
May
2011
2011-01
Kuo-I CHANG,
Kazunobu
HAYAKAWA
Toshiyuki
MATSUURA
Location Choice of Multinational Enterprises in
China: Comparison between Japan and Taiwan
Mar
2011
2010-11
Charles HARVIE,
Dionisius NARJOKO,
Sothea OUM
Firm Characteristic Determinants of SME
Participation in Production Networks
Oct
2010
2010-10 Mitsuyo ANDO Machinery Trade in East Asia, and the Global
Financial Crisis
Oct
2010
2010-09 Fukunari KIMURA
Ayako OBASHI
International Production Networks in Machinery
Industries: Structure and Its Evolution
Sep
2010
2010-08
Tomohiro
MACHIKITA, Shoichi
MIYAHARA,
Masatsugu TSUJI, and
Yasushi UEKI
Detecting Effective Knowledge Sources in Product
Innovation: Evidence from Local Firms and
MNCs/JVs in Southeast Asia
Aug
2010
2010-07
Tomohiro
MACHIKITA,
Masatsugu TSUJI, and
Yasushi UEKI
How ICTs Raise Manufacturing Performance:
Firm-level Evidence in Southeast Asia
Aug
2010

47
No. Author(s) Title Year
2010-06 Xunpeng SHI
Carbon Footprint Labeling Activities in the East
Asia Summit Region: Spillover Effects to Less
Developed Countries
July
2010
2010-05
Kazunobu
HAYAKAWA,
Fukunari KIMURA,
and
Tomohiro
MACHIKITA
Firm-level Analysis of Globalization: A Survey of
the Eight Literatures
Mar
2010
2010-04
Tomohiro
MACHIKITA
and Yasushi UEKI
The Impacts of Face-to-face and Frequent
Interactions on Innovation:
Upstream-Downstream Relations
Feb
2010
2010-03
Tomohiro
MACHIKITA
and Yasushi UEKI
Innovation in Linked and Non-linked Firms:
Effects of Variety of Linkages in East Asia
Feb
2010
2010-02
Tomohiro
MACHIKITA
and Yasushi UEKI
Search-theoretic Approach to Securing New
Suppliers: Impacts of Geographic Proximity for
Importer and Non-importer
Feb
2010
2010-01
Tomohiro
MACHIKITA
and Yasushi UEKI
Spatial Architecture of the Production Networks in
Southeast Asia:
Empirical Evidence from Firm-level Data
Feb
2010
2009-23 Dionisius NARJOKO
Foreign Presence Spillovers and Firms’ Export
Response:
Evidence from the Indonesian Manufacturing
Nov
2009
2009-22
Kazunobu
HAYAKAWA,
Daisuke
HIRATSUKA, Kohei
SHIINO, and Seiya
SUKEGAWA
Who Uses Free Trade Agreements? Nov
2009
2009-21 Ayako OBASHI Resiliency of Production Networks in Asia:
Evidence from the Asian Crisis
Oct
2009
2009-20 Mitsuyo ANDO and
Fukunari KIMURA Fragmentation in East Asia: Further Evidence
Oct
2009
2009-19 Xunpeng SHI The Prospects for Coal: Global Experience and
Implications for Energy Policy
Sept
2009

48
No. Author(s) Title Year
2009-18 Sothea OUM Income Distribution and Poverty in a CGE
Framework: A Proposed Methodology
Jun
2009
2009-17
Erlinda M.
MEDALLA and Jenny
BALBOA
ASEAN Rules of Origin: Lessons and
Recommendations for the Best Practice
Jun
2009
2009-16 Masami ISHIDA Special Economic Zones and Economic Corridors Jun
2009
2009-15 Toshihiro KUDO Border Area Development in the GMS: Turning the
Periphery into the Center of Growth
May
2009
2009-14
Claire HOLLWEG
and Marn-Heong
WONG
Measuring Regulatory Restrictions in Logistics
Services
Apr
2009
2009-13 Loreli C. De DIOS Business View on Trade Facilitation Apr
2009
2009-12
Patricia SOURDIN
and Richard
POMFRET
Monitoring Trade Costs in Southeast Asia Apr
2009
2009-11 Philippa DEE and
Huong DINH
Barriers to Trade in Health and Financial Services
in ASEAN
Apr
2009
2009-10 Sayuri SHIRAI
The Impact of the US Subprime Mortgage Crisis on
the World and East Asia: Through Analyses of
Cross-border Capital Movements
Apr
2009
2009-09 Mitsuyo ANDO and
Akie IRIYAMA
International Production Networks and
Export/Import Responsiveness to Exchange Rates:
The Case of Japanese Manufacturing Firms
Mar
2009
2009-08 Archanun
KOHPAIBOON
Vertical and Horizontal FDI Technology
Spillovers:Evidence from Thai Manufacturing
Mar
2009
2009-07
Kazunobu
HAYAKAWA,
Fukunari KIMURA,
and Toshiyuki
MATSUURA
Gains from Fragmentation at the Firm Level:
Evidence from Japanese Multinationals in East
Asia
Mar
2009
2009-06 Dionisius A.
NARJOKO
Plant Entry in a More
LiberalisedIndustrialisationProcess: An Experience
of Indonesian Manufacturing during the 1990s
Mar
2009
2009-05 Kazunobu
HAYAKAWA,
Fukunari KIMURA,
Firm-level Analysis of Globalization: A Survey Mar
2009

49
No. Author(s) Title Year
and Tomohiro
MACHIKITA
2009-04 Chin Hee HAHN and
Chang-Gyun PARK
Learning-by-exporting in Korean Manufacturing:
A Plant-level Analysis
Mar
2009
2009-03 Ayako OBASHI Stability of Production Networks in East Asia:
Duration and Survival of Trade
Mar
2009
2009-02 Fukunari KIMURA
The Spatial Structure of Production/Distribution
Networks and Its Implication for Technology
Transfers and Spillovers
Mar
2009
2009-01 Fukunari KIMURA
and Ayako OBASHI
International Production Networks: Comparison
between China and ASEAN
Jan
2009
2008-03
Kazunobu
HAYAKAWA and
Fukunari KIMURA
The Effect of Exchange Rate Volatility on
International Trade in East Asia
Dec
2008
2008-02
Satoru KUMAGAI,
Toshitaka GOKAN,
Ikumo ISONO, and
Souknilanh KEOLA
Predicting Long-Term Effects of Infrastructure
Development Projects in Continental South East
Asia: IDE Geographical Simulation Model
Dec
2008
2008-01
Kazunobu
HAYAKAWA,
Fukunari KIMURA,
and Tomohiro
MACHIKITA
Firm-level Analysis of Globalization: A Survey Dec
2008


