How Inflation Behavior Helps In the Estimation of Potential Real GDP Robert J. Gordon, Northwestern...
36
How Inflation Behavior Helps In the Estimation of Potential Real GDP Robert J. Gordon, Northwestern University Presented at Conference European and American Labor Markets in the Crisis Paris, November 7, 2014
-
Upload
piers-campbell -
Category
Documents
-
view
215 -
download
0
Transcript of How Inflation Behavior Helps In the Estimation of Potential Real GDP Robert J. Gordon, Northwestern...

How Inflation Behavior HelpsIn the Estimation of Potential Real GDP
Robert J. Gordon, Northwestern UniversityPresented at Conference
European and American Labor Markets in the CrisisParis, November 7, 2014
This Talk is ONLY About the U.S.
• First we’ll look at the inflation behavior that must be explained, with its twin peaks and later valley• Then we’ll look at a startling scatter plot
of inflation vs. unemployment. Where is the relationship? There is none visible – how can the Fed discuss monetary policy in the context of Taylor’s rule?
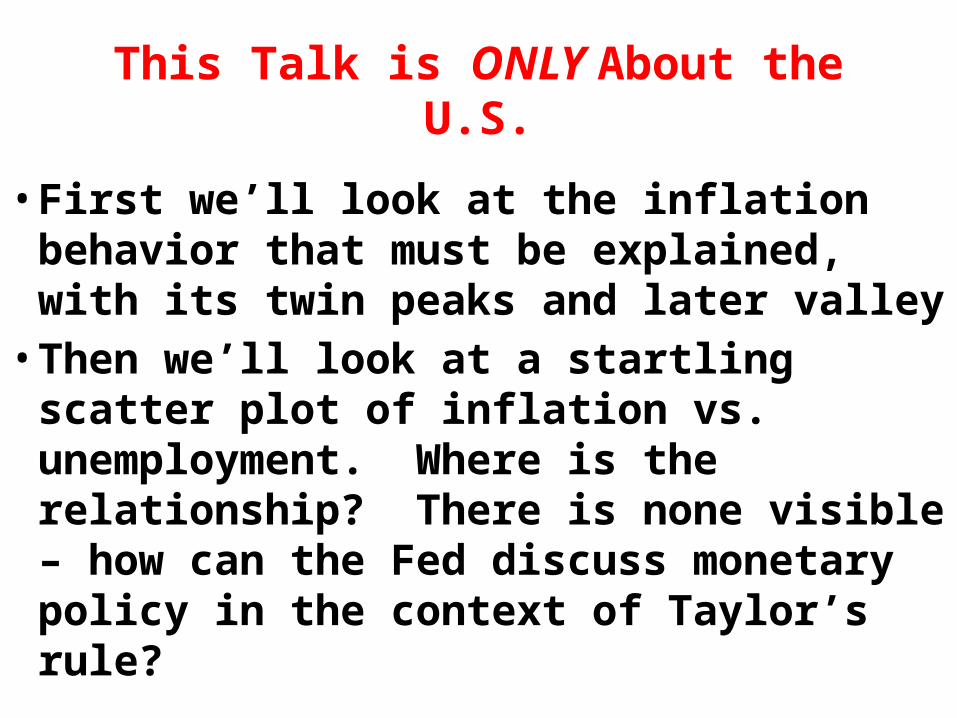
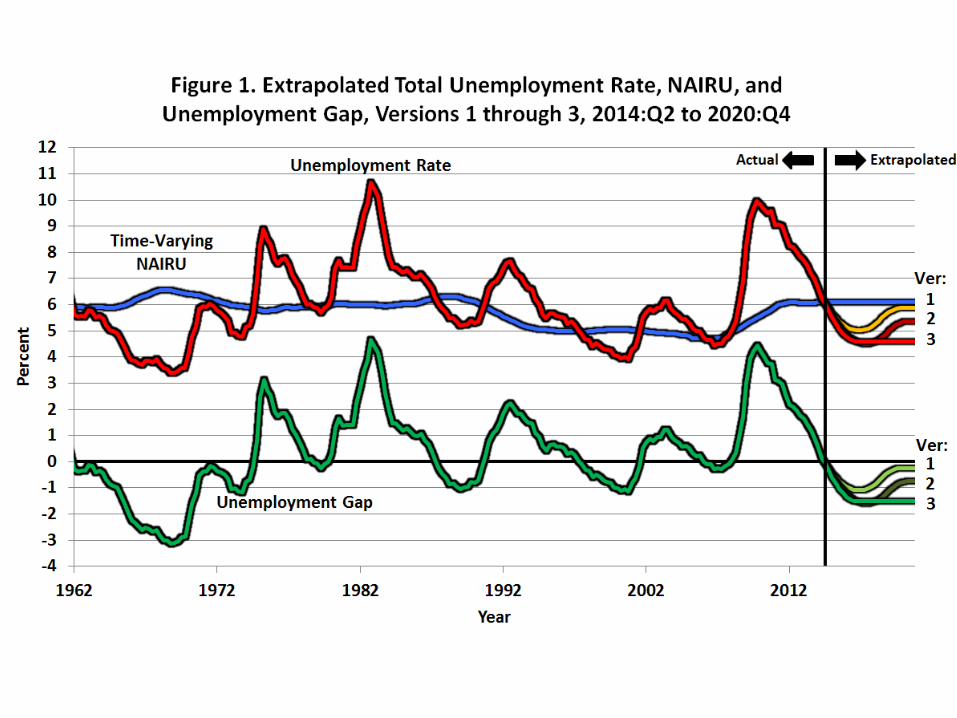
Hidden Down Underneath –A Stable Unemployment-inflation Tradeoff
• We estimate a steady-inflation NAIRU• This allows us to estimate the unemployment gap
between actual unemployment and the NAIRU• That “ugap” then can be used to detrend output,
hours, and productivity• We emerge in the end with– A stable inflation equation– New and startling estimates of potential real GDP
growth for the U.S. economy

U.S. PCE Deflator Headline Inflation:Notice the Twin Peaks and Valley

Have You Ever Seen A Scatter PlotWith a Lower Correlation?
Why Should Inflation Be RelatedOnly to Unemployment?
• This casts aside microeconomics as it was developed more than 100 years ago.
• Does the price of oil have one determinant, the demand for oil?
• Of course not, the closing of a refinery in Iraq can raise the price of oil
• THE PRICE LEVEL OF ANY GOOD DEPENDS ON SUPPLY AND DEMAND
• Why not also true of macroeconomics – unemployment represents the demand side but the supply side matters as well.
Inflation Depends on Demandand Supply
• I introduced this theory, that supply matters as much as demand, into macroeconomics in 1975, almost 40 years ago.
• “Alternative Responses of Policy to Adverse Supply Shocks,” BPEA, 1975, no. 1, pp. 183-206.
• It has been part of macro textbooks since 1978.• An adverse supply shock, e.g., a 6-fold increase of the price of
oil as in 1972-74, chews up consumer expenditures and leaves less remaining to buy non-oil/energy products
• The rest of the economy outside the energy sector goes into recession.
• Price flexibility for energy and price rigidity for non-energy
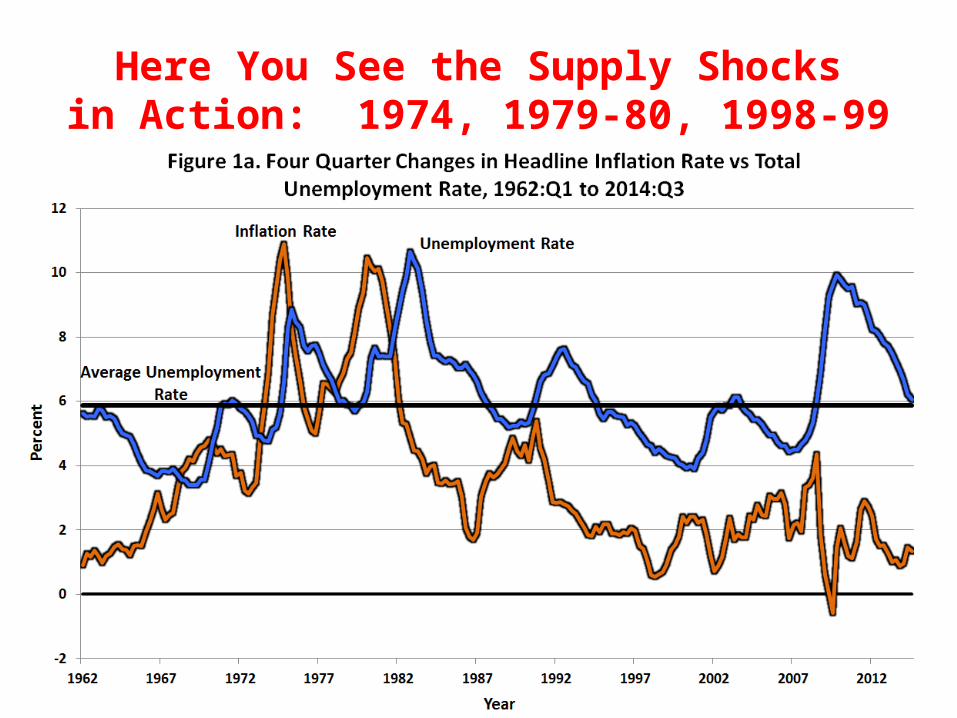
Here You See the Supply Shocksin Action: 1974, 1979-80, 1998-99

Fed Looks at Core PCE Inflation;Tonight We’ll Focus on Headline Inflation
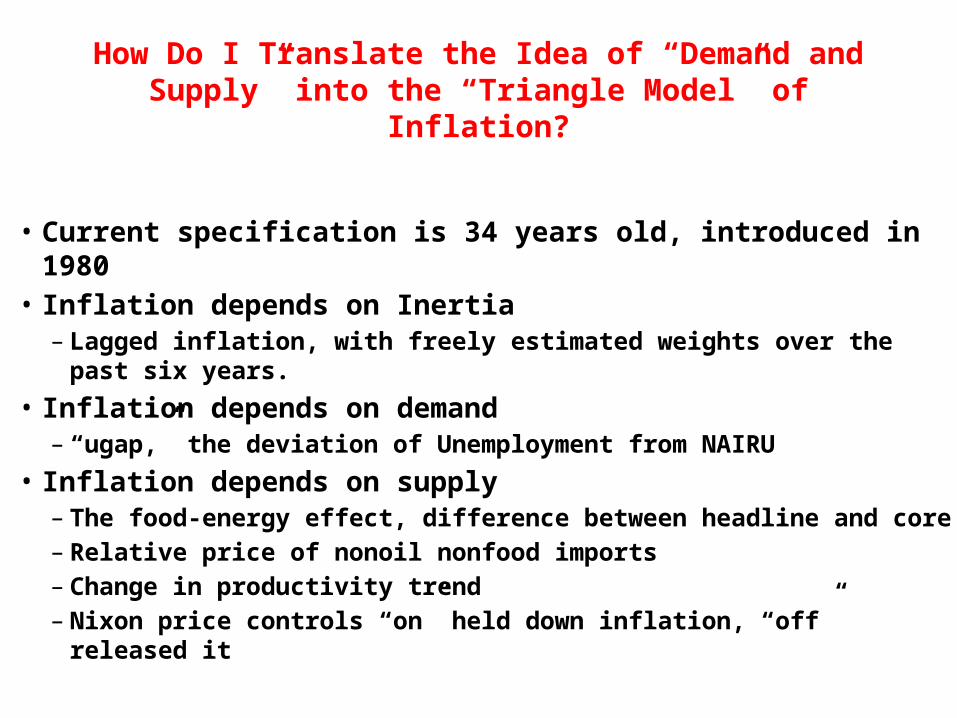
How Do I Translate the Idea of “Demand and Supply” into the “Triangle Model” of Inflation?
• Current specification is 34 years old, introduced in 1980• Inflation depends on Inertia
– Lagged inflation, with freely estimated weights over the past six years.
• Inflation depends on demand– “ugap,” the deviation of Unemployment from NAIRU
• Inflation depends on supply– The food-energy effect, difference between headline and core– Relative price of nonoil nonfood imports– Change in productivity trend– Nixon price controls “on” held down inflation, “off” released it

The Food-Energy Effect is theDifference Between Headline and Core Inflation

The Relative Price of Nonoil, nonfood Imports Also Matters (Change of scale)

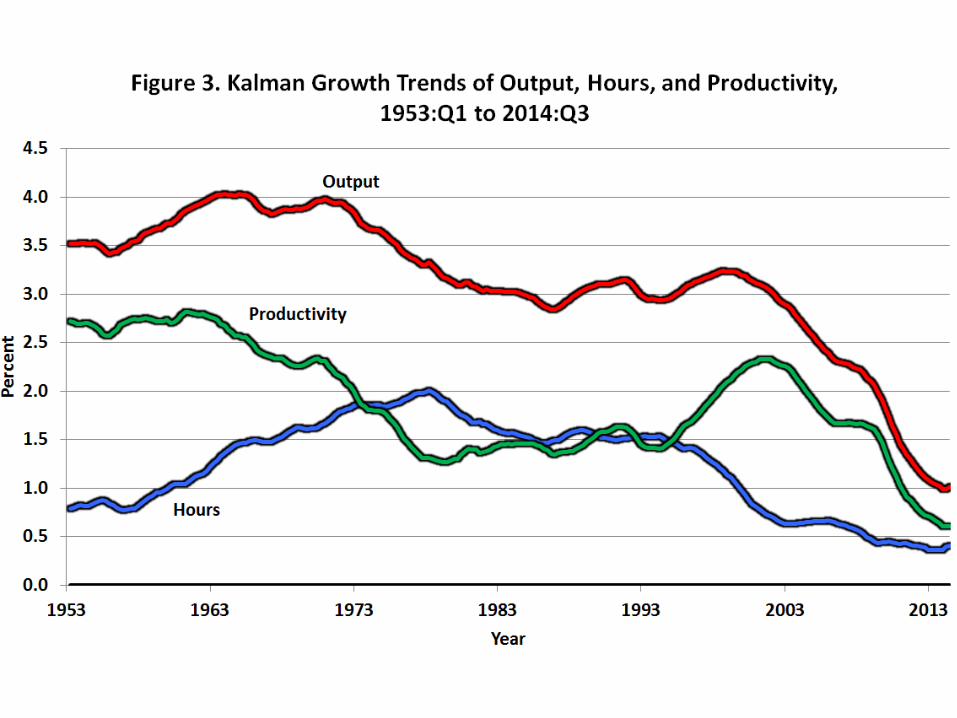
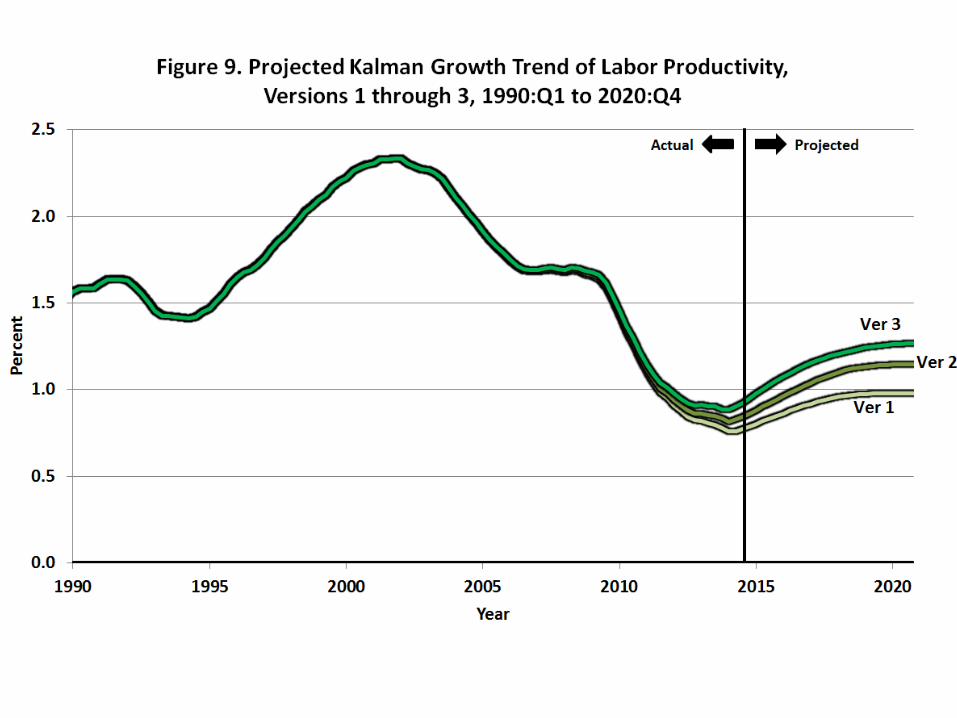
Productivity Growth Matters a Lot:Here is the Productivity Growth Trend
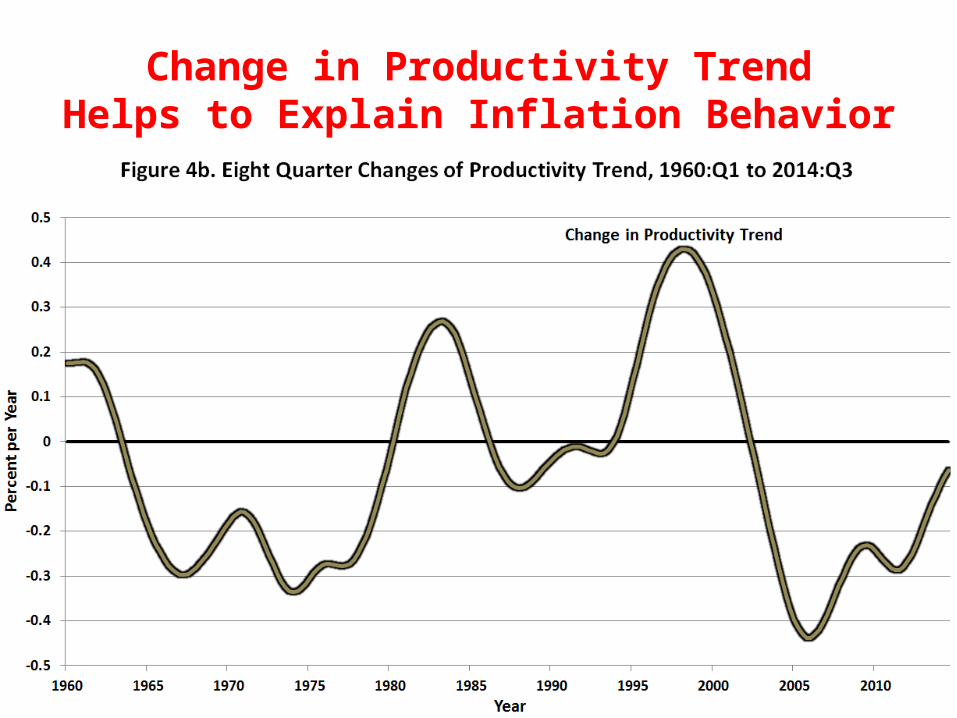
Change in Productivity TrendHelps to Explain Inflation Behavior

Which Unemployment Rate to Drive the Inflation Process?
• All the literature before my 2013 WP used the total unemployment rate
• In past year there has been a big debate about whether short-term unemployment (< 6 months) matters more for wages and inflation than long-term unemployment (> 6 months).
• The two measures behave identically until 2009, then very different

Which Unemployment Rate Drives Inflation?

Debate Whether the LTU Are Disconnected from the Labor Market
• Part of this is real: skills atrophy when workers are out of work for 6 months, 1 year, even 5 years
• All the decline in LTU over the past year is more than accounted for by labor-force dropping out. The average long-term unemployed person leaves the labor force rather than taking a job.
• Employers are described as rejecting applications from LTU, looking for gaps of 6 months or more in their employment experience. Employers use the lack of employment as a “signal” that something else is wrong with the applicant.
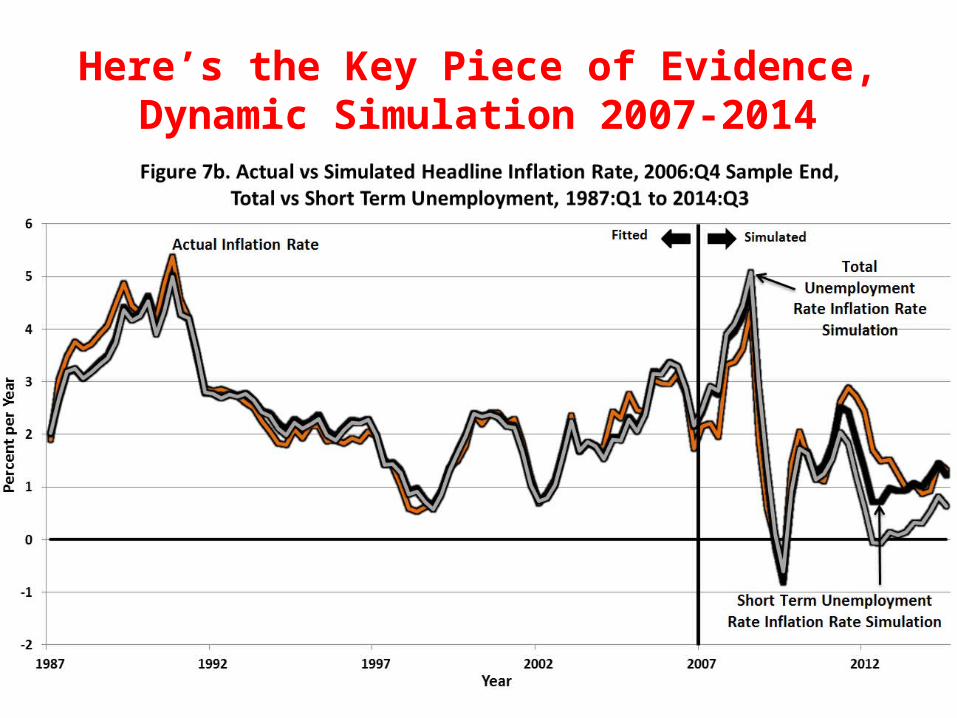
Here’s the Key Piece of Evidence,Dynamic Simulation 2007-2014
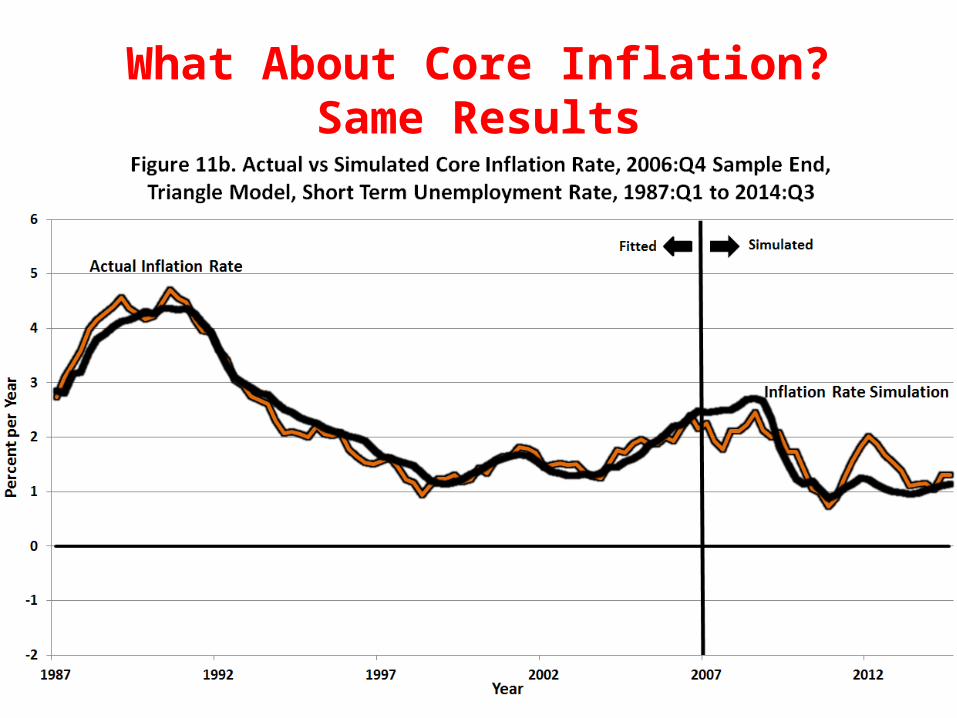
What About Core Inflation?Same Results
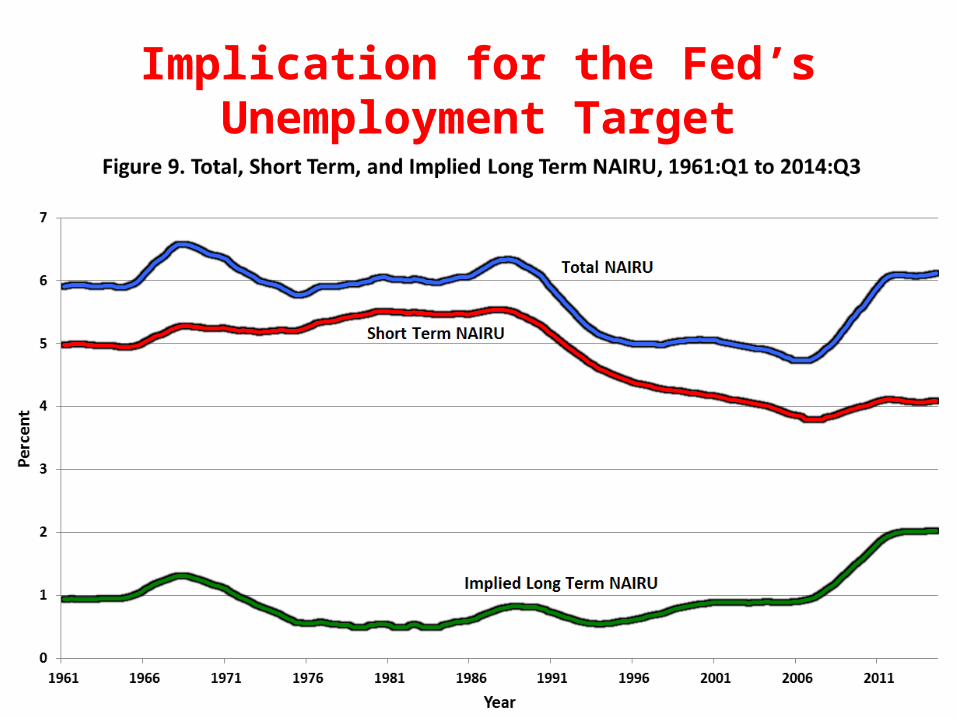
Implication for the Fed’s Unemployment Target
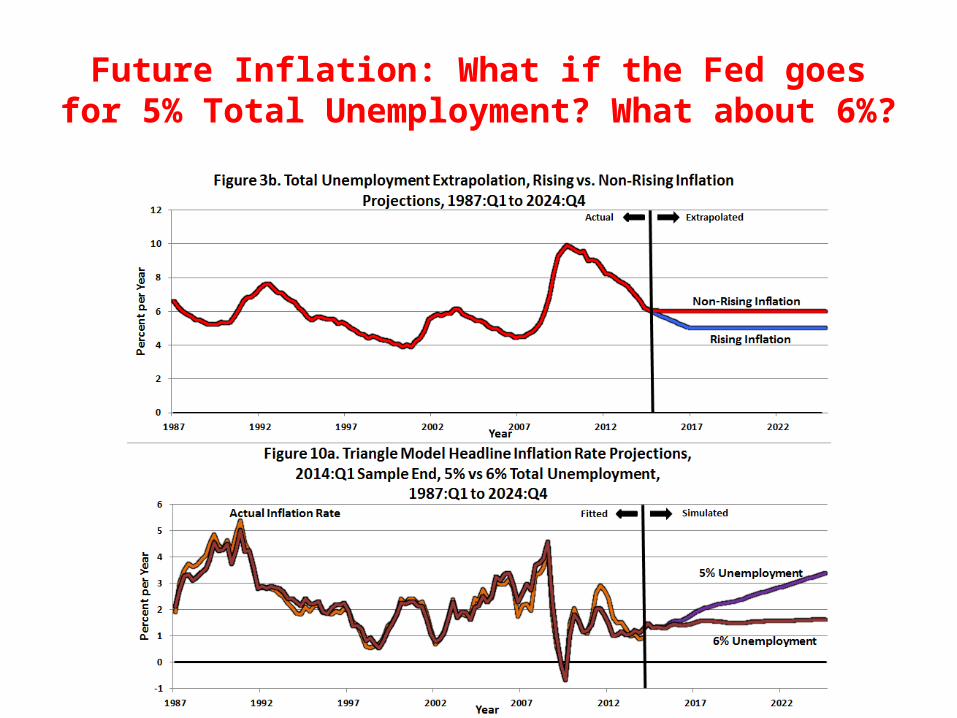
Future Inflation: What if the Fed goes for 5% Total Unemployment? What about 6%?

The Golden Path of Unemployment that Leads to 2% Inflation

Let’s Use the Inflation Model to Predict Alternative Outcomes
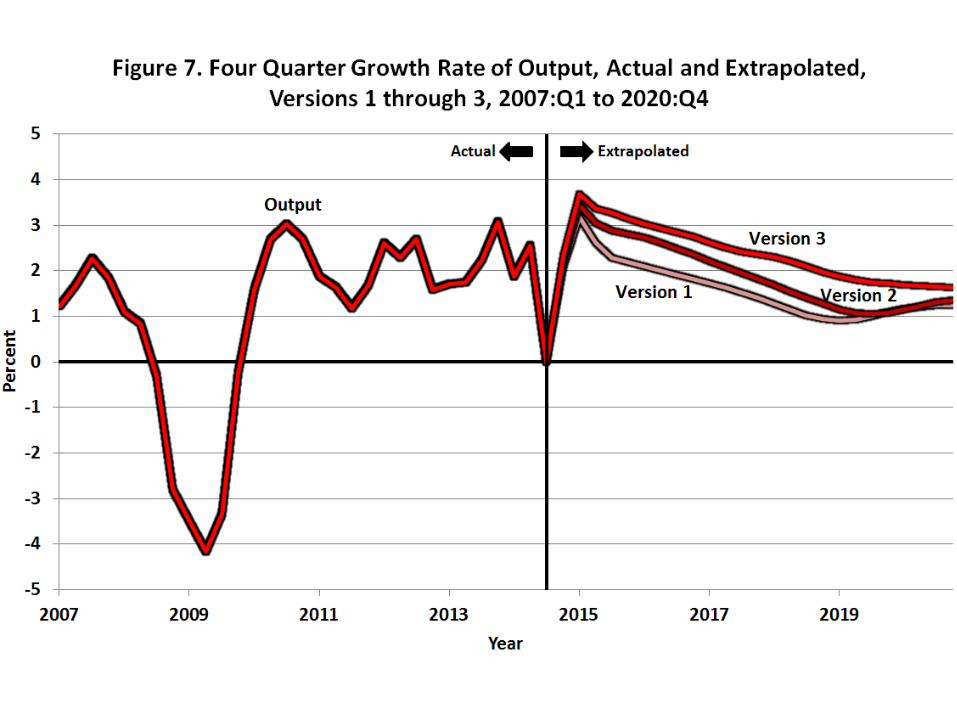
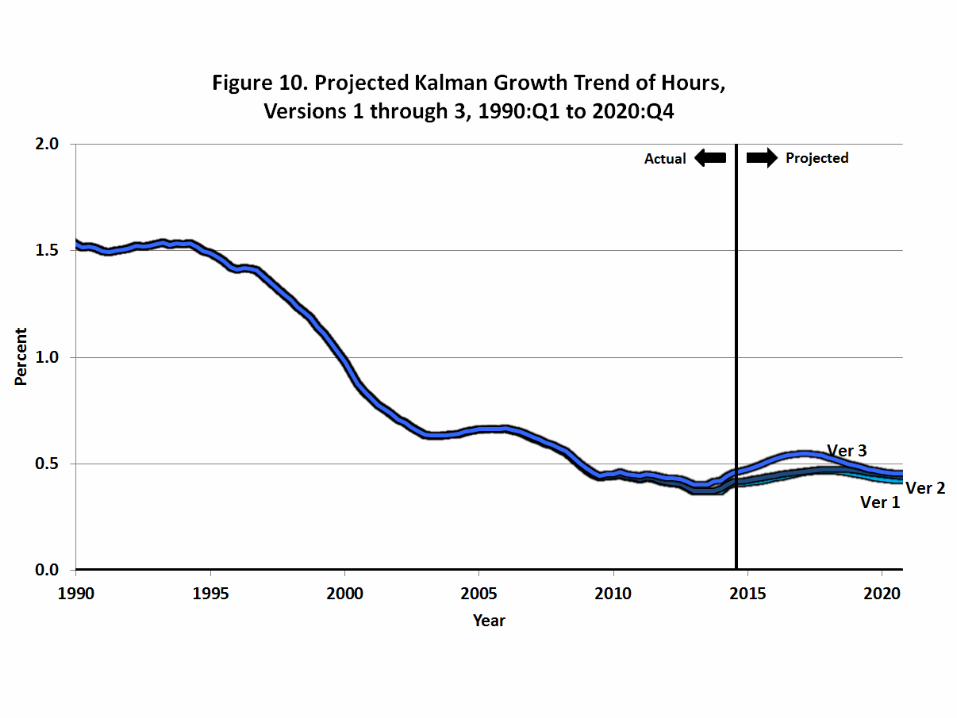
• Basic Tool: the Output Identity• By Definition Real GDP Growth (y) = Sum of
Growth in– Output per Hour (y – h)– Hours per employee (h – e)– Employment rate (e – l)– Labor force participation rate (l – n)– Working age population (n)

Exercise: Choose Three AlternativePaths of the Unemployment Rate
• Path 1. Conservative, little further decline in U rate• Path 2. Medium, unemployment
drops to 5% but then returns to 5.5%• Path 3. Aggressive. Unemployment
drops to 4.8% and stays there forever.


Broader Conclusions: Is Inflation Still Related to Unemployment?
• In 1975 we translated the microeconomic theory of the price of wheat to the macro economy. The inflation rate depends on demand and supply.
• Any approach to inflation that neglects supply shocks is bound to fail, and to distort the effect of unemployment on inflation
• Inflation is a very slow-moving process, so that Fed can’t react to the latest news. It needs a model.
• My good old 1980 model matters. The Fed should pay attention, and it is paying attention.