Ad-hoc Limited Scale-Free Models for Unstructured Peer-to-Peer Networks
CMMI Technology ConferenceNovember 16-19, 2009
Diane Mizukami-WilliamsNorthrop Grumman Corporation
How I Created Our Peer Review
Baselines and Models
1
Analyzing the data to findX factors (model inputs)
Creating the model How projects use the model Full circle – the OPP OID
connection
Agenda
2
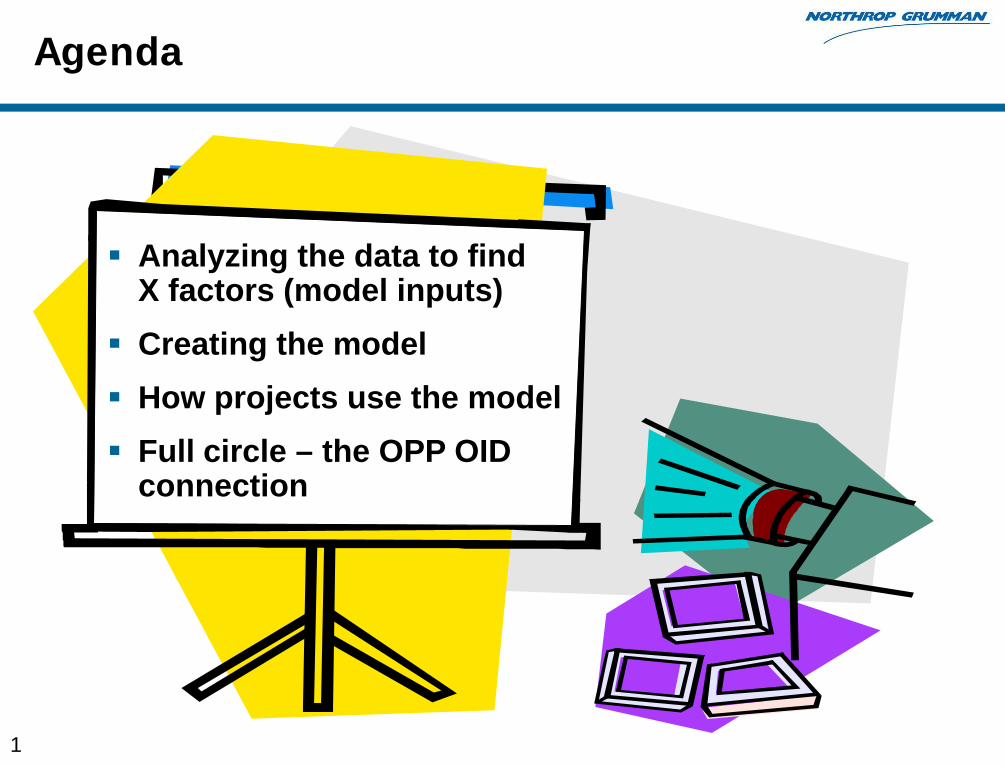
IS Sector• $10 billion in sales in 2008• 7,000 contracts• 33,000 employees
Products and Services• Mission support• Cybersecurity• Command, control, and communications• Enterprise applications• IT & network infrastructure• Management & engineering services • Intelligence, surveillance, & reconnaissance
AdvisoryServices
18%
Civil/State &Local/Commercial
22%
Northrop Grumman Information Systems (IS) Sector
CMMI Appraisals• Over 80 organizations (over 250 projects) appraised at Level 3 or higher
3
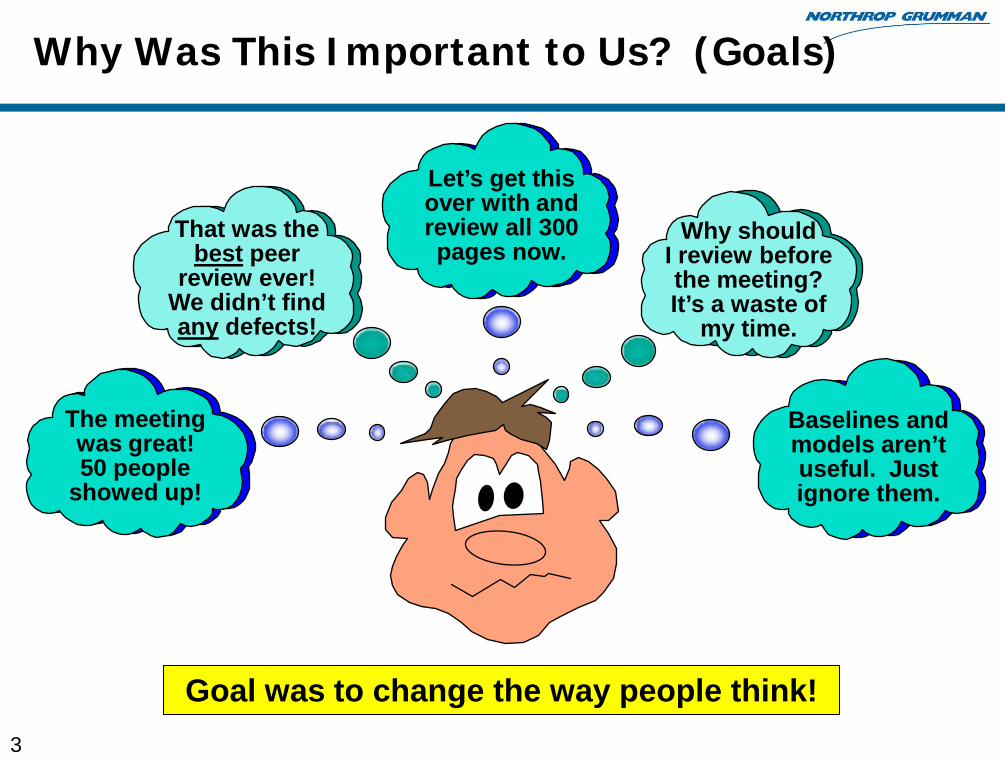
Why Was This Important to Us? (Goals)
That was the best peer
review ever! We didn’t find any defects!
The meeting was great! 50 people
showed up!
Let’s get this over with and review all 300 pages now.
Why shouldI review before the meeting? It’s a waste of
my time.
Baselines and models aren’t useful. Just ignore them.
Goal was to change the way people think!
4
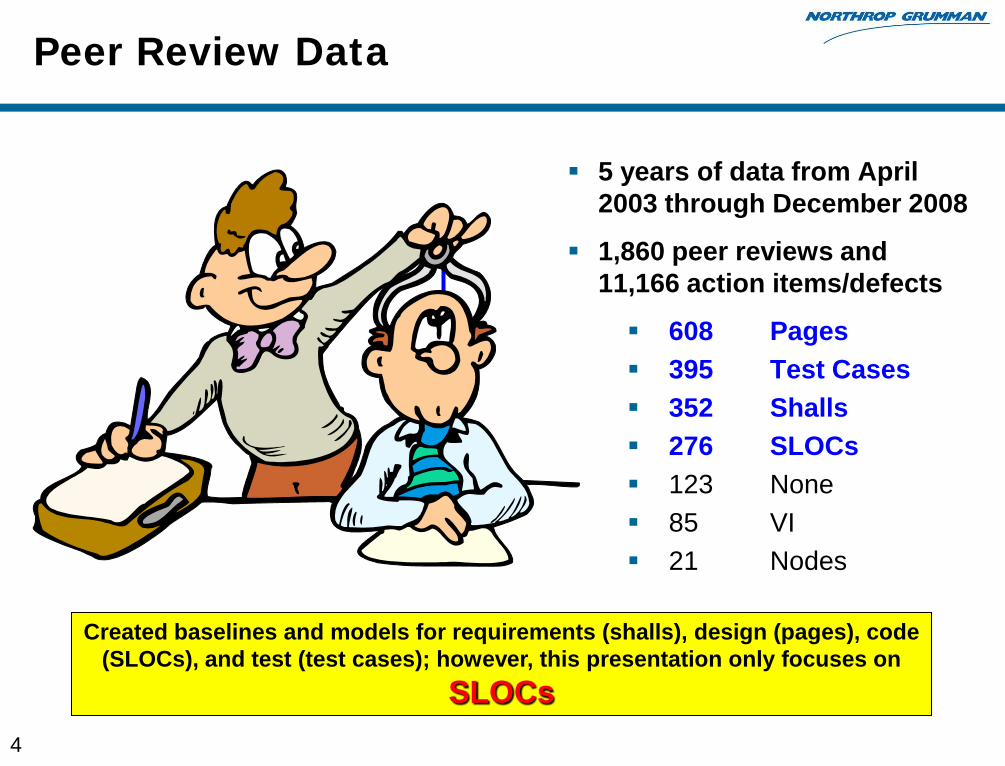
Peer Review Data
5 years of data from April 2003 through December 2008
1,860 peer reviews and 11,166 action items/defects
608 Pages 395 Test Cases 352 Shalls 276 SLOCs 123 None 85 VI 21 Nodes
Created baselines and models for requirements (shalls), design (pages), code (SLOCs), and test (test cases); however, this presentation only focuses on
SLOCs
5
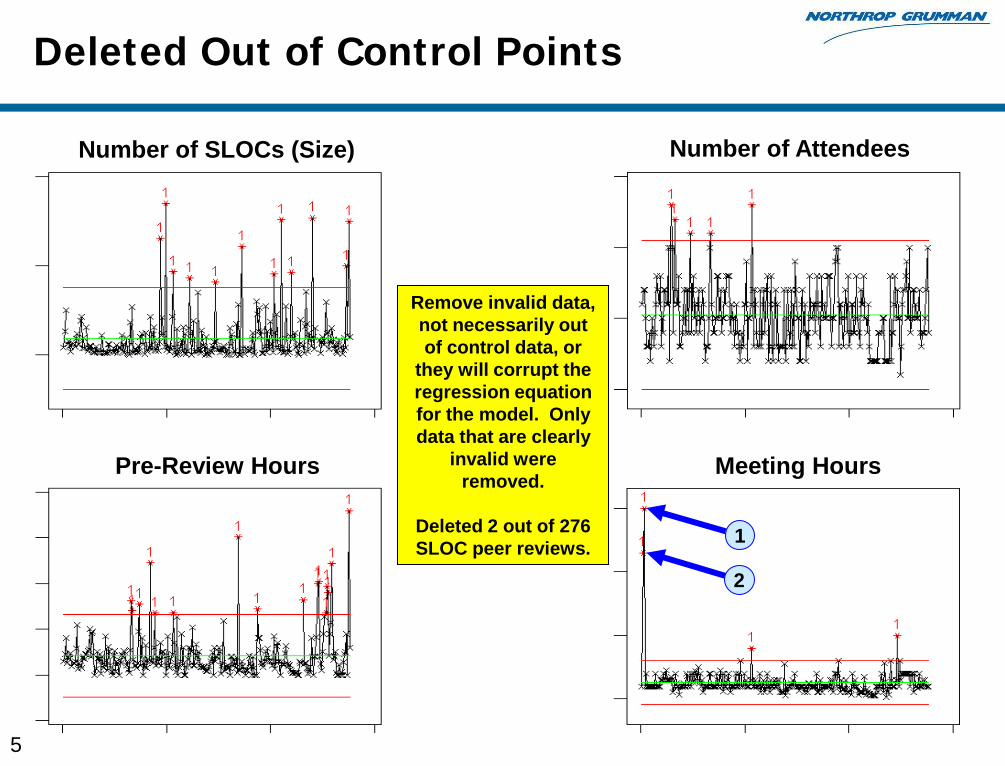
Deleted Out of Control Points
Remove invalid data, not necessarily out of control data, or
they will corrupt the regression equation for the model. Only data that are clearly
invalid were removed.
Deleted 2 out of 276 SLOC peer reviews. 1
2
Number of SLOCs (Size) Number of Attendees
Pre-Review Hours Meeting Hours
6
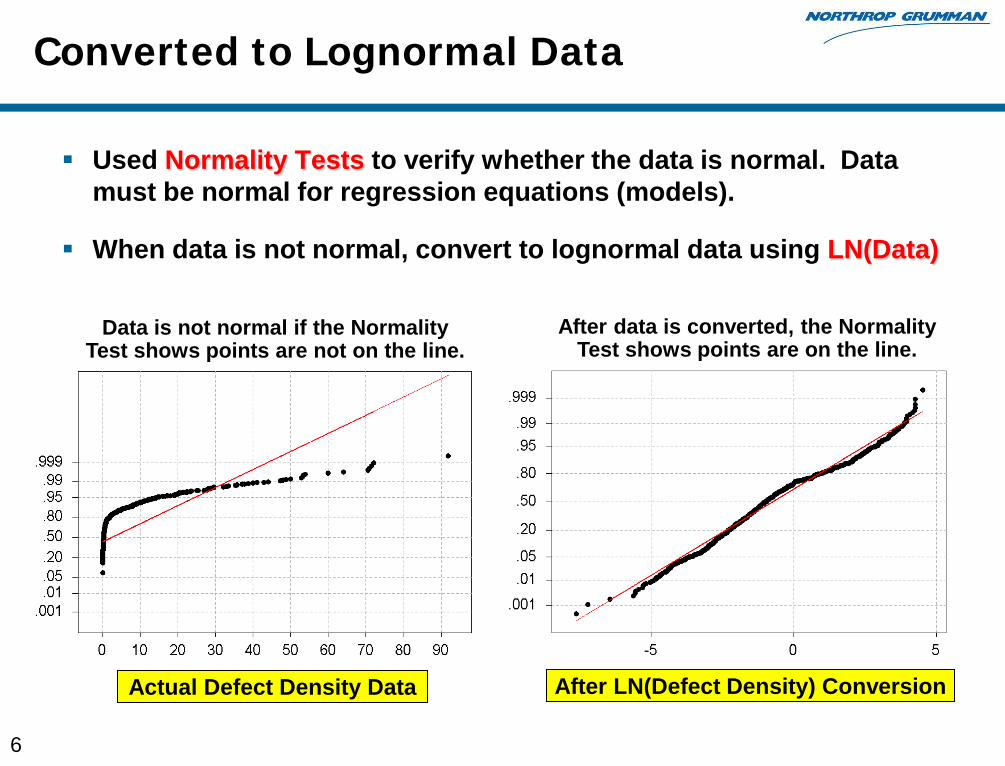
Converted to Lognormal Data
Used Normality Tests to verify whether the data is normal. Data must be normal for regression equations (models).
When data is not normal, convert to lognormal data using LN(Data)
Actual Defect Density Data After LN(Defect Density) Conversion
Data is not normal if the Normality Test shows points are not on the line.
After data is converted, the Normality Test shows points are on the line.
7
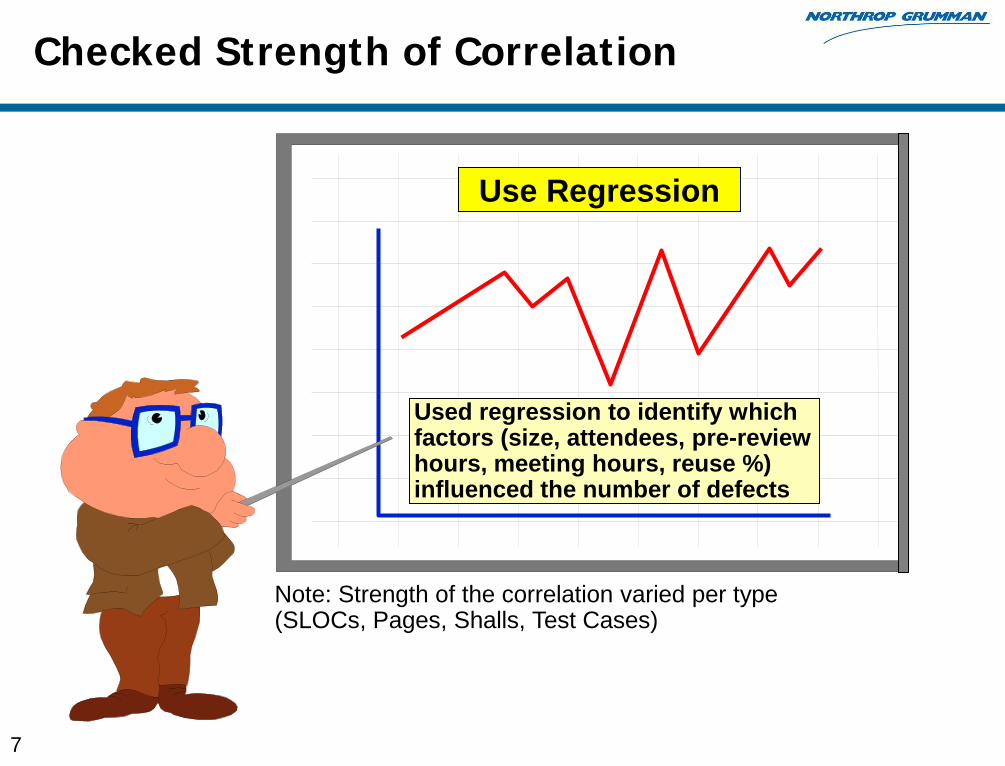
Checked Strength of Correlation
Use Regression
Used regression to identify which factors (size, attendees, pre-review hours, meeting hours, reuse %) influenced the number of defects
Note: Strength of the correlation varied per type (SLOCs, Pages, Shalls, Test Cases)
8
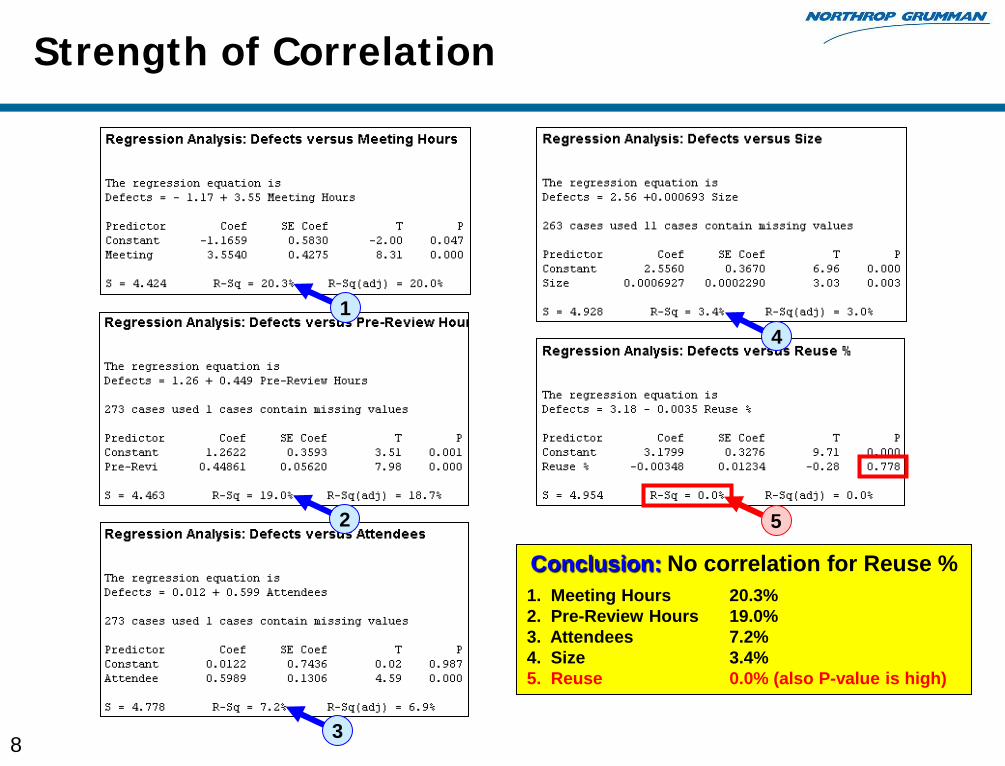
Strength of Correlation
Conclusion: No correlation for Reuse %1. Meeting Hours 20.3%2. Pre-Review Hours 19.0%3. Attendees 7.2%4. Size 3.4%5. Reuse 0.0% (also P-value is high)
1
2
3
4
5
9
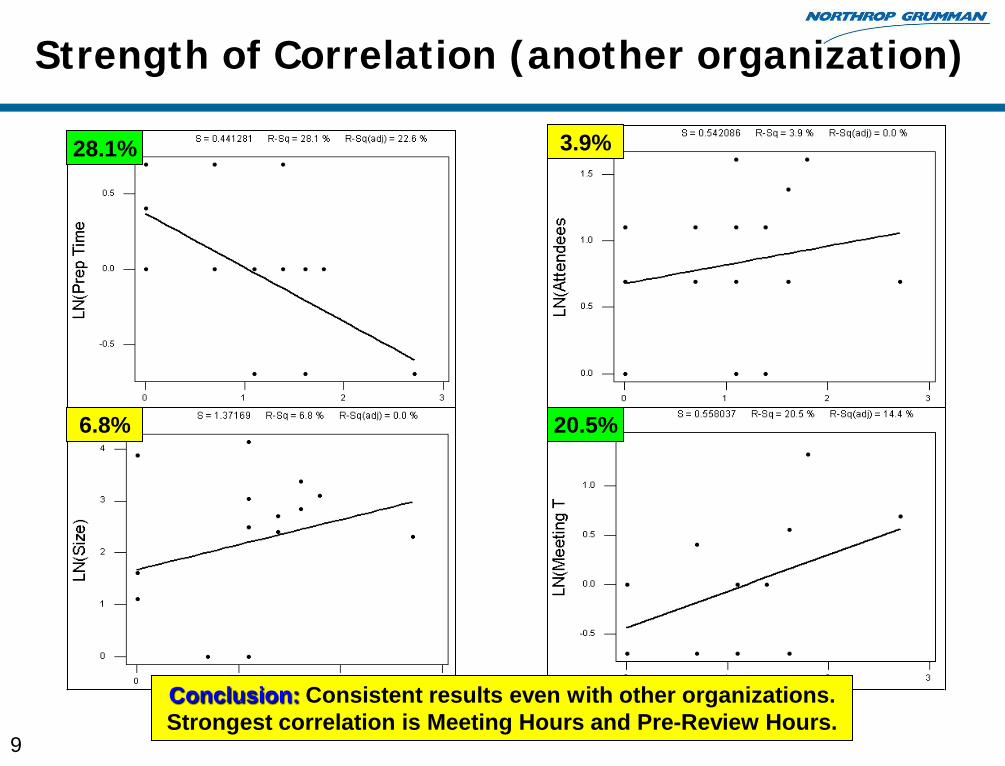
Strength of Correlation (another organization)
28.1% 3.9%
20.5%6.8%
Conclusion: Consistent results even with other organizations.Strongest correlation is Meeting Hours and Pre-Review Hours.
10
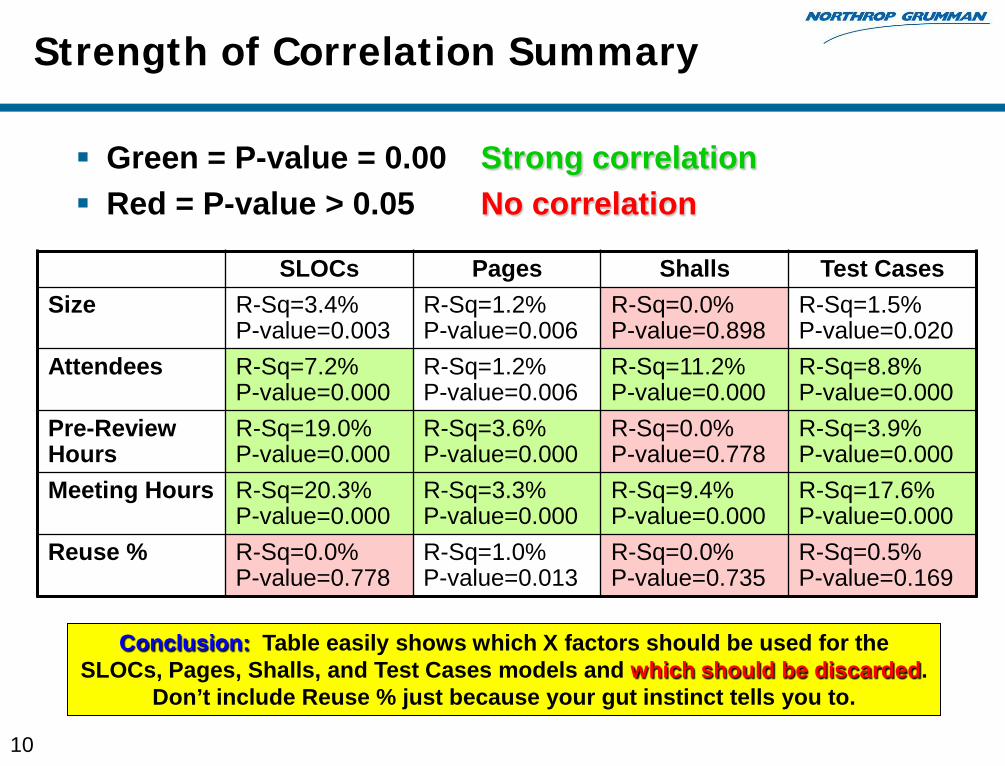
Strength of Correlation Summary
SLOCs Pages Shalls Test CasesSize R-Sq=3.4%
P-value=0.003R-Sq=1.2%P-value=0.006
R-Sq=0.0%P-value=0.898
R-Sq=1.5%P-value=0.020
Attendees R-Sq=7.2%P-value=0.000
R-Sq=1.2%P-value=0.006
R-Sq=11.2%P-value=0.000
R-Sq=8.8%P-value=0.000
Pre-Review Hours
R-Sq=19.0%P-value=0.000
R-Sq=3.6%P-value=0.000
R-Sq=0.0%P-value=0.778
R-Sq=3.9%P-value=0.000
Meeting Hours R-Sq=20.3%P-value=0.000
R-Sq=3.3%P-value=0.000
R-Sq=9.4%P-value=0.000
R-Sq=17.6%P-value=0.000
Reuse % R-Sq=0.0%P-value=0.778
R-Sq=1.0%P-value=0.013
R-Sq=0.0%P-value=0.735
R-Sq=0.5%P-value=0.169
Green = P-value = 0.00 Strong correlation Red = P-value > 0.05 No correlation
Conclusion: Table easily shows which X factors should be used for the SLOCs, Pages, Shalls, and Test Cases models and which should be discarded.
Don’t include Reuse % just because your gut instinct tells you to.
11
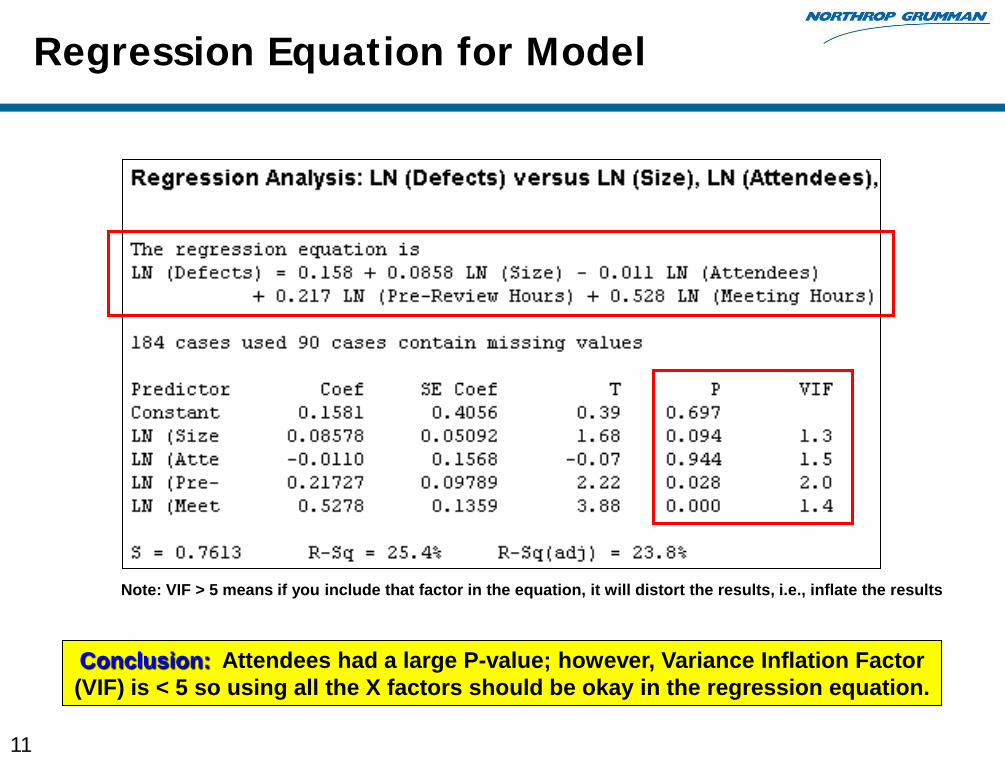
Regression Equation for Model
Conclusion: Attendees had a large P-value; however, Variance Inflation Factor (VIF) is < 5 so using all the X factors should be okay in the regression equation.
Note: VIF > 5 means if you include that factor in the equation, it will distort the results, i.e., inflate the results
12 STM XXX.X, Rev 00, 10-01-06
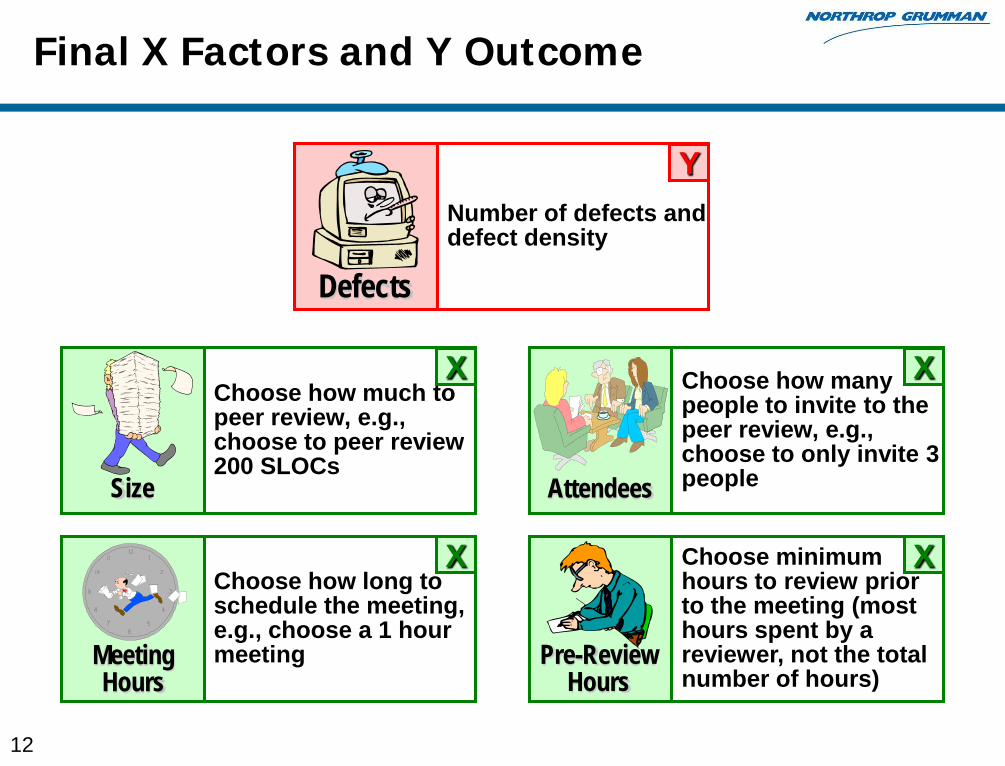
Number of defects and defect density
Defects
Choose how many people to invite to the peer review, e.g., choose to only invite 3 people
Choose minimum hours to review prior to the meeting (most hours spent by a reviewer, not the total number of hours)
Choose how much to peer review, e.g., choose to peer review 200 SLOCs
Choose how long to schedule the meeting, e.g., choose a 1 hour meeting
Size
Meeting Hours
Pre-Review Hours
Attendees
Final X Factors and Y Outcome
X
Y
X
XX

13
Peer Review Model
Model is deterministic, i.e., provides a single value, and probabilistic, i.e., provides a range of values (80% confidence interval)
Confidence intervals in Excel are very complicated
Inputs
Product Type: SLOCs
Size: 100
Number of Reviewers: 6
Pre-Review Hours: 3.00
Meeting Hours: 1.50
Confidence Level: 80%
Outputs
Minimum Defects: 16.34Minimum Defect Density per Unit: 0.16
Defects: 26.74Defect Density: 0.27
Maximum Defects: 37.13Maximum Defect Density per Unit: 0.37
SLOC Model Coef x[h]
Constant 0.15810 1.0000000Size: 0.08578 4.6051702Attendees: -0.01100 1.7917595Pre-Review Hours: 0.21727 1.0986123Meeting Hours: 0.52780 0.4054651
Analysis of Variance 183
MSE## 0.579612
T 1.286195
Matrix XPXI## 0.2838860 -0.0302640 -0.0775390 0.0224810 0.0204910-0.0302640 0.0044730 0.0044690 -0.0031290 -0.0022300-0.0775390 0.0044690 0.0424370 -0.0142430 -0.00070300.0224810 -0.0031290 -0.0142430 0.0165320 -0.00849500.0204910 -0.0022300 -0.0007030 -0.0084950 0.0318580
X[h] Transpose 1.0000000 4.6051702 1.7917595 1.0986123 0.4054651
Product 0.0385902 -0.0059994 0.0031458 -0.0027308 0.0125465Standard Error 26.7893454Y[fit] 1.0255408 26.7387093Upper Confidence Limit 6.0937728 37.1340670Lower Confidence Limit -4.0426911 16.3433517
Keep it Simple Stupid(even a child can understand it)
Hide the Intelligence(hide complexity from the user)
14
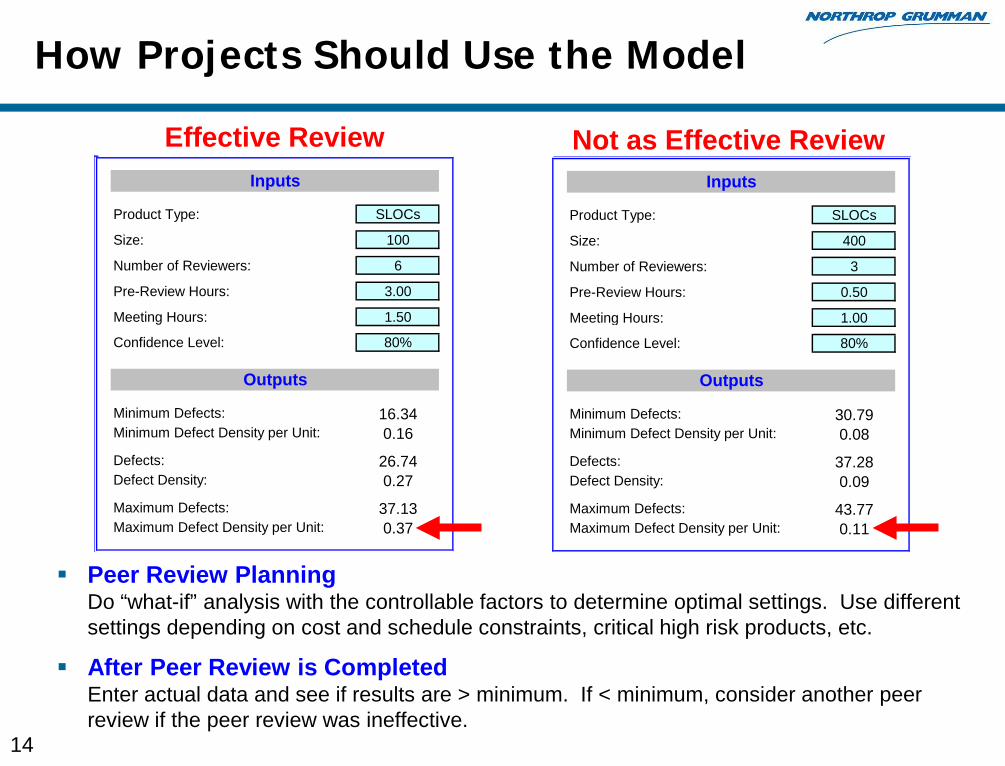
How Projects Should Use the Model
Effective Review Not as Effective ReviewInputs
Product Type: SLOCs
Size: 100
Number of Reviewers: 6
Pre-Review Hours: 3.00
Meeting Hours: 1.50
Confidence Level: 80%
Outputs
Minimum Defects: 16.34Minimum Defect Density per Unit: 0.16
Defects: 26.74Defect Density: 0.27
Maximum Defects: 37.13Maximum Defect Density per Unit: 0.37
Inputs
Product Type: SLOCs
Size: 400
Number of Reviewers: 3
Pre-Review Hours: 0.50
Meeting Hours: 1.00
Confidence Level: 80%
Outputs
Minimum Defects: 30.79Minimum Defect Density per Unit: 0.08
Defects: 37.28Defect Density: 0.09
Maximum Defects: 43.77Maximum Defect Density per Unit: 0.11
Peer Review PlanningDo “what-if” analysis with the controllable factors to determine optimal settings. Use different settings depending on cost and schedule constraints, critical high risk products, etc.
After Peer Review is CompletedEnter actual data and see if results are > minimum. If < minimum, consider another peer review if the peer review was ineffective.
15
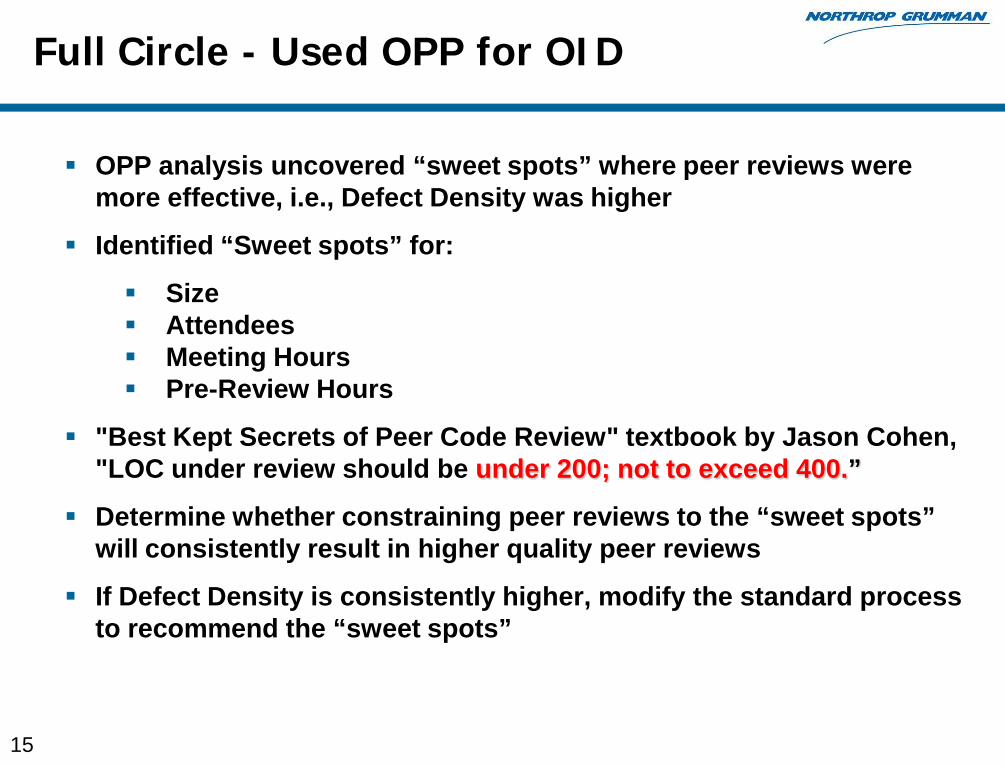
OPP analysis uncovered “sweet spots” where peer reviews were more effective, i.e., Defect Density was higher
Identified “Sweet spots” for:
Size Attendees Meeting Hours Pre-Review Hours
"Best Kept Secrets of Peer Code Review" textbook by Jason Cohen, "LOC under review should be under 200; not to exceed 400.”
Determine whether constraining peer reviews to the “sweet spots” will consistently result in higher quality peer reviews
If Defect Density is consistently higher, modify the standard process to recommend the “sweet spots”
Full Circle - Used OPP for OID

16
Goal for process performance is to improve the efficiency of code peer reviews, i.e., more cost effective
Too many reviewers do not improve Defect Density
Long meetings do not improve Defect Density
Goal for quality performance is to improve Defect Density
Less SLOCs increases Defect Density
Adequate preparation increases Defect Density
STM XXX.X, Rev 00, 10-01-06
Quality and Process Performance Goals
17
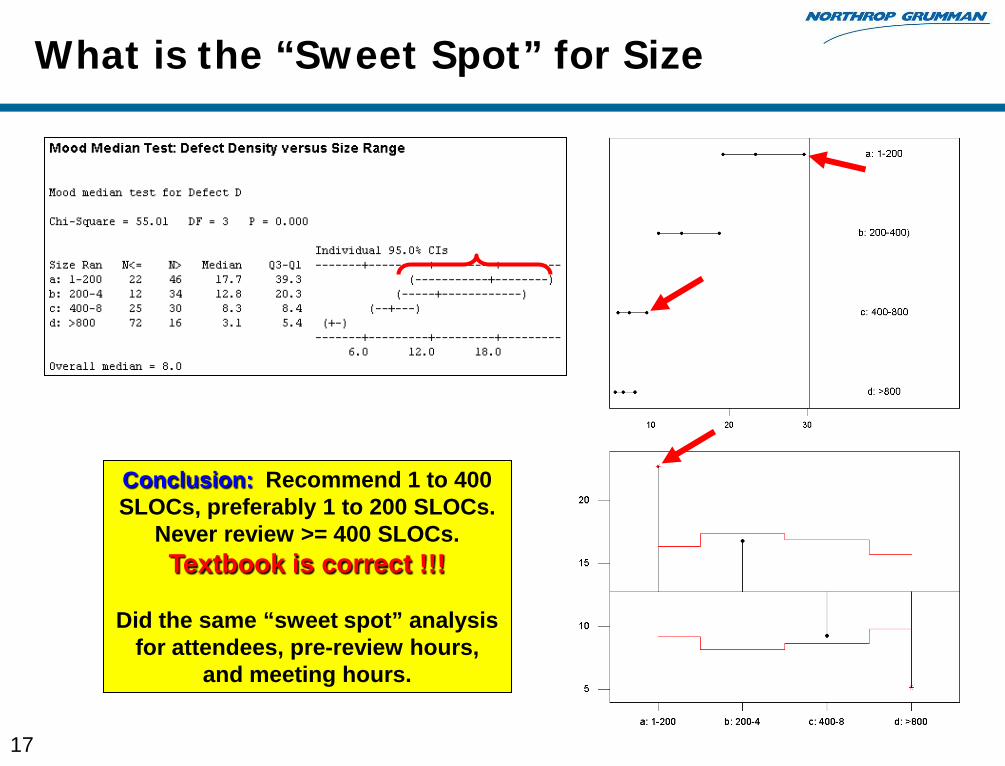
What is the “Sweet Spot” for Size
Conclusion: Recommend 1 to 400 SLOCs, preferably 1 to 200 SLOCs.
Never review >= 400 SLOCs. Textbook is correct !!!
Did the same “sweet spot” analysis for attendees, pre-review hours,
and meeting hours.
18
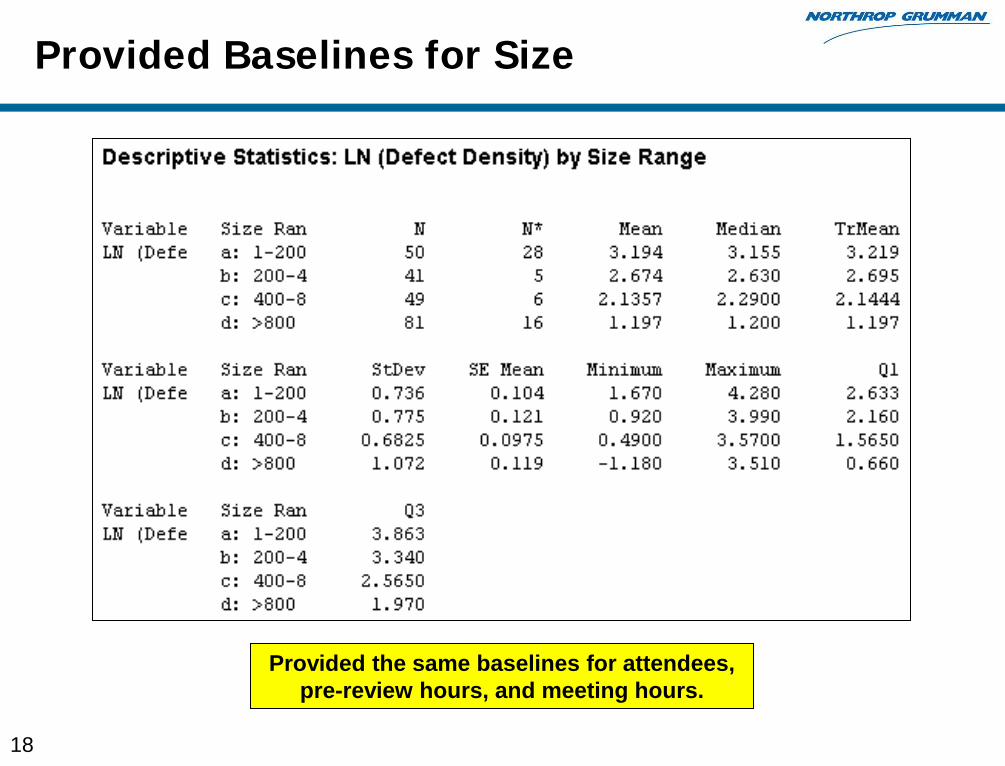
Provided Baselines for Size
Provided the same baselines for attendees, pre-review hours, and meeting hours.
19
OID for Constrained Peer Reviews Pilot
Briefed all software projects on the “sweet spots”
“Sweet spots” were provided for size, meeting hours, pre-review hours, and number of attendees
19 peer reviews were 100% constrained, i.e., used all“sweet spots”
23 peer reviews did whatever they felt was appropriate, and did not use all “sweet spots”
Used multiple Hypothesis Tests to compare Defect Density for constrained (19 peer reviews) versus non-constrained (23 peer reviews)
20
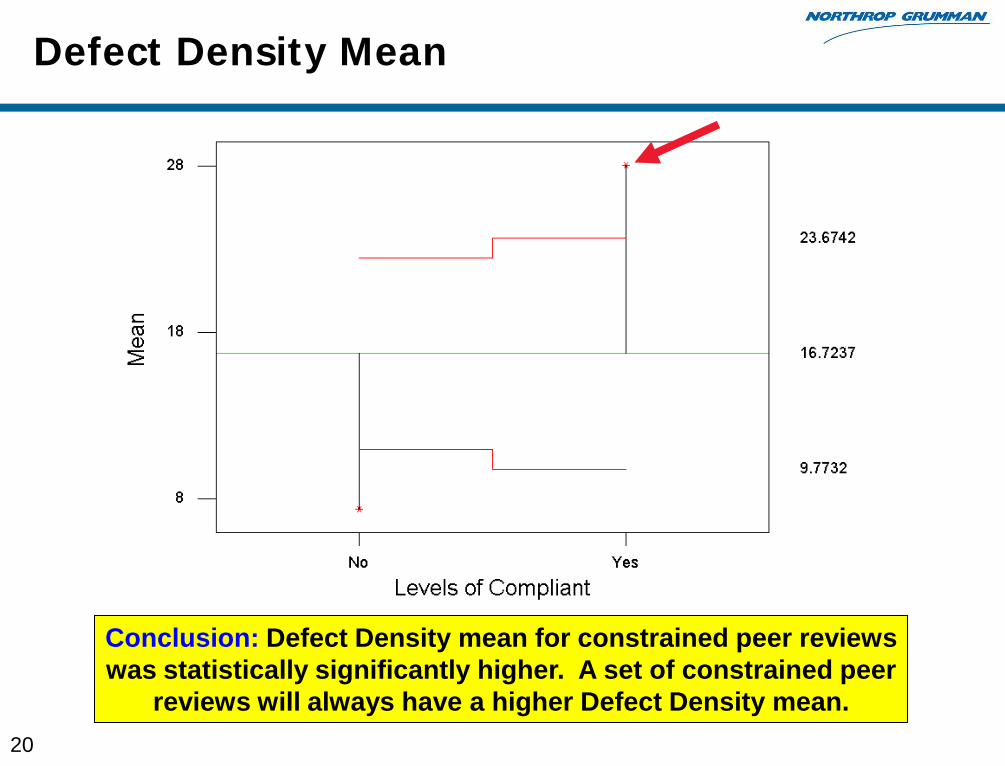
Defect Density Mean
Conclusion: Defect Density mean for constrained peer reviews was statistically significantly higher. A set of constrained peer
reviews will always have a higher Defect Density mean.
21
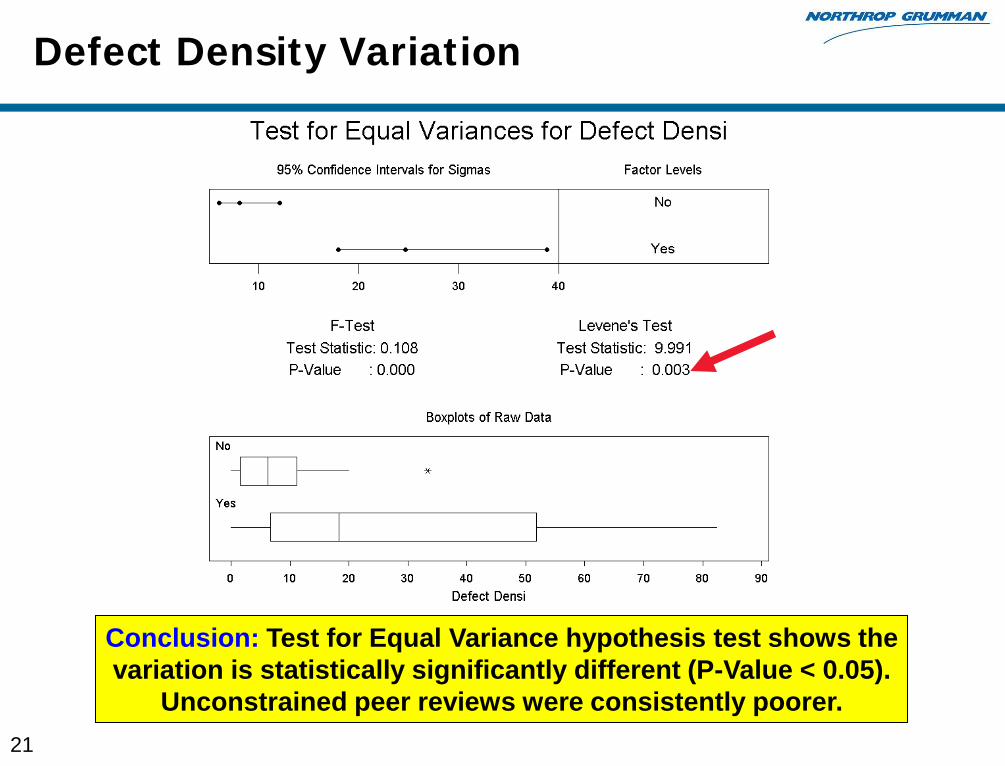
Defect Density Variation
Conclusion: Test for Equal Variance hypothesis test shows the variation is statistically significantly different (P-Value < 0.05).
Unconstrained peer reviews were consistently poorer.
22
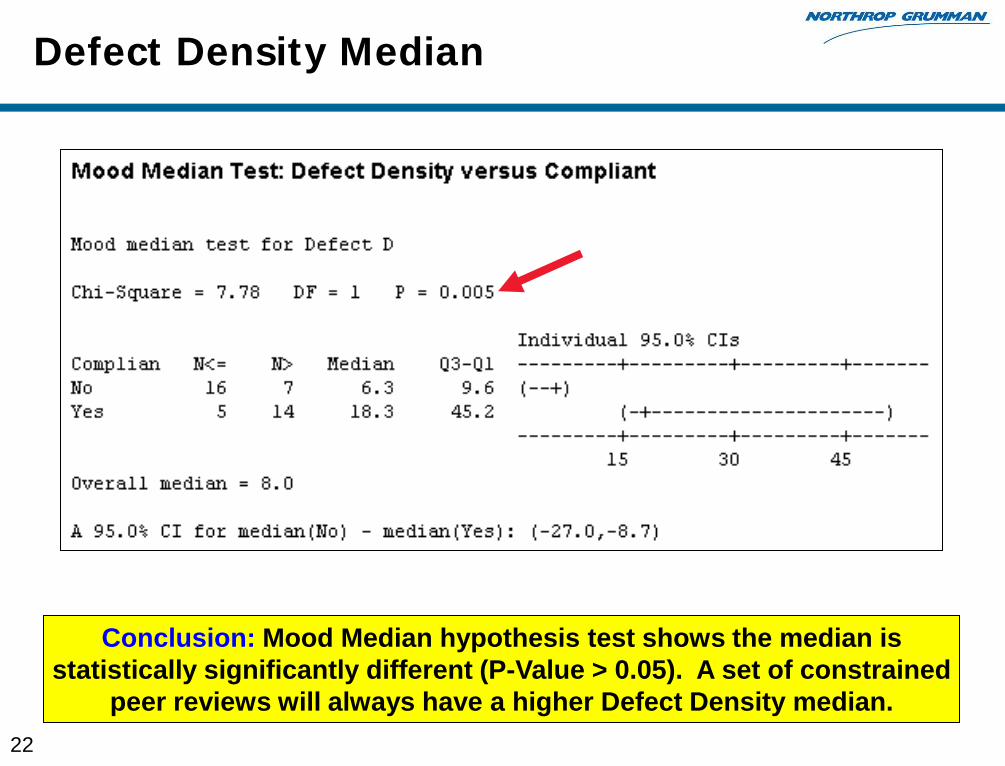
Defect Density Median
Conclusion: Mood Median hypothesis test shows the median is statistically significantly different (P-Value > 0.05). A set of constrained
peer reviews will always have a higher Defect Density median.
23
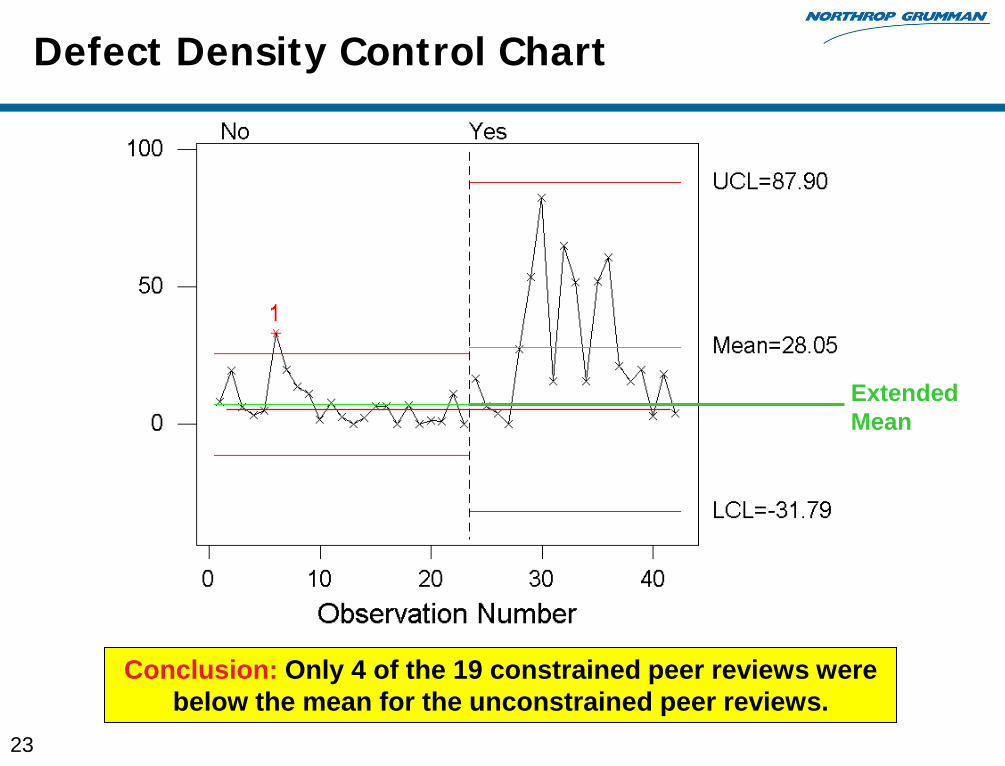
Defect Density Control Chart
Conclusion: Only 4 of the 19 constrained peer reviews were below the mean for the unconstrained peer reviews.
ExtendedMean
24
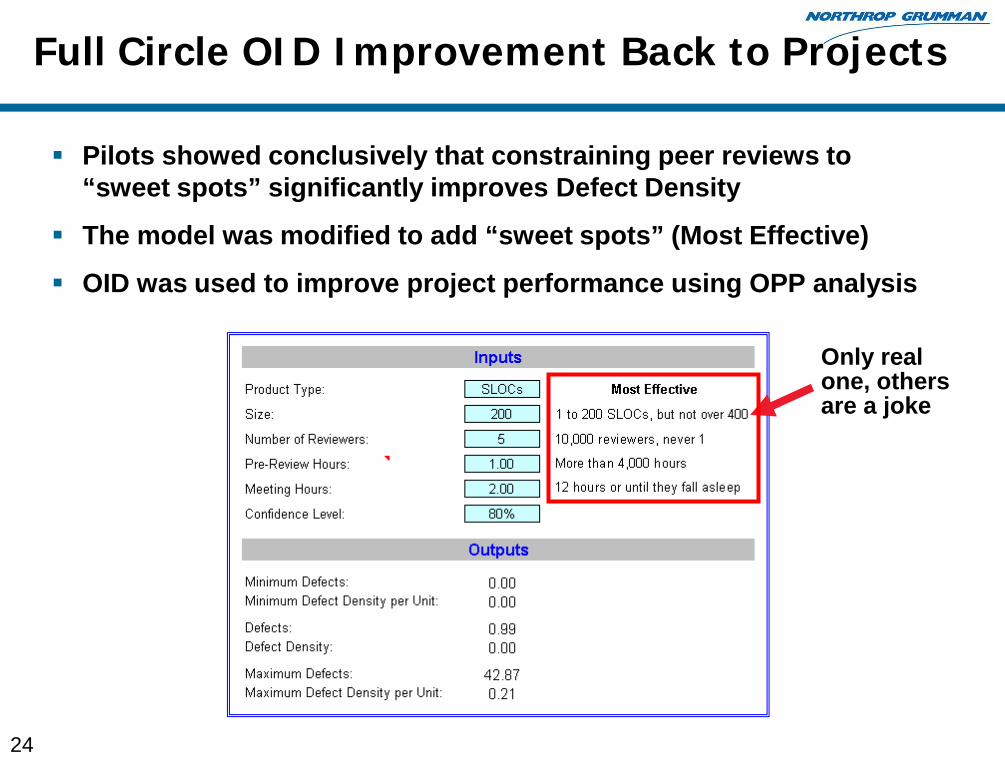
Full Circle OID Improvement Back to Projects
Pilots showed conclusively that constraining peer reviews to “sweet spots” significantly improves Defect Density
The model was modified to add “sweet spots” (Most Effective)
OID was used to improve project performance using OPP analysis
Only real one, others are a joke
25
Summary
Analyzing data can identify X factors to use and X factors to discard
Projects need to understand how to use the model
Use OID to improve the model and project performance
Publisher approved writing a textbook that will be called, “Baselines and Models, Duh, I Don’t Get It” (taking the train to the airport from a previous conference presentation) or “Baselines and Models for CMMI Process Improvement Practitioners”. Manuscript is due to the Publisher by May 2010, for publishing later in 2010. Textbook will contain an expanded version of taking the train to the airport, an expanded version of this peer review presentation, and a different way of estimating hours that will help projects perform better.
[email protected], 310-921-1939