How healthy are software engineering conferences?bvasiles.github.io/papers/scico13.pdf · cations...
37
How healthy are software engineering conferences? Bogdan Vasilescu a , Alexander Serebrenik a,* , Tom Mens c , Mark G. J. van den Brand a , Ekaterina Pek b a Eindhoven University of Technology, PO Box 513, 5600 MB Eindhoven, The Netherlands b University of Koblenz-Landau, Universit¨ atsstraße 1, 56070, Koblenz, Germany c Universit´ e de Mons, Place du Parc 20, 7000 Mons, Belgium Abstract In this article we study the health of software engineering conferences by means of a suite of metrics created for this purpose. The metrics measure stability of the community, openness to new authors, introversion, representativeness of the PC with respect to the authors’ community, availability of PC candidates, and scientific prestige. Using this metrics suite, we assess the health of 11 software engineering conferences over a period of more than 10 years. In general, our findings suggest that software engineering conferences are healthy, but we observe important differences between conferences with a wide scope and those with a more narrow scope. We also find that depending on the chosen health metric, some conferences perform better than others. This knowledge may be used by prospective authors to decide in which conferences to publish, and by conference steering committees or PC chairs to assess their selection process. Keywords: scientometrics, software engineering, conferences, empirical research * Corresponding author. Tel.: +31-40-2473595 Fax: +31-40-2475404. Email addresses: [email protected] (Bogdan Vasilescu), [email protected] (Alexander Serebrenik), [email protected] (Tom Mens), [email protected] (Mark G. J. van den Brand), [email protected] (Ekaterina Pek) Preprint submitted to Science of Computer Programming September 13, 2013
-
Upload
duongnguyet -
Category
Documents
-
view
218 -
download
1
Transcript of How healthy are software engineering conferences?bvasiles.github.io/papers/scico13.pdf · cations...

How healthy are software engineering conferences?
Bogdan Vasilescua, Alexander Serebrenika,∗, Tom Mensc, Mark G. J. van denBranda, Ekaterina Pekb
aEindhoven University of Technology, PO Box 513, 5600 MB Eindhoven, The NetherlandsbUniversity of Koblenz-Landau, Universitatsstraße 1, 56070, Koblenz, Germany
cUniversite de Mons, Place du Parc 20, 7000 Mons, Belgium
Abstract
In this article we study the health of software engineering conferences by meansof a suite of metrics created for this purpose. The metrics measure stabilityof the community, openness to new authors, introversion, representativeness ofthe PC with respect to the authors’ community, availability of PC candidates,and scientific prestige. Using this metrics suite, we assess the health of 11software engineering conferences over a period of more than 10 years. In general,our findings suggest that software engineering conferences are healthy, but weobserve important differences between conferences with a wide scope and thosewith a more narrow scope. We also find that depending on the chosen healthmetric, some conferences perform better than others. This knowledge may beused by prospective authors to decide in which conferences to publish, and byconference steering committees or PC chairs to assess their selection process.
Keywords: scientometrics, software engineering, conferences, empiricalresearch
∗Corresponding author. Tel.: +31-40-2473595 Fax: +31-40-2475404.Email addresses: [email protected] (Bogdan Vasilescu), [email protected]
(Alexander Serebrenik), [email protected] (Tom Mens), [email protected](Mark G. J. van den Brand), [email protected] (Ekaterina Pek)
Preprint submitted to Science of Computer Programming September 13, 2013

1. Introduction
In computing science, and especially in software engineering, scientific publi-cations in international conferences (as opposed to journals) are often consideredthe most important way of disseminating research results [1]. The preferencefor conference publications is motivated by such arguments as: the young ageand high dynamism of the field requiring shorter turnaround time between sub-mission and publication than journals typically offer (to avoid results becomingobsolete before their publication) [2]; the increased visibility and publicity asso-ciated with presenting a paper and discussing it with peers [2]; the prestige as-sociated with publishing at highly-selective venues with low acceptance rate [3];the increasing importance given to conference publications by decision makersassessing scientists, both in the USA [4] and in Europe [3].
However, the fundamental role of conferences in computing science is notundisputed [2, 5–12]. The reported criticism is focused around the limited num-ber of pages, too little time to revise a paper after receiving comments fromreviewers, the ultimately higher impact of referenced peer-reviewed journal pub-lications, and the increased volume of submissions. To keep the review qualityhigh and the reviewer workload low, the latter requires the programme commit-tee (PC) to grow larger. However, “the number of experienced reviewers doesnot appear to be growing at the same rate” [7], resulting in a “shrinking poolof qualified and willing PC candidates” [8]. This realisation brought a numberof conferences to adopt a two-phase review process: first, a broad PC reviewsthe submissions, then a much smaller Program Board initiates, monitors, andguides the discussions with the PC members. In this way a balance is soughtbetween a reduced review load and high review quality.
Most software engineering conferences follow a single-blind peer reviewingscheme, in which the reviewers know the names of the authors, but not viceversa. This may increase the risk of conferences becoming closed communities,and they may suffer to some extent from introversion. We understand opennessas the readiness to accept newcomers, either as authors or PC members. Indica-tive of low openness—closed communities—are, e.g., inviting roughly the samegroup of people to the PC each year, or preferential acceptance of papers byknown authors that have previously published in the same conference. We un-derstand introversion as the prevalence of papers (co)authored by PC membersamong the accepted papers. While theoretically everybody can contribute toany conference, in practice some conferences tend to attract more “new faces”than others. Both problems are well-recognised [7, 8, 13]. Crowcroft et al. [7]argue that “there is a distinct perception that papers authored by researcherswith close ties to the PC are preferentially accepted with an implicit or overt tit-for-tat relationship”. Similarly, Birman and Schneider [8] question the qualityof reviews, but suggest that “work by famous authors is less likely to experiencethis phenomenon, amplifying a perception of PC unfairness.” Therefore, it isuseful to study to which extent and for which conferences such symptoms asintroversion, closed nature, or shortage of PC candidates occur and, if so, whatare the causes and consequences of this occurrence.
2

In this article we assess the health of software engineering conferences withrespect to several criteria: community stability (author and PC turnover), open-ness to new authors, introversion, representativeness of the PC with respect tothe authors’ community, availability of PC candidates, and scientific prestige. Ingeneral, our findings suggest that software engineering conferences are healthy:balanced PC turnover (high enough to avoid introversion, yet low enough to en-sure continuity and coherence), high openness to new authors (“new” in termsof both turnover with respect to previous years as well as not having publishedat that conference ever before), and moderate introversion (in terms of fractionof papers co-authored by PC members). Nonetheless, some conferences performbetter than others according to the aforementioned criteria. In addition, weobserve important differences between conferences with a wide scope and thosewith a more narrow scope. This knowledge can be used by conference steeringcommittees and PC chairs, e.g., to assess composition of the PC, paper selectionprocess and adherence to conference charters. Furthermore, prospective authorsmight consider conference openness as well as prestige when deciding to whichconferences to submit their work.
The remainder of this article is organised as follows. Section 2 describesour research methodology, including the selection of conferences, the metricsproposed to characterise the health factors, and the data extraction process.Section 3 details the statistical analysis carried out and its findings. Section 4discusses the results on a per conference basis. Section 5 surveys related work.The threats to validity, part of any empirical study, are presented in Section 6.Section 7 sketches directions for future work and Section 8 concludes.
2. Methodology
2.1. Data extraction
Numerous software engineering conferences are organised every year. More-over, papers addressing software engineering topics are also solicited by wider-scoped computer science conferences. In our study, we focused on the confer-ences studied in [13]: International Conference on Software Engineering (ICSE),European Conference on Software Maintenance and Reengineering (CSMR),International Conference on Program Comprehension (ICPC), InternationalConference on Generative Programming and Component Engineering (GPCE),International Conference on Software Maintenance (ICSM), and Working Con-ference on Reverse Engineering (WCRE). Of these 6 conferences, only ICSEhas a wide coverage of the software engineering domain, while the others focuson a specific subdomain (maintenance, reverse engineering, program compre-hension, and generative programming). To balance our sample in terms ofscope, we added three more conferences with wide coverage of software en-gineering, namely International Conference on Automated Software Engineer-ing (ASE), Symposium on the Foundations of Software Engineering (FSE),and International Conference on Fundamental Approaches to Software Engi-neering (FASE). Furthermore, to balance our sample in terms of age, we also
3

included two younger conferences, namely Working Conference on Mining Soft-ware Repositories (MSR), and International Working Conference on SourceCode Analysis and Manipulation (SCAM).
The data we analysed was restricted to the main research track of eachconference: number of papers submitted and accepted (without distinguish-ing between long and short papers, if both were part of the main track), au-thors of the accepted papers, and composition of the programme committee.In order to facilitate replication of our study, we have published all the dataand tooling developed during our work on GitHub at github.com/tue-mdse/
conferenceMetrics. The dataset is described in more detail in [14].
Conference First ed. First ed. Last ed. Included CI Charterseries issued included included in [13] availabilityASE1 1986 1994 2013 No 55 Own charter2, SIGSOFT PC
policy3
CSMR 1997 1997 2013 Yes 40 Yes, but not public; no guide-lines on PC renewal4
FASE 1998 1998 2013 No 42 Yes5
FSE6 1993 1993 2013 No 49 SIGSOFT PC policyGPCE7 2000 2000 2013 Yes 37 Yes; no guidelines on PC renewalICPC8 1992 1997 2013 Yes 41 Yes9
ICSE10 1975 1994 2013 Yes 117 SIGSOFT PC policyICSM11 1983 1994 2013 Yes 53 Yes12
MSR 2004 2004 2013 No 32 No13
SCAM 2001 2001 2013 No 15 Own charter + part of SIG-SOFT PC policy
WCRE 1993 1995 2013 Yes 43 Yes, but not public; no guide-lines on PC renewal
Table 1: Software engineering conferences considered in the study. Those con-ference with a wide coverage of the domain are indicated in boldface.
For all considered conferences, most of the data of all accepted papers andtheir authors was extracted from the DBLP records [15]. The extracted datacovers a period of at least ten years, as can be seen in Table 1. Data about the
1Formerly Knowledge-Based Software Engineering Conference (KBSE) and Knowledge-Based Software Assistant (KBSA).
2www.ase-conferences.org/Charter.html3www.sigsoft.org/about/policies/pc-policy.htm4A public charter is in preparation and is expected for 2014.5www.easst.org/fase/fasech6We do not distinguish between the years when FSE is colocated with the European Soft-
ware Engineering Conference (and is known as ESEC/FSE) and the regular editions of FSE.7Formerly Semantics, Applications and Implementation of Program Generation (SAIG).8Formerly Workshop on Program Comprehension (WPC) and International Workshop on
Program Comprehension (IWPC).9www.program-comprehension.org/ICPC-ProgramCommittee-v1.1.pdf
10Formerly National Conference on Software Engineering.11Formerly Conference on Software Maintenance.12conferences.computer.org/icsm/PC-Guidelines.pdf13A charter is in preparation and is expected for MSR 2014.
4
composition of the programme committee and number of submitted papers toeach conference was retrieved from the websites of each conference and onlineproceedings volumes. For earlier editions we used the Wayback machine14 toanalyse websites which were no longer available as well as announcements postedby conference organisers in Usenet newsgroups.
Since we are integrating data from different sources, the names of authorsand PC members are not necessarily consistent, while it is critical to know theidentities of persons if we wish to check for signs of introversion. For example,Mark van den Brand is also known as Mark G. J. van den Brand or M. G. J.van den Brand. To match multiple aliases for the same person we performedidentity merging [16–22], and manually checked the results in a post-processingstep.
2.2. Metrics
Table 2 shows all metrics we have used. Some of these coincide with thoseused in [13]. The basic metrics count how many persons belong to the com-munity (authors #A and PC members #C ) and how many papers have beensubmitted #SP to a conference for a particular year.
We quantify the review workload RL experienced by PC members as theratio between the number of submitted papers and the size of the PC.
To determine whether a conference community for a particular year is stable ,we use two sliding window metrics #NA and #NC , that count the number ofNew Authors or programme Committee members over several previous years.We also use their relative counterparts RNA and RNC .
To study openness of a community surrounding a conference, the slidingwindow metric #PNA counts the number of Papers by New Authors, i.e., thosepapers for which none of the authors published at previous editions of thisconference. Similarly, we use its relative counterpart RPNA.
By introversion we understand influence of PC membership on paper co-authorship. Systa, Harsu and Koskimies [13] call this feature “inbreeding” toreflect the negative phenomenon of favouritism of the PC towards papers co-authored by PC members. However, high share of papers co-authored by PCmembers among the accepted papers might stem from higher quality papers orhigher publishing activity of more experienced researchers, who are also morelikely to be invited to join the PC. Therefore, we use a more neutral term forthis aspect of the conference health. Similarly to [13], we quantify introversionby calculating RAC , the ratio of accepted papers co-authored by programmecommittee members who served at least once in recent years.
We assess the representativeness of a PC for the community byRCnA, the ratio of PC members that have never co-authored a paper in severalpreceding editions of the same conference.
To assess the sustainability of the PC-candidates pool (its rejuvenationcapacity), we measure the sustainability ratio SR, the ratio between the number
14archive.org/web/web.php
5

of core authors that have not served on the PC at previous editions of thisconference (PC candidates) and the size of the PC at that time.
Acronym Definition
Basic metrics
#A(c, y) number of distinct Authors for conference c in year y
#C (c, y) [#PCmem] number of PC members for conference c in year y
#SP(c, y) [#subm] number of Submitted Papers for conference c in year y
Workload
RL(c, y) [revCoeff ] Review Load for conference c in year y, i.e., #SP(c,y)#C(c,y)
Stability
#NA(c, y ,n) number of New Authors for conference c in year y that werenot author in years y − n to y − 1
#NC (c, y ,n)[#(real)newPCmem]
number of New PC members for conference c in year y thatwere not PC member in years y − n to y − 1
RNA(c, y ,n) author turnover = Ratio of New Authors for conference c inyear y w.r.t. years y − n to y − 1, i.e., #NA(c,y,n)
#A(c,y)
RNC (c, y ,n)[(real)newPCprop]
PC turnover = Ratio of New programme Committee membersfor conference c in year y w.r.t. years y − n to y − 1, i.e.,#NC(c,y,n)#C(c,y)
Openness
#PNA(c, y ,n) number of Papers of conference c in year y by New Authors forwhich none of the co-authors has published at this conferencein years y − n to y − 1
RPNA(c, y ,n) Ratio of Papers (by New Authors) for conference c in year y forwhich none of the co-authors has published at this conferencein years y − n to y − 1, i.e., #PNA(c,y,n)
RA(c,y)∗#SP(c,y)
Introversion
RAC (c, y ,n)[PCaccProp]
Ratio of accepted papers for conference c in year y co-authoredby programme committee members who served at least onceduring years y − n to y
Representativeness
RCnA(c, y ,n) Ratio of PC members for conference c in year y that havenever co-authored a paper at preceding instances of c betweeny − n and y − 1
Sustainability
SR(c, y ,n) Sustainability Ratio = ratio between the number of core au-thors that have not served on the PC in years y − n to y and#C (c, y).
Prestige
RA(c, y) [accRate] Ratio of accepted papers for conference c in year y.
CI (c) Conference Impact of conference c = SHINE h-index for cbetween 2000 and 2012.
Table 2: Metrics used to assess conference health. If applicable, the acronymused by Systa et al. [13] is mentioned between square brackets.
We define a core author for a given conference as a person who frequently
6

(co)authored papers published at that conference during the current or previousfour editions. Specifically, we consider an author to be core author if either: (i)she has (co)authored papers in at least 3 out of the 5 most recent editions; or(ii) she has (co)authored papers in at least 2 out of the 3 most recent editions.A core author is therefore a very active member of the author community, whoprobably deserves to serve on the PC.
Finally, we use two accepted prestige measures, the conference impact CIand the acceptance ratio RA. We compute CI based on the Simple H-INdexEstimator (SHINE ) [23], a conference-specific variant of Hirsch’s h-index forquantifying an individual’s scientific research output [24, 25]. For a given con-ference c, CI (c) = SHINE (c, 2000 , 2012 ) = 40 means that conference c has 40papers published between 2000 and 2012, each with at least 40 citations in thesame period. The earliest SHINE data available is from 2000. Since computa-tion of the h-index can be inaccurate for recent years (due to late propagation ofcitation information) we use the entire available history of conference citationssince 2000 until 2012. We have also observed high degree of agreement betweenCI and the conference rankings published by the CORE ERA ranking15 (Com-puting Research and Education Association of Australasia): ICSE (CI = 117) isthe only conference in our list ranked A∗, ASE, FSE and ICSM (49 ≤ CI ≤ 59)got the A rank, FASE (42), GPCE (37) and WCRE (43) were ranked B, andfinally, CSMR (40), ICPC (41), MSR (32) and SCAM (15) were ranked C.
2.3. Data analysis
Using the R project for statistical computing [26] we visualise and statis-tically analyse the data to detect patterns and trends, with the aim to detect(counter-)evidence of conference health, e.g., signs of introversion or openness.The visualisation consists of two components, cf. discussion in [27]: (i) a simplegraph with all the time series (conferences) overlaid, to facilitate comparisonsover smaller visual spans, and (ii) small multiples for each of the time series, tofacilitate assessing trends visually.
To quantify monotone trends we compute Spearman rank correlation ρ be-tween the values of the metrics and the time axis: since the latter is monoton-ically increasing, strong correlation (either positive or negative) indicates pres-ence of a trend in the metric (either increasing or decreasing, respectively) [28].Similarly, to verify presence of linear trends (between different metrics ratherthan between a metric and the time axis) we compute Pearson correlation r.
To verify claims such as “conference A tends to have higher values for met-ric m than conference B”, we compare multiple distributions of m (one foreach of the 11 conferences). Traditionally, comparison of multiple groups fol-lows a two-step approach: first, a global null hypothesis is tested, and thenmultiple comparisons are used to test sub-hypotheses pertaining to each pairof groups. The first step is commonly carried out by means of ANOVA or itsnon-parametric counterpart, the Kruskal-Wallis one-way analysis of variance
15http://core.edu.au/index.php/categories/conference%20rankings/1
7
by ranks [29]. The second step uses the t-test or the rank-based Wilcoxon-Mann-Whitney test [30], with Bonferroni correction [31, 32]. Unfortunately,the global test null hypothesis may be rejected while none of the sub-hypothesesare rejected, or vice versa [33]. Moreover, simulation studies suggest that theWilcoxon-Mann-Whitney test is not robust to unequal population variances, es-pecially in the unequal sample size case [34, 35]. Therefore, one-step approachesare preferred: these should produce confidence intervals which always lead tothe same test decisions as the multiple comparisons. To this end, we employ therecently-proposed multiple contrast test procedure T [36] using the traditional
5% family-wise error rate. T is robust against unequal population variances. Amore comprehensive discussion of T goes beyond the scope of this article andcan be found in [36]. Small examples detailing the application of T can be foundin [21, 36] and additional scientific applications of the technique in [37–39].
For ease of presentation (given 11 conferences, one has to report the results
of 11×102 = 55 comparisons per metric), we use the T-graphs proposed in [21]
to summarise the results as a directed acyclic graph. For a particular metric,nodes of the graph correspond to conferences, and edges to results of pairwisecomparisons (there is an edge from A to B if A tends to have higher values
for that metric than B). Because transitivity is respected by T (as opposedto, e.g., the traditional pairwise Wilcoxon-Mann-Whitney tests [40]), we omitdirect edges between A and B if there is a path from A to B passing throughat least one other node C.
A special case of comparison of multiple distributions is the comparisonof two distributions (e.g., all wide-scoped conferences versus all narrow-scopedones). We need to test whether one of two samples of independent observationstends to have larger values than the other. The Wilcoxon-Mann-Whitney two-sample rank-sum test [41, 42] is not robust against differences in variance [34,
35], and the T procedure as described above cannot be used to compare two
distributions [36]. We therefore use the two-distributions equivalent of the Tprocedure, i.e., we perform two sample tests for the non-parametric Behrens-Fisher problem [35], and compute confidence intervals for the relative effect ofthe two samples (using the R package nparcomp [43]). If the relative effectof samples A and B, which is traditionally denoted p(A,B) [35], exceeds 0.5then B tends to be larger than A. Therefore, we accompany visualisationsof the evolution of different metrics by T-graphs (for a more rigorous view ofthe relations between different conferences), and we report the relative effectp(wide,narrow) (to support claims about the relation between conferences whengrouped into wide-scoped and narrow-scoped).
To avoid clutter when reporting p-values, regardless of the statistical pro-cedure applied, and to avoid the possible confusion between the relative effectp and p-values, we superscript the test result using the following convention:no superscript corresponds to p-value ≥ 0.05, ∗ corresponds to 0.01 ≤ p-value< 0.05, and ∗∗ corresponds to p-value < 0.01.
8
1995 1996 1997 1998 1999 2000 2001 2002 2003 2004 2005 2006 2007 2008 2009 2010 2011 2012 2013
010
020
030
040
050
0 ASE CSMR FASE FSE GPCE ICPC ICSE ICSM MSR SCAM WCRE
1995 1998 2001 2004 2007 2010 2013
ASE
1995 1998 2001 2004 2007 2010 2013
015
035
0
1995 1998 2001 2004 2007 2010 2013
CSMR
1995 1998 2001 2004 2007 2010 2013
015
035
0
1995 1998 2001 2004 2007 2010 2013
FASE
1995 1998 2001 2004 2007 2010 2013
015
035
0
1995 1998 2001 2004 2007 2010 2013
FSE
1995 1998 2001 2004 2007 2010 2013
015
035
0
1995 1998 2001 2004 2007 2010 2013
GPCE
1995 1998 2001 2004 2007 2010 2013
015
035
0
1995 1998 2001 2004 2007 2010 2013
ICPC
1995 1998 2001 2004 2007 2010 2013
015
035
0
1995 1998 2001 2004 2007 2010 2013
ICSE
1995 1998 2001 2004 2007 2010 2013
015
035
0
1995 1998 2001 2004 2007 2010 2013
ICSM
1995 1998 2001 2004 2007 2010 2013
015
035
0
1995 1998 2001 2004 2007 2010 2013
MSR
1995 1998 2001 2004 2007 2010 2013
015
035
0
1995 1998 2001 2004 2007 2010 2013
SCAM
1995 1998 2001 2004 2007 2010 2013
015
035
0
1995 1998 2001 2004 2007 2010 2013
WCRE
1995 1998 2001 2004 2007 2010 2013
015
035
0
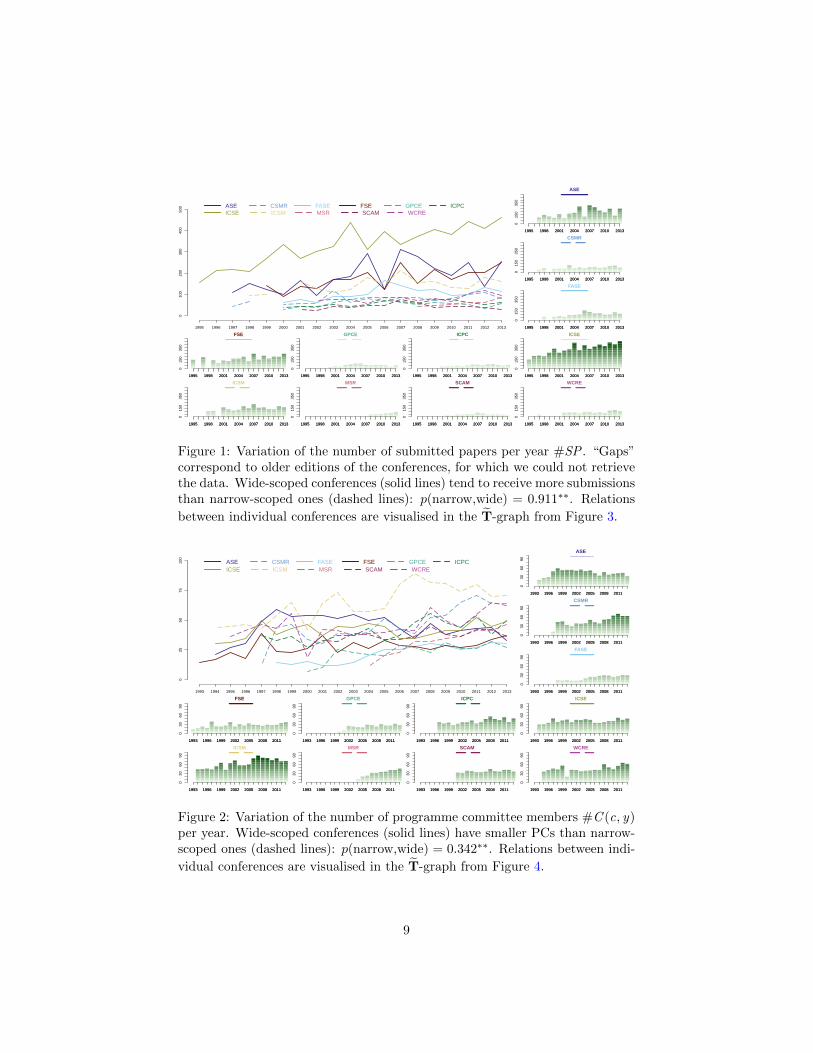
Figure 1: Variation of the number of submitted papers per year #SP . “Gaps”correspond to older editions of the conferences, for which we could not retrievethe data. Wide-scoped conferences (solid lines) tend to receive more submissionsthan narrow-scoped ones (dashed lines): p(narrow,wide) = 0.911∗∗. Relations
between individual conferences are visualised in the T-graph from Figure 3.
1993 1994 1995 1996 1997 1998 1999 2000 2001 2002 2003 2004 2005 2006 2007 2008 2009 2010 2011 2012 2013
025
5075
100
ASE CSMR FASE FSE GPCE ICPC ICSE ICSM MSR SCAM WCRE
1993 1996 1999 2002 2005 2008 2011
ASE
1993 1996 1999 2002 2005 2008 2011
030
6090
1993 1996 1999 2002 2005 2008 2011
CSMR
1993 1996 1999 2002 2005 2008 2011
030
6090
1993 1996 1999 2002 2005 2008 2011
FASE
1993 1996 1999 2002 2005 2008 2011
030
6090
1993 1996 1999 2002 2005 2008 2011
FSE
1993 1996 1999 2002 2005 2008 2011
030
6090
1993 1996 1999 2002 2005 2008 2011
GPCE
1993 1996 1999 2002 2005 2008 2011
030
6090
1993 1996 1999 2002 2005 2008 2011
ICPC
1993 1996 1999 2002 2005 2008 2011
030
6090
1993 1996 1999 2002 2005 2008 2011
ICSE
1993 1996 1999 2002 2005 2008 2011
030
6090
1993 1996 1999 2002 2005 2008 2011
ICSM
1993 1996 1999 2002 2005 2008 2011
030
6090
1993 1996 1999 2002 2005 2008 2011
MSR
1993 1996 1999 2002 2005 2008 2011
030
6090
1993 1996 1999 2002 2005 2008 2011
SCAM
1993 1996 1999 2002 2005 2008 2011
030
6090
1993 1996 1999 2002 2005 2008 2011
WCRE
1993 1996 1999 2002 2005 2008 2011
030
6090
Figure 2: Variation of the number of programme committee members #C (c, y)per year. Wide-scoped conferences (solid lines) have smaller PCs than narrow-scoped ones (dashed lines): p(narrow,wide) = 0.342∗∗. Relations between indi-
vidual conferences are visualised in the T-graph from Figure 4.
9

3. Results
3.1. Workload
We start our analysis of conference health with an overview of their generalstate: Are software engineering conferences attracting more submissions? Dothe programme committees grow? Is there evidence of increased reviewing load?
Figure 1 displays the variation of the number of submitted papers per year#SP(c, y), for each of the conferences. The most popular conference (i.e., theone receiving the most submissions) is ICSE, followed by ASE, FSE and ICSM(Figure 3). It is interesting to note that the narrow-scoped ICSM received over
the years comparable (in terms of the T procedure) numbers of submissionsas the wider-scoped FSE, ASE and FASE. Increasing trends are confirmed forMSR (ρ = 1∗∗), ICSE (ρ = 0.89∗∗) and FASE (ρ = 0.73∗∗): these conferencestend to receive more submissions each year, since their first editions. The otherconferences exhibit less clear (increasing or decreasing) trends. Overall, wide-scoped conferences (solid lines) tend to receive more submissions than narrow-scoped ones (dashed lines): p(narrow,wide) = 0.911∗∗.
With the exception of ICSE, conferences receiving increasingly more submis-sions resort to increasing the size of their programme committees. Inspectionof Figure 2 reveals increasing trends for #C for MSR (ρ = 0.99∗∗), FASE(ρ = 0.87∗∗), CSMR (ρ = 0.79∗∗), ICSM (ρ = 0.77∗∗), ICPC (ρ = 0.76∗∗) andGPCE (ρ = 0.75∗∗): these tend to increase their PC size over the years. Wenotice that this includes 5 out of 7 of the narrow-scoped conferences. The otherconferences exhibit less clear trends. Out of all the conferences in our sample,ICSM consistently has the largest PC (Figure 4).
Overall, when comparing wide-scoped conferences to narrow-scoped ones,we observe that the former receive more submissions but have smaller PCs,hence higher review load than the latter. Of course, some PC members engageexternal reviewers, implying that the actual review load might be lower thanthe ratio RL of the number of submissions and the number of PC members.
Figure 6 displays the variation of the review load RL. It is interesting to
FASE
SCAM GPCE ICPC
FSE
CSMR MSR WCRE
ICSE
ASE ICSM
Figure 3: T-graph forthe number of submit-ted papers #SP .
CSMR
FSE FASE GPCE
ASE
ICSM
SCAM MSR WCREICPCICSE
Figure 4: T-graph for the num-ber of PC members #C .
GPCE
SCAMMSR ICPC
FSE
CSMRICSM WCRE
ICSE
FASE ASE
Figure 5: T-graphfor the review load#RL.
10

1995 1996 1997 1998 1999 2000 2001 2002 2003 2004 2005 2006 2007 2008 2009 2010 2011 2012 2013
03
69
12 ASE CSMR FASE FSE GPCE ICPC ICSE ICSM MSR SCAM WCRE
1995 1998 2001 2004 2007 2010 2013
ASE
1995 1998 2001 2004 2007 2010 2013
03
69
12
1995 1998 2001 2004 2007 2010 2013
CSMR
1995 1998 2001 2004 2007 2010 2013
03
69
12
1995 1998 2001 2004 2007 2010 2013
FASE
1995 1998 2001 2004 2007 2010 2013
03
69
12
1995 1998 2001 2004 2007 2010 2013
FSE
1995 1998 2001 2004 2007 2010 2013
03
69
12
1995 1998 2001 2004 2007 2010 2013
GPCE
1995 1998 2001 2004 2007 2010 2013
03
69
12
1995 1998 2001 2004 2007 2010 2013
ICPC
1995 1998 2001 2004 2007 2010 2013
03
69
12
1995 1998 2001 2004 2007 2010 2013
ICSE
1995 1998 2001 2004 2007 2010 2013
03
69
12
1995 1998 2001 2004 2007 2010 2013
ICSM
1995 1998 2001 2004 2007 2010 2013
03
69
12
1995 1998 2001 2004 2007 2010 2013
MSR
1995 1998 2001 2004 2007 2010 2013
03
69
12
1995 1998 2001 2004 2007 2010 2013
SCAM
1995 1998 2001 2004 2007 2010 20130
36
912
1995 1998 2001 2004 2007 2010 2013
WCRE
1995 1998 2001 2004 2007 2010 2013
03
69
12
Figure 6: Variation of the review load RL per year. Wide-scoped conferences(solid lines) have higher review load than narrow-scoped ones (dashed lines):p(narrow,wide) = 0.973∗∗. Relations between individual conferences are visu-
alised in the T-graph from Figure 5.
observe the increasing trend for ICSE (ρ = 0.80∗∗), resulting from increasinglymore submissions each year and a PC size that does not tend to grow accord-ingly. ICSE and to a lesser extent FSE are also the conferences with the highestvalues of RL (Figure 5): since 2007, ICSE has stabilised to a ratio of 9 sub-missions per PC member (if each submission is reviewed on average by 3 PCmembers, this implies approximately 27 submissions being assigned to each PCmember), followed by FSE with a ratio of 7 submissions per PC member (i.e.21 submissions assigned to each PC member). Other trends are visible for MSR(increasing, ρ = 1∗∗), ASE (increasing, ρ = 0.78∗∗), and GPCE (decreasing,ρ = −0.65∗).
Recognition of an extremely high review load for ICSE has lead the programco-chairs and steering committee of ICSE to adopt the Program Board modelfor its 2014 edition. This model follows a two-phase review process: first, abroad PC reviews the submissions, then a much smaller Program Board initi-ates, monitors, and guides the discussions with the PC members. In this way abalance can be found between a reduced review load and high quality of reviews.The Program Board model has recently been used by the International Require-ments Engineering Conference (RE) as well as the International Conference onModel-Driven Engineering Languages and System (MoDELS).
11

1994 1995 1996 1997 1998 1999 2000 2001 2002 2003 2004 2005 2006 2007 2008 2009 2010 2011 2012 2013
0.00
0.25
0.50
0.75
1.00
ASE CSMR FASE FSE GPCE ICPC ICSE ICSM MSR SCAM WCRE
1994 1997 2000 2003 2006 2009 2012
ASE
1994 1997 2000 2003 2006 2009 2012
0.00
0.50
1.00
1994 1997 2000 2003 2006 2009 2012
CSMR
1994 1997 2000 2003 2006 2009 2012
0.00
0.50
1.00
1994 1997 2000 2003 2006 2009 2012
FASE
1994 1997 2000 2003 2006 2009 2012
0.00
0.50
1.00
1994 1997 2000 2003 2006 2009 2012
FSE
1994 1997 2000 2003 2006 2009 2012
0.00
0.50
1.00
1994 1997 2000 2003 2006 2009 2012
GPCE
1994 1997 2000 2003 2006 2009 2012
0.00
0.50
1.00
1994 1997 2000 2003 2006 2009 2012
ICPC
1994 1997 2000 2003 2006 2009 2012
0.00
0.50
1.00
1994 1997 2000 2003 2006 2009 2012
ICSE
1994 1997 2000 2003 2006 2009 2012
0.00
0.50
1.00
1994 1997 2000 2003 2006 2009 2012
ICSM
1994 1997 2000 2003 2006 2009 2012
0.00
0.50
1.00
1994 1997 2000 2003 2006 2009 2012
MSR
1994 1997 2000 2003 2006 2009 2012
0.00
0.50
1.00
1994 1997 2000 2003 2006 2009 2012
SCAM
1994 1997 2000 2003 2006 2009 20120.
000.
501.
001994 1997 2000 2003 2006 2009 2012
WCRE
1994 1997 2000 2003 2006 2009 2012
0.00
0.50
1.00
Figure 7: Variation of PC turnover w.r.t. previous year RNC (c, y , 1 ). Wide-scoped conferences (solid lines) usually have higher values than narrow-scoped
ones (dashed lines): p(narrow,wide) = 0.779∗∗. The T-graph in Figure 8 con-firms this, except for GPCE (which behaves like a wide-scoped conference) andASE (which behaves like a narrow-scoped conference).
Wide-scoped conferences tend to receive more submissions, but typicallyhave smaller PCs than narrow-scoped ones, resulting in higher review load.A potential approach to lowering review loads is the Program Board modelused recently by conferences such as RE and MoDELS, and adopted by ICSEfor its 2014 edition.
3.2. Stability
To study stability of the conference community we analyse the PC turnoverand author turnover for the considered conferences. We also assess the influenceof the availability of a PC charter on the PC turnover. Indeed, since conferencesare frequently subject to charters or guidelines that require PC renewal, theymust strike a balance between PC turnover and continuity.
PC turnover
Inviting PC members from previous editions helps to ensure continuity andcoherence. When studying RNC (c, y , 1 ), the PC turnover rate w.r.t. the pre-vious year, we observe a wide variation (Figure 7): the lowest observed PCrenewal ratio is 8.8% for SCAM 2005, and the highest is 93% for GPCE 2007.Using Spearman rank correlation, no clear monotonic trends could be inferredfor RNC (c, y , 1 ) for any of the conferences. To check whether the chosen widthof the sliding window (one year) affects our results, we repeated the analy-sis by looking at a longer period of 4 previous years. The PC turnover rate
12

RNC (c, y , 4 ) shows similar behaviour: no clear trends, and a big range of val-ues for the metric (from 8.8% for SCAM 2005 to 85% for GPCE 2007).
Confidence intervals for the relative effect reveal that wide-scoped confer-ences usually have higher values than narrow-scoped ones: p(narrow,wide) =0.779∗∗. One can conjecture that PC turnover might be correlated with thenumber of potential PC members, i.e., senior researchers active in research ar-eas covered by the conference. We consider estimating the number of potentialPC members as well as verifying this conjecture as future work.
FSE
MSR ICPC ASE WCRE SCAMCSMRICSM
GPCEICSE FASE
Figure 8: T-graph for the PCturnover w.r.t. previous yearRNC (c, y , 1 ).
We use T-graphs to compare distri-butions of RNC-metrics for different con-ferences. Two groups of conferences be-come apparent in Figure 8: the wide-scoped ICSE, FSE and FASE and thenarrow-scoped GPCE, have consistentlyhigher values of RNC (c, y , 1 ) than theother considered conferences.
We conjecture that presence of GPCEin the high-turnover group of conferencesmight be due either to relevance of theGPCE topics to a broader scientific com-munity, or failure to establish a core com-munity, One could also argue that thesmall PC size of GPCE plays a role: it iseasier to renew a large fraction of a smallrather than a large PC. However, while the PC of GPCE is smaller, e.g., thanthat of ICSE, it is not significantly different in size than the PC of FSE or FASE(as resulted from applying T to the values of #C , visualised in Figure 4). Amore detailed investigation of the reasons for high PC turnover in GPCE goesbeyond the scope of this article.
Wide-scoped conferences ICSE, FSE and FASE, and narrow-scoped GPCEhave consistently higher PC turnover than the other conferences. ASE (wide-scoped) appears to be an outlier with respect to the other wide-scoped con-ferences.
PC charter availability
The PC turnover rate often depends on external factors, such as the pres-ence of some implicit or explicit policy or charter requiring part of the PC tobe renewed every year. Conference charters commonly recommend that no PCmember should serve four consecutive terms. The ACM SIGSOFT policy, ap-plicable to ICSE, FSE, ASE and SCAM, requires at least one-third of the PCmembers to change each year. Our results confirm that ICSE and FSE (as wellas FASE and GPCE) always conform to this requirement of the ACM SIGSOFTpolicy. While ASE should also adhere to this policy, this is true for only 10 outof 18 editions considered, with the most recent noncompliance being in 2010.
13

Similarly, SCAM adheres to this policy in only 5 out of 12 editions considered,with the most recent noncompliance being in 2013.
ICSE and FSE always conform to the “at least one third” PC renewal policy,while ASE and SCAM do not.
The official charter of FASE (established at FASE 2004) requires that about50% of the PC members should be chosen from among PC members of theprevious two editions. Let us loosely interpret “about 50%” as the intervalbetween 40% and 60%. Although FASE did not always satisfy this requirement,it has been adhering to this charter regulation since 2009, and the threshold of50% has always been exceeded since the establishment of the charter.
Finally, the PC charter of ICSM, applied since 2004, requires between 10%and 30% of the members to be new with respect to the preceding year’s PC.Surprisingly, in nine years following the application of the charter (2004–2012)only ICSM 2007 adhered to this renewal policy (24,7%). All other ICSM editionsin this period exceed the required renewal percentage reaching 53% in 2007.
ICSM almost always exceeds the percentage of new PC members prescribedby the charter.
Author turnover
Author turnover is another indicator of conference stability. One can expectthat conferences attract local researchers, that might not be ready to participatein the subsequent edition organised at a different location. However, one can alsoexpect a relatively stable group of “core” researchers that are likely to contributeto a number of conference editions. Similar tradeoffs as with PC turnover arein place. On the one hand, a very unstable community might fail to achieve acritical research mass. On the other hand, a very stable community, in whichthe same authors publish over and over again, can be a sign of introversion.
ASE
ICSM ICPC
FASE
ICSE WCRE
Figure 9: T-graph forthe author turnoverw.r.t. four previousyears RNA(c, y , 4 ).Statistically indistin-guishable conferencesare not displayed.
We observed that all considered conferencesare very dynamic and have high author turnoverRNA(c, y , 1 ) with respect to the previous edition:from 2000 onwards values exceed 70% and can reachas high as 98% for GPCE 2000 or SCAM 2012, sug-gesting high openness to new authors. Overall, thelowest author turnover rate of 58% is observed forICPC in 1999, and the highest one of 100% for FASE1999. Given these high values, we hypothesise thatthe “new” authors are not necessarily new but ratherreturning after a short period of absence.
Figure 10 visualizes RNA(c, y , 4 ) that takes thefour preceding years into account. We still observehigh turnover (ranging from 49% for WCRE in 2006to 86% for ASE in 2006), but the results become less
extreme. The T-graph of Figure 9 further reveals
14

1997 1998 1999 2000 2001 2002 2003 2004 2005 2006 2007 2008 2009 2010 2011 2012 2013
0.00
0.25
0.50
0.75
1.00
ASE CSMR FASE FSE GPCE ICPC ICSE ICSM MSR SCAM WCRE
1997 2000 2003 2006 2009 2012
ASE
1997 2000 2003 2006 2009 2012
0.00
0.50
1.00
1997 2000 2003 2006 2009 2012
CSMR
1997 2000 2003 2006 2009 2012
0.00
0.50
1.00
1997 2000 2003 2006 2009 2012
FASE
1997 2000 2003 2006 2009 2012
0.00
0.50
1.00
1997 2000 2003 2006 2009 2012
FSE
1997 2000 2003 2006 2009 2012
0.00
0.50
1.00
1997 2000 2003 2006 2009 2012
GPCE
1997 2000 2003 2006 2009 2012
0.00
0.50
1.00
1997 2000 2003 2006 2009 2012
ICPC
1997 2000 2003 2006 2009 2012
0.00
0.50
1.00
1997 2000 2003 2006 2009 2012
ICSE
1997 2000 2003 2006 2009 2012
0.00
0.50
1.00
1997 2000 2003 2006 2009 2012
ICSM
1997 2000 2003 2006 2009 2012
0.00
0.50
1.00
1997 2000 2003 2006 2009 2012
MSR
1997 2000 2003 2006 2009 2012
0.00
0.50
1.00
1997 2000 2003 2006 2009 2012
SCAM
1997 2000 2003 2006 2009 20120.
000.
501.
001997 2000 2003 2006 2009 2012
WCRE
1997 2000 2003 2006 2009 2012
0.00
0.50
1.00
Figure 10: Variation of the author turnover w.r.t. four previous yearsRNA(c, y , 4 ). Wide-scoped conferences (solid lines) tend to have higher valuesthan narrow-scoped ones (dashed lines): p(narrow,wide) = 0.684∗∗. Relations
between individual conferences are visualised in the T-graph from Figure 9.
differences between the wide-scoped ASE and FASE, and the narrow-scopedICPC, ICSM and WCRE. Considered together, the wide-scoped conferencestend to have higher author turnover (p(narrow,wide) = 0.684∗∗). This is notsurprising since wide-scoped conferences have a larger pool of tentative authorsthat can contribute to them. This finding is concurrent with the observationthat such software engineering conferences as ASE, CAV, FASE, FM, FSE,ICSE, ISSTA are quite interdisciplinary [44].
All conferences have high author turnover: since 2000 there are more than70% new authors with respect to the previous edition, and more than 50%with respect to the previous four editions. Wide-scoped conferences tend tohave higher author turnover than the narrow-scoped ones.
We emphasize that attracting new authors and renewing the PC do not nec-essarily prevent introversion in wide-scoped conferences (e.g., the new authorscould also be PC members). We therefore further investigate openness andintroversion in subsections 3.3 and 3.4, respectively.
3.3. Openness
To evaluate openness, i.e., the ability of a conference to attract new authors,we study the evolution of RPNA(c, y , 4 )—the fraction of papers published atconference c in year y for which none of the co-authors has published at confer-ence c in the 4 preceding years (Figure 11). The lower this value, the less “open”the conference is to new authors. By focusing on the percentage of papers rather
15
1997 1998 1999 2000 2001 2002 2003 2004 2005 2006 2007 2008 2009 2010 2011 2012 2013
0.00
0.25
0.50
0.75
1.00
ASE CSMR FASE FSE GPCE ICPC ICSE ICSM MSR SCAM WCRE
1997 2000 2003 2006 2009 2012
ASE
1997 2000 2003 2006 2009 2012
0.00
0.50
1.00
1997 2000 2003 2006 2009 2012
CSMR
1997 2000 2003 2006 2009 2012
0.00
0.50
1.00
1997 2000 2003 2006 2009 2012
FASE
1997 2000 2003 2006 2009 2012
0.00
0.50
1.00
1997 2000 2003 2006 2009 2012
FSE
1997 2000 2003 2006 2009 2012
0.00
0.50
1.00
1997 2000 2003 2006 2009 2012
GPCE
1997 2000 2003 2006 2009 2012
0.00
0.50
1.00
1997 2000 2003 2006 2009 2012
ICPC
1997 2000 2003 2006 2009 2012
0.00
0.50
1.00
1997 2000 2003 2006 2009 2012
ICSE
1997 2000 2003 2006 2009 2012
0.00
0.50
1.00
1997 2000 2003 2006 2009 2012
ICSM
1997 2000 2003 2006 2009 2012
0.00
0.50
1.00
1997 2000 2003 2006 2009 2012
MSR
1997 2000 2003 2006 2009 2012
0.00
0.50
1.00
1997 2000 2003 2006 2009 2012
SCAM
1997 2000 2003 2006 2009 2012
0.00
0.50
1.00
1997 2000 2003 2006 2009 2012
WCRE
1997 2000 2003 2006 2009 2012
0.00
0.50
1.00
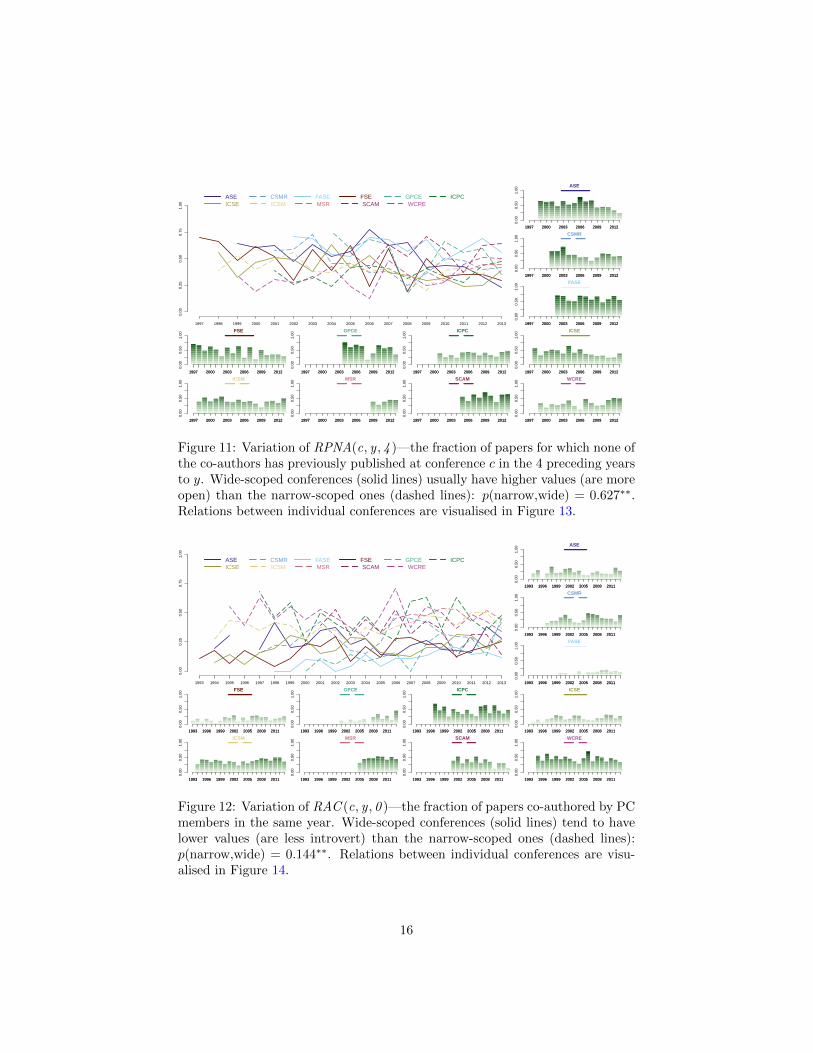
Figure 11: Variation of RPNA(c, y , 4 )—the fraction of papers for which none ofthe co-authors has previously published at conference c in the 4 preceding yearsto y. Wide-scoped conferences (solid lines) usually have higher values (are moreopen) than the narrow-scoped ones (dashed lines): p(narrow,wide) = 0.627∗∗.Relations between individual conferences are visualised in Figure 13.
1993 1994 1995 1996 1997 1998 1999 2000 2001 2002 2003 2004 2005 2006 2007 2008 2009 2010 2011 2012 2013
0.00
0.25
0.50
0.75
1.00
ASE CSMR FASE FSE GPCE ICPC ICSE ICSM MSR SCAM WCRE
1993 1996 1999 2002 2005 2008 2011
ASE
1993 1996 1999 2002 2005 2008 2011
0.00
0.50
1.00
1993 1996 1999 2002 2005 2008 2011
CSMR
1993 1996 1999 2002 2005 2008 2011
0.00
0.50
1.00
1993 1996 1999 2002 2005 2008 2011
FASE
1993 1996 1999 2002 2005 2008 2011
0.00
0.50
1.00
1993 1996 1999 2002 2005 2008 2011
FSE
1993 1996 1999 2002 2005 2008 2011
0.00
0.50
1.00
1993 1996 1999 2002 2005 2008 2011
GPCE
1993 1996 1999 2002 2005 2008 2011
0.00
0.50
1.00
1993 1996 1999 2002 2005 2008 2011
ICPC
1993 1996 1999 2002 2005 2008 2011
0.00
0.50
1.00
1993 1996 1999 2002 2005 2008 2011
ICSE
1993 1996 1999 2002 2005 2008 2011
0.00
0.50
1.00
1993 1996 1999 2002 2005 2008 2011
ICSM
1993 1996 1999 2002 2005 2008 2011
0.00
0.50
1.00
1993 1996 1999 2002 2005 2008 2011
MSR
1993 1996 1999 2002 2005 2008 2011
0.00
0.50
1.00
1993 1996 1999 2002 2005 2008 2011
SCAM
1993 1996 1999 2002 2005 2008 2011
0.00
0.50
1.00
1993 1996 1999 2002 2005 2008 2011
WCRE
1993 1996 1999 2002 2005 2008 2011
0.00
0.50
1.00
Figure 12: Variation of RAC (c, y , 0 )—the fraction of papers co-authored by PCmembers in the same year. Wide-scoped conferences (solid lines) tend to havelower values (are less introvert) than the narrow-scoped ones (dashed lines):p(narrow,wide) = 0.144∗∗. Relations between individual conferences are visu-alised in Figure 14.
16

than the percentage of authors, we avoid the phenomenon of “new faces”, e.g.,junior co-authors of researchers that have already published at the conference.Moreover, by looking at 4 previous years only, we remove the impact of theamount of historic data on the evaluation of openness.
SCAM
ICPCWCRE
FASE
ICSE MSR ICSM
ASE
Figure 13: T-graph for theratio of papers by new au-thors w.r.t. four previous yearsRPNA(c, y , 4 ). Statisticallyindistinguishable conferencesare not displayed.
At the high end of the scale (more open
communities), the T-graph of Figure 13 re-veals ASE, FASE and SCAM: ASE and SCAMtend to be more open than ICPC and WCRE.Similarly, FASE tends to be more open thanICPC, WCRE, ICSM, MSR and ICSE. At thelow end of the scale (more closed communities),no statistically significant ranking can be in-ferred between any of the conferences. Overall,the clearest trends are exhibited by ICSE andFSE, and in recent years ASE: over the years,the percentage of papers for which none of theco-authors has ever published at these confer-ences in the preceding four editions is decreas-ing (ASE: ρ = −0.629∗; FSE: ρ = −0.613∗∗;ICSE: ρ = −0.612∗). In other words, ICSE,FSE and ASE are becoming decreasingly open.
ASE, FASE and SCAM are among the most open communities (have a lowentrance barrier). ICSE, FSE and ASE are becoming increasingly less openover the years.
3.4. Introversion
CSMR
FSEFASE
ICSM
GPCEICSEASE
ICPC WCRE MSR SCAM
Figure 14: T-graph for the ra-tio of papers co-authored byPC members in the same yearRAC (c, y , 0 ).
To evaluate introversion we study the evo-lution of RAC (c, y , 0 ), the fraction of pa-pers co-authored by PC members in the sameyear (Figure 12). Again, the T-graph revealsdifferences between the wide-scoped ICSE,FSE, FASE, and ASE, and the narrow-scopedICSM, CSMR, WCRE, ICPC, MSR, SCAMand GPCE when considered as two groups:the wide-scoped conferences tend to be lessintrovert (p(narrow,wide) = 0.144∗∗).
The values range between 0% (no intro-version at all) for FASE 2002 or GPCE 2007and 71% for WCRE 2006 (high introversion).Overall, WCRE, ICPC, MSR, SCAM andICSM tend to be the most introvert (i.e., tendto have higher values of RAC (c, y , 0 ) thanother conferences), while GPCE, FSE and FASE tend to be the least introvert.
17

RAC(c,y,0)
RN
C(c
,y,1
)
0.0 0.2 0.4 0.6 0.8
0.00
0.25
0.50
0.75
1.00
●
●
●
●
●
●
●●
●
●
●
●●
●
●●
●●
●
●
●●
●
●
●
●
●●
●
●
●
●●
●
●
●●●
●
●●
●
●
●●
●
●
●
●
●
●
●
●
●
●
●
●
●
●
●
●
●●
●
●
●●
●
●
●
●
●●
●
● ●
●
●
●
●
●
●
●
●
●
●●
●
●
●
●
●
●
●
●
●●
●
●●
●
●●
ASE CSMR FASE FSE GPCE ICPC
ICSE ICSM MSR SCAM WCRE
Figure 15: For narrow-scoped (filled circles) rather than wide-scoped (emptysquares) conferences, higher PC turnover is associated with smaller fractions ofPC papers among the accepted papers.
However, both FASE (ρ = 0.79∗∗) and GPCE (ρ = 0.73∗∗) are becoming in-creasingly introvert. Repeating the analysis with a longer time window usingRAC (c, y , 4 ) concurs with the previous ranking.
WCRE (on average 47% of the papers accepted each year are co-authoredby PC members), MSR (46%), ICPC (46%), ICSM (38%) and SCAM (35%)tend to be the most introvert conferences. In contrast, FASE (10%), GPCE(14%) and FSE (18%) tend to be the least introvert. Overall, wide-scopedconferences tend to be less introvert than narrow-scoped ones.
Systa et al. [13] have observed negative linear correlation between RAC (c, y , 0 )and RNC (c, y , 1 ): “the less there is PC turnover, the greater is the proportionof PC papers among the accepted papers”. However, they also noticed that thenegative correlation does not necessarily hold for individual conference series,e.g., for CSMR the correlation was found to be reversed. We have replicatedtheir study for our larger set of conferences and longer period, and we have ob-served a similar phenomenon (Figure 15): RAC (c, y , 0 ) and RNC (c, y , 1 ) showa moderately-strong negative linear correlation (r = −0.57∗∗). The moderatecorrelation occurs in particular for the narrow-scoped (r = −0.55∗∗) rather thanthe wide-scoped (r = −0.33∗∗) conferences. At the level of individual confer-ence series, none of the conferences confirms this trend. This finding meansthat inherent features of conferences (rather than differences between individ-ual editions of the same conference) influence the association between a lowerPC turnover and a greater proportion of PC papers among the accepted papers.
18

When observing the whole set of conferences or focusing on narrow-scopedconferences only, higher PC turnover is associated with lower introversion.However, the claim does not typically hold at the level of individual confer-ence series.
3.5. Representativeness
ASE
ICSM ICPC
MSR WCRE
GPCE
CSMRFASE
ICSE
FSE
Figure 16: T-graph forRCnA(c, y , 4 ).
Ensuring a right balance between continuityand renewal is not the only sign of a healthy PC.We believe that PC members should be represen-tative of their respective communities, i.e., theyshould largely be established authors within thosecommunities.
However, not all PC members should be ex-pected to have published at a conference be-fore. For example, PC chairs often invite somePC members with industrial affiliation or back-ground, who typically do not publish often. In thecase of FASE, the charter explicitly mentions that“the PC should include at least 10% of memberswith industrial affiliation or background”. Simi-larly, senior researchers may be invited to serve onthe PC, even if they prefer to publish at more prestigious venues or in journalsinstead of conferences. Nevertheless, we expect high representativeness of thePC, given that all considered conferences are well-established and we analyse atleast ten years of history.
To investigate this, we studied RCnA(c, y , 4 ), the fraction of PC membersnot having (co)authored papers at conference c during any of the preceding foureditions. The higher the values, the less representative we claim the PC to be.Overall, we observe a wide range of values (Figure 17): the lowest is 12% forICPC 2001 (the earliest ICPC edition for which the metric can be computed),
and the highest is 85% for FSE 1997. The T-graph of Figure 16 reveals thatvalues of RCnA(c, y , 4 ) for WCRE are lower than for all other conferences exceptICPC, MSR and SCAM; ICSM and ICPC are both lower than any of CSMR,FSE, ASE and FASE. When viewed together, narrow-scoped conferences havemore representative PCs than wide-scoped ones (p(narrow,wide) = 0.808∗∗).
Narrow-scoped conferences have more representative PCs than wide-scopedones. For example, the WCRE PC is consistently more representative of itscommunity than the PCs of all other conferences except ICPC, MSR andSCAM. ICSM and ICPC also have representative PCs.
MSR (ρ = 0.9∗) and ICPC (ρ = 0.731∗∗) exhibit the clearest increasingtrends, suggesting that their PCs are becoming increasingly less representativeof their respective communities. However, one should also take into account thefact that the time series for MSR and ICPC started from values that were much
19

1997 1998 1999 2000 2001 2002 2003 2004 2005 2006 2007 2008 2009 2010 2011 2012 2013
0.00
0.25
0.50
0.75
1.00
ASE CSMR FASE FSE GPCE ICPC ICSE ICSM MSR SCAM WCRE
1997 2000 2003 2006 2009 2012
ASE
1997 2000 2003 2006 2009 2012
0.00
0.50
1.00
1997 2000 2003 2006 2009 2012
CSMR
1997 2000 2003 2006 2009 2012
0.00
0.50
1.00
1997 2000 2003 2006 2009 2012
FASE
1997 2000 2003 2006 2009 2012
0.00
0.50
1.00
1997 2000 2003 2006 2009 2012
FSE
1997 2000 2003 2006 2009 2012
0.00
0.50
1.00
1997 2000 2003 2006 2009 2012
GPCE
1997 2000 2003 2006 2009 2012
0.00
0.50
1.00
1997 2000 2003 2006 2009 2012
ICPC
1997 2000 2003 2006 2009 2012
0.00
0.50
1.00
1997 2000 2003 2006 2009 2012
ICSE
1997 2000 2003 2006 2009 2012
0.00
0.50
1.00
1997 2000 2003 2006 2009 2012
ICSM
1997 2000 2003 2006 2009 2012
0.00
0.50
1.00
1997 2000 2003 2006 2009 2012
MSR
1997 2000 2003 2006 2009 2012
0.00
0.50
1.00
1997 2000 2003 2006 2009 2012
SCAM
1997 2000 2003 2006 2009 20120.
000.
501.
001997 2000 2003 2006 2009 2012
WCRE
1997 2000 2003 2006 2009 2012
0.00
0.50
1.00
Figure 17: Variation of RCnA(c, y , 4 )—the ratio of PC members for conferencec in year y that have never co-authored a paper at any of the four precedinginstances of c. The PCs of narrow-scoped conferences (dashed lines) are morerepresentative of their communities than those of wide-scoped conferences (solidlines): p(narrow,wide) = 0.803∗∗. Relations between individual conferences arevisualised in Figure 16.
lower than for the other conferences, and that the highest values (2013 for MSRand 2012 for ICPC) still fall within the same range as for the other conferences.
ICPC starts off in 2001 by having the most representative PC out of allconferences, but its PC is becoming increasingly less representative over theyears.
3.6. Sustainability
We next investigate whether the conference communities comprise core au-thors that have not served on the PC at previous editions of the conference.Presence of such unsung heroes among the core authors can be seen as a mea-sure of conference health: such core authors, either senior researchers or PhDstudents, can and should serve as a pool of candidates for PC membership inthe future; moreover, they can contribute to increasing the representativenessof the PCs for their respective communities, should this be desired. Alterna-tively, the low number of unsung heroes can be seen as a sign of degenerationof the community/field. However, there is high variation in the number of PCmembers and number of authors between the different conferences (e.g., in 2007ICSM had 89 PC members, while ICSE had only 35). Therefore, we study vari-ation across conferences of SR(c, y), the average number of unsung heroes perPC member.
20

1998 1999 2000 2001 2002 2003 2004 2005 2006 2007 2008 2009 2010 2011 2012 2013
0.0
0.5
1.0
1.5
2.0
ASE CSMR FASE FSE GPCE ICPC ICSE ICSM MSR SCAM WCRE
1998 2000 2002 2004 2006 2008 2010 2012
ASE
1998 2000 2002 2004 2006 2008 2010 2012
0.0
1.0
2.0
1998 2000 2002 2004 2006 2008 2010 2012
CSMR
1998 2000 2002 2004 2006 2008 2010 2012
0.0
1.0
2.0
1998 2000 2002 2004 2006 2008 2010 2012
FASE
1998 2000 2002 2004 2006 2008 2010 2012
0.0
1.0
2.0
1998 2000 2002 2004 2006 2008 2010 2012
FSE
1998 2000 2002 2004 2006 2008 2010 2012
0.0
1.0
2.0
1998 2000 2002 2004 2006 2008 2010 2012
GPCE
1998 2000 2002 2004 2006 2008 2010 2012
0.0
1.0
2.0
1998 2000 2002 2004 2006 2008 2010 2012
ICPC
1998 2000 2002 2004 2006 2008 2010 2012
0.0
1.0
2.0
1998 2000 2002 2004 2006 2008 2010 2012
ICSE
1998 2000 2002 2004 2006 2008 2010 2012
0.0
1.0
2.0
1998 2000 2002 2004 2006 2008 2010 2012
ICSM
1998 2000 2002 2004 2006 2008 2010 2012
0.0
1.0
2.0
1998 2000 2002 2004 2006 2008 2010 2012
MSR
1998 2000 2002 2004 2006 2008 2010 2012
0.0
1.0
2.0
1998 2000 2002 2004 2006 2008 2010 2012
SCAM
1998 2000 2002 2004 2006 2008 2010 20120.
01.
02.
01998 2000 2002 2004 2006 2008 2010 2012
WCRE
1998 2000 2002 2004 2006 2008 2010 2012
0.0
1.0
2.0
Figure 18: Variation of SR(c, y)—the average number of unsung heroes perPC member. Wide-scoped conferences (solid lines) have more sustainable poolsof PC candidates than narrow-scoped ones (dashed lines): p(narrow,wide) =0.762∗∗. Relations between individual conferences are visualised in Figure 19.
FSE
SCAM
ICSE
CSMR WCRE ASEICPC ICSM MSR
FASE
Figure 19: T-graph for SR(c, y , 4 ).
ICSE and FSE stand out as theconferences with the most sustain-able pools of PC candidates in recentyears (Figures 19 and 18): since 2010there are on average 1.6 potential re-placements (core authors that did notserve on the PC of any of the preced-ing four editions) for each PC mem-ber for ICSE, and 1.2 for FSE. Us-ing the Spearman correlation we alsoconfirm (Figure 18) increasing trendsfor ASE (ρ = 0.891∗∗), FSE (ρ = 0.865∗∗) and ICSE (ρ = 0.732∗∗)—theyhave increasingly more sustainable pools of PC candidates; in contrast, GPCE(ρ = −0.900∗∗), WCRE (ρ = −0.727∗∗), CSMR (ρ = −0.699∗) and ICPC(ρ = −0.687∗) exhibit decreasing trends—finding qualified PC candidatesis becoming more challenging. When viewed together, wide-scoped confer-ences have more sustainable pools of PC candidates than narrow-scoped ones(p(narrow,wide) = 0.762∗∗).
There is high potential to renew the PC members for ICSE, FSE and ASEfrom within the core authors publishing at these conferences. In contrast,CSMR, WCRE, ICPC and GPCE have increasingly lower potential to renewthe PC from within their author communities.
21
3.7. Prestige
It is generally believed that the number of submissions to a conference isdirectly proportional to its scientific impact [45]. To verify this intuition, westudy the relation between the conference impact factor CI (c) and the numberof submissions #SP(c, y). Since CI (c) has a single value per conference seriesand is computed for the 2000-2012 interval, we contrast it against the meannumber of submissions during the same period. Computing the mean is mean-ingful since for each conference series the distribution of #SP(c, y) over theyears is close to normal (the Shapiro-Wilkinson test fails to reject the normal-ity hypothesis at 95% confidence level). We observe very strong positive andstatistically significant linear correlation (r = 0.95∗∗), confirming that moreprestigious conferences attract more submissions.
The higher the scientific impact of a conference, the more submissions itattracts.
The acceptance ratio has been related to conference prestige, e.g., by Manolo-poulos [46], and further debated by Laplante et al. [47]. It is also generallybelieved that the acceptance rate of a conference is inversely proportional to itsscientific impact [45]. To verify this intuition, we study the relation betweenthe conference impact factor CI (c) and the mean acceptance rate RA(c, y)for the 2000-2012 period, following the same reasoning as above. We observestrong negative linear correlation (r = −0.77), suggesting that conferences withhigher acceptance rates indeed have lower scientific impact. This conclusionis concurrent with the findings of Chen and Konstan [1] based on a study of600 ACM conferences, as well with a study of a database conference ADBIS byManolopoulos [46].
Higher impact conferences tend to have lower acceptance rates.
4. Discussion
In this section we combine and interpret the findings for each considered con-ference. Furthermore, when some of our indicators reveal that conference healthis threatened we propose strategies to improve it. We stress that our analysisdoes not suggest “optimal values” for conference health metrics. Based on ourexperience with software metrics, as well as with different software engineeringconferences, we do not believe in “one size fits all” thresholds. Consensus onthis kind of “optimal values” is hard to achieve, and once achieved it will missthe specific context of each individual conference. Moreover, the following dis-cussion shows that a relative comparison of different conferences is still possibleeven in absence of “optimal values”.
CSMR has a low author turnover. Together with average openness, thissuggests a relatively stable community. Moreover, the PC turnover is low, theintroversion and representativeness are neither high nor low. This suggeststhat the CSMR authors and PC members are relatively disconnected. As a
22

remediation strategy, one can consider inviting some of the “unsung heroes” tojoin the PC. However, sustainability of the PC pool candidates is decreasing,i.e., finding qualified PC members becomes more difficult.
ICSM, ICPC, and WCRE exhibit similar trends: all these conferences havelow author and PC turnover and average openness. The PC members activelycontribute to the paper body implying that the PC is representative for its au-thor community but there is also high introversion. Sustainability of the PCfor these conferences is low and exhibits a decreasing trend. Improving on thePC sustainability as well as increasing the PC turnover could be achieved byreducing the size of the PC. This would, however, increase the PC members’workload and, therefore, might endanger the quality of the reviews and nega-tively affect the scientific impact of the conference. Still, we have observed thatnot only ICSE, but also ASE and FSE with CI -values comparable to those ofICSM have much higher ratios of the number of submissions to the number ofPC members. Hence, higher reviewer load is not necessarily detrimental forthe scientific impact and might be beneficial for ICSM, ICPC, and WCRE. Asa countermeasure against introversion and closedness, these conferences mayconsider changing the traditional single-blind review by a double-blind reviewscheme as this scheme is fairer to authors from less prestigious institutions, thatare unlikely to be among the PC members [48]. Another alternative might con-sist in employing a double-open review scheme, although it may increase thereluctance of prospective PC members to join the PC.
GPCE, as opposed to CSMR, ICSM, ICPC and WCRE, has a high PCturnover and low introversion, suggesting that the PC members do not tend topublish at GPCE. However, the author turnover is low. This might be indica-tive of, on the one hand, relevance of the GPCE topics to the broader scientificcommunity, or alternatively, the failure to establish a relatively stable and suf-ficiently large core group ready to serve on the PC. Sustainability of the PC forGPCE is low and exhibits a decreasing trend.
ICSE is a highly prestigious conference with high author and PC turnover,suggesting that both authors and PC members can be selected from a large poolof candidates. ICSE, however, appears to become increasingly more difficult toenter, which in the long run might put the sustainability of the candidate-authorpool in jeopardy. The ICSE steering committee is aware of this, since they have amentoring program for new authors and, moreover, decided to adopt a ProgramBoard model as of 2014.
Similarly to ICSE, FSE has high author turnover, high PC turnover andlow introversion. Moreover, for FSE the sustainability of the PC is high andshows an increasing trend. Openness of FSE fluctuated greatly in early 2000sand seems to have stabilised at a relatively low level, suggesting that the samewarning as for ICSE seems to apply.
FASE, in general, exhibits typical features of wide-scoped conferences, e.g.,high author and PC turnover, little introversion and a pool of PC candidatesthat seems to be highly sustainable in recent years. Unlike ICSE and FSE,FASE is very open, suggesting the future sustainability of the conference.
Unlike FASE, ASE has a low PC turnover but similarly to FASE, it is very
23

open and has a high author turnover. Similarly to CSMR, the PC communityof ASE seems to be disconnected from the author community (the representa-tiveness is low). Therefore, similarly to CSMR we suggest inviting some of the“unsung heroes” of ASE to join the PC. Unlike CSMR, the sustainability of thePC candidates pool is higher for ASE.
MSR seems to be a conference at cross-roads: it has a relatively low butincreasing workload, caused by the increasing number of submissions and notadequately balanced by the increasing size of the PC. Its PC is representativeof the author community but is becoming less so due to a relatively low PCturnover and increasing author turnover. Finally, it does not yet have a charter,but the charter is in preparation and is expected to be presented at MSR 2014.While high author turnover and workload are more typical for wide-scopedconferences, low PC turnover is more common for narrow-scoped conferences.Sustainability of the conference is comparable to the more sustainable narrow-scoped conferences such as ICSM.
SCAM is an introvert conference, highly open to new authors and exhibitinghigh author turnover. Sustainability of the PC candidates pool is low, i.e.,finding qualified PC candidates is challenging. This suggests that while SCAMsucceeds in attracting new authors, it does not succeed in retaining those authorsfor a number of subsequent editions. SCAM has the lowest Conference ImpactCI = 15 among the conferences considered, which might be the reason why onlyfew authors would explicitly target SCAM on a regular basis.
5. Related work
In this article, we built upon the work by Systa, Harsu and Koskimies [13],replicating and extending their introversion study of 6 software engineering con-ferences (ICSE, ICSM, ICPC, CSMR, WCRE, and GPCE) observed during the2004-2009 period16. Our study takes into account more conferences, uses awider range of metrics, considers longer time periods, and uses T-graphs to per-form pairwise comparison of metrics across conferences. We assess the healthof software engineering conferences with respect to several criteria (communitystability, openness to new authors, introversion, representativeness of the PCwith respect to the authors’ community, availability of PC candidates, and sci-entific prestige), and we track how each health factor evolves over time for eachof the considered conferences.
Similar in spirit, although not focusing on software engineering conferences17,Biryukov and Dong [49] investigate how the communities represented by dif-ferent research subfields within computer science as well as the correspondingconferences are evolving and communicating to each other. They use DBLPdata to survey the development of authors’ careers, and extract features that
16The GPCE data is collected over the 2002-2009 period.17The only conference in common with our study is FSE.
24

can help distinguish between conferences of different rank. For example, pop-ulation stability (akin to our discussion of author turnover from Section 3.2)is recognised as “a candidate feature that helps to distinguish between the topand non-top venues”. They find that lower-rank conferences are characterisedby higher turnover (typically the newcomers constitute about 75-85% and theleavers up to 88% of all authors) and high percentage of pure newcomers amongthe newcomers (about 75%), the latter suggesting high openness (cf. our dis-cussion in Section 3.3). Our results suggest that wide-scoped conferences tendto have higher author turnover than narrow-scoped ones.
Also related, although again not focusing on software engineering confer-ences, are the works of Elmacioglu and Lee [50], Zhuang et al. [51] and Sakrand Alomari [52], who recognise the impact of PC quality on the conferencequality. Elmacioglu and Lee [50] extract information about PC compositionfor a number of conferences from Calls for Papers published on DBWorld18,and construct a collaboration graph for authors of these conferences from theACM Guide19. By dividing the set of analysed conferences into two groups(reputable and questionable20), they show that (i) reputable conferences tendto have smaller PC sizes than less reputable ones (28.8 members on average asopposed to 69.6); (ii) PC members of reputable conferences typically have morepublications than those of less reputable ones (complementary to our notion ofrepresentativeness, cf. Section 3.5); and (iii) most reputable conferences have PCmembers with high closeness values in the collaboration graph (the more centrala node is, the lower its total distance to all other nodes) on average. In our caseall considered conferences are well-established and would likely be labeled as“reputable”. However, our results using the T-procedure reveal that ICSM hasconsistently the largest PC among the considered conferences (63.5 memberson average), while FASE, GPCE and FSE have consistently the smallest ones(21.3, 23.1 and 26.7 members on average, respectively).
Similarly to us, Sakr and Alomari [52] also argue in favour of PC renewal:“it is quite unhealthy to have a fixed or slightly different list of members in theprogram committees for the different venues”, since this “may have intended orunintended negative effects in the fairness of evaluating the research contribu-tions or in the quality and variability of the conference programs”. They analysethe composition of the PCs for four top-tier and prestigious database confer-ences (SIGMOD, VLDB, ICDE, EDBT) over a period of 10 years (2001–2010),and report the percentage of overlap in the PC between the different editions ofeach conference. Although their metric is similar in spirit to our RNC (c, y ,n)for different values of n, we cannot directly compare our results since they usea slightly different definition21. Nonetheless, both their analysis and ours sug-gest that from the PC composition viewpoint, the considered conferences are
18http://research.cs.wisc.edu/dbworld/19Currently the ACM Digital Library.20Distinction based on personal experience of Elmacioglu and Lee.21Their metric is defined as the ratio of the number of PC members in common between
two editions and the number of distinct PC members of the same two editions.
25

relatively healthy.Inbreeding, related to introversion, has been studied by Inanc and Tuncer [53],
albeit with a different meaning. While we consider the conferences for whichPCs favour acceptance of papers submitted by PC members, they refer to asituation wherein PhDs are employed by the very same institution that trainedthem during their doctoral studies (denoted academic inbreeding). Using adataset of scholars from Turkish technical universities, the authors show thatinbreeding has negative consequences, affecting apparent scientific effectivenessas measured by one’s h-index.
Our “health assessment” of software engineering conferences can be furtherput in the context of quality evaluation (i.e., ranking) of scientific venues. Wehave used SHINE (the Simple H-INdex Estimator [23]) to rank the conferencesand show, e.g., that higher-impact conferences attract more submissions buttend to have lower acceptance rates. Numerous alternative approaches to rank-ing scientific venues have been proposed (e.g., [45, 54–61]), but they fall beyondthe scope of this paper. For example, da Silva et al. [59] propose a rankingscheme for scientific conferences based on ranking the PC members. Their rankmeasure is based on the h-index of the PC (i.e., the maximum number x of PCmembers such that each PC member has h-index [24] at least x) as well as theinequality (spread) of the h-indices of the PC members, computed using theGini index [62].
6. Threats to validity
As any empirical study our work is subject to a number threats to validity.We distinguish between three categories of threats: construct validity, exter-nal validity and internal validity. Construct validity is related to the questionwhether the measures proposed, i.e., the metrics in Table 2, constitute an ade-quate operationalisation of the concept we would like to measure, i.e., softwareengineering conference health. Internal validity is related to validity of theinferences made based on application of our entire research methodology. Ex-ternal validity discusses generalisation of our findings beyond the data we havecollected.
6.1. Construct validity
While assessing conference health has been the subject of a number of stud-ies [13, 63–65], operationalization of the concept has never been studied on itsown. Based on their experience as conference organisers, these authors usedthe number of submissions, the acceptance rate at the conference and the pro-gram committee’s workload as indicators of the conference health [63]. Theythen formulated best practices for conference organisation such as hierarchicalprogram committees, double blind reviewing and acceptance rate between 15%and 40% [64], and debated policy issues such as travel reduction and decouplingpublication from presentation, as well as evaluation issues such as “do PCs tendto favour PC-authored papers?” [65]. From this perspective we observe that
26

most of the metrics we proposed in Table 2 are closely related to the metricsused, best practices formulated and issues debated in the aforementioned pub-lications. It seems, therefore, that the research community is converging to ashared understanding of the concept of conference health.
Nevertheless, in the future we aim to assess the robustness of some of ourmetrics, such as the PNA metric or the SR metric that relies on a particulardefinition of the notion of core author. If we would use another variant of thesemetrics, how would this affect the results we obtained?
Further threats to construct validity are related to the concepts of “pres-tige” and “review load”. While a number of citation-based measures have beenproposed in the literature to operationalise “prestige”, these measures do notdistinguish between different contexts of citations. Moreover, a smaller, focusedconference will necessarily have fewer submissions than a large wide-scope con-ference, and yet, the smaller conference may carry more prestige in its areathan a wide-scoped one. In a similar way, we define the review load withouttaking into account the help of subreviewers or characteristics of individual sub-missions, such as the number of pages or quality of writing, that can facilitateor hinder the reviewing process. Moreover, while we have not found evidencefor application of more elaborate reviewing models such as the Program Boardmodel (Section 3.1) among the conferences we have studied, such a model mighthave been used informally. This suggests that a more fine-grained distinctionbetween different PC members might be needed to better quantify the reviewload.
6.2. Internal validity
Recall that the three steps of our methodology (Section 2) are data extrac-tion, metrics calculation, and data analysis and interpretation. Most internalvalidity threats related to the data extraction step stem from possible incom-pleteness of the data sources we have used: e.g., while the SHINE databasecontains information about circa 1800 conferences22, as any such collection itis inherently incomplete, and therefore the CI (c) values might underestimatethe true value of the conference h-index. Information about composition ofthe program committees has been taken from conference websites, proceedingsvolumes, the Wayback machine archive as well as announcements posted by con-ference organisers in Usenet newsgroups. Each one of these sources might beincomplete due to, e.g., editorial oversight. In the same way, information aboutthe conference authors has been taken from DBLP that might have been incom-plete as well. Finally, the number of submissions #SP(c, y) has been extractedfrom the prefaces in the proceedings volume. While many conferences employa two-phase submission process (first an abstract is submitted, then, usually aweek later, a full paper), in a number of cases the prefaces ambiguously referredto the “number of submissions” which can refer either to number of receivedabstracts or number of received full papers.
22http://shine.icomp.ufam.edu.br/about.php
27

Identity merging across multiple data sources has been explicitly recognizedas a reliability threat [66]. Automatic merging techniques might have missedmultiple representations of the same individual or considered multiple individu-als to be one and the same person. To counteract this threat we have consultedDBLP pages, that frequently indicate different names of the same researcher23,and also reviewed the results of the identity merging and corrected them man-ually.
To ensure validity of statistical inferences we have paid particular attentionto the use of appropriate statistical techniques.
6.3. External validity
We believe that the eleven conferences we have studied are a representativesample of well-established software engineering conferences. As described inSection 2.1 our study covers six conferences studied in [13], three additionalwide-scoped conferences and two additional young conferences. Our resultsmight not be generalizable to workshops, regional conferences, non-academicconferences or conferences outside of the software engineering domain.
7. Future Work
The analysis carried out in this article can be extended in many differentways. In this section we present what we believe to be the most interestingfuture research directions.
7.1. More objects of study
The first group of future work directions pertains to enriching the data col-lected by including more objects in our study.
For instance, throughout our analysis, we restricted ourselves to researchpapers submitted to the main conference track only. This was a deliberatechoice since we did not want to make the analysis overly complex. However,some conferences allow for both long and short papers in the main track. Bothtypes of papers are quite different in nature and should perhaps be accountedfor differently. Many conferences also offer different kinds of parallel tracks,in order to facilitate presentation of, e.g., early research achievements, PhDresearch, industrial results, research tools, and research projects.
A straightforward but labour-intensive extension would consist in replicatingour study for other computer science research domains (e.g. databases, artificialintelligence, theoretical computer science). Such replications would also allowone to relate the conference health factors to the considered domain.
While we focused on software engineering conferences, it would be useful toapply a similar approach to software engineering journals. Many of the met-rics proposed would need to be modified to take into account the specificities
23e.g., http://www.informatik.uni-trier.de/~ley/pers/hd/a/Andrews:Anneliese_
Amschler
28

of journal publication. For example, there is no such thing as a “journal pro-gramme committee”24 since, for every submitted paper, reviewers are assigned“ad hoc” based on the topic of the paper and the expertise and availability ofreviewers. It is probably also much harder to obtain historical data about thereviewers for papers that have been published in a particular journal. We arenot aware of such data being freely available. Another main difference is thatjournals do not tend to work with submission deadlines25. Papers can be sub-mitted at any time, and the time and process required for reviewing, revising,and resubmitting papers is also much more flexible than for conference papers.We would also have to come up with new metrics that reflect characteristicsthat are important for journal publications such as, for example, the averagetime from submission to final acceptance of the paper.
7.2. More information about the study objects
Rather than extending the study to include more study objects, one canconsider enriching the dataset by including additional information about thestudy objects (conferences) we have already considered. First of all, while weexcluded short-paper tracks from consideration, we have included in our datasubmissions to the main conference track that have been accepted as shortpapers. Distinction between main track submissions accepted as full papers andaccepted as short papers would allow us to investigate impact of the differencesbetween the two kinds of papers on, e.g., openness and introversion.
We can also record additional information about authors and PC members,e.g., their gender (which could be inferred automatically based on their names,e.g., as described in [67, 68]), geographical location, seniority, and researchexpertise. Presence of this information would allow us to obtain additional in-sights in representativeness of the PC with respect to the author communityin terms of gender, geographical location, seniority, and research expertise (cf.Section 3.5). Moreover, availability of this additional information about the PCmembers, would allow us to extend the charter adherence study initiated inSection 3.2. For instance, the ICSM charter explicitly states that the “ProgramChairs should make every effort to achieve diversity on the PC with respectto gender, geographic distribution, experience, and industry versus academicexperience” and requires PC to include members “whose areas of expertise suf-ficiently cover” different sub-areas of ICSM-related research. Furthermore, wecan also check whether evidence can be found for PC chairs/General conferencechairs favouring committee members of a certain gender, geographical location,seniority, and research expertise.
Information about the PC members’ research expertise would make it feasi-ble, with some effort, to come up with a fully objective measure of the conferencescope, allowing us to refine the distinction between wide-scope and narrow-scope
24The so-called editorial board is not the same, since it does not contain the full list ofreviewers of journal papers.
25We exclude here the so-called journal “special issues”
29

conferences considered in the current article. To achieve this, in addition to thePC members’ research expertise one would need to extract the solicited researchtopics as found in the call for papers and the websites of each conference, as wellas the topics of the actually accepted and published papers. Most software en-gineering conferences publish their proceedings through a digital library (IEEE,ACM, or Springer) that requires to follow a strict classification scheme of thepaper topic and subject area. Based on this, tracking and analysis the differentsoftware engineering topics that are covered by each conference, should be pos-sible, which in their turn can form the basis of a new metric that objectivelyquantifies the narrowness of scope of the conference.
7.3. Using the data
The final group of future work directions is related to possible applicationsof our work. To start with, we could consider studying probability of paperacceptance. While the acceptance ratio RA(c, y) can be used as a first roughestimate of this probability, better techniques should include information aboutthe authorship (e.g., is the paper more likely to be accepted if the author isalso member of the PC or a frequent co-author of some PC members?) andtopic(s) of the paper. Based on a more refined acceptance probability estimate,one can also consider modeling the prospective author behaviour by weightingthe effort she needs to put in preparing a submission against the probabilityof acceptance and potential benefits such as increased scientific visibility. Simi-larly to positive emotions affecting work engagement mediated by hope [69], weexpect that positive emotions associated with a paper accepted at a prestigiousconference in the preceding year give rise to hope, making the author to be moreinclined to submit the paper in the year afterwards. Using these kinds of models,conference organisers can obtain additional insights in the impact of differentpolicies recommended in the literature, such as increasing the acceptance rate,on future submissions (cf. [47]) and in evolution of the conference communities(“how will the GPCE author community look like in 2020?”). We believe thatthis kind of refined modelling is better than a single index of conference healthcombining multiple criteria or a “one size fits all” threshold. Indeed, such in-dices and thresholds are quite subjective, and might not be transferrable fromone conference to another.
Another promising research direction to explore pertains to collaboration be-tween researchers, both at intra-conference level (cohesion) and inter-conferencelevel (coupling). Conference cohesion can be evaluated by studying topics ofthe papers accepted and cooperation between the authors submitting to thesame conference: if the author community can be clearly separated into distinctgroups not linked by common publications or research topics, the conferenceis essentially an amalgamation of several disconnected communities. Lack ofcohesion might also explain high PC turnover. Coupling between different con-ferences arises if the same persons are PC members or authors of different con-ferences. The amount of coupling between conferences may play a role in howsome of the conference health indicators evolve over time. For example, when
30

renewing the PC, chairs can easily look for new qualified and willing PC can-didates in “coupled” conferences. Improved knowledge of conference couplingwould allow one to replicate the study on groups of related conferences. Indeed,if there is a high overlap in the author and PC communities of two conferences,these conferences could be aggregated into one since an author that has fre-quently published at one of the venues cannot be reasonably considered as a“new face” for the other. Finally, empirical evidence of high coupling betweenconferences may help the conference organisers to adapt conference organisa-tion, e.g., by merging or co-locating the events or by trying to differentiatethem more. Significant overlaps are likely to be present for some of the narrow-scoped conferences we have studied (in particular, ICSM, WCRE and CSMRthat target more or less the same subdomains of software engineering). This isone of the main reasons why CSMR and WCRE have decided to merge theirconferences into a single event in 2014.
8. Conclusions
The goal of this article was to assess how the health of software engineeringconferences evolves over time, in terms of a variety of criteria: stability andrepresentativeness of the PC with respect to the authors’ community, opennessto new authors, introversion, availability of PC candidates and scientific prestige.To this extent, we proposed a suite of metrics aiming to measure these healthindicators. The used metrics and methodology are applicable to other scientificconferences as well.
Our analysis, covering 11 software engineering conferences over a period ofmore than 10 years, indicate that these conferences are relatively healthy: bal-anced PC turnover (high enough to avoid introversion, yet low enough to ensurecontinuity and coherence), high openness to new authors (“new” in terms ofboth turnover with respect to previous years as well as not having published atthat conference ever before), and moderate introversion (in terms of fraction ofpapers co-authored by PC members). Nonetheless, we observed important dif-ferences across conferences according to the aforementioned criteria, suggestingdifferent strengths, weaknesses, opportunities and threats. We also observedimportant differences between wide-scoped and narrow-scoped software engi-neering conferences.
We do not believe in identifying a “holy grail” of conference health assess-ment, i.e., a small set of metrics or optimal values that are universally indicativeof conference health. Based on our previous experience with software metrics,as well as our experience as author, PC member or PC chair of different softwareengineering conferences, we are convinced that consensus on optimal metrics val-ues is hard to achieve and, once achieved, will miss conference-specific context.Instead, we presented a range of comparative analyses and countermeasuresthat can be useful for steering committees, programme committees, prospectiveauthors and researchers in different ways. A range of strategies could be usedto increase conference health, such as: inviting “unsung heroes” to join the PC,reducing the size of the PC, replacing the traditional single-blind review process
31

by either a double-blind or double-open review process, reducing reviewer loadby resorting to a Program Board review model or a “rolling deadline” model(such as the one followed by the VLDB conference series), merging conferencestogether or differentiating them better.
Acknowledgements
We thank Dave Binkley, David Rosenblum, Prem Devanbu, Vladimir Filkovand the anonymous reviewers for their very useful feedback on earlier versionsof this paper. We are grateful to Dr. Frank Konietschke for providing uswith the implementation of the T procedure. We also thank Andrei Jalba andMichel Westenberg for insightful comments on how to improve the visualisa-tion. This research has been partially supported by research project NWO600.065.120.10N235 financed by the Dutch Science Foundation (NederlandseOrganisatie voor Wetenschappelijk Onderzoek, NWO), and by F.R.S-FNRS re-search grant BSS-2012/V 6/5/015 (Fonds de la Recherche Scientifique) duringthe second author’s stay at the Universite de Mons. None of the funding agencieswas involved in the study design, in the collection, analysis and interpretationof data, in the writing of the report, and in the decision to submit the articlefor publication.
References
[1] J. Chen, J. A. Konstan, Conference paper selectivity and impact, Commun.ACM 53 (6) (2010) 79–83.
[2] M. Franceschet, The role of conference publications in CS, Commun. ACM53 (12) (2010) 129–132.
[3] B. Meyer, C. Choppy, J. Staunstrup, J. van Leeuwen, Viewpoint - Researchevaluation for computer science, Commun. ACM 52 (4) (2009) 31–34.
[4] D. Patterson, L. Snyder, J. Ullman, Best practices memo: evaluating com-puter scientists and engineers for promotion and tenure, Computing Re-search News 11 (4).
[5] L. Fortnow, Viewpoint - time for computer science to grow up, Commun.ACM 52 (8) (2009) 33–35.
[6] M. Y. Vardi, Conferences vs. journals in computing research, Commun.ACM 52 (5) (2009) 5.
[7] J. Crowcroft, S. Keshav, N. McKeown, Viewpoint: Scaling the academicpublication process to internet scale, Commun. ACM 52 (1) (2009) 27–30.
[8] K. Birman, F. B. Schneider, Viewpoint - program committee overload insystems, Commun. ACM 52 (5) (2009) 34–37.
32

[9] J. Freyne, L. Coyle, B. Smyth, P. Cunningham, Relative status of journaland conference publications in computer science, Commun. ACM 53 (11)(2010) 124–132.
[10] M. Franceschet, The skewness of computer science, Inf. Process. Manage.47 (1) (2011) 117–124.
[11] M. Eckmann, A. Rocha, J. Wainer, Relationship between high-quality jour-nals and conferences in computer vision, Scientometrics 90 (2) (2012) 617–630.
[12] H. V. Jagadish, The conference reviewing crisis and a proposed solution,SIGMOD Record 37 (3) (2008) 40–45.
[13] T. Systa, M. Harsu, K. Koskimies, Inbreeding in software engineering con-ferences, http://www.cs.tut.fi/~tsysta/, accessed October 2012.
[14] B. Vasilescu, A. Serebrenik, T. Mens, A historical dataset of software en-gineering conferences, in: Int’l Conf. Mining Software Repositories (MSR),IEEE, 2013, pp. 373–376.
[15] The DBLP computer science bibliography, http://dblp.uni-trier.de,accessed October 2012.
[16] G. Robles, J. Gonzalez-Barahona, Developer identification methods for in-tegrated data from various sources, in: MSR, ACM, 2005, pp. 1–5.
[17] C. Bird, A. Gourley, P. Devanbu, M. Gertz, A. Swaminathan, Mining emailsocial networks, in: MSR, ACM, 2006, pp. 137–143.
[18] W. Poncin, A. Serebrenik, M. G. J. van den Brand, Process mining softwarerepositories, in: CSMR, IEEE Computer Society, 2011, pp. 5–14.
[19] E. Kouters, B. Vasilescu, A. Serebrenik, M. G. van den Brand, Who’s whoin GNOME: using LSA to merge software repository identities, in: Int’lConference Software Maintenance - ERA track, IEEE, 2012, pp. 592–595.
[20] M. Goeminne, T. Mens, A comparison of identity merge algorithms forsoftware repositories, Science of Computer Programming 78 (8) (2013) 971–982.
[21] B. Vasilescu, A. Serebrenik, M. Goeminne, T. Mens, On the variation andspecialisation of workload—a case study of the Gnome ecosystem commu-nity, Empirical Software Engineering - (-) (2013) –.
[22] B. Vasilescu, A. Serebrenik, P. T. Devanbu, V. Filkov, How social Q&Asites are changing knowledge sharing in open source software communities,in: CSCW, 2014, p. to appear.
[23] Simple h-index estimation, http://shine.icomp.ufam.edu.br/index.
php, accessed October 2012.
33

[24] J. E. Hirsch, An index to quantify an individual’s scientific research output,Proceedings of the National Academy of Sciences of the United States ofAmerica 102 (46) (2005) 16569–16572.
[25] A. Capiluppi, A. Serebrenik, A. Youssef, Developing an h-index for OSSdevelopers, in: Int’l Conf. Mining Software Repositories (MSR), 2012, pp.251–254.
[26] R Development Core Team, R: A Language and Environment for Statisti-cal Computing, R Foundation for Statistical Computing, Vienna, Austria(2010).
[27] W. Javed, B. McDonnel, N. Elmqvist, Graphical perception of multipletime series, Visualization and Computer Graphics, IEEE Transactions on16 (6) (2010) 927–934.
[28] P. Cowpertwait, A. Metcalfe, Introductory time series with R, Springer,2009.
[29] M. Holander, D. A. Wolfe, Nonparametric statistical methods, Wiley, 1973.
[30] F. Wilcoxon, Individual comparisons by ranking methods, Biometrics Bul-letin 1 (6) (1945) 80–83.
[31] O. J. Dunn, Multiple comparisons among means, J AM STAT ASSOC 56(1961) 52–64.
[32] D. J. Sheskin, Handbook of Parametric and Nonparametric Statistical Pro-cedures, 4th Edition, Chapman & Hall, 2007.
[33] K. R. Gabriel, Simultaneous test procedures—some theory of multiple com-parisons, ANN MATH STAT 40 (1) (1969) 224–250.
[34] D. W. Zimmerman, B. D. Zumbo, Parametric alternatives to the Student ttest under violation of normality and homogeneity of variance, PERCEPTMOTOR SKILL 74 (3(1)) (1992) 835–844.
[35] E. Brunner, U. Munzel, The Nonparametric Behrens-Fisher Problem:Asymptotic Theory and a Small-Sample Approximation, Biometrical Jour-nal 42 (1) (2000) 17–25.
[36] F. Konietschke, L. A. Hothorn, E. Brunner, Rank-based multiple test pro-cedures and simultaneous confidence intervals, Electronic Journal of Statis-tics 6 (2012) 738–759.
[37] T. Jaki, L. Hothorn, Statistical evaluation of toxicological assays: Dunnettor williams test—take both, Archives of Toxicology (2013) 1–10.
[38] Y. Dajsuren, M. G. J. van den Brand, A. Serebrenik, S. Roubtsov, Simulinkmodels are also software: modularity assessment, in: Int’l ACM SigsoftConf. Quality of Software Architectures, QoSA ’13, ACM, 2013, pp. 99–106.
34

[39] B. Vasilescu, V. Filkov, A. Serebrenik, StackOverflow and GitHub: Asso-ciations between software development and crowdsourced knowledge, in:SocialCom/PASSAT, IEEE, 2013, p. to appear.
[40] B. M. Brown, T. P. Hettmansperger, Kruskal-Wallis, Multiple Comparisonsand Efron Dice, AUST NZ J STAT 44 (4) (2002) 427–438.
[41] G. Antoniol, M. Di Penta, M. Harman, Search-based techniques appliedto optimization of project planning for a massive maintenance project, in:Int’l Conf. Software Maintenance (ICSM), IEEE, 2005, pp. 240–249.
[42] F. Khomh, M. Di Penta, Y.-G. Gueheneuc, An exploratory study of theimpact of code smells on software change-proneness, in: Working Conf.Reverse Engineering, IEEE, 2009, pp. 75–84.
[43] F. Konietschke, nparcomp. Reference manual (2012).
[44] C. Bird, E. T. Barr, A. Nash, P. T. Devanbu, V. Filkov, Z. Su, Structureand dynamics of research collaboration in computer science, in: SDM, 2009,pp. 826–837.
[45] W. S. Martins, M. A. Goncalves, A. H. F. Laender, G. L. Pappa, Learningto assess the quality of scientific conferences: a case study in computerscience, in: Joint Conf. Digital Libraries (JCDL), 2009, pp. 193–202.
[46] Y. Manolopoulos, A statistic study for the adbis period 1994-2006, in: AD-BIS Research Communications, Vol. 215 of CEUR Workshop Proceedings,CEUR-WS.org, 2006.
[47] P. Laplante, J. Rockne, P. Montuschi, T. Baldwin, M. Hinchey, L. Shafer,J. Voas, W. Wang, Quality in conference publishing, Professional Commu-nication, IEEE Transactions on 52 (2) (2009) 183–196.
[48] R. Snodgrass, Single- versus double-blind reviewing: an analysis of theliterature, SIGMOD Rec. 35 (3) (2006) 8–21.
[49] M. Biryukov, C. Dong, Analysis of computer science communities based onDBLP, in: European Conf. Research and Advanced Technology for DigitalLibraries (ECDL), 2010, pp. 228–235.
[50] E. Elmacioglu, D. Lee, Oracle, where shall I submit my papers?, Commun.ACM 52 (2) (2009) 115–118.
[51] Z. Zhuang, E. Elmacioglu, D. Lee, C. L. Giles, Measuring conference qual-ity by mining program committee characteristics, in: Joint Conf. DigitalLibraries (JCDL), 2007, pp. 225–234.
[52] S. Sakr, M. Alomari, A decade of database conferences: a look inside theprogram committees, Scientometrics 91 (1) (2012) 173–184.
35
[53] O. Inanc, O. Tuncer, The effect of academic inbreeding on scientific effec-tiveness, Scientometrics 88 (3) (2011) 885–898.
[54] J. P. C. Kleijnen, W. J. H. V. Groenendaal, Measuring the quality of pub-lications: new methodology and case study, Inf. Process. Manage. 36 (4)(2000) 551–570.
[55] M. A. M. Souto, M. Warpechowski, J. P. M. Oliveira, An ontological ap-proach for the quality assessment of computer science conferences, in: Ad-vances in Conceptual Modeling – Foundations and Applications, Vol. 4802of Lecture Notes in Computer Science, Springer, 2007, pp. 202–212.
[56] W. S. Martins, M. A. Goncalves, A. H. F. Laender, N. Ziviani, Assess-ing the quality of scientific conferences based on bibliographic citations,Scientometrics 83 (1) (2010) 133–155.
[57] R. Klamma, M. C. Pham, Y. Cao, You never walk alone: Recommendingacademic events based on social network analysis, in: Int’l Conf. ComplexSciences, 2009, pp. 657–670.
[58] P. Kungas, S. Karus, S. Vakulenko, M. Dumas, C. Parra, F. Casati,Reverse-engineering conference rankings: what does it take to make a rep-utable conference?, Scientometrics (2013) 1–15.
[59] R. da Silva, J. P. M. de Oliveira, J. V. de Lima, V. Moreira, Statistics forranking program committees and editorial boards, CoRR abs/1002.1060.
[60] M. C. Pham, R. Klamma, M. Jarke, Development of computer science dis-ciplines: a social network analysis approach, Social Netw. Analys. Mining1 (4) (2011) 321–340.
[61] S. Yan, D. Lee, Toward alternative measures for ranking venues: a caseof database research community, in: Joint Conf. Digital Libraries (JCDL),2007, pp. 235–244.
[62] C. Gini, Measurement of inequality of incomes, Economic J. 31 (1921) 124–126.
[63] D. A. Patterson, The health of research conferences and the dearth of bigidea papers, Commun. ACM 47 (12) (2004) 23–24.
[64] M. D. Hill, J.-L. Gaudiot, M. Hall, J. Marks, P. Prinetto, D. Baglio, A wikifor discussing and promoting best practices in research, Commun. ACM49 (9) (2006) 63–64.
[65] J. C. Mogul, T. Anderson, Open issues in organizing computer systemsconferences, SIGCOMM Comput. Commun. Rev. 38 (3) (2008) 93–102.
[66] J. Howison, K. Crowston, A. Wiggins, Validity issues in the use of socialnetwork analysis with digital trace data, Journal of the Association forInformation Systems 12.
36

[67] B. Vasilescu, A. Capiluppi, A. Serebrenik, Gender, representation and on-line participation: A quantitative study of StackOverflow, in: ASE Inter-national Conference on Social Informatics, IEEE, 2012, pp. 332–338.
[68] B. Vasilescu, A. Capiluppi, A. Serebrenik, Gender, representation and on-line participation: A quantitative study, Interacting with Computers (2013)to appear.
[69] E. Ouweneel, P. M. Le Blanc, W. B. Schaufeli, C. I. van Wijhe, Goodmorning, good day: A diary study on positive emotions, hope, and workengagement, Human Relations 65 (9) (2012) 1129–1154.
37