HOW HEALTHY ARE CANADIANS?
46
PROTECTING AND EMPOWERING CANADIANS TO IMPROVE THEIR HEALTH HOW HEALTHY ARE CANADIANS? A TREND ANALYSIS OF THE HEALTH OF CANADIANS FROM A HEALTHY LIVING AND CHRONIC DISEASE PERSPECTIVE
Transcript of HOW HEALTHY ARE CANADIANS?
PROTECTING AND EMPOWERING CANADIANS TO IMPROVE THEIR HEALTH
HOW HEALTHY ARE CANADIANS?A TREND ANALYSIS OF THE HEALTH OF CANADIANS FROM A HEALTHY LIVING AND CHRONIC DISEASE PERSPECTIVE
TO PROMOTE AND PROTECT THE HEALTH OF CANADIANS THROUGH LEADERSHIP, PARTNERSHIP, INNOVATION AND ACTION IN PUBLIC HEALTH.
—Public Health Agency of Canada
Également disponible en français sous le titre : QUEL EST L’ÉTAT DE SANTÉ DES CANADIENS? Analyse des tendances relatives à la santé des Canadiens du point de vue des modes de vie sains et des maladies chroniques.
To obtain additional information, please contact:
Public Health Agency of CanadaAddress Locator 0900C2Ottawa, ON K1A 0K9Tel.: 613-957-2991Toll free: 1-866-225-0709Fax: 613-941-5366TTY: 1-800-465-7735E-mail: [email protected]
This publication can be made available in alternative formats upon request.
© Her Majesty the Queen in Right of Canada, as represented by the Minister of Health, 2016
Publication date: December 2016
This publication may be reproduced for personal or internal use only without permission provided the source is fully acknowledged.
PRINT Cat.: HP40-167/2016EISBN: 978-0-660-06582-3Pub.: 160196 PDFCat.: HP40-167/2016E-PDFISBN: 978-0-660-06581-6
IIIHOW HEALTHY ARE CANADIANS?
HOW HEALTHY ARE CANADIANS?A TREND ANALYSIS OF THE HEALTH
OF CANADIANS FROM A HEALTHY LIVING AND CHRONIC DISEASE PERSPECTIVE

VHOW HEALTHY ARE CANADIANS?
TABLE OF CONTENTSEXECUTIVE SUMMARY . . . . . . . . . . . . . . . . . . . . . . . . . . . . . . . . . . . I
INTRODUCTION . . . . . . . . . . . . . . . . . . . . . . . . . . . . . . . . . . . . . . . 3
MAIN FINDINGS . . . . . . . . . . . . . . . . . . . . . . . . . . . . . . . . . . . . . . . 5
RISK BEHAVIOURS ......................................................................................................................5
Smoking .................................................................................................................................5
Physical inactivity ....................................................................................................................6
Sedentary behaviour ..............................................................................................................7
Unhealthy eating ....................................................................................................................8
Harmful use of alcohol ...........................................................................................................9
Comparing risk behaviours and conditions ..........................................................................10
RISK CONDITIONS ....................................................................................................................12
Obesity ................................................................................................................................12
Hypertension ........................................................................................................................13
CHRONIC DISEASES .................................................................................................................14
Cardiovascular Diseases .......................................................................................................14
Ischemic heart disease (IHD) ................................................................................................14
Stroke ................................................................................................................................15
Cancer ................................................................................................................................16
Chronic respiratory diseases ................................................................................................17
Chronic obstructive pulmonary disease (COPD) ..................................................................17
Asthma ................................................................................................................................18
Diabetes ...............................................................................................................................19
Mood and anxiety disorders (health services use) ...............................................................20
Comparing diseases and risk conditions ..............................................................................21
CHRONIC DISEASE MULTI-MORBIDITY ...................................................................................23
Multi-morbidity ....................................................................................................................23
Mood and anxiety disorders co-morbidity ...........................................................................24
OTHER HEALTH INDICATORS ..................................................................................................25
Influenza immunization.........................................................................................................25
Neonatal and infant mortality ..............................................................................................26
Premature mortality ..............................................................................................................27
Life expectancy and health-adjusted life expectancy ..........................................................28
INTERNATIONAL COMPARISONS . . . . . . . . . . . . . . . . . . . . . . . . . . . . . 30
CONCLUSIONS . . . . . . . . . . . . . . . . . . . . . . . . . . . . . . . . . . . . . . 32
METHODOLOGICAL NOTES . . . . . . . . . . . . . . . . . . . . . . . . . . . . . . . . 33
CONTRIBUTORS . . . . . . . . . . . . . . . . . . . . . . . . . . . . . . . . . . . . . . 34
REFERENCES . . . . . . . . . . . . . . . . . . . . . . . . . . . . . . . . . . . . . . . 35

1HOW HEALTHY ARE CANADIANS?
EXECUTIVE SUMMARYGood health is a major resource for social, economic and personal development and an important dimension of quality of life. Healthy, productive citizens reduce the burden on the health care system and contribute to a strong economy.
In general, Canada is a healthy nation. Over the past several decades, the overall mortality rate and life expectancy have improved considerably, and, in general, Canada compares well with the other developed nations. Nevertheless, Canada continues to face significant public health challenges in preventing chronic diseases. Major chronic diseases, including cardiovascular diseases (CVDs), cancer, chronic respiratory diseases (CRDs) and diabetes, are the cause of 65% of all deaths in Canada each year and are the leading causes of death globally. In addition, depression and anxiety disorders are respectively, the second and eighth leading causes of years of life lost due to disability globally.
This Trend Analysis examines the last ten to fifteen years of available data investigating key risk factors, major chronic diseases and mood and anxiety disorders as well as overall life expectancy and asks the central question: How healthy are Canadians?
THE GOOD NEWS—CANADIANS ARE LIVING LONGER
• Both life expectancy (LE) and health-adjusted life expectancy (HALE)a in Canada have been steadily increasing in the past decade, and the gap between men and women has been narrowing.
• Overall mortality and premature mortality rates, particularly for CVDs, continue to decrease at a steady rate.
• The declining incidence ratesb for CVDs and chronic obstructive pulmonary disease (COPD) are linked to the major decrease in smoking rates in Canada across all age groups. Smoking rates have continued to decline in the past decade, especially among Canadian youth aged 15–24.
• Canada ranks among the top and middle third performers among Organisation for Economic Co-operation and Development (OECD) member states for most indicators.
AREAS OF CONCERN
Health implications for an ageing population• Nearly one in six Canadians (5.8 million) are 65 years or older, and this age group is
growing four times faster than overall population.
• More than one in five Canadian adults live with one of the following chronic diseases: CVD, cancer, CRD or diabetes.
a HALE refers to the average number of years that a person is expected to live in full health.b Incidence refers to the occurrence of new cases of disease or characteristics in a population over a specified period of time.
CCDSS trends in incidence rates may reflect a true change in population health status, but may also reflect changes in data collection methods, coding/classification systems, clinical practices, billing methods, etc.
2 HOW HEALTHY ARE CANADIANS?
• One in 25 Canadian adults aged 20 years and older reported having a mood and anxiety disorder and at least one of the four major chronic diseases.
• The prevalence ratesc for CVDs and CRDs have increased since 2000, reflecting that more Canadians are living with those diseases every year.
• In 2011/12, an estimated 2.3 million of Canadians were living with ischemic heart disease, almost 2 million were living with COPD, and about 700,000 were living with the effects of a stroke.
• Cancer is the leading cause of death. As of 2009, over 800,000 Canadians had been diagnosed with cancer within the previous 10 years, and nearly 90% of all newly diagnosed cancers were in Canadians 50 years or older.
• In addition, inequalities in chronic disease prevalence across subgroups of Canadians exist.
Canada’s persistently high prevalence of preventable chronic disease risk factors• Approximately four in five Canadian adults have at least one modifiable risk factor for
chronic disease (self-reported tobacco smoking, physical inactivity, unhealthy eating and harmful use of alcohol).
• Physical inactivity, sedentary behaviours and obesity rates remain high, especially among children and youth.
• In fact, more than 90% of Canadian children are not meeting current physical activity guidelines in Canada.
• Canada ranks amongst the worst of OECD countries for adult obesity rates.
The impact of type 2 diabetes rates• About 2.7 million Canadians are now living with diabetes (types 1 and 2 combinedd).
Diabetes has seen the second highest annual percent increase since 2000/01 among all diseases studied.
• The increase in diabetes prevalence rates is likely attributable to the high rates of obesity and overweight in Canadian population as well as the ageing of the Canadian population.1
• The number of prevalent cases for diagnosed diabetes is projected to be over four million people by 2020.2
Although trends show a major decrease in mortality in Canada, they also point to an increasing overall burden of disease. While Canadians are living longer, it is important that they live longer in good health. This trend report provides key information to help inform policy and programmatic decisions in health promotion and chronic disease prevention.
c Prevalence rate is the proportion of persons in a population who have a particular disease or attribute at a specified point in time or over a specified period of time.
d Type 2 diabetes could not be differentiated from type 1 because of physician-coding practices.
3HOW HEALTHY ARE CANADIANS?
INTRODUCTIONThere are many ways of looking at the health of a population. A focus on healthy living, chronic diseases and related risk factors—mainly cardiovascular diseases (CVDs), cancers, chronic respiratory diseases (CRDs) and diabetes—offers a perspective that is particularly relevant to public health as these conditions represent the leading causes of death and could largely be prevented. Most premature deaths are linked to common risk factors, namely tobacco smoking, unhealthy eating, physical inactivity and harmful use of alcohol. Addressing these risk factors and enhancing the management of these chronic diseases and conditions formed the basis of the World Health Organization’s (WHO) Global Action Plan for the Prevention and Control of Noncommunicable Diseases (NCDs) 2013-2020.3
In Canada, four in five Canadian adults have at least one modifiable risk factor, and one in five live with at least one of the following major chronic diseases: CVD, cancer, CRD and diabetes. Two-thirds of all deaths each year are caused by these major chronic diseases. In addition, mood and anxiety disorders are also common among Canadians and account for the leading cause of disability for working age adults. These four chronic diseases, along with mood and anxiety disorders, account for about one third of direct health-care expenditures in Canada.4e
This report from the Public Health Agency of Canada (PHAC) seeks to determine the level of health of Canadians. To do so, we looked at whether progress on main health indicators has been achieved in the last 10 to 15 years.
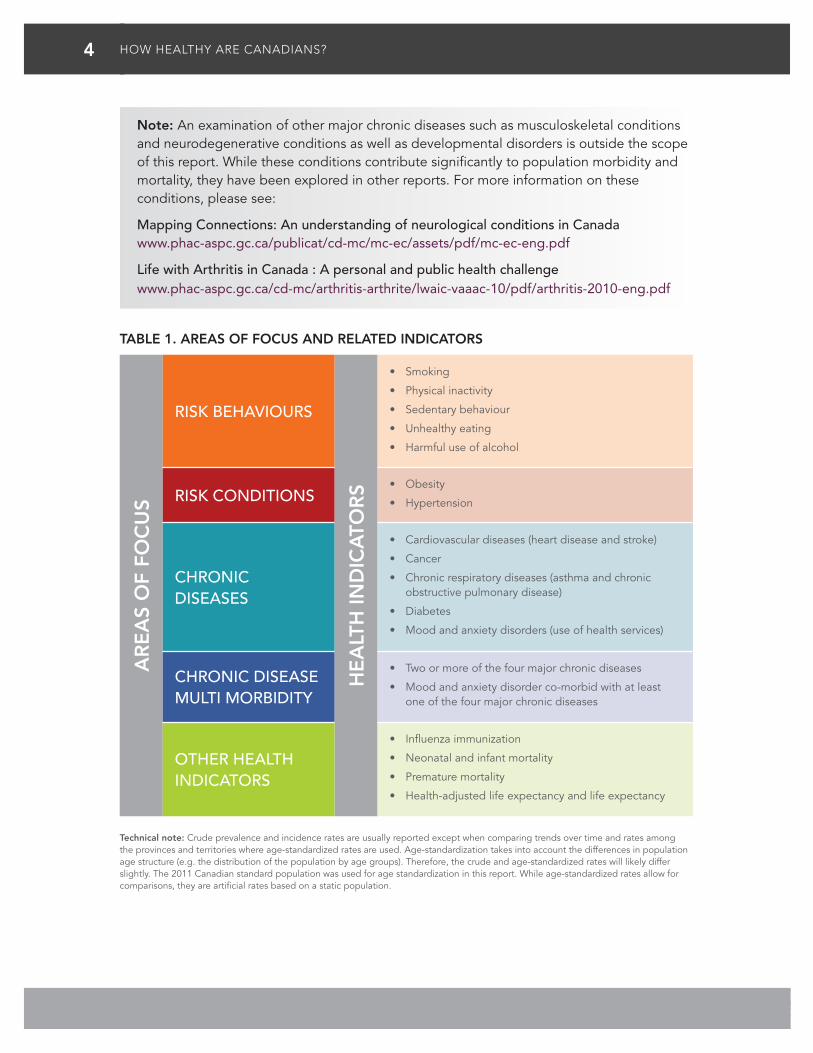
This report is structured primarily around the four major “physical” chronic diseases included in the WHO Global Plan of Action, four risk factors (smoking tobacco, physical inactivity, unhealthy eating and harmful use of alcohol) and two risk conditions (obesity and hypertension). To these we have added mood and anxiety disorders (measured by use of health services) because of their major impact on the working age population. Multi-morbidity (i.e. two or more of the four major “physical” chronic diseases co-existing, and mood and anxiety disorders co-morbid with one of the four major “physical” chronic diseases), a relatively common phenomena among the elderly, has also been examined. Moreover, several key international health indicators are included: infant/neonatal mortality, premature mortality, life expectancy (LE) and health-adjusted life expectancy (HALE). Finally, since those living with chronic diseases are particularly affected by influenza infections, the report also provides information on influenza immunization coverage. See Table 1 for an overview.
When feasible, this report focuses on Canadian prevalence and incidence trends—from 2000 to the latest year of data available—and presents further comparisons by sex, age group and geography (i.e. provinces and territories). A few selected international indicators were examined to compare the health of Canadians relative to other nations and are contextualized in the reporting of the Organisation for Economic Co-operation and Development (OECD).
e The direct health care costs of chronic diseases and conditions include those from cancer, CVDs, CRDs, diabetes, and mood and anxiety disorders. It excludes all direct health care costs from other important non-communicable diseases such as other neuro-psychiatric conditions, musculoskeletal diseases and digestive conditions, as well as costs from injuries, maternal and perinatal conditions and congenital anomalies.
4 HOW HEALTHY ARE CANADIANS?
Note: An examination of other major chronic diseases such as musculoskeletal conditions and neurodegenerative conditions as well as developmental disorders is outside the scope of this report. While these conditions contribute significantly to population morbidity and mortality, they have been explored in other reports. For more information on these conditions, please see:
Mapping Connections: An understanding of neurological conditions in Canada www.phac-aspc.gc.ca/publicat/cd-mc/mc-ec/assets/pdf/mc-ec-eng.pdf
Life with Arthritis in Canada : A personal and public health challenge www.phac-aspc.gc.ca/cd-mc/arthritis-arthrite/lwaic-vaaac-10/pdf/arthritis-2010-eng.pdf
TABLE 1. AREAS OF FOCUS AND RELATED INDICATORS
AR
EA
S O
F FO
CU
S
RISK BEHAVIOURS
HE
ALT
H IN
DIC
ATO
RS
• Smoking
• Physical inactivity
• Sedentary behaviour
• Unhealthy eating
• Harmful use of alcohol
RISK CONDITIONS• Obesity
• Hypertension
CHRONIC DISEASES
• Cardiovascular diseases (heart disease and stroke)
• Cancer
• Chronic respiratory diseases (asthma and chronic obstructive pulmonary disease)
• Diabetes
• Mood and anxiety disorders (use of health services)
CHRONIC DISEASE MULTI MORBIDITY
• Two or more of the four major chronic diseases
• Mood and anxiety disorder co-morbid with at least one of the four major chronic diseases
OTHER HEALTH INDICATORS
• Influenza immunization
• Neonatal and infant mortality
• Premature mortality
• Health-adjusted life expectancy and life expectancy
Technical note: Crude prevalence and incidence rates are usually reported except when comparing trends over time and rates among the provinces and territories where age-standardized rates are used. Age-standardization takes into account the differences in population age structure (e.g. the distribution of the population by age groups). Therefore, the crude and age-standardized rates will likely differ slightly. The 2011 Canadian standard population was used for age standardization in this report. While age-standardized rates allow for comparisons, they are artificial rates based on a static population.
5HOW HEALTHY ARE CANADIANS?
MAIN FINDINGSRISK BEHAVIOURS
Smoking
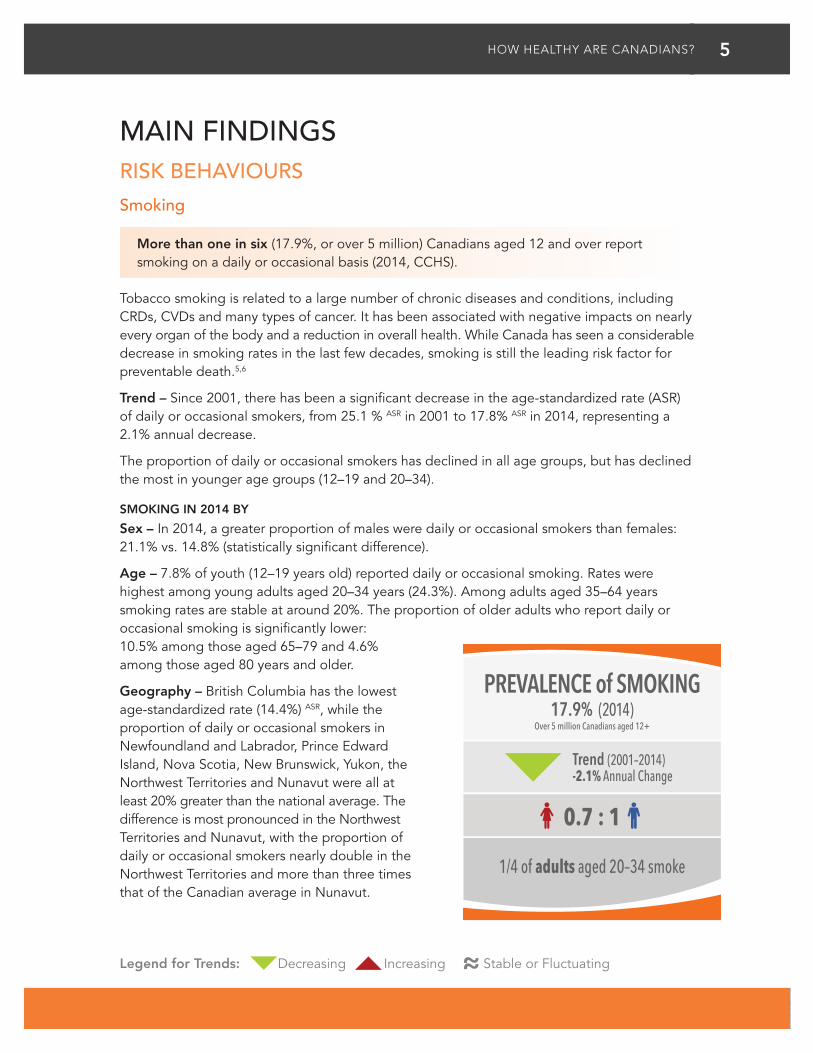
More than one in six (17.9%, or over 5 million) Canadians aged 12 and over report smoking on a daily or occasional basis (2014, CCHS).
Tobacco smoking is related to a large number of chronic diseases and conditions, including CRDs, CVDs and many types of cancer. It has been associated with negative impacts on nearly every organ of the body and a reduction in overall health. While Canada has seen a considerable decrease in smoking rates in the last few decades, smoking is still the leading risk factor for preventable death.5,6
Trend – Since 2001, there has been a significant decrease in the age-standardized rate (ASR) of daily or occasional smokers, from 25.1 % ASR in 2001 to 17.8% ASR in 2014, representing a 2.1% annual decrease.
The proportion of daily or occasional smokers has declined in all age groups, but has declined the most in younger age groups (12–19 and 20–34).
SMOKING IN 2014 BY
Sex – In 2014, a greater proportion of males were daily or occasional smokers than females: 21.1% vs. 14.8% (statistically significant difference).
Age – 7.8% of youth (12–19 years old) reported daily or occasional smoking. Rates were highest among young adults aged 20–34 years (24.3%). Among adults aged 35–64 years smoking rates are stable at around 20%. The proportion of older adults who report daily or occasional smoking is significantly lower: 10.5% among those aged 65–79 and 4.6% among those aged 80 years and older.
Geography – British Columbia has the lowest age-standardized rate (14.4%) ASR, while the proportion of daily or occasional smokers in Newfoundland and Labrador, Prince Edward Island, Nova Scotia, New Brunswick, Yukon, the Northwest Territories and Nunavut were all at least 20% greater than the national average. The difference is most pronounced in the Northwest Territories and Nunavut, with the proportion of daily or occasional smokers nearly double in the Northwest Territories and more than three times that of the Canadian average in Nunavut.
PREVALENCE of SMOKING
Trend (2001–2014)-2.1% Annual Change
1/4 of adults aged 20–34 smoke
17.9% (2014)
0.7 : 1
Over 5 million Canadians aged 12+
Legend for Trends: Decreasing Increasing Stable or Fluctuating
6 HOW HEALTHY ARE CANADIANS?
Physical inactivity
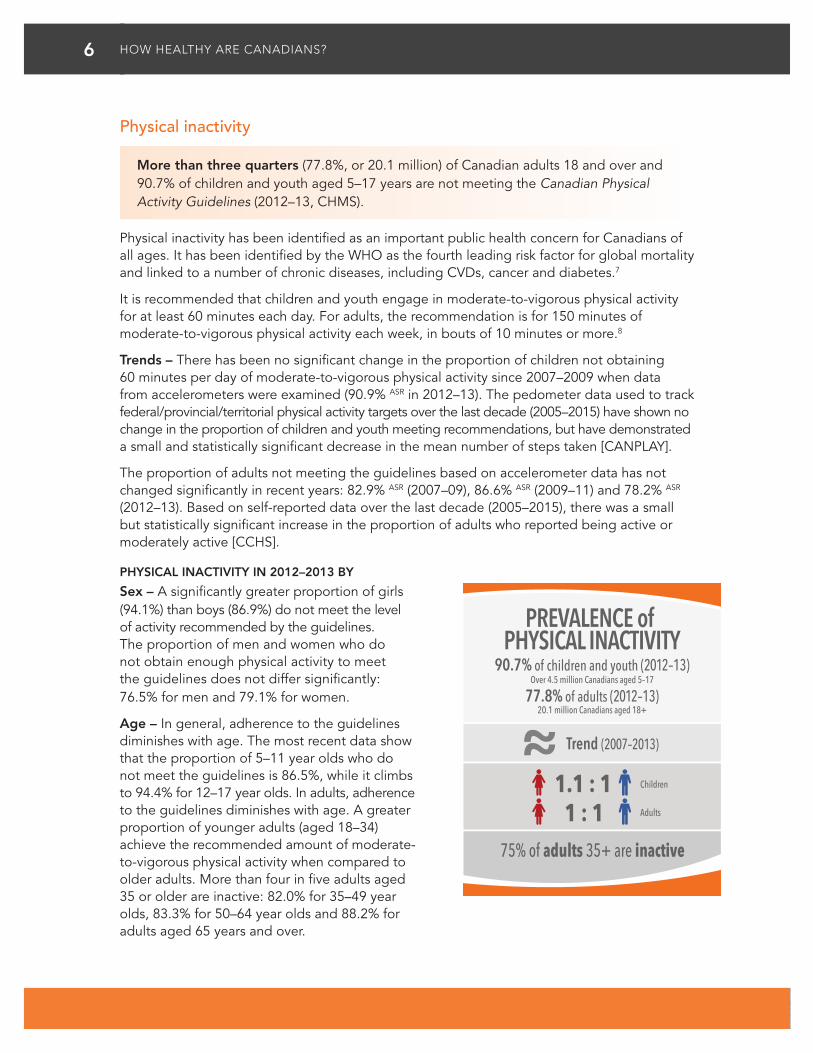
More than three quarters (77.8%, or 20.1 million) of Canadian adults 18 and over and 90.7% of children and youth aged 5–17 years are not meeting the Canadian Physical Activity Guidelines (2012–13, CHMS).
Physical inactivity has been identified as an important public health concern for Canadians of all ages. It has been identified by the WHO as the fourth leading risk factor for global mortality and linked to a number of chronic diseases, including CVDs, cancer and diabetes.7
It is recommended that children and youth engage in moderate-to-vigorous physical activity for at least 60 minutes each day. For adults, the recommendation is for 150 minutes of moderate-to-vigorous physical activity each week, in bouts of 10 minutes or more.8
Trends – There has been no significant change in the proportion of children not obtaining 60 minutes per day of moderate-to-vigorous physical activity since 2007–2009 when data from accelerometers were examined (90.9% ASR in 2012–13). The pedometer data used to track federal/provincial/territorial physical activity targets over the last decade (2005–2015) have shown no change in the proportion of children and youth meeting recommendations, but have demonstrated a small and statistically significant decrease in the mean number of steps taken [CANPLAY].
The proportion of adults not meeting the guidelines based on accelerometer data has not changed significantly in recent years: 82.9% ASR (2007–09), 86.6% ASR (2009–11) and 78.2% ASR (2012–13). Based on self-reported data over the last decade (2005–2015), there was a small but statistically significant increase in the proportion of adults who reported being active or moderately active [CCHS].
PHYSICAL INACTIVITY IN 2012–2013 BY
Sex – A significantly greater proportion of girls (94.1%) than boys (86.9%) do not meet the level of activity recommended by the guidelines. The proportion of men and women who do not obtain enough physical activity to meet the guidelines does not differ significantly: 76.5% for men and 79.1% for women.
Age – In general, adherence to the guidelines diminishes with age. The most recent data show that the proportion of 5–11 year olds who do not meet the guidelines is 86.5%, while it climbs to 94.4% for 12–17 year olds. In adults, adherence to the guidelines diminishes with age. A greater proportion of younger adults (aged 18–34) achieve the recommended amount of moderate-to-vigorous physical activity when compared to older adults. More than four in five adults aged 35 or older are inactive: 82.0% for 35–49 year olds, 83.3% for 50–64 year olds and 88.2% for adults aged 65 years and over.
PREVALENCE of PHYSICAL INACTIVITY
Trend (2007–2013)
75% of adults 35+ are inactive
90.7% of children and youth (2012–13)
1.1 : 1
Over 4.5 million Canadians aged 5–17
77.8% of adults (2012–13)20.1 million Canadians aged 18+
Children
Adults1 : 1
7HOW HEALTHY ARE CANADIANS?
Sedentary behaviour
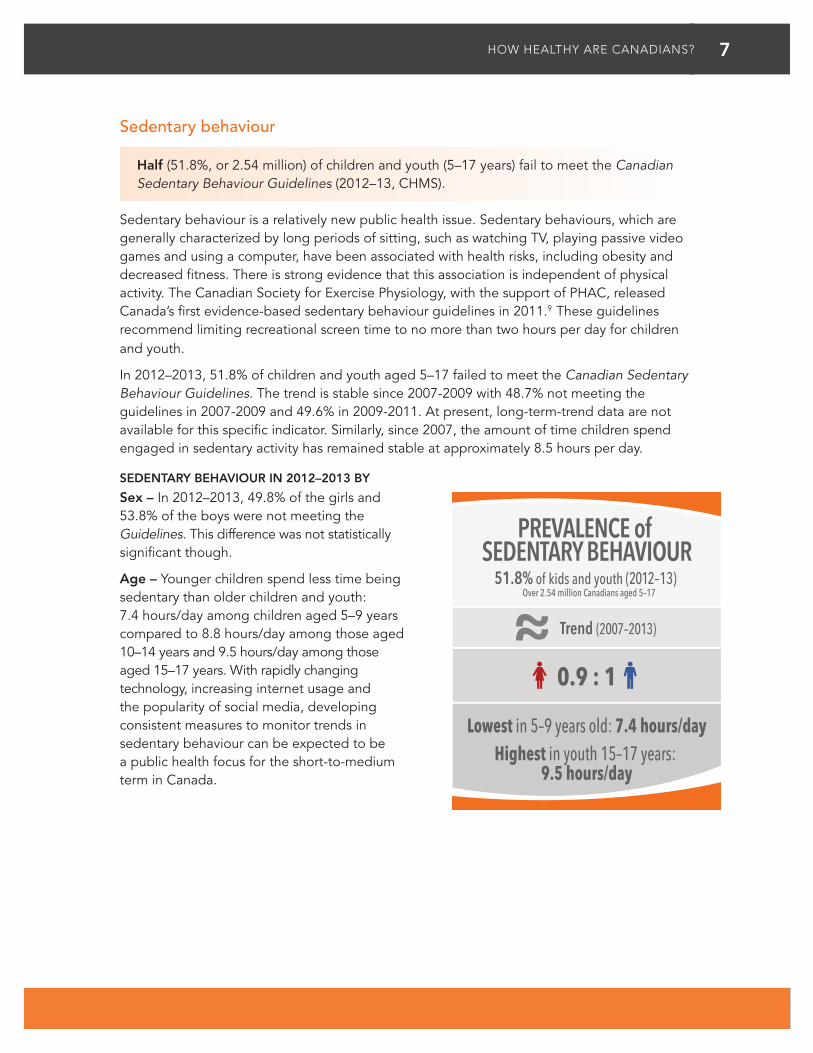
Half (51.8%, or 2.54 million) of children and youth (5–17 years) fail to meet the Canadian Sedentary Behaviour Guidelines (2012–13, CHMS).
Sedentary behaviour is a relatively new public health issue. Sedentary behaviours, which are generally characterized by long periods of sitting, such as watching TV, playing passive video games and using a computer, have been associated with health risks, including obesity and decreased fitness. There is strong evidence that this association is independent of physical activity. The Canadian Society for Exercise Physiology, with the support of PHAC, released Canada’s first evidence-based sedentary behaviour guidelines in 2011.9 These guidelines recommend limiting recreational screen time to no more than two hours per day for children and youth.
In 2012–2013, 51.8% of children and youth aged 5–17 failed to meet the Canadian Sedentary Behaviour Guidelines. The trend is stable since 2007-2009 with 48.7% not meeting the guidelines in 2007-2009 and 49.6% in 2009-2011. At present, long-term-trend data are not available for this specific indicator. Similarly, since 2007, the amount of time children spend engaged in sedentary activity has remained stable at approximately 8.5 hours per day.
SEDENTARY BEHAVIOUR IN 2012–2013 BY
Sex – In 2012–2013, 49.8% of the girls and 53.8% of the boys were not meeting the Guidelines. This difference was not statistically significant though.
Age – Younger children spend less time being sedentary than older children and youth: 7.4 hours/day among children aged 5–9 years compared to 8.8 hours/day among those aged 10–14 years and 9.5 hours/day among those aged 15–17 years. With rapidly changing technology, increasing internet usage and the popularity of social media, developing consistent measures to monitor trends in sedentary behaviour can be expected to be a public health focus for the short-to-medium term in Canada.
PREVALENCE of SEDENTARY BEHAVIOUR
Lowest in 5–9 years old: 7.4 hours/dayHighest in youth 15–17 years:
9.5 hours/day
0.9 : 1
Over 2.54 million Canadians aged 5–1751.8% of kids and youth (2012–13)
Trend (2007–2013)
8 HOW HEALTHY ARE CANADIANS?
Unhealthy eating
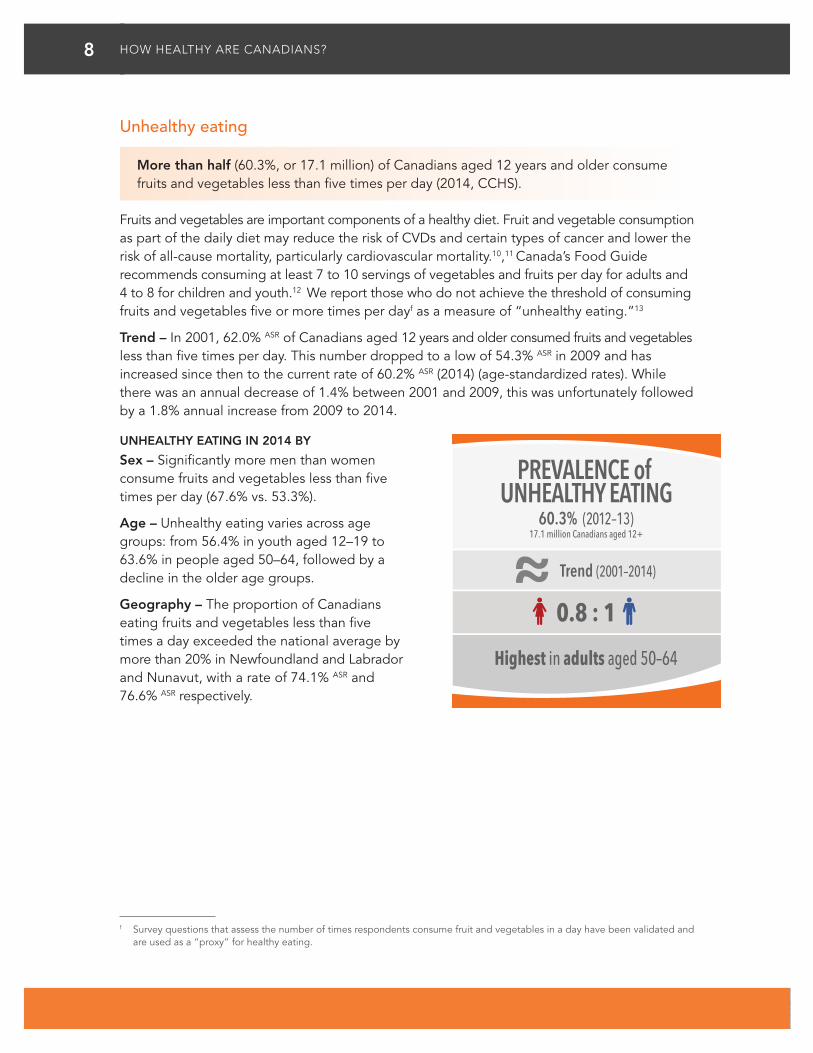
More than half (60.3%, or 17.1 million) of Canadians aged 12 years and older consume fruits and vegetables less than five times per day (2014, CCHS).
Fruits and vegetables are important components of a healthy diet. Fruit and vegetable consumption as part of the daily diet may reduce the risk of CVDs and certain types of cancer and lower the risk of all-cause mortality, particularly cardiovascular mortality.10,11 Canada’s Food Guide recommends consuming at least 7 to 10 servings of vegetables and fruits per day for adults and 4 to 8 for children and youth.12 We report those who do not achieve the threshold of consuming fruits and vegetables five or more times per dayf as a measure of “unhealthy eating.”13
Trend – In 2001, 62.0% ASR of Canadians aged 12 years and older consumed fruits and vegetables less than five times per day. This number dropped to a low of 54.3% ASR in 2009 and has increased since then to the current rate of 60.2% ASR (2014) (age-standardized rates). While there was an annual decrease of 1.4% between 2001 and 2009, this was unfortunately followed by a 1.8% annual increase from 2009 to 2014.
UNHEALTHY EATING IN 2014 BY
Sex – Significantly more men than women consume fruits and vegetables less than five times per day (67.6% vs. 53.3%).
Age – Unhealthy eating varies across age groups: from 56.4% in youth aged 12–19 to 63.6% in people aged 50–64, followed by a decline in the older age groups.
Geography – The proportion of Canadians eating fruits and vegetables less than five times a day exceeded the national average by more than 20% in Newfoundland and Labrador and Nunavut, with a rate of 74.1% ASR and 76.6% ASR respectively.
f Survey questions that assess the number of times respondents consume fruit and vegetables in a day have been validated and are used as a “proxy” for healthy eating.
PREVALENCE of UNHEALTHY EATING
Trend (2001–2014)
60.3% (2012–13)
0.8 : 1
17.1 million Canadians aged 12+
Highest in adults aged 50–64
9HOW HEALTHY ARE CANADIANS?
Harmful use of alcohol
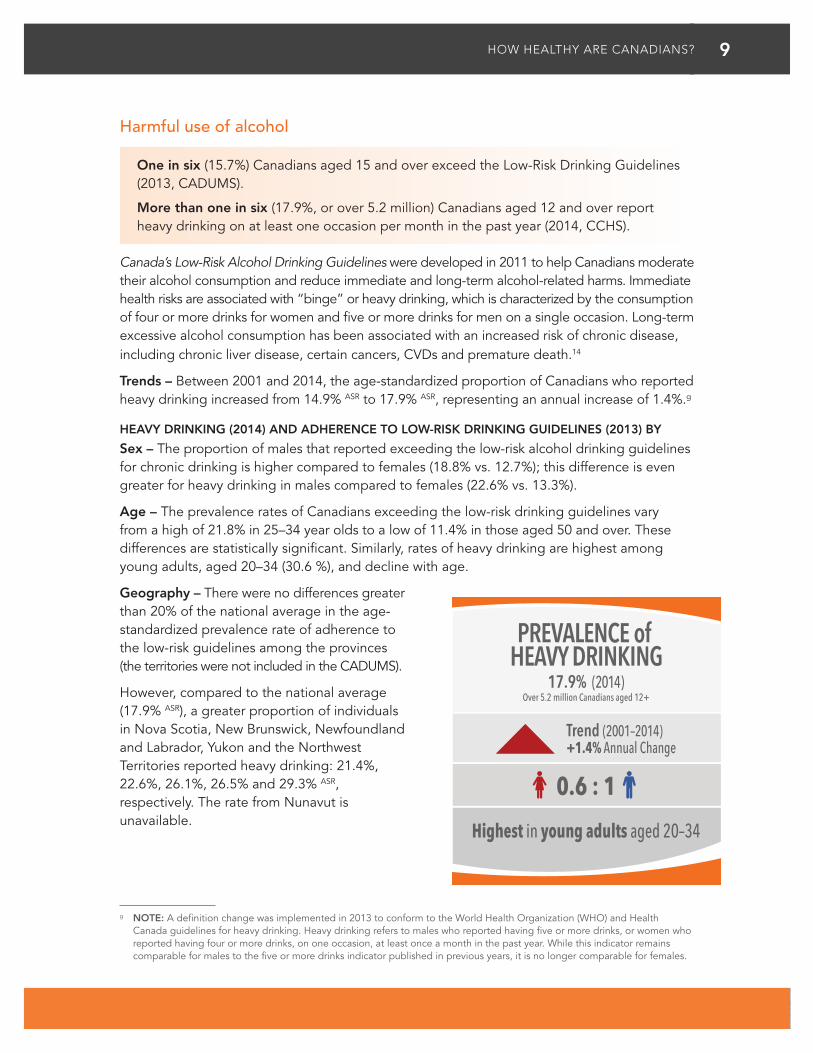
One in six (15.7%) Canadians aged 15 and over exceed the Low-Risk Drinking Guidelines (2013, CADUMS).
More than one in six (17.9%, or over 5.2 million) Canadians aged 12 and over report heavy drinking on at least one occasion per month in the past year (2014, CCHS).
Canada’s Low-Risk Alcohol Drinking Guidelines were developed in 2011 to help Canadians moderate their alcohol consumption and reduce immediate and long-term alcohol-related harms. Immediate health risks are associated with “binge” or heavy drinking, which is characterized by the consumption of four or more drinks for women and five or more drinks for men on a single occasion. Long-term excessive alcohol consumption has been associated with an increased risk of chronic disease, including chronic liver disease, certain cancers, CVDs and premature death.14
Trends – Between 2001 and 2014, the age-standardized proportion of Canadians who reported heavy drinking increased from 14.9% ASR to 17.9% ASR, representing an annual increase of 1.4%.g
HEAVY DRINKING (2014) AND ADHERENCE TO LOW-RISK DRINKING GUIDELINES (2013) BY
Sex – The proportion of males that reported exceeding the low-risk alcohol drinking guidelines for chronic drinking is higher compared to females (18.8% vs. 12.7%); this difference is even greater for heavy drinking in males compared to females (22.6% vs. 13.3%).
Age – The prevalence rates of Canadians exceeding the low-risk drinking guidelines vary from a high of 21.8% in 25–34 year olds to a low of 11.4% in those aged 50 and over. These differences are statistically significant. Similarly, rates of heavy drinking are highest among young adults, aged 20–34 (30.6 %), and decline with age.
Geography – There were no differences greater than 20% of the national average in the age- standardized prevalence rate of adherence to the low-risk guidelines among the provinces (the territories were not included in the CADUMS).
However, compared to the national average (17.9% ASR), a greater proportion of individuals in Nova Scotia, New Brunswick, Newfoundland and Labrador, Yukon and the Northwest Territories reported heavy drinking: 21.4%, 22.6%, 26.1%, 26.5% and 29.3% ASR, respectively. The rate from Nunavut is unavailable.
g NOTE: A definition change was implemented in 2013 to conform to the World Health Organization (WHO) and Health Canada guidelines for heavy drinking. Heavy drinking refers to males who reported having five or more drinks, or women who reported having four or more drinks, on one occasion, at least once a month in the past year. While this indicator remains comparable for males to the five or more drinks indicator published in previous years, it is no longer comparable for females.
PREVALENCE of HEAVY DRINKING
17.9% (2014)
0.6 : 1
Over 5.2 million Canadians aged 12+
Highest in young adults aged 20–34
Trend (2001–2014)+1.4% Annual Change
10 HOW HEALTHY ARE CANADIANS?
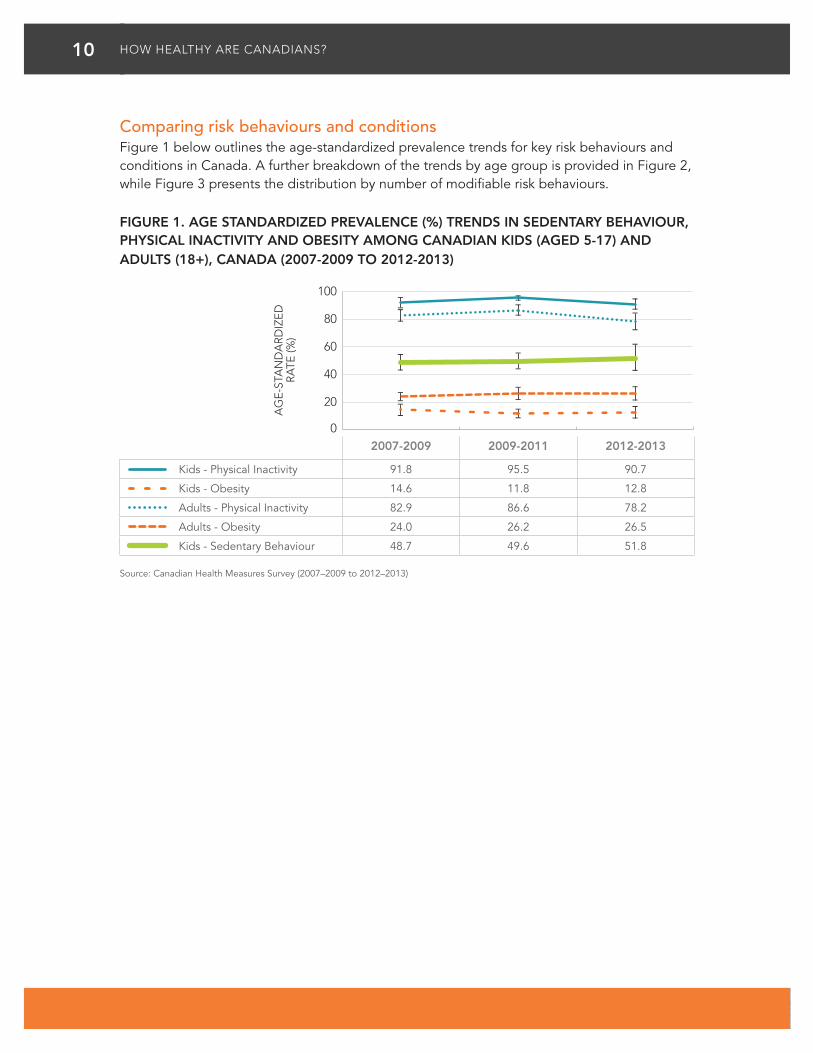
Comparing risk behaviours and conditionsFigure 1 below outlines the age-standardized prevalence trends for key risk behaviours and conditions in Canada. A further breakdown of the trends by age group is provided in Figure 2, while Figure 3 presents the distribution by number of modifiable risk behaviours.
FIGURE 1. AGE STANDARDIZED PREVALENCE (%) TRENDS IN SEDENTARY BEHAVIOUR, PHYSICAL INACTIVITY AND OBESITY AMONG CANADIAN KIDS (AGED 5-17) AND ADULTS (18+), CANADA (2007-2009 TO 2012-2013)
2007-2009 2009-2011 2012-2013
Kids - Physical Inactivity 91.8 95.5 90.7
Kids - Obesity 14.6 11.8 12.8
Adults - Physical Inactivity 82.9 86.6 78.2
Adults - Obesity 24.0 26.2 26.5
Kids - Sedentary Behaviour 48.7 49.6 51.8
Source: Canadian Health Measures Survey (2007–2009 to 2012–2013)
0
20
40
60
80
100A
GE
-STA
ND
AR
DIZ
ED
R
ATE
(%)
11HOW HEALTHY ARE CANADIANS?
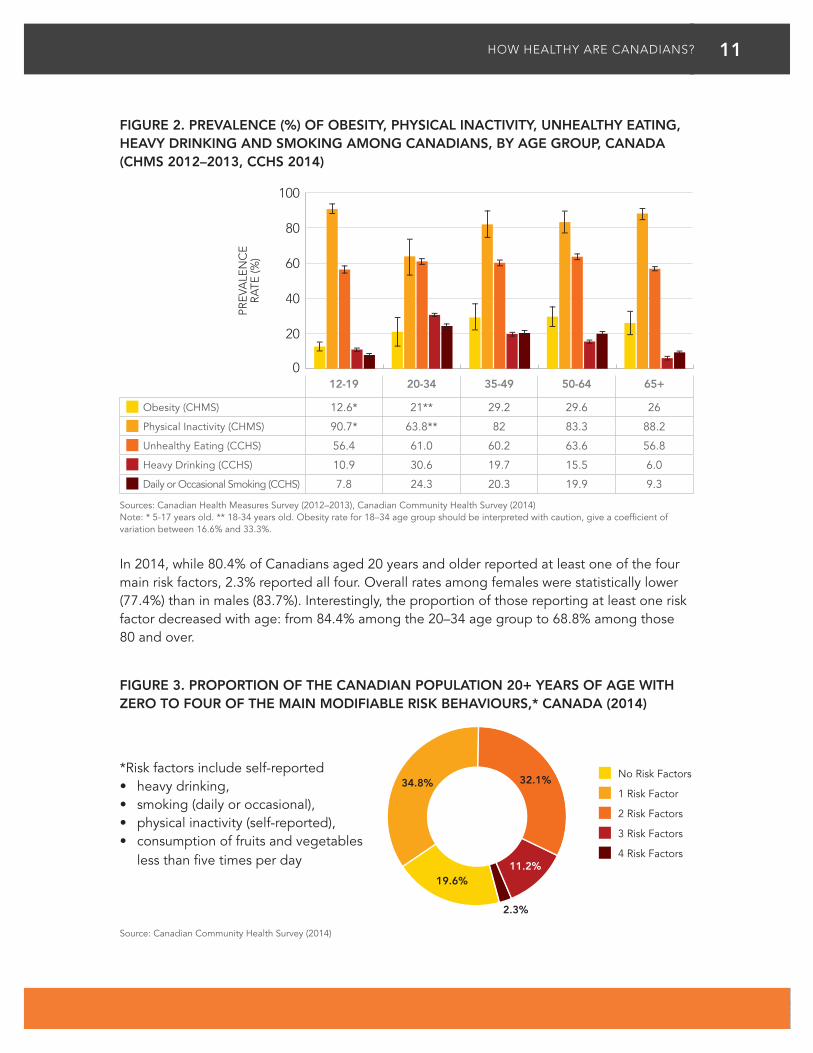
FIGURE 2. PREVALENCE (%) OF OBESITY, PHYSICAL INACTIVITY, UNHEALTHY EATING, HEAVY DRINKING AND SMOKING AMONG CANADIANS, BY AGE GROUP, CANADA (CHMS 2012–2013, CCHS 2014)
12-19 20-34 35-49 50-64 65+
Obesity (CHMS) 12.6* 21** 29.2 29.6 26
Physical Inactivity (CHMS) 90.7* 63.8** 82 83.3 88.2
Unhealthy Eating (CCHS) 56.4 61.0 60.2 63.6 56.8
Heavy Drinking (CCHS) 10.9 30.6 19.7 15.5 6.0
Daily or Occasional Smoking (CCHS) 7.8 24.3 20.3 19.9 9.3
Sources: Canadian Health Measures Survey (2012–2013), Canadian Community Health Survey (2014)Note: * 5-17 years old. ** 18-34 years old. Obesity rate for 18–34 age group should be interpreted with caution, give a coefficient of variation between 16.6% and 33.3%.
In 2014, while 80.4% of Canadians aged 20 years and older reported at least one of the four main risk factors, 2.3% reported all four. Overall rates among females were statistically lower (77.4%) than in males (83.7%). Interestingly, the proportion of those reporting at least one risk factor decreased with age: from 84.4% among the 20–34 age group to 68.8% among those 80 and over.
FIGURE 3. PROPORTION OF THE CANADIAN POPULATION 20+ YEARS OF AGE WITH ZERO TO FOUR OF THE MAIN MODIFIABLE RISK BEHAVIOURS,* CANADA (2014)
*Risk factors include self-reported• heavy drinking, • smoking (daily or occasional), • physical inactivity (self-reported), • consumption of fruits and vegetables
less than five times per day Source: Canadian Community Health Survey (2014)
34.8% 32.1%
11.2%19.6%
2.3%
No Risk Factors
1 Risk Factor
2 Risk Factors
3 Risk Factors
4 Risk Factors
0
20
40
60
80
100
PRE
VALE
NC
E
RA
TE (%
)
12 HOW HEALTHY ARE CANADIANS?
RISK CONDITIONS
Obesity
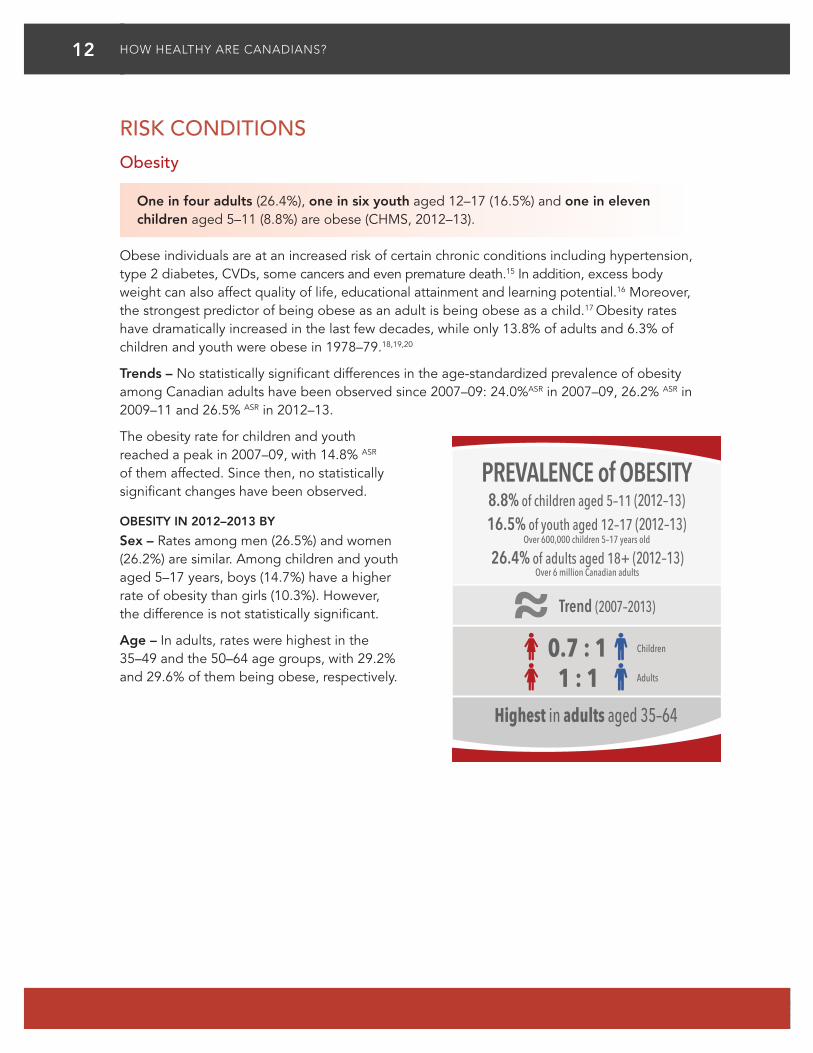
One in four adults (26.4%), one in six youth aged 12–17 (16.5%) and one in eleven children aged 5–11 (8.8%) are obese (CHMS, 2012–13).
Obese individuals are at an increased risk of certain chronic conditions including hypertension, type 2 diabetes, CVDs, some cancers and even premature death.15 In addition, excess body weight can also affect quality of life, educational attainment and learning potential.16 Moreover, the strongest predictor of being obese as an adult is being obese as a child.17 Obesity rates have dramatically increased in the last few decades, while only 13.8% of adults and 6.3% of children and youth were obese in 1978–79.18,19,20
Trends – No statistically significant differences in the age-standardized prevalence of obesity among Canadian adults have been observed since 2007–09: 24.0%ASR in 2007–09, 26.2% ASR in 2009–11 and 26.5% ASR in 2012–13.
The obesity rate for children and youth reached a peak in 2007–09, with 14.8% ASR of them affected. Since then, no statistically significant changes have been observed.
OBESITY IN 2012–2013 BY
Sex – Rates among men (26.5%) and women (26.2%) are similar. Among children and youth aged 5–17 years, boys (14.7%) have a higher rate of obesity than girls (10.3%). However, the difference is not statistically significant.
Age – In adults, rates were highest in the 35–49 and the 50–64 age groups, with 29.2% and 29.6% of them being obese, respectively.
PREVALENCE of OBESITY
Trend (2007–2013)
16.5% of youth aged 12–17 (2012–13)8.8% of children aged 5–11 (2012–13)
0.7 : 1
Over 600,000 children 5–17 years old
26.4% of adults aged 18+ (2012–13)Over 6 million Canadian adults
Children
Adults1 : 1Highest in adults aged 35–64
13HOW HEALTHY ARE CANADIANS?
Hypertension
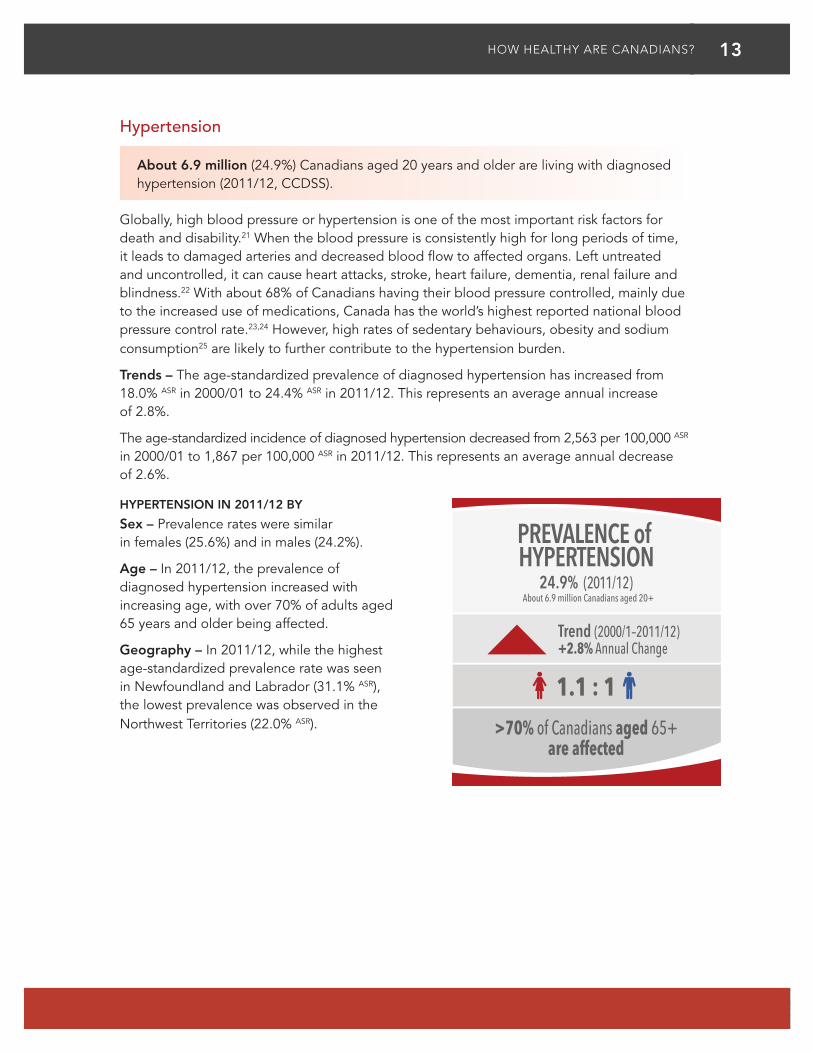
About 6.9 million (24.9%) Canadians aged 20 years and older are living with diagnosed hypertension (2011/12, CCDSS).
Globally, high blood pressure or hypertension is one of the most important risk factors for death and disability.21 When the blood pressure is consistently high for long periods of time, it leads to damaged arteries and decreased blood flow to affected organs. Left untreated and uncontrolled, it can cause heart attacks, stroke, heart failure, dementia, renal failure and blindness.22 With about 68% of Canadians having their blood pressure controlled, mainly due to the increased use of medications, Canada has the world’s highest reported national blood pressure control rate.23,24 However, high rates of sedentary behaviours, obesity and sodium consumption25 are likely to further contribute to the hypertension burden.
Trends – The age-standardized prevalence of diagnosed hypertension has increased from 18.0% ASR in 2000/01 to 24.4% ASR in 2011/12. This represents an average annual increase of 2.8%.
The age-standardized incidence of diagnosed hypertension decreased from 2,563 per 100,000 ASR in 2000/01 to 1,867 per 100,000 ASR in 2011/12. This represents an average annual decrease of 2.6%.
HYPERTENSION IN 2011/12 BY
Sex – Prevalence rates were similar in females (25.6%) and in males (24.2%).
Age – In 2011/12, the prevalence of diagnosed hypertension increased with increasing age, with over 70% of adults aged 65 years and older being affected.
Geography – In 2011/12, while the highest age-standardized prevalence rate was seen in Newfoundland and Labrador (31.1% ASR), the lowest prevalence was observed in the Northwest Territories (22.0% ASR).
PREVALENCE of HYPERTENSION
24.9% (2011/12)
1.1 : 1
About 6.9 million Canadians aged 20+
>70% of Canadians aged 65+are affected
Trend (2000/1–2011/12)+2.8% Annual Change

14 HOW HEALTHY ARE CANADIANS?
CHRONIC DISEASES
Cardiovascular Diseases
Ischemic heart disease (IHD)
About 2.3 million (8.4%) Canadians aged 20 years and older are living with diagnosed ischemic heart disease (2011/12, CCDSS).
In Canada, heart disease is the second leading cause of death,26 after cancer, and a leading cause of hospitalization.27 Ischemic heart disease is a chronic condition in which the heart muscle is damaged or works inefficiently because of the absence or relative deficiency of its blood supply. Moreover, IHD is the number one cause of years of life lost (YLLs) due to premature mortality and the second leading cause of disability-adjusted life years (DALYs) lost in 2013.28
Trends – Over time, the age-standardized prevalence of diagnosed IHD increased from 7.2% ASR in 2000/01 to 8.3% ASR in 2006/07, and has stayed stable since then, with a slight decrease in 2011/12 to 8.1% ASR. This represents an average annual increase of 1.0%.
The age-standardized incidence of diagnosed ischemic heart disease decreased from 1,244 per 100,000 ASR in 2000/01 to 709 per 100,000 ASR in 2011/12. This represents an average annual decrease of 5.1%.
IHD IN 2011/12 BY
Sex – 9.8% men over the age of 20 were living with a diagnosed IHD, while 7.1% women 20 years and older were living with the same condition.
Age – IHD prevalence increased with age, while males had higher rates than females in all age groups. Overall, more than a quarter of Canadians aged 65 years and older had been diagnosed with IHD.
Geography – In 2011/12, New Brunswick had the highest age-standardized prevalence rate of IHD (9.4% ASR) and Nunavut the lowest (4.6% ASR).
PREVALENCE of IHD
Trend (2000/1–2006/7)+1.0% Annual Change
2/3 of IHD cases are aged 65+
8.4% (2011/12)
0.7 : 1
About 2.3 million Canadians aged 20+
Trend (2006/7–2011/12)
15HOW HEALTHY ARE CANADIANS?
Stroke
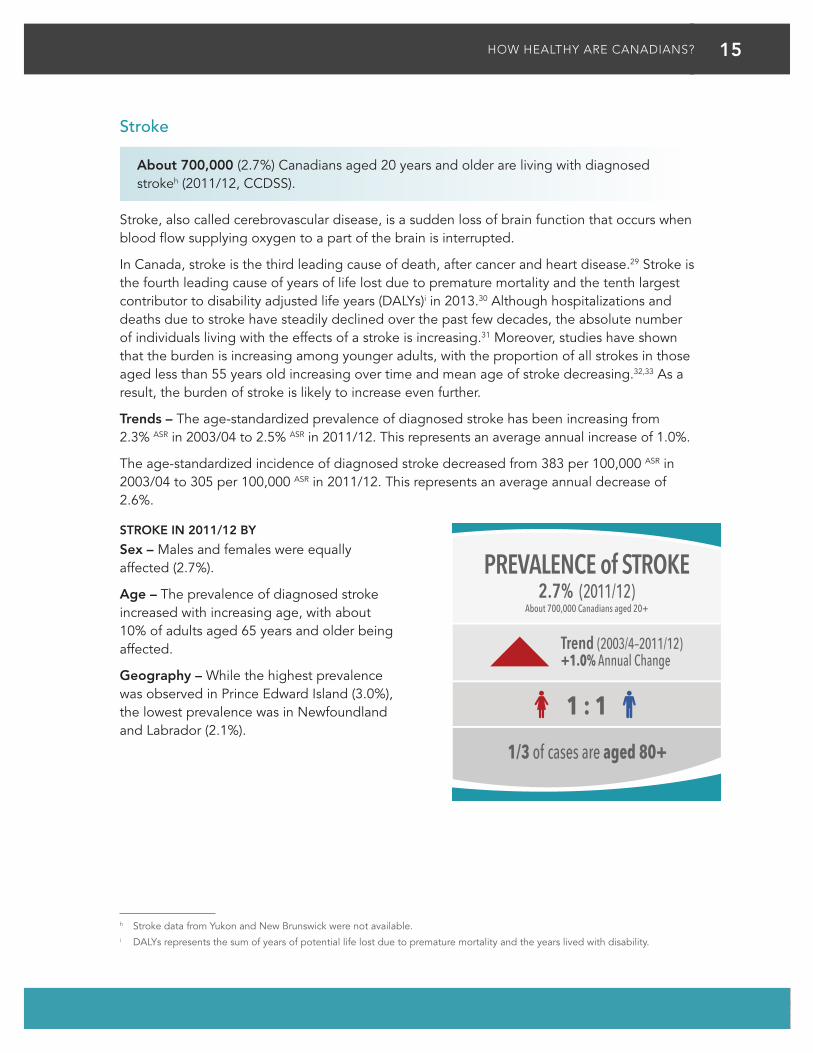
About 700,000 (2.7%) Canadians aged 20 years and older are living with diagnosed strokeh (2011/12, CCDSS).
Stroke, also called cerebrovascular disease, is a sudden loss of brain function that occurs when blood flow supplying oxygen to a part of the brain is interrupted.
In Canada, stroke is the third leading cause of death, after cancer and heart disease.29 Stroke is the fourth leading cause of years of life lost due to premature mortality and the tenth largest contributor to disability adjusted life years (DALYs)i in 2013.30 Although hospitalizations and deaths due to stroke have steadily declined over the past few decades, the absolute number of individuals living with the effects of a stroke is increasing.31 Moreover, studies have shown that the burden is increasing among younger adults, with the proportion of all strokes in those aged less than 55 years old increasing over time and mean age of stroke decreasing.32,33 As a result, the burden of stroke is likely to increase even further.
Trends – The age-standardized prevalence of diagnosed stroke has been increasing from 2.3% ASR in 2003/04 to 2.5% ASR in 2011/12. This represents an average annual increase of 1.0%.
The age-standardized incidence of diagnosed stroke decreased from 383 per 100,000 ASR in 2003/04 to 305 per 100,000 ASR in 2011/12. This represents an average annual decrease of 2.6%.
STROKE IN 2011/12 BY
Sex – Males and females were equally affected (2.7%).
Age – The prevalence of diagnosed stroke increased with increasing age, with about 10% of adults aged 65 years and older being affected.
Geography – While the highest prevalence was observed in Prince Edward Island (3.0%), the lowest prevalence was in Newfoundland and Labrador (2.1%).
h Stroke data from Yukon and New Brunswick were not available.i DALYs represents the sum of years of potential life lost due to premature mortality and the years lived with disability.
PREVALENCE of STROKE
Trend (2003/4–2011/12)+1.0% Annual Change
1/3 of cases are aged 80+
2.7% (2011/12)
1 : 1
About 700,000 Canadians aged 20+
16 HOW HEALTHY ARE CANADIANS?
Cancer
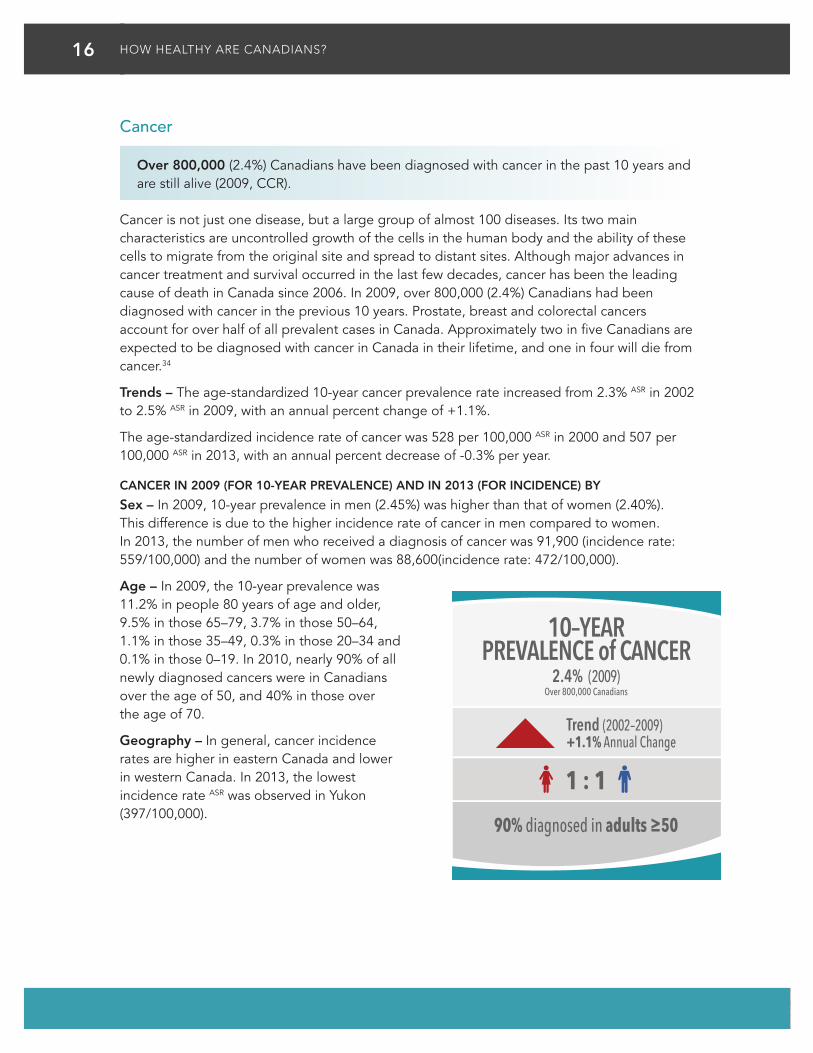
Over 800,000 (2.4%) Canadians have been diagnosed with cancer in the past 10 years and are still alive (2009, CCR).
Cancer is not just one disease, but a large group of almost 100 diseases. Its two main characteristics are uncontrolled growth of the cells in the human body and the ability of these cells to migrate from the original site and spread to distant sites. Although major advances in cancer treatment and survival occurred in the last few decades, cancer has been the leading cause of death in Canada since 2006. In 2009, over 800,000 (2.4%) Canadians had been diagnosed with cancer in the previous 10 years. Prostate, breast and colorectal cancers account for over half of all prevalent cases in Canada. Approximately two in five Canadians are expected to be diagnosed with cancer in Canada in their lifetime, and one in four will die from cancer.34
Trends – The age-standardized 10-year cancer prevalence rate increased from 2.3% ASR in 2002 to 2.5% ASR in 2009, with an annual percent change of +1.1%.
The age-standardized incidence rate of cancer was 528 per 100,000 ASR in 2000 and 507 per 100,000 ASR in 2013, with an annual percent decrease of -0.3% per year.
CANCER IN 2009 (FOR 10-YEAR PREVALENCE) AND IN 2013 (FOR INCIDENCE) BY
Sex – In 2009, 10-year prevalence in men (2.45%) was higher than that of women (2.40%). This difference is due to the higher incidence rate of cancer in men compared to women. In 2013, the number of men who received a diagnosis of cancer was 91,900 (incidence rate: 559/100,000) and the number of women was 88,600(incidence rate: 472/100,000).
Age – In 2009, the 10-year prevalence was 11.2% in people 80 years of age and older, 9.5% in those 65–79, 3.7% in those 50–64, 1.1% in those 35–49, 0.3% in those 20–34 and 0.1% in those 0–19. In 2010, nearly 90% of all newly diagnosed cancers were in Canadians over the age of 50, and 40% in those over the age of 70.
Geography – In general, cancer incidence rates are higher in eastern Canada and lower in western Canada. In 2013, the lowest incidence rate ASR was observed in Yukon (397/100,000).
10–YEARPREVALENCE of CANCER
2.4% (2009)
1 : 1
Over 800,000 Canadians
90% diagnosed in adults ≥50
Trend (2002–2009)+1.1% Annual Change
17HOW HEALTHY ARE CANADIANS?
Chronic respiratory diseases
Chronic obstructive pulmonary disease (COPD)
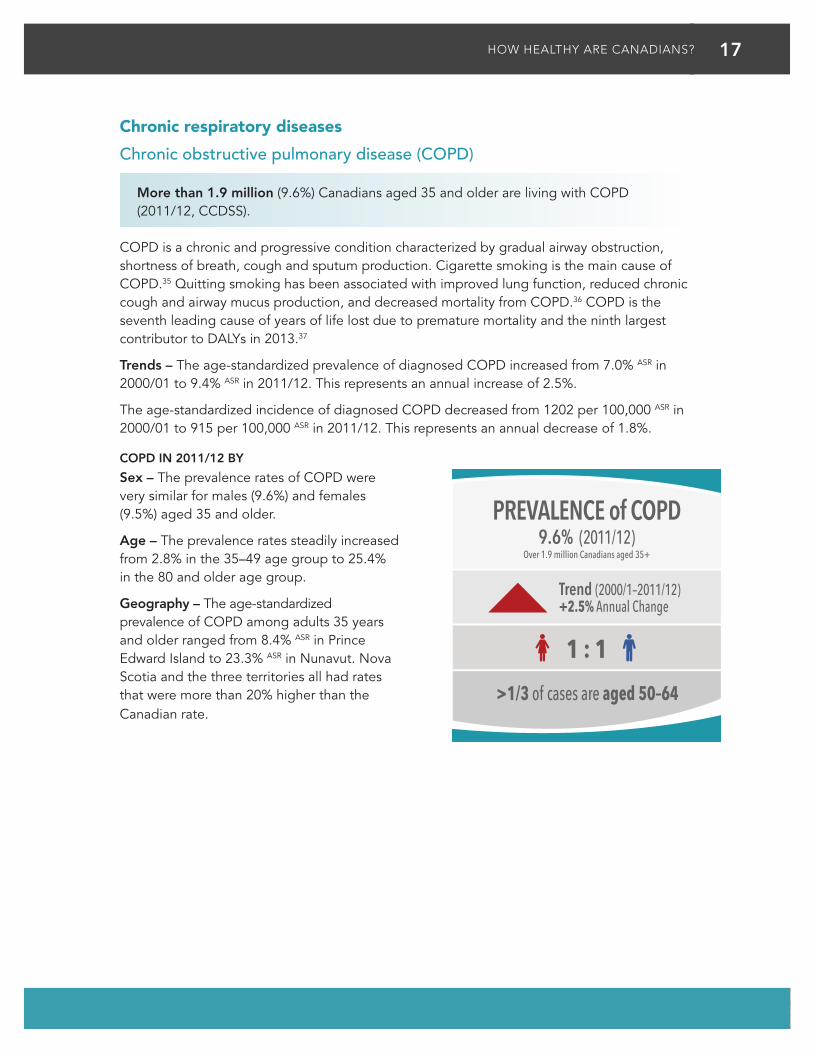
More than 1.9 million (9.6%) Canadians aged 35 and older are living with COPD (2011/12, CCDSS).
COPD is a chronic and progressive condition characterized by gradual airway obstruction, shortness of breath, cough and sputum production. Cigarette smoking is the main cause of COPD.35 Quitting smoking has been associated with improved lung function, reduced chronic cough and airway mucus production, and decreased mortality from COPD.36 COPD is the seventh leading cause of years of life lost due to premature mortality and the ninth largest contributor to DALYs in 2013.37
Trends – The age-standardized prevalence of diagnosed COPD increased from 7.0% ASR in 2000/01 to 9.4% ASR in 2011/12. This represents an annual increase of 2.5%.
The age-standardized incidence of diagnosed COPD decreased from 1202 per 100,000 ASR in 2000/01 to 915 per 100,000 ASR in 2011/12. This represents an annual decrease of 1.8%.
COPD IN 2011/12 BY
Sex – The prevalence rates of COPD were very similar for males (9.6%) and females (9.5%) aged 35 and older.
Age – The prevalence rates steadily increased from 2.8% in the 35–49 age group to 25.4% in the 80 and older age group.
Geography – The age-standardized prevalence of COPD among adults 35 years and older ranged from 8.4% ASR in Prince Edward Island to 23.3% ASR in Nunavut. Nova Scotia and the three territories all had rates that were more than 20% higher than the Canadian rate.
PREVALENCE of COPD
Trend (2000/1–2011/12)+2.5% Annual Change
>1/3 of cases are aged 50–64
9.6% (2011/12)
1 : 1
Over 1.9 million Canadians aged 35+
18 HOW HEALTHY ARE CANADIANS?
Asthma
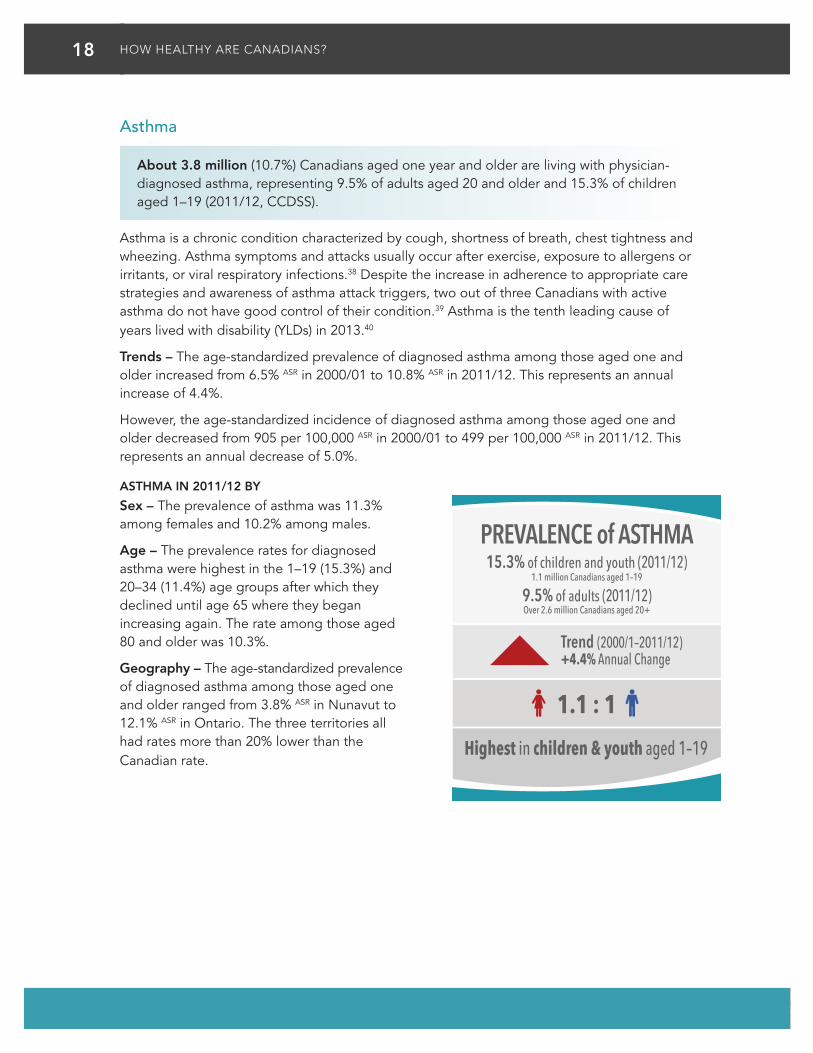
About 3.8 million (10.7%) Canadians aged one year and older are living with physician-diagnosed asthma, representing 9.5% of adults aged 20 and older and 15.3% of children aged 1–19 (2011/12, CCDSS).
Asthma is a chronic condition characterized by cough, shortness of breath, chest tightness and wheezing. Asthma symptoms and attacks usually occur after exercise, exposure to allergens or irritants, or viral respiratory infections.38 Despite the increase in adherence to appropriate care strategies and awareness of asthma attack triggers, two out of three Canadians with active asthma do not have good control of their condition.39 Asthma is the tenth leading cause of years lived with disability (YLDs) in 2013.40
Trends – The age-standardized prevalence of diagnosed asthma among those aged one and older increased from 6.5% ASR in 2000/01 to 10.8% ASR in 2011/12. This represents an annual increase of 4.4%.
However, the age-standardized incidence of diagnosed asthma among those aged one and older decreased from 905 per 100,000 ASR in 2000/01 to 499 per 100,000 ASR in 2011/12. This represents an annual decrease of 5.0%.
ASTHMA IN 2011/12 BY
Sex – The prevalence of asthma was 11.3% among females and 10.2% among males.
Age – The prevalence rates for diagnosed asthma were highest in the 1–19 (15.3%) and 20–34 (11.4%) age groups after which they declined until age 65 where they began increasing again. The rate among those aged 80 and older was 10.3%.
Geography – The age-standardized prevalence of diagnosed asthma among those aged one and older ranged from 3.8% ASR in Nunavut to 12.1% ASR in Ontario. The three territories all had rates more than 20% lower than the Canadian rate.
PREVALENCE of ASTHMA15.3% of children and youth (2011/12)
1.1 : 1
1.1 million Canadians aged 1–19
9.5% of adults (2011/12)Over 2.6 million Canadians aged 20+
Highest in children & youth aged 1–19
Trend (2000/1–2011/12)+4.4% Annual Change
19HOW HEALTHY ARE CANADIANS?
Diabetes
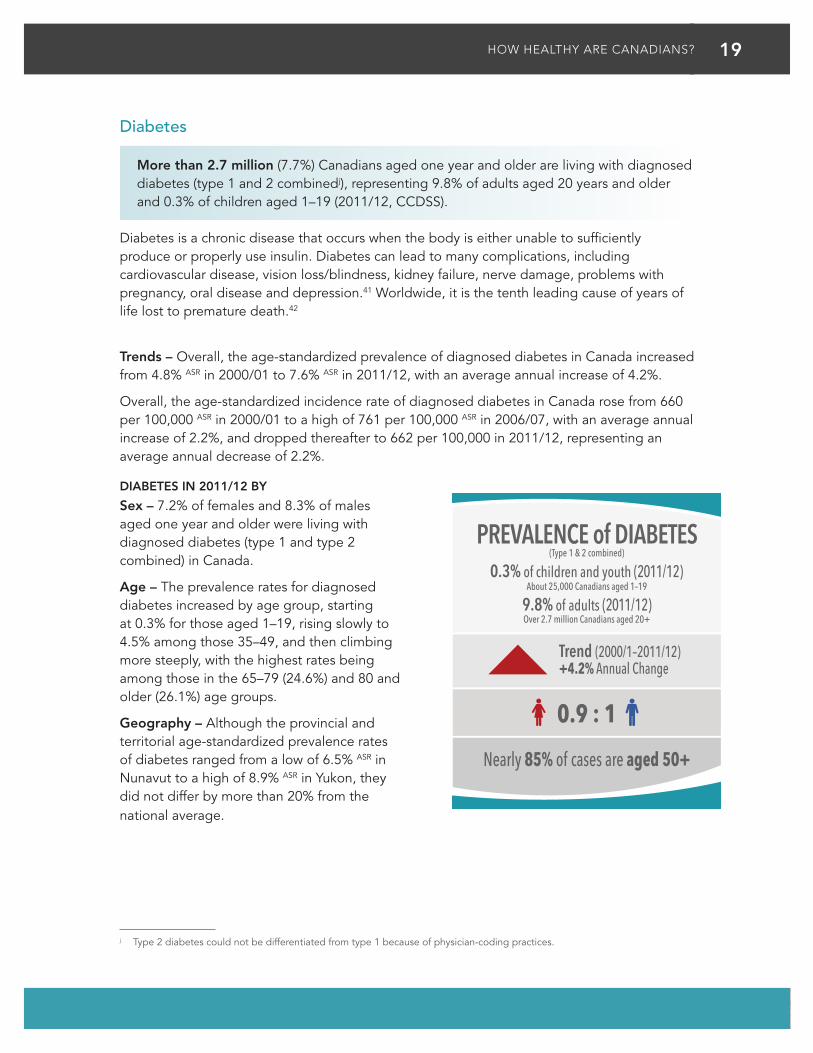
More than 2.7 million (7.7%) Canadians aged one year and older are living with diagnosed diabetes (type 1 and 2 combinedj), representing 9.8% of adults aged 20 years and older and 0.3% of children aged 1–19 (2011/12, CCDSS).
Diabetes is a chronic disease that occurs when the body is either unable to sufficiently produce or properly use insulin. Diabetes can lead to many complications, including cardiovascular disease, vision loss/blindness, kidney failure, nerve damage, problems with pregnancy, oral disease and depression.41 Worldwide, it is the tenth leading cause of years of life lost to premature death.42
Trends – Overall, the age-standardized prevalence of diagnosed diabetes in Canada increased from 4.8% ASR in 2000/01 to 7.6% ASR in 2011/12, with an average annual increase of 4.2%.
Overall, the age-standardized incidence rate of diagnosed diabetes in Canada rose from 660 per 100,000 ASR in 2000/01 to a high of 761 per 100,000 ASR in 2006/07, with an average annual increase of 2.2%, and dropped thereafter to 662 per 100,000 in 2011/12, representing an average annual decrease of 2.2%.
DIABETES IN 2011/12 BY
Sex – 7.2% of females and 8.3% of males aged one year and older were living with diagnosed diabetes (type 1 and type 2 combined) in Canada.
Age – The prevalence rates for diagnosed diabetes increased by age group, starting at 0.3% for those aged 1–19, rising slowly to 4.5% among those 35–49, and then climbing more steeply, with the highest rates being among those in the 65–79 (24.6%) and 80 and older (26.1%) age groups.
Geography – Although the provincial and territorial age-standardized prevalence rates of diabetes ranged from a low of 6.5% ASR in Nunavut to a high of 8.9% ASR in Yukon, they did not differ by more than 20% from the national average.
j Type 2 diabetes could not be differentiated from type 1 because of physician-coding practices.
PREVALENCE of DIABETES0.3% of children and youth (2011/12)
0.9 : 1
About 25,000 Canadians aged 1–19
(Type 1 & 2 combined)
9.8% of adults (2011/12)Over 2.7 million Canadians aged 20+
Nearly 85% of cases are aged 50+
Trend (2000/1–2011/12)+4.2% Annual Change
20 HOW HEALTHY ARE CANADIANS?
Mood and anxiety disorders (health services use)
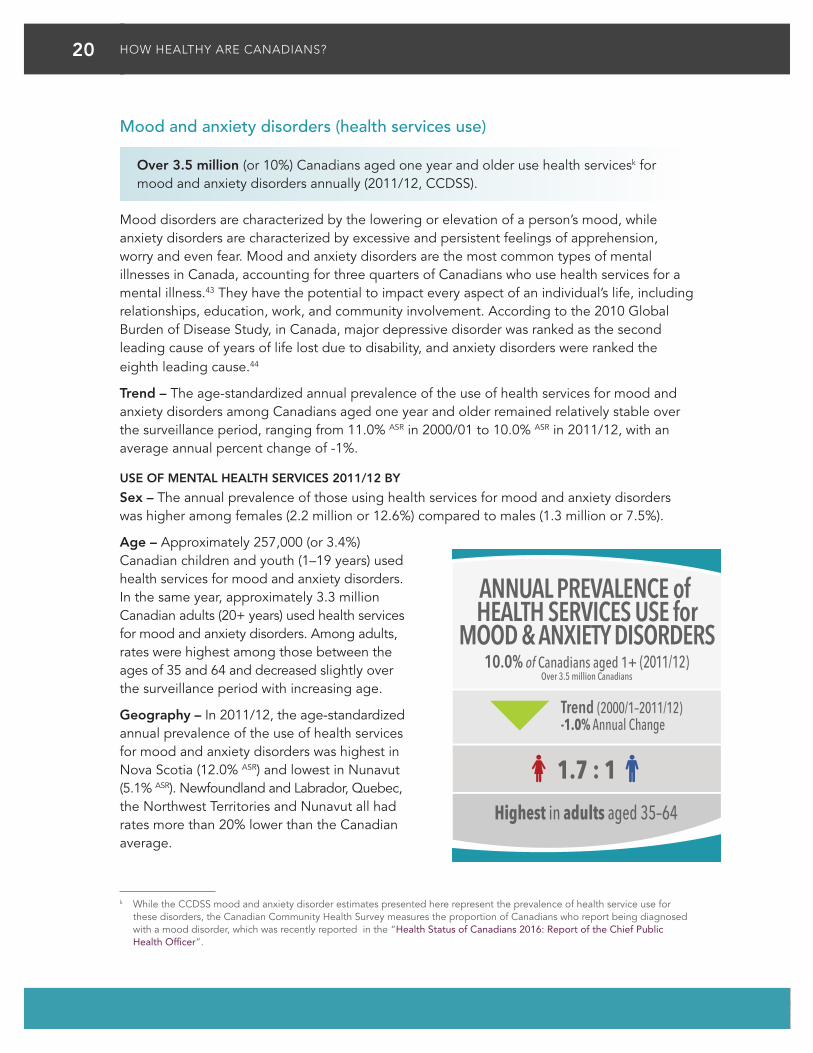
Over 3.5 million (or 10%) Canadians aged one year and older use health servicesk for mood and anxiety disorders annually (2011/12, CCDSS).
Mood disorders are characterized by the lowering or elevation of a person’s mood, while anxiety disorders are characterized by excessive and persistent feelings of apprehension, worry and even fear. Mood and anxiety disorders are the most common types of mental illnesses in Canada, accounting for three quarters of Canadians who use health services for a mental illness.43 They have the potential to impact every aspect of an individual’s life, including relationships, education, work, and community involvement. According to the 2010 Global Burden of Disease Study, in Canada, major depressive disorder was ranked as the second leading cause of years of life lost due to disability, and anxiety disorders were ranked the eighth leading cause.44
Trend – The age-standardized annual prevalence of the use of health services for mood and anxiety disorders among Canadians aged one year and older remained relatively stable over the surveillance period, ranging from 11.0% ASR in 2000/01 to 10.0% ASR in 2011/12, with an average annual percent change of -1%.
USE OF MENTAL HEALTH SERVICES 2011/12 BY
Sex – The annual prevalence of those using health services for mood and anxiety disorders was higher among females (2.2 million or 12.6%) compared to males (1.3 million or 7.5%).
Age – Approximately 257,000 (or 3.4%) Canadian children and youth (1–19 years) used health services for mood and anxiety disorders. In the same year, approximately 3.3 million Canadian adults (20+ years) used health services for mood and anxiety disorders. Among adults, rates were highest among those between the ages of 35 and 64 and decreased slightly over the surveillance period with increasing age.
Geography – In 2011/12, the age-standardized annual prevalence of the use of health services for mood and anxiety disorders was highest in Nova Scotia (12.0% ASR) and lowest in Nunavut (5.1% ASR). Newfoundland and Labrador, Quebec, the Northwest Territories and Nunavut all had rates more than 20% lower than the Canadian average.
k While the CCDSS mood and anxiety disorder estimates presented here represent the prevalence of health service use for these disorders, the Canadian Community Health Survey measures the proportion of Canadians who report being diagnosed with a mood disorder, which was recently reported in the “Health Status of Canadians 2016: Report of the Chief Public Health Officer”.
ANNUAL PREVALENCE of HEALTH SERVICES USE for
MOOD & ANXIETY DISORDERS
1.7 : 1
10.0% of Canadians aged 1+ (2011/12)Over 3.5 million Canadians
Trend (2000/1–2011/12)-1.0% Annual Change
Highest in adults aged 35–64
21HOW HEALTHY ARE CANADIANS?
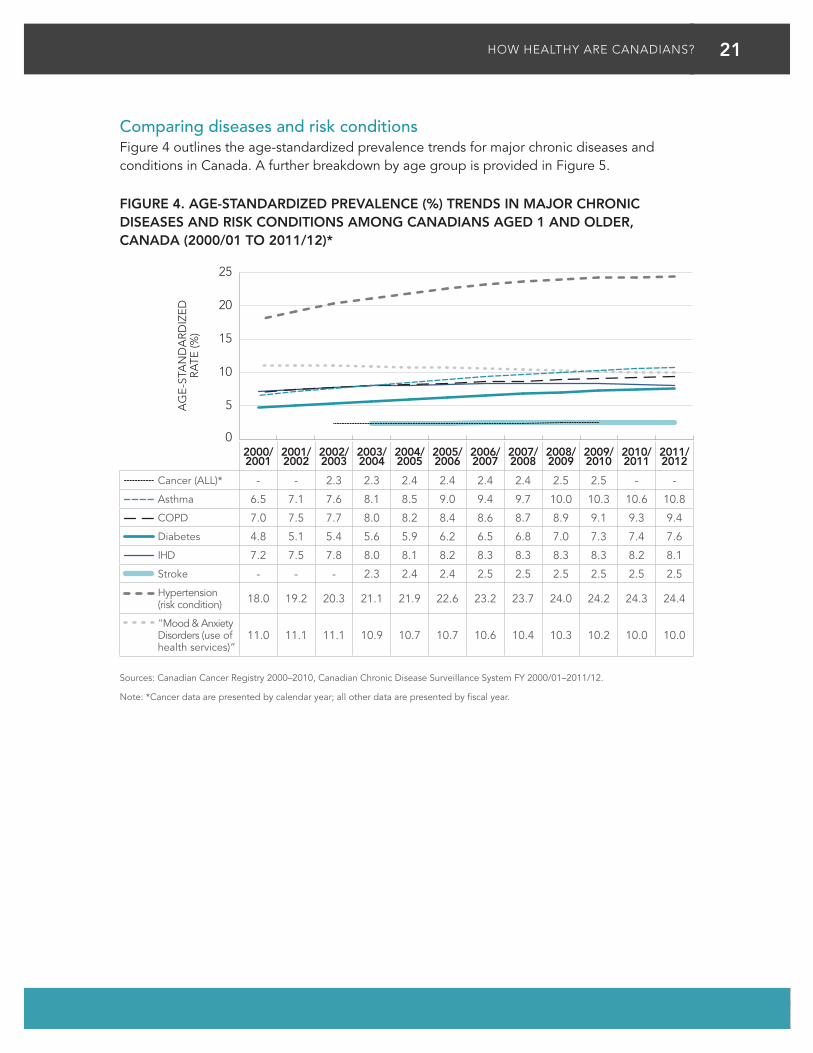
Comparing diseases and risk conditionsFigure 4 outlines the age-standardized prevalence trends for major chronic diseases and conditions in Canada. A further breakdown by age group is provided in Figure 5.
FIGURE 4. AGE-STANDARDIZED PREVALENCE (%) TRENDS IN MAJOR CHRONIC DISEASES AND RISK CONDITIONS AMONG CANADIANS AGED 1 AND OLDER, CANADA (2000/01 TO 2011/12)*
2000/ 2001
2001/ 2002
2002/ 2003
2003/ 2004
2004/ 2005
2005/ 2006
2006/ 2007
2007/ 2008
2008/ 2009
2009/ 2010
2010/ 2011
2011/ 2012
Cancer (ALL)* - - 2.3 2.3 2.4 2.4 2.4 2.4 2.5 2.5 - -
Asthma 6.5 7.1 7.6 8.1 8.5 9.0 9.4 9.7 10.0 10.3 10.6 10.8
COPD 7.0 7.5 7.7 8.0 8.2 8.4 8.6 8.7 8.9 9.1 9.3 9.4
Diabetes 4.8 5.1 5.4 5.6 5.9 6.2 6.5 6.8 7.0 7.3 7.4 7.6
IHD 7.2 7.5 7.8 8.0 8.1 8.2 8.3 8.3 8.3 8.3 8.2 8.1
Stroke - - - 2.3 2.4 2.4 2.5 2.5 2.5 2.5 2.5 2.5
Hypertension (risk condition) 18.0 19.2 20.3 21.1 21.9 22.6 23.2 23.7 24.0 24.2 24.3 24.4
"Mood & Anxiety Disorders (use of health services)”
11.0 11.1 11.1 10.9 10.7 10.7 10.6 10.4 10.3 10.2 10.0 10.0
Sources: Canadian Cancer Registry 2000–2010, Canadian Chronic Disease Surveillance System FY 2000/01–2011/12.
Note: *Cancer data are presented by calendar year; all other data are presented by fiscal year.
0
5
10
15
20
25
AG
E-S
TAN
DA
RD
IZE
D
RA
TE (%
)
22 HOW HEALTHY ARE CANADIANS?
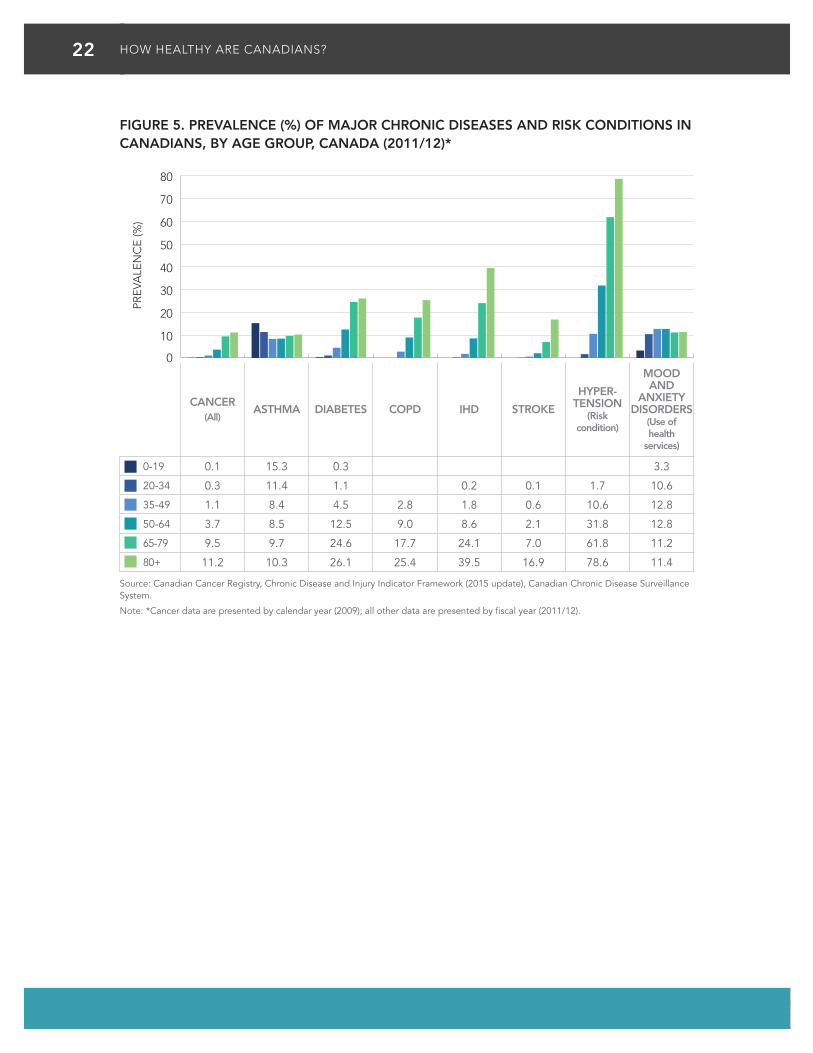
FIGURE 5. PREVALENCE (%) OF MAJOR CHRONIC DISEASES AND RISK CONDITIONS IN CANADIANS, BY AGE GROUP, CANADA (2011/12)*
CANCER (All)
ASTHMA DIABETES COPD IHD STROKE
HYPER- TENSION
(Risk condition)
MOOD AND
ANXIETY DISORDERS
(Use of health
services)
0-19 0.1 15.3 0.3 3.3
20-34 0.3 11.4 1.1 0.2 0.1 1.7 10.6
35-49 1.1 8.4 4.5 2.8 1.8 0.6 10.6 12.8
50-64 3.7 8.5 12.5 9.0 8.6 2.1 31.8 12.8
65-79 9.5 9.7 24.6 17.7 24.1 7.0 61.8 11.2
80+ 11.2 10.3 26.1 25.4 39.5 16.9 78.6 11.4
Source: Canadian Cancer Registry, Chronic Disease and Injury Indicator Framework (2015 update), Canadian Chronic Disease Surveillance System.
Note: *Cancer data are presented by calendar year (2009); all other data are presented by fiscal year (2011/12).
0
10
20
30
40
50
60
70
80
PRE
VALE
NC
E (%
)
23HOW HEALTHY ARE CANADIANS?
CHRONIC DISEASE MULTI-MORBIDITY
Multi-morbidityl
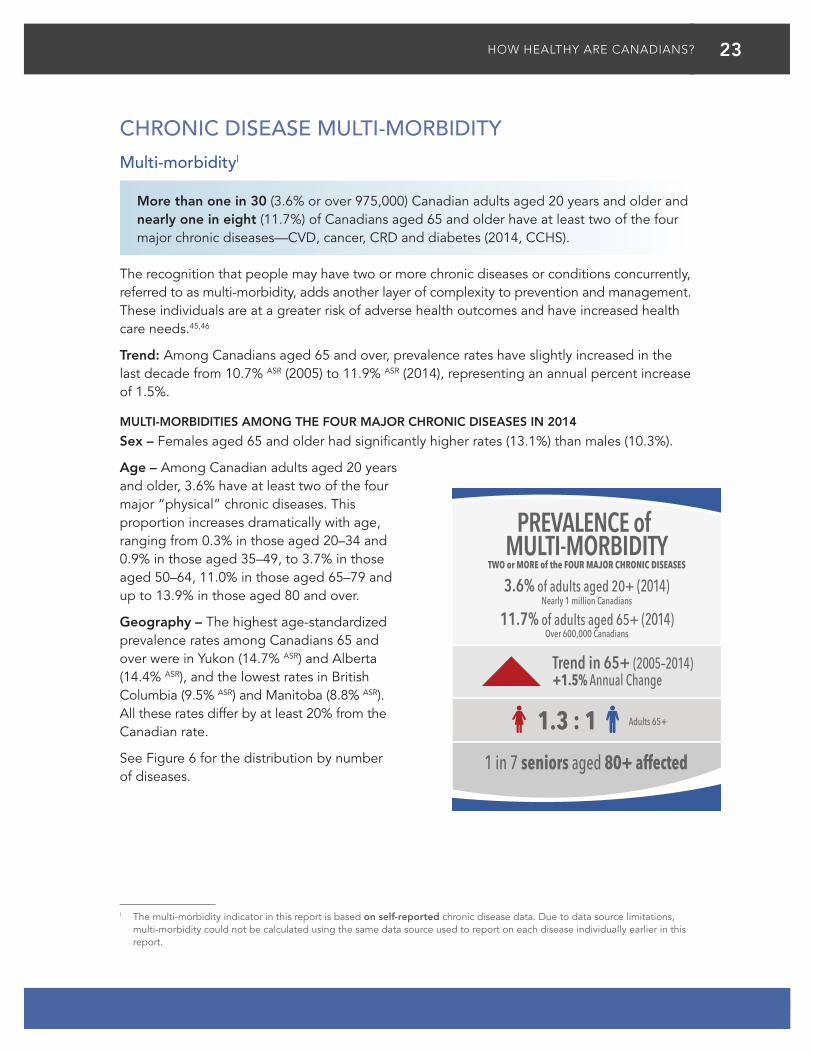
More than one in 30 (3.6% or over 975,000) Canadian adults aged 20 years and older and nearly one in eight (11.7%) of Canadians aged 65 and older have at least two of the four major chronic diseases—CVD, cancer, CRD and diabetes (2014, CCHS).
The recognition that people may have two or more chronic diseases or conditions concurrently, referred to as multi-morbidity, adds another layer of complexity to prevention and management. These individuals are at a greater risk of adverse health outcomes and have increased health care needs.45,46
Trend: Among Canadians aged 65 and over, prevalence rates have slightly increased in the last decade from 10.7% ASR (2005) to 11.9% ASR (2014), representing an annual percent increase of 1.5%.
MULTI-MORBIDITIES AMONG THE FOUR MAJOR CHRONIC DISEASES IN 2014
Sex – Females aged 65 and older had significantly higher rates (13.1%) than males (10.3%).
Age – Among Canadian adults aged 20 years and older, 3.6% have at least two of the four major “physical” chronic diseases. This proportion increases dramatically with age, ranging from 0.3% in those aged 20–34 and 0.9% in those aged 35–49, to 3.7% in those aged 50–64, 11.0% in those aged 65–79 and up to 13.9% in those aged 80 and over.
Geography – The highest age-standardized prevalence rates among Canadians 65 and over were in Yukon (14.7% ASR) and Alberta (14.4% ASR), and the lowest rates in British Columbia (9.5% ASR) and Manitoba (8.8% ASR). All these rates differ by at least 20% from the Canadian rate.
See Figure 6 for the distribution by number of diseases.
l The multi-morbidity indicator in this report is based on self-reported chronic disease data. Due to data source limitations, multi-morbidity could not be calculated using the same data source used to report on each disease individually earlier in this report.
PREVALENCE of MULTI-MORBIDITY3.6% of adults aged 20+ (2014)
1.3 : 1
Nearly 1 million Canadians
TWO or MORE of the FOUR MAJOR CHRONIC DISEASES
11.7% of adults aged 65+ (2014)Over 600,000 Canadians
1 in 7 seniors aged 80+ affected
Trend in 65+ (2005–2014)+1.5% Annual Change
Adults 65+
24 HOW HEALTHY ARE CANADIANS?
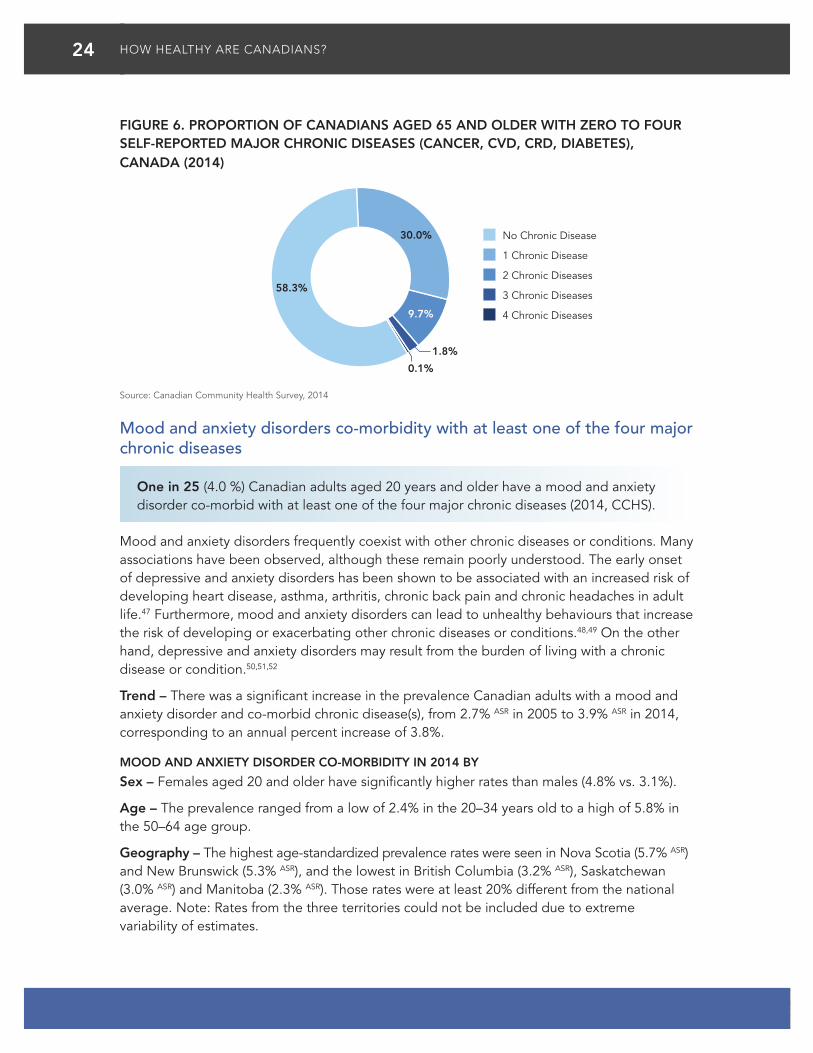
FIGURE 6. PROPORTION OF CANADIANS AGED 65 AND OLDER WITH ZERO TO FOUR SELF-REPORTED MAJOR CHRONIC DISEASES (CANCER, CVD, CRD, DIABETES), CANADA (2014)
Source: Canadian Community Health Survey, 2014
Mood and anxiety disorders co-morbidity with at least one of the four major chronic diseases
One in 25 (4.0 %) Canadian adults aged 20 years and older have a mood and anxiety disorder co-morbid with at least one of the four major chronic diseases (2014, CCHS).
Mood and anxiety disorders frequently coexist with other chronic diseases or conditions. Many associations have been observed, although these remain poorly understood. The early onset of depressive and anxiety disorders has been shown to be associated with an increased risk of developing heart disease, asthma, arthritis, chronic back pain and chronic headaches in adult life.47 Furthermore, mood and anxiety disorders can lead to unhealthy behaviours that increase the risk of developing or exacerbating other chronic diseases or conditions.48,49 On the other hand, depressive and anxiety disorders may result from the burden of living with a chronic disease or condition.50,51,52
Trend – There was a significant increase in the prevalence Canadian adults with a mood and anxiety disorder and co-morbid chronic disease(s), from 2.7% ASR in 2005 to 3.9% ASR in 2014, corresponding to an annual percent increase of 3.8%.
MOOD AND ANXIETY DISORDER CO-MORBIDITY IN 2014 BY
Sex – Females aged 20 and older have significantly higher rates than males (4.8% vs. 3.1%).
Age – The prevalence ranged from a low of 2.4% in the 20–34 years old to a high of 5.8% in the 50–64 age group.
Geography – The highest age-standardized prevalence rates were seen in Nova Scotia (5.7% ASR) and New Brunswick (5.3% ASR), and the lowest in British Columbia (3.2% ASR), Saskatchewan (3.0% ASR) and Manitoba (2.3% ASR). Those rates were at least 20% different from the national average. Note: Rates from the three territories could not be included due to extreme variability of estimates.
58.3%
30.0%
9.7%
0.1%
1.8%
No Chronic Disease
1 Chronic Disease
2 Chronic Diseases
3 Chronic Diseases
4 Chronic Diseases
25HOW HEALTHY ARE CANADIANS?
OTHER HEALTH INDICATORS
Influenza immunization
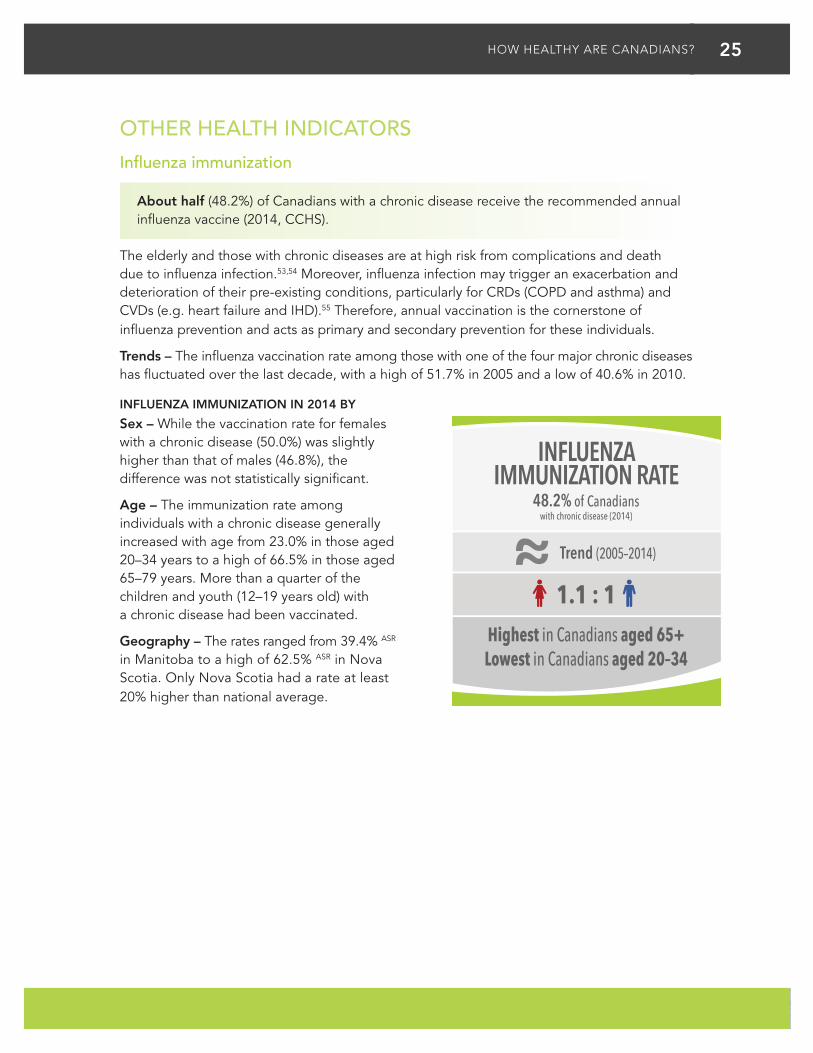
About half (48.2%) of Canadians with a chronic disease receive the recommended annual influenza vaccine (2014, CCHS).
The elderly and those with chronic diseases are at high risk from complications and death due to influenza infection.53,54 Moreover, influenza infection may trigger an exacerbation and deterioration of their pre-existing conditions, particularly for CRDs (COPD and asthma) and CVDs (e.g. heart failure and IHD).55 Therefore, annual vaccination is the cornerstone of influenza prevention and acts as primary and secondary prevention for these individuals.
Trends – The influenza vaccination rate among those with one of the four major chronic diseases has fluctuated over the last decade, with a high of 51.7% in 2005 and a low of 40.6% in 2010.
INFLUENZA IMMUNIZATION IN 2014 BY
Sex – While the vaccination rate for females with a chronic disease (50.0%) was slightly higher than that of males (46.8%), the difference was not statistically significant.
Age – The immunization rate among individuals with a chronic disease generally increased with age from 23.0% in those aged 20–34 years to a high of 66.5% in those aged 65–79 years. More than a quarter of the children and youth (12–19 years old) with a chronic disease had been vaccinated.
Geography – The rates ranged from 39.4% ASR in Manitoba to a high of 62.5% ASR in Nova Scotia. Only Nova Scotia had a rate at least 20% higher than national average.
INFLUENZAIMMUNIZATION RATE
Trend (2005–2014)
48.2% of Canadians
1.1 : 1
with chronic disease (2014)
Highest in Canadians aged 65+Lowest in Canadians aged 20–34
26 HOW HEALTHY ARE CANADIANS?
Neonatal and infant mortality
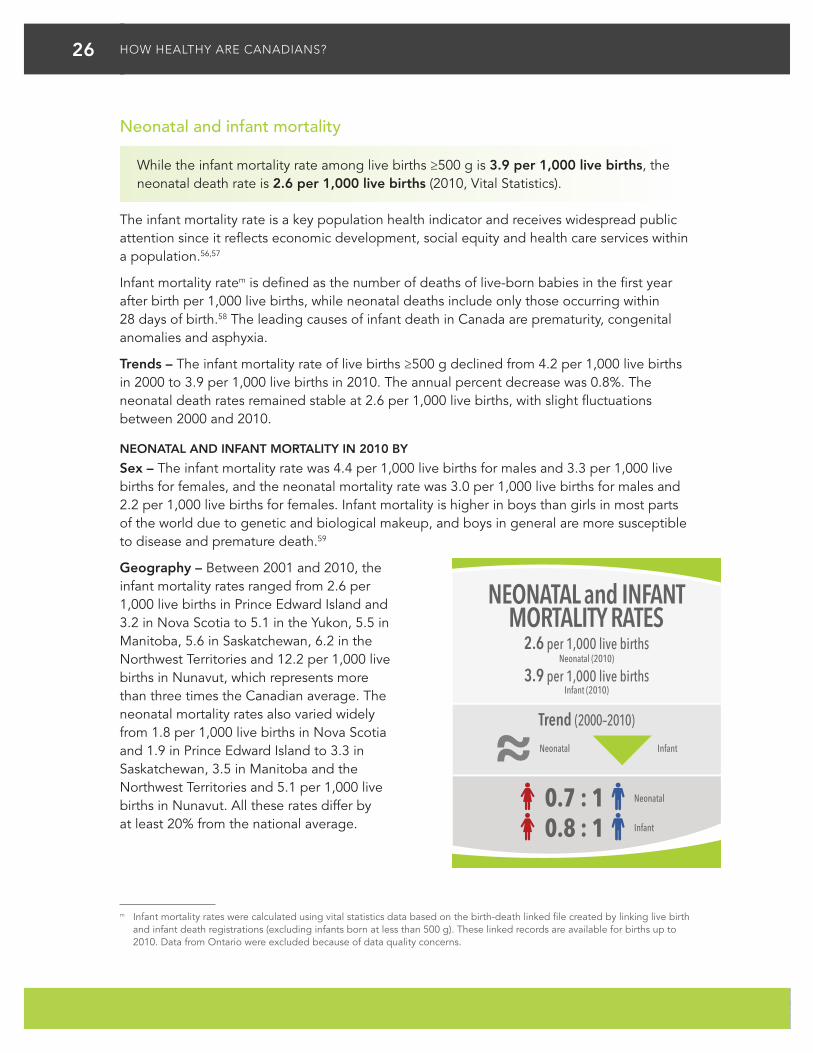
While the infant mortality rate among live births ≥500 g is 3.9 per 1,000 live births, the neonatal death rate is 2.6 per 1,000 live births (2010, Vital Statistics).
The infant mortality rate is a key population health indicator and receives widespread public attention since it reflects economic development, social equity and health care services within a population.56,57
Infant mortality ratem is defined as the number of deaths of live-born babies in the first year after birth per 1,000 live births, while neonatal deaths include only those occurring within 28 days of birth.58 The leading causes of infant death in Canada are prematurity, congenital anomalies and asphyxia.
Trends – The infant mortality rate of live births ≥500 g declined from 4.2 per 1,000 live births in 2000 to 3.9 per 1,000 live births in 2010. The annual percent decrease was 0.8%. The neonatal death rates remained stable at 2.6 per 1,000 live births, with slight fluctuations between 2000 and 2010.
NEONATAL AND INFANT MORTALITY IN 2010 BY
Sex – The infant mortality rate was 4.4 per 1,000 live births for males and 3.3 per 1,000 live births for females, and the neonatal mortality rate was 3.0 per 1,000 live births for males and 2.2 per 1,000 live births for females. Infant mortality is higher in boys than girls in most parts of the world due to genetic and biological makeup, and boys in general are more susceptible to disease and premature death.59
Geography – Between 2001 and 2010, the infant mortality rates ranged from 2.6 per 1,000 live births in Prince Edward Island and 3.2 in Nova Scotia to 5.1 in the Yukon, 5.5 in Manitoba, 5.6 in Saskatchewan, 6.2 in the Northwest Territories and 12.2 per 1,000 live births in Nunavut, which represents more than three times the Canadian average. The neonatal mortality rates also varied widely from 1.8 per 1,000 live births in Nova Scotia and 1.9 in Prince Edward Island to 3.3 in Saskatchewan, 3.5 in Manitoba and the Northwest Territories and 5.1 per 1,000 live births in Nunavut. All these rates differ by at least 20% from the national average.
m Infant mortality rates were calculated using vital statistics data based on the birth-death linked file created by linking live birth and infant death registrations (excluding infants born at less than 500 g). These linked records are available for births up to 2010. Data from Ontario were excluded because of data quality concerns.
NEONATAL and INFANTMORTALITY RATES
Trend (2000–2010)
2.6 per 1,000 live births
0.7 : 1
Neonatal (2010)
3.9 per 1,000 live birthsInfant (2010)
Neonatal
Infant0.8 : 1
Neonatal Infant
27HOW HEALTHY ARE CANADIANS?
Premature mortality
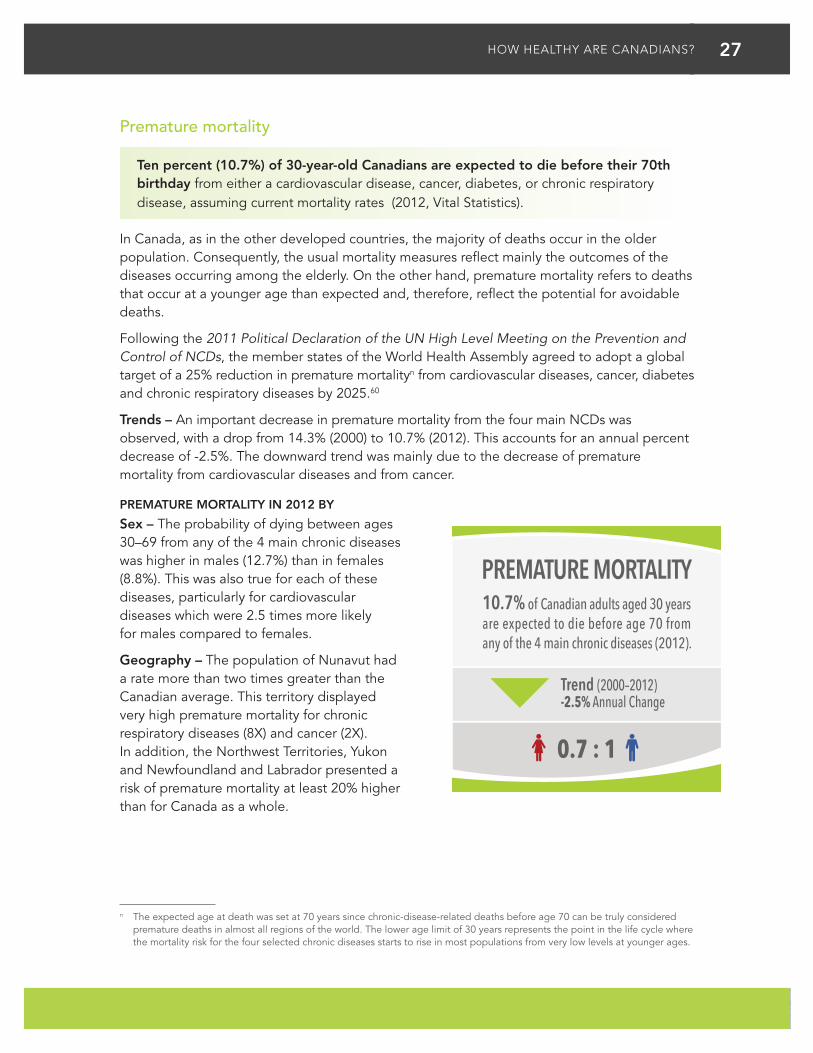
Ten percent (10.7%) of 30-year-old Canadians are expected to die before their 70th birthday from either a cardiovascular disease, cancer, diabetes, or chronic respiratory disease, assuming current mortality rates (2012, Vital Statistics).
In Canada, as in the other developed countries, the majority of deaths occur in the older population. Consequently, the usual mortality measures reflect mainly the outcomes of the diseases occurring among the elderly. On the other hand, premature mortality refers to deaths that occur at a younger age than expected and, therefore, reflect the potential for avoidable deaths.
Following the 2011 Political Declaration of the UN High Level Meeting on the Prevention and Control of NCDs, the member states of the World Health Assembly agreed to adopt a global target of a 25% reduction in premature mortalityn from cardiovascular diseases, cancer, diabetes and chronic respiratory diseases by 2025.60
Trends – An important decrease in premature mortality from the four main NCDs was observed, with a drop from 14.3% (2000) to 10.7% (2012). This accounts for an annual percent decrease of -2.5%. The downward trend was mainly due to the decrease of premature mortality from cardiovascular diseases and from cancer.
PREMATURE MORTALITY IN 2012 BY
Sex – The probability of dying between ages 30–69 from any of the 4 main chronic diseases was higher in males (12.7%) than in females (8.8%). This was also true for each of these diseases, particularly for cardiovascular diseases which were 2.5 times more likely for males compared to females.
Geography – The population of Nunavut had a rate more than two times greater than the Canadian average. This territory displayed very high premature mortality for chronic respiratory diseases (8X) and cancer (2X). In addition, the Northwest Territories, Yukon and Newfoundland and Labrador presented a risk of premature mortality at least 20% higher than for Canada as a whole.
n The expected age at death was set at 70 years since chronic-disease-related deaths before age 70 can be truly considered premature deaths in almost all regions of the world. The lower age limit of 30 years represents the point in the life cycle where the mortality risk for the four selected chronic diseases starts to rise in most populations from very low levels at younger ages.
PREMATURE MORTALITY
0.7 : 1
10.7% of Canadian adults aged 30 years are expected to die before age 70 from any of the 4 main chronic diseases (2012).
Trend (2000–2012)-2.5% Annual Change
28 HOW HEALTHY ARE CANADIANS?
Life expectancy and health-adjusted life expectancy
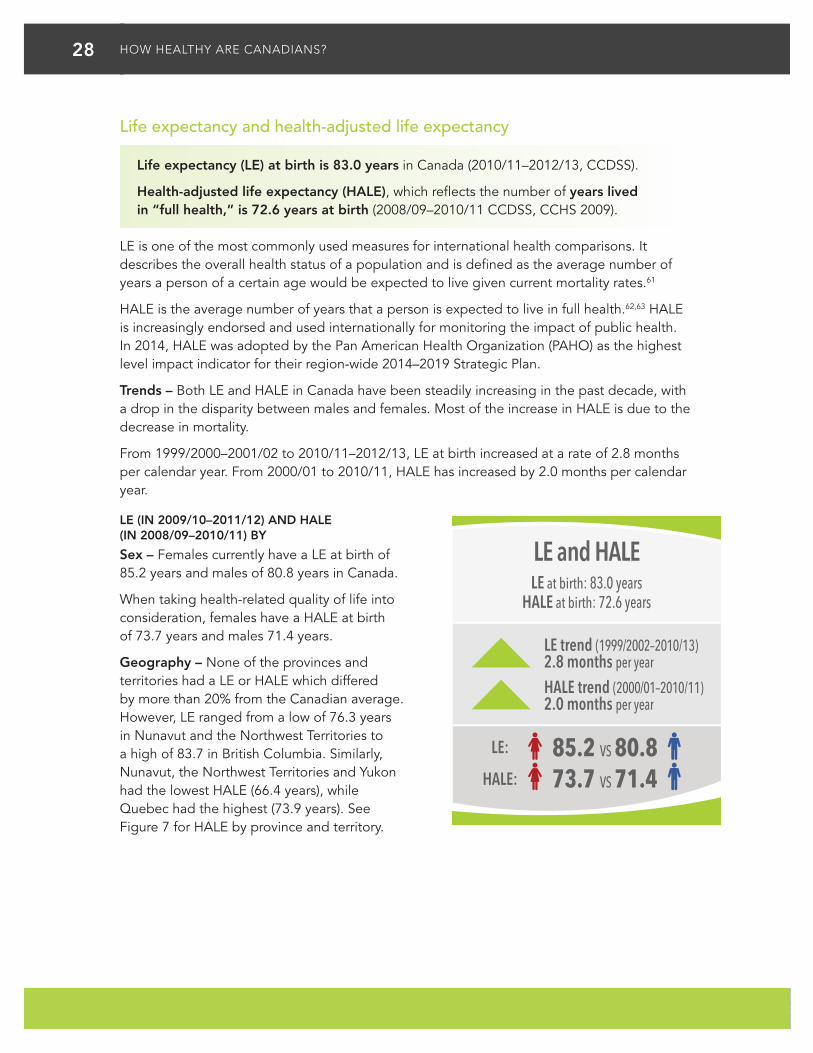
Life expectancy (LE) at birth is 83.0 years in Canada (2010/11–2012/13, CCDSS).
Health-adjusted life expectancy (HALE), which reflects the number of years lived in “full health,” is 72.6 years at birth (2008/09–2010/11 CCDSS, CCHS 2009).
LE is one of the most commonly used measures for international health comparisons. It describes the overall health status of a population and is defined as the average number of years a person of a certain age would be expected to live given current mortality rates.61
HALE is the average number of years that a person is expected to live in full health.62,63 HALE is increasingly endorsed and used internationally for monitoring the impact of public health. In 2014, HALE was adopted by the Pan American Health Organization (PAHO) as the highest level impact indicator for their region-wide 2014–2019 Strategic Plan.
Trends – Both LE and HALE in Canada have been steadily increasing in the past decade, with a drop in the disparity between males and females. Most of the increase in HALE is due to the decrease in mortality.
From 1999/2000–2001/02 to 2010/11–2012/13, LE at birth increased at a rate of 2.8 months per calendar year. From 2000/01 to 2010/11, HALE has increased by 2.0 months per calendar year.
LE (IN 2009/10–2011/12) AND HALE (IN 2008/09–2010/11) BY
Sex – Females currently have a LE at birth of 85.2 years and males of 80.8 years in Canada.
When taking health-related quality of life into consideration, females have a HALE at birth of 73.7 years and males 71.4 years.
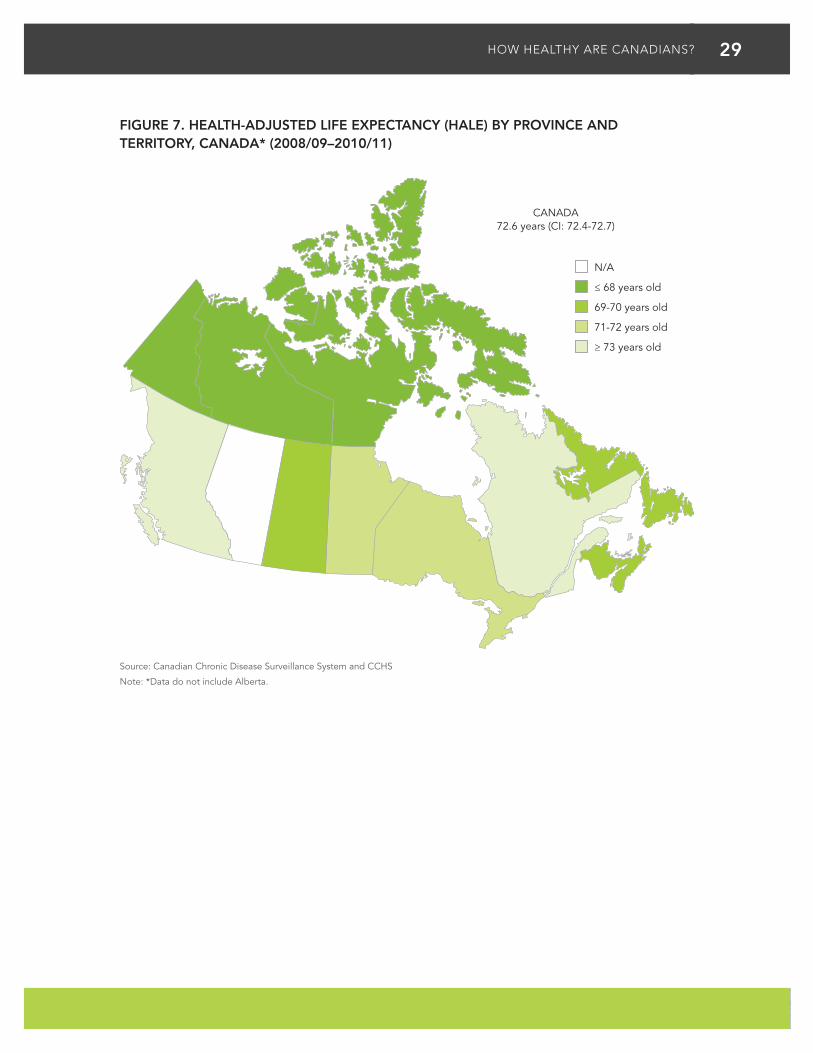
Geography – None of the provinces and territories had a LE or HALE which differed by more than 20% from the Canadian average. However, LE ranged from a low of 76.3 years in Nunavut and the Northwest Territories to a high of 83.7 in British Columbia. Similarly, Nunavut, the Northwest Territories and Yukon had the lowest HALE (66.4 years), while Quebec had the highest (73.9 years). See Figure 7 for HALE by province and territory.
LE and HALE
LE trend (1999/2002–2010/13)2.8 months per year
HALE trend (2000/01–2010/11)2.0 months per year
LE at birth: 83.0 years
85.2 VS 80.8
HALE at birth: 72.6 years
73.7 VS 71.4LE:
HALE:
29HOW HEALTHY ARE CANADIANS?
FIGURE 7. HEALTH-ADJUSTED LIFE EXPECTANCY (HALE) BY PROVINCE AND TERRITORY, CANADA* (2008/09–2010/11)
N/A
≤ 68 years old
69-70 years old
71-72 years old
≥ 73 years old
Source: Canadian Chronic Disease Surveillance System and CCHS
Note: *Data do not include Alberta.
CANADA72.6 years (CI: 72.4-72.7)
30 HOW HEALTHY ARE CANADIANS?
INTERNATIONAL COMPARISONS
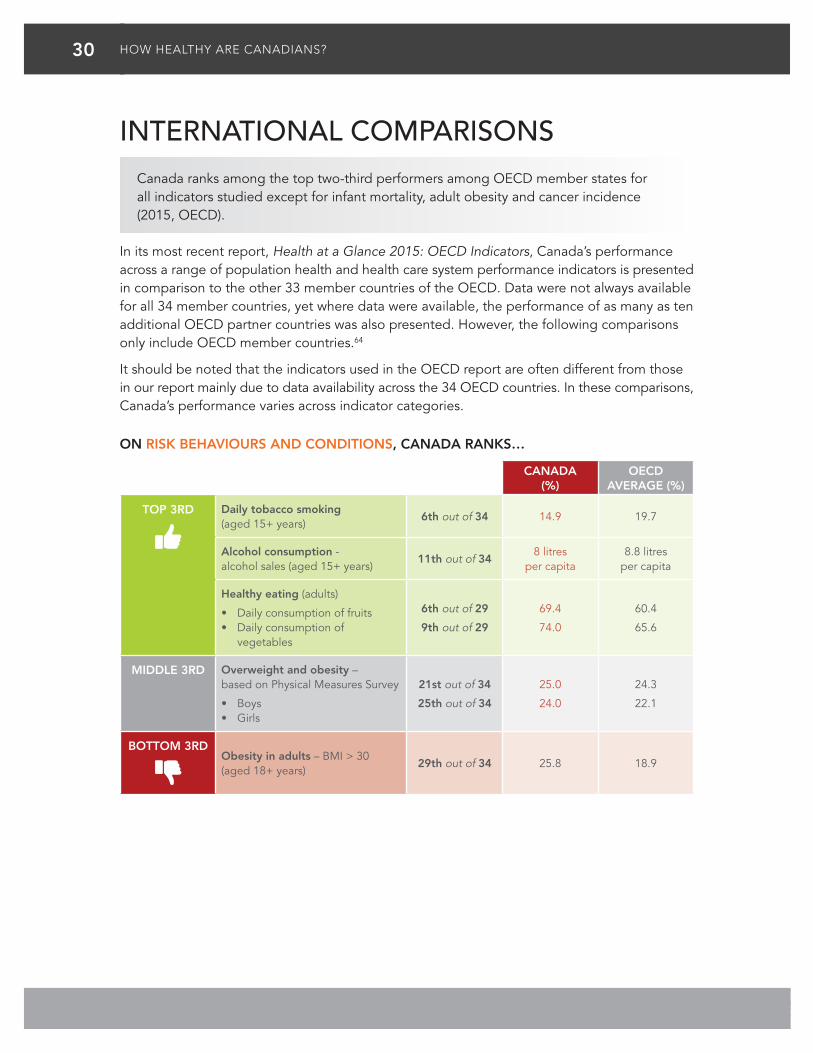
Canada ranks among the top two-third performers among OECD member states for all indicators studied except for infant mortality, adult obesity and cancer incidence (2015, OECD).
In its most recent report, Health at a Glance 2015: OECD Indicators, Canada’s performance across a range of population health and health care system performance indicators is presented in comparison to the other 33 member countries of the OECD. Data were not always available for all 34 member countries, yet where data were available, the performance of as many as ten additional OECD partner countries was also presented. However, the following comparisons only include OECD member countries.64
It should be noted that the indicators used in the OECD report are often different from those in our report mainly due to data availability across the 34 OECD countries. In these comparisons, Canada’s performance varies across indicator categories.
ON RISK BEHAVIOURS AND CONDITIONS, CANADA RANKS…
CANADA (%)
OECD AVERAGE (%)
TOP 3RD Daily tobacco smoking (aged 15+ years)
6th out of 34 14.9 19.7
Alcohol consumption - alcohol sales (aged 15+ years)
11th out of 348 litres
per capita8.8 litres
per capita
Healthy eating (adults)
• Daily consumption of fruits • Daily consumption of
vegetables
6th out of 29
9th out of 29
69.4
74.0
60.4
65.6
MIDDLE 3RD Overweight and obesity – based on Physical Measures Survey
• Boys• Girls
21st out of 34
25th out of 34
25.0
24.0
24.3
22.1
BOTTOM 3RDObesity in adults – BMI > 30 (aged 18+ years)
29th out of 34 25.8 18.9
31HOW HEALTHY ARE CANADIANS?
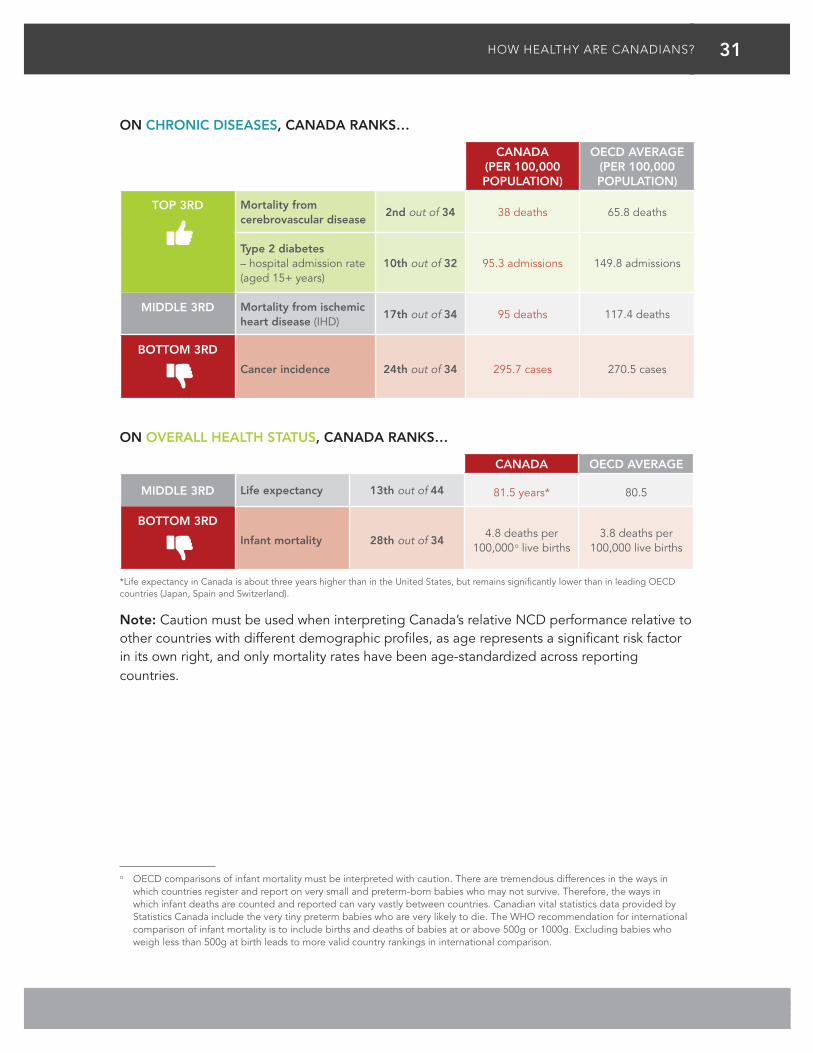
ON CHRONIC DISEASES, CANADA RANKS…
CANADA (PER 100,000 POPULATION)
OECD AVERAGE (PER 100,000 POPULATION)
TOP 3RD Mortality from cerebrovascular disease
2nd out of 34 38 deaths 65.8 deaths
Type 2 diabetes – hospital admission rate (aged 15+ years)
10th out of 32 95.3 admissions 149.8 admissions
MIDDLE 3RD Mortality from ischemic heart disease (IHD)
17th out of 34 95 deaths 117.4 deaths
BOTTOM 3RD
Cancer incidence 24th out of 34 295.7 cases 270.5 cases
ON OVERALL HEALTH STATUS, CANADA RANKS…
CANADA OECD AVERAGE
MIDDLE 3RD Life expectancy 13th out of 44 81.5 years* 80.5
BOTTOM 3RD
Infant mortality 28th out of 344.8 deaths per
100,000 o live births3.8 deaths per
100,000 live births
*Life expectancy in Canada is about three years higher than in the United States, but remains significantly lower than in leading OECD countries (Japan, Spain and Switzerland).
Note: Caution must be used when interpreting Canada’s relative NCD performance relative to other countries with different demographic profiles, as age represents a significant risk factor in its own right, and only mortality rates have been age-standardized across reporting countries.o
o OECD comparisons of infant mortality must be interpreted with caution. There are tremendous differences in the ways in which countries register and report on very small and preterm-born babies who may not survive. Therefore, the ways in which infant deaths are counted and reported can vary vastly between countries. Canadian vital statistics data provided by Statistics Canada include the very tiny preterm babies who are very likely to die. The WHO recommendation for international comparison of infant mortality is to include births and deaths of babies at or above 500g or 1000g. Excluding babies who weigh less than 500g at birth leads to more valid country rankings in international comparison.
32 HOW HEALTHY ARE CANADIANS?
CONCLUSIONSThis examination of key risk factors, major chronic diseases and overall life expectancy illustrates a mixed picture of the health of Canadians.
Canadians are living longer than ever before, and the life expectancy gap is closing between men and women. Nearly one in six Canadians (5.8 million) are 65 years or older, and this age group is growing four times faster than the overall population.65 Furthermore, rates of smoking continue to decrease in Canada, and mortality from major chronic conditions (especially that related to CVDs, CRDs and certain cancers) has also declined.
By contrast, the high rates of physical inactivity, sedentary behaviours and obesity rates, especially among Canada’s children and youth, are a major concern. While Canadians are living longer, it is important that they live longer in good health.
Most chronic diseases are preventable. The WHO estimates that at least 80% of heart disease, stroke and diabetes and 40% of all cancers are preventable.66 Central to the prevention of chronic disease are a few key risk factors. The current overweight and obesity rates in Canada must be tackled, particularly in children, youth and young adult populations. Canadian youth are now being diagnosed with conditions and diseases, like hypertension and type 2 diabetes, which were previously seen only in adults and are most likely a result of increased obesity. Diabetes overall is a major public health concern, as the prevalence rate has significantly risen over the past decade.
The higher prevalence of health service use for mood and anxiety disorders observed among working age adults (30–64 years old) may relate in part to the specific or unique challenges that these subpopulations often face, including work-related stress and the challenges of balancing work and personal/family life.67
Canadians must also become more active. Physical activity not only helps individuals manage weight, but it also independently increases sensitivity to insulin, reduces risk for CVDs and some cancers, and improves overall well-being.
Individual (e.g. lifestyle behaviours), community (e.g. built environment) and population (e.g. policy) level interventions are all critical to addressing these public health challenges. Evidence-based interventions and the identification and replication of best practices to prevent chronic disease and promote healthy living remain an important function of PHAC.
Surveillance is a core public health function. An examination of these trends illustrates the importance for continued surveillance and the need to identify new opportunities to assess and track the health of Canadians to inform health policies and practices.
33HOW HEALTHY ARE CANADIANS?
METHODOLOGICAL NOTESThe majority of data presented in this report are available from the Chronic Disease and Injury Indicator Framework (CDIIF) (http://infobase.phac-aspc.gc.ca/cdiif/) and the Chronic Disease Infobase Online Data Cubes (http://infobase.phac-aspc.gc.ca/cubes/index-eng.html).
• Crude rates for Canada and provinces/territories were calculated after random rounding counts to the nearest 10. Age-standardized rates were calculated using non-rounded counts. Prevalence counts for Canada, provinces and territories and life-course age groups were rounded to the nearest 100.
• The 2011 Canadian standard population was used for the calculation of age-standardized rates.
• All differences highlighted in this report between national and provincial/territorial averages were ≥ 20% from the Canadian average unless otherwise noted.
• Trends in incidence rates may reflect true change in population health status, but may also be a function of a change in data collection methods, coding/classification systems, clinical practices, billing methods, etc.
Depending on the data sources, the reporting year is either based on calendar year or fiscal year. For example, 2011/12 denotes a fiscal year whereas 2011–12 denotes two calendar years.
The data sources for chronic disease estimates included:
• The Canadian Chronic Disease Surveillance System (CCDSS) for physician-diagnosed disease prevalence, use of health services for mood and anxiety and incidence derived from physician billing and hospitalization records. Provincial and territorial data were contributed to the CCDSS as of November 2015. The opinions, results and conclusions reported in this paper are those of the authors. No endorsement by the provinces/territories is intended or should be inferred. The CCDSS currently covers fiscal years 1995/96 to 2011/12.
• The Canadian Cancer Registry (CCR): 1992 to 2009.
• The Canadian Community Health Survey (CCHS) for self-reported multi-morbidity, mood and anxiety disorders comorbidity, CVDs (heart disease and stroke), cancer, CRDs (asthma and COPD), diabetes and mood and anxiety disorders. Data from the CCHS were available for the years 2003, 2005, 2007 and 2008–2014.
The data sources for risk behaviour and risk condition estimates included:
• Canadian Health Measures Survey (CHMS) for physical activity, sedentary behaviour and obesity. Data from three cycles of the CHMS are available: 2007–09, 2009–11 and 2012–13.
• The Canadian Community Health Survey (CCHS) for unhealthy eating, smoking and alcohol (heavy drinking), as well as for the calculation of prevalence of self-reported chronic diseases. Data from the CCHS were available for the years 2003, 2005, 2007, 2008–2014.
• The Canadian Tobacco, Alcohol and Drug Survey (CTADS) and Canadian Alcohol and Other Drug Use Monitoring Survey (CADUMS) for alcohol (low-risk drinking guidelines). Data from these surveys cover the years 2005 to 2013.

34 HOW HEALTHY ARE CANADIANS?
CONTRIBUTORS (IN ALPHABETICAL ORDER)
Jay Barber
Sharon Bartholomew
Marisol Betancourt
Bernard Choi
Paromita Deb-Rinker
Alain Demers
Ragen Lane Halley
Lidia Loukine
Wei Luo
Louise McRae
Siobhan O’Donnell
Jay Onysko
Bob McDougall
Louise Pelletier (Lead)
Neel Rancourt
Deepa Rao
Karen C Roberts
Cynthia Robitaille
Annie J Stewart
Ming Su
Wendy Thompson
Chris Waters
Peter Walsh
Xiaoquan Yao
Dianne Zakaria
35HOW HEALTHY ARE CANADIANS?
REFERENCES(1) Public Health Agency of Canada. Diabetes in Canada: Facts and figures from a public health
perspective, Ottawa (ON): Public Health Agency of Canada; 2011. Available from: www.phac-aspc.gc.ca/cd-mc/publications/diabetes-diabete/facts-figures-faits-chiffres-2011/index-eng.php
(2) Canadian Diabetes Association. Diabetes: Canada at the tipping point—charting a new path. 2011. Available from: www.diabetes.ca/CDA/media/documents/publications-and-newsletters/advocacy-reports/canada-at-the-tipping-point-english.pdf
(3) World Health Organization. Global action plan for the prevention and control of noncommunicable diseases 2013–2020. Geneva, 2013. Available from: www.who.int/nmh/events/ncd_action_plan/en/
(4) Public Health Agency of Canada. Economic Burden of Illness in Canada (EBIC). Available from: http://ebic-femc.phac-aspc.gc.ca/index.php
(5) Health Canada. Smoking and your body [Internet]. Ottawa (ON): Health Canada; [modified 2011 Nov 1; cited 2016 Feb 17]. Available from: www.hc-sc.gc.ca/hc-ps/tobac-tabac/body-corps/index-eng.php
(6) Health Canada. The National Strategy: The 2006 Progress Report on Tobacco Control Moving Forward. Available from: www.hc-sc.gc.ca/hc-ps/pubs/tobac-tabac/prtc-relct-2006/index-eng.php.
(7) World Health Organization. Global recommendations on physical activity for health. Geneva. Available from: http://whqlibdoc.who.int/publications/2010/9789241599979_eng.pdf
(8) Tremblay MS, Warburton DE, Janssen I, Paterson DH, Latimer AE, Rhodes RE, Kho ME, Hicks A, LeBlanc AG, Zehr L, Murumets K. New Canadian physical activity guidelines. Applied Physiology, Nutrition, and Metabolism. 2011 Feb 15;36(1):36-46.
(9) Tremblay MS, LeBlanc AG, Janssen I, Kho ME, Hicks A, Murumets K, Colley RC, Duggan M. Canadian sedentary behaviour guidelines for children and youth. Applied Physiology, Nutrition, and Metabolism. 2011 Jan;36(1):59-64.
(10) Joint WHO/FAO Expert Consultation. Diet, nutrition and the prevention of chronic diseases. World Health Organ Tech Rep Ser. 2003;916:1-149.
(11) Wang X, Ouyang Y, Liu J, Zhu M, Zhao G, Bao W, Hu FB. Fruit and vegetable consumption and mortality from all causes, cardiovascular disease, and cancer: systematic review and dose-response meta-analysis of prospective cohort studies. 2014 Jul 29;349:g4490.
(12) Health Canada. Eating Well with Canada’s Food Guide. Available from: www.hc-sc.gc.ca/fn-an/food-guide-aliment/index-eng.php
(13) Garriguet D. Diet quality in Canada. Health Rep. 2009;20(3):41-52.
(14) Butt P, Beirness D, Gliksman L, Paradis C, Stockwell T. Alcohol and health in Canada: a summary of evidence and guidelines for low-risk drinking. Ottawa (ON): Canadian Centre on Substance Abuse; 2011 Nov.
(15) Guh DP, Zhang W, Bansback N, Amarsi Z, Birmingham CL, Anis AH. The incidence of co-morbidities related to obesity and overweight: a systematic review and meta-analysis. BMC Public Health. 2009 Mar 25;9:88.
(16) Reilly JJ, Methven E, McDowell ZC, et al. Health consequences of obesity. Archives of Disease in Childhood 2003; 88(9): 748-52.
36 HOW HEALTHY ARE CANADIANS?
(17) Singh AS, Mulder C, Twisk JW, et al. Tracking of childhood overweight into adulthood: a systematic review of the literature. Obesity Review 2008;9(5):474-88.
(18) Shields M, Tjepkema M. Trends in adult obesity. Health Rep. 2006 Aug;17(3):53-9.
(19) Roberts KC, Shields M, de Groh M, Aziz A, Gilbert JA. Overweight and obesity in children and adolescents: Results from the 2009 to 2011 Canadian Health Measures Survey. Health Rep. 2012 Sep;23(3):37-41.
(20) Bancej C, Jayabalasingham B, Wall RW, Rao DP, Do MT, de Groh M, Jayaraman GC. Evidence Brief – Trends and projections of obesity among Canadians. Health Promot Chronic Dis Prev Can. 2015 Sep;35(7):109-12.
(21) World Health Organization. Global Status Report on Noncommunicable Diseases 2014. Available from: www.who.int/nmh/publications/ncd-status-report-2014/en/
(22) World Health Organization. Global Status Report on Noncommunicable Diseases 2014. Available from: www.who.int/nmh/publications/ncd-status-report-2014/en/
(23) Dasgupta K, Quinn RR, Zarnke KB, Rabi DM, Ravani P, Daskalopoulou SS, Rabkin SW, Trudeau L, Feldman RD, Cloutier L, Prebtani A. The 2014 Canadian Hypertension Education Program recommendations for blood pressure measurement, diagnosis, assessment of risk, prevention, and treatment of hypertension. Canadian Journal of Cardiology. 2014 May 31;30(5):485-501.
(24) Padwal RS, Bienek A, McAlister FA, Campbell NR, Outcomes Research Task Force of the Canadian Hypertension Education Program. Epidemiology of Hypertension in Canada: An Update. Canadian Journal of Cardiology. 2015 Aug 15.
(25) Padwal RS, Bienek A, McAlister FA, Campbell NR, Outcomes Research Task Force of the Canadian Hypertension Education Program. Epidemiology of Hypertension in Canada: An Update. Canadian Journal of Cardiology. 2015 Aug 15.
(26) Public Health Agency of Canada. Chronic Disease and Injury Indicator Framework – Quick Stats, 2015 Edition. Health promotion and chronic disease prevention in Canada: research, policy and practice. 2015 Dec;35(10):194. Available from: www.phac-aspc.gc.ca/publicat/hpcdp-pspmc/35-10/assets/pdf/ar-03-eng.pdf
(27) Public Health Agency of Canada. Tracking Heart Disease and Stroke in Canada 2009. [Internet]. Ottawa (ON): Public Health Agency of Canada; 2009. Available from: www.phac-aspc.gc.ca/publicat/2009/cvd-avc/pdf/cvd-avs-2009-eng.pdf
(28) Institute for Health Metrics and Evaluation. Canada. [Internet]. Institute for Health Metrics and Evaluation. Available from: www.healthdata.org/canada
(29) Statistics Canada. Table 102-0561 - Leading causes of death, total population, by age group and sex, Canada, annual, CANSIM (database). Available from: www5.statcan.gc.ca/cansim/a26?lang=eng&id= 1020561 Accessed: 2016 Feb 22.
(30) Institute for Health Metrics and Evaluation. Overview of Global Burden of Disease. Available from: www.healthdata.org/canada
(31) Public Health Agency of Canada. Tracking Heart Disease and Stroke in Canada – Stroke Highlights 2011. [Internet]. Ottawa (ON): Public Health Agency of Canada; 2011. Available from: www.phac-aspc.gc.ca/cd-mc/cvd-mcv/sh-fs-2011/index-eng.php
37HOW HEALTHY ARE CANADIANS?
(32) Krishnamurthi RV, Moran AE, Feigin VL, Barker-Collo S, Norrving B, Mensah GA, Taylor S, Naghavi M, Forouzanfar MH, Nguyen G, Johnson CO. Stroke prevalence, mortality and disability-adjusted life years in adults aged 20-64 years in 1990-2013: data from the global burden of disease 2013 study. Neuroepidemiology. 2015 Oct 28;45(3):190-202.
(33) Kissela BM, Khoury JC, Alwell K, Moomaw CJ, Woo D, Adeoye O, Flaherty ML, Khatri P, Ferioli S, La Rosa FD, Broderick JP. Age at stroke temporal trends in stroke incidence in a large, biracial population. Neurology. 2012 Oct 23;79(17):1781-7.
(34) Canadian Cancer Society’s Advisory Committee on Cancer Statistics. Canadian Cancer Statistics 2015. Toronto, ON: Canadian Cancer Society; 2015.
(35) U.S. Department of Health and Human Services. The Health Consequences of Smoking: 50 Years of Progress. A Report of the Surgeon General. Atlanta, GA: U.S. Department of Health and Human Services, Centers for Disease Control and Prevention, National Center for Chronic Disease Prevention and Health Promotion, Office on Smoking and Health, 2014. Available from: www.surgeongeneral.gov/library/reports/50-years-of-progress/full-report.pdf
(36) U.S. Department of Health and Human Services. The Health Benefits of Smoking Cessation. U.S. Department of Health and Human Services. Public Health Service, Centers for Disease Control, Center for Chronic Disease Prevention and Health Promotion, Office on Smoking and Health. DHHS Publication No. (CDC) 90-8416, 1990.
(37) Overview of Global Burden of Disease. Institute for Health Metrics and Evaluation. Available from: www.healthdata.org/canada
(38) 2017 GINA Report, Global Strategy for Asthma Management and Prevention [accessed 2017 March 16] http://ginasthma.org/2017-gina-report-global-strategy-for-asthma-management-and-prevention/
(39) Public Health Agency of Canada. Fast Facts about Asthma: Data compiled from the 2011 Survey on Living with Chronic Diseases in Canada. [Internet]. PHAC; 2015. Available from: www.phac-aspc.gc.ca/cd-mc/crd-mrc/asthma_fs_asthme-eng.php
(40) Overview of Global Burden of Disease. Institute for Health Metrics and Evaluation. Available from: www.healthdata.org/canada
(41) Public Health Agency of Canada, Diabetes in Canada: Facts and figures from a public health perspective. Ottawa, 2011. Available from: www.phac-aspc.gc.ca/cd-mc/publications/ diabetes-diabete/facts-figures-faits-chiffres-2011/pdf/facts-figures-faits-chiffres-eng.pdf
(42) Institute for Health Metrics and Evaluation. Overview of Global Burden of Disease. Available from: www.healthdata.org/canada
(43) Public Health Agency of Canada. Report from the Canadian Chronic Disease Surveillance System: Mood and Anxiety Disorders in Canada, 2016. http://healthycanadians.gc.ca/publications/diseases-conditions-maladies-affections/mood-anxiety-disorders-2016-troubles-anxieux-humeur/index-eng.php
(44) Institute for Health Metrics and Evaluation: GBD Cause Patterns [Internet]. University of Washington; 2014 [released 2013 March; cited 2016 Feb 25]. Available from: http://vizhub.healthdata.org/irank/arrow.php
(45) Roberts KC, Rao DP, Bennett TL, Loukine L, Jayaraman GC. Prevalence and patterns of chronic disease multimorbidity and associated determinants in Canada Health Promotion and Chronic Disease Prevention in Canada Research, Policy and Practice. 2015 Aug 1;35(6).
38 HOW HEALTHY ARE CANADIANS?
(46) Marengoni A, Angleman S, Melis R, Mangialasche F, Karp A, Garmen A, Meinow B, Fratiglioni L. Aging with multimorbidity: a systematic review of the literature. Ageing Res Rev. 2011 Sep;10(4):430-9.
(47) Scott KM, Von Korff M, Angermeyer MC, Benjet C, Bruffaerts R, de Girolamo G, Haro JM, Lepine JP, Ormel J, Posada-Villa J, Tachimori H. Association of childhood adversities and early-onset mental disorders with adult-onset chronic physical conditions. Arch Gen Psychiatry. 2011 Aug;68(8):838-44.
(48) Scott KM, Von Korff M, Angermeyer MC, Benjet C, Bruffaerts R, de Girolamo G, Haro JM, Lepine JP, Ormel J, Posada-Villa J, Tachimori H. Association of childhood adversities and early-onset mental disorders with adult-onset chronic physical conditions. Arch Gen Psychiatry. 2011 Aug;68(8):838-44.
(49) Evans DL, Charney DS, Lewis L, Golden RN, Gorman JM, Krishnan KR, Nemeroff CB, Bremner JD, Carney RM, Coyne JC, Delong MR. Mood disorders in the medically ill: scientific review and recommendations. Biol Psychiatry. 2005 Aug 1;58(3):175–89.
(50) Government of Canada. The Human Face of Mental Health and Mental Illness in Canada. Ottawa (ON): Minister of Public Works and Government Services Canada; 2006.
(51) Patten SB. Long-term medical conditions and major depression in a Canadian population study at waves 1 and 2. J Affect Disord. 2001 Mar;63(1-3):35-41.
(52) Katon WJ. Clinical and health services relationships between major depression, depressive symptoms, and general medical illness. Biol Psychiatry. 2003 Aug 1;54(3):216-26.
(53) Rothberg MB, Haessler SD, Brown RB. Complications of viral influenza. The American Journal of Medicine. 2008 Apr 30;121(4):258-64.
(54) Schanzer DL, Langley JM, Tam TW. Co-morbidities associated with influenza-attributed mortality, 1994–2000, Canada. Vaccine. 2008 Aug 26;26(36):4697-703.
(55) Bin Seo Y, Suk Choi W, Hyeon Baek J, Lee J, Young Song J, Soo Lee J, Cheong HJ, Joo Kim W. Effectiveness of the influenza vaccine at preventing hospitalization due to acute exacerbation of cardiopulmonary disease in Korea from 2011 to 2012. Human vaccines & immunotherapeutics. 2014 Feb 1;10(2):423-7.
(56) Sachs BP, Fretts RC, Gardner R, Hellerstein S, Wampler NS, Wise PH. The impact of extreme prematurity and congenital anomalies on the interpretation of international comparisons of infant mortality. Obstet Gynecol. 1995, 85(6):941-946.
(57) Howell EM, Blondel B. International infant mortality rates: Bias from reporting differences. Am J Public Health. 1994, 84(5):850-852.
(58) Public Health Agency of Canada. Canadian Perinatal Health Report. 2008 Edition. Ottawa: Public Health Agency of Canada; 2008.
(59) Pongou R. Why is infant mortality higher in boys than in girls? A new hypothesis based on preconception environment and evidence from a large sample of twins. Demography. 2013, 50(2): 421-444.
(60) World Health Organization. A draft comprehensive global monitoring framework, including indicators, and a set of voluntary global targets for the prevention and control of noncommunicable diseases. A/NCD/INF./1 31. October 2012. Available from: http://apps.who.int/gb/ncds/pdf/A_NCD_INF1-en.pdf
(61) Office of Disease Prevention and Health Promotion. General Health Status [Internet]. Washington (DC): Healthy People 2020; 2014. Available from: www.healthypeople.gov/2020/about/foundation-health-measures/General-Health-Status
39HOW HEALTHY ARE CANADIANS?
(62) Public Health Agency of Canada. Health-Adjusted Life Expectancy (HALE) in Canada 2012. Ottawa, 2012 http://publications.gc.ca/collections/collection_2012/aspc-phac/HP35-32-2012-eng.pdf
(63) World Health Organization. Health Status Statistics: Mortality [Internet]. Geneva. 2016. Available from: www.who.int/healthinfo/statistics/indhale/en/
(64) OECD. Health at a Glance 2015: OECD Indicators [Internet]. Paris: OECD Publishing; 2015 Nov 4. Available from: http://dx.doi.org/10.1787/health_glance-2015-en
(65) Statistics Canada. Canada’s population estimates: Age and sex, July 1, 2015. Available from: www.statcan.gc.ca/daily-quotidien/150929/dq150929b-eng.htm
(66) World Health Organization. Preventing chronic diseases: a vital investment WHO global report [Internet]. Geneva. 2005. Available from: www.who.int/chp/chronic_disease_report/part1/ en/index11.html
(67) Public Health Agency of Canada. Mood and Anxiety Disorders in Canada, 2016. Ottawa, 2016 Available from: http://healthycanadians.gc.ca/publications/diseases-conditions-maladies-affections/mental-mood-anxiety-anxieux-humeur/index-eng.php