HOW FIBONACCI CAN IMPROVE YOUR ACCURACY AND … · Fibonacci Strategies can be applied to Futures,...
22
www.FibonacciTradingInstitute.com Documentation Copyright © 2018 Fibonacci Trading Institute. All rights reserved. HOW FIBONACCI CAN IMPROVE YOUR ACCURACY AND PROFITABILITY IN DAY AND POSITION TRADING
Transcript of HOW FIBONACCI CAN IMPROVE YOUR ACCURACY AND … · Fibonacci Strategies can be applied to Futures,...
www.FibonacciTradingInstitute.com
Documentation Copyright © 2018 Fibonacci Trading Institute. All rights reserved.
HOW FIBONACCI CAN IMPROVE YOUR
ACCURACY AND PROFITABILITY IN
DAY AND POSITION TRADING
www.FibonacciTradingInstitute.com
Documentation Copyright © 2018 Fibonacci Trading Institute. All rights reserved.
Introduction
Section 1.0 - A Brief History Of Fibonacci
Section 2.0 - Fibonacci vs Technical Indicators
2.1 – Fibonacci
2.2 – Technical Indicators
2.3 - Characteristics of Fibonacci & Indicators
Section 3.0 - Fibonacci Price Retracement Ratios
3.1 Fibonacci Price Retracement Example in a Rising Market
3.2 Fibonacci Price Retracement Example in a Falling Market
Section 4.0 - Fibonacci Price Extension Ratios
4.1 Fibonacci Price Extension Example in a Rising Market
4.2 Fibonacci Price Extension Example in a Falling Market
Section 5.0 Fibonacci Trading Institute
5.1 Fibonacci Trading Institute Proprietary Fibonacci Levels
5.2 Fibonacci Trading Institute Proprietary Method
5.3 Contact Fibonacci Trading Institute
CONTENTS

www.FibonacciTradingInstitute.com
Documentation Copyright © 2018 Fibonacci Trading Institute. All rights reserved.
An Introduction
Trading within the financial markets can be undertaken in many different ways and today’s trader
has a whole host of different tools at their disposal. One of the more popular techniques that traders
use is Fibonacci Retracements and Extensions.
Fibonacci is the only Natural Predictive Mathematical Sequence (it does not require any math skills)
that is used to analyse market structure and accurately identify key market areas of support and
resistance. Knowing where key Fibonacci levels are will identify the best area for trade entry and
show with high accuracy profit targets on any instrument and any platform.
Fibonacci Strategies can be applied to Futures, Forex, Stocks, ETF’s and essentially every liquid
market instrument. They can also be traded on any timeframe, which makes them available to all
types of traders. Whether you are a scalper, swing trader or position trader, Fibonacci Studies will be
applicable and effective.
Fibonacci techniques are powerful and whilst not a standalone trading system in their own right,
they can be a very effective component of a trading strategy. Fibonacci Strategies must be traded
with a strict set of rules. This E-Book will explain how Fibonacci can be used in trading any markets
on any time frame with a Fibonacci Retracement Tool.

www.FibonacciTradingInstitute.com
Documentation Copyright © 2018 Fibonacci Trading Institute. All rights reserved.
Fibonacci numbers were derived from an Italian mathematician Leonardo Pisano and documented
initially in the 13th Century. Pisano was considered by some as the most talented Western
mathematician of the Middle Ages and made many of the original contributions within complex
calculations.
It was whilst journeying with his father that Pisano began to develop
his mathematical skills and solve problems relating to merchant trade
and price calculations. He started to observe that certain ratios of a
number series can describe the natural proportions of the Universe
including price data.
With this in mind Pisano devised a series of numbers that were
derived by starting at 0 and 1 and then adding the two previous
numbers to create the next number in the series. This series reaches
all the way out to infinity and the start of the sequence looks like the
following:
0, 1, 1, 2, 3, 5, 8, 13, 21, 34, 55, 89, 144, 233, 377, 610, 987 ……. and so on to infinity.
The ‘Golden Ratio’ is a term that is associated with Fibonacci and the ratio is determined by a special
relationship found within the number series. After the commencement of the first few numbers
there is found to be a ratio multiplier of 1.618 between each number for example:
55 x (1.618) = 89, 89 x (1.618) = 144, 144 x (1.618) = 233 and so on.
Further work has been done on the Fibonacci ratios to provide yet another sequence which is used
in today’s Fibonacci Analysis. Without going too deep into the square roots, reciprocals or other
mathematical formulas of these numbers the list of values which are in use are:
PRICE RETRACEMENT RATIOS PRICE EXTENSION RATIOS
0.236, 0.382, 0.500, 0.618, 0.764 0, 0.382, 0.618, 1.000, 1.382, 1.618
To further understand what is meant by Price Retracement and Price Extension Ratios, some practical
examples are provided in the following section.
1.0 - A Brief History Of Fibonacci

www.FibonacciTradingInstitute.com
Documentation Copyright © 2018 Fibonacci Trading Institute. All rights reserved.
2.1 – Fibonacci
Fibonacci is a powerful tool for determining price corrections and key levels of support and
resistance. Based upon mathematical concepts of the Fibonacci Sequence, Fibonacci can determine
the extent of price movements and corrections within the markets. Fibonacci is naturally predictive
and the only tool, which can identify price levels far in advance of current prices. The accuracy of
Fibonacci lends itself to finding key entries of support and resistance within the markets thus
facilitating trade entry and profit target prices.
Technical Indicators do come with limitations in that they are often expensive, work only on certain
platforms and lag behind the markets. Fibonacci Tools on the other hand are common to the vast
majority of trading platforms, work on any instrument, any timeframe and are predictive in nature.
It is worth noting however, that Fibonacci Tools do not provide a trading strategy in their own right.
The levels of support and resistance must be traded in conjunction with a strict set of rules for a
complete trading strategy. The markets will eventually break support and resistance and it is
essential that price action at the Fibonacci levels will support any decision to enter or exit the market.
In the diagram on the right, price has
risen in an uptrend respecting the
Fibonacci Extension levels predicted
from the price structure of Wave 1.
Price has also respected the
Fibonacci Retracement levels as the
market corrected itself and retraced
the length of prior swings by 50%
and 61.8% respectively.
The predictive nature of Fibonacci
lends itself to identifying key turning
points within the markets with a
high degree of accuracy.
2.0 - Fibonacci vs Technical Indicators

www.FibonacciTradingInstitute.com
Documentation Copyright © 2018 Fibonacci Trading Institute. All rights reserved.
2.2 - Technical Indicators
Many traders who utilize technical analysis rely heavily on trading indicators to help them make
trading decisions. The internet is awash with many types of indicators that are designed to help a
trader enter or exit the markets based on some form of visual interpretation. Whether it be relative
strength, momentum oscillators, fractals or any other type of indicator they all have their own
inherent problems.
Generally speaking, many technical
indicators look at how the market behaved
and apply a mathematical formula to a
number of prior periods to plot some form
of visual representation that assists a trader
in making a decision.
The diagram on the right is plotting simple
market pivot points. The mathematical
formula requires 6 candles before it can plot
the green pivot point and this is after the
market has already moved away from the
pivot.
2.3 - Characteristics of Fibonacci & Indicators
FIBONACCI INDICATORS
• Naturally Predictive • Delayed
• Mathematical Sequence • Artificial
• Can be used on: • Can only be used on:
• Any Platform • Specific Platforms
• Any Instrument • Specific Timeframes
• Any Timeframe • Cost can be Considerable
www.FibonacciTradingInstitute.com
Documentation Copyright © 2018 Fibonacci Trading Institute. All rights reserved.
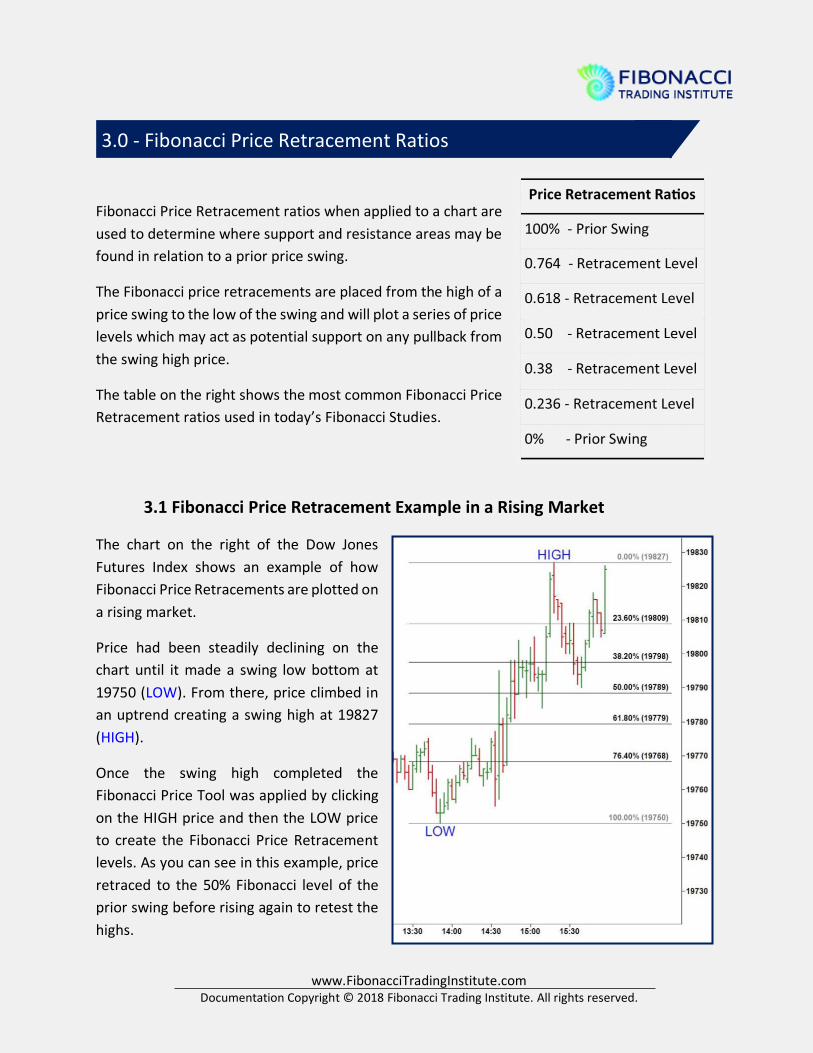
Fibonacci Price Retracement ratios when applied to a chart are
used to determine where support and resistance areas may be
found in relation to a prior price swing.
The Fibonacci price retracements are placed from the high of a
price swing to the low of the swing and will plot a series of price
levels which may act as potential support on any pullback from
the swing high price.
The table on the right shows the most common Fibonacci Price
Retracement ratios used in today’s Fibonacci Studies.
3.1 Fibonacci Price Retracement Example in a Rising Market
The chart on the right of the Dow Jones
Futures Index shows an example of how
Fibonacci Price Retracements are plotted on
a rising market.
Price had been steadily declining on the
chart until it made a swing low bottom at
19750 (LOW). From there, price climbed in
an uptrend creating a swing high at 19827
(HIGH).
Once the swing high completed the
Fibonacci Price Tool was applied by clicking
on the HIGH price and then the LOW price
to create the Fibonacci Price Retracement
levels. As you can see in this example, price
retraced to the 50% Fibonacci level of the
prior swing before rising again to retest the
highs.
3.0 - Fibonacci Price Retracement Ratios

www.FibonacciTradingInstitute.com
Documentation Copyright © 2018 Fibonacci Trading Institute. All rights reserved.
3.2 Fibonacci Retracement Example in a Bearish Market
The chart on the right of the Dow Jones
Futures Index shows an example of how
Fibonacci Price Retracements are
plotted on a falling market.
Price had been steadily rising on the
chart until it made a swing high top at
19994 (HIGH). From there price fell in a
downtrend creating a swing low at
19800 (LOW).
Once the swing low completed the
Fibonacci Price Tool was applied by
clicking on the LOW price and then the
HIGH price to create the Fibonacci Price
Retracement levels.
As you can see in this example, price
retraced to the 50% Fibonacci level of
the prior swing before falling again and
eventually finding support and
resistance between the 23.6% and
38.2% retracement levels.

www.FibonacciTradingInstitute.com
Documentation Copyright © 2018 Fibonacci Trading Institute. All rights reserved.
Fibonacci Price Extensions are similar in nature to that of Fibonacci
Price Retracements in that they are plotted from a prior swing low
to a prior swing high (or vice-versa). Fibonacci extensions do
however, extend beyond the prior swing data points to project
levels of support and resistance outside of the prior swing. The
benefit of this provides potential market entry points from support
and resistance as well as market exit points on current positions.
The table on the right shows the most common Fibonacci Price
Extension ratios used in today’s Fibonacci Studies.
4.1 Fibonacci Price Extension in a Rising Market
The chart on the right of the Dow Jones Futures Index shows an example of how Fibonacci Price
Extensions are plotted on a rising market.
Price had declined creating a swing
low pivot at 19692 (LOW). The market
then rose creating a swing high pivot
at 19730 (HIGH). Fibonacci Extensions
were then plotted from the swing high
to swing low data points creating
Fibonacci price projections above the
current market.
Price eventually rose swiftly where it
stalled at the 161.8% extension line,
broke through it and then retested
that same level before finally moving
up to the 261.8% extension where it
reversed. The Fibonacci Price
Extension levels were plotted well in
4.0 - Fibonacci Price Extension Ratios
www.FibonacciTradingInstitute.com
Documentation Copyright © 2018 Fibonacci Trading Institute. All rights reserved.
advance of the price rise and could be used for Trend Continuation Entries, Counter Trend Entries or
places for taking profit.
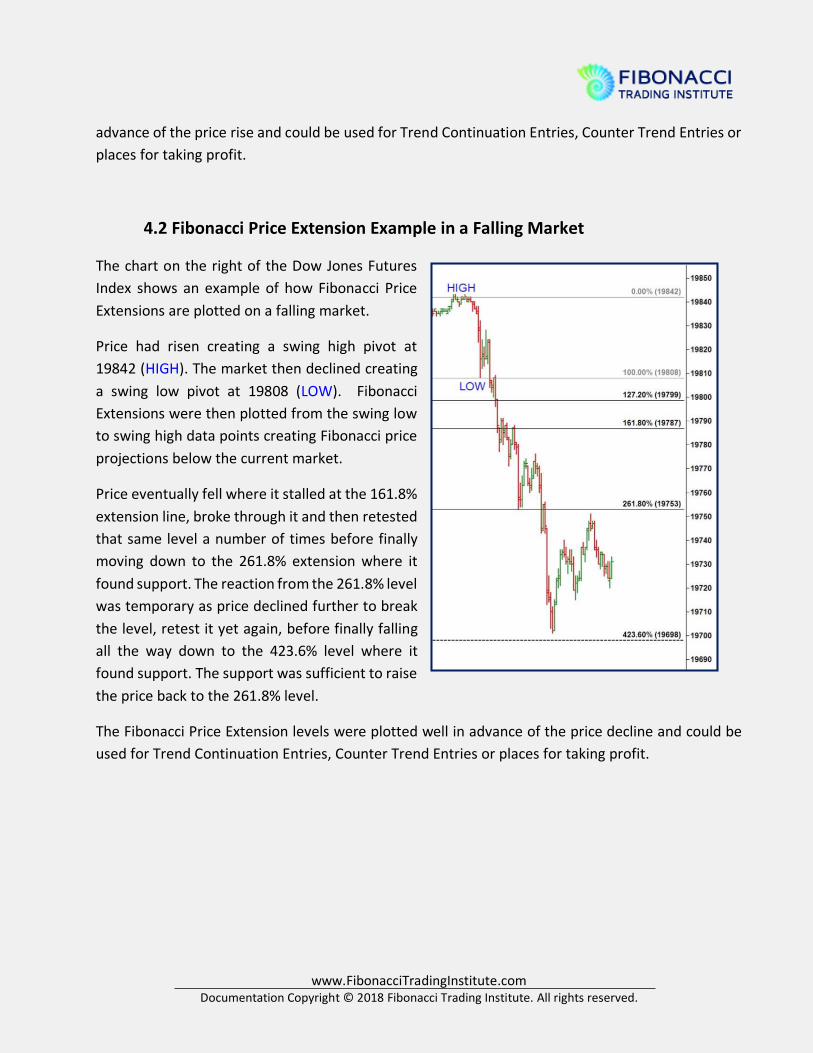
4.2 Fibonacci Price Extension Example in a Falling Market
The chart on the right of the Dow Jones Futures
Index shows an example of how Fibonacci Price
Extensions are plotted on a falling market.
Price had risen creating a swing high pivot at
19842 (HIGH). The market then declined creating
a swing low pivot at 19808 (LOW). Fibonacci
Extensions were then plotted from the swing low
to swing high data points creating Fibonacci price
projections below the current market.
Price eventually fell where it stalled at the 161.8%
extension line, broke through it and then retested
that same level a number of times before finally
moving down to the 261.8% extension where it
found support. The reaction from the 261.8% level
was temporary as price declined further to break
the level, retest it yet again, before finally falling
all the way down to the 423.6% level where it
found support. The support was sufficient to raise
the price back to the 261.8% level.
The Fibonacci Price Extension levels were plotted well in advance of the price decline and could be
used for Trend Continuation Entries, Counter Trend Entries or places for taking profit.
www.FibonacciTradingInstitute.com
Documentation Copyright © 2018 Fibonacci Trading Institute. All rights reserved.
5.1 Fibonacci Trading Institute (FTI) Proprietary Fibonacci Levels
At Fibonacci Trading Institute the power of Fibonacci has been harnessed and its core concepts
utilized to derive proprietary levels. The accuracy has enabled FTI to develop strategies around these
key levels and identify trading opportunities with the knowledge of where price is in relation to
support or resistance. These levels are also essential for determining highly accurate profit targets.
These proprietary Fibonacci levels are identified far in advance of price ever reaching an area and
allow FTI to identify not just target, but also trend inception and trend reversal areas.
The FTI method is then applied to these core areas with well-defined entries, stop placements and
price targets. The method can be applied to any instrument and any timeframe whether you are a
scalper, day trader, position trader or investor the FTI method is applicable to all types of trader.
Short-term charts, from 1 minute to hourly identify price targets minutes or hours before the targets
are reached. Identical strategies are used on long-terms charts for positon trading, option trading
and investment decisions. Charts, such as daily, weekly and monthly identify key targets days, weeks
and months in advance.
On the following pages you can see a number of examples from short term day trading charts to long
term charts where targets were identified in advance with the same accuracy. This can also be
witnessed daily in live markets in our Fibonacci Day Trading room and videos can be found on our
YouTube Channel.
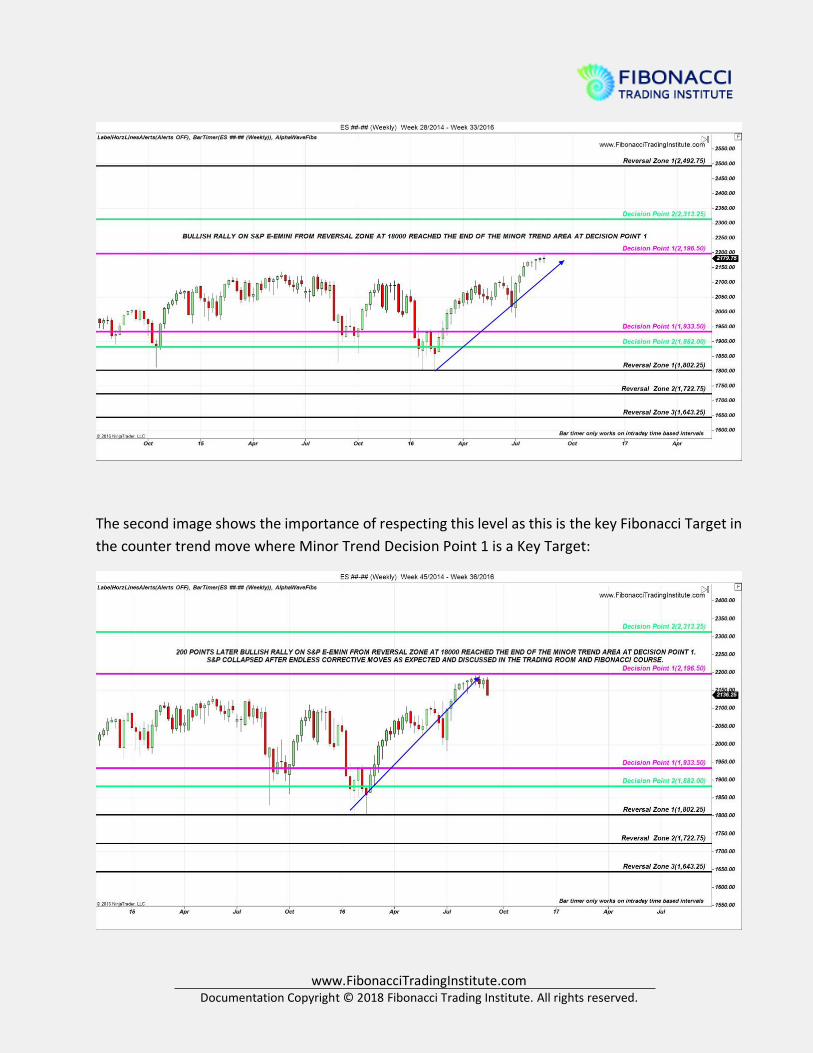
Here is an example of how Fibonacci can be used in Position or Options Trading on the S&P E-Mini:
Below is a long-term, weekly institutional chart of the S&P E-mini Futures with the FTI proprietary
Fibonacci levels applied. Each of these levels had been identified months in advance of price ever
reaching the areas. This is an example of how Fibonacci can be used in position or Options Trading.
Fibonacci is the only natural predictive tool in the market. On this weekly chart the Decision Point 1
is the key Fibonacci Target, identified months in advance. Again, the very same strategy is used in
day trading where targets are identified minutes and hours in advance.
5.0 - Fibonacci Trading Institute
www.FibonacciTradingInstitute.com
Documentation Copyright © 2018 Fibonacci Trading Institute. All rights reserved.
The second image shows the importance of respecting this level as this is the key Fibonacci Target in
the counter trend move where Minor Trend Decision Point 1 is a Key Target:

www.FibonacciTradingInstitute.com
Documentation Copyright © 2018 Fibonacci Trading Institute. All rights reserved.
In this third image the Bullish Rally continues when the Bullish Trend breaks through Decision Point
1 after six months of resistance and reaches the Reversal Zone identified years in advance:
Fibonacci Trading Institute utilizes the same Fibonacci Strategies and the same Proprietary Fibonacci
Tool on the S&P 500 Futures in the day trading room to demonstrate the power and accuracy of
Fibonacci in live markets. It is understood that every trader is unique in their own trading style, their
tolerance to risk and their preferred trading markets. Therefore, the portability of the FTI Fibonacci
method is easily transported to other markets and other timeframes.
Below are multiple examples of how Fibonacci Retracement Strategies and the FTI Fibonacci Tool can
be used on various markets and various time frames from tick, minute charts on Futures to long term
positions on Apple, Gold, Oil, EURUSD.
You can also view many different examples on our Youtube Channel in live markets on various
instruments.
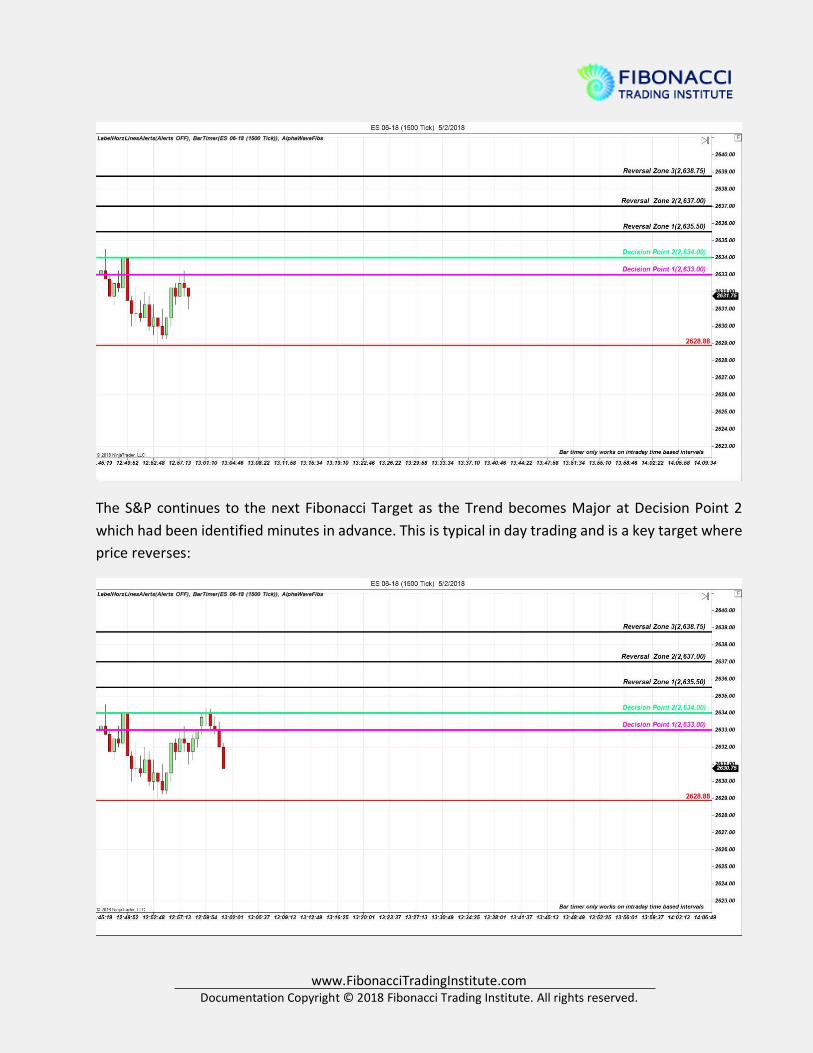
Below is an example of a 1500 tick day trading chart on the S&P E-mini Futures (the most popular
day trading instrument in the US), where price is struggling to break through Key Fibonacci Resistance
at Decision Point 1. This is the key target in a counter trend move as this is the end of the Minor
Trend:
www.FibonacciTradingInstitute.com
Documentation Copyright © 2018 Fibonacci Trading Institute. All rights reserved.
The S&P continues to the next Fibonacci Target as the Trend becomes Major at Decision Point 2
which had been identified minutes in advance. This is typical in day trading and is a key target where
price reverses:
www.FibonacciTradingInstitute.com
Documentation Copyright © 2018 Fibonacci Trading Institute. All rights reserved.
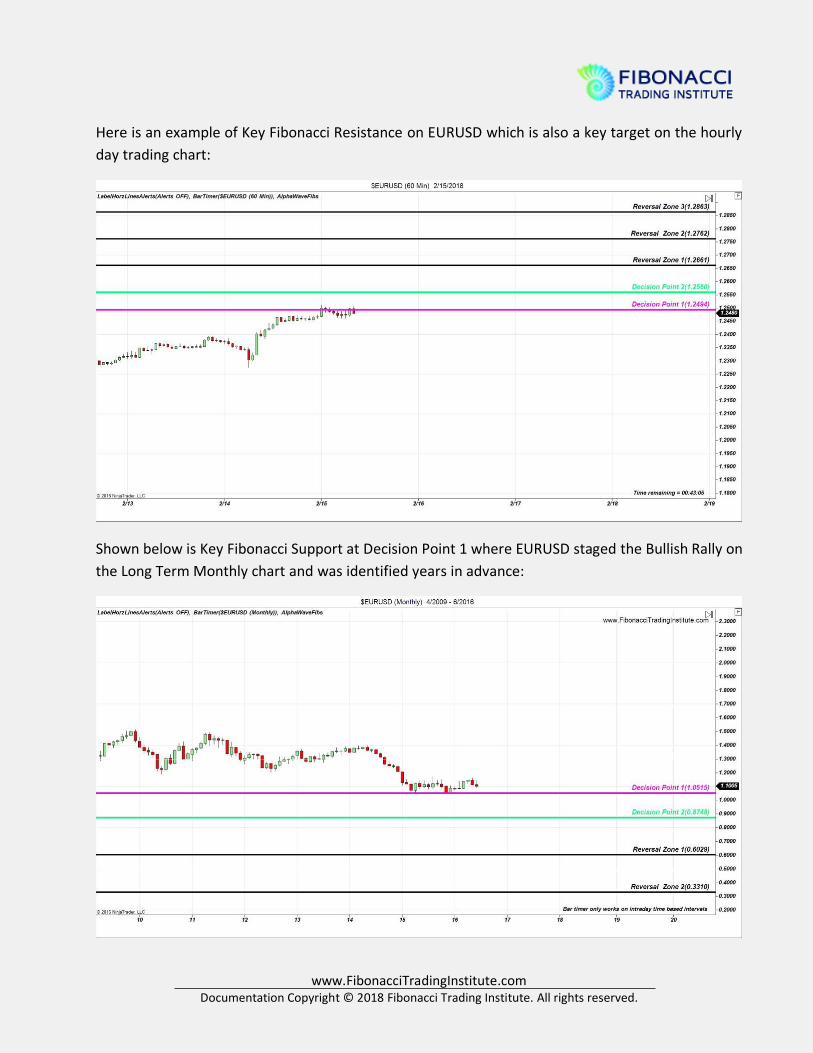
Here is an example of Key Fibonacci Resistance on EURUSD which is also a key target on the hourly
day trading chart:
Shown below is Key Fibonacci Support at Decision Point 1 where EURUSD staged the Bullish Rally on
the Long Term Monthly chart and was identified years in advance:

www.FibonacciTradingInstitute.com
Documentation Copyright © 2018 Fibonacci Trading Institute. All rights reserved.
EURUSD staged a Bullish Rally from Fibonacci Support, from the above chart at 1.05 and reaches
Reversal Zone at 1.24 on the Weekly chart, which is an important addition to Day Trading Positions:
AAPL seen below, is respecting Fibonacci Resistance in the very same way as EURUSD on the Hourly
and Monthly charts despite excellent earnings news:

www.FibonacciTradingInstitute.com
Documentation Copyright © 2018 Fibonacci Trading Institute. All rights reserved.
AAPL collapses to Fibonacci Support Decision Point 1 prior to its earnings announcement:
AAPL stages the Bullish Rally from Fibonacci Support:
www.FibonacciTradingInstitute.com
Documentation Copyright © 2018 Fibonacci Trading Institute. All rights reserved.
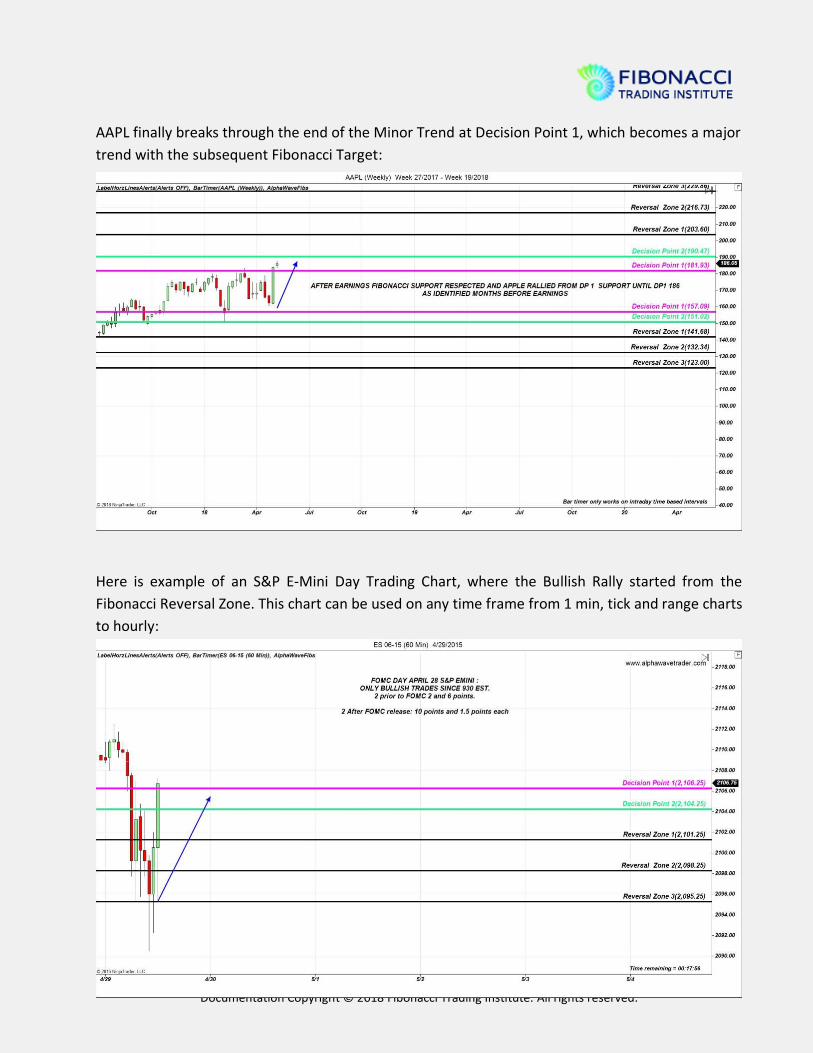
AAPL finally breaks through the end of the Minor Trend at Decision Point 1, which becomes a major
trend with the subsequent Fibonacci Target:
Here is example of an S&P E-Mini Day Trading Chart, where the Bullish Rally started from the
Fibonacci Reversal Zone. This chart can be used on any time frame from 1 min, tick and range charts
to hourly:

www.FibonacciTradingInstitute.com
Documentation Copyright © 2018 Fibonacci Trading Institute. All rights reserved.
This is an example of how a Fibonacci Reversal Zone overrides bullish news on Oil. This chart is used
for day trading entries. Oil news events are always covered in the Trading Room on Wednesdays.
Here is an identical example showing the Fibonacci Reversal Zone on the S&P 1 min. chart, where
the Reversal Zone is the key target and where the trade ends and the market reverses completely:

www.FibonacciTradingInstitute.com
Documentation Copyright © 2018 Fibonacci Trading Institute. All rights reserved.
Gold collapses from the Fibonacci Reversal Zone on the weekly chart, a long-term investment chart.
The exact same Strategy and Fibonacci Method which is applied to any market and any time frame
as demonstrated previously on the S&P E-mini 1 min. and Oil hourly charts:

www.FibonacciTradingInstitute.com
Documentation Copyright © 2018 Fibonacci Trading Institute. All rights reserved.
5.2 Fibonacci Trading Institute Proprietary Method
The naturally predictive capabilities of Fibonacci within the markets is extremely important as it is
one of the few techniques that can identify profit targets, pivots and where reversal areas exist within
a market’s price action and at what precise future price point. The FTI Fibonacci method uses Pure
Price Action for market entry and Fibonacci for exit. This is the key that the method holds from a
beginner trader right through to a hedge fund trader.
The repetitive patterns of price and the determination of their “key reversal” points leaves no room
for trader discrimination. The method is not software based and uses no indicators and as such can
be traded on any platform with basic charting facilities. The Fibonacci Trading Institute method
offers:
• Unparalleled Accuracy
• Proprietary Techniques
• Technical Excellence
• Measurable Success
5.3 Contact Fibonacci Trading Institute
For More Information:
• Listen to what FTI graduates have to say about the course: Click Here
• Learn more about the Fibonacci Method: Click Here
• Join the Fibonacci Mastery Course: Click Here
• View Latest Trades from the E-Mini S&P Futures Trading Room: Click Here
• View the Webinar about the Fibonacci Method: Click Here
• Subscribe to the S&P E-mini Trading Room: Click Here
If you would like to see the accuracy of Fibonacci and the FTI Method in action, then please get in
touch and be welcomed as a guest in the trading room.
Please Contact: Email: [email protected]
Phone: (925) 257-4298
Web: www.FibonacciTradingInstitute.com

www.FibonacciTradingInstitute.com
Documentation Copyright © 2018 Fibonacci Trading Institute. All rights reserved.
Fibonacci Trading Institute and Alla Peters are not an investment advisor and is not registered with the U.S. Securities
and Exchange Commission or the Financial Industry Regulatory Authority. Further, owners, employees, agents or
representatives of Fibonacci Trading Institute are not acting as investment advisors and might not be registered with the
U.S. Securities and Exchange Commission or the Financial Industry Regulatory.
The sender and author of this document makes no representations or warranties concerning the products, practices or
procedures of any company or entity mentioned or recommended in this document, and makes no representations or
warranties concerning said company or entity’s compliance with applicable laws and regulations, including, but not
limited to, regulations promulgated by the SEC or the CFTC. The sender or author of this document may receive a portion
of the proceeds from the sale of any products or services offered by a company or entity mentioned or recommended in
this document. The recipient of this document assumes responsibility for conducting its own due diligence on the
aforementioned company or entity and assumes full responsibility, and releases the sender or author from liability, for
any purchase or order made from any company or entity mentioned or recommended in this document.
The content on any of Fibonacci Trading Institute products or communication is for educational purposes only. Nothing
in its products, services, or communications shall be construed as a solicitation and/or recommendation to buy or sell a
security. Trading stocks, options and other securities involves risk. The risk of loss in trading securities can be substantial.
The risk involved with trading stocks, options and other securities is not suitable for all investors. Prior to buying or selling
an option, an investor must evaluate his/her own personal financial situation and consider all relevant risk factors
The Fibonacci Trading Institute educational training program and software services are provided to improve financial
understanding. The information presented in this site is not intended to be used as the sole basis of any investment
decisions, nor should it be construed as advice designed to meet the investment needs of any particular investor. Nothing
in our research constitutes legal, accounting or tax advice or individually tailored investment advice
Our research is prepared for general circulation and has been prepared without regard to the individual financial
circumstances and objectives of persons who receive or obtain access to it. Our research is based on sources that we
believe to be reliable. However, we do not make any representation or warranty, expressed or implied, as to the accuracy
of our research, the completeness, or correctness or make any guarantee or other promise as to any results that may be
obtained from using our research. To the maximum extent permitted by law, neither we, any of our affiliates, nor any
other person, shall have any liability whatsoever to any person for any loss or expense, whether direct, indirect,
consequential, incidental or otherwise, arising from or relating in any way to any use of or reliance on our research or
the information contained therein. Some discussions contain forward looking statements which are based on current
expectations and differences can be expected.
All of our research, including the estimates, opinions and information contained therein, reflects our judgment as of the
publication or other dissemination date of the research and is subject to change without notice. Further, we expressly
disclaim any responsibility to update such research. Investing involves substantial risk. Past performance is not a
guarantee of future results, and a loss of original capital may occur. No one receiving or accessing our research should
make any investment decision without first consulting his or her own personal financial advisor and conducting his or
her own research and due diligence, including carefully reviewing any applicable prospectuses, press releases, reports
and other public filings of the issuer of any securities being considered. None of the information presented should be
construed as an offer to sell or buy any particular security. As always, use your best judgment when investing
Past performance is no guarantee of future performance. This product is for educational purposes only. Practical
application of the products herein are at your own risk and Fibonacci Trading Institute its partners, representatives and
employees assume no responsibility or liability for any use or miss-use of the product. Please contact your financial
advisor for specific financial advice tailored to your personal circumstances. Any trades shown are hypothetical example
and do not represent actual trades. Actual results may differ. Nothing here in constitutes a recommendation respecting
the particular security illustrated.


![[Trading] Fibonacci Trader Gann Swing Chartist Dynamic Fibonacci Channels](https://static.fdocuments.us/doc/165x107/55cf9d87550346d033ae02c7/trading-fibonacci-trader-gann-swing-chartist-dynamic-fibonacci-channels.jpg)