How European malls evolve in a connected world · the consumption behavior and expectations of...
36
How European malls evolve in a connected world Bricks and clicks November 2018
Transcript of How European malls evolve in a connected world · the consumption behavior and expectations of...

How European malls evolve in a connected world
Bricks and clicks
November 2018
November 2018Strategy& | PwC November 2018Strategy& | PwC
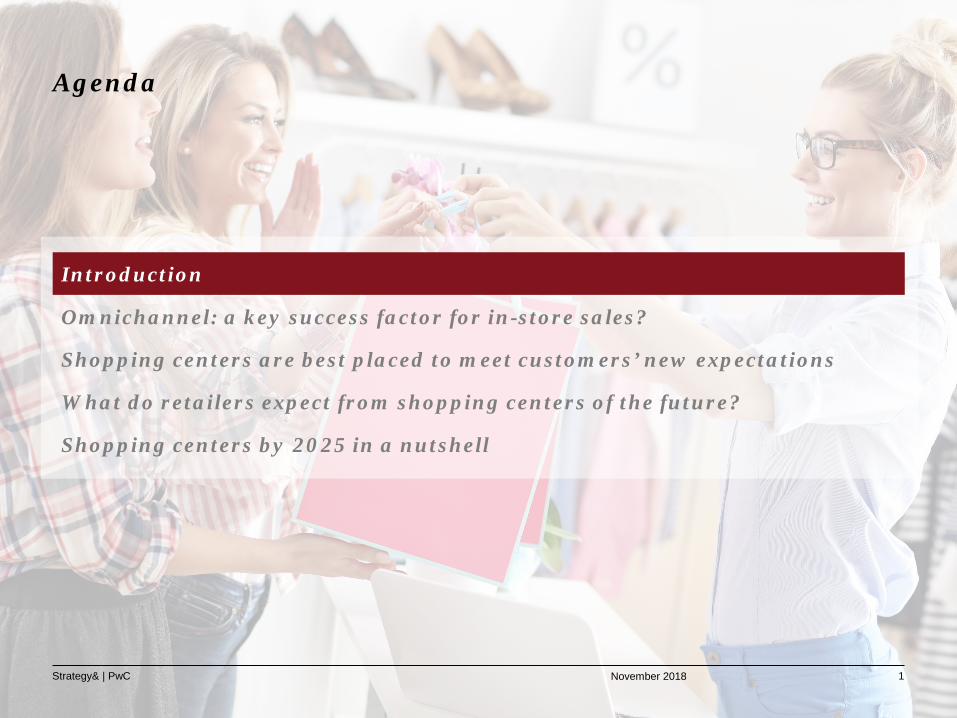
Agenda
Introduction
Omnichannel: a key success factor for in-store sales?
Shopping centers are best placed to meet customers’ new expectations
What do retailers expect from shopping centers of the future?
Shopping centers by 2025 in a nutshell
1

November 2018Strategy& | PwC
Retail trends dictated by customers and retailers are reshaping the shopping centers of tomorrow
2
Key trends and expectations from customers and retailers
Source: Strategy& Analysis
• Convenience, simplicity and fluidity• Compelling shopping experience• Sense of belonging to a community• New brand demand• Retailtainment• Social and environmental responsibility
• Channel integration & Logistics• Marketing & traffic generation• New store format• Data analytics• HR, CSR• Security & safety
Customers are seeking convenience and a differentiated experience
Retailers are expecting to share with a more integrated business model shopping centers

November 2018Strategy& | PwC
The study is supported by 3 methodological pillars covering 14 retail market countries across Europe
3
Notes: (1) Countries included in the customer survey: France, Italy, Spain, Portugal, Norway, Sweden, Denmark(2) Gross leasable area
Source: Strategy& Analysis
Customer survey1,890 respondents across Europe(1)
Interviews with retailersIn-depth interviews with 33 representative retailers, covering all market segments: personal supplies, household equipment, food, gifts/culture/leisure, health & beauty
Market researchSector sales, GLA(2) and sales by segment in 14 countries across Europe
Geographical scopeMethodological pillars

November 2018Strategy& | PwC
The present study stands out through 4 main elements
4
Clients at the heart of the study
• 1,890 end customers surveyed across Europe, with customer profiles well distributed within the countries and age categories
• Focus on the consumption behavior and expectations of millennials• In-depth interviews with 33 representative retailers, covering all market segments
A large scope• All market segments: personal supplies, household equipment, food, gifts/culture/leisure, health & beauty
• 14 major retail market countries in Europe
An omnichannel maturity analysis
• Detailed benchmark of the level of omnichannel maturity(1) compared to sales performance per country
A high level of granularity
• A precise analysis of retail sales by retail sector and sub-sector• A comparison between shopping centers and other bricks & mortar locations• An analysis of new services expected by customers and retailers• Focus on their expectations related to social and environmental concerns
Note: (1) Omnichannel maturity: in-store/digital integration in terms of distribution and marketing

November 2018Strategy& | PwC November 2018Strategy& | PwC
Agenda
5
Introduction
Omnichannel: a key success factor for in-store sales?
Shopping centers are best placed to meet customers’ new expectations
What do retailers expect from shopping centers of the future?
Shopping centers by 2025 in a nutshell

November 2018Strategy& | PwC
Over the last 100 years, the rise of technology has led to better informed, more demanding, hyper-connected customers...
6
1790Late
1700s -1940
1930 1960 1970 1990 2000 2005 2010 2025
Department store
General store
Supermarket Discount store
Loyalty/ member store
Pop-up store
Rise ofe-commerce
Rise of mobile/social
Rise of cloud Connected store
Manufacturers in control Retailers in control Customers in control
Rise of multichannel
Mass production technologies E-commerce technologies
Personalization technologies
• IoT• AI• Machine learning• VR• Beacons, etc.
• Internet• Mobile• Targeted advertising
• Mechanization• Electronics and information technology• Automation
• Seamless• Digital• Customer
focused• Experiential• Interactive
Hyper-connected customer
Better informed, more demanding customer
Source: Strategy& Analysis

November 2018Strategy& | PwC
… changing the standards of shopping
7
ExperienceCustomized and pleasant offer, service and experience by breaking existing silos
UniqueUnpredictable, emotional and apparently
irrational with shifting tastes
InformedInstant access to more information
and choice
ConnectedHyper-connected customers following
the digital revolution
Transparency/TrustSustainable trust driven by transparency on products and prices
Seamless/OmnichannelEasy access to services from any channel
New characteristics New expectations
ImmediacyDesire of immediate and quick consumption
ImpatientImpulsive and impatient customers
in permanent renewal
Source: Strategy& Analysis

November 2018Strategy& | PwC
Despite increasingly connected customers, online sales still account for only 6% of total sales
8
Notes: (1) Excluding the following: Cinemas, Vehicles, Optics for Norway, Germany, Netherlands, Belgium, Poland, Czech Republic, Hungary and Turkey, Restaurants for Turkey Including VAT and inflation
(2) CAGR: Compound Annual Growth Rate(3) ~45% on average (estimate)(4) Of which ~25% accounted for by Amazon
Sources: Euromonitor, Global Data, Statista, Strategy& Analysis
2010-17 CAGR(2)
6%
2017
2,4775%
2010
2,553
97% 95%
2015
94% In-store
Online2,3323%
+1.3%
Breakdown of total retail sales(1) between online and in-store sales(€bn; %; % growth p.a.; 2010-17; geographical scope of the study)
+13.8%
+0.8%
Omni-channel(3)
Pure players(4)
57% 43%54% 46%33% 67%27% 73%
Total

November 2018Strategy& | PwC
Sales performance depends on several factors (marketing, market trends,
geographical location, etc.); hence a wide distribution in terms of digital
maturity among mid-growth retailers
Over the past 4 years, investment in omnichannel capabilities has been a key component of success
9
Dig
ital m
atur
ity(1
)
Sales performance(2014-17; % growth p.a.)
Notes: (1) See appendix for the list and definition of the criteria (2) Where 2014-2017 data were not available, growth was calculated over a 2014-2016 or 2015-2017 period (3 retailers)(3) Retailers operating at least in Europe(4) As LVMH does not communicate on Sephora’s revenues, data sourced from press estimations
Sources: Annual reports, Press review, Strategy& Analysis
Comparison of digital maturity with sales performance(Qualitative assessment of digital maturity(1); % growth p.a.(2); sample of 26 retailers(3))
Personal supplies
Health & beauty(4)
Gift/culture/leisureHousehold equipment
5,000
Legend
Revenue (€m, World)
Hig
hM
oder
ate
Low
CAGR < 1% 1% < CAGR < 9% CAGR > 9%

November 2018Strategy& | PwC
51%
A significant portion of consumers wants the best of both worlds for each retail segment
10
59% 51% 50%38%
7%9% 9%
14%
34% 40% 42% 47%
In-store
Personal supplies Health & beauty
In-store+
Online
Online
Culture, gifts, leisure
Preference for their shopping venues, by type of goods(% of people; sample of 1,890 respondents(1))
Questions asked to respondents: “Where do you shop for the following goods?” (MCQ) and “When you go to a shopping center, which type of stores do you visit?”Notes: (1) Data were weighted by age group. (2) Household equipment excludes automotive equipment.Source: Strategy& Analysis
x%Percentage of people visiting always or frequently this type of store
61%
60%
39%
24%
35%
38% 47%
39%
54%51%
39%
37%
26%
41%
8%
Overall
Household equipment (2)

November 2018Strategy& | PwC
The role of stores remains highly valued, especially by millennials …
11
“No online shop can match the experience of having a potential purchase in your hands, and of examining it”
Man, 52 y-o, Denmark
Top 5 reasons to shop in stores(Based on the answers of 1,890 respondents)
Question asked to respondents: “For what reason do you buy in stores rather than buying on the Internet?”Note: Data were weighted by age groupSource: Strategy& Analysis
“Touch, try on and see the products”
“Have the product immediately”
“More practical”
“More reliable”
“No delivery cost”
#2
#3
#4
#5
#1 #1
#2
#3
#5
#4
Millennials are more sensitive to delivery price than other generations
MillennialsAll
64% 61%
12% 14%
8% 9%
7% 6%
6% 7%

November 2018Strategy& | PwC
… for online shopping still cannot convey the same experience; an opportunity for shopping centers
12
Main obstacles preventing customers from shopping online
Question asked to respondents: “Why have you not made your product purchases online?”Sources: PwC study “Total Retail Survey 2017” (7,667 respondents in Belgium, Denmark, France, Germany, Hungary, Italy, Poland, Spain, Sweden)
Strategy& Analysis
“I need to see and touch the product before buying”
“I prefer the in-store experience with a sales assistant”
“The lack of security of websites”
“I am concerned over delivery options”
Ability of online players to overcome the following
obstacles
Low ability High ability
Possible improvements
• Cultural change/technological improvement to make people trust website security
• Lockers, convenient pick-up locations• Quicker deliveries• No delivery and return costs
• Chatbots to provide information or technical advice
• None Customer experience, a weak point of online shopping, could be a key opportunity for shopping centers
@

November 2018Strategy& | PwC
From 2010 to 2017, bricks & mortar sales have continuously increased (+5%)
13
102
2016
101
2014
103
2013
105
106
2017100
2015
104
20122010 2011
+5%
In-store retail sales(1) trend(Basis 100 = 2010; 2010-17; geographical scope of the study)
Notes: (1) Excluding the following: Cinemas, Vehicles, Optics for Norway, Germany, Netherlands, Belgium, Poland, Czech Republic, Hungary and Turkey, Restaurants for Turkey. Including VAT and inflation
(2) Daily or weekly(3) “PwC Global Consumer Insights Trends over time” (March 2018) in the following countries: Belgium, France, Germany, Italy, Poland, Spain
Sources: Global Data, Statista, PwC Global Consumer Insights Trends over time (March 2018), Strategy& Analysis
After a slight decrease, the share of people frequently(2)
visiting stores gained 8 pts(3)
over the 2014-17 period
20172014
39.6%47.4%
+7.8 pts
Share of people frequently(2)
shopping in stores (%; 2010-17)

November 2018Strategy& | PwC
Today, more than half of consumers go shopping at least once a week
14
Frequency of shopping sessions by country(% of people; sample of 1,890 respondents)
52%61% 59% 56% 53% 50% 48%
35%
19%
14% 18%16% 19% 22% 20%
22%
11%12% 9%
9% 8% 14%14%
12%
10%6% 9%
11% 13%9% 10%
16%
8% 6% 5% 9% 7% 7% 8%15%
DenmarkTotal
At least oncea week
At least twicea month
At least oncea month
At least 3 timesa month
Less thanonce a month
FranceSweden Italy PortugalNorwaySpain
Question asked to respondents: “How often do you go shopping?”Note: Data were weighted by age group.Source: Strategy& Analysis.
• On average, more than half of the population (52%) go shopping at least once a week
• The Danes are the most frequent consumers, with more than 60% of the population shopping at least once a week
• French people are the least frequent shoppers, with 35% of the population shopping at least once a week

November 2018Strategy& | PwC November 2018Strategy& | PwC
Agenda
15
Introduction
Omnichannel: a key success factor for in-store sales?
Shopping centers are best placed to meet customers’ new expectations
What do retailers expect from shopping centers of the future?
Shopping centers by 2025 in a nutshell

November 2018Strategy& | PwC
+2.6%+0.1%
+1.2%-0.3%
+0.9%-0.9%
+2.7%-1.3%
+5.8%+1.0%
+2.7%+0.7%
+2.1%-1.0%
+2.8%+0.0%
+5.4%+0.9%
+4.6%+0.4%
+5.1%+1.7%
+3.3%+0.5%
+5.3%+0.5%
+31.2%-1.0%
From 2010 to 2016, sales growth in shopping centers has outperformed other retail locations’
16
Shopping center sales growth compared to other physical formats of distribution(€bn; % growth p.a.; 2010-16(1); geographical scope of the study)
Notes: (1) Shopping center retail sales figures were unavailable for 2017.(2) Includes high street, retail parks, outlets.
Sources: ICSC, Euromonitor, Global Data, Statista, Strategy& Analysis.
Shopping centers’ sales growth (% CAGR)In-store (excl. shopping centers) sales growth (% CAGR)
Legend
Shopping centers
Other retail locations(2)
+4.5%
-0.1%

November 2018Strategy& | PwC
Shopping centers are the #1 shopping option in all countries
17
37%
48%
42%
40%
35%
34%
33%
28%
21%
19%
24%
20%
18%
27%
18%
23%
8%
12%
9%
6%
13%
8%
8%
10%
10%
10%
6%
9%
10%
8%
19%
23%
11%
16%
27%
25%
22%
32%
28%
High street Retail park
Denmark
France
InternetShopping centers
Sweden
Outlet
2%
Total
Portugal
Norway
Italy
Spain
Preferred shopping locations by country(% of people; sample of 1,890 respondents)
Question asked to respondents: “Rank these shopping locations in order of preference?”Note: Data were weighted by age group.Source: Strategy& Analysis.
Shopping centers are the
preferred shopping place
for almost half of the Portuguese
population
French and Swedish people
are as comfortable with
shopping centers as
Internet shopping
Norway
96%4%
Sweden
Portugal
Spain
France
Italy
Denmark
3%
5%
97%
95% Total
9% 91%
Physical
7%
3%
93%
97%
8% 92%
Online
93%7%
Breakdown of physical and online sales (%; 2017)
The share of online sales is much lower than the proportion of people placing the Internet as their favorite place of shopping.
Indeed, people make lower value purchases online.

November 2018Strategy& | PwC
(1) Excluding undetermined answersQuestions asked to respondents: "Rank these shopping locations in order of preference” and “Do you see the shopping center as a place…”Note: Data were weighted by age group.Source: Strategy& Analysis.
Shopping centers are the preferred shopping locations for 37% of consumers, thanks to qualitative and diversified offers
18
High street
Retail park
Internet
Shopping centers
10%
23%
Outlet
37%
Total
21%
8%
Preferred shopping locations(% of people; sample of 1,890 respondents)
Qualitative stores
Diversified offer
Time-saving
Good deals
Trendy & modern
Contributing to the economic development of the area
Perception of shopping centers(% of people; sample of 1,890 respondents(1))
76%
75%
71%
70%
66%
65%

November 2018Strategy& | PwC
52%
Over the last few years, the perception of shopping centers has even improved, especially among the millennial population
19
Trend in the perception of shopping centers over the last few years(% of people; sample of 1,890 respondents)
13% 16%
39%40%
40% 37%
6%6%1% Very negatively
Unchanged
Negatively
Very positively
MillennialsAverage population
Positively
1%
Question asked to respondents: “Over the last few years, how has your perception of shopping centers has evolved?”Note: Data were weighted by age group.Source: Strategy& Analysis.
• 52% of the population perceive shopping centers more positively (56% of millennials)
• For only 7% of the population, the perception has deteriorated over the last few years
• Millennials' perception of shopping centers has evolved more positively than the average population
Millennials focus

November 2018Strategy& | PwC
To keep on outperforming, malls must adapt their offer to customers’ expectations, especially for millennials
20
Offers that shopping centers need to prioritize according to customers(Based on customer survey; sample of 1,890 respondents)
Questions asked to respondents: “Do you expect your shopping center to… ?” and “For you, what should shopping centers do in order to attract more people?”Note: (1) Gap in excess of 5 percentage points between the share of the total population that is attracted by the offer and the share of millennials attracted by the offer.Source: Strategy& Analysis.
Places where people can meet
Events (concerts, exhibitions, etc.)
Food
Leisure Health/wellness Beauty/cosmetics
Regularly changing offer/pop-up stores
New brands for customers to discover
Brands that offer responsible products
New services
New retailers
Higher expectations from millennials(1)New
products
Services that make life easier
Zoom next slides
Zoom next slides

November 2018Strategy& | PwC
Customers who want to spend more time on leisure activities say they will increase their attendance at shopping centers
21
Remain stable
Other locations
21%
65%
24%
Shopping centers
66%
Total in-store
Increase22%
66%
Trend in attendance by type of location(% of people; sample of 1,890 respondents)
Question asked to respondents: “In the next 5 years, do you think your attendance at these shopping venues is going to … ?” Note: Data were weighted by age group.Source: Strategy& Analysis.
86%90%88%Profile• 48% of this population are
millennials
Top 3 offer expectations
Leisure (cinema, catering, events, exhibitions)
Areas more pleasant and comfortable to spend time in
Services that make life easier
Zoom on people who will increase their attendance
at shopping centers

November 2018Strategy& | PwC
Since 2014, customers increased the share of leisure in their total budget, mostly to spend time with friends and family
22
Final consumption expenditure of households by consumption purpose(2014 = Basis 100; 2000-17; geographical scope of the study excl. Turkey)
Notes: (1) Total excluding housing, water, electricity, gas and other fuels(2) 2017 estimate for the following countries: Belgium, Germany, Spain, Italy, Hungary, Poland, Norway.
Sources: Eurostat, PwC study “Total Retail Survey 2017”, Strategy& Analysis.
110
115
105
90
95
100
80
85
2007 20152009 2010 2011 20122008 20162006 20142013 2017
100
Total(1)
Restaurants & hotels
Recreation & culture
• Leisure activities have increased faster than other expenditures, meaning customers tend to allocate an increasing share of their budget to leisure activities
• In 2017, 23% of customers declared their retail spending increased over the last 12 months (56% spent the same)(2)
• 43% of customers said they increased their retail spending to spend time with friends and family
2014-17 growth
+23%
+13%+12%
November 2018Strategy& | PwC
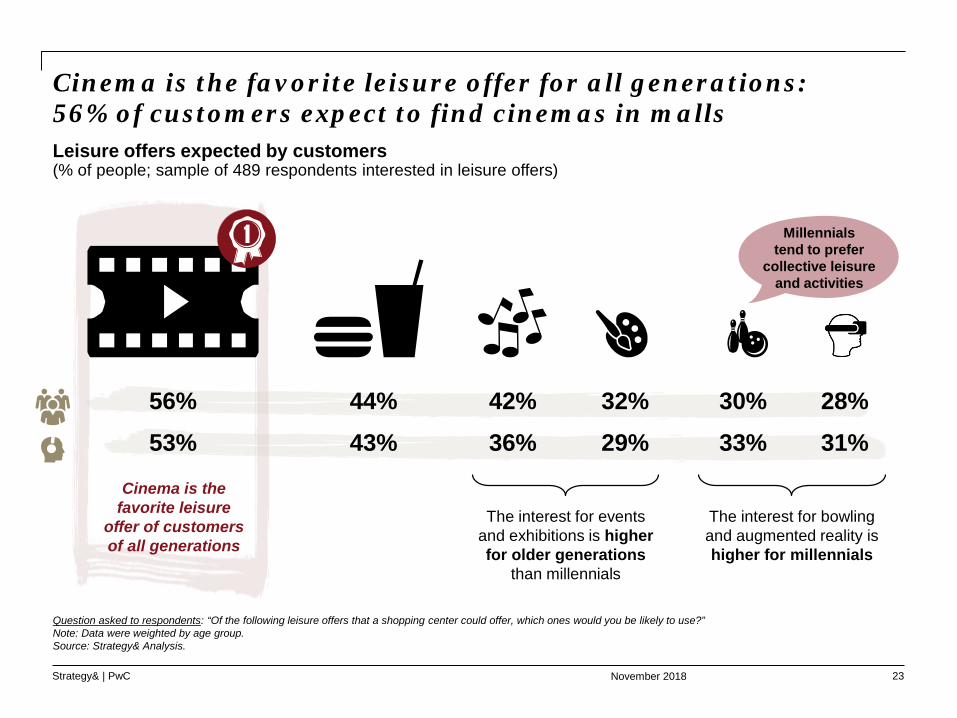
Cinema is the favorite leisure offer for all generations:56% of customers expect to find cinemas in malls
23
Leisure offers expected by customers(% of people; sample of 489 respondents interested in leisure offers)
Question asked to respondents: “Of the following leisure offers that a shopping center could offer, which ones would you be likely to use?”Note: Data were weighted by age group.Source: Strategy& Analysis.
The interest for events and exhibitions is higher for older generations
than millennials
The interest for bowling and augmented reality is higher for millennials
Cinema is the favorite leisure
offer of customers of all generations
56%53%
44%43%
42%36%
32%29%
30%33%
28%31%
Millennials tend to prefer
collective leisure and activities

November 2018Strategy& | PwC
Facilitated information search
Seamless pick-up
Bonding experience
Reduced frustrations
Customers expect services that make their lives easier to be mostly accessible on connected devices
24
Services that a shopping center could offer to make customers’ lives easier(Based on customer survey; sample of 1,890 respondents)
Question asked to respondents: “Among the services that a shopping center could offer, which ones would you be likely to use?”(Rank from 0 to 10, 0 = no interest, 10 = very strong interest)
Source: Strategy& Analysis.
@ •Access to an aggregated catalog of all the retailers
•Easily locate (GPS type):- a store in a shopping center- an item in a store
•Pay all the purchases at one time
•Click & collect, including using a device in stores
•Be informed in real time of the waiting time at the cash desk
•Receive personalized promotions
•Be informed of the availability of a product and book it
•Access to a counter dedicated to the returns of online orders
•Easily find my car in the car park
• Interact with a customer service before, during, after the visit

November 2018Strategy& | PwC
SEPHORA
Connected devices complete and support the role of retail sales assistants
25
Questions asked to respondents: “A modern store for you is a store that ...?“ and “Does it make you want to go?”Note: Data were weighted by age group/Sources: Press review, Strategy& Analysis.
Conception of a modern store(% of people; sample of 1,890 respondents)
66%
62%
67%
• 100% of products equipped with RFID• VR deployed in 30 stores• Augmented reality application• Scan application
• Products equipped with RFID enabling contactless access to product information
• In fitting rooms, a touch screen with a button allowing to request a different size and a self check-out
• Digital terminals to order products• Connected mirrors enable people to test
make-up • Phone-charging stations
Examples of stores using connected devices
propose services on tablets or smartphones
% of the population think that a modern store should…
have screens displaying content
equip vendors with tablets
In-store connected devices make the store interactive and provide a “phygital” customer experienceThey increase selling opportunities for sales assistants
Customers draw a parallelbetween connected devices and a better
shopping journey as they solve their main pain points (lack of information, availability of
a product, waiting time, etc.)
55% of customers see digital devices as a key driver of their visit to a mall
ZARA
DECATHLON

November 2018Strategy& | PwC November 2018Strategy& | PwC
Agenda
26
Introduction
Omnichannel: a key success factor for in-store sales?
Shopping centers are best placed to meet customers’ new expectations
What do retailers expect from shopping centers of the future?
Shopping centers by 2025 in a nutshell

November 2018Strategy& | PwC
Shopping centers combine many competitive edges according to retailers...
27
Shopping center strengths against high street locations
Traffic density• Communication outside the mall• Accessibility for all customers
(incl. disabled or aged people)
Ability to create marketing events• Communication when
opening a store• Invitation of influencers
Flexible retail spaces• Possibility to increase/reduce
the size of the location• Modular partition
Pooling of services• Synergies regarding maintenance, parking, etc.• Potential to develop a single counter for click & collect
and other services for customers• Potential to develop services for employees
Safer spaces• Security staff• Security equipment
Sources: Colliers InternationalStrategy&’s interviews with 33 retailer brands
Diversified offer• Well known brands driving traffic• Complementary brands• New brands customers want to discover

November 2018Strategy& | PwC
… and address retailers’ expectations for the future
28
• Financial synergies to develop new innovative store formats
• Flexible retail space in high-demand periods
• Longer opening hours
Store and sales optimization
Marketing Operational solutions and cost management
Environmental and social engagement and security
• Marketing events• Communication on store
openings• Marketing meetings between
the retailer and the lessor• Sharing of customer data
• Support on logistics issues• Shared service pooling• Reactivity in case of claims• Flexibility in rent payments
• Integration of long-term environmental issues
• Services for employees: childcare, concierge service, relaxing areas, green areas, catering offer, convenient parking
• Availability of local temporary workers and centralization of recruitment (e.g., for summer jobs)
• Security
“In cities we have a high turnover rate, so our employees will expect more practical aspects such as
childcare, concierge services”
“For example over the Christmas period, we would like to have more storage space, and the shopping center could make a pop-up kiosk
available in front of the store”
“A database would be appreciated: we could get more information about people, ability to target them more
aggressively, identify people that come to the shopping center without visiting our store and then contact them
with a discovery offer. It would bring high value”
Sources: Interviews with key market players, Strategy& Analysis.
Retailers’ expectations 60% of millennials would accept to share their data in order to receive personalized offers
“Shopping centers must adapt to people’s new expectations, by
transforming the format of stores”

November 2018Strategy& | PwC November 2018Strategy& | PwC
Agenda
29
Introduction
Omnichannel: a key success factor for in-store sales?
Shopping centers are best placed to meet customers’ new expectations
What do retailers expect from shopping centers of the future?
Shopping centers by 2025 in a nutshell

November 2018Strategy& | PwC
Consumers and retailers are increasingly concerned by the environmental and societal impact of shopping centers
30
Questions asked to respondents: “Would the commitment of shopping centers in the following actions make you more likely to visit them?” “Would you spend more on a ‘responsible’ product?”
Note: Data were weighted by age group.Sources: Interviews with key market players, Strategy& Analysis.
Childcare
Relaxing areas Concierge services
Food areas Parking
Consumer expectations Retailer expectations
Aspiration for employee wellness
Concerns about environmental issues
“We would be interested in working more with shopping centers on the reduction of carbon footprint, recycling, waste management and
energy efficiency”Sport furniture, Beauty & Cosmetics
Preference for responsible products
74% of customers declared they would be more likely to visit a shopping center if it supported the local economy
65% of customers are likely to spend more on responsible products (69% for millennials)
Willingness to support the local economy
Concerns about environmental issues
77% of customers declared they would be more likely to visit a shopping center if it limited its environmental impact

November 2018Strategy& | PwC
According to retailers, shopping centers have to be “life centers”, as if they were city centers
31
“People must find everything that can be found in a city center: a post office, a cinema, outdoor
and green areas, restaurants and leisure offers such as an escape game or laser game”
Beauty & cosmetics“It would be a mini town,
where there may be offices, a school, a nursery, doctorsand much more leisure, with much more diversity of uses”
Clothing & footwear
Retailer conception of future shopping centers “A place where you can do everything you want: experience, meet friends, work, do shopping,
socialize, enjoy entertainment, eat food… It will be the right place, the meeting point. And we have to be sure that everybody can find what they are
looking for”Sportswear
Sources: Interviews with key market players, Strategy& Analysis
“The challenge for the shopping center would be to propose an entire energy-
sufficient shopping center with renewable energy, with more green
areas”Sportswear
“It should be possible for people to visit the mall just to take a stroll, to
take their time. If they feel good, they will stay longer and therefore
consume more in catering”Food & drink

November 2018Strategy& | PwC
Customers’ and retailers’ expectations are expected to structure shopping centers by 2025 – 3 megatrends
32
Shopping centers = city centers Increasingly connected and seamless shopping
Rising environmental and societal considerations
• Restaurants
• Entertainment offer
• Health/wellness services
• Meeting areas where visitors can meet friends and family and socialize
• Personalized marketing using customer data
• Digital services fully part of the customer journey (online booking of articles, location of items or stores, etc.)
• Omnichannel supported by the shopping center (counter for returns of online orders, click & collect, etc.)
• Energy-sufficient and environment-friendly shopping centers (use of self-produced green electricity, green vehicles, green areas, waste management, etc.)
• Responsible products either from an environmental or a societal point of view
• Local life (local recruitment, local products, etc.)
Source: Strategy& Analysis
Evolving offer Evolving sales channels Evolving environmental impact

November 2018Strategy& | PwC
Appendix
33

November 2018Strategy& | PwC
We included 8 criteria in the digital maturity assessment
34
e-commerce platform
Click & collect
Quick home delivery
Connected stores
RFID
Voice commerce
Social commerce
Augmented/virtual reality
The digital maturity of retailers was assessed according to the following qualitative criteria
Presence of an online sales website where customers can buy or book products
Ability to buy a product online and collect it in store
Home delivery in a few hours
Presence of digital services in the store: mobile payment, digital tablets, IoT, etc.
Products equipped with RFID chips to enable a fully connected purchases: information about products, quick payment, etc.
Ability to buy a product with a home assistant, via voice recognition technology
Functionality to drive purchases via social media
Augmented/virtual reality technology to enrich the customer’s experience
Source: Strategy& Analysis

November 2018Strategy& | PwC 35
© 2018 PwC. All rights reserved.
PwC refers to the PwC network and/or one or more of its member firms, each of which is a separate legal entity. Please see www.pwc.com/structure for further details.
This content is general information purposes only, and should not be used as a substitute for consultation with professional advisors.
Jean-Baptiste [email protected]
Contacts
Pascal [email protected]
Vladislava [email protected]