How ecosystem services knowledge and values influence ...
17
HAL Id: hal-01122170 https://hal.archives-ouvertes.fr/hal-01122170 Submitted on 3 Mar 2015 HAL is a multi-disciplinary open access archive for the deposit and dissemination of sci- entific research documents, whether they are pub- lished or not. The documents may come from teaching and research institutions in France or abroad, or from public or private research centers. L’archive ouverte pluridisciplinaire HAL, est destinée au dépôt et à la diffusion de documents scientifiques de niveau recherche, publiés ou non, émanant des établissements d’enseignement et de recherche français ou étrangers, des laboratoires publics ou privés. How ecosystem services knowledge and values influence farmers’ decision-making P. Lamarque, P. Meyfroidt, B. Nettier, S. Lavorel To cite this version: P. Lamarque, P. Meyfroidt, B. Nettier, S. Lavorel. How ecosystem services knowledge and values influ- ence farmers’ decision-making. PLoS ONE, Public Library of Science, 2014, 9 (9), 16 p. 10.1371/jour- nal.pone.0107572. hal-01122170
Transcript of How ecosystem services knowledge and values influence ...

HAL Id: hal-01122170https://hal.archives-ouvertes.fr/hal-01122170
Submitted on 3 Mar 2015
HAL is a multi-disciplinary open accessarchive for the deposit and dissemination of sci-entific research documents, whether they are pub-lished or not. The documents may come fromteaching and research institutions in France orabroad, or from public or private research centers.
L’archive ouverte pluridisciplinaire HAL, estdestinée au dépôt et à la diffusion de documentsscientifiques de niveau recherche, publiés ou non,émanant des établissements d’enseignement et derecherche français ou étrangers, des laboratoirespublics ou privés.
How ecosystem services knowledge and values influencefarmers’ decision-making
P. Lamarque, P. Meyfroidt, B. Nettier, S. Lavorel
To cite this version:P. Lamarque, P. Meyfroidt, B. Nettier, S. Lavorel. How ecosystem services knowledge and values influ-ence farmers’ decision-making. PLoS ONE, Public Library of Science, 2014, 9 (9), 16 p. �10.1371/jour-nal.pone.0107572�. �hal-01122170�
How Ecosystem Services Knowledge and ValuesInfluence Farmers’ Decision-MakingPenelope Lamarque1*, Patrick Meyfroidt2,3, Baptiste Nettier4, Sandra Lavorel1
1 Laboratoire d’Ecologie Alpine, Unite Mixte de recherche 5553, Centre National de la Recherche Scientifique, Universite Joseph Fourier, Grenoble, France, 2 Fonds de la
recherche scientifique (F.R.S.-FNRS), Louvain-La-Neuve, Belgium, 3 Earth and Life Institute, Georges Lemaıtre Centre for Earth and Climate Research, University of Louvain,
Louvain-la-Neuve, Belgium, 4 Irstea centre de Grenoble, unite de recherche Developpement des territoires montagnards, Grenoble, France
Abstract
The ecosystem services (ES) concept has emerged and spread widely recently, to enhance the importance of preservingecosystems through global change in order to maintain their benefits for human well-being. Numerous studies considervarious dimensions of the interactions between ecosystems and land use via ES, but integrated research addressing thecomplete feedback loop between biodiversity, ES and land use has remained mostly theoretical. Few studies considerfeedbacks from ecosystems to land use systems through ES, exploring how ES are taken into account in land managementdecisions. To fill this gap, we carried out a role-playing game to explore how ES cognition mediates feedbacks fromenvironmental change on farmers’ behaviors in a mountain grassland system. On a close to real landscape game board,farmers were faced with changes in ES under climatic and socio-economic scenarios and prompted to plan for the futureand to take land management decisions as they deemed necessary. The outcomes of role-playing game werecomplemented with additional agronomic and ecological data from interviews and fieldwork. The effects of changes in ESon decision were mainly direct, i.e. not affecting knowledge and values, when they constituted situations with whichfarmers were accustomed. For example, a reduction of forage quantity following droughts led farmers to shift from mowingto grazing. Sometimes, ES cognitions were affected by ES changes or by external factors, leading to an indirect feedback.This happened when fertilization was stopped after farmers learned that it was inefficient in a drought context. Farmers’behaviors did not always reflect their attitudes towards ES because other factors including topographic constraints, socialvalue of farming or farmer individual and household characteristics also influenced land-management decisions. Thoseresults demonstrated the interest to take into account the complete feedback loop between ES and land managementdecisions to favor more sustainable ES management.
Citation: Lamarque P, Meyfroidt P, Nettier B, Lavorel S (2014) How Ecosystem Services Knowledge and Values Influence Farmers’ Decision-Making. PLoS ONE 9(9):e107572. doi:10.1371/journal.pone.0107572
Editor: Kurt O. Reinhart, USDA-ARS, United States of America
Received December 19, 2013; Accepted August 19, 2014; Published September 30, 2014
Copyright: � 2014 Lamarque et al. This is an open-access article distributed under the terms of the Creative Commons Attribution License, which permitsunrestricted use, distribution, and reproduction in any medium, provided the original author and source are credited.
Funding: This work was funded by the Agence National de la Recherche through the FP6 BiodivERsA Eranet VITAL project and by the French Ministry responsiblefor environment through the GICC-2 SECALP project. The funders had no role in study design, data collection and analysis, decision to publish, or preparation ofthe manuscript.
Competing Interests: The authors have declared that no competing interests exist.
* Email: [email protected]
Introduction
Assessing the consequences of ecosystem change on ecosystem
services (ES), defined as the outputs of ecosystems [1] from which
people derive benefits, is of primary importance. In agro-
ecosystems, flows of ES are directly affected by farmers’ behaviors
and land management decisions [2]. ES stress the need to integrate
ecological and social science to study coupled human and natural
systems [3], and therefore require to explicitly address the complex
feedback loops formed by reciprocal interactions between people
and nature [4]. These feedbacks depend on how changes in
management affect ES and how, in turn, these changes in ES are
perceived by land managers [5]. Nevertheless, while numerous
studies consider various dimensions of the interactions between
ecosystems and land use via ES, integrated research addressing the
complete feedback loop between biodiversity, ES and land use has
remained mostly theoretical. Most published frameworks (e.g.,
[6,7]) investigate the interactions between ecosystems, ES and
human well-being by considering values generated for people, and
close the loop by exploring changes and future trends in ES
according to scenarios, with possible institutional responses. The
full cascade of ES from ecosystem processes to benefits [1] is
sometimes considered (e.g., [6,8]) but the feedbacks effects from
ES to human actions and the consequences on ecosystem
processes are rarely taken into account [5]. The main research
themes in which ES are related to decision-making concern: (i)
studies on payments for ES, i.e. financial incentives to sustain
management of resources which maintain or enhance ES delivery
[9,10]; (ii) economic valuation is used to raise decision-makers’
awareness of the importance of ES through the costs associated
with their loss [11,12]; and (iii) ES mapping as a decision tool for
landscape planning [13]. Other studies explored how ES could fit
into formal institutional arrangements [14]. However, how people
perceive ecosystems and their ability to provide values affects
choices about how to manage the environment [6]. Psychology,
decision sciences and behavioral economics show that individuals
are not necessarily utility maximizers or financially rational [15],
and individual preferences are evolving [16]. Economic valuation
methods do not adequately address these complexities linked to
attitudes and motivational systems, and their effects on behaviors
PLOS ONE | www.plosone.org 1 September 2014 | Volume 9 | Issue 9 | e107572
(Kumar and Kumar, 2008). Recent reviews [5,17] underline the
interest of using mental models to explore mechanisms by which
individual decisions are made and thereby enhance sustainable
management of land and natural resources. A wide range of
theories and models based on psycho-social constructs such as
attitudes, beliefs and values can help to understand how
environmental change can influence decision-making [5,18].
Two of the most popular theories are the Theory of Planned
Behavior (TPB) model [19] and the Value-Belief-Norm Theory
(VBN) [20]. Both are based on the premise that individuals’
behavior towards the environment is influenced by what they feel
and think with respect to the environment. The TPB is based on
self-interest and rational choice deliberation, while the VBN
focuses primarily on the role of values and moral norms. The main
limitation of these theories is that they do not explain the
formation of the cognitions (beliefs, values, preferences, attitudes)
that are used in a complete feedback loop of decision-making
process, and which are crucial to understand adaptation to non-
linear and rapid environmental change [5,18]. Studies that have
explored stakeholders’ perceptions [21–24] or preferences and
values [25,26] in terms of ES have shown the diversity of
stakeholders’ knowledge and/or values attributed to different ES.
Other studies have investigated farmers’ decision-making process
[27,28], sometimes taking into account interactions between
environmental perceptions and actions [29–31], but few of these
use the ES framework [32].
To fill this gap, this paper studies how ES are taken into account
in land-use decisions in the context of mountain grasslands
management. The study area in the Central French Alps is typical
of extensive grassland management systems found in drier
European mountains, and is mainly composed of permanent
grasslands used for livestock farming. We focused on behavior of
farmers since they are the key decisional actors in this system as
they are the ones determining land management for most of the
area. Three main types of land management change affecting ES
were previously identified: (1) manuring versus not, (2) mowing
versus grazing, (3) early versus late mowing [33–35]. We tested the
hypothesis that these three land management behaviors are driven
by farmers’ motivation to benefit from ES. Previous studies on
farmers’ behavior have stressed the need to consider multiple
potential explanatory factors (e.g. biophysical, economic, political,
sociological) and the relationships among them in order to address
the complexity of the social-ecological system [28]. This led us to
analysing the influence of multiple ES as well as a broader context
of climate and socio-economic change. We built on the theoretical
frameworks of Meyfroidt [5] and Vignola et al. [36] to explore the
feedbacks between ES and behaviors through farmers’ cognitions.
First, we describe the cognitive model underpinning our analysis.
We then present the methodology used to document how ES are
taken into account in farmers’ decisions and describe results for
each component of the cognitive model. Finally, the discussion
explores the feedback loop between ES and land-use through
farmers’ cognitive processes.
Conceptual Framework
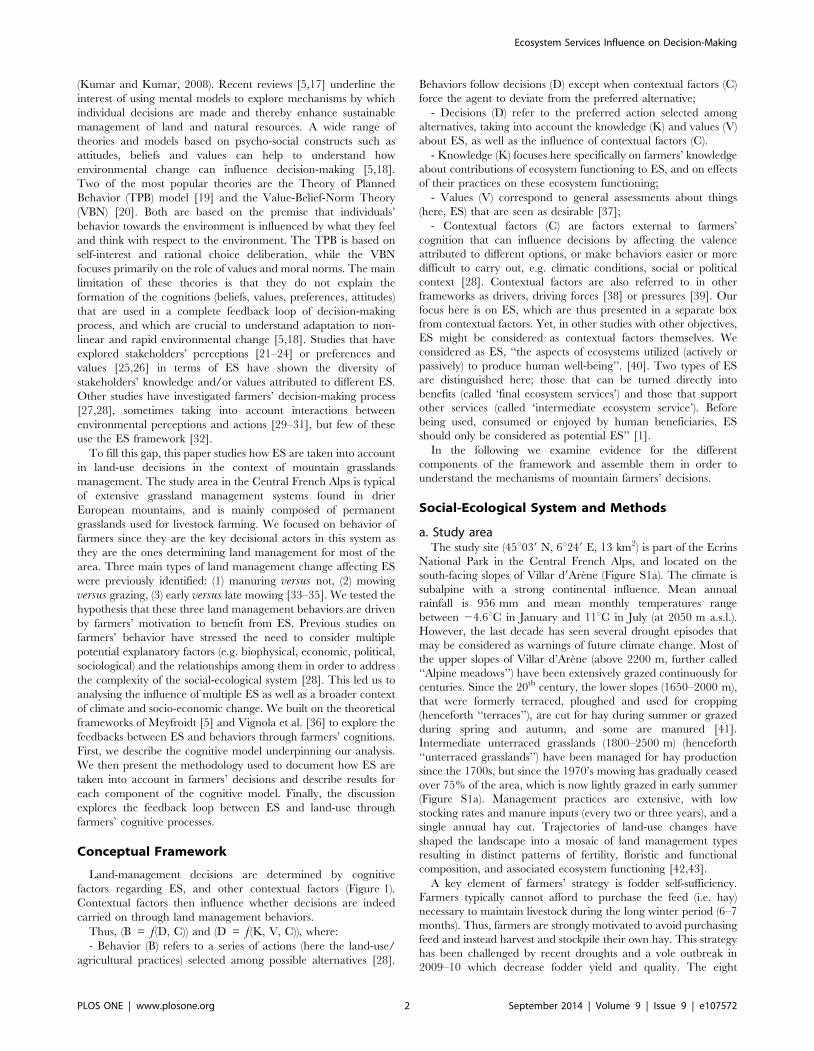
Land-management decisions are determined by cognitive
factors regarding ES, and other contextual factors (Figure 1).
Contextual factors then influence whether decisions are indeed
carried on through land management behaviors.
Thus, (B = f(D, C)) and (D = f(K, V, C)), where:
- Behavior (B) refers to a series of actions (here the land-use/
agricultural practices) selected among possible alternatives [28].
Behaviors follow decisions (D) except when contextual factors (C)
force the agent to deviate from the preferred alternative;
- Decisions (D) refer to the preferred action selected among
alternatives, taking into account the knowledge (K) and values (V)
about ES, as well as the influence of contextual factors (C).
- Knowledge (K) focuses here specifically on farmers’ knowledge
about contributions of ecosystem functioning to ES, and on effects
of their practices on these ecosystem functioning;
- Values (V) correspond to general assessments about things
(here, ES) that are seen as desirable [37];
- Contextual factors (C) are factors external to farmers’
cognition that can influence decisions by affecting the valence
attributed to different options, or make behaviors easier or more
difficult to carry out, e.g. climatic conditions, social or political
context [28]. Contextual factors are also referred to in other
frameworks as drivers, driving forces [38] or pressures [39]. Our
focus here is on ES, which are thus presented in a separate box
from contextual factors. Yet, in other studies with other objectives,
ES might be considered as contextual factors themselves. We
considered as ES, ‘‘the aspects of ecosystems utilized (actively or
passively) to produce human well-being’’. [40]. Two types of ES
are distinguished here; those that can be turned directly into
benefits (called ‘final ecosystem services’) and those that support
other services (called ‘intermediate ecosystem service’). Before
being used, consumed or enjoyed by human beneficiaries, ES
should only be considered as potential ES’’ [1].
In the following we examine evidence for the different
components of the framework and assemble them in order to
understand the mechanisms of mountain farmers’ decisions.
Social-Ecological System and Methods
a. Study areaThe study site (45u039 N, 6u249 E, 13 km2) is part of the Ecrins
National Park in the Central French Alps, and located on the
south-facing slopes of Villar d9Arene (Figure S1a). The climate is
subalpine with a strong continental influence. Mean annual
rainfall is 956 mm and mean monthly temperatures range
between 24.6uC in January and 11uC in July (at 2050 m a.s.l.).
However, the last decade has seen several drought episodes that
may be considered as warnings of future climate change. Most of
the upper slopes of Villar d’Arene (above 2200 m, further called
‘‘Alpine meadows’’) have been extensively grazed continuously for
centuries. Since the 20th century, the lower slopes (1650–2000 m),
that were formerly terraced, ploughed and used for cropping
(henceforth ‘‘terraces’’), are cut for hay during summer or grazed
during spring and autumn, and some are manured [41].
Intermediate unterraced grasslands (1800–2500 m) (henceforth
‘‘unterraced grasslands’’) have been managed for hay production
since the 1700s, but since the 1970’s mowing has gradually ceased
over 75% of the area, which is now lightly grazed in early summer
(Figure S1a). Management practices are extensive, with low
stocking rates and manure inputs (every two or three years), and a
single annual hay cut. Trajectories of land-use changes have
shaped the landscape into a mosaic of land management types
resulting in distinct patterns of fertility, floristic and functional
composition, and associated ecosystem functioning [42,43].
A key element of farmers’ strategy is fodder self-sufficiency.
Farmers typically cannot afford to purchase the feed (i.e. hay)
necessary to maintain livestock during the long winter period (6–7
months). Thus, farmers are strongly motivated to avoid purchasing
feed and instead harvest and stockpile their own hay. This strategy
has been challenged by recent droughts and a vole outbreak in
2009–10 which decrease fodder yield and quality. The eight
Ecosystem Services Influence on Decision-Making
PLOS ONE | www.plosone.org 2 September 2014 | Volume 9 | Issue 9 | e107572
farmers managing the study area can be classified in three
categories according to their production: (1) 3 sheep farmers
producing lambs (mean = 21 livestock units (LU), 19 ha); (2) 3
cattle farmers breeding calves and heifers for dairy farms situated
in neighbouring areas (mean = 67 LU, 55 ha), (3) 2 farmers raising
both sheep and cattle (mean = 54 LU, 48 ha). During summer,
most of the alpine meadows are grazed by a shepherd who
manages local farmers’ sheep along with his/her own flock
(around 1400 sheep in total). The remaining alpine meadows are
divided into paddocks for cattle grazing.
These farms are part of a ‘‘Less Favored Area’’ due to the
combination of a short growing season (April-September) because
of high altitude, and steep slopes (from 0 to more than 50u).Compensations for low productivity from European subsidies and
agri-environmental measures to conserve mowing practices and
related biodiversity constitute a significant share of farmers’
income. Grasslands are collectively managed through an associ-
ation called ‘‘AFP’’ (Association fonciere pastorale) created in 1975
in which agricultural parcels of all landowners are pooled and
allocated among farmers, in order to lower constraints (ex.
production costs, accessibility to parcel) and increase the average
size of parcels and secure land access on long-term.
In addition to agriculture, tourism is a dominant economic
activity in this region recognized for its aesthetic, cultural and
conservation value and recreation opportunities [44].
b. Ethics StatementThis analysis is partially based on survey results. The
interviewees were voluntary, and their answers are confidential
and analyzed anonymously. Farmers surveyed are familiar with
the Central French Alps Long-Term Socio-Ecological Research
(LTSER) site, with whom they have been participating in research
since 2003. When asking them to participate we explained that the
survey contents would remain confidential and anonymous, and
would not be used beyond our study. We also committed to
communicate to them the results of the study, which was done in
March 2013. Farmers consented verbally to these conditions,
given that written consents are not enforced in the Central French
Alps LTSER, nor there is an institutional review board for this
study area. No specific permissions were required for research
studies in this study site (45u03’N, 6u24’E). Our activities did not
involve endangered or protected species.
c. Data collectionQualitative and quantitative data to understand the different
components of the farmers’ decision-making process (Figure 1 and
Table 1) were collected using a role-playing game (called hereafter
the ‘‘feedback game’’) which took place with seven (out of the 8)
farmers of the site in January 2012. The ‘‘feedback game’’ aimed
at understanding how ES and other factors are taken into account
in land management decisions in different contexts regarding
levels of ecosystem service provision, socio-economic and drought
conditions. The role-playing game methodology was used (i) to put
farmers in an experimental situation of decisions with the help of
different supports; (ii) to distinguish between what people say
(‘espoused theory’) and what they do (‘theory in use’) [17] and (iii)
to present to farmers how their adaptive management responding
to climate and socio-political change affected ES delivery.
The ‘‘feedback game’’ is a role-playing game made of a two-
dimensional board game composed of cells representing a
simplified landscape where farmers playing their own role were
asked to place pieces representing their land management
(quantity of cattle, fodder harvested and manure) according to
rules translating the effects of scenarios on ES for each type of
grasslands (for more information on the material see [35]). The
board game retained the actual grassland types managed by each
farmer, with the same proportions of grassland types, which makes
it possible to compare game results with the actual land use map.
The ‘‘feedback game’’ was built on the outcomes of a first role-
playing game (called hereafter the ‘‘scenario game’’) with the same
farmers (April 2011) which identified and mapped farmers’ land-
management adaptations to integrated climate and socio-econom-
ic change scenarios [35]. Farmers’ management adaptations to
alternative contexts in the ‘‘scenario game’’ were used to design
Figure 1. Socio-cognitive conceptual model of ecosystem services feedbacks on farmer behavior. Feedback from changes in ES supplyto farmers’ cognitions and behaviors can be either direct, affecting only the perceived parameters of decision, or indirect, affecting the differentcognitive components underlying the behavior [5].doi:10.1371/journal.pone.0107572.g001
Ecosystem Services Influence on Decision-Making
PLOS ONE | www.plosone.org 3 September 2014 | Volume 9 | Issue 9 | e107572

the initial land management board of the ‘‘feedback game’’ and
the same equipment (board and pieces) was used.
The ‘‘feedback game’’ was played in three sessions lasting each
between 1 h and 1 h30 during the same day. Each session was
composed of one round corresponding to a year where farmers
were projected in a 2030-like situation according to one scenario
(Table 2), in order for them to consider the effects of the
adaptations they had made in the ‘‘scenario game’’. These
scenarios and the initial board game were used to identify the
main contextual factors considered in this study (climate, socio-
economic and political context from the scenarios; altitude,
topography, distance to farm from the board game). The scenarios
also provided a quantification of the consequences on ES delivery
of land management in the ‘‘scenario game’’ (Table 3).
The three scenarios used to vary the levels of ES and other
contextual factors, and analyzed their effects on farmers’ behaviors
are: (1) the ‘‘drastic and local’’ scenario were repeated droughts
occurring during four consecutive years with a return period of
four years combined with a socio-economic context assuming
demand for local products and area-related agricultural subsidies;
(2) the ‘‘intermittent and international’’ scenario alternating
favorable climatic years and droughts combined with a globalized
socio-economic context; (3) the ‘‘drastic anticipation’’ scenario
with repeated droughts as in ‘‘drastic and local’’ scenario, but with
the current socio-economic context (Table 2). At the beginning of
each session, information on ES change by land-management type
(percentage increase or decrease between the current situation and
2030) was given for a set of ESs previously shown to be important
for these farmers and regional experts [23]: forage quality, forage
quantity, date of flowering onset, litter quantity, plant diversity,
aesthetics, water quality, nitrate leaching and carbon storage
(Table 3). ES changes were calculated using spatially-explicit
models predicting the response of ecosystem functioning to
drought and management based on plant and microbial traits,
and abiotic parameters [35].
Before starting the game, each farmer ranked the value of each
ES or service on a five levels Likert-scale (Table 4). This was
followed by a group discussion on the attribution of values and a
discussion of each service. Then, three game sessions were
conducted corresponding each to one scenario. To document
individual decisions in addition to collective discussions during the
game, at the end of each session farmers were asked to write the
reasons for adopting a given practice for each cell of the board
game. The pieces placed by farmers on the board game illustrated
the behaviors that they adopted. The game finished with a general
debriefing where decisions and behaviors were discussed. Knowl-
edge about ecosystem services was extracted from the discussion
during the presentation of ecosystem services change before the
game, through the discussions during the game and the debriefing.
Due to the complexity of the socio-ecological system, plausibility
of the ‘‘feedback game’’ results were cross-checked and completed
with information from multiple sources on actual land manage-
ment behavior (Table 5). Firstly, farmers’ actual land management
behaviors were documented from semi-directed individual inter-
views conducted with the eight farmers in summer 2009 about
farm structure and features of the herd, forage resource and
management practices [45]. These interviews included a partic-
ipatory photomapping where interviewees outlined their parcels
over aerial photographs, and described the management (i.e.
mowing, grazing, manuring, dates and stocking rate) as well as
Table 1. Data collection and analysis of the different components of the conceptual model of the farmer decision-making process(Figure 1).
ObjectivesDecision-makingprocess components Data collection Data types Data Analysis Results
Role-playinggame inputs
Contextual factors Three socio-economic and climatic scenariosand initial boards corresponding to the threesessions of the ‘‘feedback game’’
Qualitative andquantitative
‘‘Scenarios game
Consequence on ES "Feedback game’’ rules (number of piecesallowed in each land use type)
Qualitative andquantitative
‘‘Scenarios game’’ Table 1
Modellingfarmerscognitions
Knowledge "Feedback game" discussions Qualitative Retranscription Figure 2; Table 6
Values "Feedback game" questionnaire Quantitative Likert-scale Table 4; Table 6
Decision "Feedback game" discussions Qualitative Retranscription Table 8; Table 6
Behavior "Feedback game" board game Qualitative andquantitative
Digitalisation Table 7
Links betweencomponents
"Feedback game" Qualitative andquantitative
Process tracing approach Table 6
Validation ofgame results
Knowledge Farmers individual + group interviews Qualitative Qualitative analysis ofdescription of current practices
Values Farmers individual interviews + Field functionmapping
Quantitative Anova and Chi-squared Table 5
Decision Farmers individual interviews + scenariosgame
QuantitativeQuantitative
Regression Table 5
Behavior Farmer participatory photo mapping Quantitative Regression Table 5
Contextual factors Ancillary data Quantitative Regression Table 5
doi:10.1371/journal.pone.0107572.t001
Ecosystem Services Influence on Decision-Making
PLOS ONE | www.plosone.org 4 September 2014 | Volume 9 | Issue 9 | e107572
each parcel’s ‘‘field function’’, i.e. the main parcel value assigned
by farmers [46]. Field functions can be interpreted as levels of ES
provision and were coded according to the expectations on output:
(i) both quantity and quality of fodder being expected, (ii) only
quantity expected, (iii) only quality expected. We used these data
to compare perceptions and actual behaviors of farmers to game
results. Secondly, data about knowledge, values and decision were
obtained from other surveys conducted from 2009 to 2011: (i)
semi-directed individual interviews about knowledge and adapta-
tions to past droughts [34], (ii) the ’’scenario game’’ on adaptations
to future climatic and socio-economic change under four scenarios
[35], and (iii) a group interview conducted in January 2010 with 3
farmers and other inhabitants to elicit their perceptions of
biodiversity and ES related to management of mountain
grasslands [23].
Finally, ancillary spatial data was used to study the effects of
contextual factors (i.e. altitude, topography, distances), on land
management behaviors: a land-use map of the site constructed
using a combination of cadastral (1810 to 2009) and aerial
photographic data (since 1952) [41], a 10 m610 m Digital
Elevation Model, and settlements, farms and road digitized from
the 1:25000 topographic map (IGN).
d. Data analysisInterviews and game discussions were recorded, typed and
coded by themes using Nvivo 9 (QSR International) to extract the
different components of farmers’ cognitions (Table 6; Figure 1:
values, knowledge, decisions) for each ES (Table 4) and draw the
mental map (Figure 2). The ‘‘feedback game’’ questionnaires
about values were analyzed using the Likert-scale data (Table 4).
Land management type and their location on the boards of the
‘‘feedback game’’ sessions were recorded (photography and GIS)
and analysed for each farmer to collect data on behavior (Table 7).
Maps resulting from participatory photomapping were digitized
and georeferenced (with ARCGIS, ESRI), to overlay with the
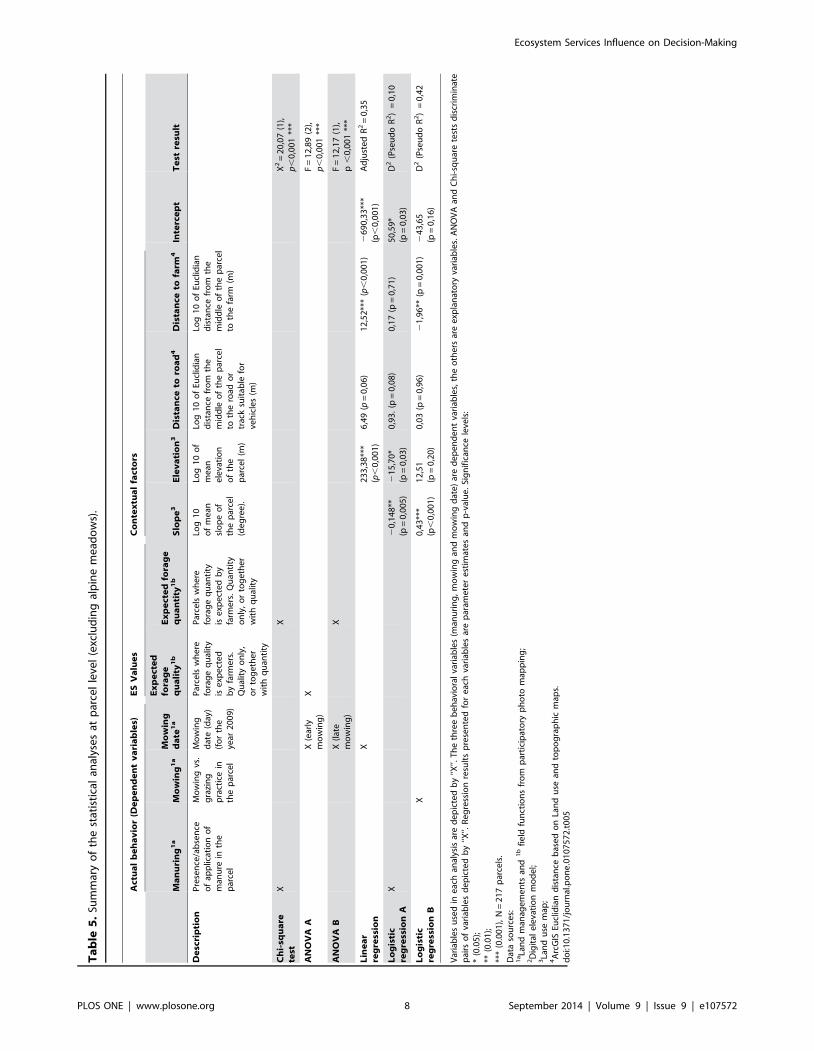
other maps. In order to test whether relations between behaviors
and other elements discussed during the game process were
consistent with those in the real life, we performed statistical
analyses (ANOVA and regressions) of the relationships between
actual land management behaviors (mowing, grazing or manur-
ing), as dependent variables, and ES (expected values in term of
quality and quantity identified by farmers (field functions)) or
potential contextual factors (listed in Table 5) as explanatory
variables (Table 5) using R (R Development Core Team 2008).
These statistical analyses provide one additional element to test the
main hypothesis, i.e. the effect of ES knowledge and values on
farmers’ decisions.
The entire feedback loop from change in ES supply to farmers’
behaviors was then analyzed by combining all this data and using
the « process-tracing » approach [47] to explore individually each
component of the conceptual model before considering links
between them (Figure 1) (as in [31]). This method attempts to
identify the causal chain and mechanisms between independent
variables (cognitive factors such as knowledge, values and
decisions, and contextual factors such as climate change or the
socio-economic context) and the outcome of the dependent
variable (farmers’ behaviors). Tracing all the steps in the process
chain linking knowledge and values to behavior and the
consequences in term of ES – Figure1), and all the necessary
implications of the main hypothesis (farmers’ land management
behaviors are driven by their willingness to benefit from ES)
provides evidence to test this main hypothesis. Meanwhile, the
alternative paths through which the same outcome could have
occurred, without being influenced by perception of ES (e. g.
through effects of external factors on behavior) were identified and
tested, also by being decomposed as a series of steps [47].
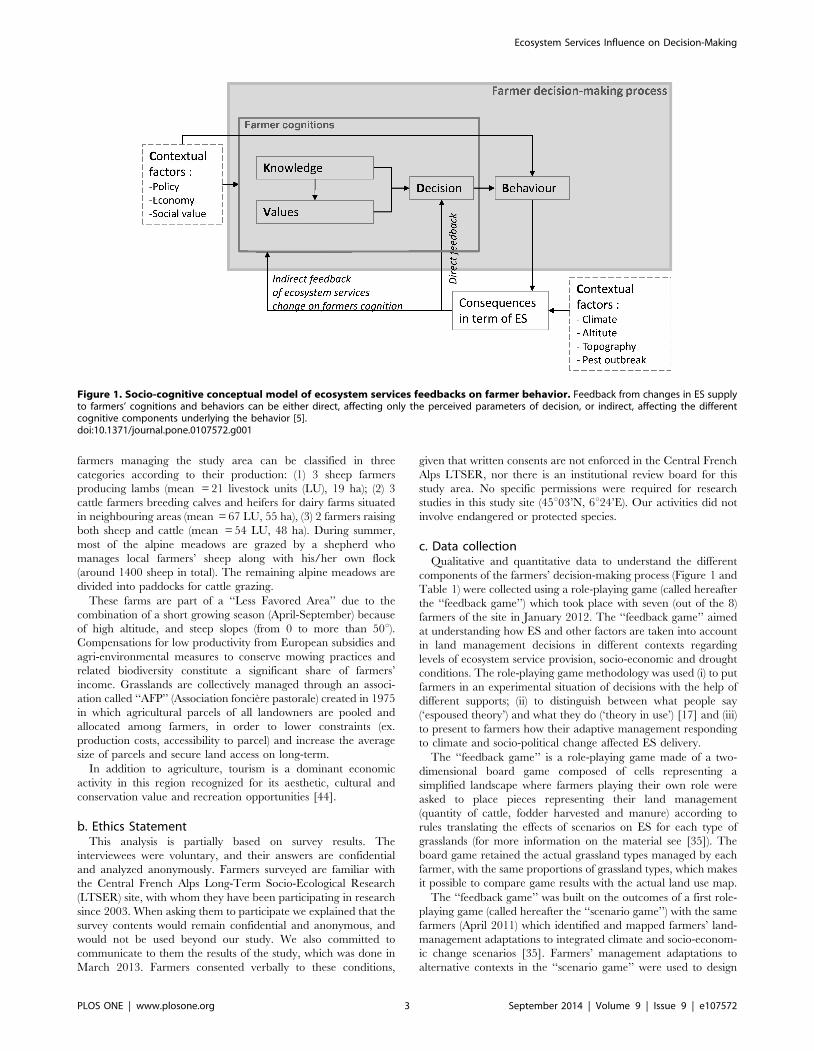
Table 2. Drivers and related assumptions describing the four scenarios combining climatic and socio-economic alternatives(adapted from [61]).
Drivers Climate alternatives
‘‘Drastic’’ ‘‘Intermittent’’
Season of drought andoccurrence
Spring drought during four consecutive years Spring or summer drought every two years
Effects on vegetation Change in species composition. Development of speciesadapted to drought (eg. Festuca paniculata, Carex sempervirens)
No change
Effects on biomassproduction
Decrease by more than 50% Decrease by 15% during drought years
Effects on water quantity(springs)
Decreased flow of all springs, even quenching of theless productive ones
Decreased flow of the springs
Socio-economic alternatives
‘‘Local’’ ‘‘International’’
Consumption demand Local and high quality products Cheapest prices
Aim of agriculturalsubsidies
To maintain both an agriculture with quality production anda high level of ecosystem services and biodiversity conservation.High subsidies but more restrictive in term of expectedoutcomes than in the ‘‘International’’ alternative.
To maintain open landscapes and production of environmentalservices such as carbon sequestration. Lower subsidies than onthe local alternative, but less restrictive. A minimal income isguaranteed to farmers
Subsidies 20% of CAP pillar 1 support: no minimum guaranteed;Agri-environmental measures (AEM): Bonus for biodiversitywith commitment to results (e.g. maintain plant diversity):210J/ha (maximum 10000J/farm) c).; Strengthening of eco-conditionality requirements for funding (e.g. manure control)
20% of CAP pillar 1 support: subsidies generally decoupled butminimum guaranteed (1 yearly minimum wage); Agri-environmental measures (AEM): Bonus for maintaininggrasslands; Carbon credits: 76J/ha (maximum 76000J/farm)
doi:10.1371/journal.pone.0107572.t002
Ecosystem Services Influence on Decision-Making
PLOS ONE | www.plosone.org 5 September 2014 | Volume 9 | Issue 9 | e107572
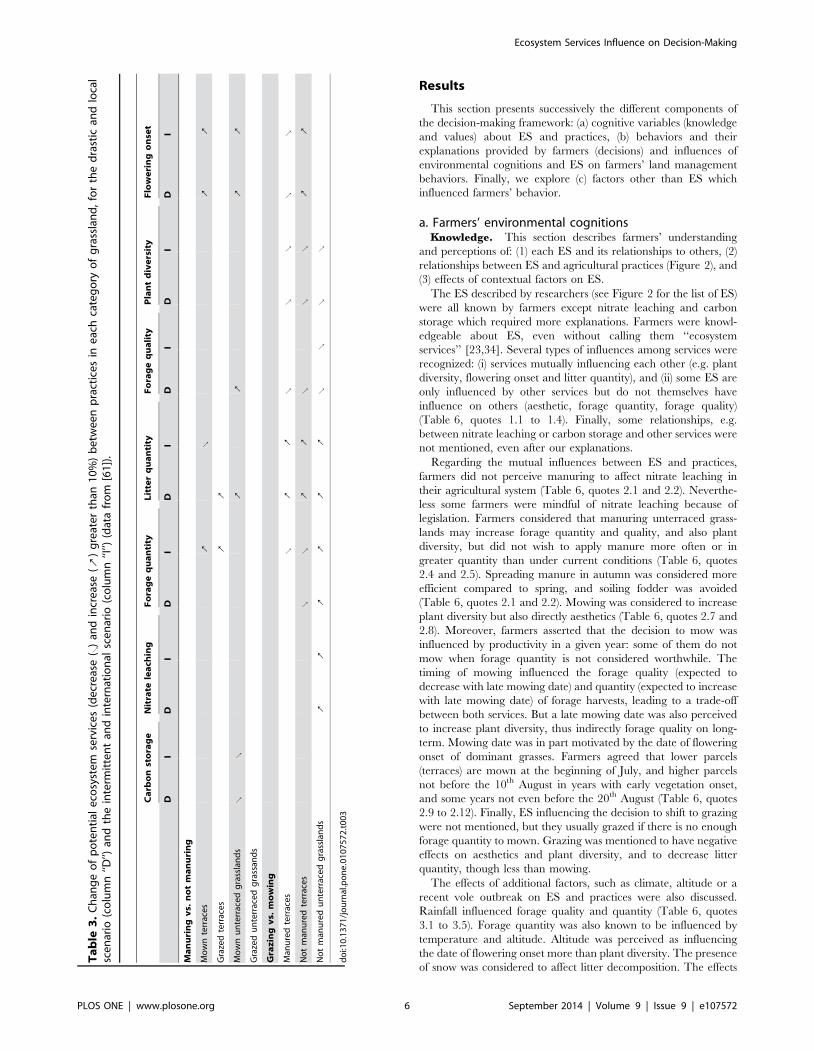
Results
This section presents successively the different components of
the decision-making framework: (a) cognitive variables (knowledge
and values) about ES and practices, (b) behaviors and their
explanations provided by farmers (decisions) and influences of
environmental cognitions and ES on farmers’ land management
behaviors. Finally, we explore (c) factors other than ES which
influenced farmers’ behavior.
a. Farmers’ environmental cognitionsKnowledge. This section describes farmers’ understanding
and perceptions of: (1) each ES and its relationships to others, (2)
relationships between ES and agricultural practices (Figure 2), and
(3) effects of contextual factors on ES.
The ES described by researchers (see Figure 2 for the list of ES)
were all known by farmers except nitrate leaching and carbon
storage which required more explanations. Farmers were knowl-
edgeable about ES, even without calling them ‘‘ecosystem
services’’ [23,34]. Several types of influences among services were
recognized: (i) services mutually influencing each other (e.g. plant
diversity, flowering onset and litter quantity), and (ii) some ES are
only influenced by other services but do not themselves have
influence on others (aesthetic, forage quantity, forage quality)
(Table 6, quotes 1.1 to 1.4). Finally, some relationships, e.g.
between nitrate leaching or carbon storage and other services were
not mentioned, even after our explanations.
Regarding the mutual influences between ES and practices,
farmers did not perceive manuring to affect nitrate leaching in
their agricultural system (Table 6, quotes 2.1 and 2.2). Neverthe-
less some farmers were mindful of nitrate leaching because of
legislation. Farmers considered that manuring unterraced grass-
lands may increase forage quantity and quality, and also plant
diversity, but did not wish to apply manure more often or in
greater quantity than under current conditions (Table 6, quotes
2.4 and 2.5). Spreading manure in autumn was considered more
efficient compared to spring, and soiling fodder was avoided
(Table 6, quotes 2.1 and 2.2). Mowing was considered to increase
plant diversity but also directly aesthetics (Table 6, quotes 2.7 and
2.8). Moreover, farmers asserted that the decision to mow was
influenced by productivity in a given year: some of them do not
mow when forage quantity is not considered worthwhile. The
timing of mowing influenced the forage quality (expected to
decrease with late mowing date) and quantity (expected to increase
with late mowing date) of forage harvests, leading to a trade-off
between both services. But a late mowing date was also perceived
to increase plant diversity, thus indirectly forage quality on long-
term. Mowing date was in part motivated by the date of flowering
onset of dominant grasses. Farmers agreed that lower parcels
(terraces) are mown at the beginning of July, and higher parcels
not before the 10th August in years with early vegetation onset,
and some years not even before the 20th August (Table 6, quotes
2.9 to 2.12). Finally, ES influencing the decision to shift to grazing
were not mentioned, but they usually grazed if there is no enough
forage quantity to mown. Grazing was mentioned to have negative
effects on aesthetics and plant diversity, and to decrease litter
quantity, though less than mowing.
The effects of additional factors, such as climate, altitude or a
recent vole outbreak on ES and practices were also discussed.
Rainfall influenced forage quality and quantity (Table 6, quotes
3.1 to 3.5). Forage quantity was also known to be influenced by
temperature and altitude. Altitude was perceived as influencing
the date of flowering onset more than plant diversity. The presence
of snow was considered to affect litter decomposition. The effects
Ta
ble
3.
Ch
ang
eo
fp
ote
nti
ale
cosy
ste
mse
rvic
es
(de
cre
ase
(Q)
and
incr
eas
e(8
)g
reat
er
than
10
%)
be
twe
en
pra
ctic
es
ine
ach
cate
go
ryo
fg
rass
lan
d,
for
the
dra
stic
and
loca
lsc
en
ario
(co
lum
n‘‘D
’’)an
dth
ein
term
itte
nt
and
inte
rnat
ion
alsc
en
ario
(co
lum
n‘‘I
’’)(d
ata
fro
m[6
1])
.
Ca
rbo
nst
ora
ge
Nit
rate
lea
chin
gF
ora
ge
qu
an
tity
Lit
ter
qu
an
tity
Fo
rag
eq
ua
lity
Pla
nt
div
ers
ity
Flo
we
rin
go
nse
t
DI
DI
DI
DI
DI
DI
DI
Ma
nu
rin
gv
s.n
ot
ma
nu
rin
g
Mo
wn
terr
ace
s8
Q8
8
Gra
zed
terr
ace
s8
8
Mo
wn
un
terr
ace
dg
rass
lan
ds
88
88
Gra
zed
un
terr
ace
dg
rass
and
s
Gra
zin
gv
s.m
ow
ing
Man
ure
dte
rrac
es
Q8
8Q
No
tm
anu
red
terr
ace
sQ
Q8
8Q
88
No
tm
anu
red
un
terr
ace
dg
rass
lan
ds
88
88
88
do
i:10
.13
71
/jo
urn
al.p
on
e.0
10
75
72
.t0
03
Ecosystem Services Influence on Decision-Making
PLOS ONE | www.plosone.org 6 September 2014 | Volume 9 | Issue 9 | e107572
of these external factors on practices will be presented in the
‘‘alternative hypotheses’’ section (see also the alternative hypoth-
esis section of Table 6 and the contextual factors section of
Table 8).
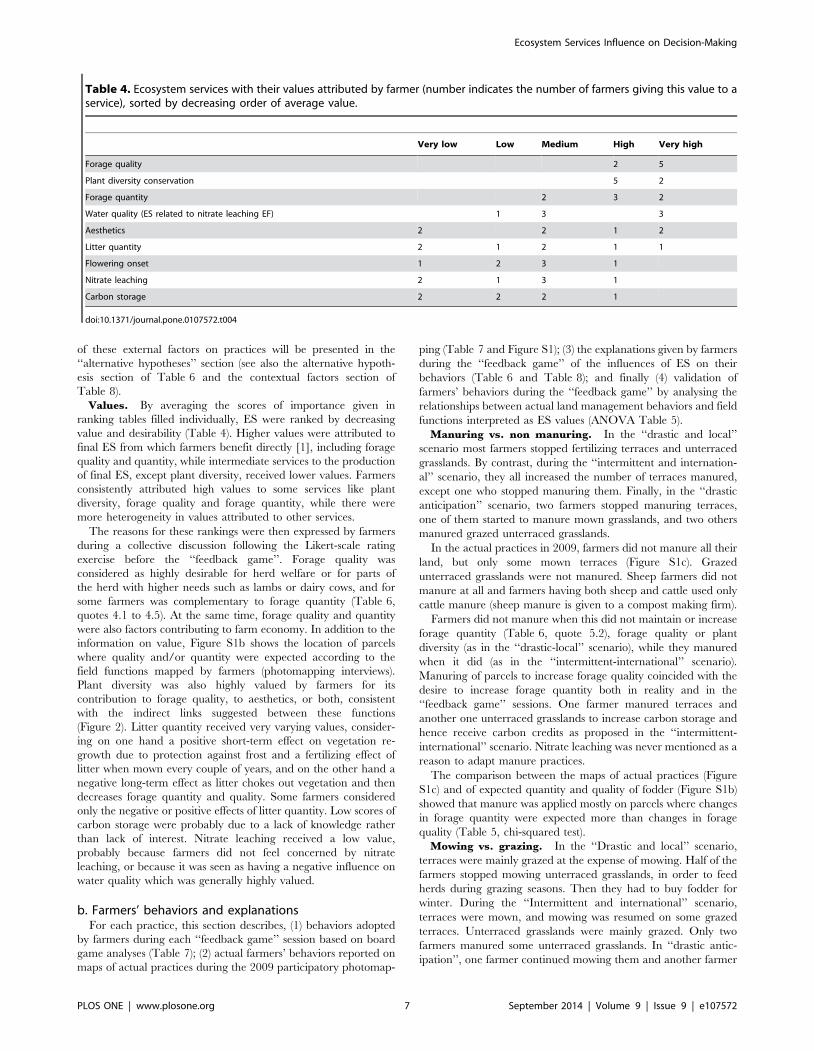
Values. By averaging the scores of importance given in
ranking tables filled individually, ES were ranked by decreasing
value and desirability (Table 4). Higher values were attributed to
final ES from which farmers benefit directly [1], including forage
quality and quantity, while intermediate services to the production
of final ES, except plant diversity, received lower values. Farmers
consistently attributed high values to some services like plant
diversity, forage quality and forage quantity, while there were
more heterogeneity in values attributed to other services.
The reasons for these rankings were then expressed by farmers
during a collective discussion following the Likert-scale rating
exercise before the ‘‘feedback game’’. Forage quality was
considered as highly desirable for herd welfare or for parts of
the herd with higher needs such as lambs or dairy cows, and for
some farmers was complementary to forage quantity (Table 6,
quotes 4.1 to 4.5). At the same time, forage quality and quantity
were also factors contributing to farm economy. In addition to the
information on value, Figure S1b shows the location of parcels
where quality and/or quantity were expected according to the
field functions mapped by farmers (photomapping interviews).
Plant diversity was also highly valued by farmers for its
contribution to forage quality, to aesthetics, or both, consistent
with the indirect links suggested between these functions
(Figure 2). Litter quantity received very varying values, consider-
ing on one hand a positive short-term effect on vegetation re-
growth due to protection against frost and a fertilizing effect of
litter when mown every couple of years, and on the other hand a
negative long-term effect as litter chokes out vegetation and then
decreases forage quantity and quality. Some farmers considered
only the negative or positive effects of litter quantity. Low scores of
carbon storage were probably due to a lack of knowledge rather
than lack of interest. Nitrate leaching received a low value,
probably because farmers did not feel concerned by nitrate
leaching, or because it was seen as having a negative influence on
water quality which was generally highly valued.
b. Farmers’ behaviors and explanationsFor each practice, this section describes, (1) behaviors adopted
by farmers during each ‘‘feedback game’’ session based on board
game analyses (Table 7); (2) actual farmers’ behaviors reported on
maps of actual practices during the 2009 participatory photomap-
ping (Table 7 and Figure S1); (3) the explanations given by farmers
during the ‘‘feedback game’’ of the influences of ES on their
behaviors (Table 6 and Table 8); and finally (4) validation of
farmers’ behaviors during the ‘‘feedback game’’ by analysing the
relationships between actual land management behaviors and field
functions interpreted as ES values (ANOVA Table 5).
Manuring vs. non manuring. In the ‘‘drastic and local’’
scenario most farmers stopped fertilizing terraces and unterraced
grasslands. By contrast, during the ‘‘intermittent and internation-
al’’ scenario, they all increased the number of terraces manured,
except one who stopped manuring them. Finally, in the ‘‘drastic
anticipation’’ scenario, two farmers stopped manuring terraces,
one of them started to manure mown grasslands, and two others
manured grazed unterraced grasslands.
In the actual practices in 2009, farmers did not manure all their
land, but only some mown terraces (Figure S1c). Grazed
unterraced grasslands were not manured. Sheep farmers did not
manure at all and farmers having both sheep and cattle used only
cattle manure (sheep manure is given to a compost making firm).
Farmers did not manure when this did not maintain or increase
forage quantity (Table 6, quote 5.2), forage quality or plant
diversity (as in the ‘‘drastic-local’’ scenario), while they manured
when it did (as in the ‘‘intermittent-international’’ scenario).
Manuring of parcels to increase forage quality coincided with the
desire to increase forage quantity both in reality and in the
‘‘feedback game’’ sessions. One farmer manured terraces and
another one unterraced grasslands to increase carbon storage and
hence receive carbon credits as proposed in the ‘‘intermittent-
international’’ scenario. Nitrate leaching was never mentioned as a
reason to adapt manure practices.
The comparison between the maps of actual practices (Figure
S1c) and of expected quantity and quality of fodder (Figure S1b)
showed that manure was applied mostly on parcels where changes
in forage quantity were expected more than changes in forage
quality (Table 5, chi-squared test).
Mowing vs. grazing. In the ‘‘Drastic and local’’ scenario,
terraces were mainly grazed at the expense of mowing. Half of the
farmers stopped mowing unterraced grasslands, in order to feed
herds during grazing seasons. Then they had to buy fodder for
winter. During the ‘‘Intermittent and international’’ scenario,
terraces were mown, and mowing was resumed on some grazed
terraces. Unterraced grasslands were mainly grazed. Only two
farmers manured some unterraced grasslands. In ‘‘drastic antic-
ipation’’, one farmer continued mowing them and another farmer
Table 4. Ecosystem services with their values attributed by farmer (number indicates the number of farmers giving this value to aservice), sorted by decreasing order of average value.
Very low Low Medium High Very high
Forage quality 2 5
Plant diversity conservation 5 2
Forage quantity 2 3 2
Water quality (ES related to nitrate leaching EF) 1 3 3
Aesthetics 2 2 1 2
Litter quantity 2 1 2 1 1
Flowering onset 1 2 3 1
Nitrate leaching 2 1 3 1
Carbon storage 2 2 2 1
doi:10.1371/journal.pone.0107572.t004
Ecosystem Services Influence on Decision-Making
PLOS ONE | www.plosone.org 7 September 2014 | Volume 9 | Issue 9 | e107572
Ta
ble
5.
Sum
mar
yo
fth
est
atis
tica
lan
alys
es
atp
arce
lle
vel
(exc
lud
ing
alp
ine
me
ado
ws)
.
Act
ua
lb
eh
av
ior
(De
pe
nd
en
tv
ari
ab
les)
ES
Va
lue
sC
on
tex
tua
lfa
cto
rs
Ma
nu
rin
g1
aM
ow
ing
1a
Mo
win
gd
ate
1a
Ex
pe
cte
dfo
rag
eq
ua
lity
1b
Ex
pe
cte
dfo
rag
eq
ua
nti
ty1
bS
lop
e3
Ele
va
tio
n3
Dis
tan
ceto
roa
d4
Dis
tan
ceto
farm
4In
terc
ep
tT
est
resu
lt
De
scri
pti
on
Pre
sen
ce/a
bse
nce
of
app
licat
ion
of
man
ure
inth
ep
arce
l
Mo
win
gvs
.g
razi
ng
pra
ctic
ein
the
par
cel
Mo
win
gd
ate
(day
)(f
or
the
year
20
09
)
Par
cels
wh
ere
fora
ge
qu
alit
yis
exp
ect
ed
by
farm
ers
.Q
ual
ity
on
ly,
or
tog
eth
er
wit
hq
uan
tity
Par
cels
wh
ere
fora
ge
qu
anti
tyis
exp
ect
ed
by
farm
ers
.Q
uan
tity
on
ly,
or
tog
eth
er
wit
hq
ual
ity
Log
10
of
me
ansl
op
eo
fth
ep
arce
l(d
eg
ree
).
Log
10
of
me
ane
leva
tio
no
fth
ep
arce
l(m
)
Log
10
of
Eucl
idia
nd
ista
nce
fro
mth
em
idd
leo
fth
ep
arce
lto
the
road
or
trac
ksu
itab
lefo
rve
hic
les
(m)
Log
10
of
Eucl
idia
nd
ista
nce
fro
mth
em
idd
leo
fth
ep
arce
lto
the
farm
(m)
Ch
i-sq
ua
rete
stX
XX
2=
20
,07
(1),
p,
0,0
01
***
AN
OV
AA
X(e
arly
mo
win
g)
XF
=1
2,8
9(2
),p
,0
,00
1**
*
AN
OV
AB
X(l
ate
mo
win
g)
XF
=1
2,1
7(1
),p
,0
,00
1**
*
Lin
ea
rre
gre
ssio
nX
23
3,3
8**
*(p
,0
,00
1)
6,4
9(p
=0
,06
)1
2,5
2**
*(p
,0
,00
1)
26
90
,33
***
(p,
0,0
01
)A
dju
ste
dR
2=
0,3
5
Lo
gis
tic
reg
ress
ion
AX
20
,14
8**
(p=
0,0
05
)2
15
,70
*(p
=0
,03
)0
,93
.(p
=0
,08
)0
,17
(p=
0,7
1)
50
,59
*(p
=0
,03
)D
2(P
seu
do
R2)
=0
,10
Lo
gis
tic
reg
ress
ion
BX
0,4
3**
*(p
,0
,00
1)
12
,51
(p=
0,2
0)
0,0
3(p
=0
,96
)2
1,9
6**
(p=
0,0
01
)2
43
,65
(p=
0,1
6)
D2
(Pse
ud
oR
2)
=0
,42
Var
iab
les
use
din
eac
han
alys
isar
ed
ep
icte
db
y‘‘X
’’.T
he
thre
eb
eh
avio
ral
vari
able
s(m
anu
rin
g,
mo
win
gan
dm
ow
ing
dat
e)
are
de
pe
nd
en
tva
riab
les,
the
oth
ers
are
exp
lan
ato
ryva
riab
les.
AN
OV
Aan
dC
hi-
squ
are
test
sd
iscr
imin
ate
pai
rso
fva
riab
les
de
pic
ted
by
‘‘X’’.
Re
gre
ssio
nre
sult
sp
rese
nte
dfo
re
ach
vari
able
sar
ep
aram
ete
re
stim
ate
san
dp
-val
ue
.Si
gn
ific
ance
leve
ls:
*(0
.05
);**
(0.0
1);
***
(0.0
01
),N
=2
17
par
cels
.D
ata
sou
rce
s:1
aLa
nd
man
age
me
nts
and
1b
fie
ldfu
nct
ion
sfr
om
par
tici
pat
ory
ph
oto
map
pin
g;
2D
igit
ale
leva
tio
nm
od
el;
3La
nd
use
map
;4A
rcG
ISEu
clid
ian
dis
tan
ceb
ase
do
nLa
nd
use
and
top
og
rap
hic
map
s.d
oi:1
0.1
37
1/j
ou
rnal
.po
ne
.01
07
57
2.t
00
5
Ecosystem Services Influence on Decision-Making
PLOS ONE | www.plosone.org 8 September 2014 | Volume 9 | Issue 9 | e107572
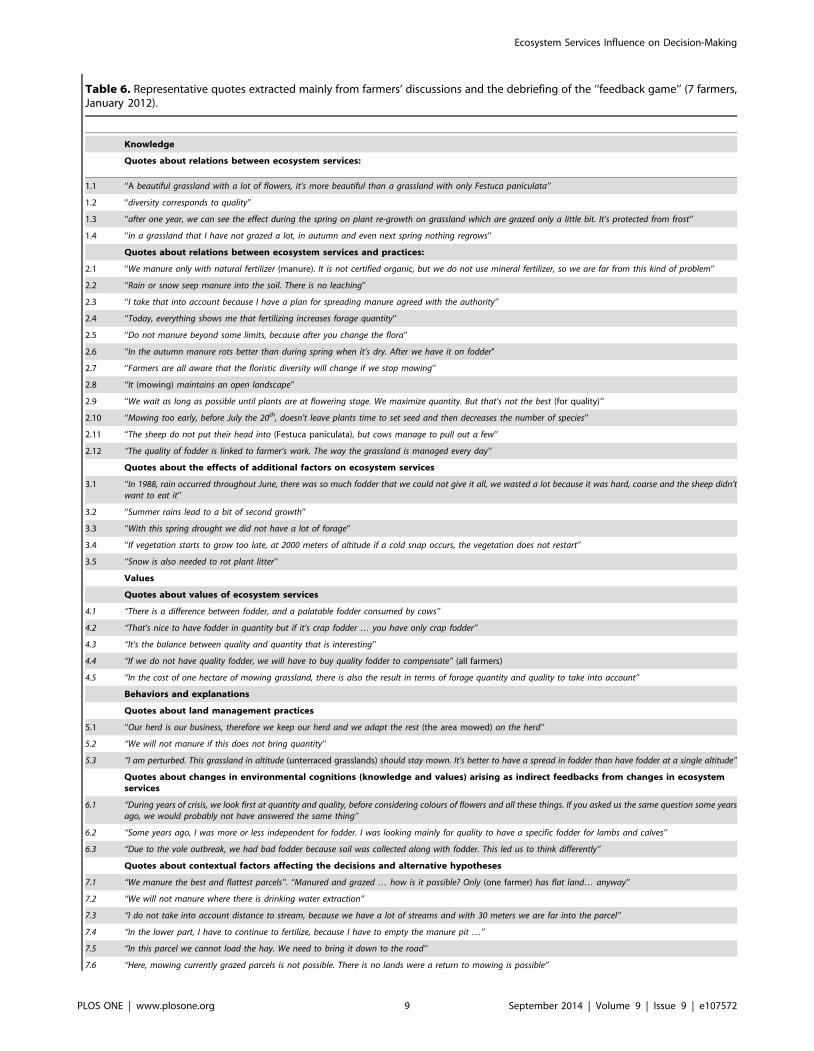
Table 6. Representative quotes extracted mainly from farmers’ discussions and the debriefing of the ‘‘feedback game’’ (7 farmers,January 2012).
Knowledge
Quotes about relations between ecosystem services:
1.1 ‘‘A beautiful grassland with a lot of flowers, it’s more beautiful than a grassland with only Festuca paniculata’’
1.2 ‘‘diversity corresponds to quality’’
1.3 ‘‘after one year, we can see the effect during the spring on plant re-growth on grassland which are grazed only a little bit. It’s protected from frost’’
1.4 ‘‘in a grassland that I have not grazed a lot, in autumn and even next spring nothing regrows’’
Quotes about relations between ecosystem services and practices:
2.1 ‘‘We manure only with natural fertilizer (manure). It is not certified organic, but we do not use mineral fertilizer, so we are far from this kind of problem’’
2.2 ‘‘Rain or snow seep manure into the soil. There is no leaching’’
2.3 ‘‘I take that into account because I have a plan for spreading manure agreed with the authority’’
2.4 ‘‘Today, everything shows me that fertilizing increases forage quantity’’
2.5 ‘‘Do not manure beyond some limits, because after you change the flora’’
2.6 ‘‘In the autumn manure rots better than during spring when it’s dry. After we have it on fodder"
2.7 ‘‘Farmers are all aware that the floristic diversity will change if we stop mowing’’
2.8 ‘‘It (mowing) maintains an open landscape’’
2.9 ‘‘We wait as long as possible until plants are at flowering stage. We maximize quantity. But that’s not the best (for quality)’’
2.10 ‘‘Mowing too early, before July the 20th, doesn’t leave plants time to set seed and then decreases the number of species’’
2.11 ‘‘The sheep do not put their head into (Festuca paniculata), but cows manage to pull out a few’’
2.12 ‘‘The quality of fodder is linked to farmer’s work. The way the grassland is managed every day’’
Quotes about the effects of additional factors on ecosystem services
3.1 ‘‘In 1988, rain occurred throughout June, there was so much fodder that we could not give it all, we wasted a lot because it was hard, coarse and the sheep didn’twant to eat it’’
3.2 ‘‘Summer rains lead to a bit of second growth’’
3.3 ‘‘With this spring drought we did not have a lot of forage’’
3.4 ‘‘If vegetation starts to grow too late, at 2000 meters of altitude if a cold snap occurs, the vegetation does not restart’’
3.5 ‘‘Snow is also needed to rot plant litter’’
Values
Quotes about values of ecosystem services
4.1 ‘‘There is a difference between fodder, and a palatable fodder consumed by cows’’
4.2 ‘‘That’s nice to have fodder in quantity but if it’s crap fodder … you have only crap fodder’’
4.3 ‘‘It’s the balance between quality and quantity that is interesting’’
4.4 ‘‘If we do not have quality fodder, we will have to buy quality fodder to compensate’’ (all farmers)
4.5 ‘‘In the cost of one hectare of mowing grassland, there is also the result in terms of forage quantity and quality to take into account’’
Behaviors and explanations
Quotes about land management practices
5.1 ‘‘Our herd is our business, therefore we keep our herd and we adapt the rest (the area mowed) on the herd’’
5.2 ‘‘We will not manure if this does not bring quantity’’
5.3 ‘‘I am perturbed. This grassland in altitude (unterraced grasslands) should stay mown. It’s better to have a spread in fodder than have fodder at a single altitude’’
Quotes about changes in environmental cognitions (knowledge and values) arising as indirect feedbacks from changes in ecosystemservices
6.1 ‘‘During years of crisis, we look first at quantity and quality, before considering colours of flowers and all these things. If you asked us the same question some yearsago, we would probably not have answered the same thing’’
6.2 ‘‘Some years ago, I was more or less independent for fodder. I was looking mainly for quality to have a specific fodder for lambs and calves’’
6.3 ‘‘Due to the vole outbreak, we had bad fodder because soil was collected along with fodder. This led us to think differently’’
Quotes about contextual factors affecting the decisions and alternative hypotheses
7.1 ‘‘We manure the best and flattest parcels’’. ‘‘Manured and grazed … how is it possible? Only (one farmer) has flat land… anyway’’
7.2 ‘‘We will not manure where there is drinking water extraction’’
7.3 ‘‘I do not take into account distance to stream, because we have a lot of streams and with 30 meters we are far into the parcel’’
7.4 ‘‘In the lower part, I have to continue to fertilize, because I have to empty the manure pit …’’
7.5 ‘‘In this parcel we cannot load the hay. We need to bring it down to the road’’
7.6 ‘‘Here, mowing currently grazed parcels is not possible. There is no lands were a return to mowing is possible’’
Ecosystem Services Influence on Decision-Making
PLOS ONE | www.plosone.org 9 September 2014 | Volume 9 | Issue 9 | e107572
even mowed and manured previously grazed unterraced grass-
lands.
In the current practices, farmers organized their land manage-
ment around spring grazing and mowing, because summer alpine
meadows are large enough to ensure flexibility in forage resources
(Figure S1c). During autumn, the herd grazed extensively on the
re-growth of mown or spring grazed grassland. Areas of grazed
versus mown unterraced grasslands were adjusted to herd size
(Table 6, quote 5.1), while the remaining area was used to mow,
leading three farmers to harvest part of their fodder in other
municipalities.
Some farmers attributed their decision in the RPG to mow
terraces to its positive effect on forage quality and on the reduction
of litter (in the ‘‘drastic-local’’ scenario), or to its benefits for plant
diversity and forage quality (in the ‘‘intermittent-international’’
scenario). Date of flowering was also cited once as a factor
influencing decision to mow terraces. Unterraced grasslands were
also mown by some farmers to increase or maintain plant diversity
and decrease litter quantity, in the ‘‘drastic-local’’ scenario. By
contrast, these grasslands were grazed to increase carbon storage
in the ‘‘intermittent-international’’ scenario.
Maps of expected ES (field functions) showed that in mown
parcels farmers often expected to obtain high fodder quality as well
as large fodder quantity (Figure S1b). Mown parcels where quality
was expected were concentrated on the lower part of the slope,
mixed with parcels where only quantity was required.
Date of mowing. Dates of mowing were not discussed during
‘‘feedback game’’ sessions. During interviews and participatory
photo mapping, farmers explained that dates of mowing are
spread between 1st July and mid-September (FigureS1d).
One farmer indicated that, by choosing to graze unterraced
grasslands to increase carbon storage (Table 6) and gain credits as
proposed in the ‘‘intermittent and international’’ scenario
(Table 2), dates of mowing on his parcels were disturbed as he
had lost the possibility of later mowing in unterraced grasslands
(Table 6, quote 5.3). This farmer faced a trade-off between
maintaining a spread in mowing date or receiving carbon credits
and continued to graze according to the ‘‘intermittent and
international’’ scenario.
Map comparison revealed associations between early mowing
(current practice) and expected quality or late mowing and
expected quantity (Table 5, ANOVA) (Figure S1b and S1d).
However there were no significant relationships between date of
mowing and actual date of flowering onset, or plant diversity
(Simpson index) and date of mowing.
c. Contextual factors affecting the decisions andalternative hypotheses
This section describes contextual factors (internal or external to
the farm) influencing farmers’ decisions, using explanations by
farmers (during games or interviews) and statistical analyses
between spatial factors and practices (Table 5). These factors can
explain divergences between farmers’ behaviors and attitudes, or
in case of consistent behaviors, constitute alternatives to our main
hypothesis that farmers’ land management behaviors are driven by
their willingness to benefit from ES.
Manuring vs. non manuring. As mowing and manuring are
mechanised, constraints on the mechanisation of parcels such as
slope and accessibility came out as a recurrent theme in farmers’
discussions (Table 6, quote 6.1). Distance to farm was mentioned
as a factor influencing manuring due to price of fuel and travel
time to the parcel (except by one farmer who rents a truck bringing
manure close to the most remote parcels). Other characteristics of
parcels were sometimes considered such as proximity to dwellings,
streams and water springs (Table 6, quote 6.2 and 6.3). These
aspects were mainly considered because of legislation and policy
support including fertilisation management plans, which impose
quantity, date and distance thresholds. Sheep farmers usually did
not use their manure and gave it to a specialized company, which
does not take liquid manure or slurry. Therefore, the capacity of
slurry storage pits forced farmers to manure when it was full
((Table 5, quote 6.3). Individual parcels were manured only once
every two or three years. Finally, for some parcels, the short time
between autumn grazing and snow (around 1st November on
average) limited manuring. Mineral fertilisation was considered as
too costly.
The effects of some contextual factors mentioned by farmers
were confirmed by statistical analyses on land use maps. The
logistic regression of factors influencing manuring showed that
manuring was mainly applied on gentle slopes, but distance to
farm, distance to road and altitude were not significant (Table 5,
logistic regression A). In addition, we estimated the maximum area
which could be manured according to the amount of manure
produced depending on farm characteristics. This theoretical
calculation considered farm herd size, an average annual
production of manure of 4.5 T per livestock unit, a theoretical
average of 15 T/ha of manure per spreading and a frequency of
Behaviors and explanations
Quotes about contextual factors affecting the decisions and alternative hypotheses
7.7 ‘‘The problem with grazing is that we need water supply. A cow consumes 40 liters per day and there is not always an access to carry water’’
78 ‘‘We will try to continue to mow as far as we can by respect towards elderly people … but on mechanisable parcels’’
7.9 ‘‘To respect their work, the terraces they built’’
7.10 ‘‘We have to respect land. Not entering when it’s wet, and not grazing when mowing is possible. When a terrace is grazed it’s due to an accessibility issue’’
7.11 ‘‘Grazing instead of mowing is another system; the agreement of the landowner would be needed’’.
7.12 ‘‘What we will do during summer if we stop mowing? We will have a lot of time. We are not shepherds’’
7.13 ‘‘If land becomes available, I will stop to mow over the entire landscape and do it near my farm, to waste as little time as possible. Even if I will need to increase bytwo the hours per day or to take an additional worker during a few days’’
Quotes illustrate the different components of the conceptual model presented in Figure 1.doi:10.1371/journal.pone.0107572.t006
Table 6. Cont.
Ecosystem Services Influence on Decision-Making
PLOS ONE | www.plosone.org 10 September 2014 | Volume 9 | Issue 9 | e107572
manuring of every two or three years for each parcel. The results
suggest that all farmers could potentially fertilize almost all their
mown grasslands at the selected frequency, or that they could
increase frequency of manuring on usually fertilized parcels.
Mowing vs. grazing. Mechanisation of parcels was men-
tioned as an important determinant of conversion from mowing to
grazing (Table 6, quote 6.5). At the time of data collection farmers
considered that they were mowing all the mechanisable parcels
(Table 6, quote 6.6). They regarded mowing equipment adapted
to mountain terrain as too expensive. Factors related to farms’
economy, such as cost of mowing considering investment into
equipment (purchase cost, depreciation and maintenance), ap-
peared often in farmers’ discourses. This was even more
prominent when the farmer had acquired new equipment to
meet the norms of the European Union and/or when farm debt
level was important. When asked to rate the importance of
equipment investments compared to ES in their behavior, farmers
responded ‘‘very high’’ for cost of mowing and ‘‘high’’ for ES.
Some equipment such as manure spreaders was shared between
farmers to decrease costs, but each farmer usually owned their
personal cutting equipment whose use could not be spread
through time. Agri-environmental measures provided subsidies to
mow unterraced grasslands and a possibility of extra subsidy to
mow less mechanisable parcels with a pedestrian mower. While
this kind of subsidies substantially contributed to the farms’
economy, farmers argued several times during the ‘‘feedback
game’’ that, although policy supports were carefully taken into
consideration (balancing the financial amount and constraints),
their amount were insufficient to compensate the actual cost of
maintaining mowing practices.
Farmers discussed different elements favouring conversion from
mowing to grazing. They explained that mown parcels surrounded
by grazed parcels belonging to other farmers could be more prone
to conversion, to avoid risks like trampling by cattle or fence
removal. The altitude of the site did not allow multiple uses of
parcels throughout the season (e.g. grazing before mowing)
because vegetation re-grew only at the end of summer, and in
small quantities. Parcels close to the farm were needed to turn out
the herd to grass during the first weeks of spring. Grazing also
required the presence of water or the possibility to install a trough
(Table 6, quote 6.7). Future opportunities to mow elsewhere or to
acquire parcels from retiring farmers might arise, allowing
remaining farms to increase their land and then fodder
production, or to restrict mowing to the more mechanisable
parcels and to graze the others. By consolidating land among
farmers, the ‘‘Association fonciere pastorale’’ has allowed them to
increase the average size of their parcels and decrease their
production costs, but also to solve conflicts between families about
some parcels, allowing to manage them effectively. This could in
turn favour mowing because some farmers perceived a social
pressure to properly manage land, and thus to prevent shrub
encroachment, especially in terraces, which have a high cultural
value and suffer from trampling by stock. This is directly linked
with farmers’ perceptions of the social value of farming and of
social pressure from landowners, other farmers and/or inhabitants
(Table 6, quote 6.8 to 6.11). Mowing also appeared as an
important aspect of the farming profession: in the discussions, the
possibility of completely stopping mowing was always a source of
laughter (Table 6, quote 6.12).
The logistic regression on mapped data confirmed farmers’
explanations that mowing, in contrast to grazing, was preferen-
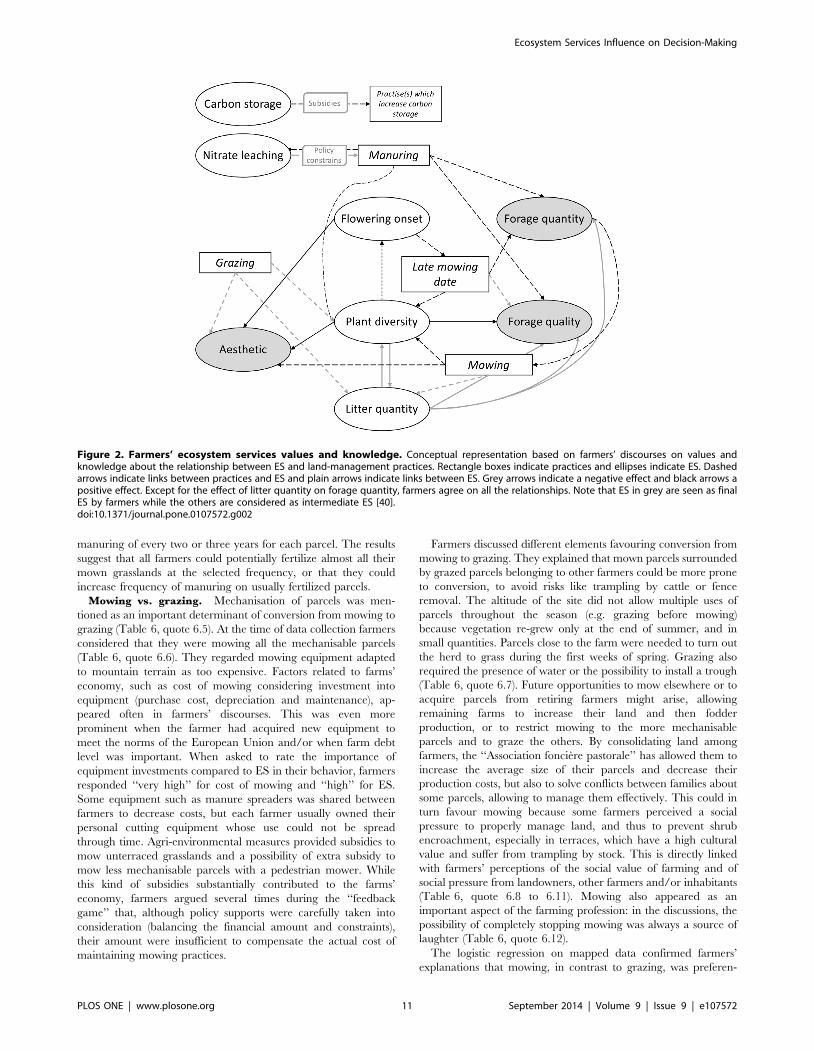
Figure 2. Farmers’ ecosystem services values and knowledge. Conceptual representation based on farmers’ discourses on values andknowledge about the relationship between ES and land-management practices. Rectangle boxes indicate practices and ellipses indicate ES. Dashedarrows indicate links between practices and ES and plain arrows indicate links between ES. Grey arrows indicate a negative effect and black arrows apositive effect. Except for the effect of litter quantity on forage quantity, farmers agree on all the relationships. Note that ES in grey are seen as finalES by farmers while the others are considered as intermediate ES [40].doi:10.1371/journal.pone.0107572.g002
Ecosystem Services Influence on Decision-Making
PLOS ONE | www.plosone.org 11 September 2014 | Volume 9 | Issue 9 | e107572
tially located on parcels with gentler slopes and further from farms.
Altitude and distance to roads were not significant in the model
(Table 5, logistic regression B).
Early vs. late mowing. For farmers having contracted agri-
environmental measures, mowing cannot occur before the 1st July
on unterraced grasslands. This subsidy was perceived as a
constraint by some farmers, depending on the inter-annual
variability in flowering date. Having parcels spread across the
landscape increased the time necessary to mow them all (although
re-parcelling between farmers decreased that constraint), but the
altitudinal span of parcels allowed them to stagger the mowing
over the summer season. This was seen by some farmers as an
opportunity, while others perceived it more as a constraint and
argued that ideally it would be preferable to have the entire mown
area around their farms (Table 6, quote 6.13). All farmers worked
alone on their farm, and additional labour was hired exclusively
from family when needed, e.g. for mowing. On parcels enclosed
within other farmers’ parcels, farmers of the enclosed parcel had to
wait for surrounding parcels to be mown first, before being able to
harvest their own parcel. Around the villages and campsites, some
parcels were mown earlier than desired to avoid trampling by
tourists. Finally, mowing dates depended on rain as dry weather is
necessary to harvest fodder.
According to spatial data, early mowing occurred mainly on the
lower part of the area and late mowing on the upper part, except
for some parcels (Figure S1d). A linear regression model confirmed
that not only parcel elevation but also distance to farm had an
influence on the date of mowing (Table 5, linear regression).
Discussion
First, results are discussed looking at how knowledge and values
about ES influence behavior, and how contextual factors can
change farmers’ cognitions or decisions. Second, methodological
relevance is discussed. Third, implications of findings for future
studies on ES are examined.
a. Role of ES in farmers’ decision-making processVisions of ES differed between farmers and scientists [48].
Farmers explained that for them, ‘‘ES are neither numbers norupward or downward trends’’, but are part of a more complex
system of decision-making. Here we discuss the correspondence
between farmers’ willingness to adopt different behaviors accord-
ing to their values and knowledge towards ES, and farmers’
behaviors in the ‘‘feedback game’’ or actual life. Returning to the
conceptual chain (Figure1), three configurations emerge, explain-
ing whether ES were taken into account in farmers decisions or
not. First, some ES were not part of farmers’ knowledge or far
away from their interest and therefore had low values. This was
the case for carbon storage and nitrate leaching, which were thus
in principle not considered by farmers when making decisions.
Yet, institutional mechanisms may lead some farmers to consider
these services [49], as demonstrated in the second ‘‘feedback
game’’ session where contractual carbon credits could be allocated
to farmers, which indeed modified some decisions. Second, some
ES were known by farmers but had a low value, or farmers
considered not having enough knowledge to include this ES in
their decisions. For example, farmers perceived an influence of
mowing date on the date of flowering onset, itself affecting forage
quantity and quality, but they did not consider themselves capable
of obtaining a desirable ecosystem service delivery by adjusting
mowing dates. Additional reasons (section 3.3, e.g. distance to
farm, surroundings of the parcels, weather) also constrained
mowing dates. Third, in some cases farmers had both knowledge
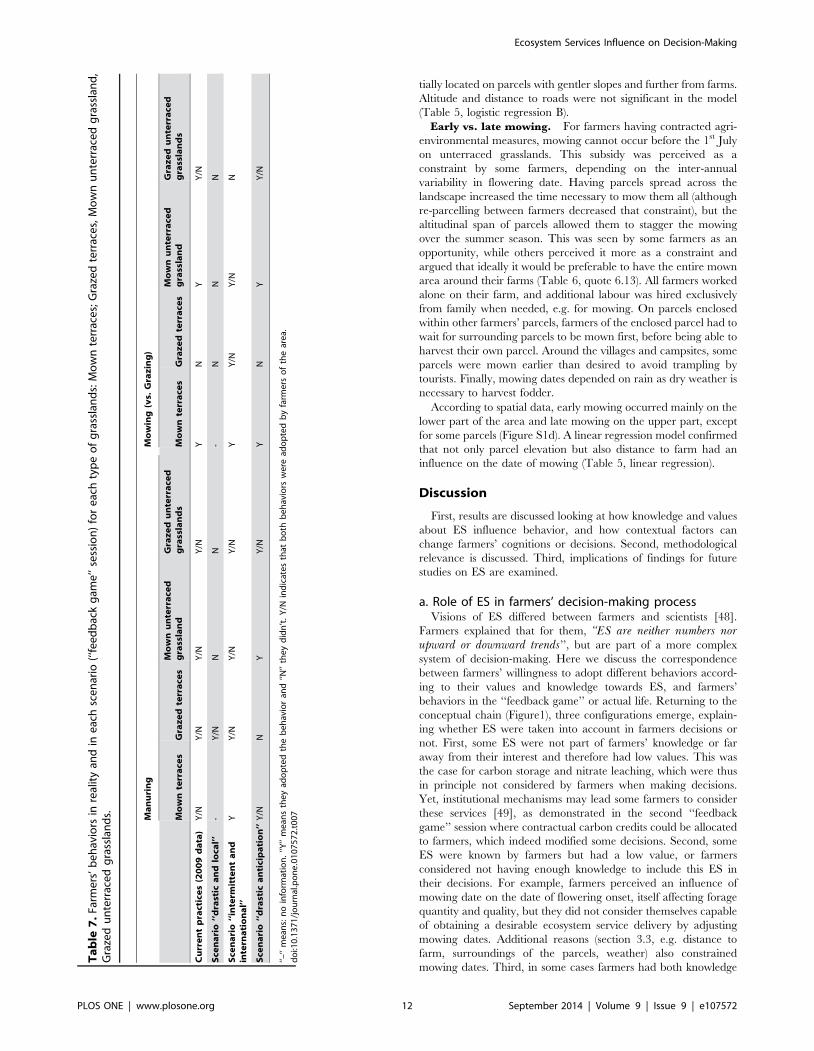
Ta
ble
7.
Farm
ers
’b
eh
avio
rsin
real
ity
and
ine
ach
sce
nar
io(‘‘
fee
db
ack
gam
e’’
sess
ion
)fo
re
ach
typ
eo
fg
rass
lan
ds:
Mo
wn
terr
ace
s;G
raze
dte
rrac
es,
Mo
wn
un
terr
ace
dg
rass
lan
d,
Gra
zed
un
terr
ace
dg
rass
lan
ds. M
an
uri
ng
Mo
win
g(v
s.G
raz
ing
)
Mo
wn
terr
ace
sG
raz
ed
terr
ace
sM
ow
nu
nte
rra
ced
gra
ssla
nd
Gra
ze
du
nte
rra
ced
gra
ssla
nd
sM
ow
nte
rra
ces
Gra
ze
dte
rra
ces
Mo
wn
un
terr
ace
dg
rass
lan
dG
raz
ed
un
terr
ace
dg
rass
lan
ds
Cu
rre
nt
pra
ctic
es
(20
09
da
ta)
Y/N
Y/N
Y/N
Y/N
YN
YY
/N
Sce
na
rio
‘‘d
rast
ica
nd
loca
l’’
-Y
/NN
N-
NN
N
Sce
na
rio
‘‘in
term
itte
nt
an
din
tern
ati
on
al’
’Y
Y/N
Y/N
Y/N
YY
/NY
/NN
Sce
na
rio
‘‘d
rast
ica
nti
cip
ati
on
’’Y
/NN
YY
/NY
NY
Y/N
‘‘–‘‘
me
ans:
no
info
rmat
ion
.‘‘Y
’’m
ean
sth
ey
ado
pte
dth
eb
eh
avio
ran
d‘‘N
’’th
ey
did
n’t
.Y
/Nin
dic
ate
sth
atb
oth
be
hav
iors
we
read
op
ted
by
farm
ers
of
the
are
a.d
oi:1
0.1
37
1/j
ou
rnal
.po
ne
.01
07
57
2.t
00
7
Ecosystem Services Influence on Decision-Making
PLOS ONE | www.plosone.org 12 September 2014 | Volume 9 | Issue 9 | e107572
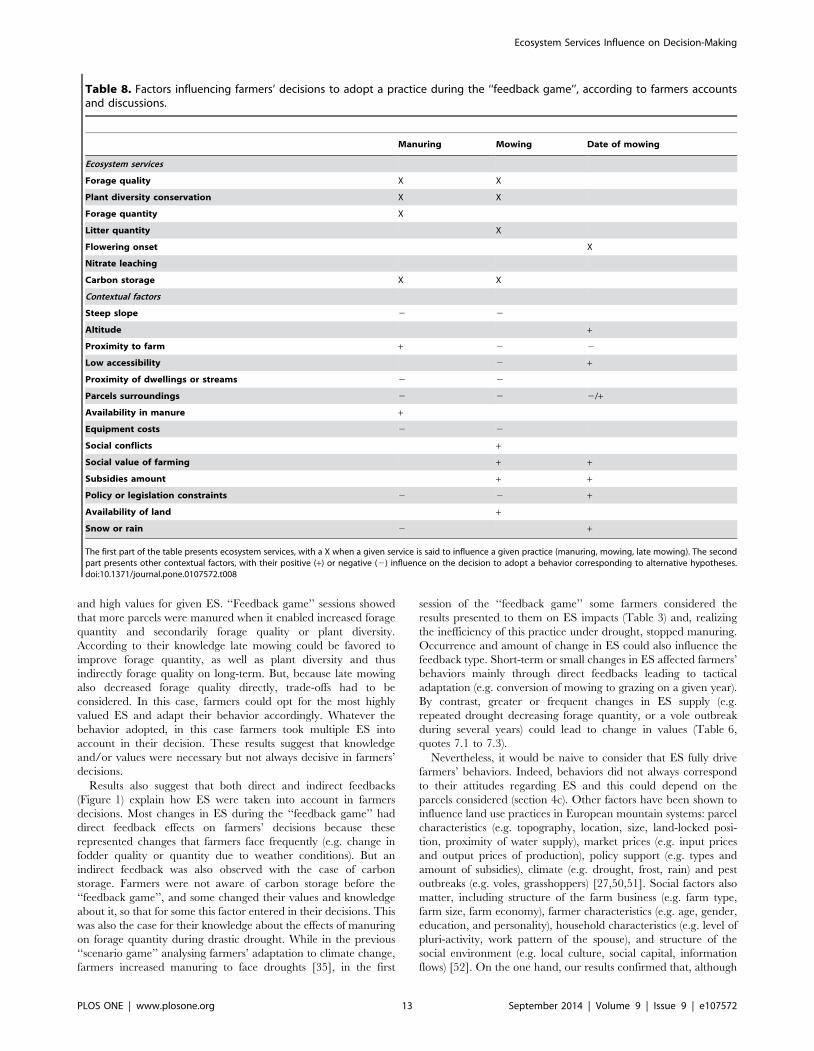
and high values for given ES. ‘‘Feedback game’’ sessions showed
that more parcels were manured when it enabled increased forage
quantity and secondarily forage quality or plant diversity.
According to their knowledge late mowing could be favored to
improve forage quantity, as well as plant diversity and thus
indirectly forage quality on long-term. But, because late mowing
also decreased forage quality directly, trade-offs had to be
considered. In this case, farmers could opt for the most highly
valued ES and adapt their behavior accordingly. Whatever the
behavior adopted, in this case farmers took multiple ES into
account in their decision. These results suggest that knowledge
and/or values were necessary but not always decisive in farmers’
decisions.
Results also suggest that both direct and indirect feedbacks
(Figure 1) explain how ES were taken into account in farmers
decisions. Most changes in ES during the ‘‘feedback game’’ had
direct feedback effects on farmers’ decisions because these
represented changes that farmers face frequently (e.g. change in
fodder quality or quantity due to weather conditions). But an
indirect feedback was also observed with the case of carbon
storage. Farmers were not aware of carbon storage before the
‘‘feedback game’’, and some changed their values and knowledge
about it, so that for some this factor entered in their decisions. This
was also the case for their knowledge about the effects of manuring
on forage quantity during drastic drought. While in the previous
‘‘scenario game’’ analysing farmers’ adaptation to climate change,
farmers increased manuring to face droughts [35], in the first
session of the ‘‘feedback game’’ some farmers considered the
results presented to them on ES impacts (Table 3) and, realizing
the inefficiency of this practice under drought, stopped manuring.
Occurrence and amount of change in ES could also influence the
feedback type. Short-term or small changes in ES affected farmers’
behaviors mainly through direct feedbacks leading to tactical
adaptation (e.g. conversion of mowing to grazing on a given year).
By contrast, greater or frequent changes in ES supply (e.g.
repeated drought decreasing forage quantity, or a vole outbreak
during several years) could lead to change in values (Table 6,
quotes 7.1 to 7.3).
Nevertheless, it would be naive to consider that ES fully drive
farmers’ behaviors. Indeed, behaviors did not always correspond
to their attitudes regarding ES and this could depend on the
parcels considered (section 4c). Other factors have been shown to
influence land use practices in European mountain systems: parcel
characteristics (e.g. topography, location, size, land-locked posi-
tion, proximity of water supply), market prices (e.g. input prices
and output prices of production), policy support (e.g. types and
amount of subsidies), climate (e.g. drought, frost, rain) and pest
outbreaks (e.g. voles, grasshoppers) [27,50,51]. Social factors also
matter, including structure of the farm business (e.g. farm type,
farm size, farm economy), farmer characteristics (e.g. age, gender,
education, and personality), household characteristics (e.g. level of
pluri-activity, work pattern of the spouse), and structure of the
social environment (e.g. local culture, social capital, information
flows) [52]. On the one hand, our results confirmed that, although
Table 8. Factors influencing farmers’ decisions to adopt a practice during the ‘‘feedback game’’, according to farmers accountsand discussions.
Manuring Mowing Date of mowing
Ecosystem services
Forage quality X X
Plant diversity conservation X X
Forage quantity X
Litter quantity X
Flowering onset X
Nitrate leaching
Carbon storage X X
Contextual factors
Steep slope 2 2
Altitude +
Proximity to farm + 2 2
Low accessibility 2 +
Proximity of dwellings or streams 2 2
Parcels surroundings 2 2 2/+
Availability in manure +
Equipment costs 2 2
Social conflicts +
Social value of farming + +
Subsidies amount + +
Policy or legislation constraints 2 2 +
Availability of land +
Snow or rain 2 +
The first part of the table presents ecosystem services, with a X when a given service is said to influence a given practice (manuring, mowing, late mowing). The secondpart presents other contextual factors, with their positive (+) or negative (2) influence on the decision to adopt a behavior corresponding to alternative hypotheses.doi:10.1371/journal.pone.0107572.t008
Ecosystem Services Influence on Decision-Making
PLOS ONE | www.plosone.org 13 September 2014 | Volume 9 | Issue 9 | e107572
the influence of ES is not negligible, in some cases these other
factors outweigh ES in farmers’ decisions. For example, the
difference in manuring between repeated and intermittent drought
conditions (‘‘feedback game’’ sessions on ‘‘drastic and local’’ and
intermittent and international’’ scenarios) confirmed that forage
quantity influenced farmers’ decisions, because they fertilised only
when it was efficient. Nevertheless, some parcels were not
manured (in ‘‘feedback game’’ sessions on ‘‘intermittent and
international’’ and ‘‘drastic and local’’ scenarios) because some of
them were not mechanisable, too far from the farm resulting in
high transport cost, or at unauthorised distance from streams or
settlements imposed by regulations. By contrast, despite the
inefficiency of manuring in repeated drought conditions, some
farmers still manured some parcels because they had to use their
manure. During the ‘‘feedback game’’ farmers chose to mow some
parcels to increase forage quantity and/or quality, plant diversity
or decrease litter quantity but sometimes grazing was preferred
due to the cost of mowing, accessibility and possibility to
mechanise. Financial incentives also had importance in farmers’
decision as shown by the farmer grazing a parcel to receive carbon
storage subsidies although mowing would have been preferred for
forage quality. Farmers took into account date of mowing to
increase forage quantity or quality, but some parcels around
villages were mown earlier than expected to avoid trampling.
Similarly, unterraced grasslands were mown too late because of
the time needed to mow the other parcels nearer to the farm. On
the other hand, even when behaviors were found to be consistent
with attitudes towards ES, alternative reasons could also have
driven farmers to adopt these behaviors. ES would thus be only
one factor among others contributing to farmers’ decisions. For
example, some farmers mowed parcels to increase plant diversity,
but this could also have been favored by financial support from
agri-environmental measures and social value attributed to
mowing as part of the farming profession. Agri-environmental
measures could also favor late mowing, as they impose a date
threshold.
b. Methodological relevanceThe results presented are valid for our study located in a high
mountain farmer community of the French Alps, where agricul-
ture is very extensive. Although to our knowledge no previous
study has analyzed the complete feedback loop, some studies
suggested that farmers in other contexts have detailed and
accurate knowledge about the relationship between their practices
and the functioning of their agro-ecosystem [27,51]. Therefore,
our results might hold for other mountain agricultural social-
ecological systems where farmers opportunities (policy support,
economy) and constraints (e.g. topography, weather conditions,
higher cost of productions) to adopt different behaviors are to a
large extent similar [50,51].
The results of this study are based on data gathered from eight
farmers which represent the total farming population of the area.
This small number did not allow statistical analyses on decision-
making following established paradigms such as the Theory of
Planned Behavior (TPB) or the Value-Belief-Norm Theory (VBN)
[53] but enabled deeper analysis of the reasons behind the
relationships between the different components of farmers’
decision-making process and of their effects on behavior. The
direct involvement of farmers during the role-playing game and
their adaptations in a realistic situation of change allowed us to
observe and to discuss how they decided to adopt a given behavior
[35]. The coherence of results was increased by cross-checking
data from different sources of information. This led us to use a
combination of qualitative and quantitative methods which have
both strengths and weaknesses.
Spatial analyses (photomapping of actual behaviors) provide
robust quantitative data on decisions, but do not give information
to interpret them in terms of ES values and knowledge. Interviews
provide useful qualitative data to interpret the reason behind
decisions, but give little quantitative information to assess whether
rationales given by the farmers are effectively implemented. Role-
playing game provide a crucial link between quantitative spatial
data and qualitative data from interviews, by providing explicit,
quantitative data on decisions, though less robust than spatial
analyses of actual behaviors, and less self-explanatory than
interviews.
Participatory simulation, of which role-playing game constitute
one tool, is a very useful approach in decision-making processes in
complex systems [54,55]. However, this approach implies different
forms of learning such as the learning related to the stakes
involved, to the other players or to the technical aspects [55]. The
addition of a protocol to assess farmers’ learning as an outcome of
the iterative process of our approach could be beneficial.
c. Implications for ES researchOur results show the importance of considering stakeholders’
perception and use of ecosystems rather than focusing only on
potential ES supply [56]. Stakeholders’ perceptions and potential
ES delivery sometime differ [1] and the latter may not coincide
with stakeholders’ needs. Nevertheless, most of the potential ES
presented to farmers were indeed considered by them as services,
except for water quality/nitrate leaching and carbon storage of
which they were not aware. Studying systemic representation of
potential ES by farmers (Figure 2) also allowed us to show that
potential ES can benefit to farmers (i) either individually (forage
quality, forage quantity, litter quantity, date of flowering onset,
plant diversity and aesthetics) or as tradeoffs (forage quantity and
quality), and (ii) directly (i.e. final ES: forage quantity, forage
quality, aesthetics) and/or indirectly (i.e. intermediate ES:
flowering onset, plant diversity, litter quantity) [40]. For example,
plant diversity was not considered by farmers for its intrinsic value
but rather for its value to contribute to forage quality and
aesthetics. Quality and quantity of ‘‘green’’ forage (vegetation)
were seen as services deriving directly from the ecosystem, while
quality and quantity of ‘‘dry’’ fodder (harvested) were considered
as benefits, acknowledging that manufactured and/or human
capital (e.g. farmer know-how) are required to generate a valued
good from ES (Table 6, quote 2.12) [1,6]. Moreover, our results
showed the importance to not only consider perception or
valuation of ES by stakeholders but also their effective uses. ES
potentially supplied, ES perceptions and ES actually used can
differ according to individuals and to the spatial and temporal
contexts. For example farmers might not manage a parcel with
high plant diversity towards quality fodder because of topography
limiting access, or because of the context forcing them to maximise
quantity at the expense of quality. For the purpose of ES
conservation, it is also important to consider farmers’ awareness,
willingness and/or ability to adopt a practice maintaining or
enhancing ES delivery in the social-ecological system as a whole.
Results of this study confirmed and illustrated the utility of
decomposing ES along the conceptual cascade from ecosystem
processes to values [1,57,58].
Although all components of agro-ecosystems cannot be trans-
lated in terms of ES, research focusing on ES can complement
agronomic studies for several reasons. Firstly, the ES framework
translates ecological complexity into common language easily
understandable by researchers from different disciplines as well as
Ecosystem Services Influence on Decision-Making
PLOS ONE | www.plosone.org 14 September 2014 | Volume 9 | Issue 9 | e107572
farmers, stakeholders or policy makers [59]. This study showed
that the concept was rapidly understood, even by farmers who had
never heard the term before [23]. Secondly, it emphasizes human-
environment interactions which have been generally overlooked in
previous research, increasing the awareness of the dependence of
society on biodiversity and ecosystems [60]. Thirdly, it allows
identifying and arbitrating trade-offs and priorities at the farm,
municipality or even larger scales involving beneficiaries having
different interests. In this study, the national park aims at
maintaining mowing in unterraced grasslands to conserve this
rare agro-ecosystem and the related biodiversity. In contrast,
farmers are interested in maximising other ES and are induced to
stop mowing by other contextual factors including profitability or
topography. The ES framework could help design public policies
to reconcile the interests of different stakeholders.
Conclusion
To our knowledge this is the first ES study exploring the
feedback between multiple ES and stakeholders’ behavior through
the decisions making process. By demonstrating the causal chain
and mechanisms leading farmers to adopt a behavior, our study
shows that farmer’s knowledge about ES and willingness to benefit
from these services are taken into account in their decisions, but do
not constitute the main factor of decision. ES constitute necessary
but not sufficient conditions in explaining behaviors, as other key
factors were determinant (i.e. altitude, topography, parcels
location, policies or social value). Such an approach should be
tested at other sites with a greater set of ES and/or other
beneficiaries and land managers, as well as in other natural
resource management systems.
Supporting Information
Figure S1 (a) Study site map with grassland management types
and location of farms and roads (modified from [62]). Maps made
by farmers during the 2009 interviews: (b) farmers’ expectations
about forage quality and quantity (colours) for mown (plain) or
grazed parcels (shaded); (c) current practices and (d) current date of
mowing.
(TIF)
Acknowledgments
We thank all participants of interviews, workshops and role-playing games
for their contributions and the time they devoted to our study. We also
thank Fabien Quetier, Aloıs Artaux, Eric Deboeuf and Coline Byczek for
their help during the game sessions, workshop and/or interviews, Cecile
Barnaud for her advices for the role-playing games development and the
Joseph Fourier Alpine Station for logistical support. This research was
conducted on the long term research site ‘‘Zone Atelier Alpes’’, a member
of the ILTER-Europe network.
Author Contributions
Conceived and designed the experiments: PL PM SL. Performed the
experiments: PL SL BN. Analyzed the data: PL BN PM. Contributed
reagents/materials/analysis tools: PL. Wrote the paper: PL PM SL.
References
1. Lamarque P, Quetier F, Lavorel S (2011) The diversity of the ecosystem services
concept and its implications for their assessment and management. Comptes
Rendus Biologies 334: 441–449.
2. Foley JA, DeFries R, Asner GP, Barford C, Bonan G, et al. (2005) Global
Consequences of Land Use. Science 309: 570–574.
3. Diaz S, Quetier F, Caceres DM, Trainor SF, Perez-Harguindeguy N, et al.
(2011) Linking functional diversity and social actor strategies in a framework for
interdisciplinary analysis of nature’s benefits to society. Proceedings of the
National Academy of Sciences, USA 108: 895–902.
4. Liu J, Dietz T, Carpenter SR, Folke C, Alberti M, et al. (2007) Coupled Human
and Natural Systems. AMBIO: A Journal of the Human Environment 36: 639–
649.
5. Meyfroidt P (2013) Environmental cognitions, land change, and social-ecological
feedbacks: an overview. Journal of Land Use Science 8: 341–367.
6. Mace GM, Bateman I, (ed.) (2011) Conceptual Framework and Methodology.
In: The UK National Ecosystem Assessment Technical Report. UK National
Ecosystem Assessment, UNEP-WCMC, Cambridge.
7. Hein L, van Koppen K, de Groot RS, van Ierland EC (2006) Spatial scales,
stakeholders and the valuation of ecosystem services. Ecological Economics 57:
209–228.
8. Reyers B, Biggs R, Cumming GS, Elmqvist T, Hejnowicz AP, et al. (2013)
Getting the measure of ecosystem services: A social-ecological approach.
Frontiers in Ecology and the Environment 11: 268–273.
9. Banerjee S, Secchi S, Fargione J, Polasky S, Kraft S (2013) How to sell ecosystem
services: a guide for designing new markets. Frontiers in Ecology and the
Environment 11: 297–304.
10. Robertson M, BenDor TK, Lave R, Riggsbee A, Ruhl JB, et al. (2014) Stacking
ecosystem services. Frontiers in Ecology and the Environment 12: 186–193.
11. Costanza R, d’Arge R, de Groot R, Farber S, Grasso M, et al. (1997) The value
of the worl’s ecosystem services and natural capital. Nature 387: 253–260.
12. TEEB (2009) The Economics of Ecosystems and Biodiversity for Policy Makers
Summary: Responding to the Value of Nature. Available at: www.teebweb.org,
accessed 10 june 2010.
13. von Haaren C, Albert C (2011) Integrating ecosystem services and environ-
mental planning: limitations and synergies. International Journal of Biodiversity
Science, Ecosystem Services & Management 7: 150–167.
14. Salzman J, Thompson Jr BH, Daily GC (2001) Protecting ecosystem services:
Science, economics, and law. Stan Envtl 20: 309.
15. St John FAV, Edwards-Jones G, Jones JPG (2011) Conservation and human
behaviour: lessons from social psychology. Wildlife Research 37: 658–667.
16. Kumar M, Kumar P (2008) Valuation of the ecosystem services: A psycho-
cultural perspective. Ecological Economics 64: 808–819.
17. Jones NA, Ross H, Lynam T, Perez P, Leitch A (2011) Mental Models: An
Interdisciplinary Synthesis of Theory and Methods. Ecology and Society 16 (1)
46.
18. Wise RM, Fazey I, Stafford Smith M, Park SE, Eakin HC, et al. (in press)
Reconceptualising adaptation to climate change as part of pathways of change
and response. Global Environmental Change.
19. Ajzen I (1991) The theory of planned behavior. Organizational behavior and
human decision processes 50: 179–211.
20. Stern PC, Dietz T, Abel T, Guagnano GA, Kalof L (1999) A value-belief-norm
theory of support for social movements: The case of environmentalism. Human
ecology review 6: 81–98.
21. O’Farrell PJ, Donaldson JS, Hoffman MT (2007) The influence of ecosystem
goods and services on livestock management practices on the Bokkeveld plateau,
South Africa. Agriculture, Ecosystems & Environment 122: 312–324.
22. Lewan L, Soderqvist T (2002) Knowledge and recognition of ecosystem services
among the general public in a drainage basin in Scania, Southern Sweden.
Ecological Economics 42: 459–467.
23. Lamarque P, Tappeiner U, Turner C, Steinbacher M, Bardgett RD, et al.
(2011) Stakeholder perceptions of grassland ecosystem services in relation to
knowledge on soil fertility and biodiversity. Regional Environmental Change 11:
791–804.
24. Fontaine CM, Dendoncker N, De Vreese R, Jacquemin I, Marek A, et al. (2013)
Towards participatory integrated valuation and modelling of ecosystem services
under land-use change. Journal of Land Use Science: 1–26.
25. Duguma LA, Hager H (2011) Farmers’ assessment of the social and ecological
values of land uses in central Highland Ethiopia. Environmental management
47: 969–982.
26. Martın-Lopez B, Iniesta-Arandia I, Garcıa-Llorente M, Palomo I, Casado-
Arzuaga I, et al. (2012) Uncovering ecosystem service bundles through social
preferences. PLoS ONE 7: e38970. doi:38910.31371/journal.pone.0038970.
27. Nettier B, Dobremez L, Seres C, Pauthenet Y, Orsini M, et al. (2011)
Biodiversity conservation by livestock farmers: advantages and shortcomings of
the agri-environmental scheme ’Prairies fleuries’. Fourrages: 283–292.
28. Feola G, Binder CR (2010) Towards an improved understanding of farmers’
behaviour: The integrative agent-centred (IAC) framework. Ecological Eco-
nomics 69: 2323–2333.
29. Tengo M, Belfrage K (2004) Local management practices for dealing with
change and uncertainty: a cross-scale comparison of cases in Sweden and
Tanzania. Ecology and Society 9.
30. Lauer M, Aswani S (2010) Indigenous knowledge and long-term ecological
change: detection, interpretation, and responses to changing ecological
conditions in pacific Island Communities. Environmental management 45:
985–997.
Ecosystem Services Influence on Decision-Making
PLOS ONE | www.plosone.org 15 September 2014 | Volume 9 | Issue 9 | e107572
31. Meyfroidt P (2013) Environmental cognitions, land change and social-ecological
feedbacks: local case studies of the forest transition in Vietnam. Human ecology41: 367–392.
32. Poppenborg P, Koellner T (2013) Do attitudes toward ecosystem services
determine agricultural land use practices? An analysis of farmers’ decision-making in a South Korean watershed. Land Use Policy 31: 422–429.
33. Quetier (2006) Vulnerabilite des ecosystemes semi-naturels europeens auxchangements d’utilisations des terres. Montpellier: Ecole superieure Agronomi-
que de Montpellier. 269 p.
34. Nettier B, Dobremez L, Coussy JL, Romagny T (2010) Attitudes of livestockfarmers and sensitivity of livestock farming systems to drought conditions in the
French Alps. Revue De Geographie Alpine-Journal of Alpine Research 98: 383–400.
35. Lamarque P, Artaux A, Barnaud C, Dobremez L, Nettier B, et al. (2013) Takinginto account farmers’ decision making to map fine-scale land management
adaptation to climate and socio-economic scenarios. Landscape and Urban
Planning 119: 147–157.36. Vignola R, Koellner T, Scholz RW, McDaniels TL (2010) Decision-making by
farmers regarding ecosystem services: Factors affecting soil conservation effortsin Costa Rica. Land Use Policy 27: 1132–1142.
37. Dietz T, Fitzgerald A, Shwom R (2005) Environmental values. Annu Rev
Environ Resour 30: 335–372.38. Geist HJ, Lambin EF (2002) Proximate causes and underlying driving forces of
tropical deforestation. Bioscience 52: 143–150.39. Svarstad H, Petersen LK, Rothman D, Siepel H, Watzold F (2008) Discursive
biases of the environmental research framework DPSIR. Land Use Policy 25:116–125.
40. Fisher B, Turner RK, Morling P (2009) Defining and classifying ecosystem
services for decision making. Ecological Economics 68: 643–653.41. Girel J, Quetier F, Bignon A, Aubert S (2010) Histoire de l’agriculture en Oisans.
Hautes Romanche et pays faranchin. Villar d’Arene, Hautes-Alpes (History ofagriculture in Oisans. Villar d’Arene, Hautes-Alpes). Grenoble, France: Station
Alpine Joseph Fourier. 79 p.
42. Quetier F, Thebault A, Lavorel S (2007) Plant traits in a state and transitionframework as markers of ecosystem response to land-use change. Ecological
Monographs 77: 33–52.43. Diaz S, Lavorel S, de Bello F, Quetier F, Grigulis K, et al. (2007) Incorporating
plant functional diversity effects in ecosystem service assessments. Proceedings ofthe National Academy of Sciences, USA 104: 20684–20689.
44. Quetier F, Rivoal F, Marty P, de Chazal J, Thuiller W, et al. (2010) Social
representations of an alpine grassland landscape and socio-political discourses onrural development. Regional Environmental Change 10: 119–130.
45. Deboeuf E (2009) Adaptabilite des systemes d’elevage de haute-montagne a desaleas. Le cas de Villar d’Arene: Enita de Clermont-Ferrand, France. 91 p.
46. Fleury P, Dubeuf B, Jeannin B (1996) Forage management in dairy farms: A
methodological approach. Agricultural Systems 52: 199–212.47. George AL, Bennett A (2005) Case studies and theory development in the social
sciences. Cambridge, Massachusetts: The MIT Press.
48. Lugnot M, Martin G (2013) Biodiversity provides ecosystem services: scientificresults versus stakeholders’ knowledge. Regional Environmental Change 13:
1145–1155.49. Vatn A (2010) An institutional analysis of payments for environmental services.
Ecological Economics 69: 1245–1252.
50. Mottet A, Ladet S, Coque N, Gibon A (2006) Agricultural land-use change andits drivers in mountain landscapes: A case study in the Pyrenees. Agriculture
Ecosystems & Environment 114: 296–310.51. von Glasenapp M, Thornton T (2011) Traditional Ecological Knowledge of
Swiss Alpine Farmers and their Resilience to Socioecological Change. HumanEcology 39: 769–781.
52. Edwards-Jones G (2006) Modelling farmer decision-making: concepts, progress
and challenges. Animal Science 82: 783–790.53. Kaiser FG, Hubner G, Bogner FX (2005) Contrasting the theory of planned
behavior with the value-belief-norm model in explaining conservation behavior.Journal of Applied Social Psychology 35: 2150–2170.
54. Voinov A, Bousquet F (2010) Modelling with stakeholders. Environmental
Modelling & Software 25: 1268–1281.55. Etienne Mc (2010) La modelisation d’accompagnement: Une demarche
participative en appui au developpement durable. Versailles, France: QuaeEditions. 368 p.
56. Termorshuizen JW, Opdam P (2009) Landscape services as a bridge betweenlandscape ecology and sustainable development Landscape Ecology Volume 24:
1037–1052.
57. Haines-Young R, Potschin M, Raffaelli DG, Frid CLJ (2010) The links betweenbiodiversity, ecosystem services and human well-being Ecology E, editor:
Cambridge University Press.58. TEEB (2010) The Economics of Ecosystems and Biodiversity: Ecological and
Economic Foundations. Edited by Pushpam Kumar. Earthscan, London and
Washington.59. Barnaud C, Antona M, Marzin J (2011) Vers une mise en debat des incertitudes
associees a la notion de service ecosystemique. Vertigo 11.60. Vihervaara P, Ronka M, Walls M (2010) Trends in Ecosystem Service Research:
Early Steps and Current Drivers. Ambio 39: p. 314–324.61. Lamarque P, Lavorel S, Mouchet M, Quetier F (2014) Plant trait-based models
identify direct and indirect effects of climate change on bundles of grassland
ecosystem services. Proc Natl Acad Sci USA, 10.1073/pnas.121605111162. Lavorel S, Grigulis K, Lamarque P, Colace M-P, Garden D, et al. (2011) Using
plant functional traits to understand the landscape distribution of multipleecosystem services. Journal of Ecology 99: 135–147.
Ecosystem Services Influence on Decision-Making
PLOS ONE | www.plosone.org 16 September 2014 | Volume 9 | Issue 9 | e107572