How Does Raising Women’s Full Retirement Age Affect...
36
How Does Raising Women’s Full Retirement Age Affect Labor Supply, Income, and Mortality? Evidence from Switzerland Rafael Lalive University of Lausanne and Stefan Staubli University of Calgary Prepared for the 16 th Annual Joint Meeting of the Retirement Research Consortium August 7-8, 2014 Washington, DC The research reported herein was pursuant to a grant from the U.S. Social Security Administration (SSA), funded as part of the Retirement Research Consortium (RRC). The findings and conclusions expressed are solely those of the authors and do not represent the views of SSA, any agency of the federal government, the University of Lausanne, the University of Calgary, or the Center for Retirement Research at Boston College.
Transcript of How Does Raising Women’s Full Retirement Age Affect...

How Does Raising Women’s Full Retirement Age Affect Labor Supply, Income, and Mortality? Evidence from Switzerland
Rafael Lalive University of Lausanne
and Stefan Staubli
University of Calgary
Prepared for the 16th Annual Joint Meeting of the Retirement Research Consortium August 7-8, 2014 Washington, DC
The research reported herein was pursuant to a grant from the U.S. Social Security Administration (SSA), funded as part of the Retirement Research Consortium (RRC). The findings and conclusions expressed are solely those of the authors and do not represent the views of SSA, any agency of the federal government, the University of Lausanne, the University of Calgary, or the Center for Retirement Research at Boston College.

Abstract Aging populations put enormous financial pressure on social security. This paper
analyzes the labor market aspects of a large pension reform in Switzerland that increased the full
retirement age (FRA) for women by two years and introduced a penalty of 3.4 percent for
claiming benefits before the FRA. Identification of causal effects is obtained by exploiting large
discontinuities in financial incentives to claim benefits by day of birth. Our empirical analysis
suggests that raising the FRA strongly affects women's labor supply. A one year increase in the
FRA delays labor market exit and claiming of retirement benefits by about half as much. We
find no effect on labor supply and benefit claiming of affected women's spouses. Mortality
increases somewhat among affected women but the effect is not very precisely estimated.
Increasing the FRA has no statistically significant effect on the level of social security benefits
but lowers social security wealth.

1 Introduction
Between 1960 and 2010 the average life expectancy at age 65 in the United States increased
by 4.5 years for men and 4.2 years for women (OECD, 2011b). Over the same period the average
effective retirement age has declined by approximately three years (OECD, 2011a). These forces
have substantial fiscal ramifications for social security. As a reaction to growing financial pressure,
social security reforms in the United States and other countries have implemented measures aimed
at delaying labor force exit of older workers. One of the most discussed and implemented policy
measures is an increase in the retirement age. However, there is surprisingly little evidence on the
impact of this measure on labor force participation and well-being of older workers.
This project examines the causal impact of an increase in the full retirement age (FRA) for
women in Switzerland on labor force participation, income, and health. Specifically, we exploit
exogenous variation in the FRA that is generated by one major pension reform. This reform
became effective in 1997 and increased the FRA for women from age 62 to age 64. The increase
in the FRA occurred in two stages. Women born in 1938 or before were unaffected by the reform,
while the FRA was increased by on year for women born between 1939 and 1941, followed by an
additional one year increase for women born after 1942. Affected women could still claim benefits
at age 62 at a penalty of 3.4% for each year of claiming before the new FRA. This penalty was
increased to 6.8% for women born in 1948 or after, affecting women retiring in 2010 or after.
Studying the Swiss case has several advantages. First, the Swiss context is interesting from a
conceptual point of view. There is no mandatory retirement similar to the U.S. Moreover, there
is no earnings test so individuals can both draw retirement benefits and continue working. This
implies that changes to retirement benefits are induced by a pure wealth effect rather than by
both wealth and substitution effects. Second, we can use the Swiss Social Security Administration
database (SSSD) which contains the complete labor market and earnings histories of 25% of workers
and their spouses in Switzerland. The availability of detailed information on labor market histories
allows for the examination of whether an increase in the FRA has spillover effects into other social
insurance programs and whether there is an effect on the labor supply of the spouse. Third, the
database also contains detailed information on mortality allowing us to explore the health effects of
an increase in the FRA. Given the similarity in the social security system and the aging population
2

Figure 1: International Context: Labor Force Participation
(a) Men, Age 60-6450
5560
6570
75P
erce
nt
1990 1995 2000 2005 2010Year
Switzerland United States
(b) Women, Age 60-64
3035
4045
50P
erce
nt
1990 1995 2000 2005 2010Year
Switzerland United States
Notes: This figure shows labor force participation rates in Switzerland and the United States of 60-64 year oldmen (a) and 60-64 year old women (b).
Source: OECD labor force statistics.
structure, our results can yield important insights go guide social security reform in the United
States.
Switzerland differs from the United States in terms of labor supply of men. Figure 1A shows
labor supply of men aged 60 to 64 in Switzerland and the United States. Swiss men are more
likely to work just before the full retirement age than men in the U.S. Figure 1B reports the same
statistics for women. Women in the United States work somewhat more than Swiss women. But
the trend in labor force participation is very similar and the difference in its level is fairly small.
To identify the effect of the FRA on labor market behavior, income and health, we exploit the
discontinuous increases in the FRA, implying that the birth date is key for determining the eligibility
age for full retirement benefits. The sharp discontinuities in the FRA provide an attractive setting
to analyze the impact of the FRA using a regression discontinuity design that compares women
born just after the cut-off dates (January 1 of 1939 and 1942) to those born before.
Our empirical analysis yields the following insights. First, raising the FRA strongly affects
women’s labor supply. We find that a one year increase in the FRA delays labor market exit by 0.51-
0.66 years and increases the claiming age of retirement benefits by 0.41-0.55 years. Second, there
are no effects on labor supply and benefit claiming of women’s spouses, suggesting that husbands
and wives do not coordinate retirement dates. Third, mortality appears to increase somewhat but
3

the effect is not very precisely estimated. Fourth, we find that social security benefits decrease only
slightly because women’s labor supply adjustment almost fully undoes the negative income effect
from raising the FRA. However, there is sizeable reduction in social security wealth. The reason is
that social security wealth not only looks at pension benefits (which decrease only marginally) but
also at the duration of benefit receipt (which decreases due to the later claiming).
This paper is related to several strands of the literature. Several U.S. studies examine how
the Social Security Amendments of 1983, which increased the FRA from 65 to 67 affected labor
force participation of older workers in the U.S. Blau and Goodstein (2010), Mastrobuoni (2009),
and Song and Manchester (2007) find that the FRA increase led to a significant delay in labor
force exit and benefit claiming among affected birth cohorts. Duggan et al. (2007) find that the
Amendments significantly increased SSDI enrollment. Behaghel and Blau (2012) find that the
benefit claiming hazard at 65 moved in lockstep along with the FRA increase implemented with
the 1983 Amendments. Our paper is also related to the literature on the role of financial incentives
for retirement on labor supply (Krueger and Pischke, 1992;Gruber and Wise, 1999;Coile and Gruber,
2007; and Manoli and Weber, 2014) and the literature on the impact of retirement on health (Kuhn
et al., 2010; Coe and Zamarro, 2011; and Hernaes et al., 2013). This project builds on these papers
but extends them by exploiting stronger and more drastic variation in the FRA. Also by relying
on exceptionally rich administrative data the project allows for the investigation of spillover effects
into other social insurance programs and whether there is an effect on spousal labor supply.
We discuss the institutional background in the next section. Section 3 presents the data and
descriptive analyses. Section 4 discusses our empirical strategy and tests of its validity. Section
5 presents the main results. Section 6 concludes with a summary of our findings and their policy
implications.
2 Background
This section presents the Swiss old age pension system, discusses the reform we use to assess
the effects of raising the full retirement age on labor supply, income, and mortality, and presents
our main hypotheses.
4

2.1 Swiss Pension System
This section aims at providing a short overview of the Swiss pension system before it was
changed in 1995. The Swiss pension system consists of three components.1
The first component is a public pay-as-you go insurance, introduced in 1947. This first pillar
has a strong redistributive character since it is aimed at covering the basic living expenses, the
resulting pension is relatively small, and financed by contributions of 8.4% of every employee’s
wage. The full retirement age (FRA) was set at 65 years for both women and men at inception
but fell to 62 years for women in 1964. The FRA was not mandatory by law but an eligibility
condition for claiming the full old age pension. Pensions are based on contribution years and
average earnings. To qualify for a full pension, men and women need to contribute to the pension
system from age 20 onwards. Men get a full pension after 44 contribution years, women after 42
contribution years. Pensions are reduced by 2.3 percent per missing contribution year. Students
or other non-employed individuals pay voluntary contributions to close holes in their contribution
history. Voluntary contributions are means tested and range from less than 500 CHF (CHF 1 =
USD 1.2) for individuals with wealth below 300,000 CHF to 24,000 CHF for individuals with wealth
at 8,4 Million CHF or higher. Average earnings are based on three aspects: real earnings from
employment or self-employment, supplements for parents who have taken care of children below age
16, and supplements for people who care for relatives in need of care. Supplements are equivalent to
three times the minimal pension. Pensions are between the minimal pension level of about 12,000
CHF and the maximum, twice the minimum. Due to the cap of pensions from below and from
above, pension replacement rates vary a lot across individuals. The replacement rate is 100 % or
more for individuals earning below the minimum pension level. The replacement rate is 34 % or
less for people earning three times the maximum pension level or more. Late claiming up to five
years is possible, entailing an increase in the pension of between 5 and 6 % per year of delaying.
Early claiming was not possible before the reform. There is no earnings test so individuals can
continue working while claiming an old age pension.
Figure 2 shows how the Swiss systems adjusts pensions for early or late claiming. The solid black
line gives the pension adjustment factor for women born before 1938, the last cohort unaffected by
1For details see Queisser and Vittas (2000), especially concerning institutional details, and Butler and Staubli(2011), for the second pillar.
5

Figure 2: Adjustment Factors
9010
011
012
013
0In
dexe
d be
nefit
s (1
00=
age
62, b
orn
<19
38)
62 63 64 65 66 67 68 69 70Age
Born <1939 Born 1939−1941 Born >1941
Notes: This figure shows how the Swiss social security system adjusts women’s old age pensions as a function of
the claiming age for different birth cohorts. Old age pension are indexed, basis (=100): women born in 1938 or
before claiming at age 62 years. Source: Own calculations based on Swiss social security rules.
the reform we discuss below. Women in that cohort could not claim old age pensions before age 62.
Women who started claiming old age pensions at age 62 received the full pension amount. Women
who deferred claiming an old age pension by one year to age 63 were entitled to a pension that was
5.2 % higher than the full pension, unaffected by the top cap. Women who delayed claiming by 2
years to age 64 were eligible for a pension that was 10.8 % higher than the full pension. Women
who delayed claiming an old age pension by the maximum of five years to age 67 received an old
age pension that was 31.5 % higher than the regular pension.
Special rules are in place concerning joint retirement of spouses. The old age pension system
primarily focused on the labor market trajectory of the husband. In case the husband claimed a
retirement pension before the spouse did, he was eligible for the single pension based on his labor
market history. Equivalently, in case the wife claimed a pension before the husband did, she was
eligible for a single pension based on her labor market history. Couples became eligible to a joint
pension amounting of 150% of the individual pension to which the husband is eligible once husband
and wife had reached the statutory pension age.
The occupational benefit plan (second pillar) was formally introduced in 1985 but a variety of
6

schemes were already in place: the law only defined the minimum standards. This pillar intends to
provide retired workers with an appropriate income to guarantee the accustomed (pre-retirement)
standards of living. Federal law imposes employers to contribute at least as much as employees
do: there exits a large degree of flexibility since contribution rates are proposed by pension funds.
Second pillar contributions are mandatory if annual earnings exceed CHF 20,000. Upon reaching
the FRA defined by the first pillar, the cumulated capital can be withdrawn either as monthly life-
long annuity or as lump-sum amount or as a mix of these two. The majority of retired individuals
chooses the annuity even though the first pillar already provides an annuity stream in old age
(Butler and Teppa, 2007). Second pillar pensions can be withdrawn as early as age 58 years, with
actuarially fair adjustment. Late claiming is also possible if the pension plan allows it. The net
replacement rate of the second pillar is on the order of 40 % for the average earner. The second
pillar system is very fragmented: 2,543 pension funds operated in 2007 offering plans that are very
heterogenous regarding claiming and payout options.
The third component is the so-called individual occupation pension scheme. It has been thought
to supplement the state pension with sufficient means to ensure an ultimately comfortable retire-
ment. The contribution rate is decided individually. Contributions to the third pillar are deducted
from taxable income. Payouts of the third pillar are taxed albeit at a reduced rate.
Old age pension replacement rates are fairly high (OECD, 2011b). Together, the first and
second pillars pay out about two thirds of the pre-retirement earnings to the average wage earner.
The net replacement rate is substantially lower for high earners. For instance, individuals earning
twice the average wage see one third of their pre-retirement earnings replaced. High earners rely
heavily on the third pillar to guarantee adequate income replacement. Actuarially fair adjustments
to pensions are made for individuals who claim pensions early or late.
Employment relationships do not end at the FRA (Senti, 2011). Workers who wish to leave
the labor force upon reaching the FRA therefore have to quit their job by formally informing their
employer of their decision. Workers covered by collective agreements or employed in the public
sector may have contracts that terminate automatically upon reaching the FRA. These contract
can, however, be renewed. Continuing work beyond the FRA is often attractive from the financial
point of view as social security contributions and second pillar payments are no longer deducted
from the wage.
7
Partial retirement is not possible in the first pillar. Workers who move to part-time employment
in the years before retiring incur a penalty as their average pension contributions decrease. The
second pillar allows for partial retirement.
2.2 The 1997 Reform
To improve the fiscal health of the public pension system, the Swiss government drafted a major
pension reform in 1995, enacted as of January 1997. The most important element of this reform
was an increase in the FRA for women from age 62 to age 64. The increase occurred in two main
stages. In the first half of the policy change the FRA was increased to age 63 for women born
between 1939 and 1941 affecting all women retiring in 2001 or after. In the second half of the
policy change the FRA was increased to age 64 for women born in 1942 or later, affecting women
retiring in 2005 or after. Affected women could still claim benefits as early as age 62 subject to
a penalty of 3.4% of full benefits for each year of claiming prior to the FRA. This penalty was
increased to 6.8% for women born in 1948 or after, affecting women retiring in 2010 or after.
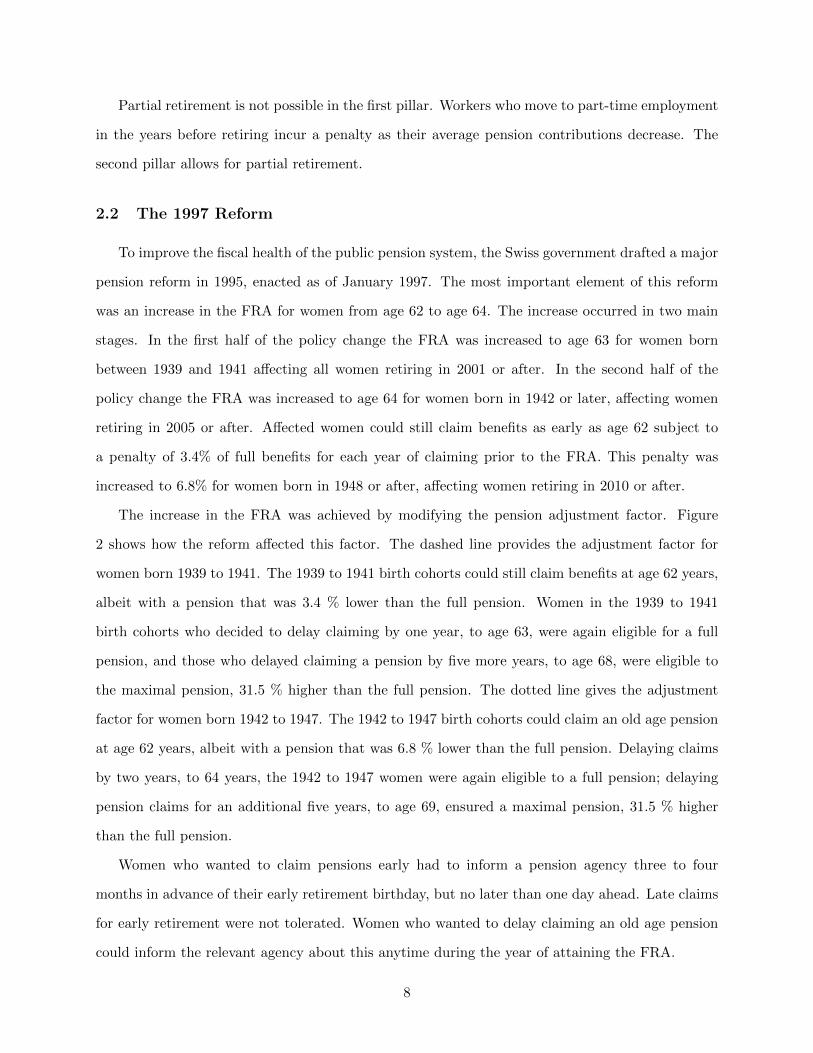
The increase in the FRA was achieved by modifying the pension adjustment factor. Figure
2 shows how the reform affected this factor. The dashed line provides the adjustment factor for
women born 1939 to 1941. The 1939 to 1941 birth cohorts could still claim benefits at age 62 years,
albeit with a pension that was 3.4 % lower than the full pension. Women in the 1939 to 1941
birth cohorts who decided to delay claiming by one year, to age 63, were again eligible for a full
pension, and those who delayed claiming a pension by five more years, to age 68, were eligible to
the maximal pension, 31.5 % higher than the full pension. The dotted line gives the adjustment
factor for women born 1942 to 1947. The 1942 to 1947 birth cohorts could claim an old age pension
at age 62 years, albeit with a pension that was 6.8 % lower than the full pension. Delaying claims
by two years, to 64 years, the 1942 to 1947 women were again eligible to a full pension; delaying
pension claims for an additional five years, to age 69, ensured a maximal pension, 31.5 % higher
than the full pension.
Women who wanted to claim pensions early had to inform a pension agency three to four
months in advance of their early retirement birthday, but no later than one day ahead. Late claims
for early retirement were not tolerated. Women who wanted to delay claiming an old age pension
could inform the relevant agency about this anytime during the year of attaining the FRA.
8

The 1997 reform also affected a number of other details of the pension system. First, he 1997
changed the way the joint pension was calculated (Koller 1998). Once husband and wife wanted
to claim old age pension, the earnings accumulated by husband and wife during the marriage were
split equally between the two. These split careers were used in assessing the level of the pension of
husband and wife. The rules remained roughly similar for unilateral claiming of old age pensions.
This change affected pensions from January 1, 2001 onwards, exception in case of divorce or death
when the new splitting rule took effect immediately.
Second, the 1997 reform abolished supplementary pensions for women born 1942 or later. This
change does not affect our analysis of the increase in the retirement age from 62 to 63 years,
affecting women born before 1942. We carefully assess whether the abolishment of supplementary
pensions interferes with our second analysis, the increase in the FRA from 63 to 64 years. We find
no evidence of it.
Third, the reform introduced early retirement for men. Starting January 1st, 1997, men could
claim one year prior to FRA. The first cohort affected is the cohort born in 1933. The pension
adjustment factor was reduced by 6.8% for retiring early, i.e. twice as much as for women. Starting
January 1st, 2001, men could claim old age pensions at age 63 years, up to two years prior to
the FRA. The first cohort affected is born in 1938. The penalty is 6.8% per year. There were no
changes in supplements for late retirement.
Individuals were informed of the changes brought about by the reform in various ways. First,
the national press discussed the key features of this reform intensely. Second, the Federal Social
Insurance Office (FSIO) printed a leaflet summarizing the key questions people might have and
answering them. The leaflet provided accessible and clear information on the penalty for retiring
at the old FRA and it contained clear information about deferring retirement.
2.3 Research Questions
We are interested in two sets of questions. We first study how increasing the FRA affects
labor supply and pension claiming behavior. The labor supply effects are best understood in the
context of the pension adjustment and claiming age figure 2. The Swiss pension system does not
offer any pension benefits before age 62, a full pension at the full retirement age of 62 (FRA), and
pension benefits that increase in an actuarially fair way until the late retirement age (LRA) of 67.
9

These rules introduce two kinks in the budget set; one at the FRA and one at the LRA. These
kinks introduce bunching in claiming behavior: a first group of women will find it optimal to take
retirement exactly at the FRA; a second group exactly at the LRA of 67. The system will also
encourage continuous claiming behavior between the FRA and LRA.
The increase in the FRA from age 62 to age 63 induces a negative income effect. The budget
set shifts downward by 3.4 percentage points between the old FRA (age 62) and the new FRA (63
years), and by about 5-6 percentage points between the new FRA and the new LRA (age 68). The
pension system after the reform still features a strong kink at the old FRA (age 62), a continuous
and upward sloping profile thereafter, and a new kink at the new LRA (age 68).
Fully informed and forward looking women will adjust labor supply in response to this negative
income effect. Specifically, women who were just indifferent between taking retirement at the old
FRA and working a bit longer will now work longer. Also, women who were just indifferent between
taking retirement at the LRA and working a bit less than that will now continue to work to the
new LRA. But these two groups are likely to be small compared to the population, assuming that
preferences for work and leisure follow a continuous distribution. Standard labor supply theory
suggests the effect of raising the FRA from age 62 to age 63 will be limited.
It is possible, however, that women were not fully informed about the nature of the policy
change. Specifically, women might have perceived the change as moving the kink at the old FRA
to the new FRA. Partially informed women will respond much more strongly to the policy change
than fully informed women. Specifically, all women with strong preference for leisure, who would
have taken retirement at the old FRA, now will do so at the new FRA since they believe that
pension benefits are zero before the FRA.
Reality is likely to consist of both fully and partially informed women. Fully-informed women
with strong preference for leisure will continue to take retirement at the old FRA. Partially-informed
women with strong preference for leisure will take retirement at the new FRA. The extent of the
labor supply response and its timing will be informative on the size of the two sub-groups. We will
pay attention to the detailed timing of the labor supply response in our analysis below. We also
study to what extent an employment response is likely to be full-time or part-time by studying
effects on monthly earnings, setting to zero earnings for women who do not work. We also study
whether increasing the FRA for women affects their spouse’s labor supply decisions.
10

Women can delay old-age pension claiming also by entering other income support programs. We
study to what extent increasing the FRA affects UI inflow and DI inflow. Note that both UI and
DI claimants continue to accumulate work experience enabling them to avoid reductions in their
pensions due to lack of complete work history. Women can also delay old-age pension claiming
while continuing to accumulate contribution years by paying the voluntary contributions.
How increasing the FRA affects old age pension claiming behavior is a central policy question.
We analyze how this reform affects claiming of old age pensions, and contrast it all pension claiming
behavior. This distinction will be important as a small proportion of women already leave the labor
force long before the FRA via DI.
A second set of questions concerns the health and income effects of increasing the FRA. A key
welfare rationale for retirement programs is deteriorating health among older workers. We study
whether an increase in the FRA affects health. Specifically, we ask whether women whose FRA
was increased from age 62 to age 63 in 2001 were more likely to die by the year 2012 (the last year
observed in our data). A second welfare implication is the possible reduction in pension benefits
for women who continue to take retirement at the old FRA. We study how increases in the FRA
affect the level of pension benefits and social security wealth.
3 Data and Descriptive Statistics
3.1 Data
Our empirical analysis uses Swiss Social Security data (SSSD) from two sources. The first data
source is a 25 % random sample of the individual accounts that register pension contributions giving
access to labor market histories starting in 1982 currently observed until the end of 2012. Individual
accounts contain detailed information on labor supply. Employed or self-employed individuals
generate one record per employment per year that details the starting and ending month of an
employment relationship along with the total earnings over that time period, without information
on full- or part-time status. Unemployed benefit recipients also generate one record per year
that contains information on unemployment benefits and the starting and ending months of an
unemployment spell. Individual accounts also contain information on dates of birth (daily precision)
and nationality.
11

The second data source contains information on all disability and old age pension claims matched
to the 25 % sample of individuals above. For old age pensions, we observe the start date of the
old age pension, its benefit level along with the contribution years and average indexed monthly
earnings used to calculate the pension level. For disability pensions, we observe the start date
of the disability pension, its level, and the reasons for granting it. The pension claims data also
contains information on mortality as both disability and old age pension claims terminate when its
claimant dies. Pension claims also contain an identifier for the married spouse, information that
we use to match information on spouses.
3.2 Descriptive Statistics
We extract a series of samples of women with labor force attachment who were just affected or
not affected by the changes implemented with the reform. Specifically, we focus on women born
between 1938 and 1939 and between 1941 and 1942. We exclude the following sets of women:
women who are never employed between age 50 and age 53, women who claim a disability pension
before age 53, and women who never claim an old-age pension.
Our empirical analysis focuses on the following key outcome variables. Exit Age is the last age
an individual has positive earnings in the individual accounts data (monthly precision). Claiming
Age is the age an individual first starts claiming a disability or old-age pension (daily precision).
Mortality is the probability to die by 2012, the last year we observe in our data. Social Security
Benefits refer to the old age pension amount (in CHF per year). We also construct a measure of
Social Security Wealth as the expected sum of discounted benefits after the claiming age. Specifi-
cally SS Wealth=∑T
s=Rb(s=R)
(1+r)(s−R) ∗ ps|R where R is claiming age, T is the maximum age possible
(assumed to be 100), r is the discount rate (set at 2.5%), and ps|R is the probability to be alive at
date s conditional on claiming old age pension benefits at age R.
Table 1 reports summary statistics for the two samples we use to measure the effects of increasing
the FRA from 62 to 63 years (column 1), and from 63 to 64 years (column 2). Panel A provides
statistics on the key outcome variables. Women leave the labor force about one to two years before
the FRA. Average claiming age is within one year of the FRA. Mortality is around 7 percent for
the cohort affected by the reform increasing the FRA from age 62 to age 63 (in 2001) and lower for
the cohort affected by the increase from age 63 to age 64 (in 2005). Average social security benefits
12

Table 1: Summary Statistics
FRA 62 ⇒ 63 years FRA 63 ⇒ 64 years(1) (2)
A. Outcome variablesExit Age (years) 60.8 (4.14) 61.4 (4.18)Claiming Age (years) 61.8 (1.93) 62.4 (2.3)Mortality, Pr(die by 2012), % 6.9 (25.4) 5 (21.7)SS benefits (CHF per year) 20110 (4850) 20376 (4887)SS wealth (CHF) 473054 (113676) 471680 (112112)
B. Characteristics% married 55 (49.8) 57.3 (49.5)Age wife - age husband (years) -3 (5.63) -2.6 (5.55)% foreign 18 (38.4) 15.5 (36.2)Average indexed earnings (CHF per year) 52757 (27418) 55106 (31033)% supplemental benefits spouse 40.9 (49.2) 29.6 (45.6)Supplemental benefits amount (CHF per year) 7219 (1600) 7188 (1599)Earnings at age 55 (CHF per year) 37743 (38429) 39924 (57741)
No. observations 22,908 27,766
Notes: This table reports summary statistics of key outcome variables in Panel A, and background characteristicsin Panel B for the two samples we use to measure the effects of increasing the FRA. The FRA 62 to 63 yearssample refers to the cohorts born 1938 and 1939, the FRA 63 to 64 years sample refers to the cohorts born 1941and 1942.
Source: Own calculations, based on SSSD.
are around 20,000 CHF for one year. Discounted social security wealth is about 23 times larger.
Panel B of Table 1 shows summary statistics on key background variables. About 55 percent of
women are married and those who are, are on average 2.6-3 years younger than their spouse. About
one in five or six women has a non-Swiss nationality. Average indexed earnings are 52,757 CHF per
year for the 62 to 63 years sample, and 55,106 CHF per year for the 63 to 64 years sample. Old age
benefits replace about 38 percent (=20,110/52,757 * 100) of indexed earnings in the 62 to 63 years
sample, and the replacement rate is similar for the 63 to 64 years sample. About 40 % of the women
in the 62 to 63 years sample get a supplementary pension. Supplementary pensions are much less
frequent in the 63 to 64 years sample; only 30 percent of all women receive one. The supplemental
benefit amount is on the order of one third of the old age pension; supplementary pensions are
a substantial part of retirement income among women. Annual earnings at age 55 are between
37,743 CHF in the older cohorts (or 3,145 CHF per month), and 39,924 in the younger cohorts
13

(or 3,327 CHF per month). Annual earnings measure earnings over the entire year regardless of
whether a women worked or not; periods of non-employment contributing zero to annual earnings.
This explains why annual earnings are substantially lower than indexed earnings. Old age pensions
replace a substantial proportion of annual earnings: the replacement rate is 53 percent in the
younger cohort, and 51 percent in the older cohort.
Figure 3 shows labor force participation and pension claiming behavior from age 50 to 75 years,
for the cohort entering retirement before the FRA was increased. Figure 3(a) shows results for
women. The bold line gives the proportion of women working in each age (measured in monthly
precision). Almost all women in our analysis sample are employed at age 50 but many leave the
labor market already before reaching the FRA: the proportion working is about 90 percent at age
55, about 65 percent age age 60, and 50 percent in the month before celebrating the 62nd birthday.
About 30 percent of all women leave the world of work exactly at age 62 years, the FRA before the
reform. Women who are older than the FRA retire continuously from the world of work between
age 62 and age 75 years. The light line shows the proportion of women on disability or old age
pensions. This share is exactly zero at age 50 years, increases somewhat to 5 percent age age 55,
and further to about 15 percent between age 60 and 62 years. Almost all women start to claim old
age pension benefits exactly in the month they turn 62 years, i.e. exactly upon reaching the FRA.
By contrast, the LRA appears is quantitatively irrelevant: fewer than 1 percent of all women defer
claiming an old age pension beyond the FRA.
Figure 3 (b) shows results for men for comparison. Overall, men’s life-cycle labor supply profile
is very similar to the profile for women but recall that we focus on a sub-group of women with labor
force attachment. One key difference is the proportion of men still working just before turning 65
years old, i.e. jut before reaching the FRA. The proportion working just before the FRA is 40
percent among men and 50 percent among women. But this is because men’s FRA is three years
later than women’s FRA. In contrast, the proportion on some form of pension is much higher for
men than for women. It starts at zero at the age of 50, but quickly increases after the 55th birthday
to reach a level of about 38 percent on the eve of the 65th birthday. We suspect that more men
than women manage to gain access to the disability system. As for women, almost all remaining
men start claiming an old age pension upon celebrating their 65th birthday. Again, late claiming
is not quantitatively important among Swiss men.
14

Figure 3: Labor Force Participation and Pension Claims Around Retirement
(a) Women0
.2.4
.6.8
1P
erce
nt
50 55 60 65 70 75Age
Labor force participation Pension claims
(b) Men
0.2
.4.6
.81
Per
cent
50 55 60 65 70 75Age
Labor force participation Pension claims
Notes: This figure shows profiles of labor force participation and pension claims for women born 1938 (a) andmen born 1938 (b) where age is measured at a monthly frequency.
Source: Source: Own calculations, based on SSSD.
4 Empirical Strategy
Our goal is to estimate how women’s FRA affects their labor supply behavior and health as
well as the labor supply behavior of the spouse. To address these questions, we exploit the quasi-
experimental increase in the FRA for women arising from the 2001 reform using a regression
discontinuity design (RDD). Specifically, we exploit the increase in the FRA to 63 for women born
in 1939, as well as the fact that the FRA remained at 62 years for their counterparts born in
1938. We can estimate the causal effects of increasing the FRA by comparing women who are born
after December 31, 1938 (treated group) with those who are born on December 31, 1938 or before
(control group). A similar discontinuity in the birth date can be exploited to examine the second
increase in the FRA for women from 63 to 64. This comparison will yield unbiased estimates if the
distribution of observable and unobservable characteristics is similar to the left and to the right of
the age threshold.
The regression discontinuity approach can be implemented by estimating regressions of the
following type:
yi = α+ βDi + γ0(1−Di)f(Zi − c) + γ1f(Zi − c) +X ′iδ + εi (1)
15
where i denotes individual, Di is a dummy that is equal to 1 if a woman is born after December 31,
1938 and 0 otherwise, Zi denotes a womans birth date, c is the cut-off date for the FRA increase
(January 1, 1939), and f is a function of the difference between a womans birth date and January
1, 1939. The coefficient of interest is β which measures the impact of the increase in the FRA on
the outcome variable yi.
We will first examine the impact of the FRA on labor market exit and benefit claiming. Here the
outcome variable yi denotes the age of labor force exit and the age of benefit claiming, respectively.
We can run similar regressions to examine the impact on spousal labor supply where yi denotes the
age of labor force exit (benefit claiming) of the husband. In a second step we will examine the labor
market effects in more detail, in particular spillover effects into other social insurance programs.
In this case the outcome variable is a dummy for whether a woman is employed, unemployed, or
receiving disability benefits at a particular age. Finally, to examine the impact of an increase in
FRA on health, the outcome variable denotes death by a certain age.
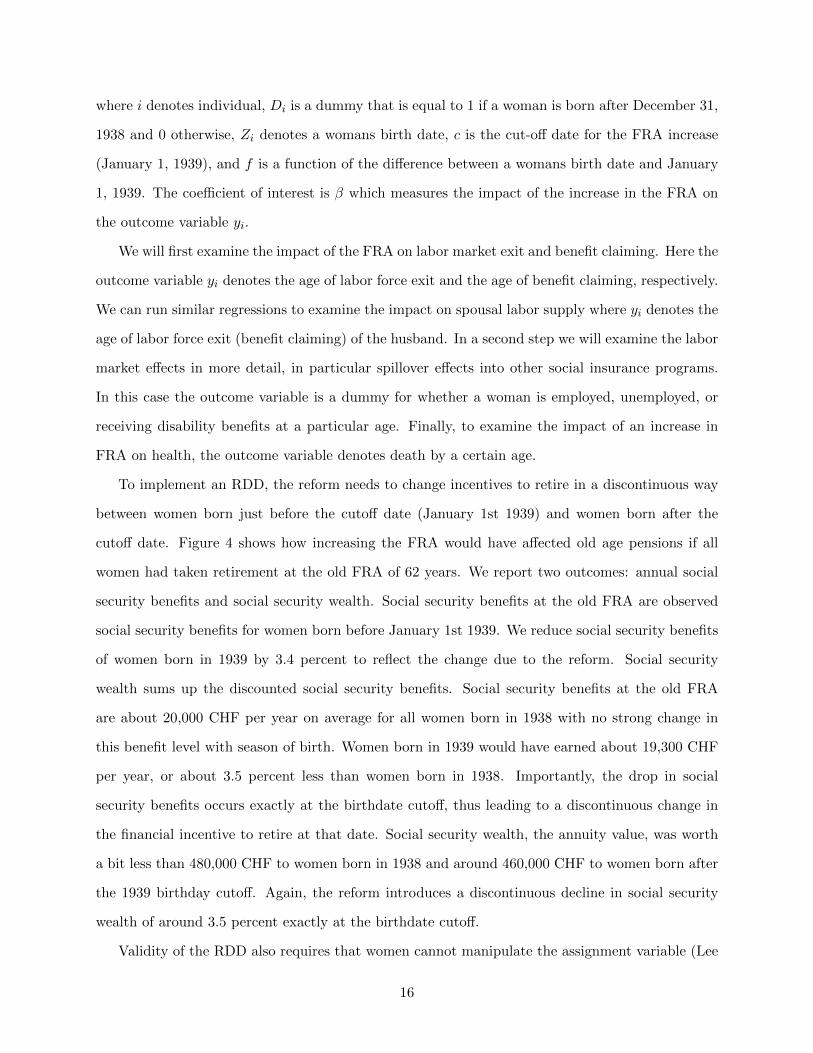
To implement an RDD, the reform needs to change incentives to retire in a discontinuous way
between women born just before the cutoff date (January 1st 1939) and women born after the
cutoff date. Figure 4 shows how increasing the FRA would have affected old age pensions if all
women had taken retirement at the old FRA of 62 years. We report two outcomes: annual social
security benefits and social security wealth. Social security benefits at the old FRA are observed
social security benefits for women born before January 1st 1939. We reduce social security benefits
of women born in 1939 by 3.4 percent to reflect the change due to the reform. Social security
wealth sums up the discounted social security benefits. Social security benefits at the old FRA
are about 20,000 CHF per year on average for all women born in 1938 with no strong change in
this benefit level with season of birth. Women born in 1939 would have earned about 19,300 CHF
per year, or about 3.5 percent less than women born in 1938. Importantly, the drop in social
security benefits occurs exactly at the birthdate cutoff, thus leading to a discontinuous change in
the financial incentive to retire at that date. Social security wealth, the annuity value, was worth
a bit less than 480,000 CHF to women born in 1938 and around 460,000 CHF to women born after
the 1939 birthday cutoff. Again, the reform introduces a discontinuous decline in social security
wealth of around 3.5 percent exactly at the birthdate cutoff.
Validity of the RDD also requires that women cannot manipulate the assignment variable (Lee
16

Figure 4: SS Pension Benefits and SS Wealth (Without Adjustment)
(a) Benefits (CHF per year)16
000
1700
018
000
1900
020
000
2100
022
000
Sw
iss
fran
cs
−12 −9 −6 −3 0 3 6 9 12Birth date − cutoff
(b) SS Wealth (CHF)
4000
0042
0000
4400
0046
0000
4800
0050
0000
Sw
iss
fran
cs
−12 −9 −6 −3 0 3 6 9 12Birth date − cutoff
Notes: This figure shows mean pension benefits (a) and social security wealth (b) that women would have receivedif they had not adjusted their pension claiming age to the increase in the FRA from 62 to 63 years (in 2001).
Source: Own calculations, SSSD.
and Lemieux, 2010). In our context, the assignment variable is the date of birth of women in
the birth cohorts 1938 and 1939. Clearly, is impossible that women or their parents manipulated
the date of birth in anticipation of the policy change. But seasonality in births or other policy
changes or anticipation of WWII could still have been driving dates of birth. We are not aware of
any change in the incentive to give birth in 1939 as opposed to 1938. We carefully examine the
distribution of co-variates and the number of women born in 1938 and 1939. We find neither a
discontinuity in background variables nor a discontinuous change in the number of women born
around the cutoff date (Figure A.1). These checks suggest that the RDD is valid.
5 Results
5.1 Labor Supply and Pension Claiming
Figure 5 shows how women’s exit age changes in response to increasing the FRA from 62 to 63
years. Women unaffected by the increase in the FRA leave the labor force at about age 60.5 year,
1.5 years before reaching the FRA. In contrast, the first cohort of women subject to the new FRA
leaves the labor force at age 61 years, about 2 years before reaching the new FRA. The reform
induce women to delay their labor force exit by about half a year.
17

Figure 5: Effect on Women’s Labor Force Exit Age, FRA 62 to 63
59.5
6060
.561
61.5
6262
.563
Age
−12 −9 −6 −3 0 3 6 9 12Birth date − cutoff
Notes: This figure reports the average labor force exit age for the women just affected or not affected by theincrease of the FRA fromo 62 years to 63 years. The x-axis reports the date of birth minus the reform cutoff onJanuary 1st 1939. The solid line refers to women born in 1938 who were just not affected by the reform. Thelight line refers to women born in 1939 just affected by the reform.
Source: Own calculations, SSSD.
Figure 6 shows how the reform affected the life cycle labor supply profile in the years before and
after the FRA. The dark line is the the labor supply profile of the last cohort of women unaffected
by the reform (born 1938); the light line shows the labor supply profile of the first cohort affected
by the reform (born 1939). The labor supply profile of the women just not affected by the reform
is the same one we discussed earlier. Increasing the FRA by one year changes the timing of labor
force exit around the old and new FRA in important ways. Women who can get a full pension only
at age 63 years are substantially more likely to continue working until that age. About 38 percent
of women born in 1939 still work on the eve of their 63rd birthday but only about 12 percent of all
women born 1938 do so at that time. The reform also increases labor supply somewhat just before
the old FRA and just after the new FRA. A small sub-group of a the women born in 1939 continue
to leave the labor force the old FRA of 62 years.
The previous figure contrasts the labor supply profiles of two birth cohorts. Figure 7 shows how
increasing the FRA affects employment and earnings adopting using the RDD estimation approach.
Figure 7(a) shows causal effects on employment, essentially the difference between the labor supply
18

Figure 6: Effect on the Labor Supply Profile, FRA 62 to 63
0.2
.4.6
.81
Per
cent
50 55 60 65 70 75Age
1938 1939
Notes: This figure shows the proportion working by age for women born 1938 (with FRA 62 years; dark line) andwomen born 1939 (with FRA 63 years; light line). Increasing the FRA changes labor supply strongly in the agebracket between the old FRA and the new FRA.
Source: Own calculations, based on SSSD.
profiles reported in the figure above. The solid vertical line indicates the year women were informed
about the increase in the FRA from 62 to 63 years. Increasing the FRA does changes employment
of women in the aged 61 to 63 years. Women who know their FRA moved to 63 years are about 12
percentage points less likely to leave the labor force on their 61st birthday and continue to remain
8 to 9 percentage points employed more likely until their 62nd birthday (differences are on the
margin of statistical significance). Moving the FRA to 63 years also strongly encourages work at
age 62 years. The difference is particularly pronounced in the month women turn 62 years old
(35 percentage points) and it remains sizeable throughout the entire 62nd year of life (about 25
percentage points). Moving the FRA to 63 years also encourages somewhat more work at age 63
years but the differences are smaller (5 percent) and not statistically significant.
Figure 7(a) shows that increasing the FRA generates additional employment, an extensive mar-
gin effect. Figure 7(b) reports effects on monthly earnings, setting earnings to zero for women who
are not employed. Earnings reflect both changes at the extensive and intensive margin. Increasing
the FRA generates significantly higher earnings at age 62 years, when the control cohort of women
could already claim a full pension but the treated women could not. The earnings effect is sizeable:
19

Figure 7: RDD Effects on Employment and Earnings, FRA 62 to 63
(a) Employment−
100
1020
3040
53 54 55 56 57 58 59 60 61 62 63 64 65Age
(b) Earnings
−10
000
1000
2000
53 54 55 56 57 58 59 60 61 62 63 64 65Age
Notes: This figure reports RDD estimates of the effects of increasing the FRA from 62 to 63 years on employment(a) and monthly earnings (b) along with the 95 % confidence interval. The vertical line indicates the age whenwomen were informed of the reform.
Source: Own calculations, based on SSSD.
treated women earn about 1,000 CHF more age age 62 than control women. Recall that about
one in four women was induced to work at age 62 years in response to the increase in the FRA.
We conclude that increasing the FRA generated a monthly salary of about 4,000 CHF per month
(=1,000 CHF / 0.25) for each women induced to work due to the increase in the FRA, higher than
average monthly earnings at age 55 of 3,145 CHF. Increasing the FRA also generates somewhat
higher earnings at age 61 years but the effects are nowhere near statistical significance. Increasing
the FRA does not affect earnings at any other age, consistent with results for employment.2
Increasing the FRA induces some women to work longer, what happens to the women who do not
work? Figure 8 reports RDD effects on unemployment insurance (UI) inflow, disability insurance
(DI) inflow, and non-employment (NE) contributions. Figure 8(a) shows that increasing the FRA
increases UI inflow by about 0.5 percentage points at age 62 years. This effect is statistically
significant but economically small. Figure 8(b) shows that raising the FRA also increases DI inflow
by 2 percentage points at age 61 and by one percentage point at age 62 years. These effects are not
only statistically significant but also economically important. Non-employed women can also make
NE contributions to accumulate pension contribution years and to avoid a cut in their pension
2Increasing women’s FRA might also affect spousal labor supply. Figure A.2 reports RDD effects on the exit ageof the spouse. Spouses leave the labor market on average at age 64. Increasing the FRA does not affect that decision.
20

Figure 8: RDD Effects on Unemployment, Disability, and Pension Contributions, FRA 62 to 63
(a) UI Inflow−
4−
20
24
53 54 55 56 57 58 59 60 61 62 63 64 65Age
(b) DI Inflow
−2
02
4
53 54 55 56 57 58 59 60 61 62 63 64 65Age
(c) NE Contributions
−10
010
2030
40
53 54 55 56 57 58 59 60 61 62 63 64 65Age
Notes: This figure reports RDD effects of increasing the FRA from 62 to 63 years on UI inflow (a), DI inflow (b),and NE contributions (c). We report average effects by age in years since monthly figures are extremely noisy (DIand UI) or because the timing of NE contributions within age years is not informative. The vertical line indicatesthe age when women were informed of the reform.
Source: Own calculations, based on SSSD.
benefits of 2.4 percentage points per missing contribution year. Figure 8(c) shows that increasing
the FRA encourages women to make more NE contributions. The effects are sizeable: 38 percent
more women contribute at age 61, and 42 percent more women do so at age 62 years. These results
suggest that non-employed women find it worthwhile to make the NE contribution payments rather
than see their pension benefits reduced.
We now turn to discussing effects on pension claiming behavior. Figure 9 shows how increasing
the FRA from 62 to 63 years affects the age when women first claim an old age pension. Women
who were not affected by this reform started claiming an old age pension exactly upon reaching the
FRA. This finding shows that early claiming was not possible and late claiming was not empirically
relevant. Increasing the FRA from 62 to 63 years increased the old age pension claiming age to
62.7 years, a sizeable effect.
But note that about 15 percent of all women already claim a disability pension before entering
retirement. These pensions claims are mechanically postponed by the reform but do not generate
savings to the combined budget of old age pensions and disability insurance. Figure 10 reports how
increasing the FRA from 62 to 63 years affects the all pension claiming age, the age a women starts
claiming either an old age or a disability pension. This all pension claiming age is 61.5 years for
women not subject to the reform. The all pension claiming age is quite a bit lower than the FRA
because some women enter disability insurance before claiming an old age pension. Increasing the
21

Figure 9: Effect on Old-Age Pensions Claiming Age, FRA 62 to 63
60.5
6161
.562
62.5
6363
.564
Age
−12 −9 −6 −3 0 3 6 9 12Birth date − cutoff
Notes: This figure reports the average age when women start claiming their old age pension. Women born in1938 (dark line) do so exactly at age 62 years, the old FRA. Women born in 1939 (light line) do so at 62.7 years,about 3 to 4 months before reaching the new FRA.
Source: Own calculations, based on SSSD.
FRA from 62 to 63 years raises the all pension claiming age to 62 years, or by about 0.5 years.
This effects is smaller than the effect on the old age pension claiming age.3
5.2 Health and Income Effects
We now turn to discussing welfare effects of increasing the FRA. Two questions are central
from the welfare perspective. First, one key rationale for retirement is to provide people with the
means to leave the world of work who suffer from a reduced ability to work. Lengthening the work
life might therefore harm health. Second, increasing the FRA by reducing the pensions people get
when retiring at the old FRA might affect retiree incomes.
We first study possible health effects of increasing the FRA. Figure 11 reports mortality, i.e.
the probability to die by December 2012 (the last year we observe in our data). Mortality decreases
in date of birth, probably reflecting the fact that the observation window is shorter for women born
late. Women born in 1938 (dark line) face a mortality risk of about 6 to 7 percent. The risk is of
similar magnitude for women born in 1939 (light line). Mortality risk is a tad higher for women
3We have also checked whether the reform affects spouse’s pension claiming behavior and find no effect.
22

Figure 10: Effect on All Pension Claiming Age, FRA 62 to 63
60.5
6161
.562
62.5
6363
.564
Age
−12 −9 −6 −3 0 3 6 9 12Birth date − cutoff
Notes: This figure reports the average all pension claiming age, i.e. the age a women starts claiming either an oldage or a disability pension. Women born in 1938 (dark line) claim their first pension at age 61.5. Women bornin 1939 (light line) claim their first pension at age 62. Increasing the FRA raises the all pension claiming age byabout 0.5 years.
Source: Own calculations, based on SSSD.
just born after the reform cutoff than just before it suggesting that increasing the FRA could have
hurt health but this effect is not robust / significant.
Figure 12 shows how the reform affects pension benefits and social security wealth. Figure 12(a)
reports actual social security pension benefits women get. Women born in 1938 (dark line) who were
not affected by the reform earn about 20,300 CHF per year in old age pension benefits. Increasing
the FRA from 62 to 63 years reduces annual pension benefits somewhat to about 20,000 CHF.
The effect of increasing the FRA is about 1.5 of a percentage points which is small. This result
is consistent with our earlier results on labor supply and NE contributions suggesting substantial
adjustment to the policy change.
Figure 12(b) shows social security wealth. The annuity value of social security benefits is on the
order of 480,000 CHF to women born just before the reform cutoff; that value decreases to about
465,000 CHF for women born just after the reform cutoff. Interestingly, the effect of increasing the
FRA on social security wealth is on the order of 3 percentage points, substantially larger than the
effect of that reform on pension benefits. This is because social security wealth not only looks at
23

Figure 11: Effects on Mortality, FRA 62 to 63
0.0
5.1
.15
.2P
r(di
e by
201
2)
−12 −9 −6 −3 0 3 6 9 12Birth date − cutoff
Notes: This figure shows mortality risk, the probability to die between 2001 and December 2012. Women bornin 1938 (dark line) face a mortality risk of 7 to 8 percent, women born in 1939 (light line) face a risk of 5 to 8percent. Increasing the FRA slightly but insignificantly increased mortality risk.
Source: Own calculations, based on SSSD.
Figure 12: Effects on Pension Benefits and Social Security Wealth, FRA 62 to 63
(a) Actual benefits (CHF per year)
1600
017
000
1800
019
000
2000
021
000
2200
0S
wis
s fr
ancs
−12 −9 −6 −3 0 3 6 9 12Birth date − cutoff
(b) Actual SS wealth (CHF)
4000
0042
0000
4400
0046
0000
4800
0050
0000
Sw
iss
fran
cs
−12 −9 −6 −3 0 3 6 9 12Birth date − cutoff
Notes: This figure reports pension benefits (a) and social security wealth (b) for women born just before (darkline) and just after (light line) the January 1st, 1939 cutoff for raising the FRA from 62 to 63 years.
Source: Own calculations, based on SSSD.
24

pension benefits (which decrease only marginally) but also at the duration of benefit receipt (which
decreases due to the later claiming).
5.3 Anticipation Effects in the 2005 reform?
So far, we discussed the effects of increasing the FRA from 62 to 63 years. This reform generated
large responses in the period around the old and new FRA ages but relatively little anticipatory
responses. One reason for the absence of anticipation effects might be the short time span between
announcing the reform in 1997 and its implementation in 2001, only four years.
The 63 to 64 increase in the FRA allows us to study whether anticipation effects would be
present with a longer information window. That reform was announced in 1997 and took effect
only in 2005, a period of 8 years. Figure 13 shows the labor supply profile for women born in 1941
(eligible for a full pension at age 63 years) and for women born in 1942 (eligible for a full pension
at age 64 years). Contrasting the labor supply profiles reveals that the largest effect of increasing
the FRA again takes place at age 63 years, the year when the young cohort lost eligibility to a full
pension. But the two profiles also indicate much higher labor supply already at age 62 years, one
year before the old cohort could reaches the FRA, and at age 64 years, the year after the young
cohort became eligible for a full pension.
Figure 14 reports RDD effects of increasing the FRA from 63 to 64 years on employment and
earnings. Figure 14(a) shows results on employment. There are no differences in employment before
women were informed that the FRA would increase (to the left of the vertical line). Interestingly,
raising the FRA from 62 to 63 appears to depress employment somewhat between age 58 and 59
years by about 5 to 10 percentage points. Raising the FRA also encourages more employment
between age 62 and 63 years. The additional employment effects are sizeable: strongest at age 63
years (about 33 percent more) but also sizeable and significant at age 62 years (10 percent) and 64
years (5 percent). These results suggest that anticipatory behavior might play a role.
Figure 14(b) shows the effects of raising the FRA from 63 to 64 years on earnings. As for
employment, there are no effects on earnings before the reform was announced (to the left of the
vertical line). Increasing the FRA from 63 to 64 years decreases earnings at age 58 and 59 years,
by about about 500 CHF (marginally significant). Increasing the FRA leads to significantly higher
earnings at age 63 years, with no significant effects at age 62 and 64 years.
25

Figure 13: FRA 63⇒64: Labor Supply, FRA 63 to 64
0.2
.4.6
.81
Per
cent
50 55 60 65 70 75Age
1941 1942
Notes: This figure shows the proportion working by age for women born 1941 (with FRA 63 years; dark line) andwomen born 1942 (with FRA 64 years; light line). Increasing the FRA changes labor supply strongly in the agebracket between the old FRA and the new FRA.
Source: Own calculations, based on SSSD.
Figure 14: Effects on Employment and Earnings, FRA 63 to 64
(a) Employment
−20
020
4060
53 54 55 56 57 58 59 60 61 62 63 64 65Age
(b) Earnings
−10
00−
500
050
010
0015
00
53 54 55 56 57 58 59 60 61 62 63 64 65Age
Notes: This figure reports RDD estimates of the effects of increasing the FRA from 63 to 64 years on employment(a) and monthly earnings (b) along with the 95 % confidence interval. The vertical line indicates the age whenwomen were informed of the reform.
Source: Own calculations, based on SSSD.
26

Figure 15: Effects on Unemployment, Disability, and Contributions, FRA 63 to 64
(a) UI Inflow−
4−
20
24
53 54 55 56 57 58 59 60 61 62 63 64 65Age
(b) DI Inflow
−4
−2
02
4
53 54 55 56 57 58 59 60 61 62 63 64 65Age
(c) Contributions
010
2030
40
53 54 55 56 57 58 59 60 61 62 63 64 65Age
Notes: This figure reports RDD effects of increasing the FRA from 63 to 64 years on UI inflow (a), DI inflow (b),and NE contributions (c). We report average effects by age in years since monthly figures are extremely noisy (DIand UI) or because the timing of NE contributions within age years is not informative. The vertical line indicatesthe age when women were informed of the reform.
Source: Own calculations, based on SSSD.
Figure 15 shows effects on UI inflow (a), DI inflow (b), and NE contributions (c). The effect
on UI inflows is of similar magnitude than for the earlier reform. DI inflows are less affected. NE
contributions are about 7 to 8 percentage points higher at age 58 and 59 years (explaining why
women worked less during those two years) and they remain higher later on. The effect is smaller
at age 60 and 61 years (5 to 6 percentage points, insignificant) and sizeable at age 62 and 63 years
(31 and 37 percentage points, respectively).
5.4 Overview
Table 2 gives an overview of the effects of increasing women’s retirement age on labor supply,
health, and income. Columns (1)-(3) show estimates of equation (1) for the increase in the FRA
from 62 to 63 while columns (4)-(6) report analogous estimates for the increase in the FRA from 63
to 64. All specifications use a local linear regression with triangular kernel but differ in the choice
of bandwidth. We report estimates for three different bandwidths: 3, 6, and 9 months on each side
of the cut-off birthdate.
Column (1) of the first row shows that raising the FRA from 62 to 63 increases the exit age
by 0.512 years. Since the bandwidth is only 3 months on each side of the cut-off, the effect is not
very precisely estimated and statistically insignificant. The size of the increase in the exit age is
somewhat larger, 0.662 to 0.663 years, and statistically significant for the bandwidths of 6 and 9
27

months, as shown in columns (2) and (3) of the first row. Columns (4)-(6) show that the estimated
effect on the exit age is very similar for the second increase in the FRA from 63 to 64. This finding
suggests that labor supply adjustments were similar for both increases in the FRA, despite the fact
that women affected by the second FRA increase were informed four years earlier about the change
than their counterparts affected by the first FRA increase.
Rows 2 to 5 examine the labor supply effects in more detail by estimating the change in em-
ployment at each age between 61 and 64. The estimates indicate that most of the labor supply
adjustment takes place at the old FRA (62 for the first and 63 for the second FRA increase). At
this age employment increases by 23.2-34.1 percentage points for the first FRA increase and by
31-32 percentage points for the second FRA increase. There is also a significant increase in employ-
ment of 6.3 to 10.9 percentage points in the year before the old FRA (61 (62) for the first (second)
FRA increase), suggesting that anticipation effects play some role. We also find a positive effect
on employment in the year of the new FRA which indicates that some women delay labor market
exit by more than a year as a response to a one year increase in the FRA.
Columns (1) to (3) of row 6 show that women delayed benefit claims by 0.406-0.525 years as
a response to the increase in the FRA from 62 to 63. The estimated increase in the claiming age
is slightly larger for the FRA increase from 63 to 64, as illustrated in columns (4) to (6) of row 6.
The absolute size of the effect on the claiming age is slightly smaller than the corresponding effect
on the exit age.
Panel B of Table 2 reports RDD estimates for the impact of the reform on mortality, social
security benefits, and social security wealth. The estimates for the probability to die by 2012 and
before age 70 are positive but in most cases the estimates are statistically insignificant due to the
lack of precision. The generosity of the annual social security benefits drops only marginally by
278-533 CHF, reflecting the fact that a larger share of women delays claiming to avoid any reduction
in benefits. However, the FRA increases led to a substantial reduction in social security wealth
of 13,300-19,800 CHF, because women affected by the FRA increases receive benefits for 0.5 years
less on average.
28

Table 2: Overview of Main Effects
FRA 62 to 63 years FRA 63 to 64 years
(1) (2) (3) (4) (5) (6)
A. Labor supply and claiming effectsExit age (years) 0.512 0.663??? 0.662??? 0.556? 0.577??? 0.604???
(0.336) (0.19) (0.15) (0.295) (0.168) (0.128)Employed, 61 years 6.6 6.3??? 8.7??? 0.2 1.1 2.9?
(4.1) (2.3) (1.8) (3.8) (2.1) (1.6)Employed, 62 years 23.2??? 30.1??? 34.1??? 10.5??? 10??? 10.9???
(3) (1.9) (1.4) (3.9) (2.1) (1.7)Employed, 63 years 3.6 6.8??? 9.6??? 32??? 31??? 32???
(2.6) (1.4) (1.1) (2.8) (1.6) (1.2)Employed, 64 years -2 0.4 1.9?? 4.9?? 4.5??? 5.4???
(2.1) (1.3) (0.9) (2.1) (1.2) (1)Claiming age (years) 0.406??? 0.525??? 0.514??? 0.548??? 0.549??? 0.539???
(0.139) (0.082) (0.064) (0.153) (0.086) (0.067)B. Health and income effectsMortality, prob(die by 2012) 0.028 0.004 0.002 0.023? 0.016? 0.011?
(0.018) (0.011) (0.009) (0.013) (0.008) (0.006)Mortality, prob(die by 70) 0.004 -0.001 -0.002 0.014 0.013? 0.009
(0.015) (0.008) (0.007) (0.013) (0.007) (0.006)SS benefits -416 -329 -390?? -533 -278 -284?
(377) (219) (166) (342) (204) (149)SS wealth -16189? -14489??? -15639??? -19820?? -13296??? -13571???
(8887) (4939) (3911) (8476) (4439) (3487)Bandwidth (months) 3 6 9 3 6 9
Obs 5575 11329 17319 6674 13912 21325
Notes: This table reports RDD estimates of equation 1 for three different bandwidths: 3, 6, and 9 months.
Columns (1)-(3) shows the estimates for the increase in women’s FRA from 62 to 63 years and columns (4)-(6)
shows estimates for the increase in women’s FRA from 63 to 64 years. Source: Own calculations, based on SSSD.
29

6 Conclusion
We study how a two-year increase in the full retirement age (FRA) for women affects labor
supply, income, and mortality. Increasing the retirement age is one of the most discussed and
implemented policy measures to improve the long-term financial sustainability of social security
programs in the face of demographic aging. However, there is surprisingly little evidence on the
impact of this measure on labor force participation and well-being of older workers. To identify the
causal impact of the FRA, we exploit a large pension reform in Switzerland that became effective
in 1997. This reform increased the FRA for women from 62 to 64 in two one-year increments
while simultaneously introducing a 3.4 % reduction of social security benefits for early claiming.
More specifically, women born in 1938 or before were unaffected by the reform, while the FRA was
increased by on year for women born between 1939 and 1941, followed by an additional one year
increase for women born after 1942. The sharp discontinuities in the FRA by birth date allow us
to analyze the impact of an increase in the FRA using a regression discontinuity design.
We find that the FRA has a strong effect on the labor supply behavior of affected women. A
one year increase in the FRA delays labor market exit by 0.51-0.66 years and increases the claiming
age of retirement benefits by 0.41-0.55 years. Most of the adjustment in labor supply takes place
in the year women reach the pre-reform FRA (62 for the first and 63 for the second FRA increase).
We also find some increase in labor force participation in the year before the pre-reform FRA,
suggesting that anticipation effects play a role. The availability of detailed information on labor
market histories of all family members also allows for the examination of whether there is an effect
on the labor supply of the spouse. We find no effects on labor supply and benefit claiming of
women’s spouses, suggesting that husbands and women do not coordinate retirement dates. We
find that a raise in the FRA increases mortality among affected women somewhat but the effect is
not very precisely estimated. Increasing the FRA using financial incentives reduces social security
wealth but not social security benefits.
From a policy perspective, our study suggests that increasing the FRA is an effective policy,
delaying both labor market exit and claiming of retirement benefits. Hopes for an “added worker”
effect are, however, not substantial given that spouses of affected women do not increase their labor
supply. These insights should also be important for the U.S. setting because the characteristics of
30

the social security system and the aging population structure are quite similar.
31

References
Behaghel, L. and Blau, D. M. (2012). Framing social security reform: Behavioral responses to
changes in the full retirement age. American Economic Journal: Economic Policy , 4(4), 41–67.
Blau, D. M. and Goodstein, R. M. (2010). Can social security explain trends in labor force partic-
ipation of older men in the united states? Journal of Human Resources, 45(2), 328–363.
Butler, M. and Staubli, S. (2011). Payouts in switzerland: Explaining developments in annuiti-
zation. In O. S. Mitchell, J. Piggott, and N. Takayama, editors, Securing Lifelong Retirement
Income: Global Annuity Markets and Policy . Oxford University Press, Oxford, UK.
Butler, M. and Teppa, F. (2007). The choice between an annuity and a lump-sum: Results from
swiss pension funds. Journal of Public Economics, 91, 1944–1966.
Coe, N. B. and Zamarro, G. (2011). Retirement effects on health in europe. Journal of health
economics, 30(1), 77–86.
Coile, C. C. and Gruber, J. (2007). Future social security entitlements and the retirement decision.
The Review of Economics and Statistics, 89(2), 234–246.
Duggan, M., Singleton, P., and Song, J. (2007). Aching to retire? the rise in the full retirement
age and its impact on the social security disability rolls. Journal of Public Economics, 91(7-8),
1327–1350.
Gruber, J. and Wise, D. A., editors (1999). Social Security and Retirement around the World .
University of Chicago Press.
Hernaes, E., Markussen, S., Piggott, J., and Vestad, O. L. (2013). Does retirement age impact
mortality? Journal of health economics, 32(3), 586–598.
Krueger, A. B. and Pischke, J.-S. (1992). The effect of social security on labor supply: A cohort
analysis of the notch generation. Journal of Labor Economics, 10, 412–437.
Kuhn, A., Wuellrich, J.-P., and Zweimuller, J. (2010). Fatal attraction? access to early retirement
and mortality. Institute for Empirical Research in Economics Working Paper, University of
Zurich, (499).
32

Lee, D. S. and Lemieux, T. (2010). Regression discontinuity designs in economics. Journal of
Economic Literature, 48(2), 281–355.
Manoli, D. and Weber, A. (2014). Intertemporal substitution in labor force participation: Evidence
from policy discontinuities. CESifo Working Paper Series No. 4619 .
Mastrobuoni, G. (2009). Labor supply effects of the recent social security benefit cuts: Empirical
estimates using cohort discontinuities. Journal of Public Economics, 93, 1224–1233.
OECD (2011a). Health at a Glance 2011 . Organisation for Economic Cooperation and Develop-
ment.
OECD (2011b). Pensions at a Glance 2011 . Organisation for Economic Cooperation and Devel-
opment.
Queisser, M. and Vittas, D. (2000). The Swiss multi-pillar pension system: triumph of common
sense?, volume 2416. Citeseer.
Senti, C. (2011). Pensionierte als arbeitnehmende: Ein arbeits- und sozialversicherungsrechtlicher
sonderfall mit stolperstricken. Presentation, University of St. Gallen.
Song, J. and Manchester, J. (2007). Have people delayed claiming retirement benefits? responses
to changes in social security rules. Social Security Bulletin, 67(2), 1–23.
33

Figure A.1: Are Covariates Smooth Around Cutoffs?
(a) Earnings Age 55 (CHF perYear)
2500
030
000
3500
040
000
4500
050
000
Sw
iss
fran
cs
−12 −9 −6 −3 0 3 6 9 12Birth date
(b) Married (%)
020
4060
8010
0P
erce
nt
−12 −9 −6 −3 0 3 6 9 12Birth date
(c) Foreign (%)
05
1015
2025
3035
Per
cent
−12 −9 −6 −3 0 3 6 9 12Birth date
(d) Age Difference (years)
−5
−4
−3
−2
−1
0A
ge d
iffer
ence
−12 −9 −6 −3 0 3 6 9 12Birth date
Notes: This figure shows averages of background characteristics as a function of distance to the cutoff. None ofthese background characteristics shows a discontinuity at the reform cutoff, suggesting that the composition ofwomen just affected and just not affected by the increase in the FRA from 62 to 63 years is identical.
Source: Own calculations, based on SSSD.
34

Figure A.2: Effects on Spouse’s Exit Age, FRA 62 to 63
6363
.564
64.5
6565
.566
66.5
Age
−12 −9 −6 −3 0 3 6 9 12Birth date − cutoff, wife
Notes: This figure reports the average labor force exit age of married women’s spouse. Increasing women’s FRAfrom 62 to 63 years does not affect labor supply of their spouse.
Source: Own calculations, based on SSSD.
35