how do we shape a safer future - BCEO - Butler County ... · PDF filehow do we shape a safer...
40
how do we shape a safer future Highway Safety Program Overview Transportation Engineering Workshop Wednesday, June 10 th , 2015
-
Upload
truongdieu -
Category
Documents
-
view
216 -
download
3
Transcript of how do we shape a safer future - BCEO - Butler County ... · PDF filehow do we shape a safer...

how do we shape a safer future
Highway Safety Program Overview
Transportation Engineering Workshop
Wednesday, June 10th, 2015

Roadmap for Today
• Summarize where we have been
• Identify where we want to go
• Discuss how we are going to get there

W h e r e h a v e w e b e e n ?


First, Some Good News
• Historically, crashes in Ohio and nationwide have been going down
• 2013 was Ohio’s safest year in modern history
• Nationally, Ohio has one of the lowest crash rates in the nation

Ohio Crashes by Year 3
70
,88
2
39
2,5
24
41
9,3
94
43
3,6
14
41
7,6
61
37
0,9
82
33
8,8
87
31
7,0
13
31
1,6
49
34
2,3
49
37
3,0
69
36
9,3
83
38
0,4
01
38
5,7
76
38
8,8
54
37
3,5
25
35
0,2
79
35
6,4
58
36
2,0
63
37
0,3
73
38
3,3
83
39
5,1
13
36
8,8
52
37
7,9
20
38
5,7
04
38
6,1
22
38
7,0
75
38
6,0
76
39
2,6
83
38
1,6
40
35
8,5
90
33
4,2
06
32
8,7
42
32
0,8
77
29
8,6
58
30
0,1
63
29
7,8
31
28
7,0
35
26
9,0
83
0
50,000
100,000
150,000
200,000
250,000
300,000
350,000
400,000
450,000
500,000
19
75
19
76
19
77
19
78
19
79
19
80
19
81
19
82
19
83
19
84
19
85
19
86
19
87
19
88
19
89
19
90
19
91
19
92
19
93
19
94
19
95
19
96
19
97
19
98
19
99
20
00
20
01
20
02
20
03
20
04
20
05
20
06
20
07
20
08
20
09
20
10
20
11
20
12
20
13

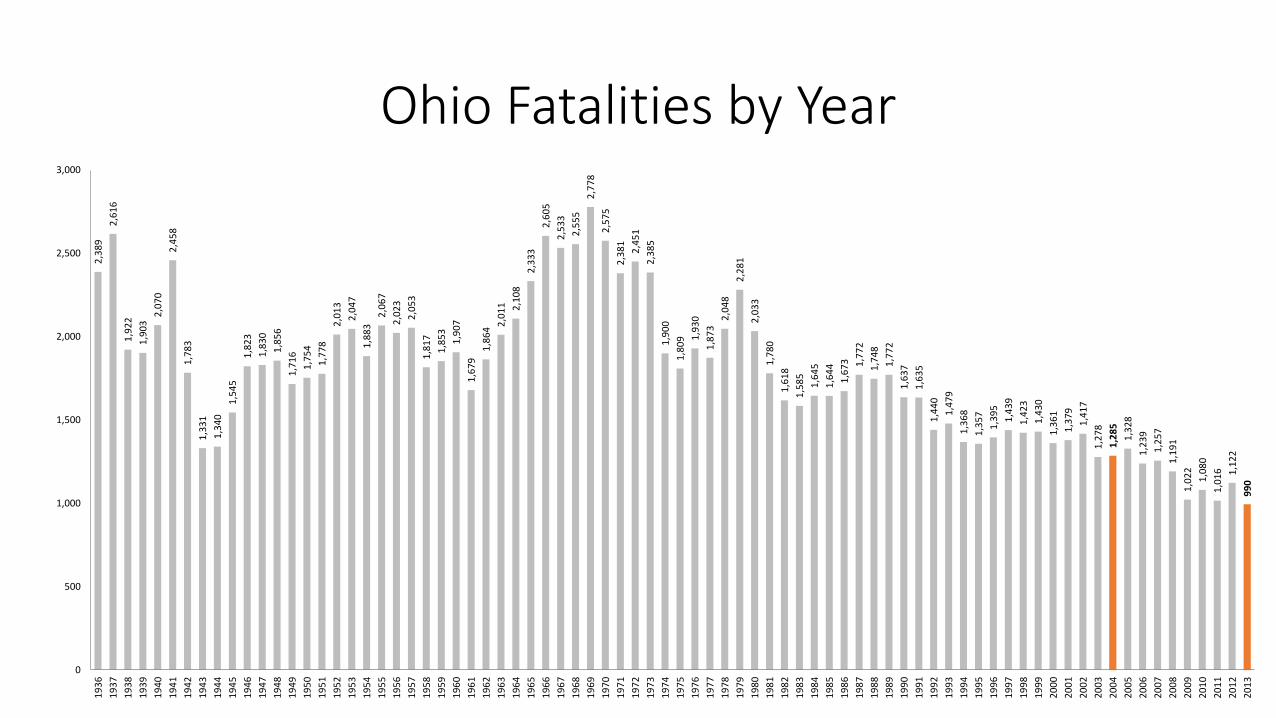
Ohio Fatalities by Year 2
,38
9
2,6
16
1,9
22
1,9
03
2,0
70
2,4
58
1,7
83
1,3
31
1,3
40
1,5
45
1,8
23
1,8
30
1,8
56
1,7
16
1,7
54
1,7
78
2,0
13
2,0
47
1,8
83
2,0
67
2,0
23
2,0
53
1,8
17
1,8
53
1,9
07
1,6
79
1,8
64
2,0
11
2,1
08
2,3
33
2,6
05
2,5
33
2,5
55
2,7
78
2,5
75
2,3
81
2,4
51
2,3
85
1,9
00
1,8
09
1,9
30
1,8
73
2,0
48
2,2
81
2,0
33
1,7
80
1,6
18
1,5
85
1,6
45
1,6
44
1,6
73
1,7
72
1,7
48
1,7
72
1,6
37
1,6
35
1,4
40
1,4
79
1,3
68
1,3
57
1,3
95
1,4
39
1,4
23
1,4
30
1,3
61
1,3
79
1,4
17
1,2
78
1,2
85
1,3
28
1,2
39
1,2
57
1,1
91
1,0
22
1,0
80
1,0
16
1,1
22
99
0
0
500
1,000
1,500
2,000
2,500
3,000
19
36
19
37
19
38
19
39
19
40
19
41
19
42
19
43
19
44
19
45
19
46
19
47
19
48
19
49
19
50
19
51
19
52
19
53
19
54
19
55
19
56
19
57
19
58
19
59
19
60
19
61
19
62
19
63
19
64
19
65
19
66
19
67
19
68
19
69
19
70
19
71
19
72
19
73
19
74
19
75
19
76
19
77
19
78
19
79
19
80
19
81
19
82
19
83
19
84
19
85
19
86
19
87
19
88
19
89
19
90
19
91
19
92
19
93
19
94
19
95
19
96
19
97
19
98
19
99
20
00
20
01
20
02
20
03
20
04
20
05
20
06
20
07
20
08
20
09
20
10
20
11
20
12
20
13

Ohio Serious Injuries by Year
10,856
11,633 11,858
11,549 11,942
11,077 10,701
10,469 10,113
9,774 10,186
9,654 9,780
9,233
0
2,000
4,000
6,000
8,000
10,000
12,000
14,000
20
00
20
01
20
02
20
03
20
04
20
05
20
06
20
07
20
08
20
09
20
10
20
11
20
12
20
13

Total Crashes vs. Vehicle Miles Traveled
392,683 381,640
358,590
334,206 328,742 320,877
298,658 300,163 297,831 287,035
109,906 112,388 111,535 112,098 111,064 108,631 110,776 113,504 111,748 111,468
0
50,000
100,000
150,000
200,000
250,000
300,000
350,000
400,000
450,000
2002 2003 2004 2005 2006 2007 2008 2009 2010 2011 2012 2013
Year
Crashes MVMT
Total VMT increased 1.4% since 2002
Total crashes dropped 27% since 2003

State vs. Local System
Local System
53%
ODOT System
47%
Fatalities
Local System
63%
ODOT System
37%
Serious Injuries
Local System
72%
ODOT System
28%
Total Crashes

What are the leading cause of traffic deaths in Ohio?
ROADWAY DEPARTURE
526
53%
SEATBELTS
368
37%
300
30%
YOUNG DRIVER
294
30%
314
32%
SPEED-RELATED
ALCOHOL-RELATED

What are the leading cause of serious injuries in Ohio?
ROADWAY DEPARTURE
3291
36%
YOUNG DRIVER
3563
39%
3580
39%
INTERSECTION

Where are roadway departure crashes most likely to occur?

What are drivers most likely to hit when they leave the road?

When do Roadway Departure crashes tend to occur?

Roadway Departure Fact Sheets

W h e r e a r e w e g o i n g ?


We are in it together
• All states are required to develop a Strategic Highway Safety Plan
• Includes all roadway users
• Managed by a network of stakeholders

Steering Committee
• ODOT leads the steering committee with quarterly meetings
• Review updated crash data in
key emphasis areas
• Track progress on crash reduction strategies

Emphasis Areas

Performance Measures and Targets


Performance Measures
• Annually, Ohio has seen the following reductions from 2003-2013
ODOT is adopting a goal of a minimum 2% reduction for all categories over the next five years

Emerging Trends: Older Drivers
• 10,000 people a day will turn 60 between 2011 and 2029
• These people will live and drive longer than their predecessors
• Visual, physical and cognitive impairments

Emerging Trend: Biking, Walking, Transit
National Realtors Association 2013 Survey:
• 60% favor mixed-use, walkable neighborhoods
• 41% are interested in improving public transportation
• 29% prefer communities where people don’t have to drive long distances
• We also know that more teens and young adults are delaying driving or choosing not to drive.

Emerging Trend: Distracted Driving
• 4X more likely to crash while talking on cell phone
• 8X more likely to crash while texting
• 10% of Americans using a cell phone while driving (NHTSA)
• Hands free is not risk free

H o w d o w e s h a p e a s a fe r f u t u r e ?

Systematic Safety Improvements
ODOT sets aside about $10M-$20M each year for systematic safety improvements. These are low-cost safety treatments that can be implemented across many miles for thousands of dollars.
National studies show these types of treatments can significantly reduce crashes for less cost.

Systematic Safety: Backplates
In 2009, ODOT spent $15 million to upgrade 900 signals including energy-efficient LED bulbs and battery backups.
• In Ohio, the investment has reduced rear-end crashes by 9% and angle crashes by 13% (average per location).
• Now a statewide requirement for all new signals

Systematic Safety: Rumble Stripes
Ohio installed edge line rumble stripes at 420 locations in 2010.
• 15% reduction in fatalities
• 26% reduction in fixed-object crashes
• 33% reduction in nighttime crashes on roads with lights (increase reflectivity of pavement markings)

Highway Safety Improvement Program (HSIP)
ODOT has one of the largest programs in the country:
• $102M in state and federal funds aimed addressing spot locations.
• Funding available for any public road and any improvement that can be tied to crash reductions
• Accept safety applications twice a year
• Applications reviewed by multi-disciplinary committees at the district and at central office.
• Typically $5M or less (maximum $10M)

GIS Crash Analysis Tool (GCAT) • Available For:
• ODOT
• MPOs
• City/County Engineers
• Law Enforcement Agencies
• Pre-qualified Safety Study Consultants
• Tool allows for several different user expertise levels to query crashes
• Designed to be simple for the occasional user and robust enough for ODOT Safety Analysis needs

The Map Room
• These maps provide Ohio's safety and priority locations. They are mapped statewide. However, you can retrieve the maps for specific regions by typing the desired ODOT District Number, County Name, or Township Name into the filter

• TIMS is ODOT's web-mapping portal where you can discover information about Ohio's transportation system, create maps, and share information.

TAKE THE PLEDGE The fight to end distracted driving starts with you. Develop a plan and make the commitment to drive phone-free today.
TALK


summary
We are trending in the right direction. ODOT has developed some target goals and implemented systematic approaches to help us reach the zero fatality mark, but it really is a multi-agency approach.
The next round of safety applications will be accepted through the end of September. We will be happy to help you with the steps involved in submitting your application!