HOW DO SOCIAL RECOMMENDATIONS INFLUENCE SHOPPING BEHAVIOR? A
20
1 HOW DO SOCIAL RECOMMENDATIONS INFLUENCE SHOPPING BEHAVIOR? A FIELD EXPERIMENT Jörn Grahl * Franz Rothlauf ** Oliver Hinz *** Working Paper – April 2013 Keywords: Social Recommendation, User Generated Content, Social Media, E-Commerce, Business Value of IT Contact Information: * Johannes Gutenberg-University, Faculty of Law, Management and Economics, Jakob-Welder- Weg 9, 55128 Mainz, Germany. Phone: +49 6131 39-27209, Fax: +49 6131 39-22185, e-mail: [email protected]. ** Johannes Gutenberg-University, Faculty of Law, Management and Economics, Jakob-Welder- Weg 9, 55128 Mainz, Germany. Phone: +49 6131 39-22734, Fax: +49 6131 39-22185, e-mail: [email protected]. *** TU Darmstadt, Faculty of Law and Business, Hochschulstraße 1, 64289 Darmstadt, Germany. Phone: +49-6151-16-75221, Fax: +49-6151-16-72220, e-mail: [email protected].
Transcript of HOW DO SOCIAL RECOMMENDATIONS INFLUENCE SHOPPING BEHAVIOR? A

1
HOW DO SOCIAL RECOMMENDATIONS
INFLUENCE SHOPPING BEHAVIOR?
A FIELD EXPERIMENT
Jörn Grahl*
Franz Rothlauf**
Oliver Hinz***
Working Paper – April 2013
Keywords: Social Recommendation, User Generated Content, Social Media, E-Commerce, Business Value of IT
Contact Information:
* Johannes Gutenberg-University, Faculty of Law, Management and Economics, Jakob-Welder-Weg 9, 55128 Mainz, Germany. Phone: +49 6131 39-27209, Fax: +49 6131 39-22185, e-mail: [email protected].
** Johannes Gutenberg-University, Faculty of Law, Management and Economics, Jakob-Welder-Weg 9, 55128 Mainz, Germany. Phone: +49 6131 39-22734, Fax: +49 6131 39-22185, e-mail: [email protected].
*** TU Darmstadt, Faculty of Law and Business, Hochschulstraße 1, 64289 Darmstadt, Germany. Phone: +49-6151-16-75221, Fax: +49-6151-16-72220, e-mail: [email protected].

2
HOW DO SOCIAL RECOMMENDATIONS
INFLUENCE SHOPPING BEHAVIOR?
A FIELD EXPERIMENT
Abstract:
Previous research has tried to understand the influence of user-generated content on economic
outcomes, however many of these analyses avoid any suggestion of causality which would be very
important for drawing managerial implications. We conduct a randomized field experiment in an
online store where we exogenously manipulate the visibility of the number of people who like a
product (similar to “Likes”' collected by Facebook). This design allows us to analyze the causal effect
of social recommendations on shopping behavior.
In a four-week experiment with new customers, we find that displaying social recommendations
caused a 12.97% revenue increase, generating 13,883.74 EUR revenue in the treated group compared
to 12,289.46 EUR revenue in the control group. This difference is mainly caused by significantly
longer search processes when social recommendations are displayed which also lead to a 22.19%
higher chance that a first-time shopper makes a purchase. We compare the social influence effect of
Likes on revenue with the inherent quality effect that the Likes also capture. The social influence
effect is much smaller and it is usually only responsible for less than 10% of the total effect. This
emphasizes that it is difficult to draw conclusions from non-experimental studies. If user-generated
content is related to economic outcomes in observational data, the estimates can be heavily biased.
Overall, our results suggest however that for online stores social recommendations and Likes are
intangible assets with significant business value.

3
1 Introduction
In February 2013, San Francisco based startup Pinterest raised $200 million of funding and is now
valued at $2.5 billion, according to the firm itself (Mitroff, 2013). Pinterest maintains a website where
users can “pin” movies, services and all kinds of products to their board, so that these preferences and
tastes become visible to the public or to friends. A simple idea that seems to work so far: Pinterest has
grown rapidly, is currently ranked among the top 40 websites with respect to site visits, and was
selected as one the 50 best websites by TIME Magazin (McCracken, 2011). Not far from Pinterest’s
headquarters resides Facebook, the world’s leading online social network site. Almost one billion
users have registered for the online service allowing them to manage social contacts, to post and share
content and to communicate their taste by clicking on “Like” buttons that are nowadays available on
many websites. Founded in 2004, Facebook is valued at $58 billion as of February 2013, an
impressive market valuation especially for a technology startup.
Where does the high valuation of Pinterest, Facebook and similar startups come from? Many agree
that it is not their tangible assets like machines or inventories, but their access to unique customer data
what make these firms special. Users of these networks leave digital footprints, reveal their
preferences or make social recommendations that seem valuable for e-business. During the last years,
online shopping has become strongly socially embedded. Online stores not only display detailed
product information like price, availability, and technical specifications but also additional user-
generated content like customer reviews, ratings, or simply the number of people who “like this
product” on Facebook. The underlying believe is that customers appreciate and follow social
recommendations, which makes the data collected by companies like Pinterest and Facebook valuable
for e-business. This is confirmed by surveys (e.g. The Nielsen Company (2007)), who find that
customers trust online recommendations or opinions more than they trust paid ads.
This paper focuses on social recommendations expressed by “Likes”. Likes are immensely popular as
more than 20% of the top 1 million web sites collect and display Facebook Likes, more than 14% use
Google’s equivalent “+1” (Web Technology Survey, 2012). We study whether the visibility of the
number of Likes that a product has gathered in a social network actually influence purchase decisions?
In the social business era this question is relevant for practitioners and researchers alike. Although this
question has been studied in the literature, we believe that it is not yet fully answered. A detailed
review of the literature is in Section 2 and here we just briefly mention several representative results.
There is theoretical evidence that it can be optimal for rational decision makers to imitate the decisions
of others, even if these decisions contradict the decision maker’s individual preferences (Banerjee,
1992). Bikhchandani et al. (1992) point out that although this leads to conformity of behavior, mass
behavior remains fragile. In theory, this gives room for fashions, fads and rapid behavior change.
But, can we observe in practice that consumers prefer what others like? Chevalier and Mayzlin (2006)
analyze book reviews at Amazon.com and bn.com and find that an improvement in a book’s average

4
rating correlates with an increase of relative sales at that site. Liu (2006) studies messages about
movies from the Yahoo! Movies site and used them as a proxy for customer word-of-mouth. They find
that the volume of word-of-mouth has explanatory power for box office revenue and that it can be
used to build an effective forecasting model. Sun (2012) examines the informational role of rating
variance and concludes that a higher rating variance corresponds to higher product demand, if the
average rating is low. This claim is verified on data from Amazon.com.
These and most other works about user-generated content fit econometric models to observational
data. The models relate content (e.g. recommendations or ratings) to economic outcomes
(e.g. purchases or revenues). This has revealed important correlations that are useful for prediction,
e.g. on future sales of a product. However, correlation is not always causal and like Godes and
Mayzlin (2004) point out, most researchers “avoid any suggestion of causality” as it is very difficult to
draw clean inferences of causality from observational data using traditional econometrics. For these
reasons we believe that it is currently unclear whether displaying social recommendation (“Likes”) in
an online shop causes customers to shop differently, and how the mechanism works.
To make causal claims about the effect of visibility and number of Likes on shopping behavior, we
conduct a randomized field experiment. Randomized field experiments are the gold standard for causal
inference because the experimental design ensures that correlation between a treatment and an
outcome is causal (Shadish et al., 2002). We exogenously manipulate the visibility of Likes in a real
online shop and randomly assign visitors to the treatment group or the control group. As part of the
product details, we show the treatment group how many “Likes” the product had gathered in a social
network similar to Facebook.com, but did not show this information to the control group. We recorded
which products the subjects inspected and which products they ultimately bought.
We conducted the experiment in cooperation with a German online store for toys and board games,
who routinely display Likes and other user-generated content. As the store management believed that
displaying social recommendations increases sales, it was difficult to convince the management to
conduct an experiment where social recommendations are not shown to some customers. They finally
conducted the experiment as the results would allow them to accurately estimate the business value of
their user-generated content and they would know whether social recommendations are just nice-to-
have or whether they are an important asset with significant business value.
2 Previous Research
This paper draws on the literature of user-generated content and on that of social influence in social
networks. In both domains researchers study the social embeddedness of economic decision making
but consider different sources of possible influence.

5
A number of papers study and explain the impact of user-generated content on customer behavior.
Godes and Mayzlin (2004) examine television shows and the resulting word-of-mouth in online
forums. They find that the dispersion of conversations generated by a show across several
communities has explanatory power for its future number of viewers. Liu (2006) study word-of-mouth
for movies and find that the number of messages about a movie at the Yahoo! Movies website has
explanatory power for its box office revenue. Chevalier and Mayzlin (2006) analyze book reviews at
Amazon.com and bn.com and find that an improvement in a book’s average rating and in the number
of ratings at one of the two sites correlates with an increase of relative sales at that site. For the craft
beer industry, Clemons et al. (2006) find that rating variance and the strength of the most positive
quartile of reviews have predictive power for future product growth. Liu (2006) and Dellarocas et al.
(2007) study movie sales and develop domain-specific forecasting models using both online and
offline review metrics. Duan et al. (2008) account for potential endogeneity of movie reviews and find
that this renders the average rating of a movie insignificant for forecasting its success, while the
volume of postings remains a significant predictor. Also Chintagunta et al. (2010) study movie sales
on designated market area level but find in contrast to the previous works that not the volume of the
reviews but their valence matters. Zhu and Zhang (2010) examine the moderating effect of product
and consumer characteristics and find that reviews have a stronger influence if a game is less popular
and played by more experienced Internet users. Moe and Trusov (2011) find that the dynamics of
rating behavior matters as it influences consecutive ratings and future sales. Gu et al. (2012)’s work
suggests that for high-involvement products, user-generated content from external sources is more
influential in comparison to user-generated content created on the online shopping site itself. Sun
(2012) develops a theoretical model about the influence of rating variance on sales. She concludes that
a higher rating variance corresponds to higher product demand, if and only if the average rating is low.
This theoretical claim is verified on data from Amazon.com.
Relating user-generated content to economic outcomes can lead to biased results due to a number of
endogeneity problems. Therefore the following studies used experiments to study how popularity
impacts choices. Salganik et al. (2006) created two online markets for music downloads and studied
the impact of the download rank on future downloads. The results indicate that popularity is self-
enforcing: top-ranked songs receive more downloads. Salganik and Watts (2008) collected music
preferences from their subjects and thereby constructed a “true” song ranking. In an online store
similar to Salganik et al. (2006), they placed the songs at positions different from their “true” position
in the ranking. Over time, the position of the songs in the download ranking converged again to their
“true” position, suggesting that popularity affects choices but preferences moderate the magnitude of
the effect. Tucker and Zhang (2011) conducted an experiment with vendors of wedding services. The
displayed popularity information about the vendors leads to a redistribution of the page visits towards
narrow-appeal vendors. De Matos et al. (2013) study leases of videos on demand. They manipulate the
slot at which a movie is shown on the TV-Screen and its number of Likes. They find that promoting a

6
movie by moving it up one position in the list leads to a 4% increase in number of leases, but movies
tend to move back to their true position in the list over time.
Research on social influence in social networks studies how peers affect each other in social networks.
A major challenge in this field is to make causal claims and to disentangle causality from confounding
effects (Aral et al. 2009; Christakis and Fowler, 2013). Iyengar et al. (2011) study the prescribing
behavior of doctors in a social network of doctors. They identify social influence over social network
ties, even after controlling for marketing efforts and arbitrary system-wide changes (see also Aral
(2011), Christakis and Fowler (2011), and Godes (2011)). This study is one of the first
econometrically clean identification of social influence after the results of Coleman et al. (1966)
required revision (van den Bulte and Lilien, 2001). Hinz et al. (2011b) conduct field experiments to
identify optimal seeding points for viral marketing campaigns. In two field experiments and one large
scaled study of transactional data, they find that especially hubs and bridges foster the diffusion
process and constitute promising seeding points. Aral and Walker (2012) study the adoption of a free
product in the online social network Facebook. They find that social influence can operate over
network ties of an online social network, and propose methods to identify influential and susceptible
members. In a recent paper, Bapna and Umjarov (2013) study the adoption of a paid service in an
online social network and identify peer influence as a driver for service adoption.
It was found that not all people are equally susceptible to influence. Iyengar et al. (2011) find that
doctors who perceive themselves as experts are less susceptible to social influence in comparison to
those who do not. Aral and Walker (2012) find that a user’s susceptibility to social influence correlates
with socio-demographic factors like age, sex or relationship status. In a similar vein, Bettman and Park
(1980) show that consumers with high product knowledge process less information during a product
choice task. The behavior of such consumers can be less influenced by additional information than
those with a moderate amount of knowledge.
Our study is similar to papers about user-generated content as we study how user-generated content
affects purchasing behavior and resulting revenues. Just like ours, the studies by Salganik et al. (2006),
Salganik and Watts (2008), Tucker and Zhang (2011), Hinz et al. (2011b), Aral and Walker (2012), de
Matos et al. (2013) and Bapna and Umjarov (2013) are randomized experiments. However, there are a
number of differences. Iyengar et al. (2011), Hinz et al (2011b), Aral and Walker (2012), and Bapna
and Umjarov (2013) consider social influence over network ties in social networks. We do not study
social networks. Furthermore, previous research does not address the impact of user-generated content
on revenue. In the studies by Salganik et al. (2006) and Salganik and Watts (2008), the customers
could download songs for free; financial aspects were not relevant. Tucker and Zhang (2011) study
click-through-rates and do not know which purchases resulted. In de Matos et al. (2013), the
customers leased movies and the number of Likes, which determined the ordering of the displayed
movie list, had an effect on the sales, however, the authors only explored the number of leases and not
7
the resulting revenues. Our research goes beyond the existing work as we directly explore the effect of
the visibility and number of “Likes” on the resulting revenue. Doing this, we split the total effect into a
latent quality effect, which is determined by content quality, and a social influence effect, which is
determined by social contagion, and relate both to actual revenues.
3 Field Experiment
3.1 Setup
We conducted the experiment in cooperation with a German online store selling toys and board games.
The online store provides a product information page for every product. The product pages are similar
to those of Amazon.com and display price, shipping information, some photos of the product, product
information as well as user-generated content. In addition to the online store, the company hosts a
large and active online social network (OSN). The OSN is similar to Facebook or LinkedIn in terms of
functionality. A user has a profile page that she can fill with personal information (including a
picture), she can connect with friends, post and share content, or engage in a discussion. Similar to
Facebook, users of the OSN can “like” products that are sold over the online store. For reasons of
confidentiality we do not disclose the name of the online store or that of the OSN.
The user-generated content shown on a product page of the online store includes customer reviews,
ratings, and a box displaying the number of people who “like” the product. The display of the number
of Likes is similar to that of Facebook’s Like plug-in. In addition to the number of Likes, the box also
displays miniature profile pictures of randomly selected users who like the product.
In our experiment, we use first-time visitors as subjects. In contrast to using the entire customer base,
focusing on first-time visitors limits the potential financial loss for the online store. The policy of the
online store was to show all user-generated content (including the number of Likes) to all customers;
performing an experiment, where some user-generated content is not shown to all customers was
expected to lead to reduced revenues for the store. Second, using first-time customers eliminates
problems with returning customers, who might be confused when coming back to the online store and
finding that now some user-generated content is missing which was available at their last visit. This
might lead to confounding effects like the Hawthorne effect (see e.g. Parsons, 1974) as well as other
unwanted effects.
Like most commercial websites, the online store sets cookies with a unique customer-ID to identify
visitors of the web site. We assume a customer to be a first-time visitor, if the web server does not
detect an existing cookie. If there was a cookie from a previous visit or if cookies were disabled in the
browser, the corresponding visitor did not participate in the experiment.
8
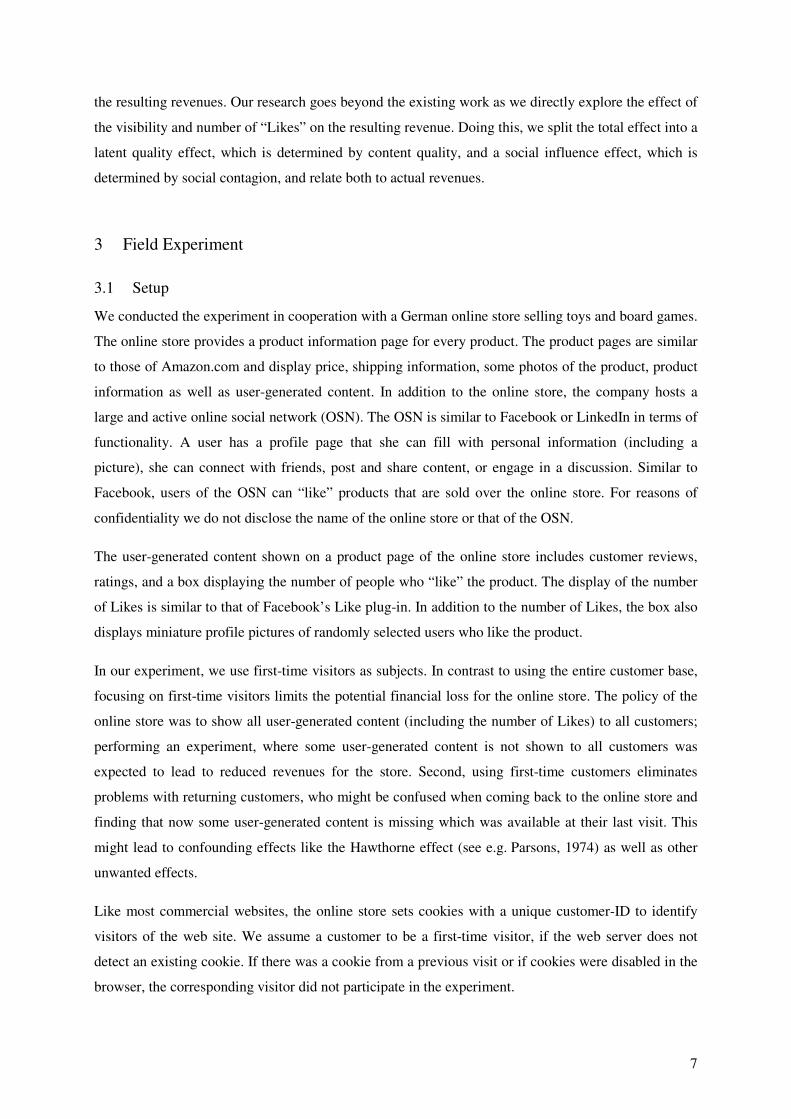
All first-time customers were randomly assigned with a 50:50 chance to either the treatment or control
group. On each product page, the members of the treatment group could see the number of people
“who like the product” and a random selection of miniature profile pictures of people who liked the
product. The members of the control group did not see this user-generated content. The remaining
product pages were unchanged. Screenshots of the treatment and the control conditions are in Figure
1.
Figure 1: Screenshot of treatment condition (left) and control condition
We conducted the experiment for four weeks in February 2013. We tracked the browsing and
purchasing behavior of the subjects. When a subject visited a product page, we stored the
corresponding product information and also whether the customer bought the product. In Sect. 3.2, we
analyze the product level data in detail; in Sect. 3.3, we aggregate the observations to the customer
level and perform a detailed analysis.
3.2 Results on Product Level
Overall, 72,849 first-time customers visited 112,362 detail pages. The customers completed 1,399
orders with a total of 1,616 products, generating revenues of 26,173.20 EUR for the online shop. The
average volume of an order was 18.71 EUR with a standard deviation of 15.25 EUR.
We use regression to analyze factors influencing the probability to buy a product and to obtain a sanity
check for our data. The models use the following variables. NumberOfLikes stores the number of likes
that a product has gathered over time. This value is shown to the treatment group but not to the control
group. The price in EUR is stored in Price, for special offers PriceDiscount captures the discount in
EUR. PriceDiscount is 0 if a product is not a special offer. We compared the prices charged by the
focal store to prices charged by other online stores to incorporate competitive price setting. The price
position of the focal store is captured by PricePositionInMarket. It is 1, if the focal store has the
lowest price, and larger otherwise. AverageRating is the average rating of a product, RatingVariance is
the corresponding variance. The dummy variable InStock is 1 if the product is available and 0 if it is
out of stock. If customers can try the product before buying it, Leasable is 1, and 0 otherwise. If the
product was released within the last six months, NewRelease is 1 and 0, otherwise. If the product was
among the 100 best selling products before the experiment, Top100 is 1 and 0, otherwise. We obtained

9
detailed descriptions of all products and encoded them with 111 binary game type controls. We used
191 binary publisher controls to encode the publisher of all products (games).
Treatment encodes the treatment condition. It is 1, if the social recommendations (NumberOfLikes and
randomly selected miniature profile pictures) are visible and 0, otherwise. A nice feature of the dataset
is that the experimental variation allows disentangling the effect of visibility from the effect of latent
quality. For this purpose we include an interaction term between the visibility of the recommendations
and a product’s number of likes (Treatment*NumberOfLikes). The variable NumberOfLikes should
capture the latent effect of quality as it only measures the unseen part.
The dependent variable is Sale. It is 1 if a product was bought and 0 otherwise. 27 missing values
reduce the sample size to n=112,335. Sales occurred in only ~1.2% of the cases, so we conduct a rare
events logit regression with robust standard errors (King and Zeng, 1999).
Table 1 summarizes the results obtained from three models. They differ in their use of the game type
controls and/or the publisher controls. As expected, Price has a negative influence on the purchase
probability (p<.01). The possibility to rent a game in the shop (Leasable=1) also has a negative effect
on Sale (p<.01) which suggests some kind of cannibalization effect. InStock (p<.01), PriceDiscount
(p<.01), AverageRating (p<.01), Top100 (p<.01), and NewRelease (p<.01) have a positive effect on
the sales probability. With respect to the competitive situation, we find that the higher the rank the
focal shop has compared to other shops (this means the focal shop has a lower price than the
competitors), the higher sales probability. Overall, all coefficients provide high face validity.
We inspect the effect of social recommendations. There is no effect of the experimental Treatment on
the sales probability of a product (p>.1) and there is no significant interaction between Treatment and
NumberOfLikes (Treatment*NumberOfLikes, p>.1). Thus, we find no effect of social
recommendations on the sales probability of a product. However, we find a significant effect of the
NumberOfLikes on the sales probability (p<.05). The interaction effect should capture the effect of the
visibility and the number of Likes so that NumberOfLikes exclusively captures the effect of latent
quality. High-quality products gather more Likes and they are ordered with a higher probability, but
there is no contagion effect of the social recommendation itself. This finding highlights the
endogeneity problem inherent to this kind of study when transactional data without experimental
variation is available. We control for the average product rating and the rating variance (which is done
in literature as well), but there is still some latent quality effect in the data. Therefore, we recommend
researchers to be careful when interpreting results based on non-experimental data.
Table 1: Rare events logit regression on sales probability (0/1)
Dependent variable: Sale (0/1)
Model 1: Model 2: Model 3:
Coefficient (robust standard error)

10
Social
recommendations
Treatment -.0035 (.0618) -.0070 (.0618) .0043 (.0614)
NumberOfLikes .0018** (.0009) .0013* (.0007) .0021** (.0009)
Treatment*NumberOfLikes .0005 (.0009) .0006 (.0009) .0005 (.0009)
Price Price -.0201*** (.0032) -.0242*** (.0024) -.0185*** (.0032)
PriceDiscount .0151*** (.0018) .0111*** (.0017) .0155*** (.0020)
Quality AverageRating .1069*** (.0207) .0759*** (.0143) .0956*** (.0208)
RatingVariance -.0302 (.0563) -.0333 (.0513) -.0158 (.0553)
Competition PricePositionInMarket -.0290* (.0176) -.0300*** (.0084) -.0239 (.0178)
Others
InStock 1.454*** (.0769) 1.4172*** (.0756) 1.5017*** (.0780)
Leasable -.2108*** (.0556) -.3347*** (.0533) -.2439*** (.0567)
NewRelease .6982*** (.0780) .5568*** (.0757) .6960*** (.0787)
Top100 1.344*** (.1586) 1.2172*** (.1403) 1.2981*** (.1596)
Constant -5.591*** (.1244) -5.3674*** (.1075) -5.6154*** (.1300)
Game type controls Dummies Yes No Yes
Publisher controls Dummies No Yes Yes
Observations 112,335
Logit Pseudo-R² .074 .062 .079
* Significant at 10% level; ** Significant at 5% level; ***Significant at 1% level
3.3 Results on Customer Level
While social recommendations do not influence the sales probability on product level through social
contagion, the revenue generated by the treatment group (13,883.74 EUR) is larger by 12.97% than
that of the control group (12,289.46 EUR), which is a significant difference (p<.1). How can we
explain the difference? We answer this question by taking the visitor’s perspective. Each visitor visits
one or more product pages and places an order for one or more products. Therefore, additional revenue
in the treatment group can be the result of 1) a higher conversion rate (the percentage of visitors that
order products increases, “more” shopping baskets), 2) a higher average number of products bought by
each customer (“bigger” shopping baskets) 3) a higher average price per product (“more valuable”
shopping baskets), or 4) a combination of these three factors. We separately study the influence of
social recommendations on each factor and then analyze the aggregate effect.
First, we focus on the navigation of the visitors on the website and study how the treatment (social
recommendation) affects the number of visited product pages. We find that members of the treatment
group visit significantly more product pages than visitors in the control group (p<.05). According to an
OLS estimate, a visitor in the treatment group visits on average .04 more detailed product pages than a
visitor without social recommendations. A Poisson regression yields the same statistical effect (p<.05).
Table 2 summarizes the result.

11
Table 2: Impact of social recommendations on number of visited product pages
Dependent variable: Number of
visited detail pages
OLS coefficient
(robust standard error)
Poisson regression coefficient
(robust standard error)
Social recommendations (treatment) .0405** (.0166) .0263** (.0108)
Constant 1.5220*** (.0109) .4200*** (.0071)
Observations 72,849
R² / Pseudo-R² .0001 .0001
* Significant at 10% level; ** Significant at 5% level; ***Significant at 1% level
Second, we focus on revenues. We use the full sample of 72,849 visitors and examine the influence of
social recommendations (Treatment) on the probability to make a purchase (number of shopping
baskets), on the average number of products bought by a customer (size of shopping baskets), and on
the average price of bought products (value of shopping baskets). For all three relationships, we find
no significant effects. This is striking having in mind that there is a significant and large revenue
difference between the treatment and the control group.
Thus, we analyze the dataset in more detail. As Bettman and Park (1980), Iyengar et al. (2011) and
Aral and Walker (2012) point out, not all people are equally susceptible to social influence. This is
most likely also true in the shopping context. There are different motivations for customers to
purchase products: Customers purchase products since they need them, implicitly assuming that the
shopping motive is a simple function of the buying motive (Tauber 1972). There are however other
motives and some consumers enjoy browsing and looking around. Therefore, we can distinguish
between goal-oriented buyers and impulse shoppers with not so well planned behavior (Tauber 1972).
It appears likely that the latter type of consumers is more susceptible to influence than goal-oriented
ones who know exactly what they want and for example work off a shopping list. We operationalize
this classification as follows. Consumers who visit exactly x product pages and put x products in their
shopping basket are classified to be goal-oriented buyers (denoted as buyers). Consumers who visit y
detail pages and buy x<y products are classified as shoppers. Such shoppers also visit product pages
without buying the product. According to this classification, 61.8% of the customers are (goal-
oriented) buyers and 38.2% are shoppers.
We introduce a binary variable Purchase which is 1 if a visitor has bought at least one product and 0,
otherwise. Purchase is different from Sale, as Purchase measures whether a customer takes a purchase
whereas Sale measures whether a product is bought by a customer. We study the influence of
Treatment on Purchase and distinguish between buyers and shoppers. For shoppers, we find a
significant effect of social recommendation (Treatment) on order probability (Purchase). For
shoppers, the probability to make a purchase is 22.19% higher in the treatment group in comparison to
the control group (p<.05). For buyers, social recommendations have no significant effect on the
probability to take a purchase (p>.1). We compare the conversion rate of the complete treatment group

12
to that of the complete control group and find that it is 1.091 times higher. Table 3 shows the estimates
obtained from a logistic regression and a rare events regression.
Table 3: Impact of social recommendations on probability to make a purchase
Dependent variable:
Purchase (0/1)
Shopper Buyer
Logistic regression Rare events
regression Logistic regression
Rare events
regression
Coefficient (robust standard error)
Social recommendation
(Treatment)
.2004** (.0912)
(Odds Ratio: 1.2219) .2000** (.0912)
.0934 (.1154)
(Odds Ratio: 0.9108) .0931 (.1154)
Constant -5.098*** (.0676)
(Odds Ratio: 0.0061) -5.096*** (.0676)
-5.429*** (.0797)
(Odds Ratio: 0.0044) -5.426*** (.0797)
Observations 72,547 72,360
Pseudo-R² .0008 .0002
* Significant at 10% level; ** Significant at 5% level; ***Significant at 1% level
Otherwise, we find no significant influence of social recommendation (Treatment) neither on the
average number of products bought by a customer nor on the value of purchased products.
Thus, we can conclude that social recommendations do not increase the probability to buy a product
viewed by a customer but social recommendations cause significantly longer search processes
ultimately leading to a higher probability that a visitor places an order. We use OLS to study the total
effect of social recommendations on the revenue per prospective customer. We include a variable
sumLikes that counts the number of Likes of all products that a visitor has inspected, and the quadratic
term sumLikes*sumLikes to allow a non-linear effect. In analogy to NumberOfLikes we consider
interaction effects between Treatment and the linear as well as quadratic sumLikes-variables. We find
that social recommendations significantly increase the average revenue per visitor by +0.06 EUR
(p<.1). The interaction between Treatment and sumLikes (sumLikes*Treatment) is not significant,
however, the interaction between Treatment and sumLikes*sumLikes (sumLikes*sumLikes*Treatment)
is significant (p<0.01). This allows us to separate the effect of latent quality as measured by the
number of Likes, and the effect of the visibility of Likes. The quadratic effect is the social
recommendation effect. It suggests a threshold-like structure of social influence where many Likes are
required for a significant revenue increase. The linear effect captures latent product quality. Table 4
summarizes the results.
Table 4: Impact of social recommendations on revenue per visitor
Dependent variable:
revenue per visitor
OLS coefficient
(robust standard error)
Social Recommendation (Treatment) .0572* (.0295)
sumLikes .0035*** (.0005)
sumLikes*sumLikes -1.10e-06*** (2.40e-07)

13
sumLikes*Treatment -.0006 (.0006)
sumLikes*sumLikes*Treatment 8.19e-07*** (2.46e-07)
Constant .1814*** (.0196)
Observations 72,849
R² .006
* Significant at 10% level; ** Significant at 5% level; ***Significant at 1% level
Figure 2 plots the average additional revenue per customer (measured in Euro) over the average
number of likes seen by a visitor (sumLikes). The overall additional revenue comes from two sources:
the latent quality of a product, which is captured by the number of Likes sumLikes and its squared
term sumLikes*sumLikes, and the social recommendation effect. As the figure illustrates, the latent
quality effect that is usually captured by Likes is much stronger than the social recommendation effect.
However, the social effect exists and can play a substantial economic role.
Figure 2: Average Revenue per visitor
Finally, we perform a robustness check using a Heckman model. The social recommendation
(Treatment) appears in the selection model and the revenue outcome model. The results (see Table 5)
support the findings. On the selection stage, we observe a positive effect of the visibility of social
recommendations (Treatment) on the order probability (Purchase) on customer level (p<.05) and on
the second stage we observe a positive effect of social recommendations on revenue per customer
(p<.05). The coefficient in the outcome equation is affected by its presence in the selection equation
and the coefficients are hard to interpret directly.
0.00
0.20
0.40
0.60
0.80
1.00
1.20
0
20
40
60
80
10
0
12
0
14
0
16
0
18
0
20
0
22
0
24
0
26
0
28
0
30
0
32
0
34
0
Ad
dit
ion
al R
even
ue
Number of Likes
Latent quality effect
Social effect
Aggregate effect
14
Table 5: Heckman model with treatment in selection and outcome equation (shopper)
Heckman model
Selection Model
(Purchase: 0/1)
Outcome Model
(Revenue)
Coefficient (robust standard error)
Social Recommendation (Treatment) .0690** (.0323) 5.6922** (.2.5876)
Constant -2.5082*** (.0237) -167.0508*** (14.2993)
Observations 72,547
Censored Observations 72,058
Uncensored Observations 489
Log Pseudolikelihood -5065.4
* Significant at 10% level; ** Significant at 5% level; ***Significant at 1% level
3.4 Effect of Social Recommendations on Sales Distribution
A variety of studies examine how recommender systems influence the distribution of customer
demand across products. The results are diverse. Anderson (2006) and Brynjolfsson et al. (2006) find
that recommender systems flattens the customer demand distribution across products and, therefore,
reduce the importance of blockbusters, whereas Fleder and Hosangar (2007 as well as Mooney and
Roy (2000) find a higher concentration of demand on blockbuster. Fleder and Hosanagar (2009)
attempt to reconcile these incompatible results. On the one hand, the use of recommender systems
increases the diversity of individual demand by pushing customers towards new products that are not
known to them before, on the other hand it decreases the diversity of the aggregated demand by
pushing different the customers towards the same products (blockbusters).
Brynjolfsson et al. (2011) find evidence that the lower cost of online search reduces the relative
contribution of the best-selling 20% of products to total customer demand. Using simulation studies,
Hinz and Eckert (2010) show that depending on the used recommender technology, consumption can
be shifted either towards blockbusters or niche products. These results have later been empirically
confirmed using transactional data from the movie industry (Hinz et al. 2011a).
Dellarocas, Gao, and Narayan (2011) study the influence of social recommendations in the movie
industry. They find that consumers write more reviews for niche products and blockbusters but less for
films that are neither blockbusters nor niches. This finding implicates that – if the number of
recommendations is important – the use of recommender systems causes consumers to buy more
blockbusters and more products in the long tail, but fewer products in between which are neither
blockbuster nor niche products.
To test this hypothesis, we examine the effect of social recommendations on the sales distribution. We
measure the inequality among the values of the sales distribution using the Gini coefficient, which is
defined as two times the area between the line of equality and the Lorenz curve. The Lorenz curve
plots the proportion of the cumulated total sales over x% of the customers. The Gini coefficient ranges

15
from 0% to 100%; if the Gini coefficient is zero, the Lorenz curve is identical to the line of equality
and each product is bought by the same number of customers. A higher Gini coefficient indicates a
more unequal sales distribution. If the Gini coefficient is one, only one product is bought by the
customers. The Gini coefficient should be interpreted with care, because an infinite number of Lorenz
curves yield the same Gini coefficients (Hinz et al. 2011a).
Unfortunately we do not have information on a very high number of sales and the sales divide
amongst a high number of products in the assortment. Therefore the results are rather descriptive.
However, we believe that the findings are quite interesting: In our experiment, the display of social
recommendations leads to an increase of the Gini coefficient from 24.58% to 24.89%. Therefore, the
sales distribution becomes more unequal. Figure 2 plots the percentage of sales over products, where
the products are ordered in decreasing order with respect to their sales number. The display of social
recommendations decreases the number of sold blockbusters, the long tail gets shorter, and products
that are neither blockbusters nor niches benefit strongly from social recommendations. This finding
indicates that the influence of social recommendations is even more nuanced than previously
anticipated. We believe that in the absence of social recommendations, top lists have a strong
influence on consumer behavior and the display of top lists shifts demand towards blockbusters. If
additional social recommendations are available, the influence of top lists is mitigated and good
products in the middle of the sales distribution curve, experience additional demand. Future research
could test this hypothesis.
Figure 2: Sales distribution with and without social recommendation
0.00%
0.50%
1.00%
1.50%
2.00%
Per
cen
tage
of
sale
s
Products in decreasing order of sales
Without social recommendations
With social recommendations

16
4 Discussion and Implications
Understanding how social recommendations in the form of Likes influence customer behavior is
vitally important to the electronic commerce industry. We conducted a randomized field experiment
with an online store. Over a four week period and considering only prospective customers, the display
of Likes caused a 12.97% revenue increase. The additional revenue is mainly caused by significantly
longer search processes which lead to a 22.19% higher chance that a first-time shopper makes a
purchase. By showing Likes, the expected revenue per prospect increased by +0.06 EUR.
Our study makes the following contributions, each of it relevant to managers. On the basis of previous
research it was difficult for managers to make profound decisions on whether to display Likes in an
online store and what are the economic consequences. Our results suggest that online stores should
indeed display social recommendations as their visibility may lead to significantly longer search
processes, a larger probability that a visitor buys a product and, ultimately, increased revenues and
profits. Therefore, social recommendations should not be seen as a nice-to-have piece of information
that shops show by default but do not care about. The impact of their visibility on purchasing behavior
makes recommendations a valuable asset. We recommend that stores should actively manage these
data. In order to assure that the recommendations may have the desired positive effects, we suggest
stores to ensure that social recommendations are available for all products.
Our results help in estimating the value of platforms that allow the generation of user-generated
content. For example, Facebook collected “more than 2.7 Billion Likes and comments per day” in
2011 (Facebook, 2011). If just 1% of these (27,000,000) were Likes for products with on average 200
Likes per product, the total value captured by the Likes is 353,609,226 EUR per year and the social
contagion effect leads to 14,498,676 EUR additional revenue per year in shops that integrate the Like
button. These are just approximations. Yet, the magnitude of these numbers suggests that the social
effect generated by social recommendations is also of macroeconomic relevance. Managers of online
shops can approximate the value of their user generated content in a similar way.
Further, we find that the social influence of Likes is a nonlinear function of the number of Likes. To
achieve a substantial revenue increase, many Likes are required. This suggests that online stores show
new visitors those products that have gathered a large number of Likes, as this increases the expected
revenue per visitor.
Our study also makes the following contributions to theory. We find that not all customers are equally
susceptible to influence asserted by social recommendations. Previous research in the area of user-
generated content and decision aids does not differentiate between customers who are visiting an
online store and already know which products they want to buy, and those visitors who look around
and visit also products that they do not know before. This suggests future research which studies the
moderating effects of the shopping motive on the online shopping behavior. Along the same line, it

17
could be interesting to study if different motives should be matched with different designs or
functionality of online shops that serve customers better than a standardized version.
Further, this paper has disentangled the social effect of a Like from the latent quality effect. From
these results, we conclude that observational studies must be very careful when interpreting the
estimates. Without experimental manipulation it might be difficult to correctly estimate the social
influence of social recommendations. This seems particularly challenging as the latent quality effect
appears usually to be more than 10 times stronger than the social influence effect.
Of course, our research is not without limitations. Maybe the most important is that we study the effect
of social recommendations on prospective (new) customers. The magnitude of the effects might be
different for existing customers. Furthermore, the magnitudes of the effects might differ across
industries and shops. Future research is needed that replicates our study in different contexts. Finally,
although the results clearly show that the visibility of recommendations influenced customers, this
might not always be the case. The impact on customers might depend on the social network from
which the Likes originate. If the Likes were issued in an online social network that visitors do not
know or do not trust, the effects might be smaller or different than described here.
5 References
Anderson, C. (2006): The long tail: Why the future of business is selling less of more. New York:
Hyperion.
Aral, (2011): Identifying Social Influence: A Comment on Opinion Leadership and Social Contagion
in New Product Diffusion. In: Marketing Science 30 (2), 217–223.
Aral, S.; Muchnik, L.; Sundararajan, A. (2009): Distinguishing influence-based contagion from
homophily-driven diffusion in dynamic networks. In: Proceedings of the National Academy of
Sciences 106 (51), 21544–21549.
Aral, S.; Walker, D. (2012): Identifying Influential and Susceptible Members of Social Networks. In:
Science 337 (6092), 337–341.
Banerjee, A. V. (1992): A simple model of herd behavior. In: The Quarterly Journal of Economics
107 (3), 797–817.
Bapna, R.; Umjarov, A. (2013): Do your online friends make you pay? A randomized field experiment
in an online music social network. Working Paper.
Bettman, J. R.; Park, C. W. (1980): Effects of prior knowledge and experience and phase of the choice
process on consumer decision processes: A protocol analysis. In: Journal of Consumer Research 7 (3),
234–248.

18
Bikhchandani, S.; Hirshleifer, D.; Welch, I. (1992): A theory of fads, fashion, custom, and cultural
change as informational cascades. In: Journal of Political Economy 100 (5), 992–1026.
Brynjolfsson, E.; Hu, Y.; Simester, D. (2011): Goodbye Pareto Principle, Hello Long Tail: The Effect
of Search Costs on the Concentration of Product Sales. In: Management Science 57 (8), 1373–1386.
Brynjolfsson, E.; Hu, Y.; Smith, M. D. (2006): From Niches to Riches: The Anatomy of the Long
Tail. In: Sloan Management Review 47 (4), 67–71.
Chevalier, J. A.; Mayzlin, D. (2006): The effect of word of mouth on sales: Online book reviews. In:
Journal of Marketing Research 43 (3), 345–354.
Chintagunta, P. K.; Gopinath, S.; Venkataraman, (2010): The Effects of Online User Reviews on
Movie Box Office Performance: Accounting for Sequential Rollout and Aggregation Across Local
Markets. In: Marketing Science 29 (5), 944–957.
Christakis, N. A.; Fowler, J. H. (2011): Contagion in Prescribing Behavior Among Networks of
Doctors. In: Marketing Science 30 (2), 213–216.
Christakis, N. A.; Fowler, J. H. (2013): Social contagion theory: examining dynamic social networks
and human behavior. In: Statist. Med. 32 (4), 556–577.
Clemons, E. K.; Gao, G.; Hitt, L. M. (2006): When online reviews meet hyperdifferentiation: A study
of the craft beer industry. In: Journal of Management Information Systems 23 (2), 149–171.
Coleman, J. S.; Katz, E.; Menzel, H. (1966): Medical Innovation: A Diffusion Study. Indianapolis:
Bobbs-Merill.
Dellarocas, C.; Gao, G.; Narayan, R. (2010): Are consumers more likely to contribute online reviews
for hit or nichte products? In: Journal of Management Information Systems 27 (2), 127–157.
Dellarocas, C.; Zhang, X.; Awad, N. F. (2007): Exploring the value of online product reviews in
forecasting sales: The case of motion pictures. In: Journal of Interactive Marketing 21 (4), 23–45.
Duan, W.; Gu, B.; Whinston, A. B. (2008): Do online reviews matter? An empirical investigation of
panel data. In: Decision Support Systems 45 (4), 1007–1016.
Facebook (2011), Report on user data, Prepared for Initial Public Offering, Available online at
http://www.sec.gov/Archives/edgar/data/1326801/000119312512034517/d287954ds1.htm
Fleder, D.; Hosanagar, K. (2007): Recommender systems and their impact on sales diversity. In:
Proceedings of the 8th ACM Conference on Electronic Commerce (EC 07). New York.
Fleder, D.; Hosanagar, K. (2009): Blockbuster Culture's Next Rise or Fall: The Impact of
Recommender Systems on Sales Diversity. In: Management Science 55 (5), 697–712.
Godes, D. (2011): Invited Comment on Opinion Leadership and Social Contagion in New Product
Diffusion. In: Marketing Science 30 (2), 224–229.

19
Godes, D.; Mayzlin, D. (2004): Using online conversations to study word-of-mouth communication.
In: Marketing Science 23 (4), 545–560.
Gu, B.; Park, J.; Konana, P. (2012): Research Note--The Impact of External Word-of-Mouth Sources
on Retailer Sales of High-Involvement Products. In: Information Systems Research 23 (1), 182–196.
Hinz, O.; Eckert, J. (2010): The Impact of Search and Recommendation Systems on Sales in
Electronic Commerce. In: Bus Inf Syst Eng 2 (2), 67–77.
Hinz, O.; Eckert, J.; Skiera, B. (2011a): Drivers of the Long Tail Phenomenon: An Empirical
Analysis. In: Journal of Management Information Systems 27 (4), 43–70.
Hinz, O.; Skiera, B.; Barrot, C.; Becker, J. (2011b): Social Contagion – An Empirical Comparison of
Seeding Strategies for Viral Marketing. In: Journal of Marketing Research 75 (6), 55–71.
Iyengar, R.; van den Bulte, C.; Valente, T. W. (2011): Opinion Leadership and Social Contagion in
New Product Diffusion. In: Marketing Science 30 (2), 195–212.
King, G.; Langche, Z. (2001): Logistic regression in rare events data. In: Political Analysis 9 (2), 137–
163.
Liu, Y. (2006): Word of mouth for movies: Its dynamics and impact on box office revenue. In:
Journal of Marketing Research 70 (3), 74–89.
Matos, M. G. de; Ferreira, P.; Telang, R.; Smith, M. (2013): The impact of popularity on the sales of
movies in Video-on-Demand: a randomized experiment. Working paper.
McCracken, H. (2011): 50 Websites that make the Web great. Hg. v. TIME Magazin. Available online
at http://www.time.com/time/specials/packages/article/0,28804,2087815_ 2088159_2088155,00.html.
Mitroff, (2013): Pinterest gets a billion dollar bump, pins more cash to its boards. WIRED. Available
online at http://www.wired.com/business/2013/02/pinterest-200m.
Moe, W. W.; Trusov, M. (2011): The value of social dynamics in online product rating forums. In:
Journal of Marketing Research 48 (3), 444–456.
Mooney, R. J.; Roy, L. (1999): Content-Based Book Recommending Using Learning for Text
Categorization. In: Proceedings of the SIGIR-99 Workshop on Recommender Systems: Algorithms
and Evaluation. New York.
Parsons, H. M. (1974): What Happened at Hawthorne?: New evidence suggests the Hawthorne effect
resulted from operant reinforcement contingencies. In: Science 183 (4128), 922–932.
Salganik, M. J.; Dodds, P. S.; Watts, D. J. (2006): Experimental Study of Inequality and
Unpredictability in an Artificial Cultural Market. In: Science 311 (5762), 854–856.

20
Salganik, M. J.; Watts, D. J. (2008): Leading the Herd Astray: An Experimental Study of Self-
fulfilling Prophecies in an Artificial Cultural Market. In: Social Psychology Quarterly 71 (4), 338–
355.
Shadish, W. R.; Cook, T. D.; Campbell, D. T. (2002): Experimental and quasi-experimental designs
for generalized causal inference. Boston: Houghton Mifflin.
Sun, M. (2012): How Does the Variance of Product Ratings Matter? In: Management Science 58 (4),
696–707.
Tauber, E. M. (1972): Why do people shop? In: The Journal of Marketing 36 (4), 46–49.
The Nielsen Company (Hg.) (2007): Through the grapevine. Breaking News (September).
Tucker, C.; Zhang, J. (2011): How Does Popularity Information Affect Choices? A Field Experiment.
In: Management Science 57 (5), 828–842.
van den Bulte, C.; Lilien, G. L. (2001): Medical innovation revisited: Social contagion versus
marketing effort. In: American Journal of Sociology 106 (5), 1409–1435. Web Technology Surveys
(2013). Available online at http://w3techs.com/technologies/overview/ social_widget/all.
Zhu, F.; Zhang, X. (2010): Impact of Online Consumer Reviews on Sales: The Moderating Role of
Product and Consumer Characteristics. In: The Journal of Marketing 74 (2), 133–148.