How Do Predatory Lending Laws Influence Mortgage Lending...
30
JRER Vol. 25 No. 4 – 2003 How Do Predatory Lending Laws Influence Mortgage Lending in Urban Areas? A Tale of Two Cities Authors Keith D. Harvey and Peter J. Nigro Abstract This paper examines the effects of predatory lending laws in the cities of Chicago and Philadelphia. The level of mortgage activity in each of the cities is compared during the pre- and post-legislative periods relative to other parts of the state to assess the impact of localized legislation. In Chicago, where the predatory lending law focused on banks, a subprime origination in the city was found to be more likely to be made by a non- bank after the passage of the law. In Philadelphia, however, where the predatory legislation was aimed at all financial service providers, a decline was observed in the likelihood of a subprime loan being originated in the city during the post-legislation period, with the minority and low-income market segments experiencing the largest reduction. Introduction Over the past decade the subprime mortgage market grew dramatically, increasing from $34 billion in 1994 to over $160 billion in 1999. 1 Concurrent with this expansion, there is a growing body of anecdotal evidence suggesting that a subset of lenders involved in the subprime market are engaging in abusive or‘‘predatory’’ lending practices. To deal with these abuses, regulators recently implemented revisions to Regulation Z, a disclosure law that increased the number of loans covered by the Home Equity Protection Act (HOEPA). 2 These revisions to HOEPA, however, did not prohibit any lending practices. In recent months, however, several states and cities have gone beyond increased disclosure and implemented legislation that prohibits or penalizes certain ‘‘predatory practices.’’ 3 Federal policymakers have also proposed legislation on predatory lending that would preempt state laws and prohibit certain predatory practices on a nationwide basis. 4 This study examines the impact of predatory lending legislation in two cities, Chicago and Philadelphia, which were the first to enact predatory lending laws. Because subprime lenders tend to focus their activity in low-income and minority
Transcript of How Do Predatory Lending Laws Influence Mortgage Lending...
J R E R � V o l . 2 5 � N o . 4 – 2 0 0 3
H o w D o P r e d a t o r y L e n d i n g L a w s I n f l u e n c e
M o r t g a g e L e n d i n g i n U r b a n A r e a s ? A
Ta l e o f Tw o C i t i e s
A u t h o r s Keith D. Harvey and Peter J . Nigro
A b s t r a c t This paper examines the effects of predatory lending laws in thecities of Chicago and Philadelphia. The level of mortgageactivity in each of the cities is compared during the pre- andpost-legislative periods relative to other parts of the state toassess the impact of localized legislation. In Chicago, where thepredatory lending law focused on banks, a subprime originationin the city was found to be more likely to be made by a non-bank after the passage of the law. In Philadelphia, however,where the predatory legislation was aimed at all financial serviceproviders, a decline was observed in the likelihood of a subprimeloan being originated in the city during the post-legislationperiod, with the minority and low-income market segmentsexperiencing the largest reduction.
I n t r o d u c t i o n
Over the past decade the subprime mortgage market grew dramatically, increasingfrom $34 billion in 1994 to over $160 billion in 1999.1 Concurrent with thisexpansion, there is a growing body of anecdotal evidence suggesting that a subsetof lenders involved in the subprime market are engaging in abusive or ‘‘predatory’’lending practices. To deal with these abuses, regulators recently implementedrevisions to Regulation Z, a disclosure law that increased the number of loanscovered by the Home Equity Protection Act (HOEPA).2 These revisions toHOEPA, however, did not prohibit any lending practices. In recent months,however, several states and cities have gone beyond increased disclosure andimplemented legislation that prohibits or penalizes certain ‘‘predatory practices.’’3
Federal policymakers have also proposed legislation on predatory lending thatwould preempt state laws and prohibit certain predatory practices on a nationwidebasis.4
This study examines the impact of predatory lending legislation in two cities,Chicago and Philadelphia, which were the first to enact predatory lending laws.Because subprime lenders tend to focus their activity in low-income and minority

4 8 0 � H a r v e y a n d N i g r o
applicant areas, examining the impact of predatory legislation in these two citiesis extremely important.5 In Chicago, the impact of the predatory lending law onboth borrowers and lenders in that city is examined relative to other borrowers inthe state from the pre- to post-legislation period. The impact of the city ofPhiladelphia’s predatory lending ordinance on subprime lending in the city is alsoexamined, although the law was later rescinded by state-level legislation.Philadelphia is included because according to popular press reports the passageof the law led several lenders to exit the city.6
The study focuses on several important questions. First, did the restrictionsimposed in Chicago and Philadelphia affect the availability of credit to subprimeborrowers? Second, if so, what types of borrowers and lenders felt the greatestimpact? Finally, given that the laws have different restrictions and penalties, howdid they affect different types of lenders? It should be noted from the outset,however, that the data do not permit us to ascertain what part of any decline inmortgage lending was predatory in nature. The data employed in the study do nothave information on pricing or other terms of the loans, and even if they did itwould have required a value judgment to decide whether these terms were onerousenough to consider the loans to be predatory.7 Although it is very likely thepredatory lending laws reduced or eliminated some predatory practices,policymakers need also be concerned about their impact on legitimate subprimelending.
The article is organized as follows. First there is a review of the literature onsubprime and predatory lending. Second, there is a brief overview of the Chicagoand Philadelphia predatory legislation. Third, there is a description of the data anddescriptive statistics on mortgage lending activity in Chicago and Philadelphiacompared to the rest of Illinois and Pennsylvania, respectively. Fourth, empiricaltests examine the changes in mortgage flows following the implementation of thecity-level predatory lending laws. Specifically, the impact of the legislation ondenial probabilities and changes in the likelihood of a loan being originated by asubprime versus a traditional lender, or a bank (depository) versus a non-banklender are examined. Fifth, the results of the multivariate analysis are discussed.Finally, there is a summary conclusion with policy implications and areas of futureresearch.
� L i t e r a t u r e R e v i e w
The term predatory lending, while commonly used, does not have a unique oragreed upon definition. Engel and McCoy (2001), however, broadly define apredatory loan as one that meets one or more of the following conditions: loanswith no net benefit to the borrower, loans designed to earn supranormal profits,loans involving fraud or deceptive practices, loans involving other misleadingnondisclosures that are nevertheless legal and loans that require the borrower towaive meaningful redress. Some of these practices include high points, highinterest rates, high or duplicative closing costs and fees, loan-to-value ratios (LTV)
P r e d a t o r y L e n d i n g L a w s � 4 8 1
J R E R � V o l . 2 5 � N o . 4 – 2 0 0 3
in excess of 100% of the underlying collateral, loan flippings, loan steering,excessive prepayment penalties, abusive collection and foreclosure practices andloan features such as negative amortization, balloon payments and unnecessarycredit insurance.8
Loans with high interest rates, however, are not all necessarily predatory in nature.The higher interest rates charged on these loans may simply reflect higher risksand costs associated with ‘‘subprime’’ lending. Subprime loans are higher rateloans designed for borrowers with impaired or limited credit histories that makeit difficult for them to secure credit from the prime market or traditional lenders.9
Lenders argue that these higher rates are justified by the need to be compensatedfor the greater risk that these borrowers pose.10 They also argue that the higherrates charged reflect a lack of standardization in underwriting that makes it morecostly to originate and service loans to borrowers with blemished credit histories,limited discretionary income and cash-flow concerns.11 Predatory lenders,however, may be defined as those that go beyond risk-based pricing and set loanterms high above what is necessary to offset costs and earn a return thatcompensates them for their risk. Given the lack of publicly available informationon loan terms and practices, however, it is very difficult to distinguish betweenthe two. It is generally agreed, however, that predatory lenders constitute asegment of the subprime market.
A significant amount of research on subprime lending activity has been conductedat the Department of Housing and Urban Development (HUD) where for the pastseveral years researchers have compiled a list of subprime lenders.12 Using thislist, HUD and other researchers have documented the high rates of subprimelending in low-income and minority communities. For example, in 2000, HUDissued a report entitled ‘‘Unequal Burden: Income and Racial Disparities inSubprime Lending in America’’ documenting the concentration of these lendersin low-income and minority communities in five cities including Atlanta, LosAngeles, Baltimore, New York and Chicago. They found that subprime loans werethree times more likely in low-income neighborhoods than in high-incomeneighborhoods and five times more likely in black neighborhoods than in whiteneighborhoods. More recently, the Bradford (2002) study on subprime lendingpatterns in all of the nation’s 331 metropolitan areas found that there are‘‘widespread’’ racial disparities in subprime lending activity nationwide, and thetop six areas with the most widespread disparities are all in California.13
Several other researchers have examined subprime lending. Immergluck (1999)focused on the growth rate of subprime lending in Chicago’s minority and low-income community. He found that prime lenders active in white and upper-incomecommunities tended to be less active in minority and lower-income neighborhoodsand that subprime lenders have filled this vacuum. Marsico (2001) examined 1999Home Mortgage Disclosure Act (HMDA) data for New York and found similarpatterns with subprime lenders having a greater presence in low-income andminority communities. Finally, Canner, Passmore and Laderman (1999)demonstrated that subprime lenders are oriented more toward low-income and
4 8 2 � H a r v e y a n d N i g r o
minority applicants and that changes in denial rates over the 1993 to 1998 timeperiod can be partially attributed to the increase in the number of subprimelenders.
Two more recent papers, Elliehausen and Staten (2002) and Harvey and Nigro(2002), examined the impact of the North Carolina predatory lending law onaccess to credit. The North Carolina legislation was the first state-level predatorylending law in the United States. Although the authors employed different datasources, they arrived at similar conclusions. Using 1998-2000 HMDA data,Harvey and Nigro found that the North Carolina law reduced the overall level ofsubprime mortgage lending activity and that the impact of the legislation wasdifferent by both the type of financial service provider and borrower. Specifically,they found that non-bank subprime lending contracted faster in North Carolinawhen compared to the control group, while minority applicants were also lesslikely to get loans following the legislation. Also, Elliehausen and Staten foundthat the North Carolina law significantly reduced the supply of subprime credit.
This study extends Elliehausen and Staten (2002) and Harvey and Nigro (2002)by examining the impact of local legislation passed in the cities of Chicago andPhiladelphia. This is the first study to examine city-level predatory lendinglegislation. Second, given the focus of the laws in each of the two cities, severalunique hypotheses are presented that are specific to the city legislation.
� P r e d a t o r y L e n d i n g L a w s i n C h i c a g o a n d P h i l a d e l p h i a
Chicago became the first city in the nation to impose sanctions on predatorylending when the City Council’s finance committee passed an ordinance in August2000.14 Chicago’s ordinance defines predatory loans as mortgages that haveinterest rates five percentage points or more higher than the yield on U.S. Treasurysecurities of comparable maturities.15 The council blamed these types of loans fora rise in foreclosures and, by extension, in crime in and around vacant lots thatcan result from foreclosures.16 Unlike other proposed federal and implementedstate predatory initiatives, however, the focus of the Chicago law was on banklenders, their mortgage subsidiaries, as well as banks buying ‘‘predatory’’ loansfrom a third party.17 Specifically, the predatory ordinance bars the city of Chicagofrom investing any of its $1 billion of municipal funds at banks with predatoryloans on their books and from doing other business with such banks. Furthermore,the ordinance requires that banks acting as depositories for municipal funds certifythat they do not fund predatory loans. It also requires a similar certification frombanks that have other city contracts.18 The Chicago Department of Housing andMayors office believed that this leverage would promote good practices andresponsible lending.
The Philadelphia predatory lending ordinance was passed in April 2001 and manybelieve that it was one of the toughest efforts aimed at eliminating predatorypractices. The Philadelphia ordinance subjects ‘‘threshold’’ loans, defined as those
P r e d a t o r y L e n d i n g L a w s � 4 8 3
J R E R � V o l . 2 5 � N o . 4 – 2 0 0 3
with rates 4.5 to 6.5 percentage points above Treasury securities of comparablematurity, to stringent restrictions and imposes even harsher penalties on ‘‘high-cost’’ loans, those with rates 6.5 percentage points over comparable Treasuries.These penalties include cash fines or loss of the city’s investment businessdepending on the terms and conditions. Furthermore, the Philadelphia ordinancealso forces all lenders, even banks and credit unions that are exempt from someother provisions, to file disclosures with the city outlining the annual percentagerate and the points charged on each loan. Lenders in the city argued that theordinance would make it harder for people with poor credit histories to get a loanand may force lenders to leave the market.19 Lobbying by mortgage financialservice providers in Philadelphia was eventually successful. On June 21, 2001,the Pennsylvania industry supported bill HB 1703 and provisions were enacted,including those preempting the Philadelphia predatory ordinance, but not beforeseveral lenders exited the city. Thus, this study attempts to determine if the passageand later repeal of the Philadelphia law had any impact on subprime lending.
� T h e D a t a a n d D e s c r i p t i v e S t a t i s t i c s
T h e D a t a
Quarterly HMDA data was collected for Illinois and Pennsylvania. InPennsylvania, observations for the third and fourth quarters of 2000 and 2001constitute the pre-law and post-law samples, respectively. Similarly, the Illinoispre-law sample includes the fourth quarter of 1999 and first quarter of 2000, andthe post-law sample includes these identical quarters for the following year.20
Matching the quarterly periods in each year controls for seasonal trends inmortgage application volume. The action date on the application is used to placeobservations in the quarterly groupings. For both samples the observations for thecities where laws were enacted, Philadelphia and Chicago, are compared with acontrol group of observations for the rest of the state.
The HUD subprime lender list was used to identify lenders whose principalbusiness is subprime lending.21 Low-income applicants are defined as those withannual incomes of less than $25,000 as reported in HMDA data, while theminority grouping includes Black and Hispanic applicants. The race analysisincludes only Caucasian, Black or Hispanic applications. Withdrawn applicationsare not included in the denial rate calculations, but are included in all other areasof the analysis.
C h i c a g o L o a n O r i g i n a t i o n s
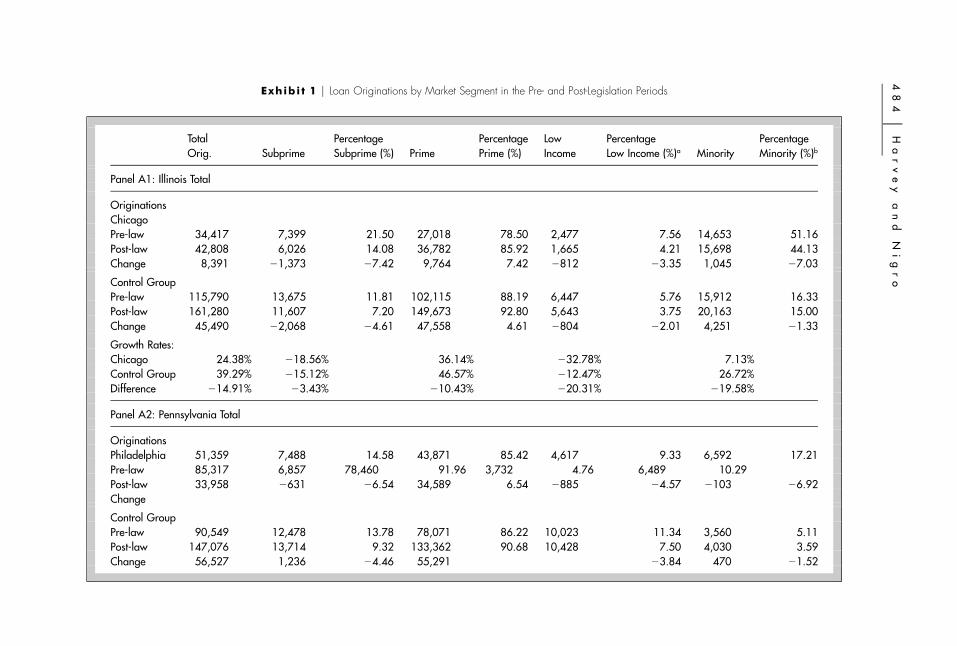
Panels A1 and A2 of Exhibit 1 detail the number of loan originations in Illinoisand Pennsylvania, respectively. The panels provide a breakdown of theoriginations and percentage shares in each market segment in the pre- and post-
48
4�
Ha
rv
ey
an
dN
ig
ro
Exhibi t 1 � Loan Originations by Market Segment in the Pre- and Post-Legislation Periods
TotalOrig. Subprime
PercentageSubprime (%) Prime
PercentagePrime (%)
LowIncome
PercentageLow Income (%)a Minority
PercentageMinority (%)b
Panel A1: Illinois Total
OriginationsChicagoPre-law 34,417 7,399 21.50 27,018 78.50 2,477 7.56 14,653 51.16Post-law 42,808 6,026 14.08 36,782 85.92 1,665 4.21 15,698 44.13Change 8,391 �1,373 �7.42 9,764 7.42 �812 �3.35 1,045 �7.03
Control GroupPre-law 115,790 13,675 11.81 102,115 88.19 6,447 5.76 15,912 16.33Post-law 161,280 11,607 7.20 149,673 92.80 5,643 3.75 20,163 15.00Change 45,490 �2,068 �4.61 47,558 4.61 �804 �2.01 4,251 �1.33
Growth Rates:Chicago 24.38% �18.56% 36.14% �32.78% 7.13%Control Group 39.29% �15.12% 46.57% �12.47% 26.72%Difference �14.91% �3.43% �10.43% �20.31% �19.58%
Panel A2: Pennsylvania Total
OriginationsPhiladelphia 51,359 7,488 14.58 43,871 85.42 4,617 9.33 6,592 17.21Pre-law 85,317 6,857 78,460 91.96 3,732 4.76 6,489 10.29Post-law 33,958 �631 �6.54 34,589 6.54 �885 �4.57 �103 �6.92Change
Control GroupPre-law 90,549 12,478 13.78 78,071 86.22 10,023 11.34 3,560 5.11Post-law 147,076 13,714 9.32 133,362 90.68 10,428 7.50 4,030 3.59Change 56,527 1,236 �4.46 55,291 �3.84 470 �1.52
Pr
ed
at
or
yL
en
di
ng
La
ws
�4
85
JR
ER
�V
ol
.2
5�
No
.4
–2
00
3
Exhibi t 1 � (continued)
Loan Originations by Market Segment in the Pre- and Post-Legislation Periods
Total Percentage Percentage Low Percentage PercentageOrig. Subprime Subprime (%) Prime Prime (%) Income Low Income (%)a Minority Minority (%)b
Panel A2: Pennsylvania Total (continued)
Growth Rates:Philadelphia 66.12% �8.43% 78.84% �19.17% �1.56%Control Group 62.43% 9.91% 70.82% 4.04% 13.20%Difference 3.69% �18.33% 8.02% �23.21% �14.76%
Panel B1: Illinois Subprime Market
OriginationsChicago 1,080 15.21 4,543 80.87Pre-law 505 9.05 3,584 76.94Post-law �575 �6.16 �959 �3.93Change
Control GroupPre-law 1,574 11.94 3,436 34.46Post-law 974 8.98 2,918 35.47Change �600 �2.96 �518 1.01
Growth RatesChicago �53.24% �21.11%Control Group �38.12% �15.08%Difference �15.12% �6.03%
48
6�
Ha
rv
ey
an
dN
ig
ro
Exhibi t 1 � (continued)
Loan Originations by Market Segment in the Pre- and Post-Legislation Periods
Total Percentage Percentage Low Percentage PercentageOrig. Subprime Subprime (%) Prime Prime (%) Income Low Income (%)a Minority Minority (%)b
Panel B2: Pennsylvania Subprime Market
OriginationsPhiladelphia 1,500 20.71 1,817 40.79Pre-law 628 9.82 883 23.45Post-law �872 �10.89 �934 �17.34Change
Control GroupPre-law 2,541 20.85 752 11.11Post-law 1,749 13.18 566 8.65Change �792 �7.67 �186 �2.46
Growth RatesPhiladelphia �58.13% �51.40%Control Group �31.17% �24.73%Difference �26.96% �26.67%
Panel C1: Illinois Prime Market
OriginationsChicago 1,397 5.44 10,110 43.91Pre-law 1,160 3.42 12,114 39.18Post-law �237 �2.02 2,004 �4.73Change
Control GroupPre-law 4,873 4.94 12,476 14.26Post-law 4,669 3.35 17,245 13.67Change �204 �1.59 4,769 �0.59
Pr
ed
at
or
yL
en
di
ng
La
ws
�4
87
JR
ER
�V
ol
.2
5�
No
.4
–2
00
3
Exhibi t 1 � (continued)
Loan Originations by Market Segment in the Pre- and Post-Legislation Periods
Total Percentage Percentage Low Percentage PercentageOrig. Subprime Subprime (%) Prime Prime (%) Income Low Income (%)a Minority Minority (%)b
Panel C1: Prime Market
Growth RatesChicago �16.96% 19.82%Control Group �4.19% 38.23%Difference �12.78% �18.40%
Panel C2: Pennsylvania Prime Market
OriginationsPhiladelphia 3,117 7.38 4,775 14.11Pre-law 3,104 4.31 5,606 9.46Post-law �13 �3.07 831 �4.65Change
Control GroupPre-law 7,482 9.82 2,808 4.46Post-law 8,697 6.90 3,464 3.28Change 1,215 �2.92 656 �1.18
Growth RatesPhiladelphia �0.42% 17.40%Control Group 16.24% 23.36%Difference �16.66% �5.96%
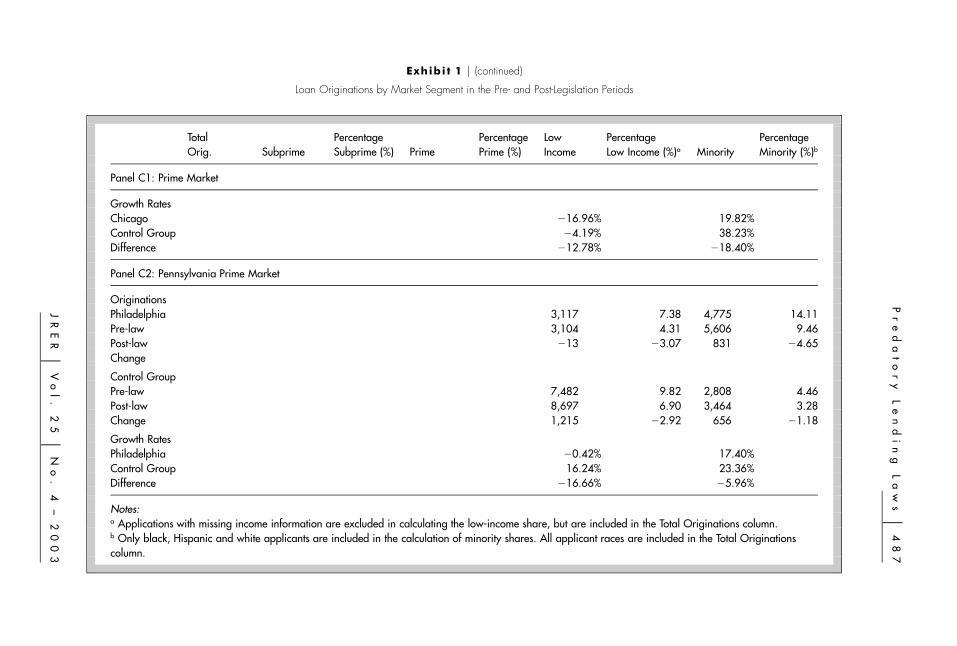
Notes:a Applications with missing income information are excluded in calculating the low-income share, but are included in the Total Originations column.b Only black, Hispanic and white applicants are included in the calculation of minority shares. All applicant races are included in the Total Originationscolumn.
4 8 8 � H a r v e y a n d N i g r o
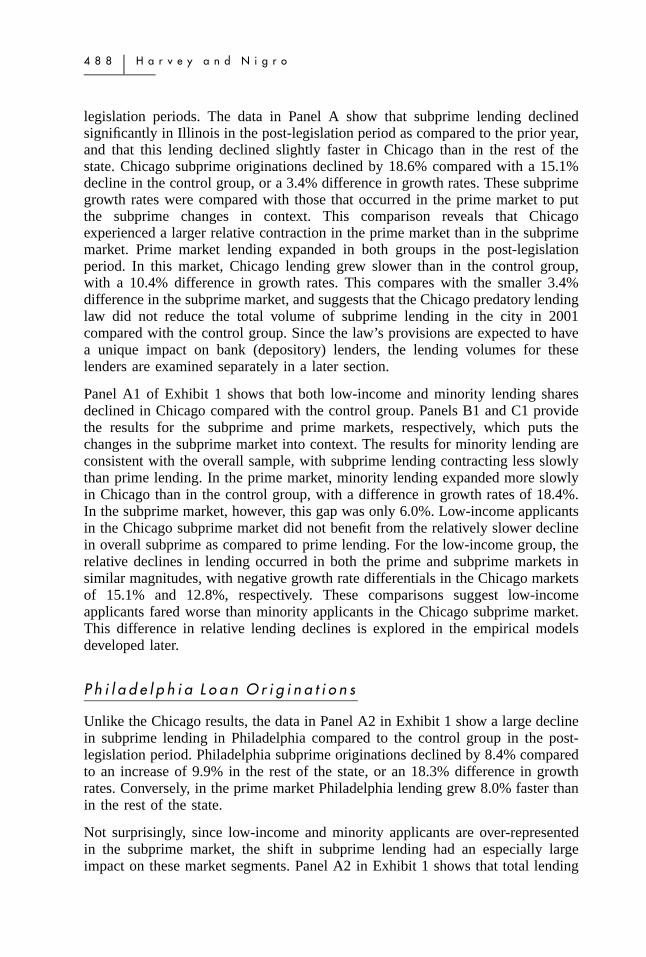
legislation periods. The data in Panel A show that subprime lending declinedsignificantly in Illinois in the post-legislation period as compared to the prior year,and that this lending declined slightly faster in Chicago than in the rest of thestate. Chicago subprime originations declined by 18.6% compared with a 15.1%decline in the control group, or a 3.4% difference in growth rates. These subprimegrowth rates were compared with those that occurred in the prime market to putthe subprime changes in context. This comparison reveals that Chicagoexperienced a larger relative contraction in the prime market than in the subprimemarket. Prime market lending expanded in both groups in the post-legislationperiod. In this market, Chicago lending grew slower than in the control group,with a 10.4% difference in growth rates. This compares with the smaller 3.4%difference in the subprime market, and suggests that the Chicago predatory lendinglaw did not reduce the total volume of subprime lending in the city in 2001compared with the control group. Since the law’s provisions are expected to havea unique impact on bank (depository) lenders, the lending volumes for theselenders are examined separately in a later section.
Panel A1 of Exhibit 1 shows that both low-income and minority lending sharesdeclined in Chicago compared with the control group. Panels B1 and C1 providethe results for the subprime and prime markets, respectively, which puts thechanges in the subprime market into context. The results for minority lending areconsistent with the overall sample, with subprime lending contracting less slowlythan prime lending. In the prime market, minority lending expanded more slowlyin Chicago than in the control group, with a difference in growth rates of 18.4%.In the subprime market, however, this gap was only 6.0%. Low-income applicantsin the Chicago subprime market did not benefit from the relatively slower declinein overall subprime as compared to prime lending. For the low-income group, therelative declines in lending occurred in both the prime and subprime markets insimilar magnitudes, with negative growth rate differentials in the Chicago marketsof 15.1% and 12.8%, respectively. These comparisons suggest low-incomeapplicants fared worse than minority applicants in the Chicago subprime market.This difference in relative lending declines is explored in the empirical modelsdeveloped later.
P h i l a d e l p h i a L o a n O r i g i n a t i o n s
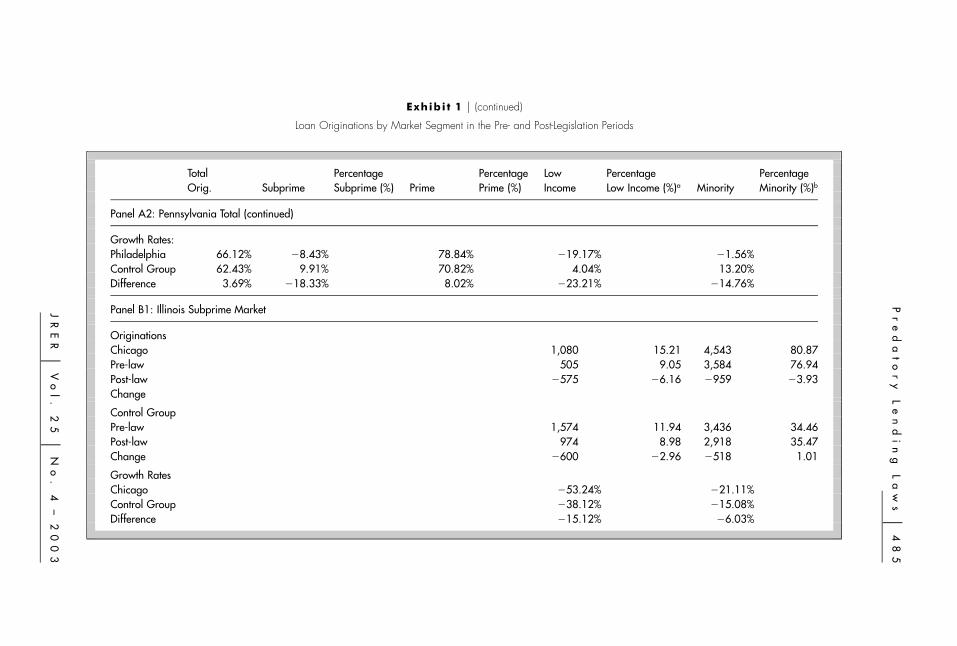
Unlike the Chicago results, the data in Panel A2 in Exhibit 1 show a large declinein subprime lending in Philadelphia compared to the control group in the post-legislation period. Philadelphia subprime originations declined by 8.4% comparedto an increase of 9.9% in the rest of the state, or an 18.3% difference in growthrates. Conversely, in the prime market Philadelphia lending grew 8.0% faster thanin the rest of the state.
Not surprisingly, since low-income and minority applicants are over-representedin the subprime market, the shift in subprime lending had an especially largeimpact on these market segments. Panel A2 in Exhibit 1 shows that total lending
P r e d a t o r y L e n d i n g L a w s � 4 8 9
J R E R � V o l . 2 5 � N o . 4 – 2 0 0 3
to low-income applicants in Philadelphia declined by 19.2% while low-incomelending increased by 4.0% in the rest of the state. Similarly, minority lending inPhiladelphia declined by 1.6% compared to an increase of 13.2% in the rest ofthe state.
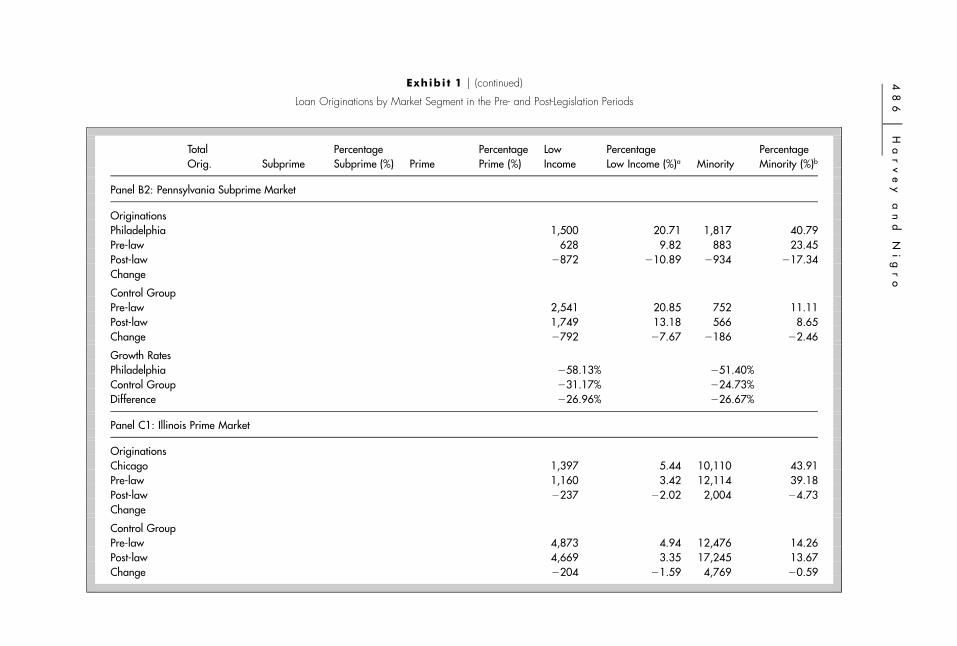
Panels B2 and C2 in Exhibit 1 confirm that these relative declines in low-incomeand minority lending were most severe in the subprime market segment. Subprimelow-income lending declined by 58.1% in Philadelphia compared to a 31.2%decline in the control group, for a 26.9% difference in growth rates. Subprimeminority lending declined by 51.4% in Philadelphia compared to a 24.7% declinein the control group, for a 26.7% difference in growth rates. These growth ratedifferentials are much higher than those that occurred in the prime market, whichwere 16.7% and 6.0% respectively. Overall the data suggest that the Philadelphiapredatory lending law may have reduced subprime lending volumes in the citycompared to the rest of the state, and that this decline had an especially largeimpact on low-income and minority loan applicants.
D e n i a l R a t e s
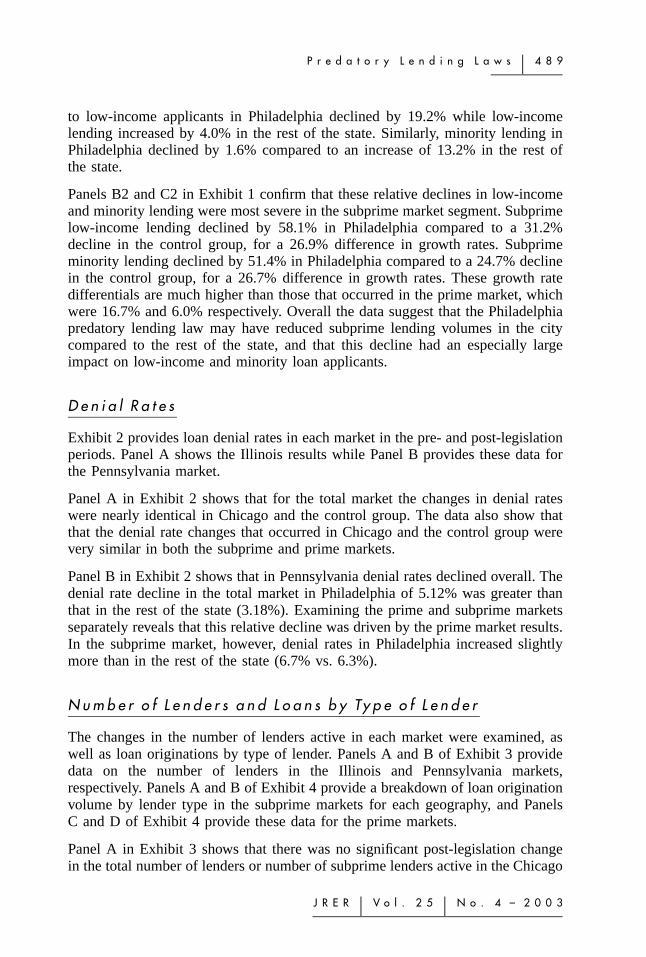
Exhibit 2 provides loan denial rates in each market in the pre- and post-legislationperiods. Panel A shows the Illinois results while Panel B provides these data forthe Pennsylvania market.
Panel A in Exhibit 2 shows that for the total market the changes in denial rateswere nearly identical in Chicago and the control group. The data also show thatthat the denial rate changes that occurred in Chicago and the control group werevery similar in both the subprime and prime markets.
Panel B in Exhibit 2 shows that in Pennsylvania denial rates declined overall. Thedenial rate decline in the total market in Philadelphia of 5.12% was greater thanthat in the rest of the state (3.18%). Examining the prime and subprime marketsseparately reveals that this relative decline was driven by the prime market results.In the subprime market, however, denial rates in Philadelphia increased slightlymore than in the rest of the state (6.7% vs. 6.3%).
N u m b e r o f L e n d e r s a n d L o a n s b y Ty p e o f L e n d e r
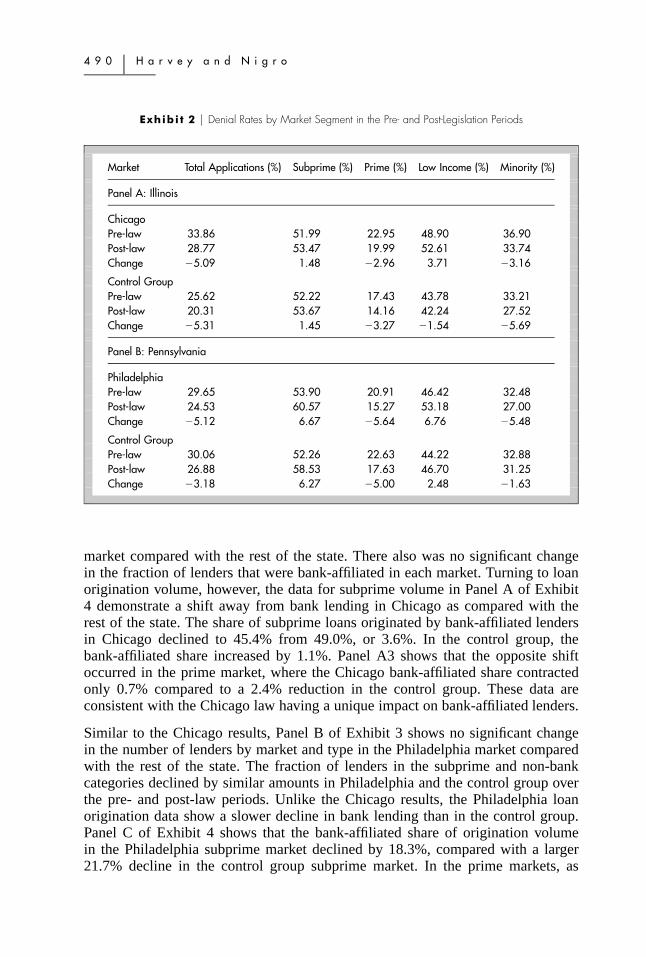
The changes in the number of lenders active in each market were examined, aswell as loan originations by type of lender. Panels A and B of Exhibit 3 providedata on the number of lenders in the Illinois and Pennsylvania markets,respectively. Panels A and B of Exhibit 4 provide a breakdown of loan originationvolume by lender type in the subprime markets for each geography, and PanelsC and D of Exhibit 4 provide these data for the prime markets.
Panel A in Exhibit 3 shows that there was no significant post-legislation changein the total number of lenders or number of subprime lenders active in the Chicago
4 9 0 � H a r v e y a n d N i g r o
Exhibi t 2 � Denial Rates by Market Segment in the Pre- and Post-Legislation Periods
Market Total Applications (%) Subprime (%) Prime (%) Low Income (%) Minority (%)
Panel A: Illinois
ChicagoPre-law 33.86 51.99 22.95 48.90 36.90Post-law 28.77 53.47 19.99 52.61 33.74Change �5.09 1.48 �2.96 3.71 �3.16
Control GroupPre-law 25.62 52.22 17.43 43.78 33.21Post-law 20.31 53.67 14.16 42.24 27.52Change �5.31 1.45 �3.27 �1.54 �5.69
Panel B: Pennsylvania
PhiladelphiaPre-law 29.65 53.90 20.91 46.42 32.48Post-law 24.53 60.57 15.27 53.18 27.00Change �5.12 6.67 �5.64 6.76 �5.48
Control GroupPre-law 30.06 52.26 22.63 44.22 32.88Post-law 26.88 58.53 17.63 46.70 31.25Change �3.18 6.27 �5.00 2.48 �1.63
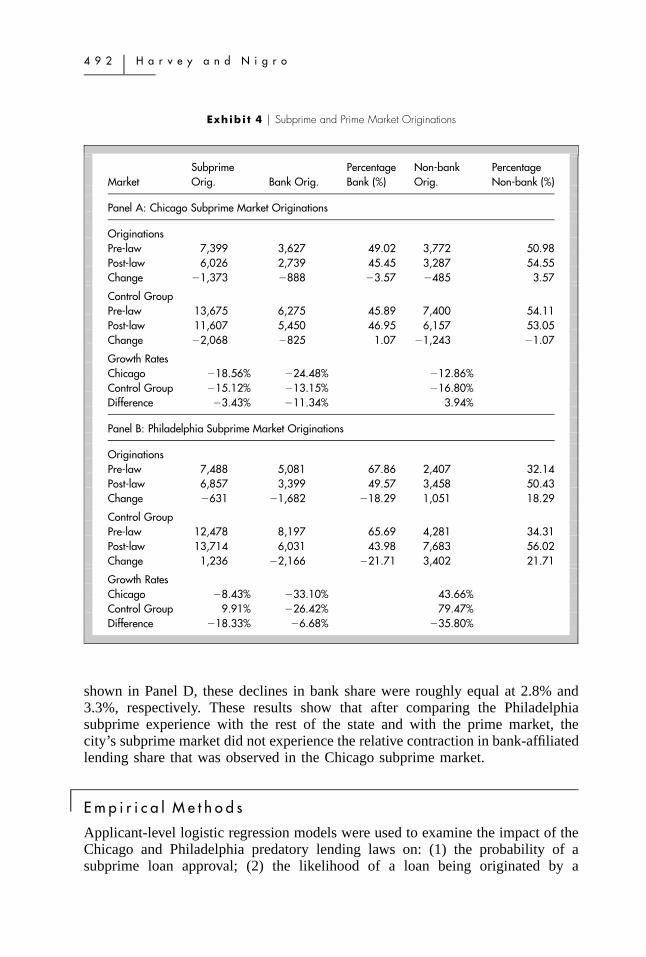
market compared with the rest of the state. There also was no significant changein the fraction of lenders that were bank-affiliated in each market. Turning to loanorigination volume, however, the data for subprime volume in Panel A of Exhibit4 demonstrate a shift away from bank lending in Chicago as compared with therest of the state. The share of subprime loans originated by bank-affiliated lendersin Chicago declined to 45.4% from 49.0%, or 3.6%. In the control group, thebank-affiliated share increased by 1.1%. Panel A3 shows that the opposite shiftoccurred in the prime market, where the Chicago bank-affiliated share contractedonly 0.7% compared to a 2.4% reduction in the control group. These data areconsistent with the Chicago law having a unique impact on bank-affiliated lenders.
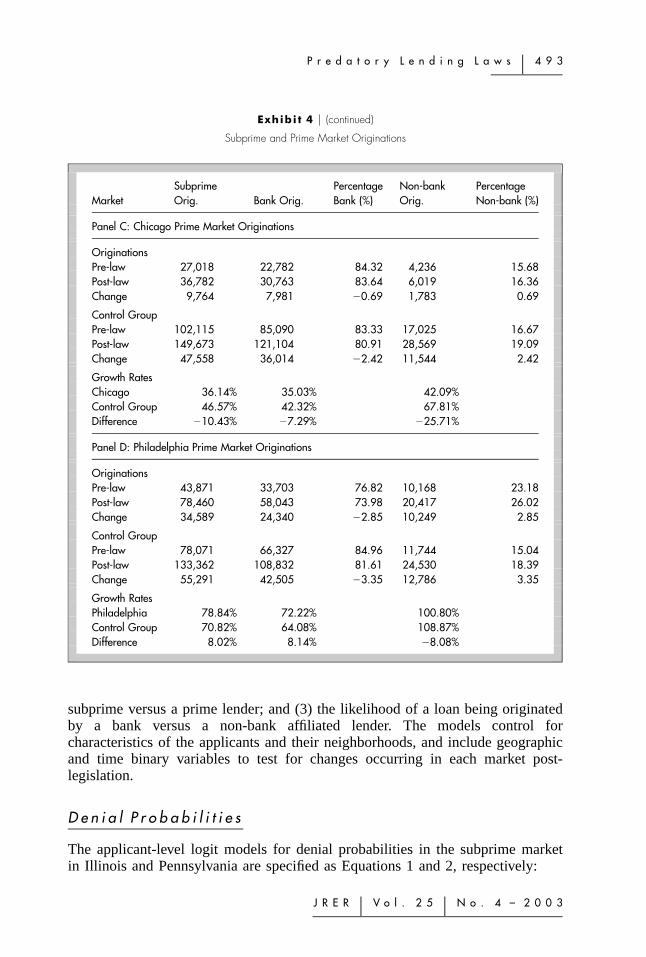
Similar to the Chicago results, Panel B of Exhibit 3 shows no significant changein the number of lenders by market and type in the Philadelphia market comparedwith the rest of the state. The fraction of lenders in the subprime and non-bankcategories declined by similar amounts in Philadelphia and the control group overthe pre- and post-law periods. Unlike the Chicago results, the Philadelphia loanorigination data show a slower decline in bank lending than in the control group.Panel C of Exhibit 4 shows that the bank-affiliated share of origination volumein the Philadelphia subprime market declined by 18.3%, compared with a larger21.7% decline in the control group subprime market. In the prime markets, as
Pr
ed
at
or
yL
en
di
ng
La
ws
�4
91
JR
ER
�V
ol
.2
5�
No
.4
–2
00
3
Exhibi t 3 � Lenders and Originations by Lender Type in the Pre- and Post-Legislation Periods
Pre-Law Post-Law
Number of Percentage Number of PercentageNumber of Percentage Non-bank Non-bank Number of Percentage Non-bank Non-bank
Number of Subprime Subprime Subprime Subprime Number of Subprime Subprime Subprime SubprimeMarket Lenders Lenders Lenders (%) Lenders Lenders (%) Lenders Lenders Lenders (%) Lenders Lenders (%)
Panel A1: Illinois Number of Lenders by Lender Type
Number of LendersChicago 641 106 16.54 75 11.70 643 95 14.77 68 10.58Control Group 1,049 119 11.34 86 8.20 1,028 105 10.21 75 7.30
Growth RatesChicago 0.31% �10.38% �9.33%Control Group �2.00% �11.76% �12.79%
Panel B1: Pennsylvania Number of Lenders by Lender Type
Philadelphia 536 76 14.18 48 8.96 556 70 12.59 46 8.27Control Group 690 80 11.59 49 7.10 750 79 10.53 51 6.80
Growth RatesPhiladelphiaControl Group 3.73% �7.89% �11.21% �4.17% �7.61%
4 9 2 � H a r v e y a n d N i g r o
Exhibi t 4 � Subprime and Prime Market Originations
MarketSubprimeOrig. Bank Orig.
PercentageBank (%)
Non-bankOrig.
PercentageNon-bank (%)
Panel A: Chicago Subprime Market Originations
OriginationsPre-law 7,399 3,627 49.02 3,772 50.98Post-law 6,026 2,739 45.45 3,287 54.55Change �1,373 �888 �3.57 �485 3.57
Control GroupPre-law 13,675 6,275 45.89 7,400 54.11Post-law 11,607 5,450 46.95 6,157 53.05Change �2,068 �825 1.07 �1,243 �1.07
Growth RatesChicago �18.56% �24.48% �12.86%Control Group �15.12% �13.15% �16.80%Difference �3.43% �11.34% 3.94%
Panel B: Philadelphia Subprime Market Originations
OriginationsPre-law 7,488 5,081 67.86 2,407 32.14Post-law 6,857 3,399 49.57 3,458 50.43Change �631 �1,682 �18.29 1,051 18.29
Control GroupPre-law 12,478 8,197 65.69 4,281 34.31Post-law 13,714 6,031 43.98 7,683 56.02Change 1,236 �2,166 �21.71 3,402 21.71
Growth RatesChicago �8.43% �33.10% 43.66%Control Group 9.91% �26.42% 79.47%Difference �18.33% �6.68% �35.80%
shown in Panel D, these declines in bank share were roughly equal at 2.8% and3.3%, respectively. These results show that after comparing the Philadelphiasubprime experience with the rest of the state and with the prime market, thecity’s subprime market did not experience the relative contraction in bank-affiliatedlending share that was observed in the Chicago subprime market.
� E m p i r i c a l M e t h o d s
Applicant-level logistic regression models were used to examine the impact of theChicago and Philadelphia predatory lending laws on: (1) the probability of asubprime loan approval; (2) the likelihood of a loan being originated by a
P r e d a t o r y L e n d i n g L a w s � 4 9 3
J R E R � V o l . 2 5 � N o . 4 – 2 0 0 3
Exhibi t 4 � (continued)
Subprime and Prime Market Originations
MarketSubprimeOrig. Bank Orig.
PercentageBank (%)
Non-bankOrig.
PercentageNon-bank (%)
Panel C: Chicago Prime Market Originations
OriginationsPre-law 27,018 22,782 84.32 4,236 15.68Post-law 36,782 30,763 83.64 6,019 16.36Change 9,764 7,981 �0.69 1,783 0.69
Control GroupPre-law 102,115 85,090 83.33 17,025 16.67Post-law 149,673 121,104 80.91 28,569 19.09Change 47,558 36,014 �2.42 11,544 2.42
Growth RatesChicago 36.14% 35.03% 42.09%Control Group 46.57% 42.32% 67.81%Difference �10.43% �7.29% �25.71%
Panel D: Philadelphia Prime Market Originations
OriginationsPre-law 43,871 33,703 76.82 10,168 23.18Post-law 78,460 58,043 73.98 20,417 26.02Change 34,589 24,340 �2.85 10,249 2.85
Control GroupPre-law 78,071 66,327 84.96 11,744 15.04Post-law 133,362 108,832 81.61 24,530 18.39Change 55,291 42,505 �3.35 12,786 3.35
Growth RatesPhiladelphia 78.84% 72.22% 100.80%Control Group 70.82% 64.08% 108.87%Difference 8.02% 8.14% �8.08%
subprime versus a prime lender; and (3) the likelihood of a loan being originatedby a bank versus a non-bank affiliated lender. The models control forcharacteristics of the applicants and their neighborhoods, and include geographicand time binary variables to test for changes occurring in each market post-legislation.
D e n i a l P r o b a b i l i t i e s
The applicant-level logit models for denial probabilities in the subprime marketin Illinois and Pennsylvania are specified as Equations 1 and 2, respectively:
4 9 4 � H a r v e y a n d N i g r o
DENY � � � � CHICAGO � � POSTLAW1 2
� � CHICPOST � � INCOME � � LOAN2INC3 4 5
� � CENSUS. (1)6
DENY � � � � PHIL � � POSTLAW � � PHILPOST1 2 3
� � INCOME � � LOAN2INC � � CENSUS. (2)4 5 6
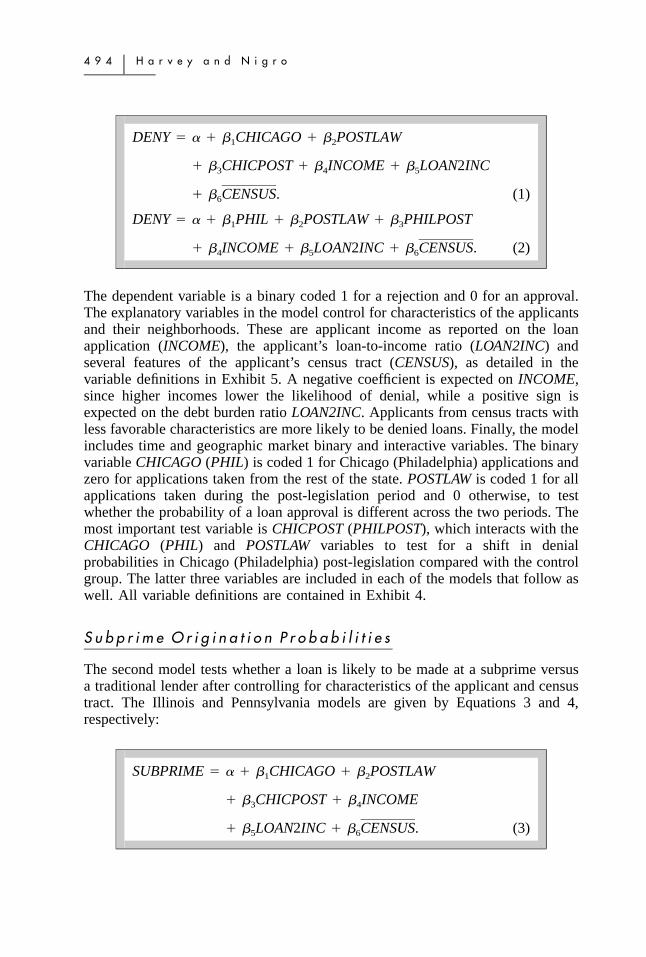
The dependent variable is a binary coded 1 for a rejection and 0 for an approval.The explanatory variables in the model control for characteristics of the applicantsand their neighborhoods. These are applicant income as reported on the loanapplication (INCOME), the applicant’s loan-to-income ratio (LOAN2INC) andseveral features of the applicant’s census tract (CENSUS), as detailed in thevariable definitions in Exhibit 5. A negative coefficient is expected on INCOME,since higher incomes lower the likelihood of denial, while a positive sign isexpected on the debt burden ratio LOAN2INC. Applicants from census tracts withless favorable characteristics are more likely to be denied loans. Finally, the modelincludes time and geographic market binary and interactive variables. The binaryvariable CHICAGO (PHIL) is coded 1 for Chicago (Philadelphia) applications andzero for applications taken from the rest of the state. POSTLAW is coded 1 for allapplications taken during the post-legislation period and 0 otherwise, to testwhether the probability of a loan approval is different across the two periods. Themost important test variable is CHICPOST (PHILPOST), which interacts with theCHICAGO (PHIL) and POSTLAW variables to test for a shift in denialprobabilities in Chicago (Philadelphia) post-legislation compared with the controlgroup. The latter three variables are included in each of the models that follow aswell. All variable definitions are contained in Exhibit 4.
S u b p r i m e O r i g i n a t i o n P r o b a b i l i t i e s
The second model tests whether a loan is likely to be made at a subprime versusa traditional lender after controlling for characteristics of the applicant and censustract. The Illinois and Pennsylvania models are given by Equations 3 and 4,respectively:
SUBPRIME � � � � CHICAGO � � POSTLAW1 2
� � CHICPOST � � INCOME3 4
� � LOAN2INC � � CENSUS. (3)5 6

P r e d a t o r y L e n d i n g L a w s � 4 9 5
J R E R � V o l . 2 5 � N o . 4 – 2 0 0 3
Exhibi t 5 � Variable Definitions
Variables Definition
HMDA VariablesDENIAL Indicator variable �1 if denied; 0 otherwiseINCOME Applicant income reported on HMDALOAN2INC Ratio of requested loan amount to applicant incomeNON-BANK Indicator variable �1 if non-regulated institution; 0 if
regulated, i.e., bank, thrift and credit union
Census VariablesMEDINC Median income in the applicant MSA% MINORITY Percentage of Minorities in the applicant MSA% PUBLIC Percentage of Families on Public Assistance in the
applicant MSA% RENTAL In the applicant MSA% VACANT In the applicant MSA% FEMALEHH Percentage of female head of households in the
applicant MSAAGEHOUSE Average age of the housing stock
Variables Isolating Chicago/Philadelphiaand Effects of LegislationCHICAGOPHIL
Indicator variable: Chicago � 1; 0 otherwiseIndicator variable: Philadelphia � 1; 0 otherwise
POSTLAW Indicator variable: Time period post Chicago(Philadelphia) legislation � 1; 0 otherwise
CHICPOST Indicator variable: post legislation in Chicago � 1; 0otherwise
PHILPOST Indicator variable: post legislation in Philadelphia �
1; 0 otherwise
Note: 1990 Census information was used for the Census variables due to the lack of availabilityof 2000 Census information at the MSA level.
SUBPRIME � � � � PHIL � � POSTLAW � � PHILPOST1 2 3
� � INCOME � � LOAN2INC4 5
� � CENSUS.6 (4)
The dependent variable is coded 1 for subprime originations and zero for non-subprime loan originations. Applicants with weaker incomes and higher loan-to-income ratios are considered more likely to seek a loan from a subprime lender,

4 9 6 � H a r v e y a n d N i g r o
as are applicants from census tracts with less favorable characteristics. The modelsalso include the same binary and interactive variables that control for timing(POSTLAW) and geographic market (CHICAGO and PHIL) effects. As in the firstmodel, the most important variable is the interaction of POSTLAW with thegeographic variables (Chicago and Phil) to test for a shift in subprime lendingpost-legislation in each geographic market.
B a n k A f f i l i a t i o n E f f e c t s
The third model tests whether loan applicants are more likely to get their loanfrom a bank versus a non-bank lender in each geographic market pre- and post-legislation. Results of the tests are provided for both the subprime and primemarkets in each geography. The Illinois and Pennsylvania models are given byEquations 5 and 6, respectively:
NON-BANK � � � � CHICAGO � � POSTLAW1 2
� � CHICPOST � � INCOME3 4
� � LOAN2INC � � CENSUS. (5)5 6
NON-BANK � � � � PHIL � � POSTLAW1 2
� � PHILPOST � � INCOME3 4
� � LOAN2INC � � CENSUS. (6)5 6
The dependent variable is coded 1 for loan originations at non-bank lenders and0 for bank-affiliated lenders.22 INCOME is expected to be inversely related toNON-BANK since lower income applicants may be more likely to rely on non-traditional providers of credit.23 A positive sign is expected for the LOAN2INCvariable for the same reason, while applicants from neighborhoods with lessfavorable census tract characteristics may also rely more heavily on non-traditionalcredit sources. The model includes the same binary and interactive variables asthe first two models to test for a shift in bank versus non-bank lending post-legislation.
� M u l t i v a r i a t e A n a l y s i s R e s u l t s
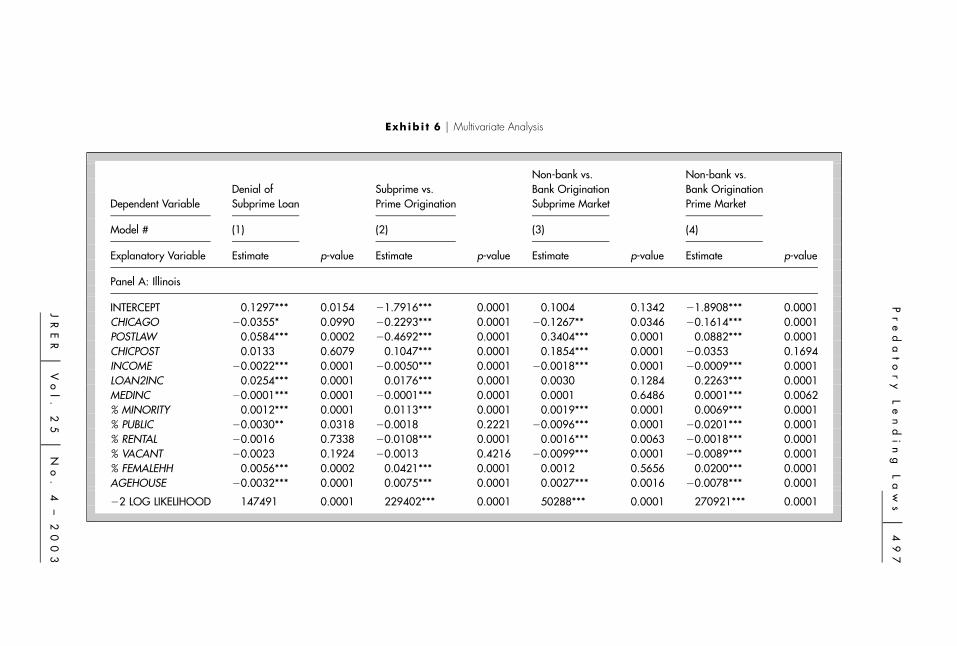
The results of each of the multivariate models outlined in the last section arepresented in Exhibit 6. The results for the Illinois and Pennsylvania samples arecontained in Panels A and B, respectively. This section discusses the results ofeach model in detail.
Pr
ed
at
or
yL
en
di
ng
La
ws
�4
97
JR
ER
�V
ol
.2
5�
No
.4
–2
00
3
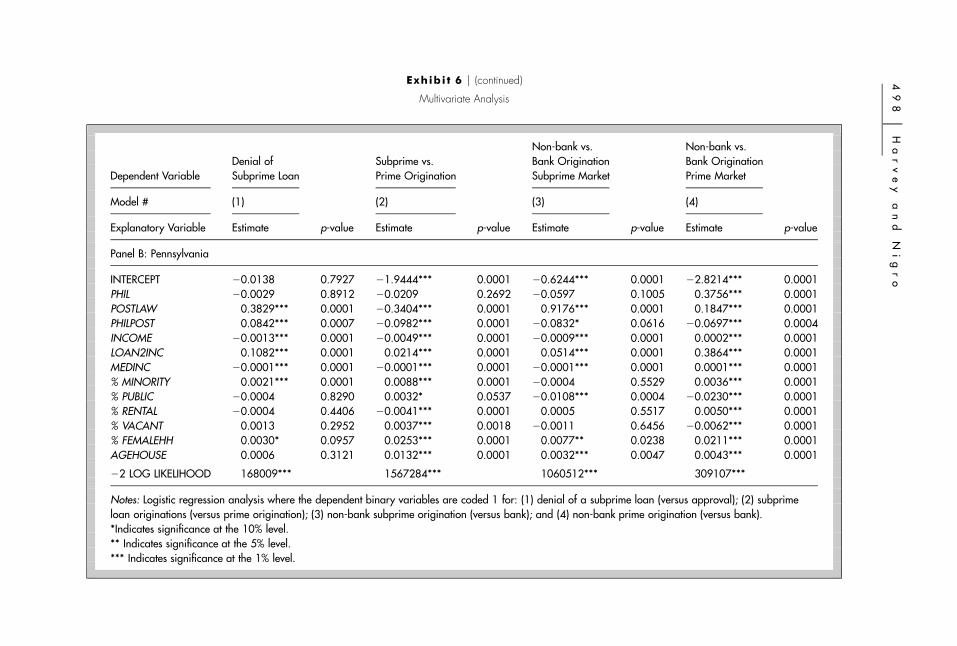
Exhibi t 6 � Multivariate Analysis
Non-bank vs. Non-bank vs.Denial of Subprime vs. Bank Origination Bank Origination
Dependent Variable Subprime Loan Prime Origination Subprime Market Prime Market
Model # (1) (2) (3) (4)
Explanatory Variable Estimate p-value Estimate p-value Estimate p-value Estimate p-value
Panel A: Illinois
INTERCEPT 0.1297*** 0.0154 �1.7916*** 0.0001 0.1004 0.1342 �1.8908*** 0.0001CHICAGO �0.0355* 0.0990 �0.2293*** 0.0001 �0.1267** 0.0346 �0.1614*** 0.0001POSTLAW 0.0584*** 0.0002 �0.4692*** 0.0001 0.3404*** 0.0001 0.0882*** 0.0001CHICPOST 0.0133 0.6079 0.1047*** 0.0001 0.1854*** 0.0001 �0.0353 0.1694INCOME �0.0022*** 0.0001 �0.0050*** 0.0001 �0.0018*** 0.0001 �0.0009*** 0.0001LOAN2INC 0.0254*** 0.0001 0.0176*** 0.0001 0.0030 0.1284 0.2263*** 0.0001MEDINC �0.0001*** 0.0001 �0.0001*** 0.0001 0.0001 0.6486 0.0001*** 0.0062% MINORITY 0.0012*** 0.0001 0.0113*** 0.0001 0.0019*** 0.0001 0.0069*** 0.0001% PUBLIC �0.0030** 0.0318 �0.0018 0.2221 �0.0096*** 0.0001 �0.0201*** 0.0001% RENTAL �0.0016 0.7338 �0.0108*** 0.0001 0.0016*** 0.0063 �0.0018*** 0.0001% VACANT �0.0023 0.1924 �0.0013 0.4216 �0.0099*** 0.0001 �0.0089*** 0.0001% FEMALEHH 0.0056*** 0.0002 0.0421*** 0.0001 0.0012 0.5656 0.0200*** 0.0001AGEHOUSE �0.0032*** 0.0001 0.0075*** 0.0001 0.0027*** 0.0016 �0.0078*** 0.0001
�2 LOG LIKELIHOOD 147491 0.0001 229402*** 0.0001 50288*** 0.0001 270921*** 0.0001
49
8�
Ha
rv
ey
an
dN
ig
ro
Exhibi t 6 � (continued)
Multivariate Analysis
Non-bank vs. Non-bank vs.Denial of Subprime vs. Bank Origination Bank Origination
Dependent Variable Subprime Loan Prime Origination Subprime Market Prime Market
Model # (1) (2) (3) (4)
Explanatory Variable Estimate p-value Estimate p-value Estimate p-value Estimate p-value
Panel B: Pennsylvania
INTERCEPT �0.0138 0.7927 �1.9444*** 0.0001 �0.6244*** 0.0001 �2.8214*** 0.0001PHIL �0.0029 0.8912 �0.0209 0.2692 �0.0597 0.1005 0.3756*** 0.0001POSTLAW 0.3829*** 0.0001 �0.3404*** 0.0001 0.9176*** 0.0001 0.1847*** 0.0001PHILPOST 0.0842*** 0.0007 �0.0982*** 0.0001 �0.0832* 0.0616 �0.0697*** 0.0004INCOME �0.0013*** 0.0001 �0.0049*** 0.0001 �0.0009*** 0.0001 0.0002*** 0.0001LOAN2INC 0.1082*** 0.0001 0.0214*** 0.0001 0.0514*** 0.0001 0.3864*** 0.0001MEDINC �0.0001*** 0.0001 �0.0001*** 0.0001 �0.0001*** 0.0001 0.0001*** 0.0001% MINORITY 0.0021*** 0.0001 0.0088*** 0.0001 �0.0004 0.5529 0.0036*** 0.0001% PUBLIC �0.0004 0.8290 0.0032* 0.0537 �0.0108*** 0.0004 �0.0230*** 0.0001% RENTAL �0.0004 0.4406 �0.0041*** 0.0001 0.0005 0.5517 0.0050*** 0.0001% VACANT 0.0013 0.2952 0.0037*** 0.0018 �0.0011 0.6456 �0.0062*** 0.0001% FEMALEHH 0.0030* 0.0957 0.0253*** 0.0001 0.0077** 0.0238 0.0211*** 0.0001AGEHOUSE 0.0006 0.3121 0.0132*** 0.0001 0.0032*** 0.0047 0.0043*** 0.0001
�2 LOG LIKELIHOOD 168009*** 1567284*** 1060512*** 309107***
Notes: Logistic regression analysis where the dependent binary variables are coded 1 for: (1) denial of a subprime loan (versus approval); (2) subprimeloan originations (versus prime origination); (3) non-bank subprime origination (versus bank); and (4) non-bank prime origination (versus bank).*Indicates significance at the 10% level.** Indicates significance at the 5% level.*** Indicates significance at the 1% level.
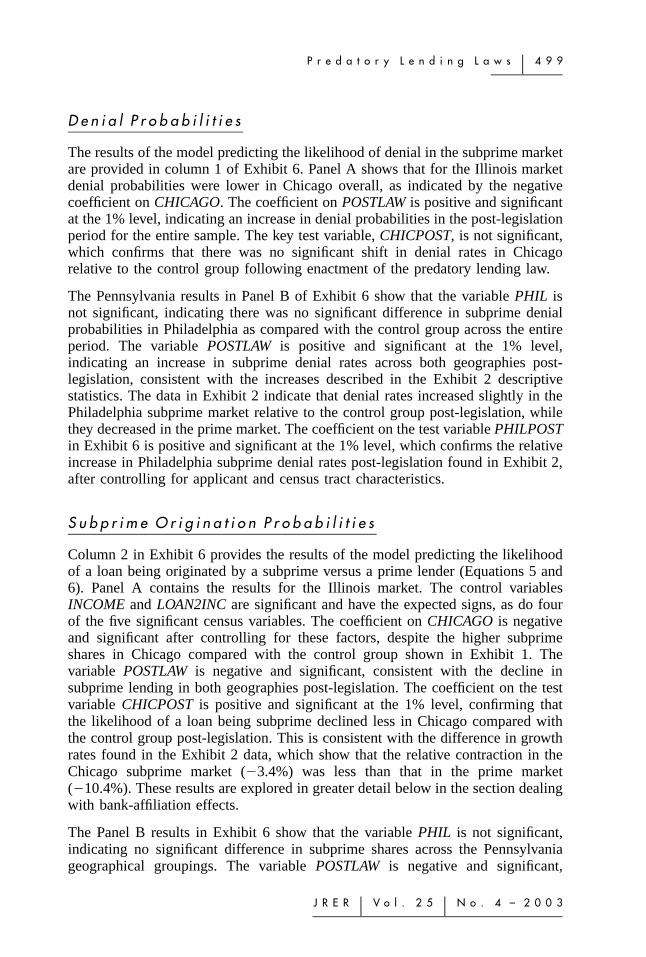
P r e d a t o r y L e n d i n g L a w s � 4 9 9
J R E R � V o l . 2 5 � N o . 4 – 2 0 0 3
D e n i a l P r o b a b i l i t i e s
The results of the model predicting the likelihood of denial in the subprime marketare provided in column 1 of Exhibit 6. Panel A shows that for the Illinois marketdenial probabilities were lower in Chicago overall, as indicated by the negativecoefficient on CHICAGO. The coefficient on POSTLAW is positive and significantat the 1% level, indicating an increase in denial probabilities in the post-legislationperiod for the entire sample. The key test variable, CHICPOST, is not significant,which confirms that there was no significant shift in denial rates in Chicagorelative to the control group following enactment of the predatory lending law.
The Pennsylvania results in Panel B of Exhibit 6 show that the variable PHIL isnot significant, indicating there was no significant difference in subprime denialprobabilities in Philadelphia as compared with the control group across the entireperiod. The variable POSTLAW is positive and significant at the 1% level,indicating an increase in subprime denial rates across both geographies post-legislation, consistent with the increases described in the Exhibit 2 descriptivestatistics. The data in Exhibit 2 indicate that denial rates increased slightly in thePhiladelphia subprime market relative to the control group post-legislation, whilethey decreased in the prime market. The coefficient on the test variable PHILPOSTin Exhibit 6 is positive and significant at the 1% level, which confirms the relativeincrease in Philadelphia subprime denial rates post-legislation found in Exhibit 2,after controlling for applicant and census tract characteristics.
S u b p r i m e O r i g i n a t i o n P r o b a b i l i t i e s
Column 2 in Exhibit 6 provides the results of the model predicting the likelihoodof a loan being originated by a subprime versus a prime lender (Equations 5 and6). Panel A contains the results for the Illinois market. The control variablesINCOME and LOAN2INC are significant and have the expected signs, as do fourof the five significant census variables. The coefficient on CHICAGO is negativeand significant after controlling for these factors, despite the higher subprimeshares in Chicago compared with the control group shown in Exhibit 1. Thevariable POSTLAW is negative and significant, consistent with the decline insubprime lending in both geographies post-legislation. The coefficient on the testvariable CHICPOST is positive and significant at the 1% level, confirming thatthe likelihood of a loan being subprime declined less in Chicago compared withthe control group post-legislation. This is consistent with the difference in growthrates found in the Exhibit 2 data, which show that the relative contraction in theChicago subprime market (�3.4%) was less than that in the prime market(�10.4%). These results are explored in greater detail below in the section dealingwith bank-affiliation effects.
The Panel B results in Exhibit 6 show that the variable PHIL is not significant,indicating no significant difference in subprime shares across the Pennsylvaniageographical groupings. The variable POSTLAW is negative and significant,
5 0 0 � H a r v e y a n d N i g r o
consistent with the overall decline in subprime shares found in Exhibit 1. The keytest variable PHILPOST is negative and significant at the 1% level. This findingindicates a decline in the likelihood of a loan being originated by a subprimelender in Philadelphia post-legislation, compared with the control group. Thisresult, combined with the relative increase in denial rates, suggests that theproposed legislation in Philadelphia may have impacted the marketing andunderwriting of subprime loans in the city.
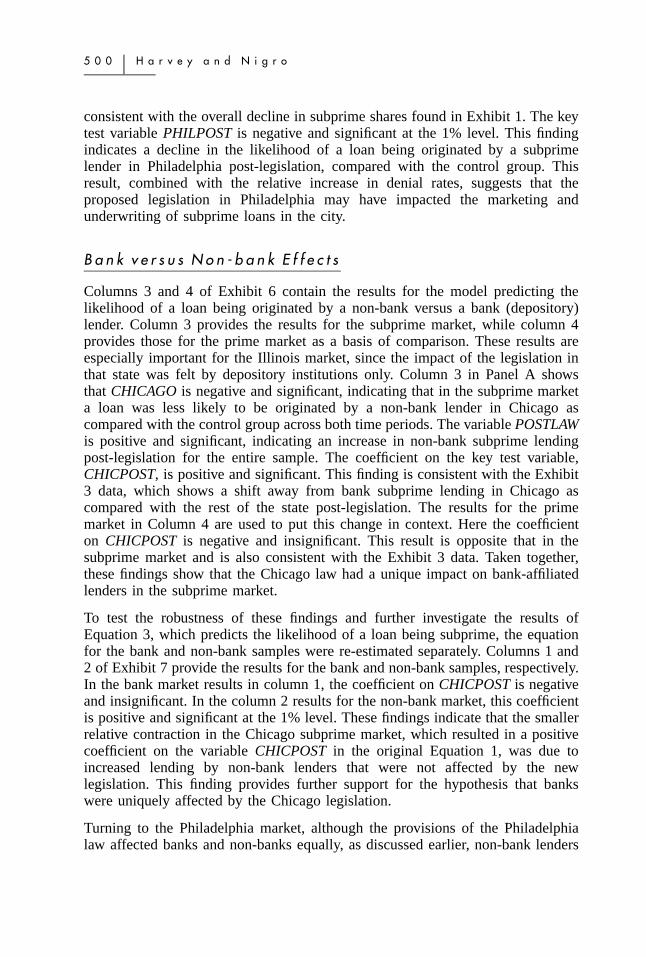
B a n k v e r s u s N o n - b a n k E f f e c t s
Columns 3 and 4 of Exhibit 6 contain the results for the model predicting thelikelihood of a loan being originated by a non-bank versus a bank (depository)lender. Column 3 provides the results for the subprime market, while column 4provides those for the prime market as a basis of comparison. These results areespecially important for the Illinois market, since the impact of the legislation inthat state was felt by depository institutions only. Column 3 in Panel A showsthat CHICAGO is negative and significant, indicating that in the subprime marketa loan was less likely to be originated by a non-bank lender in Chicago ascompared with the control group across both time periods. The variable POSTLAWis positive and significant, indicating an increase in non-bank subprime lendingpost-legislation for the entire sample. The coefficient on the key test variable,CHICPOST, is positive and significant. This finding is consistent with the Exhibit3 data, which shows a shift away from bank subprime lending in Chicago ascompared with the rest of the state post-legislation. The results for the primemarket in Column 4 are used to put this change in context. Here the coefficienton CHICPOST is negative and insignificant. This result is opposite that in thesubprime market and is also consistent with the Exhibit 3 data. Taken together,these findings show that the Chicago law had a unique impact on bank-affiliatedlenders in the subprime market.
To test the robustness of these findings and further investigate the results ofEquation 3, which predicts the likelihood of a loan being subprime, the equationfor the bank and non-bank samples were re-estimated separately. Columns 1 and2 of Exhibit 7 provide the results for the bank and non-bank samples, respectively.In the bank market results in column 1, the coefficient on CHICPOST is negativeand insignificant. In the column 2 results for the non-bank market, this coefficientis positive and significant at the 1% level. These findings indicate that the smallerrelative contraction in the Chicago subprime market, which resulted in a positivecoefficient on the variable CHICPOST in the original Equation 1, was due toincreased lending by non-bank lenders that were not affected by the newlegislation. This finding provides further support for the hypothesis that bankswere uniquely affected by the Chicago legislation.
Turning to the Philadelphia market, although the provisions of the Philadelphialaw affected banks and non-banks equally, as discussed earlier, non-bank lenders

P r e d a t o r y L e n d i n g L a w s � 5 0 1
J R E R � V o l . 2 5 � N o . 4 – 2 0 0 3
Exhibi t 7 � Illinois Subprime Likelihood by Lender Type
ExplanatoryVariable
Bank
Estimate p-value
Origination by Non-Bank
Estimate p-value
INTERCEPT �2.3317*** 0.0001 �0.3315*** 0.0001
CHICAGO �0.1505*** 0.0001 �0.1859*** 0.0001
POSTLAW �0.4547*** 0.0001 �0.5198*** 0.0001
CHICPOST �0.0176 0.6249 0.2528*** 0.0001
INCOME �0.0052*** 0.0001 �0.0041*** 0.0001
LOAN2INC 0.0135*** 0.0001 �0.1382*** 0.0001
MEDINC �0.0001*** 0.0001 �0.0001*** 0.0001
% MINORITY 0.0111*** 0.0001 0.0084*** 0.0001
% PUBLIC �0.0003 0.8935 0.0041* 0.0914
% RENTAL �0.0113*** 0.0001 �0.0104*** 0.0001
% VACANT 0.0013 0.5655 0.0043 0.1040
% FEMALEHH 0.0445*** 0.0001 0.0282*** 0.0001
AGEHOUSE 0.0049*** 0.0001 0.0142*** 0.0001
Notes: Logistic regression analysis where the dependent binary variables are coded 1 for asubprime origination (versus prime). The dependent variable is subprime vs. prime origination.Column 1 contains observations for loans made by depository institutions while column 2 containsthose for loans made by non-banks.* Indicates significance at the 10% level.** Indicates significance at the 5% level.*** Indicates significance at the 1% level.
may be more likely to underwrite loans that could be subject to the new criteria.The results in column 3 of Panel B in Exhibit 6 do show a reduction in thelikelihood of a subprime loan being originated by a non-bank in Philadelphiacompared with the control group, as indicated by the negative coefficient onPHILPOST, which is significant a the 10% level. This variable is also negativeand significant in the column 4 results for the prime market. Thus, there was noapparent unique impact on non-bank lending in the subprime market inPhiladelphia.
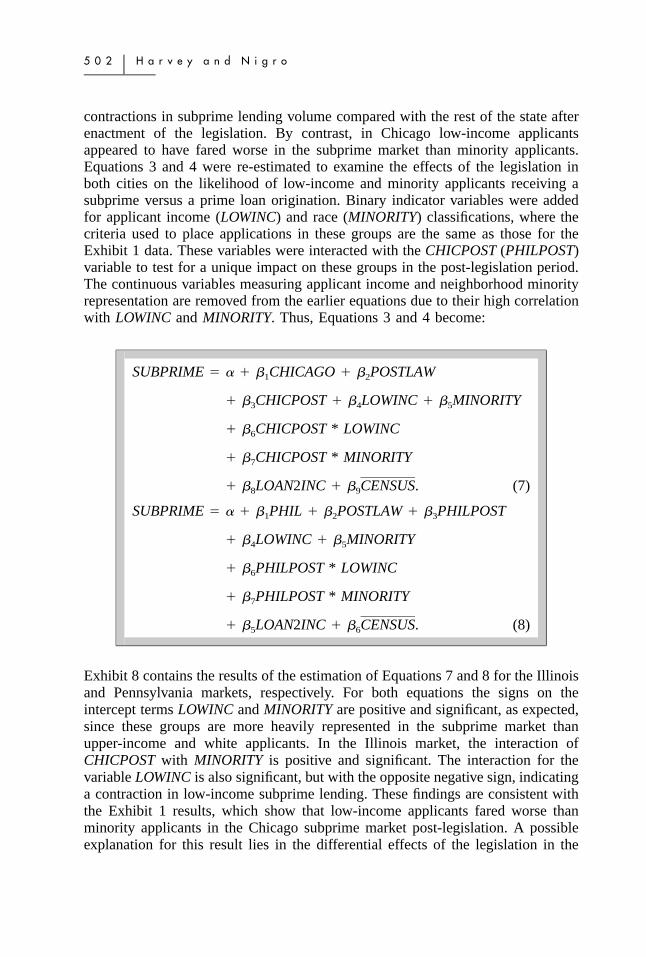
I n c o m e a n d R a c i a l C l a s s i f i c a t i o n E f f e c t s
The examination of growth rate differentials in the Pennsylvania market in Exhibit1 revealed that both low-income and minority loan applicants experienced
5 0 2 � H a r v e y a n d N i g r o
contractions in subprime lending volume compared with the rest of the state afterenactment of the legislation. By contrast, in Chicago low-income applicantsappeared to have fared worse in the subprime market than minority applicants.Equations 3 and 4 were re-estimated to examine the effects of the legislation inboth cities on the likelihood of low-income and minority applicants receiving asubprime versus a prime loan origination. Binary indicator variables were addedfor applicant income (LOWINC) and race (MINORITY) classifications, where thecriteria used to place applications in these groups are the same as those for theExhibit 1 data. These variables were interacted with the CHICPOST (PHILPOST)variable to test for a unique impact on these groups in the post-legislation period.The continuous variables measuring applicant income and neighborhood minorityrepresentation are removed from the earlier equations due to their high correlationwith LOWINC and MINORITY. Thus, Equations 3 and 4 become:
SUBPRIME � � � � CHICAGO � � POSTLAW1 2
� � CHICPOST � � LOWINC � � MINORITY3 4 5
� � CHICPOST * LOWINC6
� � CHICPOST * MINORITY7
� � LOAN2INC � � CENSUS.8 9 (7)
SUBPRIME � � � � PHIL � � POSTLAW � � PHILPOST1 2 3
� � LOWINC � � MINORITY4 5
� � PHILPOST * LOWINC6
� � PHILPOST * MINORITY7
� � LOAN2INC � � CENSUS.5 6 (8)
Exhibit 8 contains the results of the estimation of Equations 7 and 8 for the Illinoisand Pennsylvania markets, respectively. For both equations the signs on theintercept terms LOWINC and MINORITY are positive and significant, as expected,since these groups are more heavily represented in the subprime market thanupper-income and white applicants. In the Illinois market, the interaction ofCHICPOST with MINORITY is positive and significant. The interaction for thevariable LOWINC is also significant, but with the opposite negative sign, indicatinga contraction in low-income subprime lending. These findings are consistent withthe Exhibit 1 results, which show that low-income applicants fared worse thanminority applicants in the Chicago subprime market post-legislation. A possibleexplanation for this result lies in the differential effects of the legislation in the

P r e d a t o r y L e n d i n g L a w s � 5 0 3
J R E R � V o l . 2 5 � N o . 4 – 2 0 0 3
Exhibi t 8 � Income and Racial Classification Effects on Subprime Likelihood
ExplanatoryVariable
Illinois
Estimate p-value
Pennsylvania
Estimate p-value
INTERCEPT �3.0237*** 0.0001 �3.2325*** 0.0001
CHICAGO �0.1993*** 0.0001PHIL �0.0119 0.6031
POSTLAW �0.5050*** 0.0001 �0.4606*** 0.0001
CHICPOST 0.1132*** 0.0083
PHILPOST 0.0089 0.7894
LOWINC 0.5251*** 0.0001 0.4309*** 0.0001
MINORITY 0.8730*** 0.0001 0.6111*** 0.0001
CHICPOST*LOWINC �0.3005*** 0.0001
PHILPOST*LOWINC �0.4533*** 0.0001
CHICPOST*MINORITY 0.1096** 0.0111
PHILPOST*MINORITY �0.1112** 0.0316
LOAN2INC 0.0168*** 0.0001 0.0223*** 0.0001
% PUBLIC �0.0008 0.6463 0.0016 0.4665
% RENTAL �0.0068*** 0.0001 �0.0010* 0.0936
% VACANT 0.0026 0.1614 0.0028* 0.0813
% FEMALEHH 0.0573*** 0.0001 0.0424*** 0.0001
AGEHOUSE 0.0066*** 0.0006 0.0129*** 0.0001
�2 LOG LIKELIHOOD 175396*** 0.0001 144064*** 0.0001
Notes: Logistic regression analysis where the dependent variable is a binary coded 1 for subprimeloan originations (versus prime originations). The columns contain the results for Illinois andPennsylvania, respectively. The models include indicator variables for low-income (LOWINC ) andminority applicants, and their interactions with the city post-law indicator variables (CHICPOSTand PHILPOST ). The dependent variable is subprime vs. prime origination.* Indicates significance at the 10% level.** Indicates significance at the 5% level.*** Indicates significance at the 1% level.
bank versus non-bank markets. To explore this finding further, the same approachas in the models shown in Table 6 was used to re-estimate the equations for thebank and non-bank samples separately. The results, not shown here, indicate thelow-income interaction is negative and significant for the bank sample only, wherethe Chicago law is expected to have had its impact in reducing subprime lending.For the non-bank sample, this interaction variable is not nearly significant.24 Thus,
5 0 4 � H a r v e y a n d N i g r o
a contraction in bank subprime lending in Chicago was not sufficiently offset bynon-bank lending for low-income borrowers.
The results for Pennsylvania indicate that both low-income and minority borrowerswere negatively impacted in the subprime market. The coefficients on bothinteraction terms, LOWINC and MINORITY, are negative and significant.PHILPOST, which now measures the effect on applicants who are neither low-income or minority, is no longer significant, showing that the contraction insubprime lending was felt most by the low-income and minority groups.
� C o n c l u s i o n
This study examined the impact of two city-level predatory lending laws passedin Chicago and Philadelphia. The impact of the localized legislation on denialrates, subprime originations and the impact on different types of lenders in thetwo cities relative to other parts of the states from the pre- to post-legislationperiods were evaluated. This study is the first to examine how city-level predatorylending laws impact mortgage activity. The findings are consistent with resultsfrom previous studies on predatory lending laws.
In Chicago, where the predatory lending law focused on banks, the findingsindicate that a subprime origination in the city was less likely to be made by abank after the passage of the law when compared to the rest of the state. Thus,the legislation did have an impact on its stated target. Non-banks in Chicago,however, appeared to fill the vacuum left by their bank counterparts, as the overalllikelihood of a loan being originated by a subprime lender increased in the cityrelative to the rest of the state during the post-legislation period. This impact ofthe legislation was felt only in the subprime market. The Chicago law did notimpact the likelihood of a prime loan being originated by a non-bank lender.
The Philadelphia predatory lending law, unlike their Chicago counterpart, wasaimed at all financial service providers, and its provisions were generallyconsidered to be more severe. In Philadelphia, the volume of subprime mortgagelending declined significantly when compared to the rest of the state followingthe enactment of the predatory lending law. An examination of the results by raceand income classes indicates that minority and low-income applicants wereaffected to a greater degree than majority applicants.
The results from both cities show significant declines in subprime mortgageactivity, of which a portion is likely predatory in nature. Given the magnitude ofthese declines, however, it is very possible that the city-level predatory laws alsohave had an adverse impact on legitimate subprime lending. These results suggestthat policymakers need to ensure that any future predatory legislation be morenarrowly focused to deter only those lenders actually engaging in predatorypractices. As predatory lending laws become more effective, it is likely thatpredatory lenders will seek to relocate to areas where they are less likely to betargets for predatory legislation. Thus, city-level and even state-level predatory
P r e d a t o r y L e n d i n g L a w s � 5 0 5
J R E R � V o l . 2 5 � N o . 4 – 2 0 0 3
lending legislation enacted in the U.S. during the past few years may actuallyredistribute where predatory lending occurs, as opposed to eliminating it. Thissuggests that policymakers should consider a national predatory lending law topreclude these lenders from targeting geographies that lack effective deterrents.Much more thought, however, has to be given to how such legislation could morenarrowly target predatory lenders.25
Future research should attempt to disentangle how much of the subprime lendingin the two cities is predatory in nature. This would require a data set that includesmore information on pricing and applicant credit-worthiness or more detailedinformation on the lenders operating in the area. Finally, future research couldalso examine the impact of more recent predatory lending statutes in other cities,such as Los Angeles and Detroit, to determine the robustness of the results andwhether different provisions lead to smaller or larger declines in subprime lending.
� E n d n o t e s1 See the HUD/Treasury (2000) joint study on subprime lending.2 The Federal Reserve broadened the scope of HOEPA in December 2001. The goal of
the expansion was to curb some of the most flagrant predatory lending abuses withoutimpairing the growth of legitimate subprime lending. See Remarks by Governor EdwardM. Gramlich, at the Housing Bureau for Seniors Conference, January 2002.
3 For example, in 2000 North Carolina was the first state to implement a predatory lendinglaw. See Harvey and Nigro (2002) and Elliehausen and Staten (2002) for more details.More recently, Georgia passed what many consider the most stringent predatory lendinglaw. See American Banker, October 1, 2002 ‘‘Georgia Predator Law Drives Out SomeLenders,’’ for more details on the Georgia predatory lending law.
4 The Predatory Lending Consumer Protection Act of 2002, introduced by SenatorSarbanes, Chairman of the Senate Banking, Housing and Urban Affairs, wouldimplement a national predatory lending law, while Representative Ney (R-OH)anticipates introducing on January 7, 2003, the first day of the 108th Congress theResponsible Lending Act, which would be a vehicle for consideration of federalpreemption of state and local predatory lending laws.
5 For example, several HUD studies (2000) show the predominance of subprime lendersrole in inner cities such as Atlanta, Baltimore, Los Angeles and New York.
6 For a discussion of lenders who left the Philadelphia market during the time period ofthe imposition of the predatory lending law, see ‘‘Stiff Predator Laws Lead Lenders toExit,’’ American Banker, June 11, 2001.
7 For example, if a borrower cannot obtain a loan from any other source other than asubprime lender charging 300 basis points above other lenders in the area, but desiresand has the ability to repay the loan—is this a predatory loan?
8 Stein (2001) estimates the costs to consumers of these predatory practices at over $9.1billion annually.
9 The banking regulators designate a ‘‘subprime’’ borrower as having one of the followingcharacteristics: two or more 30-day delinquencies; one or more 60-day delinquencies inthe last 24 months; judgment, foreclosure, repossession or charge-off in the prior 24
5 0 6 � H a r v e y a n d N i g r o
months; bankruptcy in the last 5 years; a high default probability as measured by a creditscore of 660 or below; or a debt-to-income ratio of 50% or greater. See OCC Bulletin2001-6.
10 Zorn (2000) finds that up to 100 basis points of the rates charged by subprime lenderscould not be explained by credit risk of the borrowers.
11 Subprime loans are also typically smaller in size, which make the associated fees notonly greater in absolute amounts but also as a percentage of the loan amount.
12 The names, identification numbers and methodology to identify subprime home lenderscompiled are outlined in Scheessele (1998). See http: / /www.huduser.org/datasets /manu.html for lenders on the annual list.
13 Specifically, the study found that African Americans and Latinos are disproportionatelyrepresented in the subprime lending market and that these patterns persist across allincome levels and throughout the nation.
14 The Chicago predatory lending law was the footprint for the state law passed in mid-April 2001. See the Mortgage Bankers Association site on predatory at http: / /www.mbaa.org/resources/predlend for more information on the status of predatorylending laws in Illinois and the rest of the U.S.
15 This currently equals roughly an 11% mortgage rate or total fees and points exceedingmore than 4% of the loan amount.
16 The city says that more than 40% of repossessions last year were the result of subprimeloans, up from 15% in 1993 (see American Banker, April 24, 2000).
17 The passage of the Chicago ordinance came after five months of negotiations with thebanking industry that wanted to narrow the predatory lending guidelines defined by thecouncil (see American Banker, August 31, 2000).
18 The institutions impacted range in size from $651 billion-asset Bank of America Corp.to $48 million-asset Community Bank of Lawndale (see American Banker, April 20,2000).
19 See American Banker, June 15, 2001, ‘‘Stiff Predator Laws Lead Lenders to Exit,’’ thatstates that ‘‘. . . ten different lenders who have already left the market’’ prior toimplementation and that numerous more planned to pull out of the city.
20 The remainder of 2001 is excluded from the Illinois data, since a state-level predatorylaw passed in the second quarter of 2001.
21 The subprime lender list is comprised of all subprime lenders who primarily engage inthis activity. Thus, the list omits some prime lenders who may have a small subprimeportfolio, as well as some identified subprime lenders who are active on the primemarket.
22 The HMDA data includes ‘‘agency’’ codes that permits us to separate out banks fromnon-banks.
23 See Vermilyea and Wilcox (2002) for a discussion of ‘‘banked and unbanked’’consumers.
24 In the bank sample, the p-value for the low-income interaction variable is .0005, whilein the non-bank sample it is .6932.
25 The Office of the Comptroller of the Currency recently proposed guidance for flexiblenational guidelines on predatory lending, as opposed to regulation, arguing that strictrules might inadvertently outlaw useful loan features and that any framework to reduce
P r e d a t o r y L e n d i n g L a w s � 5 0 7
J R E R � V o l . 2 5 � N o . 4 – 2 0 0 3
predatory practices needs to be done on a national level (see Washington Post, February22, 2003, p. E01).
� R e f e r e n c e s
Association of Community Organizations for Reform Now (ACORN), Separate andUnequal: Predatory Lending in America, Washington, DC: ACORN, November, 2001.
Agencies Expand Subprime Lending Guidance, ABA Bank Compliance, 2001, 22:3.
Best Practices Not Good Enough, American Banker, June 12, 2002, 11.
Bradford, C., Risk or Race? Racial Disparities and the Subprime Mortgage Market, ReportIssued by the Center for Community Change, 2002.
Canner, G., W. Passmore and E. Laderman, The Role of Specialized Lenders in ExtendingMortgages to Lower-Income and Minority Homebuyers, Board of Governors of the FederalReserve System, Federal Reserve Bulletin, November, 1999, 709–26.
Chicago Predator Law Sees Guilt by Association, American Banker, August 31, 2000.
Chicago Weighs Halt of City Business For Banks Linked to Predatory Loans, AmericanBanker, April 20, 2000.
Curbing Predatory Home Mortgage Lending: A Joint Report, United States Department ofthe Treasury and United States Department of Housing and Urban Development, June 2000.
Department of Justice May Target Lenders with High Foreclosure Rates, National MortgageNews, May 13, 2002, 23.
Elliehausen, G. and M. Staten, Predatory Lending and the North Carolina Experience, Paperpresented at the September 2002 Credit Research Conference on Subprime Lending.
Engel, K. and P. McCoy, The Law and Economics of Remedies of Predatory Lending,Proceedings of a conference held in Washington, DC. A Federal Reserve SystemCommunity Affairs Research Conference; Changing Financial Markets and CommunityDevelopment, April 5–6, 2001.
Expanded Guidance for Subprime Lending Programs, OCC Bulletin 2001-6.
FDIC Chief Urges Tighter Capital Rules On Subprimes, American Banker, Oct 12,1999, 1.
Freddie Mac Defends Purchase of Subprime Mortgages, American Banker, April 6,2000, 7.
Georgia Predator Law Drives Out Some Lenders, American Banker, October 1, 2002.
Gramlich, E., Predatory Lending, Remarks by Governor Edward M. Gramlich at theHousing Bureau for Seniors Conference, Ann Arbor, Michigan, January 17, 2002.
Harvey, K. and P. Nigro, Do Predatory Lending Laws Influence Mortgage Lending? AnAnalysis of the North Carolina Predatory Lending Law, Paper presented at the September2002 Credit Research Conference on Subprime Lending.
Immergluck, D., Two Steps Back: The Dual Mortgage Market, Predatory Lending, and theUndoing of Community Development, Chicago, IL: The Woodstock Institute, 1999.
In Brief: Preemption Talk Raises Subprime Hopes, American Banker, May 6, 2002, 24.
Marsico, R., Patterns of Lending to Low-Income and Minority Persons and Neighborhoods:The 1999 New York Metropolitan Area Lending Scorecard, NY Law School, Public LawResearch Paper No. 02/02, 2001.
5 0 8 � H a r v e y a n d N i g r o
N.C. Passes Second Predator Law, American Banker, September 21, 2001, 6.
Providian Ordered Out of Subprime, American Banker, November 29, 2001, 1.
Relevant Statutes Enforced by Federal Trade Commission, FTC Fact Sheet, January 30,1998.
Scheessele, R. M., 1998 HMDA Highlights, Working Paper No. HF-009, Office of PolicyDevelopment and Research, U.S. Department of Housing and Urban Development, October,1999.
Subprime Lending Forecast: Defaults Will Edge Up on New Production, National MortgageNews, June 17, 2002, 14.
Staten, M. and G. Elliehausen, The Impact of the Federal Reserve Board’s ProposedRevisions to HOEPA on the Number and Characteristics of HOEPA Loans, Report preparedby the Credit Research Center, 2001.
Stein, E., Quantifying the Economic Costs of Predatory Lending, A Report from theCoalition for Responsible Lending, October, 2001.
Sarbanes Aide: Best Practices Not Good Enough, American Banker, June 12, 2002, 11.
Stiff Predator Laws Lead Lenders to Exit, American Banker, June 11,2001.
Unequal Burden: Income and Racial Disparities in Subprime Lending in America, HUD/Treasury Joint Study, 2000.
U.S. Department of Housing and Urban Development, Unequal Burden in Atlanta: Incomeand Racial Disparities in Subprime Lending, Washington, DC, 2000.
U.S. Department of Housing and Urban Development Unequal Burden in Baltimore:Income and Racial Disparities in Subprime Lending, Washington, DC, 2000.
U.S. Department of Housing and Urban Development, Unequal Burden in New York:Income and Racial Disparities in Subprime Lending, Washington, DC, 2000.
Vermilyea, T. and J. Wilcox Who is Unbanked, and Why: Results from a Large, NewSurvey of Low-and-Moderate Income Adults, Paper prepared for the 2002 Chicago BankStructure Conference, 2002.
Zorn, P., Subprime Lending: An Investigation of Economic Efficiency, Freddie Mac, 2000.
The authors thank David Nebhut for very useful comments. The opinions expressedare those of the authors and do not necessarily represent those of the Office of theComptroller of the Currency or the Treasury Department.
Keith D. Harvey, Boise State University, Boise, ID 83725 or [email protected].
Peter J. Nigro, Bryant College, Smithfield, RI 02917 or [email protected].