How do Morgan & Scott County Children Enter the Child Welfare System? Morgan and Scott Counties...
29
Talking About PERMANENCY in Our Community What Does the DATA Tell Us? Morgan and Scott Counties
-
date post
19-Dec-2015 -
Category
Documents
-
view
213 -
download
0
Transcript of How do Morgan & Scott County Children Enter the Child Welfare System? Morgan and Scott Counties...

Talking About PERMANENCY in Our Community
What Does the DATA Tell Us?
Morgan and Scott Counties

Morgan and Scott Counties
How do Morgan & Scott County Children Enter the Child Welfare System?Indicated reports FY 2010Source Number Percent of totalLaw enforcement 31 29%Relative/neighbor 26 24%School personnel 16 15%Medical 14 13%“Other”9 8%Social services 7 6%DCFS personnel 5 5%Child care centers 0 0%Coroner/Medical Exam 0 0%
108 100%In FY10 only 5 children were indicated in Scott County – 1 each from
medical, law enforcement, DCFS, school and relative/neighbor.Source: DCFS QA FY 2010

Morgan and Scott Counties
How do Children Enter the Child Welfare System?As shown above, law enforcement was the largest
source of indicated reports in Morgan County.
Further, law enforcement reports overall were more likely to be indicated than reports from other sources.
- 69% of reports (31 reports out of 45) from law enforcement personnel were indicated in FY2010.- 40% of reports from medical sources were indicated.
Source: DCFS QA FY 2010

Morgan and Scott Counties
What Types of Harm do Children Experience in Morgan & Scott Counties?
Morgan ScottType N indicated % N indicated %ABUSESubstantial risk of harm 26 18% 0Physical abuse 15 11% 1 14.5%Sexual abuse 11 8% 0Emotional abuse 1 >1%0
NEGLECTBlatant disregard 59 42% 5 71%Lack of supervision 22 16% 1 14.5%Environmental 6 4% 0Lack of health 1 >1% 0
141 100% 7 100%Source: DCFS QA FY 2010

Morgan and Scott Counties
What Types of Harm …?By far the most common harm to children in FY10 is neglect/ blatant disregard for child’s welfare, representing 42% of all indicated reports in Morgan County.
The second most common is abuse/substantial risk of harm (18%), followed by neglect/lack of supervision, (16%) of indicated cases.
Sexual abuse per se accounts for 8% of indicated cases (11 cases). However, when this is combined with substantial risk of sexual injury (n=4), then 11% of cases relate to sexual harm to children. [Data not summarized for Scott due to small numbers]Source: DCFS QA FY 2010

Morgan and Scott Counties
In FY10, 18 children and youth entered foster care in Morgan County.
Gender: female – 50% male – 50%
Race: African American 1 6%White17 94%Hispanic* 0 0%
No children entered care in Scott County in FY10.
Source: DCFS QA FY 2010
*There are on-going concerns about how Latino or Hispanic ethnicity is determined for DCFS clients. This percent is based on classification in QA data.
Who Entered Care in Morgan County in FY10?

Morgan and Scott Counties
Who is in Care?At the close of FY10, 50 children were in out-
of-home care in Morgan County.- 17 or 34% of children were African American- 33 or 66% were White- 0% were Hispanic
In Scott County all 3 children in care were White.
Source: DCFS QA FY 2010 & 2009.

Morgan and Scott Counties
Who is in Care?GENDER In Morgan County 46% of youth were female, 54% maleIn Scott, 2 children (66%) were male, and 1 (33%) female.
AGE In Morgan County
28% 2 or under32% 3 - 5 18% 6 - 9 6% 10 – 1310% 14 – 17 6% 18+
In Scott, 1 child was 3-5, 1 was 10-13 and 1 was 18 or older.
Source: DCFS QA 2010

Morgan and Scott Counties
What are the Permanency Goals for Youth in Care?*Morgan:
Reunification 67%Adoption 25%Independence 6%Guardianship 2%
100%In Scott, 1 had a goal of independence, 2 had a
goal of reunification.Source: DCFS QA FY 2010
*This table excludes children for whom data were missing or coded as “other”

Morgan and Scott Counties
Where are Children Placed?*
Morgan:
- with kin (46%)- traditional foster care (30%)- specialized care (13%)- institution/group care (11%)
In Scott, all 3 children were with kin.
* QA data combines foster and relative care, thus this information is from CFRC for FY09.
Morgan and Scott Counties
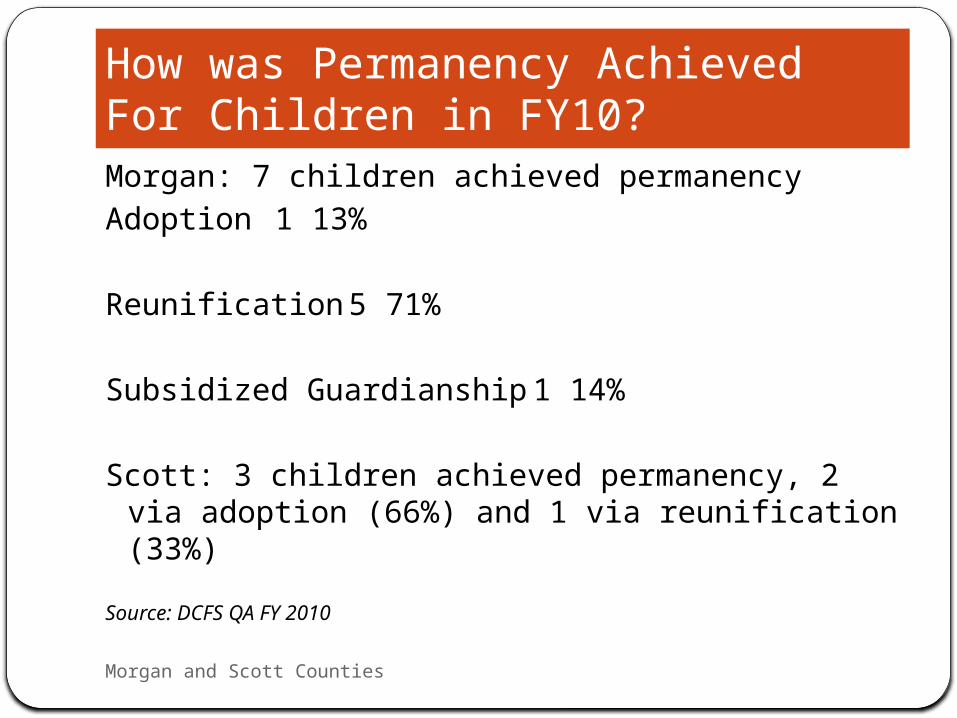
How was Permanency Achieved For Children in FY10? Morgan: 7 children achieved permanencyAdoption 1 13%
Reunification 5 71%
Subsidized Guardianship 1 14%
Scott: 3 children achieved permanency, 2 via adoption (66%) and 1 via reunification (33%)
Source: DCFS QA FY 2010

Morgan and Scott Counties
How have Permanency Rates Changed over Time?
Source: CFRC 2009
2004 2005 2006 2007 20080%
20%
40%
60%
80%
100%
Year Child Entered CareYear Child Entered Care
Morgan County:12 Month Permanency

Morgan and Scott Counties
How have 24 Month Permanency Rates Changed Over Time?
Source: CFRC 2009
2003 2004 2005 2006 20070%
20%
40%
60%
80%
100%
Year Child Entered Care
Morgan County:24 Month Permanency

Morgan and Scott Counties
Over the last 5 years, Morgan County has seen fluctuation in 12 month permanency – from a high of 70% (26 children) for those entering care in 2007 to a low of 18% (2 children) for those entering in 2008.
24 month permanency has fluctuated as well, but has generally trended up.
The most recent data (those entering care in 2007) show 70% achieving 24 month permanency.
(There are too few children in Scott to meaningfully chart permanency trends.)
Source: CFRC 2009. [Such data are not yet available from QA]
What are the Permanency Trends in Morgan County?

Morgan and Scott Counties
Disproportionality and Disparity in our CountyDisproportionality is when the percentage of a group of children
in a population is different from the percentage of the same group in the child welfare system.
For example, if 25% of the children in a county were African American, then 25% of those in foster care should be African American, all things being equal. That would be proportional. If these percents differ there is disproportionality.
Disparity is unequal treatment or outcomes when comparing children of color to non-minority children.
For example, if African American children are less likely to achieve permanency than white children then there are disparate outcomes by race/ethnicity.

Morgan and Scott Counties
Is There Disproportionality in Morgan County?YES African American children continue to be overrepresented
among children in care in Morgan County.
8% of the child population is African American, compared to 34% of those in care at the end of FY10.
88% of the child population is White, compared to 66% of those in care.
4% of the child population is Hispanic, compared to 0% of those in care.
This overrepresentation has been the case for many years. (For Scott County no racial comparisons will be made given the
very small numbers of children in care.)Source: 2009 population data come from CFRC, 2010 placement data
from QA

Morgan and Scott Counties
Disproportionality
African American Hispanic Caucasian0%
20%
40%
60%
80%
100%
Child Population = Light colorsFoster Care Population = Dark colors
Morgan County: Child Population vs. Foster Care Population by Race/Ethnic-
itySource: Population data CFRC 2009, Care data DCFS QA 2010

Morgan and Scott Counties
Disproportionality Over Time
2005 2006 2007 2008 20090%
20%
40%
60%
80%
100%
African American Hispanic
Caucasian
Morgan County: Percentages of Children in Care by Race/Ethnicity
Source: CFRC 2009

Morgan and Scott Counties
Are There Differences in Permanency Goals by Race in Morgan County?*
YESAfrican American
White .
Reunification 9 56% 23 72%
Adoption 4 25% 8 25%
Guardianship 0 0% 1 3%
Independence 3 19% 0 0%
16 100% 32 100%
*This table excludes children for whom permanency goals were missing or coded as “other”.
Source: DCFS QA FY 2010

Morgan and Scott Counties
Is There Disparity in Permanency Achievement in Morgan County in FY10? YES, but in a way that benefited African American children.
However, the numbers of children exiting care in Morgan County were so small that we cannot draw meaningful conclusions from these data.
In FY10, 3 African American children and 4 White children achieved permanency (18% and 12% respectively).
Thus African American children were more likely to exit care in FY10,
White youth were somewhat more likely than African American youth to exit via reunification (75% vs 67%)
Source: DCFS QA FY 2010

Morgan and Scott Counties
Is There Disparity in Permanency Achievement Over Time?
2004 2005 2006 2007 20080%
20%
40%
60%
80%
100%
Morgan County:12 Month Permanency by Race/Ethnicity
Source: CFRC 2009
African American
Caucasian
Year Child Entered Care

Morgan and Scott Counties
Is There Disparity in Permanency Achievement Over Time?
2003 2004 2005 2006 20070%
20%
40%
60%
80%
100%
Morgan County:24 Month Permanency by Race/Ethnicity
Source: CFRC 2009
African American
Caucasian
Year Child Entered Care

Morgan and Scott Counties
What is the “Bottom Line” on Disproportionality?
Are African American children more likely to be reported as neglected / abused than White children in County?
YES
Although African American children are just 8% of the population, they comprise 17% of the reported cases.
White children comprise 88% of the child population but 79% of those reported.
Hispanic children represent 4% of the population but just 1% of those reported.
Source: CFRC 09 (for population data) QA FY10 (for report data)

Morgan and Scott Counties
What is the “Bottom Line” on Disproportionality?
Once reported, are African American children more likely to be indicated than White children?
NO
In FY10 of all reports for African American children in Morgan County, 19% were indicated.
Of all reports for White children, 25% were indicated.
Source: DCFS QA FY 2010

Morgan and Scott Counties
Once indicated, do African American and White children enter care at similar rates?
NO. African American children do better.
In FY10, African American children were less likely to enter care in Morgan County.6% of African American children of those indicated entered care17% of White children of those indicated entered care
Source: DCFS QA FY 2010
What is the “Bottom Line” on Disparity?

Morgan and Scott Counties
DisparityAre African American children less likely to have reunification
as a goal than White children?
YES
In FY10, 56% of African American children had a goal of reunification compared to 72% of White children.
Are African American children less likely to exit care than White children?
NO, African American children were more likely to leave care in FY10.
In FY10 18% of African American children in care achieved permanency compared to 12% of White children.
Again, numbers are too small to draw meaningful conclusions
Source: DCFS QA FY 2010

Morgan and Scott Counties
DisparityDid African American children achieve permanency
differently from White children in FY10?
YES
In FY10, African American children were less likely than White children to achieve permanency through reunification (67% & 75%).
Again, the numbers are so small (2 African American children and 3 White children were reunified) we cannot draw meaningful conclusions.
Source: DCFS QA FY 2010

Morgan and Scott Counties
Disproportionality and Disparity: The SummaryAfrican American children are more likely to
be reported than White children.When reported however, African American
children are less likely to be indicated than White children.
When indicated, African American children are less likely to enter care than white children.
Rates of 12 and 24 month permanency

Morgan and Scott Counties
On-going Questions for our Area