
HOW DO HOSPITALS RESPOND TO MARKET ENTRY? EVIDENCE … · HOW DO HOSPITALS RESPOND TO MARKET ENTRY?...
47
NBER WORKING PAPER SERIES HOW DO HOSPITALS RESPOND TO MARKET ENTRY? EVIDENCE FROM A DEREGULATED MARKET FOR CARDIAC REVASCULARIZATION Suhui Li Avi Dor Working Paper 18926 http://www.nber.org/papers/w18926 NATIONAL BUREAU OF ECONOMIC RESEARCH 1050 Massachusetts Avenue Cambridge, MA 02138 March 2013 We thank Shin-Yi Chou, Mary E. Deily, James A. Dearden, Yang Wang, and seminar participants at the Lehigh Economics Department, George Washington University, and the Federal Trade Commission Bureau of Economics for helpful comments. Much of the data used in this analysis was from the Pennsylvania Health Care Cost Containment Council (PHC4). The PHC4 is an independent state agency responsible for addressing the problem of escalating health costs, ensuring the quality of health care, and increasing access to health care for all citizens regardless of ability to pay. PHC4 has provided data to this entity in an effort to further PHC4’s mission of educating the public and containing health care costs in Pennsylvania. PHC4, its agents, and staff, have made no representation, guarantee, or warranty, express or implied, that the data - financial, patient, payer, and physician specific information - provided to this entity, are error-free, or that the use of the data will avoid differences of opinion or interpretation. This analysis was not prepared by PHC4. This analysis was done by Suhui Li and Avi Dor. PHC4, and its agents and staff bear no responsibility or liability for the results of the analysis, which are solely the opinion of the authors. Avi Dor acknowledges funding support from NIH. The views expressed herein are those of the authors and do not necessarily reflect the views of the National Bureau of Economic Research. NBER working papers are circulated for discussion and comment purposes. They have not been peer- reviewed or been subject to the review by the NBER Board of Directors that accompanies official NBER publications. © 2013 by Suhui Li and Avi Dor. All rights reserved. Short sections of text, not to exceed two paragraphs, may be quoted without explicit permission provided that full credit, including © notice, is given to the source.
Transcript of HOW DO HOSPITALS RESPOND TO MARKET ENTRY? EVIDENCE … · HOW DO HOSPITALS RESPOND TO MARKET ENTRY?...

NBER WORKING PAPER SERIES
HOW DO HOSPITALS RESPOND TO MARKET ENTRY? EVIDENCE FROM ADEREGULATED MARKET FOR CARDIAC REVASCULARIZATION
Suhui LiAvi Dor
Working Paper 18926http://www.nber.org/papers/w18926
NATIONAL BUREAU OF ECONOMIC RESEARCH1050 Massachusetts Avenue
Cambridge, MA 02138March 2013
We thank Shin-Yi Chou, Mary E. Deily, James A. Dearden, Yang Wang, and seminar participants at theLehigh Economics Department, George Washington University, and the Federal Trade Commission Bureauof Economics for helpful comments. Much of the data used in this analysis was from the PennsylvaniaHealth Care Cost Containment Council (PHC4). The PHC4 is an independent state agency responsiblefor addressing the problem of escalating health costs, ensuring the quality of health care, and increasingaccess to health care for all citizens regardless of ability to pay. PHC4 has provided data to this entity in aneffort to further PHC4’s mission of educating the public and containing health care costs in Pennsylvania.PHC4, its agents, and staff, have made no representation, guarantee, or warranty, express or implied,that the data - financial, patient, payer, and physician specific information - provided to this entity,are error-free, or that the use of the data will avoid differences of opinion or interpretation. This analysiswas not prepared by PHC4. This analysis was done by Suhui Li and Avi Dor. PHC4, and its agentsand staff bear no responsibility or liability for the results of the analysis, which are solely the opinionof the authors. Avi Dor acknowledges funding support from NIH. The views expressed herein arethose of the authors and do not necessarily reflect the views of the National Bureau of Economic Research.
NBER working papers are circulated for discussion and comment purposes. They have not been peer-reviewed or been subject to the review by the NBER Board of Directors that accompanies officialNBER publications.
© 2013 by Suhui Li and Avi Dor. All rights reserved. Short sections of text, not to exceed two paragraphs,may be quoted without explicit permission provided that full credit, including © notice, is given tothe source.
How Do Hospitals Respond to Market Entry? Evidence from A Deregulated Market for CardiacRevascularizationSuhui Li and Avi DorNBER Working Paper No. 18926March 2013JEL No. I1,L4,L5
ABSTRACT
Regulatory entry barriers to hospital service markets, namely Certificate of Need (CON) regulations,are enforced in many states; although no longer federally mandated, policy makers in other states areconsidering reinstating CON policies in tandem with service expansions mandated under the AffordableCare Act. While numerous studies have examined the impacts of CON on hospital volumes, demandresponses to actual hospital entry into local hospital markets are not well understood. In this paper,we empirically examine the demand-augmenting, demand-redistribution, and risk-allocation effectsof hospital entry by studying the cardiac revascularization markets in Pennsylvania, a state in whichdynamic market entry occurred after repeal of CON in 1996. Our findings with respect to demand-augmentationare mixed: we find robust evidence that high entrant market share mitigated the declining incidenceof coronary artery bypass graft (CABG), but it had no significant effect on the rising trend in percutaneouscoronary intervention (PCI) procedures, among patients with coronary artery disease. Consequently,incumbent hospitals experienced a decrease in the likelihood of PCI due to entry, thereby indicatinga shift in demand away from incumbents to entrants, namely business-stealing. Results of our analysesfurther indicate that entry by new cardiac surgery centers tended to sort high-severity patients intothe more invasive CABG procedure and low-severity patients into the less invasive PCI procedures.Thus, from a welfare perspective our results are mixed: on the one hand, free-entry may lead to improvedaccess rather than business stealing for CABG procedures; on the other hand, the empirical evidenceis in favor of business-stealing for PCI procedures. Moreover, free-entry improves the match betweenunderlying medical risk and treatment intensity. These findings underscore the importance of consideringmarket-level strategic responses by hospitals when regulatory barriers to entry are rescinded.
Suhui LiAssistant ProfessorDepartment of Health PolicyGeorge Washington University2021 K Street, Suite 800Washington, DC [email protected]
Avi DorProfessorGeorge Washington University2021 K street NW, Suite 800Washington, DC 20037and [email protected]
2
I. Introduction
Regulatory entry barriers, while considered detrimental to market efficiency in most industries,
are widely used in health care. In particular, many states enforce Certificate of Need (CON)
regulation, whereby hospitals are required to obtain approval from a designated state agency
before installing additional capacity or prior to offering certain high cost services. Although a
Federal law which required all states to maintain CON regulation for cardiac care expired in 1986,
states were slow to deregulate the market. As recently as 2011, cardiac CON continued to be in
place in 26 states (AHPA, 2011). Moreover, new forms of quality monitoring recently introduced
under the Affordable Care Act (ACA) have rekindled interest in state-based regulation, with
several states currently reinstituting CON programs (Sharamitaro and Drew, 2011)1.
Proponents of CON argue that regulation is needed to curtail overuse of technology-
intensive services, a phenomenon previously referred to as the medical “arms race” (Luft, 1986).
Furthermore, proponents theorized that entry barriers promote higher quality and help to rein in
costs by maintaining higher-volume clinical programs with established expertise. Opponents
make the more traditional argument that entry barriers protect inefficient producers by shielding
them from competition. In a joint report the Federal Trade Commission and the Department of
Justice (2008) noted that “existing competitors have exploited the CON process to thwart or delay
new competition to protect their own supra-competitive revenues.”2
Previous research attempted to shed light on the policy debate by evaluating impacts in
states that kept or dropped CON regulation. Focusing on health outcomes associated with major
cardiac procedures, notably mortality, Ho et al. (2009) and Popescu, Vaughan-Sarrazin, and
Rosenthal (2006), find small or no difference between the groups of states. Another study by Ho
1 Quality monitoring aspects of the ACA include reduced federal payments to hospitals for excess mortality for a number of medical conditions, notably heart attacks, and a requirement that hospitals meet community needs assessment criteria to maintain their tax-exempt status. 2 “Competition in Health Care and Certificates of Need – Joint Statement of the Antitrust Division of the U.S. Department of Justice and the Federal Trade Commission Before the Illinois Task Force on Health Planning Reform.” http://www.justice.gov/atr/public/comments/237351.htm#N_1_
3
(2006) uses simulation methods to identify difference in treatment costs between CON and non-
CON states, finding that CON was associated with relatively small reductions in costs. Turning to
volume effects, Popescu et al. find significantly lower use rates in states with CON, while Ho
(2006) found no significant difference in the statewide procedure volume between states with and
without CON. Using a difference in difference approach, Ho et al. (2009) found that the number
of hospitals performing cardiac revascularization rose in states that repealed CON, coupled by
offsetting decreases in average hospital volume in these states.
While studies focusing on the impact of discrete policy events are important, they do not
necessarily capture heterogeneity within states that are targeted by the intervention. In this study
we focus on understanding volume effects more deeply, taking within-state heterogeneity into
account. In particular, we seek to empirically explain responses to actual hospital entry into local
cardiac markets as they occurred in the aftermath of CON repeal, differentiating between
incumbent hospitals and all other market participants combined. To implement this approach, we
focus on Pennsylvania, a state in which dynamic market entry occurred after repeal of CON in
1996, allowing us to observe the distribution of low and high entry rates both longitudinally and
across small market areas. For similar reasons Pennsylvania was also used as the case study by
Cutler et al. (2010) in their empirical study of CON regulation affecting cardiac surgeons.3
Additionally, we adopt an interrupted time series design to account for discontinuity in trends
before and after repeal of CON (Finkelstein, 2007). Following much of the literature cited in this
paper we focus on two major cardiac procedures, jointly referred to as cardiac “revascularization”,
namely coronary artery bypass graft (CABG) 4 and percutaneous coronary intervention (PCI)5,
3 Cutler et al. point out that facing with a highly inelastic supply of cardiac surgeons, entrant hospitals are more likely to contract with higher-quality cardiac surgeons, which in turn leads to a welfare-enhancing redistribution of patients from lower-quality to higher-quality surgeons. Empirically, they show that top-performing cardiac surgeons received increased CABG volume following the entry of new CABG hospitals. 4 CABG is a surgical procedure which involves surgically isolating a section of a vein or artery and grafting it to create a bypass of blockage in the coronary artery. It was developed in the late 1960s and entered mainstream use in the United States during the 1970s, largely performed on patients whose indications represent a significant risk of heart attack.

4
which are relatively common and well identifiable in administered databases. Specifically, we
explore how entrants’ market shares affect the likelihood of undergoing the more intensive
CABG and the relatively less intensive PCI for patients with coronary artery disease (CAD), as
well as the likelihood of encountering these treatments at incumbent hospitals before and after
deregulation.
By focusing on shifts in patient volume, we are able to further hone in on strategic
responses related to the distribution of patients by levels of risk and illness severity. While
previous research has explored this issue of risk allocation in the context of hospital competition
in general (Capps, Dranove, Satterthwaite, 2003; Kessler and Geppert, 2005)6, the allocation of
low risk versus high risk patients has not been previously studied in relation to either CON
regulation or market entry specifically. This latter analysis, which we implement, carries certain
welfare implications as well: from the patient’s perspective, does resorting after market entry lead
to appropriate intensity of care? From the hospital perspective, do entrants exhibit “business
stealing” behavior (e.g., Mankiw and Whinston, 1986; Bresnahan and Reiss, 1990, 1991), such
that incumbents are left with a greater proportion of high-risk patients in the post-deregulation
period?
Thus, our analysis complements and extends previous studies by exploring the interaction
of CON deregulation and the degree of market entry. Moreover, unlike previous studies of CON,
we focus on changes in patient volume at the level of local markets, rather than hospital averages.
Furthermore, we analyze the reallocation of patients based on severity, among incumbents and
5 The PCI procedure involves only a small incision through which a balloon-tipped catheter is threaded and inflated within the coronary artery to improve the blood supply. PCI is less invasive compared to CABG, and more often performed on patients with relatively mild CAD. PCI was formerly labeled PTCA, and more commonly referred to as angioplasty. 6 Capps et al. note that low risk and high risk patients differ in their valuations of health care, leading them to differ in their willingness to switch to competitors; Kessler and Geppert show that clinically appropriate sorting of low risk and high risk patients into low intensity and high intensity hospital treatments is enhanced when markets are locally competitive.
5
other hospitals, and between high-intensity (CABG) and low intensity procedures (PCI), thereby
shedding light on an issue not previously considered.
The rest of the paper proceeds as follows. Section II lays out the main hypotheses to be
tested, and provides a related review of the literature. Section III discusses the market for cardiac
care in Pennsylvania, and provides background behind CON laws in that state. Section IV
describes the data and presents summary statistics. Section V describes the empirical models for
identifying the effects of entry on patient allocation, while controlling for prior trends. Section VI
presents the empirical results, showing that they are robust to alternative specifications. Section
VII concludes.
II. Main Issues and Related Literature
In the previous section we noted prior literature on the effects of CON which relied on
between-state comparisons to identify changes in volume and aggregate demand. A separate
strain of the literature has focused on strategic responses to market entry by new health care
providers, independently of CON. Yet few studies have explored market reactions to free entry
specifically in the aftermath of CON deregulation. In this study, we aim to fill the gap, thereby
combining and extending both research themes. Below we survey the literature on entry in
relation to the main hypotheses to be tested in our empirical analysis. We label these hypotheses
as the demand augmenting effect, the demand redistribution effect, and define two variants of
patients risk allocation effects, first by type of hospital, and second by treatment intensity:
1. Demand-augmenting Effect – Previous studies have shown that market entry by
hospitals and other health care centers can lead to higher volume. For instance, using the
structure-conduct-performance (SCP) framework developed by Bresnahan and Reiss7, Abraham
7 Bresnahan and Reiss (1990, 1991) model firms’ entry decision as the equilibrium outcome of a discrete game played between potential entrants. The general entry condition suggests that as intensified competition shrinks profit margin, entrants need a larger population to generate enough revenue to cover fixed entry costs. Thus examining the relationship between the number of firms and the market size allows the authors to determine whether additional firms generate additional revenue or just steal business from incumbent rival firms.

6
et al. (2007) presented evidence that hospital entry substantially expands market demand and
tightens competition. Similarly, Mitchell (2007) found substantial increases in utilization rates
following the entry of specialty hospitals, even after controlling for area specific effects. While it
is difficult to empirically distinguish between volume increases that occur due to entrants’
response to unmet needs (pent up demand) and volume increases representing creation of new
demand by entrants (inducement), anecdotal evidence suggests that inducement may have been
the culprit. For instance, Burns et al. (2009) found that the rapid growth in Arizona’s cardiac
surgery volume, which was accompanied by entry, exceeded population growth and aging trends.
In this paper we do not attempt to enter the debate over inducement. Rather, we are initially
interested in describing trends in the aggregate demand for CABG and PCI, and their association
with market entry, in order to establish the potential for strategic behavior as described below8.
Note that while the above studies provide evidence on the aggregate demand response to entry,
they do not explain how entry affects treatment choices and patients’ redistribution.
2. Demand-redistribution Effect (business stealing) — Entry that shifts demand from
incumbent firms to entrants is generally referred to as “business-stealing” (Mankiw and Whinston,
1986; Bresnahan and Reiss, 1990, 1991). In our context, entrants (namely new cardiac surgery
centers) may attract patients from incumbent hospitals rather than augment existing demand.
Prior studies examining volume shifts in response to hospital entry are sparse. However,
Huckman (2006) examines shifts in the volume of cardiac care from acquired hospitals to
acquiring hospitals, using small area market shares and concludes that acquirers benefited from
business stealing. Dafny (2005) has shown that incumbent hospitals strategically increase their
own volume in order to deter potential entry into high-end cardiac treatments, suggesting that the
8 Mankiw and Whinston (1986) note that when entry causes a sufficient rise in the aggregate demand so that incumbent firms’ demand is not affected (no business-stealing effect), free entry will create net social benefits through newly created demand. In health care markets, however, asymmetric information between providers and patients, may induce demand beyond optimal treatment levels, so that the additional demand may not be welfare enhancing.

7
perceived threat of business stealing is pervasive in these markets9. Given that incumbent market
share is necessarily reduced when new firms enter the market10, in this study we are able to infer
business stealing effects from changes in the likelihood of receiving cardiac treatment at
incumbent hospitals associated with entry into an incumbent’s local market area. We base our
analysis on patient level regressions, which allows for detailed risk adjustment using the patient’s
clinical characteristics while incorporating market-level variables, notably the share of entrants in
treatment volume within the local market area. Predicted entrant market share is constructed
using a method used by Kessler and McClellan (2000) (see Appendix).
3. Risk-allocation Effect (Patient sorting) – refers to the allocation of high risk patients and
low risk patients into incumbent hospitals versus entrant hospitals. To the extent business stealing
is found, its effects may be more harmful from the perspective of incumbents if for a given
medical condition, relatively healthy patients (“low-risk”) are drawn away by entrant hospitals
while sicker patients (“high-risk”) remain with incumbents. Rephrasing, we ask whether entrants
exhibit business stealing behavior such that incumbents are left with a greater proportion of high-
risk patients following deregulation11.
Previous studies found evidence that specialty cardiac hospitals tend to serve relatively
healthier patients than general hospitals (Barro et al., 2006; Cram et al., 2005) and tend to enter
markets in which cardiac patients are healthier to begin with (Barro et al., 2006). However, given
their interest in specialty hospital reimbursement issues, these studies took a narrow view of
9 Ellison and Ellison (2011) find similar results in the case of the pharmaceutical industry, where investment in research and development in established product lines acts as a deterrent for potential entry by new drug developers. 10 As an illustrative example, let ∆ ∆ ∆ , where ∆ , ∆ , and ∆ denote the change in total demand, change in incumbent demand, and change in entrant demand, respectively. Assume that the baseline market volume was 100, and that following entry, ∆ 10, ∆ 0, and ∆ 10. In this case, even though the incumbent share declines from 1 to 0.91(=100/110), there is no business stealing, because the entrant obtains its market share through creating new demand. 11 Note that under the Medicare Prospective Payment System (PPS) hospitals receive a fixed payment for a given diagnosis with minimal compensation for outlier costs; for the most part, private insurers also use PPS or similar fixed-price reimbursement methods that do not provide for full risk adjustment (Capps and Dranove, 2004). Thus, high risk patients are also less profitable for the hospital.
8
market entry and did not consider broader entry due to openings of new cardiac centers within
established general hospitals. In addition, these studies did not model the interaction between
entrant share and patient “riskiness”, which would allow one to explore the degree to which
business stealing by entrants correlates with risk. In this paper, we seek to address both of these
issues by focusing on Pennsylvania, where all cardiac surgery centers were affiliated with general
hospitals during our sample period, and by incorporating the interaction patient risk and entrant
share in patient-level analyses of the likelihood of receiving cardiac surgeries at incumbent
hospitals. The manner in which we interact the low-risk and high-risk patient designations with
entry share categories is analogous to Kessler and Geppert (2005) who examined the effects of
hospital competition and patient risk on hospital expenditures for Medicare patients with heart
attacks. Their results showed that competition led to increased variation in risk-based inpatient
expenditures, suggesting that contrary to standard oligopoly theory, competition leads to greater
product differentiation in the special case of hospital care12.
More generally, we are interested in knowing the extent to which observed changes in
demand are actually related to the repeal of CON, rather than a reflection in long-term trends that
may be unrelated to policy changes. Nationally, the rate for CABG (the high intensity procedure)
steadily declined during the past decade while the rate for PCI (the low intensity procedure) has
remained stable (Epstein et al., 2011). Previous studies noted the introduction and diffusion of
stent coronary angioplasty (one type of PCI) in the mid-1990s contributed to the declining rate of
CABG by shifting many patients from CABG to PCI (Cutler and Huckman 2003; Epstein et al.
2011). However, recent clinical trials indicate that CABG remains the treatment of choice for
12 Although Kessler and Geppert do not discuss this, Hotelling’s (1929) duopoly model of spatial location serves as the basis for this hypothesis. The standard Hotelling model predicts that competition leads the two firms to move towards the center in a linear market, a result that is referred to as the “principle of minimum differentiation”. Accordingly, market entry would not change the level of specialty or risk differentiation by hospitals. However, applying the Hotelling model to the unique circumstances of the hospital industry, Calem and Rizzo (1995) and Brekke et al. (2006) show that when prices are regulated, there is an incentive for hospitals to move further apart on the service mix space in order to dampen the quality competition.

9
patients with severe coronary arterial disease as it achieves better health outcomes than PCI
(Serruys et al., 2009). Given the longitudinal nature of our data from Pennsylvania, one concern
is that our estimates of demand augmentation may reflect a general time trend in cardiac
treatment rates that began prior to the repeal of CON, which may confound our estimates of the
trend due to CON and related effects of post-deregulation entry. To address this concern, we
adopt a differences-in-trend design akin to that found in Finkelstein’s (2007) study on the effects
of Medicare’s introduction.
III. Pennsylvania’s Cardiac Care Market and CON Regulation
With the repeal of CON laws in several states following a change in Federal law dating
back to 1986, hospitals have faced opposing incentives for entering newly opened markets for
cardiac services. On the one hand, cardiovascular disease is a highly prevalent condition in the
population and a potentially large source of revenues, currently accounting for about a third of
inpatient revenues nationally. On the other hand, entry costs into this market may be prohibitively
high, with an initial investment in a new revascularization centers reportedly ranging from $12 to
$14 million (Robinson et al. 2001; Huckman 2006). Therefore, high entry costs may dampen the
effects of deregulation in this market. Although a number of studies examined aggregate changes
in volume due to the repeal of CON regulations13, the issue of strategic responses by hospitals to
entry that ensued deregulation has not been fully explored. Pennsylvania, a state in which
dynamic entry occurred following its repeal of CON, provides a useful test case (Longwell, 2011).
Pennsylvania repealed its comprehensive state CON program in December 1996, thereby
allowing hospitals to provide new services, including cardiac surgeries, without having to obtain
permission from the state’s regulators. Recently however, public interest in the state’s CON
13 For instance, Ho et al. (2009) found that while the number of hospitals performing cardiac revascularization rose in states that repealed CON between 1989 and 2002, overall volume in these states remained essentially unchanged due to offsetting decreases in average hospital volume.

10
program has been rekindled, and legislative attempts to reinstate the program are currently
underway.14
Figure 1 illustrates the striking increase in the number of cardiac surgery centers after the
1996 repeal of CON relative to the pre-policy trend. Five centers, all of whom were located in
general hospitals, entered the market immediately after the repeal, consequently increasing the
total number of providers from 43 to 48. By 2004, there were a total of 28 post-CON new entrants,
accounting for 41% of all hospitals providing cardiac revascularization in Pennsylvania.15 The
majority of entry occurred in urban or suburban areas. All cardiac surgery centers in Pennsylvania
were affiliated with general acute hospitals rather than cardiac specialty hospitals.
Figure 2 shows the type of procedures provided by new entrants since the 1996 repeal of
CON. A hospital is considered to be a participant in the market for CABG in a particular year if it
performed at least 5 CABGs in that year (Magid et al, 2007, Nallamothu et al, 2007).16 The same
threshold is used to identify PCI hospitals. Although PCIs are less invasive than CABGs, and are
performed in catheterization laboratories instead of operating rooms, hospitals performing PCIs
are required to have on-site surgical backup in case an emergency CABG is needed following a
failed PCI. For this reason, all participating hospitals in Pennsylvania had provided both types of
procedures before the 2000s. However, as PCI became nationally more diffused in the mid-1990s,
some of the new entrants began specializing in PCI only. As shown in Figure 2, only one of the
six new entrants during 2003 and 2004 was providing both procedures; the other five were
providing only PCI procedures. This trend suggests that the cardiac revascularization markets in
Pennsylvania may be evolving toward a greater degree of treatment specialization following the
14 See http://www.legis.state.pa.us/cfdocs/Legis/CSM/showMemoPublic.cfm?chamber=S&SPick=20130&cosponId=10038, and http://wesa.fm/2012/05/08/proposed-legislation-calls-certificate-need. Both accessed on January 14, 2013. 15 During the sample period, St. Francis Medical Center and Medical College of Pennsylvania closed on 2001 and 2004. UPMC Shadyside merged with UPMC Presbyterian in 2003. As a result, the total number of cardiac surgery centers was 68 by 2004. 16 In our main analysis, entrants are defined as hospitals that started performing CABG or PCI procedures as of 1997, (more than 5 CABG or PCI cases in a given year) with no cases in previous years.

11
entry of new programs.
IV. Data and Sample
This study uses longitudinal inpatient records of all CAD patients who reside in
Pennsylvania from 1995 through 2004 to investigate the effects of free entry in cardiac
revascularization markets. The data is collected by the Pennsylvania Health Care Cost
Containment Council (PHC4), and provides a wide range of patient clinical and utilization
information including diagnosis/procedure codes, admission type and source, discharge status,
and charges. It also includes patient demographic information such as age, gender, race, insurance
type, and zip code of residence. A unique patient identifier allows us to track each individual’s in-
hospital records over time.
The PHC4 also records patient’s illness severity using the MediQual score, which is
calculated based on patient characteristics and key clinical variables abstracted from admission
medical records including vital signs, other physical findings, historical factors, and radiographic
and laboratory findings (Lezzoni and Moskowtiz, 1988). This severity measure ranges from 0 to 4,
with 4 being the most severe. The MediQual score captures not only acute symptoms, but also
long-term conditions that may affect the patient’s baseline health status.
The second source of data for this study is the American Hospital Association (AHA)
Annual Survey of Hospitals. Each admission record in the PHC4 data is associated with a unique
facility identifier, which enables us to link it to comprehensive facility characteristics in the AHA
data, including location (longitude and latitude), bed capacity, teaching status, ownership, and
system member status.
Our study sample includes Pennsylvania residents who were admitted to any hospital in
the state with a new diagnosis of CAD17 between 1995 and 2004. During the sample period, a
total of 1,112,777 patients were hospitalized due to CAD. Excluding those who were hospitalized
17 Diagnosis codes for CAD: ICD-9-CM 410x-414x.

12
for the same diagnosis in the previous year, and repeated admission records within the same
quarter, the final sample contains 714,088 CAD patients.
The analysis centers on two outcomes: an individual’s incidence of CABG or PCI18
procedure within a three month period (a quarter) after admission for CAD; and the incidence of
CABG or PCI procedure at any incumbent hospital within one quarter after admission for CAD.
The first outcome is used to assess the response of per-patient demand for procedure to the entry
of new cardiac surgery centers. The second outcome is used to identify how patient flow is
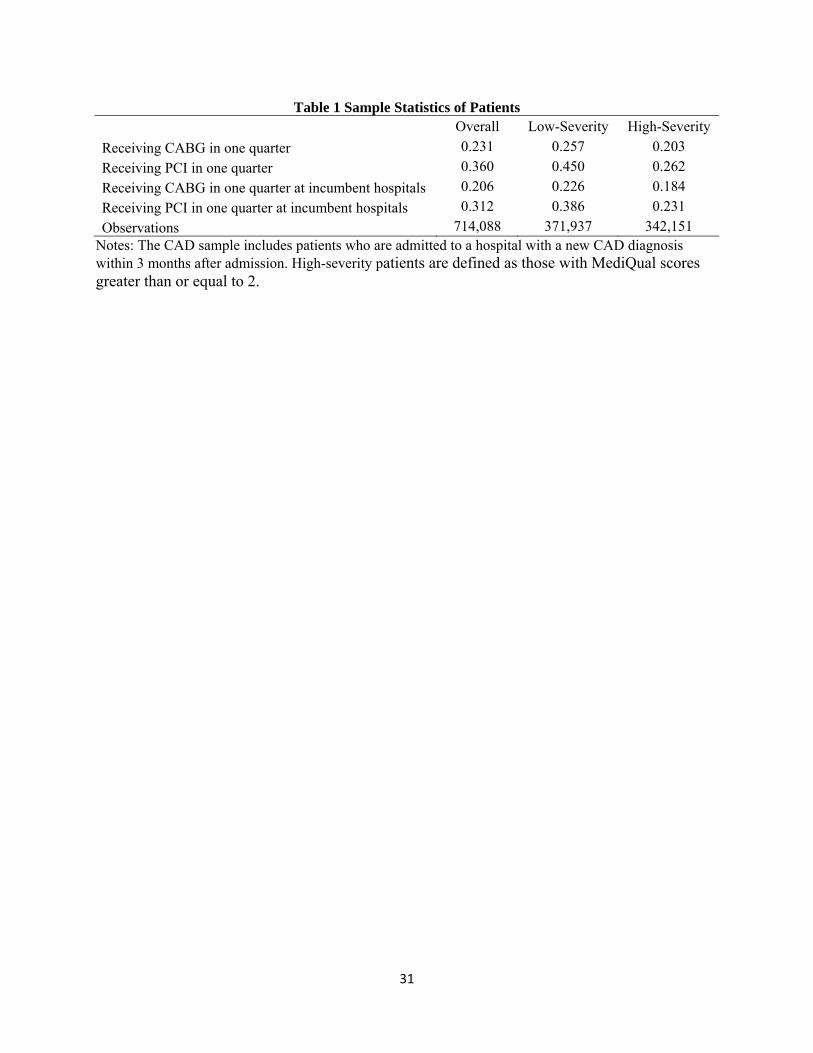
redistributed from existing centers to new centers following entry. Table 1 presents the summary
statistics of procedure incidences and surgical outcomes by patient severity. Patients with
MediQual scores greater than or equal to 2 are identified as high-severity. More than half of
hospitalized CAD patients in the study period received either a CABG or PCI procedure within 3
months after admission. Without adjusting for age, gender, and other individual factors, the low-
severity patients were more likely to undergo CABG and PCI procedures than the high-severity
patients.
Figure 3 contrasts the trends of 3-month CABG and PCI rates between1995 and 2004,
which are further divided into trends in markets where entry occurred versus markets where entry
never occurred. These rates are expressed as the number of procedures per 1,000 new CAD
patients in the study sample, and markets are defined as Hospital Service Area (HSA)19. As
shown in Figure 3, markets that experienced entry had higher rates of CABG and PCI than
markets that did not experience entry both before and after the 1996 CON repeal. Nevertheless,
the average CABG rate gradually declined since 1997, despite the continuing entry of new
surgery centers in these markets. In contrast, PCI diffused rapidly in both entry and no-entry
18 Procedure codes for CABG: ICD-9-CM 3610-3619. Procedure codes for PCI: ICD-9-CM 3601, 3602, 3605, 3606, 3607, and 3609. 19 HSAs are groups of zip codes whose residents receive most of their hospitalizations from the hospitals in that area. There are 127 HSAs in Pennsylvania. Our market definition differs from Cutler et al. (2010), which used Hospital Referral Regions (HRRs). The use of HRRs can create measurement error of entrant market share because 7 out of 21 HRRs include areas of neighboring states, where we do not observe patient flows. Therefore, we use smaller geographic markets, the HSAs, to mitigate the boundary problem.
13
markets, mirroring national trends that occurred with the introduction of stent technology during
the mid-1990s (Epstein et al., 2011).
However, taken by itself Figure 3 does not necessarily provide evidence that free entry in
the post-CON period explains the shifts in revascularization rates, since it does not distinguish
between market effects and temporal effects due to technological change. Moreover, Figure 3
does not distinguish between market areas with different concentrations of entrants at different
time points in time. To identify these effects we implement the empirical analysis described
below.
V. Empirical Framework
V.A. General Specification
It is hypothesized that the entry of new cardiac surgery centers may lead to both demand-
augmenting and business-stealing effects in the aftermath of the repeal of CON. To test for the
demand-augmenting effect, we estimate changes in CABG and PCI incidences in local area
where new entrants had a larger market share, relative to areas where they had low market share
following the repeal of CON. Using the sample of first-time CAD patients, we estimate two
alternative specifications of the regression model, (1a) and (1b). The more parsimonious equation
(1a) captures the average effect of entry, similar to the baseline model in Barro et al.’s (2006)
study of cardiac specialty hospitals20. Equation (1b) incorporates area-specific pre-existing trends
to allow for identification of area trends attributable to CON deregulation. Finkelstein (2007) uses
an analogous model in her study of Medicare implementation, referring to it as “differences-in-
trend”.21 We specify both models as follows:
20 While highly related to our study, Barro et al’s analysis of entry into the CABG and PTCA markets focused more narrowly on specialty hospitals; they do not consider entry by general hospitals who open new revascularization centers. According to these authors only five specialty hospitals entered these markets nationally during their study period of 1996-1999. Their results showed that specialty hospitals tended to enter market area with a healthier mix of patients, thereby incurring lower costs. 21 In our special case entrant market share forms the local impact variable to be interacted with trend. In Finkelstein’s case, the time interacted impact variable is the percent of elderly individuals in a region

14
∙ , (1a)
∙ ∙
,(1b)
where the dependent variable equals one if patient from market admitted to hospital at
time received CABG or PCI procedure within a period one quarter after admission to a hospital
for CAD; are market fixed effects; are year fixed effects, is a vector of
patient characteristics, is a vector that controls for characteristics of the admitting hospital,
and is an error term. Standard errors are clustered by market area to account for any within-
area correlation.
In both models, is the policy parameter of interest. In equation (1a), the corresponding
variable of interest is defined as ∙ , the interaction between the market share of new
cardiac surgery centers in market k at time t and an indicator variable that equals 1 for years after
the repeal of CON (t=1997 … 2004). This interaction measures the extent to which area k is
exposed to entrants’ market power at time t during the post-policy period. Thus the coefficient
identifies the difference in per-patient demand for revascularization procedures in areas where
entrant market share is relatively high. A positive implies that entry of new surgery centers
expands market demand for CABG or PCI procedure by CAD patients. If is zero, the total
demand for CABG or PCI does not increase following the entry.
While informative about average entry effects, the parsimonious model may reflect a
general time trend in procedure rates that began prior to the repeal of CON in 1996, independent
of the policy itself (by definition, entrant share equals zero for all markets until 1997). To address
without private insurance in 1963, the year in which Medicare was introduced. Thus in our case, the impact variable varies longitudinally as well as across areas.

15
this concern, equation (1b) imposes a area-specific linear trend [ ∙ ]22 and allows for a
shift in trend after the repeal of CON that varies with the entrants market share ∙ .
Here, the coefficient indicates the differential shift from pre-existing trends experienced by
markets with higher entrant share relative to markets with zero entrant share.
Next, we attempt to identify business stealing behavior. Accordingly, new cardiac
surgery centers have an incentive to draw patients away from existing hospitals even if total
demand has expanded. To test for this effect, we simply re-estimate equations (1a) and (1b), by
replacing the previous dependent variable with a binary variable that equals one if the patient
received CABG or PCI procedure at any incumbent hospitals within one quarter of admission for
CAD ( ). Thus we estimate:
∙ , (2a)
∙ ∙
. (2b)
If higher entrant market share leads, on average, to a decrease in patient demand at
incumbent hospitals, then a negative value for coefficient would be expected. On the other hand,
if entrant hospitals create new demand from the potential pool of patients such that the incumbent
hospitals’ demand is not reduced, we would expect to approximately equal zero. A positive
may reflect either a spillover of demand-augmentation from entrant hospitals to all hospitals, or
strategic behavior on the part of incumbent hospitals whereby they increase procedure volume in
order to deter further entry (Dafny, 2005).
All of the models we estimate include patient characteristics and hospital traits.
22 The trend variable 1,… , 10 for 1995,… , 2004.
16
includes indicator variables for age (50-59, 60-69, 70-79, 80 or older; 49 or younger is the
omitted group), race (White, Black, Asian; omitted group is other races), gender, urban residence,
MediQual severity score (1, 2, 3, and 4; omitted group is 0), admission status (emergency
admission and transferred admission), insurance type (Medicare and Medicaid) and major clinical
indications at admission (cardiogenic shock, hypertension, dialysis, heart failure, renal failure,
and acute myocardial infarction). We also include in a continuous variable for the annual
percentage of HMO enrollees in the patient’s county of residence, in order to control for the
potential impact of HMO penetration on procedure use (Town and Vistnes 2001; Miller and Luft
1997).23
The vector includes the indicator variables for the hospital’s bed capacity (200 beds
to 400 beds and >400 beds; omitted group is <200 beds), teaching status , whether it is not-for-
profit, and whether it belongs to a health care system. In addition, the literature on volume-
outcome relationship suggests that hospitals with a higher volume of a particular surgical
procedure tend to achieve better patient outcomes (Birkmeyer et al. 2002; Halm et al. 2002;
Shanhian and Normand 2003)24. To control for volume effects, the vector also includes two
indicators of high-volume CABG hospital and PCI hospital, based on the number of cases
performed at the hospital in the previous year. The cut-off values are 200 cases for CABG and
400 cases for PCI, following the recommendation by the ACC/AHA guidelines (Smith et al.,
2001). Descriptive statistics for patient and hospital characteristics are reported in Table A-1 of
the Appendix.
Finally, we estimate the extent to which the effect of entry on utilization and business
varies with patient risk. In particular, we hypothesized that business stealing would be more
concentrated among low risk patients, both because they are potentially more profitable from the
23 To further test the potential confounding influence of HMOs on procedure use, we repeat the analyses on the Medicare sample only. See Section VI.B. for details. 24 Economists have questioned whether such volume effects should be taken as evidence of “learning-by-doing” or quality. For instance, Gaynor et al. (2005) suggest that economies of scale and selection of low risk patients explain better outcomes at high-volume hospitals.
17
perspective of the hospital, and because low risk-patients are more likely to value entrants as
acceptable substitutes for established providers (Capps et al., 2003). To test this hypothesis, we
estimate another variant of the above equations, allowing for heterogeneous demand responses of
high-severity versus low-severity patients. Specifically, focusing on the full interrupted time
series design from equations (1b) and (2b), we add interactions between a patient’s on-admission
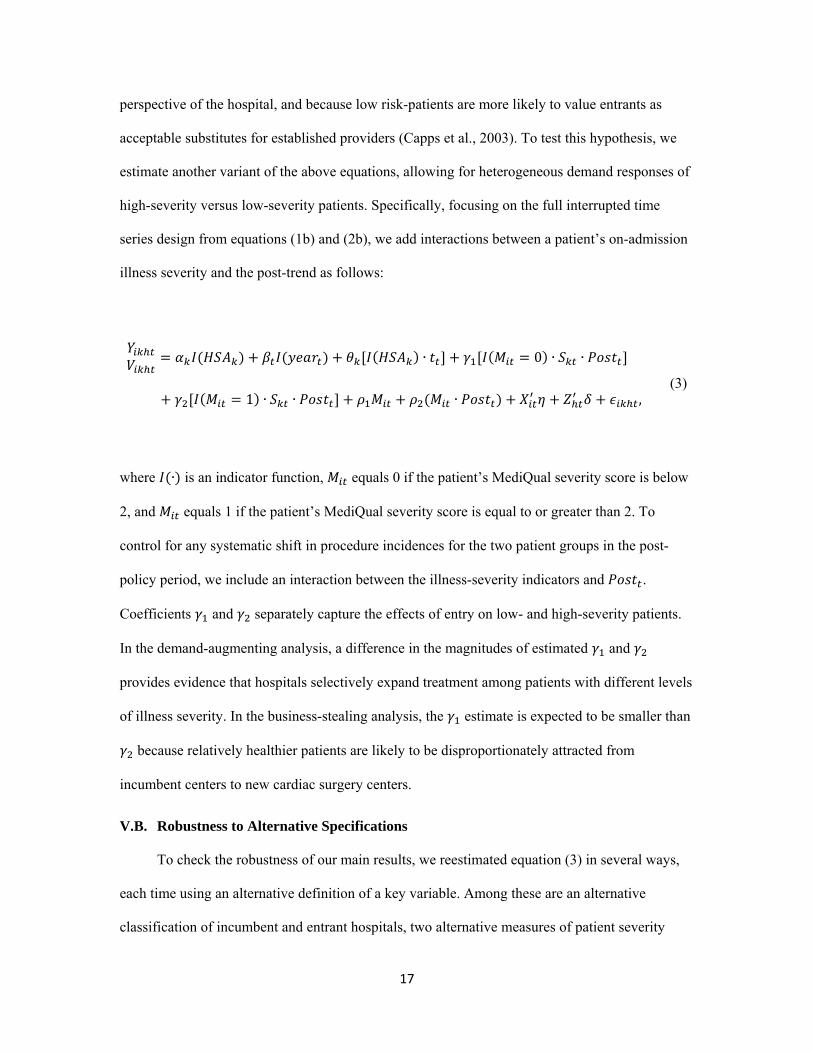
illness severity and the post-trend as follows:
∙ 0 ∙ ∙
1 ∙ ∙ ∙ ,(3)
where ∙ is an indicator function, equals 0 if the patient’s MediQual severity score is below
2, and equals 1 if the patient’s MediQual severity score is equal to or greater than 2. To
control for any systematic shift in procedure incidences for the two patient groups in the post-
policy period, we include an interaction between the illness-severity indicators and .
Coefficients and separately capture the effects of entry on low- and high-severity patients.
In the demand-augmenting analysis, a difference in the magnitudes of estimated and
provides evidence that hospitals selectively expand treatment among patients with different levels
of illness severity. In the business-stealing analysis, the estimate is expected to be smaller than
because relatively healthier patients are likely to be disproportionately attracted from
incumbent centers to new cardiac surgery centers.
V.B. Robustness to Alternative Specifications
To check the robustness of our main results, we reestimated equation (3) in several ways,
each time using an alternative definition of a key variable. Among these are an alternative
classification of incumbent and entrant hospitals, two alternative measures of patient severity

18
groupings other than the severity measure previously described, the addition of a supply-side
variable (surgeons), and finally a reestimation using Medicare patient sample. Further detail is
provided in section VI along with a brief discussion of the results.
V.C. Measuring Entrants’ Market Share
One issue we have not yet addressed in relation to the patient-level equations (1) - (3) is
our definition of market share. Entrant’s market share is the aggregate of patient-level
probabilities of treatment at entry hospitals in the market area. There are two ways to assign
market share to each patient. One is based on where the patient was admitted, and the other is
based on where the patient lives. The former is susceptible to endogeneity bias because the
patient’s choice of hospital may depend on unobservable factors that correlate with the patient
treatment decision. For instance, patients with unobservablely high valuations of cutting-edge
care may prefer to be admitted to teaching hospitals located in urban areas where entrant share is
higher. To address this, we define market share by the patient’s area of residence.
Even so, measuring entrant share with actual treatment volume can lead to bias because
hospitals’ investment in new capacity, e.g. entry, is guided by potential demand and revenue in
the relevant market (Wedig et al. 1989; Chernew et al. 2002; Dafny 2005). Although the use of
area fixed effects may alleviate this concern, the potential for unobserved heterogeneity remains.
To address this, we construct predicted hospital choice equations using the method by Kessler
and McClellan (2000) and Gowrisankaran and Town (2003), whereby exogenous distances to
hospitals in the patient’s geographic area enter as instrumental variables. Further, following
Kessler and McClellan (2000), we estimate hospital choice separately for CABG and PCI, and as
noted above, sum up the probabilities of treatment at entrants by patient location rather than
hospital location to obtain shares. The full estimation method is described in the Appendix.
Table 2 shows how entrant shares in CABG and PCI markets have changed during the free-
entry period. As measured by predicted patient demands, the average CABG entrant share across
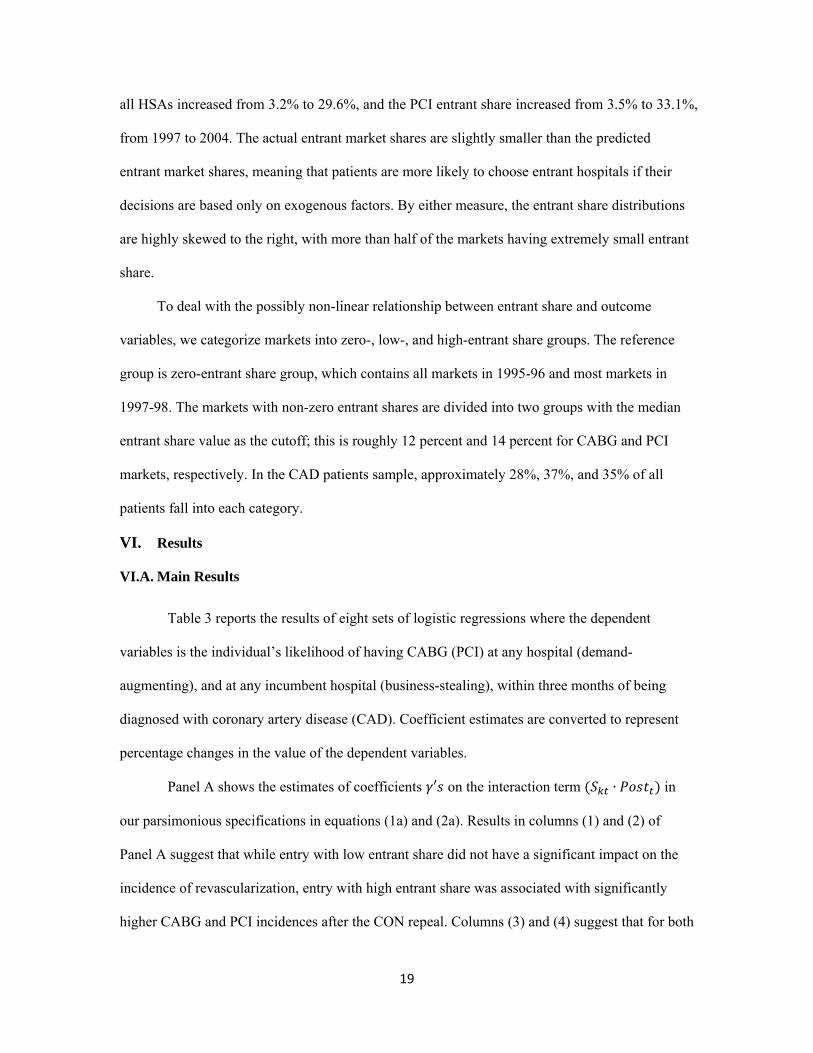
19
all HSAs increased from 3.2% to 29.6%, and the PCI entrant share increased from 3.5% to 33.1%,
from 1997 to 2004. The actual entrant market shares are slightly smaller than the predicted
entrant market shares, meaning that patients are more likely to choose entrant hospitals if their
decisions are based only on exogenous factors. By either measure, the entrant share distributions
are highly skewed to the right, with more than half of the markets having extremely small entrant
share.
To deal with the possibly non-linear relationship between entrant share and outcome
variables, we categorize markets into zero-, low-, and high-entrant share groups. The reference
group is zero-entrant share group, which contains all markets in 1995-96 and most markets in
1997-98. The markets with non-zero entrant shares are divided into two groups with the median
entrant share value as the cutoff; this is roughly 12 percent and 14 percent for CABG and PCI
markets, respectively. In the CAD patients sample, approximately 28%, 37%, and 35% of all
patients fall into each category.
VI. Results
VI.A. Main Results
Table 3 reports the results of eight sets of logistic regressions where the dependent
variables is the individual’s likelihood of having CABG (PCI) at any hospital (demand-
augmenting), and at any incumbent hospital (business-stealing), within three months of being
diagnosed with coronary artery disease (CAD). Coefficient estimates are converted to represent
percentage changes in the value of the dependent variables.
Panel A shows the estimates of coefficients ′ on the interaction term ∙ in
our parsimonious specifications in equations (1a) and (2a). Results in columns (1) and (2) of
Panel A suggest that while entry with low entrant share did not have a significant impact on the
incidence of revascularization, entry with high entrant share was associated with significantly
higher CABG and PCI incidences after the CON repeal. Columns (3) and (4) suggest that for both
20
procedures, there was a concomitant business-stealing effect with the incidence of
revascularization declining significantly at incumbent hospitals in high entrant share areas.
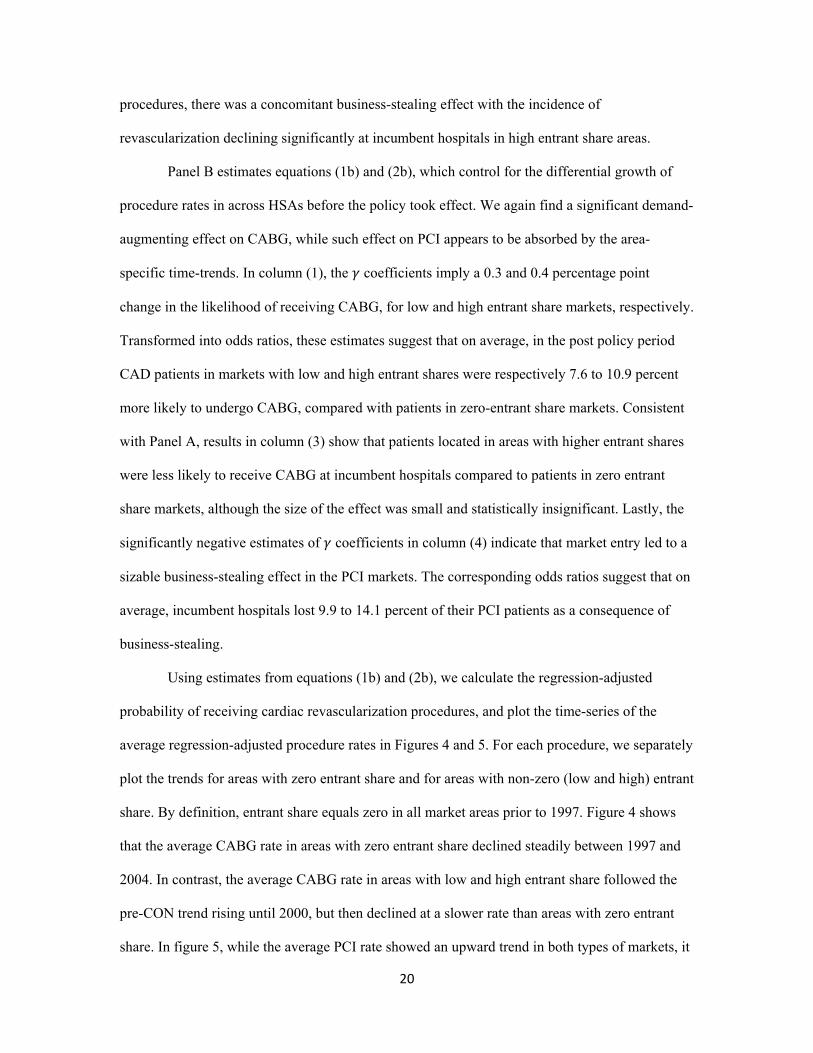
Panel B estimates equations (1b) and (2b), which control for the differential growth of
procedure rates in across HSAs before the policy took effect. We again find a significant demand-
augmenting effect on CABG, while such effect on PCI appears to be absorbed by the area-
specific time-trends. In column (1), the coefficients imply a 0.3 and 0.4 percentage point
change in the likelihood of receiving CABG, for low and high entrant share markets, respectively.
Transformed into odds ratios, these estimates suggest that on average, in the post policy period
CAD patients in markets with low and high entrant shares were respectively 7.6 to 10.9 percent
more likely to undergo CABG, compared with patients in zero-entrant share markets. Consistent
with Panel A, results in column (3) show that patients located in areas with higher entrant shares
were less likely to receive CABG at incumbent hospitals compared to patients in zero entrant
share markets, although the size of the effect was small and statistically insignificant. Lastly, the
significantly negative estimates of coefficients in column (4) indicate that market entry led to a
sizable business-stealing effect in the PCI markets. The corresponding odds ratios suggest that on
average, incumbent hospitals lost 9.9 to 14.1 percent of their PCI patients as a consequence of
business-stealing.
Using estimates from equations (1b) and (2b), we calculate the regression-adjusted
probability of receiving cardiac revascularization procedures, and plot the time-series of the
average regression-adjusted procedure rates in Figures 4 and 5. For each procedure, we separately
plot the trends for areas with zero entrant share and for areas with non-zero (low and high) entrant
share. By definition, entrant share equals zero in all market areas prior to 1997. Figure 4 shows
that the average CABG rate in areas with zero entrant share declined steadily between 1997 and
2004. In contrast, the average CABG rate in areas with low and high entrant share followed the
pre-CON trend rising until 2000, but then declined at a slower rate than areas with zero entrant
share. In figure 5, while the average PCI rate showed an upward trend in both types of markets, it

21
increased slightly more rapidly in areas with low and high entrant share, especially toward the
end of the sample period. These time-series plots provide further evidence of demand-augmenting
effects associated with market entry.
Table 4 reports the estimation results from equation (3), which investigates the extent to
which entry had different impacts on low- and high-severity patients. Overall, high-severity
patients are more likely to receive CABG, and less likely to receive PCI, than low-severity
patients. Comparing the estimated coefficients and in the first two columns, we find that the
expansion of CABG procedures mainly targeted sicker patients, while healthier patients may have
experienced a modestly higher incidence of PCI following entry. Specifically, entry led to a
sizable increase of 1.8 - 3.4 percentage points (Column 1) in the likelihood of CABG procedures
(∆odds ratio = 11.6 – 23.8 percent) among high-severity patients, and an increase of 1.1
percentage points (Column 2) in the likelihood of PCI procedures (∆odds ratio = 6.7 percent)
among low-severity patients, during the post-policy period.
Results in Column (3) show that entrant share had a positive impact on high-severity
patients, and a negative impact on low-severity patients, in their likelihood of receiving CABG at
incumbent hospitals. These estimates suggest that low-severity patients tended to be shifted away
from incumbents to new surgery centers. As shown in column (4), while entry had a negative
effect on incumbents’ volume of low-severity as well as high-severity PCI patients, such effect
was relatively larger among low-severity patients.25 Therefore, we conclude that the estimates in
columns (3) and (4) support the risk-allocation hypothesis, which predicts that new surgery
centers are likely to attract disproportionately more low-severity patients from incumbent
hospitals.
VI.B. Alternative Specifications
25 Interpreted as changes in odds ratio, the estimated coefficients in Column (4) represent a decreased likelihood of undergoing PCI at incumbent hospitals by 11 – 17.3 percent for low-severity patients, and 13.4 – 13.7 percent for high-severity patients in non-zero entrant share markets.
22
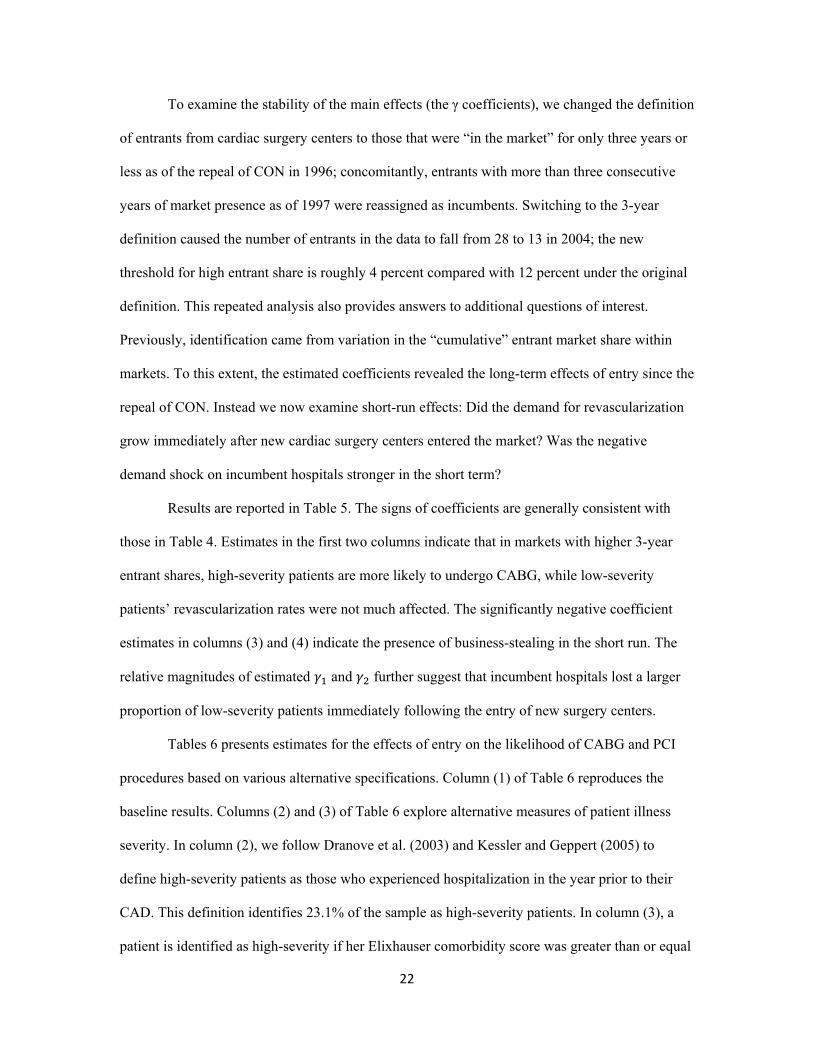
To examine the stability of the main effects (the γ coefficients), we changed the definition
of entrants from cardiac surgery centers to those that were “in the market” for only three years or
less as of the repeal of CON in 1996; concomitantly, entrants with more than three consecutive
years of market presence as of 1997 were reassigned as incumbents. Switching to the 3-year
definition caused the number of entrants in the data to fall from 28 to 13 in 2004; the new
threshold for high entrant share is roughly 4 percent compared with 12 percent under the original
definition. This repeated analysis also provides answers to additional questions of interest.
Previously, identification came from variation in the “cumulative” entrant market share within
markets. To this extent, the estimated coefficients revealed the long-term effects of entry since the
repeal of CON. Instead we now examine short-run effects: Did the demand for revascularization
grow immediately after new cardiac surgery centers entered the market? Was the negative
demand shock on incumbent hospitals stronger in the short term?
Results are reported in Table 5. The signs of coefficients are generally consistent with
those in Table 4. Estimates in the first two columns indicate that in markets with higher 3-year
entrant shares, high-severity patients are more likely to undergo CABG, while low-severity
patients’ revascularization rates were not much affected. The significantly negative coefficient
estimates in columns (3) and (4) indicate the presence of business-stealing in the short run. The
relative magnitudes of estimated and further suggest that incumbent hospitals lost a larger
proportion of low-severity patients immediately following the entry of new surgery centers.
Tables 6 presents estimates for the effects of entry on the likelihood of CABG and PCI
procedures based on various alternative specifications. Column (1) of Table 6 reproduces the
baseline results. Columns (2) and (3) of Table 6 explore alternative measures of patient illness
severity. In column (2), we follow Dranove et al. (2003) and Kessler and Geppert (2005) to
define high-severity patients as those who experienced hospitalization in the year prior to their
CAD. This definition identifies 23.1% of the sample as high-severity patients. In column (3), a
patient is identified as high-severity if her Elixhauser comorbidity score was greater than or equal
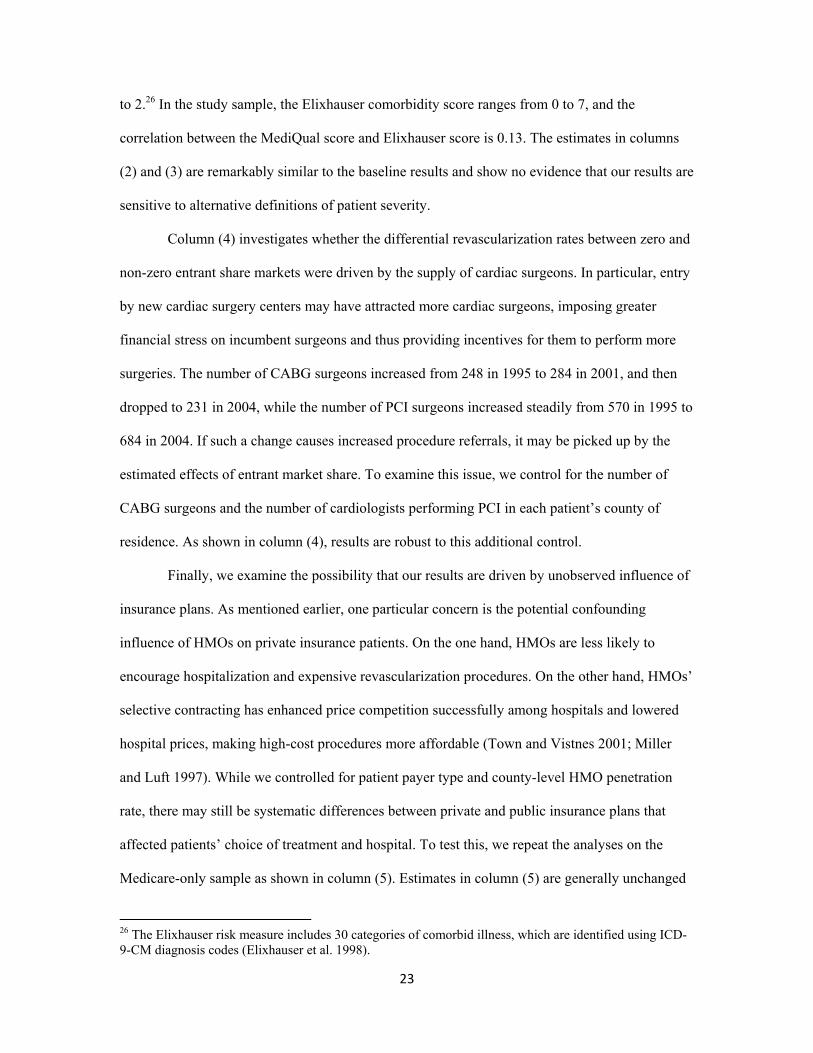
23
to 2.26 In the study sample, the Elixhauser comorbidity score ranges from 0 to 7, and the
correlation between the MediQual score and Elixhauser score is 0.13. The estimates in columns
(2) and (3) are remarkably similar to the baseline results and show no evidence that our results are
sensitive to alternative definitions of patient severity.
Column (4) investigates whether the differential revascularization rates between zero and
non-zero entrant share markets were driven by the supply of cardiac surgeons. In particular, entry
by new cardiac surgery centers may have attracted more cardiac surgeons, imposing greater
financial stress on incumbent surgeons and thus providing incentives for them to perform more
surgeries. The number of CABG surgeons increased from 248 in 1995 to 284 in 2001, and then
dropped to 231 in 2004, while the number of PCI surgeons increased steadily from 570 in 1995 to
684 in 2004. If such a change causes increased procedure referrals, it may be picked up by the
estimated effects of entrant market share. To examine this issue, we control for the number of
CABG surgeons and the number of cardiologists performing PCI in each patient’s county of
residence. As shown in column (4), results are robust to this additional control.
Finally, we examine the possibility that our results are driven by unobserved influence of
insurance plans. As mentioned earlier, one particular concern is the potential confounding
influence of HMOs on private insurance patients. On the one hand, HMOs are less likely to
encourage hospitalization and expensive revascularization procedures. On the other hand, HMOs’
selective contracting has enhanced price competition successfully among hospitals and lowered
hospital prices, making high-cost procedures more affordable (Town and Vistnes 2001; Miller
and Luft 1997). While we controlled for patient payer type and county-level HMO penetration
rate, there may still be systematic differences between private and public insurance plans that
affected patients’ choice of treatment and hospital. To test this, we repeat the analyses on the
Medicare-only sample as shown in column (5). Estimates in column (5) are generally unchanged
26 The Elixhauser risk measure includes 30 categories of comorbid illness, which are identified using ICD-9-CM diagnosis codes (Elixhauser et al. 1998).
24
from the baseline results. Perhaps the only exception is in the last panel, where the estimated
business-stealing effects among high-severity PCI Medicare patients appeared to be larger than
the baseline estimates. Overall, our general findings are unaffected by these specification tests.
VII. Conclusion
The majority of hospital markets in the United States currently operate under state-
mandated certificate-of-need regulation which impedes market entry. Concerns over
anticompetitive effects and adverse impacts on the availability of services to consumers led a
number of states to repeal CON regulation in recent years. Previous research has focused
primarily on the efficiency consequences of CON, generally finding no significant cost-
differences between CON and non-CON states, with little evidence provided on volume effects
(e.g. Ho and Ku-Goto, 2013). Moreover, little has been previously known about the degree to
which deregulation correlates with market entry, or the effect of unimpeded entry has on the
incidence and flow of services in these markets. In this study, we aim to fill the gap by exploring
the impacts of post-deregulation hospital entry on the use of major cardiac procedures in
Pennsylvania, a state which experienced rapid market entry after the repeal of its CON in 1996.
Consistent with previous studies, we find that the removal of entry restrictions in
Pennsylvania was associated with a substantial increase in the number of hospitals performing
cardiac revascularization procedures, coupled with an overall downward trend in CABG, and an
overall upward trend in the alternative procedure, PCI. Examining the role of entry by new
cardiac surgery centers, we find that entry led to a significant increase in the likelihood of CABG,
relative to trend, but it did not contribute to the increase in PCI after adjusting for patient traits,
market characteristics, and area-specific trends. Our analyses show that the probability of
receiving PCI specifically at incumbent hospitals decreased with market entry, suggesting a
volume shift from incumbents to entrants, a phenomenon referred to as business stealing. Results
of our analyses further indicate that entry by new cardiac surgery centers tended to sort high-

25
severity patients into the more invasive CABG procedure and low-severity patients into the less
invasive PCI procedures. Regarding risk-allocation among hospitals, we find evidence that entry
shifted disproportionate volume of low-severity patients from incumbent hospitals to entrants.
While our analysis on impacts of market level entry and entrant concentration on
procedure likelihood and trends are novel, our results echo findings from studies in related
literature which suggest that hospital entry contributed to increased quantity of services, as
observed in market aggregates (Abraham et al. 2007; Mitchell 2007). Our results on business
stealing by entrants parallel those of Huckman (2006), which show that acquiring hospital chains
tend to draw volume from target hospitals. The finding that entrant hospitals tended to
disproportionately attract low-severity patients away from incumbent hospitals is consistent with
Barro et al. (2006), thereby suggesting that the risk-allocation effect of entry is not unique to
specialty hospitals. Finally, focusing on per unit costs of hospitalizations, Kessler and Geppert
(2005) show that low- and high- risk patients are sorted more efficiently into low intensity and
high intensity care when markets are competitive.
As for welfare implications for policies, such as CON, that are designed to remove barrier
entries in hospitals markets, our results are mixed: on the one hand, free-entry may lead to
improved access to care rather than business stealing for CABG procedures; on the other hand,
there is significant empirical evidence in favor of welfare-reducing business-stealing for PCI
procedures. Moreover, free-entry improves the match between underlying medical risk and
treatment intensity, potentially improving quality of care and hence welfare enhancing. These
findings underscore the importance of considering strategic responses by hospitals when
evaluating the impact of free entry into hospital markets when regulatory barriers to entry are
rescinded.
In conclusion, our analysis complements and extends previous studies by exploring the
interaction of CON deregulation and market entry. Moreover, building on an empirical analysis

26
of patient heterogeneity and hospital preference, we allow the impact of the policy to vary by
local market area, and thus provide a more nuanced understanding of the responses to entry as
measured by patient flows. Future research might apply our analytical framework to efficiency
measures such as costs or patient outcomes.
27
References
Abraham, J. M., Gaynor, M., & Vogt, W. B. (2007). Entry and Competition in Local Hospital Markets. Journal of Industrial Economics, 55(2), 265-288.
American Health Planning Association. 2011. American Health Planning Association National Directory. Retrieved from http://www.ahpanet.org/national_directory.html
Barro, J. R., Huckman, R. S., & Kessler, D. P. (2006). The Effects of Cardiac Specialty Hospitals on the Cost and Quality of Medical Care. Journal of Health Economics, 25(4), 702-721.
Birkmeyer, J. D., Siewers, A. E., Finlayson, E. V. A., Stukel, T. A., Lucas, F. L., Batista, I., et al. (2002). Hospital Volume and Surgical Mortality in the United States. New England Journal of Medicine, 346(15), 1128-1137.
Brekke, K. R., Nuscheler, R., & Rune Straume, O. (2006). Quality and Location Choices Under Price Regulation. Journal of Economics & Management Strategy, 15(1), 207-227.
Bresnahan, T. F., & Reiss, P. C. (1990). Entry in Monopoly Markets. Review of Economic Studies, 57(4), 531-553.
Bresnahan, T. F., & Reiss, P. C. (1991). Empirical Models of Discrete Games. Journal of Econometrics, 48(1-2), 57-81.
Burns, L. R., David, G., & Helmchen, L. A. (2009). Effective Responses to Market Entry by Specialty Hospitals and Ambulatory Surgery Centers. Philadelphia, PA.
Calem, P. S., & Rizzo, J. A. (1995). Competition and Specialization in the Hospital Industry: An Application of Hotelling's Location Model. Southern Economic Journal, 1182-1198.
Capps, C., & Dranove, D. (2004). Hospital Consolidation and Negotiated PPO Prices. Health Affairs, 23(2), 175-181.
Capps, C., Dranove, D., & Satterthwaite, M. (2003). Competition and Market Power in Option Demand Markets. The Rand Journal of Economics, 34(4), 737-763.
Chernew, M., Gowrisankaran, G., & Fendrick, A. M. (2002). Payer Type and the Returns to Bypass Surgery: Evidence from Hospital Entry Behavior. Journal of Health Economics, 21(3), 451-474.
Cram, P., Rosenthal, G. E., & Vaughan-Sarrazin, M. S. (2005). Cardiac Revascularization in Specialty and General Hospitals. New England Journal of Medicine, 352(14), 1454-1462.
Cutler, D. M., & Huckman, R. S. (2003). Technological Development and Medical Productivity: The Diffusion of Angioplasty in New York State. Journal of Health Economics, 22(2), 187-217.
Cutler, D. M., Huckman, R. S., & Kolstad, J. T. (2010). Input Constraints and the Efficiency of Entry: Lessons from Cardiac Surgery. American Economic Journal: Economic Policy, 2(1), 51-76.
28
Dafny, L. S. (2005). Games Hospitals Play: Entry Deterrence in Hospital Procedure Markets. Journal of Economics & Management Strategy, 14(3), 513-542.
Dranove, D., Kessler, D., McClellan, M., & Satterthwaite, M. (2003). Is More Information Better? The Effects of "Report Cards" on Health Care Providers. [Article]. Journal of Political Economy, 111(3), 555-588.
Elixhauser, A., Steiner, C., Harris, D. R., & Coffey, R. M. (1998). Comorbidity Measures for Use with Administrative Data. Medical care, 36(1), 8-27.
Ellison, G., & Ellison, S. F. (2011). Strategic Entry Deterrence and the Behavior of Pharmaceutical Incumbents Prior to Patent Expiration. American Economic Journal: Microeconomics, 3(1), 1-36.
Epstein, A. J., Polsky, D., Yang, F., Yang, L., & Groeneveld, P. W. (2011). Coronary Revascularization Trends in the United States, 2001-2008. JAMA: The Journal of the American Medical Association, 305(17), 1769-1776.
Finkelstein, A. (2007). The Aggregate Effects of Health Insurance: Evidence from the Introduction of Medicare. The Quarterly Journal of Economics, 122(1), 1-37.
Gaynor, M., Seider, H., & Vogt, W. B. (2005). The Volume-Outcome Effect, Scale Economies, and Learning-by-Doing. The American Economic Review, 95(2), 243-247.
Gaynor, M., & Vogt, W. B. (2003). Competition among Hospitals. The Rand Journal of Economics, 34(4), 764-785.
Gowrisankaran, G., & Town, R. J. (2003). Competition, Payers, and Hospital Quality. Health Services Research, 38(6p1), 1403-1422.
Halm, E. A., Lee, C., & Chassin, M. R. (2002). Is Volume Related to Outcome in Health Care? A Systematic Review and Methodologic Critique of the Literature. Annals of Internal Medicine, 137(6), 511-520.
Ho, K. (2006). The welfare Effects of Restricted Hospital Choice in the US Medical Care Market. Journal of Applied Econometrics, 21(7), 1039-1079.
Ho, V. (2006). Does Certificate of Need Affect Cardiac Outcomes and Costs? International Journal of Health Care Finance and Economics, 6(4), 300-324.
Ho, V., & Ku-Goto, M.-H. (2013). State Deregulation and Medicare Costs for Acute Cardiac Care. Medical Care Research and Review, 70(2), 185-205.
Ho, V., Ku-Goto, M.-H., & Jollis, J. G. (2009). Certificate of Need (CON) for Cardiac Care: Controversy over the Contributions of CON. Health Services Research, 44(2p1), 483-500.
Hotelling, H. (1929). Stability in Competition. The Economic Journal, 39(153), 41-57.
Huckman, R. S. (2006). Hospital Integration and Vertical Consolidation: An Analysis of Acquisitions in New York State. Journal of Health Economics, 25(1), 58-80.

29
Kessler, D. P., & Geppert, J. J. (2005). The Effects of Competition on Variation in the Quality and Cost of Medical Care. Journal of Economics & Management Strategy, 14(3), 575-589.
Kessler, D. P., & McClellan, M. B. (2000). Is Hospital Competition Socially Wasteful? Quarterly Journal of Economics, 115(2), 577-615.
Lezzoni, L. I., & Moskowitz, M. A. (1988). A Clinical Assessment of Medis-Groups. [doi: 10.1001/jama.1988.03410210071039]. JAMA: The Journal of the American Medical Association, 260(21), 3159-3163.
Longwell, C. B., & Steele Jr, J. T. (2011). Rise and Fall of Certificate of Need in Pennsylvania: An Experiment in Health Care Planning and the Role of the Commonwealth Court, The. Widener LJ, 21, 185.
Luft, H. S., Robinson, J. C., Garnick, D., Maerki, S. C., & McPhee, S. J. (1986). The Role of Specialized Clinical Services in Competition Among Hospitals. Inquiry, 23(spring), 83-94.
Magid, D. J., Calonge, B. N., Rumsfeld, J. S., Canto, J. G., Frederick, P. D., Every, N. R., et al. (2000). Relation Between Hospital Primary Angioplasty Volume and Mortality for Patients with Acute MI Treated With Primary Angioplasty vs Thrombolytic Therapy. JAMA: The Journal of the American Medical Association, 284(24), 3131-3138.
Mankiw, N. G., & Whinston, M. D. (1986). Free Entry and Social Inefficiency. RAND Journal of Economics, 17(1), 48-58.
Mcfadden, D. (1973). Conditional Logit Analysis of Qualitative Choice Behavior. Frontiers in econometrics.
Miller, R. H., & Luft, H. S. (1997). Does Managed Care Lead to Better or Worse Quality of Care? Health Affairs, 16(5), 7-25.
Mitchell, J. M. (2007). Utilization Changes Following Market Entry by Physician-owned Specialty Hospitals. Medical Care Research and Review, 64(4), 395-415.
Nallamothu, B. K., Young, J., Gurm, H. S., Pickens, G., & Safavi, K. (2007). Recent Trends in Hospital Utilization for Acute Myocardial Infarction and Coronary Revascularization in the United States. The American Journal of Cardiology, 99(6), 749-753.
Popescu, I., Vaughan-Sarrazin, M. S., & Rosenthal, G. E. (2006). Certificate of Need Regulations and Use of Coronary Revascularization After Acute Myocardial Infarction. [doi: 10.1001/jama.295.18.2141]. JAMA, 295(18), 2141-2147.
Robinson, J. L., Nash, D. B., Moxey, E., & O'Connor, J. P. (2001). Certificate of Need and the Quality of Cardiac Surgery. American Journal of Medical Quality, 16(5), 155-160.
Serruys, P. W., Morice, M.-C., Kappetein, A. P., Colombo, A., Holmes, D. R., Mack, M. J., et al. (2009). Percutaneous Coronary Intervention versus Coronary-Artery Bypass Grafting for Severe Coronary Artery Disease. New England Journal of Medicine, 360(10), 961-972.

30
Shahian, D. M. (2004). Improving Cardiac Surgery Quality-Volume, Outcome, Process? The Journal of the American Medical Association, 291(2), 246-248.
Sharamitaro, A., & Drew, C. (2011). Health Care Reform: Impact on Hospitals. Health Capital, 4.
Smith, S. C., Dove, J. T., Jacobs, A. K., Kennedy, J. W., Kereiakes, D., Kern, M. J., et al. (2001). ACC/AHA Guidelines for Percutaneous Coronary Intervention (Revision of the 1993 PTCA Guidelines)—Executive Summary: A Report of the American College of Cardiology/American Heart Association Task Force on Practice Guidelines (Committee to Revise the 1993 Guidelines for Percutaneous Transluminal Coronary Angioplasty) Endorsed by the Society for Cardiac Angiography and Interventions. Circulation, 103(24), 3019-3041.
Town, R., & Vistnes, G. (2001). Hospital Competition in HMO Networks. Journal of Health Economics, 20(5), 733-753.
Wedig, G. J., Hassan, M., & Sloan, F. A. (1989). Hospital Investment Decisions and the Cost of Capital. The Journal of Business, 62(4), 517-537.
31
Table 1 Sample Statistics of Patients Overall Low-Severity High-Severity
Receiving CABG in one quarter 0.231 0.257 0.203
Receiving PCI in one quarter 0.360 0.450 0.262
Receiving CABG in one quarter at incumbent hospitals 0.206 0.226 0.184
Receiving PCI in one quarter at incumbent hospitals 0.312 0.386 0.231
Observations 714,088 371,937 342,151 Notes: The CAD sample includes patients who are admitted to a hospital with a new CAD diagnosis within 3 months after admission. High-severity patients are defined as those with MediQual scores greater than or equal to 2.

32
Table 2 The Distribution of Predicted and Actual Entrant Market Share
Year Mean Std. Dev. Lower Quartile Median Upper Quartile
Predicted Entrant Market Share
1997 CABG 0.032 0.091 0 0 0.003 PCI 0.035 0.093 0 0 0.005
2000 CABG 0.132 0.195 0.003 0.057 0.172 PCI 0.142 0.208 0.005 0.055 0.204
2004 CABG 0.296 0.302 0.048 0.193 0.471 PCI 0.331 0.311 0.054 0.232 0.551
Overall CABG 0.135 0.228 0.000 0.018 0.171 PCI 0.141 0.234 0.000 0.016 0.197
Actual Entrant Market Share
1997 CABG 0.026 0.093 0 0 0 PCI 0.026 0.091 0 0 0
2000 CABG 0.132 0.224 0 0.017 0.177 PCI 0.126 0.227 0 0.006 0.154
2004 CABG 0.272 0.320 0 0.125 0.449 PCI 0.302 0.326 0.02 0.176 0.504
Overall CABG 0.125 0.239 0 0 0.126 PCI 0.128 0.243 0 0 0.130

33
Table 3 Effects of Entry on Procedure Incidences
CABG in 3 months at any hospital
PCI in 3 months at any hospital
CABG in 3 months at any incumbent
hospital
PCI in 3 months at any incumbent
hospital
(1) (2) (3) (4) Panel A: Not controlling for HSA-specific time trend
Low entrant share*Post 0.002 0.001 -0.001 -0.006 [0.006] [0.005] [0.007] [0.007]
High entrant share*Post 0.015*** 0.02*** -0.015** -0.033*** [0.005] [0.006] [0.006] [0.009]
Panel B: Controlling for HSA-specific time trend
Low entrant share*Post 0.003** -0.005 -0.001 -0.016*** [0.002] [0.004] [0.002] [0.006]
High entrant share*Post 0.004*** 0.008 -0.002 -0.024*** [0.002] [0.006] [0.002] [0.009]
Observations 714,088 714,088 714,088 714,088 Notes: Coefficient estimates are converted to represent percentage changes. All specifications patient and hospital characteristics, HSA fixed effects and year fixed effects. Standard errors, adjusted for correlation in residents in the same HSA over time, are reported in brackets. *** p<.01, **p<.05, *p<.10

34
Table 4 Effects of Entry on Procedure Incidences by Patient Severity
CABG in 3 months at any hospital
PCI in 3 months at any hospital
CABG in 3 months at any incumbent
hospital
PCI in 3 months at any incumbent
hospital (1) (2) (3) (4)
High-severity 0.015** -0.073** 0.017*** -0.066*** [0.003] [0.003] [0.003] [0.003]
Effects of entry on low-severity patients Low entrant share*Post 0.003 -0.006 -0.004 -0.018***
[0.006] [0.004] [0.006] [0.006] High entrant share*Post -0.001 0.011* -0.017*** -0.030***
[0.006] [0.006] [0.006] [0.009] Effects of entry on high-severity patients Low entrant share*Post 0.018*** -0.003 0.008* -0.014**
[0.005] [0.005] [0.005] [0.006] High entrant share*Post 0.034*** 0.004 0.014* -0.015
[0.006] [0.01] [0.007] [0.012] Observations 714,088 714,088 714,088 714,088

35
Table 5 Effects of Entry on Procedure Incidences by Patient Severity (Entrant = Hospitals operating for 3 years or less)
CABG in 3 months at any hospital
PCI in 3 months at any hospital
CABG in 3 months at any incumbent
hospital
PCI in 3 months at any incumbent
hospital (1) (2) (3) (4)
High-severity 0.015*** -0.073*** 0.016*** -0.07*** [0.003] [0.003] [0.003] [0.003]
Effects of entry on low-severity patients Low entrant share*Post -0.001 -0.005 -0.005 -0.013**
[0.005] [0.005] [0.005] [0.005] High entrant share*Post 0.003 0 -0.021*** -0.039***
[0.005] [0.005] [0.006] [0.006] Effects of entry on high-severity patientsLow entrant share*Post 0.012** -0.005 0.008 -0.013*
[0.005] [0.005] [0.005] [0.007] High entrant share*Post 0.02*** 0.005 -0.002 -0.027***
[0.004] [0.007] [0.006] [0.009] Observations 714,088 714,088 714,088 714,088

Table 6 Robustness Checks on CABG and PCI Procedure Incidence
Baseline Prior-year expenditures
Elixhauser score
Surgeon supply
Medicare Sample
(1) (2) (3) (4) (5) CABG in 3 months at any hospital
Effects on low-severity patients Low entrant share*Post 0.003 0.008 0.004 0.003 0.003
[0.006] [0.005] [0.006] [0.006] [0.006] High entrant share*Post -0.001 0.011 0.001 0 -0.005
[0.006] [0.006] [0.006] [0.006] [0.007] Effects on high-severity patients Low entrant share*Post 0.018*** 0.017*** 0.019*** 0.017*** 0.017***
[0.005] [0.005] [0.005] [0.005] [0.006] High entrant share*Post 0.034*** 0.028*** 0.034*** 0.035*** 0.027***
[0.006] [0.006] [0.007] [0.007] [0.007] PCI in 3 months at any hospital
Effects on low-severity patients Low entrant share*Post -0.006 -0.006 -0.004 -0.006 -0.007
[0.004] [0.004] [0.004] [0.004] [0.005] High entrant share*Post 0.011* 0.008 0.013* 0.012* 0.01
[0.006] [0.006] [0.007] [0.006] [0.007] Effects on high-severity patients Low entrant share*Post -0.003 -0.001 -0.008 -0.003 -0.011**
[0.005] [0.006] [0.005] [0.005] [0.005] High entrant share*Post 0.004 0.013* 0.001 0.005 -0.005
[0.01] [0.007] [0.008] [0.01] [0.009] CABG in 3 months at any incumbent hospital
Effects on low-severity patients Low entrant share*Post -0.004 0 -0.004 -0.004 -0.004
[0.006] [0.005] [0.006] [0.006] [0.006] High entrant share*Post -0.017*** -0.008 -0.014*** -0.016** -0.021***
[0.006] [0.006] [0.006] [0.006] [0.007] Effects on high-severity patients Low entrant share*Post 0.008* 0.009* 0.011** 0.008 0.009*
[0.005] [0.005] [0.005] [0.005] [0.005] High entrant share*Post 0.014* 0.015* 0.011 0.014* 0.009
[0.007] [0.008] [0.007] [0.008] [0.007] PCI in 3 months at any incumbent hospital
Effects on low-severity patients Low entrant share*Post -0.018*** -0.018*** -0.016*** -0.018*** -0.016***
[0.006] [0.006] [0.006] [0.006] [0.006] High entrant share*Post -0.030*** -0.027*** -0.029*** -0.029*** -0.028***
[0.009] [0.008] [0.009] [0.009] [0.009] Effects on high-severity patients Low entrant share*Post -0.014** -0.010 -0.017*** -0.014** -0.019***
[0.006] [0.008] [0.006] [0.006] [0.005] High entrant share*Post -0.015 -0.007 -0.015 -0.014 -0.023**
[0.012] [0.01] [0.01] [0.012] [0.01] Observations 714,088 714,088 714,088 714,088 419,193
36

37
Figure 1 Number of Cardiac Revascularization Centers in Pennsylvania 1993 – 2004
Figure 2 New CABG and PCI Centers in Pennsylvania 1997 – 2004
0
5
10
15
20
25
30
1997 1998 1999 2000 2001 2002 2003 2004
PCI only
CABG only
both

38
Figure 3 Unadjusted CABG and PCI Procedure Rates Among New CAD Patients
150
200
250
300
350
400
450
500
Pro
cedu
re in
cid
ence
/10
00 n
ew C
AD
pa
tien
ts
1995 1996 1997 1998 1999 2000 2001 2002 2003 2004
CABG in entry markets CABG in no-entry marketsPCI in entry markets PCI in no-entry markets

39
Figure 4 Regression-Adjusted Three-Month Probabilities of CABG for First-Time CAD Patients, 1995 – 2004
Note: Fitted trends are quadratic, allows to vary across the before- and after-CON repeal period, and are adjusted for factors included in equation (2b).
.15
.2.2
5.3
Re
gre
ssio
n-a
djus
ted
CA
BG
Ra
te
1995 1996 1997 1998 1999 2000 2001 2002 2003 2004
HSAs with zero entrant shareHSAs with low and high entrant share

40
Figure 5 Regression-Adjusted Three-Month Probabilities of PCI for First-Time CAD Patients, 1995 – 2004
Note: Fitted trends are quadratic, allows to vary across the before- and after-CON repeal period, and are adjusted for factors included in equation (2b).
.2.2
5.3
.35
.4.4
5.5
Re
gre
ssio
n-a
djus
ted
PC
I Ra
te
1995 1996 1997 1998 1999 2000 2001 2002 2003 2004
HSAs with zero entrant shareHSAs with low and high entrant share

41
Table A-1 Descriptive Statistics of Patient Samples
Full Sample of Patients newly diagnosed as CAD
Medicare FFS Patients traveling within 50 miles for
CABG or PCI
Mean Stdv Mean Stdv Patient Characteristics Gender (1=male) 0.586 0.493 0.581 0.493 Race Group
White 0.094 0.292 0.095 0.293 Black 0.846 0.361 0.87 0.336 Asian 0.057 0.232 0.034 0.181 Other races 0.002 0.046 0.001 0.036
Age group Age<=49 0.095 0.293 0.012 0.111 Age 50-59 0.171 0.377 0.033 0.179 Age 60-69 0.241 0.428 0.256 0.436 Age 70-79 0.3 0.458 0.52 0.5 Age 80+ 0.193 0.395 0.179 0.383
Emergency room admission 0.478 0.5 0.252 0.434 Transferred admission 0.161 0.368 0.221 0.415 Urban residence 0.71 0.454 0.784 0.411 Illness Severity Upon Admission
MediQual=0 0.069 0.253 0.043 0.203 MediQual=1 0.452 0.498 0.427 0.495 MediQual=2 0.323 0.468 0.432 0.495 MediQual=3 0.14 0.346 0.094 0.291 MediQual≥4 0.017 0.128 0.004 0.064
Major indications at admission Cardiogenic shock 0.02 0.139 Hypertension 0.535 0.499 Dialysis 0.008 0.086 Heart failure 0.196 0.397 Diabetes 0.273 0.446 Renal failure 0.043 0.202 AMI 0.4 0.49 Prior CABG 0.047 0.213 Prior PCI 0.084 0.277 Medicare 0.587 0.492 Medicaid 0.046 0.21
HMO penetration rate at the county of residence 0.406 0.148

42
Table A-1 Descriptive Statistics of Patient Samples (Continued)
Full Sample of Patients newly diagnosed as CAD
Medicare FFS Patients traveling within 50 miles for
CABG or PCI Mean Stdv Mean Stdv Hospital Characteristics Not-for-profit 0.991 0.092 0.996 0.066 Bed size <200 0.196 0.397 0.063 0.242 Bed size 200-400 0.326 0.469 0.296 0.456 Bed size>400 0.478 0.5 0.642 0.479 Member of any health system 0.707 0.455 0.766 0.424 Teaching 0.485 0.5 0.606 0.489 COTH membership 0.345 0.475 0.427 0.495 CABG volume ≥ 200 0.624 0.484 0.848 0.359 PCI volume ≥ 400 0.556 0.497 0.776 0.417 # of patients 714088 147684 # of hospitals 195 79

43
Appendix: Predicting Entrant Market Share
In equations 1-3, is the entrant market share at time t in Hospital Service Area (HSA) k, based
on patients’ area of residence (assigning entrant share based on where patients were treated can
introduce endogeneity, since patients’ hospital choice may be affected by unobserved
determinants of the hospitals; Similarly, the hospital’s entry choice may depend on anticipated
patient flows, which in turn depends on unobserved determinants of patient population). To
further address the identification issues, we adopt Kessler and McClellan’s (2000) method of
constructing hospital market share to our special context of entry. The analysis is conducted in
three steps: First, calculate an array of relative distances between the choice hospital and
alternative hospitals in the patient’s choice set; these provide instrumental variables. Second,
estimate a patient level hospital choice model, incorporating patient characteristics, hospital traits,
and relative distances. Third, obtain predicted probabilities of choosing an entrant hospital and
sum up the probabilities within each area to obtain market shares. Estimates are implemented
separately for CABG and PCI.
Step 1:
We specify an array of distance variables specified as follows:
∑ ∙ ∙ ∙ ∙ 1 ∙ ∙ ∙ ∙
1 , (A-1)
where is a binary indicator of trait h in hospital j. The exogenous impact of travel cost is
specified as an array of differential distances between the choice hospital and the patient’s closest
alternative hospital (D), where the alternative is specified separately for each hospital trait. Thus,
for H hospital traits, there are 2×H distance-trait interactions terms included in V. For example, if
hospital j is not-for-profit, then the patient’s utility from choosing hospital j depends on , the
additional distance she has to travel beyond her closest not-for-profit hospital (a good substitute)
and , the additional distance she has to travel beyond her closest for-profit hospital (a poor

44
substitute).27
The choice set for each individual i at year t is comprised of all non-federal hospitals
offering at least five CABG (PCI) within 50-mile radius of her residence. We compute the
straight line distance between the geographic centroid of the zip code of a patient’s residence and
the exact location (longitude and latitude) of the hospital using the Geographic Information
System.
Step 2.
In this step, we estimate a patient-level conditional logit (CL) model of hospital choice separately
for CABG and PCI patients by each year in the post CON period, 1997-2004. An individual
patient i’s utility from going to hospital j is a function of the individual’s characteristics, the
hospital’s attributes, and they array of relative distances previously described. Using vector
notation we define
∙ . (A-2)
W is specified as a nonparametric function of the interaction between individual's
characteristics are fully interacted with binary indicators of all hospital characteristics .28
Using the previous notation the individual ’s indirect expected utility from choosing
hospital can be summarized as
; , . . . , , . . . , , , . . . , ; , . . . , . (A-3)
Each hospital is characterized by binary characteristics , . . . , , and the utility of
individual from choosing depends on the relative distances to its good substitutes (same-type)
27 This specification allows for 2 relative distances that influence : equals the distance from to
hospital minus the distance from to the closest hospital ′ with ′
, and equals the distance
from to hospital minus the distance from to the closest hospital ′ with ′
. 28 Vector includes age categories, gender, race categories, source of admission, illness severity, and an indicator of living in urban counties. Vector includes indicators of not-for-profit, bed size between 200 – 400, bed size above 400, more than 20 full-time residents, COTH member, hospital system member, CABG cases above 200 in the prior year, and PCI cases above 400 in the prior year.
45
and the relative distances to its poor substitutes (different-type). To allow for any nonparametric
relationship between distances and patient’s choice, we categorize and into four quartile
dummies based on the distribution of the respective relative distance. That is,
1 ,… , 4 and 1 ,… , 4 .
Finally, let 1 if individual is treated at hospital , and =0 otherwise. Using
McFadden’s (1973) conditional logit, the probability of individual choosing hospital equal to
Pr 1exp
∑ exp∈. (A-4)
Equation (A-4) is estimated using maximum likelihood. Given that private insurance plans
ranging from HMOs to PPOs constrain their memberships choices to hospitals within their
networks, we estimate equation (A-4) using the sample of Medicare fee-for-service enrollees
whose hospital choices are essentially unrestricted. Following Town and Vistnes (2001) and Ho
(2006) we use the parameter values from the Medicare equation to obtain predicted choices for
the all-payer sample. Both studies showed that this method provides reasonable proxies for other
payers.29 Descriptive statistics for the patient and hospital characteristics of the Medicare-FFS
sample are reported in column (2) of Table A-1.
Step 3
Estimated coefficients then are used to predict , the expected demand for CABG (PCI) at
hospital from patients living in market , for patients of all insurance types:
∈
, (A-5)
where denotes the predicted probability of individual receiving procedure CABG(PCI)
at hospital .
Let be the entrants’ market share in HSA . It can be computed as the number of 29 Ho (2006) and Town and Vistnes (2001) implicitly assume that the Medicare that Medicare patients have similar preference for hospitals as their managed care counterparts conditional on diagnosis, distances, and other demographics.

46
patients living in market who go to new centers for cardiac procedures as a proportion of the
total number of patients in market :
∑ ∈
∑ ∈, (A-6)
where denotes the set of entrant hospitals, and denotes the full set of hospitals
providing CABG(PCI) procedure. Each patient i then is assigned an entrant share at his/her
market of residence (instead of at the admitting hospital).