HOW DO COMPANIES REWARD THEIR EMPLOYEES...
97
HOW DO COMPANIES REWARD THEIR EMPLOYEES SAMUEL EBENEZER CUDJOE Master of Science Thesis Stockholm, Sweden 2012
Transcript of HOW DO COMPANIES REWARD THEIR EMPLOYEES...

HOW DO COMPANIES REWARD
THEIR EMPLOYEES
SAMUEL EBENEZER CUDJOE
Master of Science Thesis
Stockholm, Sweden 2012

HOW DO COMPANIES REWARD THEIR
EMPLOYEES
SAMUEL EBENEZER CUDJOE
Master of Science Thesis INDEK 2012:64
KTH Industrial Engineering and Management
Industrial Management
SE-100 44 STOCKHOLM
3
Master of Science Thesis INDEK 2012:64
HOW DO COMPANIES REWARD THEIR
EMPLOYEES
SAMUEL EBENEZER CUDJOE
Approved
2012-06-28
Examiner
Matti Kaulio
Supervisor
Matti Kaulio
Commissioner
Contact person
Francis Eduku
Key-words
Axiological
Extrinsic
Intrinsic
Methodological assumption
Methodological triangulation
Methodology
Ontological Assumptions
Paradigm
Positivism
Qualitative
Quantitative
Research Design
Sampling frame
Sample Size
Unit of Analysis

4
DECLARATION
I hereby declare that this work being submitted as a master thesis is the result of my
original research and that it has neither in whole nor in part presented for another degree
elsewhere and that reproduction of this thesis in part or in full is strictly reserved unless
authorized by the author and the parties associated with this work, herewith under a
written agreement.
5
DEDICATION
I dedicate this work to the Almighty God for his caring and unfailing love he has
bestowed on me during this two-year study period of the International Master in
Industrial Management program (IMIM).
I also dedicate this work to my family and all my colleagues who had been around to
offer support and encouragement throughout the period of this master thesis writing.
I also dedicate this work to the entire staff of Golden Star (Bogoso/Prestea) Limited for
their willingness and contribution in making this questionnaire survey in the company a
great success.
6
ACKNOWLEDGEMENT
I would like to thank the Almighty God for how far he has brought me. His love, care
and favour throughout my schooling had been exceptional.
I would also like to thank the IMIM Program leaders and the Erasmus Scholarship
Authorities for giving me international exposure by awarding me the prestigious
Erasmus Mundus Scholarship to study in three prestigious universities in Europe during
the 2010-2012 academic year.
I would like to thank all the professors and guest speakers who impacted my life both
academically and non-academically during my two year study in Spain, Italy and
Sweden.
I would like to express my profound gratitude and appreciation to my supervisor, Prof.
Matti Kaulio, for his guidance, suggestions and proposals in coming up with this master
thesis. What I can say for now is may the good Lord bless you with infinite wisdom and
special strength throughout the rest of your life.
My appreciation again goes to my mother, Mrs. Rebecca Cudjoe, and the rest of my
family, for their support and encouragement in diverse ways throughout my stay in
Ghana during this master thesis writing.
And lastly, I would like to thank GSB/PL Staff and especially the Human Resources
and Administration Department of Golden Star (Bogoso/Prestea) Limited for furnishing
me with all requested data for my study. Here also, I would like to thank the Human
Resources and Administration Manager, Mr. Francis Eduku, for accepting my proposal
in using GSB/PL as the case study company and making himself available to be
interviewed.

7
LIST OF APPENDICES
Page
Appendix1…………………………………………………………………. 92
Appendix 2………………………………………………………………… 92
Appendix 3………………………………………………………………… 92
Appendix 4………………………………………………………………… 93
Appendix 5………………………………………………………………… 93
Appendix 6………………………………………………………………….93-97

8
TABLE OF CONTENT
Page
Title Page............................................................................................................1
Declaration..........................................................................................................4
Dedication...........................................................................................................5
Acknowledgement..............................................................................................6
List of Appendices..............................................................................................7
Table of Content..................................................................................................8-9
List of Tables and Figures...................................................................................10
Abbreviations......................................................................................................11
Abstract...............................................................................................................12-13
CHAPTER ONE
1.0 Introduction.....................................................................................................14
1.1.0 Background to the Study..............................................................................14
1.2.0 Problem Description......................................................................................15
1.3.0 The purpose of the Study..............................................................................15-16
1.4.0 Scope and Limitations of the Research Design............................................16
CHAPTER TWO
2.0 Literature Review..............................................................................................17
2.1.0 Generational Groups and Employees Reward Preferences............................17
2.2.0 Total Reward System Perspectives: Motivation Theory and
Behavioural Perspectives...............................................................................17
2.2.1 Motivation Theory Perspective......................................................................17-32
2.2.2 The Expectancy Theory: A framework for the analysis of workplace
motivation.......................................................................................................20-21
2.2.3 Porter and Lawler Expectancy Model.............................................................21
2.2.4 Adams Equity Theory......................................................................................21-23
2.2.5 Goal Theory......................................................................................................23-25
2.2.6 Herzberg Two-Factor Theory...........................................................................25-27
2.2.7 Needs Hierarchy...............................................................................................27-29
2.2.8 McCllelands Achievement Needs Theory........................................................29-32
2.3.0 Behavioural Management Perspective..............................................................33-41
2.3.1 Informational or Effort Directing Purpose.......................................................33
2.3.2 Motivational or Effort Inducing Purpose.........................................................33
2.3.3 Personnel-related Purpose................................................................................33-34
2.3.4 Overview of the Various Types of Rewards....................................................34
2.3.5 Intrinsic and Extrinsic Rewards........................................................................34
2.3.6 Monetary and Non-Monetary Rewards............................................................35
2.3.7 Collective and Individual Rewards..................................................................35
2.3.8 Fixed and Variable Rewards............................................................................35
Page

9
2.3.9 Positive and Negative Rewards........................................................................35
2.4.0 Salary Increases................................................................................................36
2.4.1 Short Term Incentives.......................................................................................37
2.4.2 Long Term Incentives.......................................................................................38
2.4.3 Stock Option Plans...........................................................................................38-39
2.4.3.1 Restricted Stock Plans....................................................................................39
2.4.3.2 Performance Stock Plans................................................................................40
2.4.3.3 Stock Appreciation Plans..............................................................................40-41
2.50 Total Reward Strategy......................................................................................41-44
CHAPTER THREE
3.0 Methodology.........................................................................................................46
2.60 Corporate Profile of Golden Star (Bogoso/Prestea) Ltd.....................................46
2.61 Corporate Strategy of GSB/PL...........................................................................46
2.62 The HR Configuration of Golden Star (Bogoso/Prestea) Ltd............................47-48
3.10 Research Design..................................................................................................49
3.12 Sample Size Determination.................................................................................50
CHAPTER FOUR
4.0 Result From the Study..........................................................................................53-68
CHAPTER FIVE
5.0 Discussion of Results and Findings....................................................................69
5.10 Questionnaire Results and Analysis..................................................................69-73
5.20 Human Resources and Administration Manager Interview Result...................73-75
5.30 Findings From the Study....................................................................................75-77
CHAPTER SIX
6.0 Conclusion and Recommendation........................................................................78
6.10Conclusion...........................................................................................................78-79
6.20 Recommendation................................................................................................79-80
Bibliography...............................................................................................................81-91
10
LIST OF TABLES AND FIGURES
List of Tables
Page
Table 1........................................................................................................................19
Table 2a......................................................................................................................19
Table 2b......................................................................................................................19
Table 3........................................................................................................................26
Table 4........................................................................................................................31
Table 5........................................................................................................................36
Table 6........................................................................................................................45
Table 7........................................................................................................................52
Table 8a......................................................................................................................53
Table 8b......................................................................................................................54
Table 9a......................................................................................................................55
Table 9b......................................................................................................................56
Table 10a....................................................................................................................57
Table 10b....................................................................................................................58
Table 11a....................................................................................................................59
Table 11b....................................................................................................................60
Table 12a....................................................................................................................64
Table 12b....................................................................................................................65
Table 13a.....................................................................................................................66
Table 13b.....................................................................................................................67
Table 14.......................................................................................................................67
List of Figures
Fig 1b...........................................................................................................................25
Fig 2a...........................................................................................................................58
Fig 2b...........................................................................................................................59
Fig 3a...........................................................................................................................63
Fig 3b...........................................................................................................................63
Fig 4a...........................................................................................................................64
Fig 4b...........................................................................................................................65
Fig 5a...........................................................................................................................66
Fig 5b...........................................................................................................................67
Fig 6.............................................................................................................................68

11
ABBREVIATIONS
GSB/PL: Golden Star (Bogoso/Prestea) Limited
GEN X: Generation X
GEN Y: Generation Y
MGT: Management
12
ABSTRACT
This study is unique considering the location (Africa) and the industrial setting (Gold
Mining) from which the research was studied as reward systems had mostly been
studied in the North-American and European settings. Thus, the study considered
rewards from the perspective of the African and its natural resource industries such as
the gold mining industry.
The methodology employed in the study was based on a case study approach at Golden
Star (Bogoso/Prestea) Limited (GSB/PL) with a population size of 1029 employees
combining both qualitative and quantitative data obtained through a questionnaire
survey of a 278 sample size and structured interview with the Human Resources and
Administration Manager. Thus, the method of data collection represents methodological
triangulation and the data obtained from the study represents a primary source of data.
The study revealed that all the three generational groups (Baby Boomers, GEN Xers and
GEN Yers) places higher emphasis or priority on financial incentives (high salary and
bonuses) over any other incentives when respondents were asked to indicate the reward
they prefer most. But when rewards were considered as a total package profile, greater
number of the baby boomers placed more emphasis or priority on packages with highly
flexible pension benefits, long term job security and high internal promotions
eventhough the salary and bonus components of the packages (profile) were not that
attract. The GEN X and GEN Y groups still maintained their reward package profile
preferences based on high financial incentives, training and learning opportunities,
personal growth and career advancement.
The study revealed that aside the high preferences for financial incentives such as high
salary and bonuses by all the generational groups, few of the GEN X and GEN Y also
exhibited other preferences such as high personal growth, flexible work schedule,
attractive company policy and administration, career advancement, working
environment, job security and praises and recognition of which the baby boomers did
not indicate any preferences or interest.
The study revealed that all the three generational groups (Baby Boomers, GEN X and
GEN Y) consider high salary and bonuses as factor which causes employee
dissatisfaction when not satisfied or available but when they are satisfied or available
also do not motivate or cause satisfaction and thus confirming Herzberg Two-Factor
theory that factors such as salary or remuneration, job security, working conditions and
company policies only prevent employee dissatisfaction.
The study revealed that all generational groups (baby boomers, GEN X and GEN Y)
consider high salaries and bonuses as factor which could lead to lack of satisfaction and
motivation of the employee in his current role or position when not available or satisfied

13
and thus this finding confirm the traditional belief that pay is prime, or in some cases
the only source of motivation but contradict Herzberg claim that pay (high salaries and
bonuses) is only an extrinsic factor and that when is available or satisfied, pay does not
bring satisfaction and motivation but rather prevents dissatisfaction.
The study revealed that GSB/PL rewards systems basically comprises of extrinsic
rewards such as high salary levels (pay increases), a bonus scheme, training and
learning opportunities, job security, Stock options, Retirement/Pension benefits such as
social security and provident fund, promotions, attractive company policies and
administration, praises and recognition, good working environment, flexible work
schedule, Long service awards and benefits such as housing, Health insurance,
Vacation/Annual leave benefits, transportation/bussing service, messing (provision of
meals to employees only when at work), and educational benefits (for employees
dependants).
The study also revealed that the design and implementation of GSB/PL reward systems
involves four distinct phases: assessment, design, execution and evaluation phases.
In the end, a suitable conclusion was drawn and a number of recommendations
proposed to be implemented by the mining company in safeguarding the interest of both
employees and the employer.

14
CHAPTER ONE
1.0 INTRODUCTION
1.1.0 Background to the study
In achieving and sustaining competitive advantage, it is imperative that organizations
leverage human capital in a desired direction (Boxall and Purcell, 2003) and the key
means of accomplishing this is through the incentive power of rewards (Lawler, 2000).
Rewards like baits have the incentive power and ability in eliciting and reinforcing
performance and this is widely acknowledged in both economic and behavioural
literatures (Bartol and Srivastava, 2002; Cadsby et al., 2007; Heneman et al., 2000; Sun
et al., 2007).
According to WorldatWork (The Total Reward Association), "the total reward strategy
of companies basically encompasses compensation, benefits, performance and
recognition, as well as development and career opportunities1".
Heneman (2007, p. 3-4) defined total rewards as encompassing not only compensation
and benefits but also personal and professional growth opportunities and a motivating
work environment (for example, recognition, valued job design, and work/life balance)2.
Fernandes (1998) describes total reward as ―The sum of the values of each element of
an employee‘s reward package.‖
From the behavioural management perspective, reward is a management control tool
that employers use in achieving desired behaviours from their employees in the
workplace. The term reward is therefore a tool for effective management in the
workplace and according to Steven Kerr (2004), Chief Learning Officer, Goldman
Sachs, ―One of the primary principles of effective management is that rewards should
be the third thing you work on as measurements come second, and both rewards and
measurements being subordinated to performance definition; i.e. clear and unambiguous
articulation of what needs to be done‖ Merchant K.A et al (2007 p.393).
In emphasizing the power of rewards, Towers Perrin (2007, p.1) research highlighted
that employers must be prepared to deploy a broad range of reward elements — based
on insights about specific workforce demographics, job functions and levels, geographic
1 WorldatWork. The Total Rewards Association: http://www.worldatwork.org/waw/aboutus/html/aboutus-
whatis.html#snap
2 http://www.shrm.org/hrdisciplines/benefits/documents/07rewardsstratreport.pdf

15
regions and industry sectors in-order to attract, retain and engage the talent they need
for business success.3
Reward management systems have major impact on organizations capability to catch,
retain and motivate high potential employees and as a result getting the high levels of
performance (Barber et al., 2000; Güngör, 2011 p.1511)
Developing and managing a reward system, which is efficient and suited to the
organisation, is an essential human resource management function (e.g. Frombrun,
Tichy and Devanna 1984; Beer et al. 1985; Schuler and Jackson, 1996) and that HR
practitioners must endeavor to attach all the necessary importance to this area of human
resource management.
1.2.0 Problem description
Today's organizations consist of a diversified workforce (Nelson, 2007) of four (4)
groups of generations who are working together side by side: Silent Generation, the
Baby Boomers, Generation X and Generation Y ( Dries et al. 2008). Each generation
have its own unique work ethics, different perspectives of work, distinct and preferred
ways of being managed and managing (Zemke, 1999 p.33) and as a result becomes
imperative in taking into consideration the perceptions of the different generational
groups in the workplace during the design and implementation of organizations reward
strategy in preventing employee dissatisfaction and enhancing employee motivation
workplace. This among other pressing employee reward preferences gave birth to the
research questions: How do the different generational groups perceive rewards in the
workplace, which rewards they prefer most, which rewards prevents employee
dissatisfaction and enhances employee satisfaction and motivation as well as what are
the critical success factors and phases considered in the design and implementation of
the reward systems.
1.3.0 The Purpose of the Study
The purpose of the study is to understand the perceptions of the different generational
groups in the workplace towards rewards and the factors involved in the design and
implementation of the reward systems in the workplace based on the following
objectives:
to ascertain which rewards employees prefer most in relation to their job or
position
to evaluate and understand which rewards prevent employees dissatisfaction
3 http://www.towersperrin.com/tp/getwebcachedoc?webc=HRS/USA/2007/200709/TRE_TalentMgmt_919.pdf

16
to evaluate and understand which rewards contribute to employees satisfaction
and motivation
to evaluate and understand which reward package profile employees prefer most
To identify the critical success factors involved in the design and
implementation of the reward systems
To outline the various phases involved in the design and implementation of the
reward systems
The findings from the objectives "evaluation of which rewards prevent employees
dissatisfaction and which rewards contribute to employees satisfaction and motivation"
serve as a test in proving conformance to or non-conformance to Herzberg Two Factor
Theory (The Hygiene factors and Motivators)
The different Generational groups whose perceptions on rewards are being sought after
in this study will be defined as follows: A group of people which shares the same years
of birth, common tastes, attitudes, experiences, place in history and common events and
images which all make then create unique personalities (Zemke, 1999 p.24). The
generation or demographic groups that will be used in the study include the following:
Silent Generation, the Baby Boomers, Generation X and Generation Y ( Dries et al.
2008).
1.4.0 Scope and the limitations of the research design
The scope of the research covers the perceptions and preferences of the different
generational groups on rewards within GSB/PL. The limitations of the research design
will include the following:
The research was carried out within only one natural setting (GSB/PL).
A small random sample of the population was considered
The sampling frame was supplied by the Human Resources Department and as
such any error or biases in the data would produce or result in biased sample.
The main research questions behind this study are as follows:
What rewards do employees of the different generational groups prefer most?
What rewards do the different generational groups perceive to prevent
employees dissatisfaction?
What rewards do the different generational groups perceive to enhance
employees satisfaction and motivation?
what reward package profile do employees prefer most?
What are the critical success factors and phases involved in the design and
implementation of reward systems.

17
CHAPTER TWO
2.0 LITERATURE REVIEW/BACKGROUND STUDY
2.1.0 Generational Groups and Employees Reward Preferences
Kanfer and Ackerman (2004) emphasize that despite the increasing number of ageing
employees, little research is targeted at age-related changes in motivation and age-
related differences in employee reward preferences (Doering, Rhodes and Schuster
1983).
Armstrong(1999) emphasized that especially, when the availability of human resources
is limited, it is essential for organizations to develop their reward philosophies, practices
and strategies in accordance with the culture they want to promote. Lawler (1990)
emphasized that reward systems are highly dependent on organization strategy, culture
and values, and has a strong impact on the culture of most organisations.
Employees‘ reward preferences had been studied in various contexts (Rainey 1982;
Doering et al. 1983; Kanungo and Mendonca 1988; Cable and Judge 1994; Chiu, Luk
and Tang 2002; Chiang and Birch 2007). In some instances, typical comparisons have
been made between public and private sector employees on reward preferences (Rainey
1982; Doering et al. 1983) or between employees with different cultural background
(Chiu et al. 2002; Chiang and Birch 2007). Also, reward preferences have been found to
relate closely to job preferences and to job search decisions (Cable and Judge, 1994;
Jurgensen, 1978), and have a tendency to change across the life course and different
types of work and therefore a good idea or understanding of the reward preferences of
an ideal job applicant might help the organisation in increasing its attractiveness and
becoming economically more effective (Cable and Judge, 1994).
Kubal and Newman (2008) emphasized that demographics paint a picture of a
workforce in search of flexibility and that a Merrill Lynch survey indicated that 16
percent of the baby boomer workforce is looking for part-time work, and 42 percent will
only take jobs that will allow them periods off for leisure.
2.2.0 Total Rewards System Perspectives: Motivation Theory and Behavioural
Management Control Perspectives of Rewards
2.2.1 Motivation Theory Perspective
According to Wright (1989), the first step towards predicting and influencing work
behaviour is the understanding of the human need. Due to the complexity of the work
motivation concept, there is no single definition as over the years some theorist have
concentrated on physiological aspects, some stress behavioural aspects and others the
rationality of human beings (Pinder, 1998).
18
Pinder (1998, p. 11) describes motivation as: ‗‗a set of energetic forces that originate
both within as well as beyond an individual‘s being, to initiate work-related behavior,
and to determine its form, direction, intensity, and duration‘‘. Ambrose and Kulik
(1999, p. 231) viewed Pinder work motivation definition as an ‗‗invisible, internal,
hypothetical construct‘‘ and also emphasized that since work motivation cannot actually
be seen or measure directly, established theories are used when measuring the
observable manifestations of work motivation.
Brooks et al (2009 p.80) defined motivation in two terms: Broad and Simpler terms. In
the broad term, they considered motivation to comprise an individual's effort and
persistence and the direction of that effort but in the simpler terms, they considered
motivation as the will to perform. In their attempt to explain the concept of motivation,
they highlighted the characteristics frequently exhibited or associated with well-
motivated and demotivated individuals. They argued that well-motivated individuals are
thought to consistently achieve at workplace and to exhibit energy and enthusiasm in
the process; work with people to overcome organizational problems, or obstacles to
progress, and frequently demand and accept additional responsibility; and may be more
willing to accept organizational change. They also argued that demotivated employees
may appear apathetic and may tend to consider problems and issues as insurmountable
obstacles to progress; might have poor attendance and time keeping records and might
appear uncooperative and resistant to change. Steer & Porter (1991) also defined work
motivation as the process by which behavior is energized, directed, and sustained in
organizational settings4.
Brooks et al (2009 p.81), emphasized that motivational theory has been developed from
empirical research activities and has progressed considerably from the Traditional or
Classical approaches based on the assumption that employees in an attempt to maximize
the economic return to their labour in the workplace acted rationally. They also argued
that cognitive tradition is based on the assumption that people are conscious of both
their goals and behaviour and they act rationally and purposefully. They considered the
behaviouralist tradition as where the human behaviour is to be reflexive and instinctive
and thus responsive to certain environmental positive or negative stimuli. They also
argued that the behaviour modification theory and the reinforcement theory are firmly
rooted in the behaviouralist tradition and focuses on the consequences of people's
action instead of the inner state of the individual which is the focal point of the
cognitive school.
4 Leonard, N.H. (1999) "Work motivation: The Incorporation of Self-Concept-Based
Processes" Human Relations, 52/8, p.970.

19
According to Brooks et al (2009 p.81), broadly, most models and approaches to
motivation can be categorized as either content or process theories and that the content
theories attempt to identify and explain the factors which energize or motivate people
whereas process theories focus on how a variety of personal factors interact and
influence human behaviour. The two sets of theories are quite often compatible and
provide considerable insight into motivation in the workplace when combined. They
emphasized that behaviour modification theory is associated with motivation and
learning and that it broadly suggests that behaviour is a function of its consequences,
that is the outcome of a particular behaviour will influence the nature of future
behaviour. They also highlighted that both positive and negative reinforcement can
increase the strength of a behaviour as people often respond positively to encouraging
feedback and/ or consider changing their bahaviour if it leads to negative feedback.
They emphasized that critiques of behavioural modification or shaping in the workplace
suggest that it dehumanizes employees.
Table 1: Shows a simple classification of motivation theories (Brooks, 2009 p.82)
Content theories Process theories
Two-factor theory (Herzberg) Expectancy theory (Vroom; Porter & Lawler)
Needs hierarchy (Maslow; Alderfer) Equity theory (Adams)
Achievement needs theory (McClelland) Goal theory (Looke)
Attribution theory (Heider; Kelley)
Source: Brooks et al. (2009, p.82) "Organizational Behaviour: Individuals, Groups and Organization"
4th Edition, England: Prentice Hall, p.82
Table 2a: Shows distinction between process and content theories
CONTENT PROCESS
Static Dynamic
Emphasis on what motivates Emphasis on the process of motivation
Concern with individual needs and goals Concern with how motivation occurs
Source: Brooks et al. (2009, p.82) "Organizational Behaviour: Individuals, Groups and Organization"
4th Edition, England: Prentice Hall, p.82
Table 2b: Shows distinction between behavioural and cognitive traditions
BEHAVIOURAL COGNITIVE
Focus on behaviour Consciousness/rationality
Responses to internal or external stimuli Goals and behaviour known and calculable
Source (Table 3&4): Brooks et al. (2009, p.82) "Organizational Behaviour: Individuals, Groups and
Organization" 4th Edition, England: Prentice Hall, p.82

20
2.2.2 The Expectancy theory: A framework for the analysis of workplace
motivation
Vroom (1964) developed the expectancy theory from the original work of Tolman and
Honzik (1930), producing a systematic explanatory theory of workplace motivation and
as an alternative to the behaviouralist approaches to motivation. The theory provides a
framework for explaining employee behaviour such as level of motivation,
performance, employee turnover and absenteeism, in addition to leadership
effectiveness and career choice (Brooks et al. 2009 p.83). Chen and Lou (2002)
emphasized that the theory basically provides a general framework for assessing,
interpreting, and evaluating employee behaviour in learning, decision-making, attitude
formation, and motivation. Expectancy theory generally is supported by empirical
evidence (Tien, 2000; Vansteenkiste et al., 2005; Chiang, et al., 2008) and is one of
most commonly used theories of motivation in the workplace
(Campbell and Pritchard, 1976; Heneman and Schwab, 1972; Mitchell and Biglan,
1971; Chiang et al., 2008).
The theory argued that the motivation to behave in a particular way is determined by an
individual's expectation that behaviour will lead to a particular outcome, multiplied by
the preference or valence that person has for that outcome. Brooks et al. (2009, p.83)
highlighted Vrooms arguments that "human behaviour is directed by subjective
probability, that is, the individual's expectation that his or her behaviour will lead to a
particular outcome". The simple expectancy equation is: Motivation= Expectation (E) x
Valence (V)
Brooks et al. (2009 p.86) highlighted a number of important assumptions underlying the
expectancy theory as follows:
The realization that individual behaviour is influenced by various personal and
environmental factors;
An individual makes a series of decisions or choices about his or her behavior
and acts rationally in that process, taking note of such information as is
available;
Individuals differ and have a variety of needs, drives and sources of motivation
Pinder (1984) found that both valence and expectancy were related to both effort and
performance in the workplace, where as Campbell and Pritchard (1976) confirmed that
an individual's motivation is influenced by the value this person places on expected
rewards5.
5 Brook, I. et al. (2009) p.86.
21
Mitchell (1974) suggested that the construct validity of the components of expectancy
theory remains little understood. The results of the meta-analysis by Van Eerde and
Thierry (1996) meta-analysis results implicated that Vroom's model lacks external
validity suggesting that the model does not yield higher effect sizes than the
components of the models. In addition, research dedicated to developing a theory for the
process of employee motivation had been very little, and the lack of a strong theoretical
framework may negatively affect the validity of the Vroom‘s model.
Chiang, et al. (2008) proposed a modified expectancy theory model which comprises of
five (5) components (expectancy, extrinsic instrumentality, intrinsic instrumentality,
extrinsic valence, and intrinsic valence) and tested it with 289 hotel employees which
indicated that that intrinsic motivation factors are more influential than extrinsic factors
for hotel employees, suggesting that hotel managers need to focus more on intrinsic
factors to better motivate employees. They illustrated their modified expectancy model
as follow: Motivation= Expectancy x Instrumentality x Valence
2.2.3 Porter and Lawler Expectancy Model
This is a more complex expectancy model, which represents a further development of
the basic expectancy model carried out by Porter and Lawler (1968) which includes
further, hopefully realistic, variables and highlights certain potential managerial
implications and also sheds light on the nature of the relationship between employee
satisfaction and performance. Porter and Lawler‘s model suggests that performance is a
product not only of effort but also of the individual‘s abilities and characteristics
together with his or her role perception (Brooks et al, 2009 p.85). They emphasized that
performance leads to two types of reward: Intrinsic and extrinsic rewards and that
intrinsic rewards are intangible and include a sense of achievement, or advancement, of
recognition and enhanced responsibility whereas extrinsic rewards are more tangible
and include pay and working conditions. The basic assumption underlying this concept
is that if performance in an organization results in equitable and fair results, people will
be more satisfied. Lawler (1973) argues that intrinsic rewards have more important
influences on motivation than pay or promotion. Hertzberg (1968) suggests that
intrinsic rewards have a more direct and powerful influence on workplace satisfaction
than do extrinsic rewards. Blum (1949:132-3) having recognized this for some time
earlier emphasized that ―the major error in industry has been the oversimplification of
the concept of motivation‖.
2.2.4 Adam’s Equity Theory
Adam (1963, 1965) developed the equity theory which provides useful and simple
insights into the relationship between rewards and the likely satisfaction individuals‘
gain from them and helps also to qualify the understanding of the expectancy model.

22
This theory is based on the assumption that people pursue a balance between their
investments (or ‗inputs‘, e.g. time, attention, skills, effort) in and the rewards (or outputs
‗outcomes‘, e.g. status, appreciation, gratitude and pay) gained from this relationship,
compared to the input/outcome ratio of similar others
(Tarris, Kalimo, et al., 2002 p.287).
The social comparison notion incorporated into Adam‘s theory of psychological equity
originates from Leon Festinger (1954) argument that when people are uncertain about
their opinions or abilities (that is, when objective information is not available), they
evaluate themselves by comparing themselves to similar others (Tarris, Kalimo, et al.,
2002 p.287).
Brooks, et al. (2009 p.97) highlighted that Adam‘s model contains three crucial
components: inputs (the effort an individual makes); outputs (intrinsic and extrinsic
rewards from the organization); and comparison with others. According to the theory, if
an individual perceives that the overall outputs he or she receives from the organization
(eg. Pay, fringe benefits, recognition) in return for their particular inputs (eg. Hours of
work, achievements, qualifications) are equal to, or exceed, those received by
colleagues in the company or peers elsewhere, then they will view the situation as
equitable or even favourable and the opposite effect leads to under-reward inequity
where individuals are motivated to reduce such inequality.
Brooks, et al. (2009 p.86) emphasized the five factors suggested by Tyler and Bies
(1990) regarding perception of fairness in the workplace and hence perceived equity as
follows:
Adequate consideration of an employee‘s view point;
Suppression of personal bias;
Consistent application of criteria across employees;
Provision of timely feedback after a discussion;
Providing employees with adequate explanations for a discussion
Tarris et al.( 2002, p.288) emphasized that though over the last decade, a small body of
research has addressed the relationship between inequality in exchange relationships at
work and work outcomes such as job satisfaction, turnover, organizational commitment
and burnout, this small research supported the predictions generated by equity theory, in
that inequity in various work relationships was shown to be associated with job
dissatisfaction (Perry, 1993), lack of organizational commitment (Schaufeli, Van
Dierendonck, & Van Gorp, 1996), absenteeism and turnover (Geurts, Schaufeli, & De
Jonge, 1998; Iverson & Roy, 1994; Van Yperen, Hagedoorn, & Geurts, 1996),
employee theft (Greenberg, 1990; Shapiro, Trevino, & Victor, 1995), and burnout

23
(Van Dierendonck, Schaufeli, & Buunk, 1996; Van Dierendonck, Schaufeli, & Sixma,
1994; Van Yperen, 1998).
Goodman and Friedman (1971) emphasized and confirmed that equity theory hold
validity in practice and as a consequence the theory underpins the work of managers
and, in particular, industrial relations and compensation specialists in HRM.
Though, the equity theory seems to be similar to the expectancy theory, it differs
significantly based on its recognition of social comparison (that individuals make
comparison between themselves and others when assessing the scale or worthiness of
rewards received).
2.2.5 Goal Theory
Locke (1968) proposed a simple and intuitively appealing cognitive theory of
motivation which states that "both motivation and performance will be high if
individuals are set specific goals which are challenging, but accepted and where
feedback is given on performance" (Brooks, et al. p.84).
Locke & Latham (2002 p.706) emphasized that goal specificity in itself does not
necessarily lead to high performance because specific goals vary in difficulty and in
spite of that, insofar as performance is fully controllable, goal specificity does reduce
variation in performance by reducing the ambiguity about what is to be attained Locke
et al. (1989).
Locke et al (1981) identified four ways in which goals influence behaviour as follows:
Direct attention
Rothkopf and Billington (1979) observed that students with specific learning goals paid
attention to and learned goal-relevant prose passages better than goal-irrelevant
passages. Also, Locke and Bryan (1969) observed that people who were given
feedback about multiple aspects of their performance on an automobile-driving task
improved their performance on the dimensions for which they had goals but not on
other dimensions.
Mobilize effort
Goals are observed to have an energizing function and that high goals lead to greater
effort than low goals and this has been shown with tasks that (a) directly entail physical
effort, such as the ergometer (Bandura & Cervone, 1983); (b) entail repeated
performance of simple cognitive tasks, such as addition; (c) include measurements of

24
subjective effort (Bryan & Locke, 1967a); and (d) include physiological indicators of
effort (Sales, 1970).
Encourage persistence
LaPorte & Nath, (1976) observed that hard goals prolong effort when participants were
allowed to control the time they spend on a task. Tight deadlines lead to a more rapid
work pace than loose deadlines in the laboratory (Bryan & Locke, 1967b) as well as in
the field (Latham & Locke, 1975).
Facilitate strategy development
Wood & Locke, (1990) observed that goals affect action indirectly by leading to the
arousal, discovery, and/or use of task-relevant knowledge and strategies
It is argued that self evaluation and self monitoring against targets are vital and has
shown to be important to successful individual learning. A study revealed that
individuals who received training in self regulatory processes demonstrated less
absenteeism whiles other studies had also shown that difficulty in achieving a high-
order goal tended to lead to a shift towards a lower-order goal, hence the notion of a
hierarchy of goals is recognized as valuable, enabling self regulation and the
achievement of longer term goals (Brooks, et al. p.84).
But in addressing the question why would people be motivated to set high goals, Locke
and Latham (2002) emphasized that people could expect many psychological and
practical outcomes from setting and attaining those goals. For example, Mento et
al.,(1992) reported four beneficial outcomes that undergraduate business students
expected as a result of having a grade point of A versus B versus C as follows: Pride in
performance; academic outcomes such as admission into graduate school or receiving a
scholarship; future benefits, such as an excellent job offer or a high starting salary; and
life benefits, such as career success. They also reported that expected satisfaction with
performance showed the opposite pattern and that the highest degree of anticipated
satisfaction, averaged across all grade outcomes, was for students with a goal of C, and
the lowest was for students with a goal of earning an A.
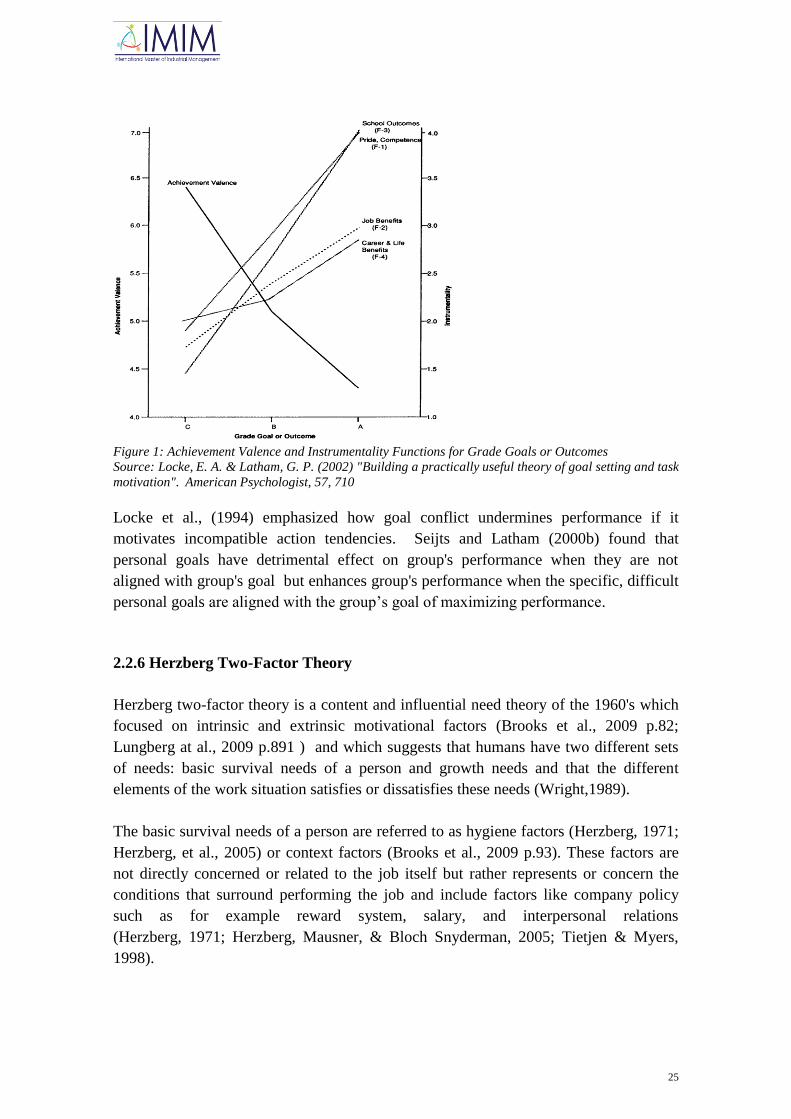
Mento et al. (1992) relationships are graphically shown in Figure1.
Locke and Bryan (1967) observed that a means of enhancing task interest is by setting
specific challenging goals whiles Harackiewicz, et al. (1984) also observed that setting
specific challenging goals is a means of helping people to discover the pleasure of an
activity.
25
Figure 1: Achievement Valence and Instrumentality Functions for Grade Goals or Outcomes Source: Locke, E. A. & Latham, G. P. (2002) "Building a practically useful theory of goal setting and task
motivation". American Psychologist, 57, 710
Locke et al., (1994) emphasized how goal conflict undermines performance if it
motivates incompatible action tendencies. Seijts and Latham (2000b) found that
personal goals have detrimental effect on group's performance when they are not
aligned with group's goal but enhances group's performance when the specific, difficult
personal goals are aligned with the group‘s goal of maximizing performance.
2.2.6 Herzberg Two-Factor Theory
Herzberg two-factor theory is a content and influential need theory of the 1960's which
focused on intrinsic and extrinsic motivational factors (Brooks et al., 2009 p.82;
Lungberg at al., 2009 p.891 ) and which suggests that humans have two different sets
of needs: basic survival needs of a person and growth needs and that the different
elements of the work situation satisfies or dissatisfies these needs (Wright,1989).
The basic survival needs of a person are referred to as hygiene factors (Herzberg, 1971;
Herzberg, et al., 2005) or context factors (Brooks et al., 2009 p.93). These factors are
not directly concerned or related to the job itself but rather represents or concern the
conditions that surround performing the job and include factors like company policy
such as for example reward system, salary, and interpersonal relations
(Herzberg, 1971; Herzberg, Mausner, & Bloch Snyderman, 2005; Tietjen & Myers,
1998).
26
Brooks et al. (2009 p.94) highlighted that these hygiene factors are extrinsic to the
actual work itself, and include factors such as salary or remuneration, job security,
working conditions and company policies. According to Herzberg, these factors can
cause employee dissatisfaction when not satisfied or available but when they are
satisfied or available also they do not motivate or cause satisfaction and so these factors
only prevent employee dissatisfaction (Herzberg, 1971; Herzberg, Mausner, &Bloch
Snyderman, 2005).
The growth needs refer to factors intrinsic within the work itself, which Herzberg
referred to as motivating factors, which implies that human being try to become all that
they are capable of becoming and when these factors are satisfied they work as
motivators (Herzberg, 1971, Herzberg, Mausner, & Bloch Snyderman, 2005) and
includes for example recognition of a task completed, achievement, responsibility,
advancement and work itself. According to Herzberg, content of work is the only way
to increase satisfaction and thereby enhance work motivation (Wright, 1989) and that
when the growth factors are absent or unavailable it does not lead to dissatisfaction, but
simply an absence of satisfaction (Herzberg, 1971; Herzberg, Mausner, & Bloch
Snyderman, 2005).
Brooks et al. (2009 p.94-6) highlighted how Herzberg contextual factors such as such
pay viewed as a non-motivator is in contrast with traditional belief that pay is prime, or
in some cases the only source of motivation. They highlighted that Herzberg intrinsic
rewards equate to Maslow's higher-level needs whereas the hygiene or extrinsic factors
are similar to his lower-level physiological and security needs.
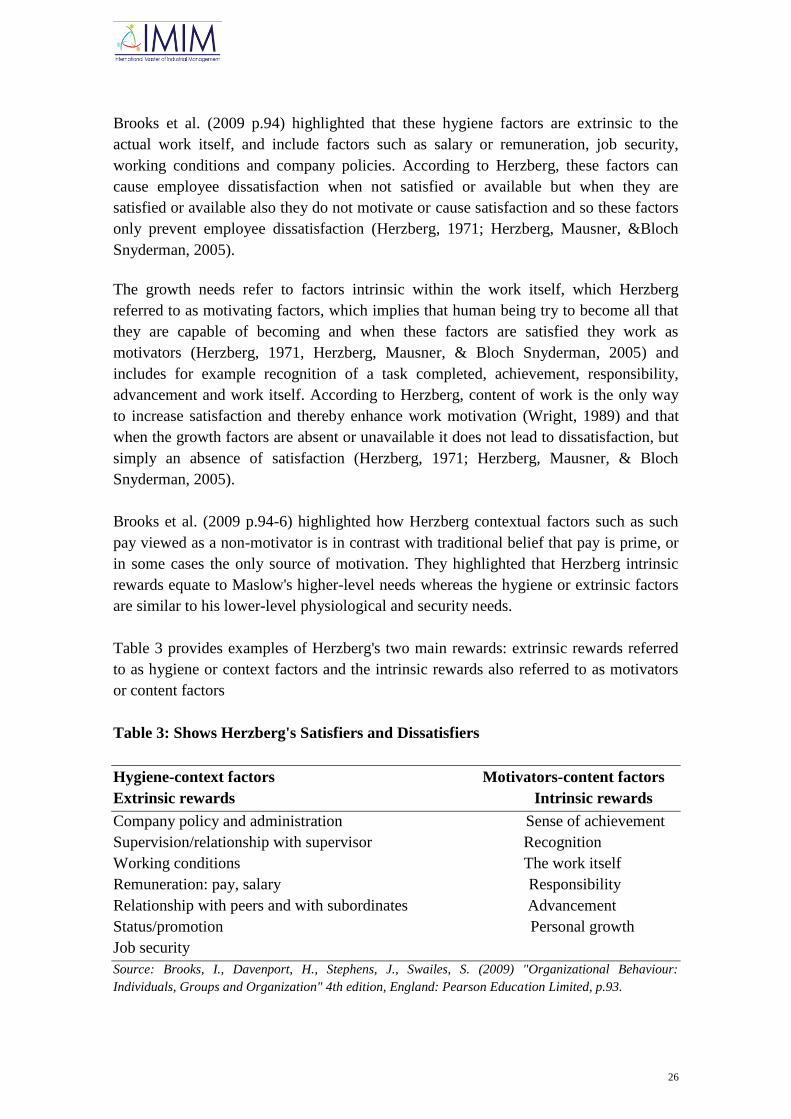
Table 3 provides examples of Herzberg's two main rewards: extrinsic rewards referred
to as hygiene or context factors and the intrinsic rewards also referred to as motivators
or content factors
Table 3: Shows Herzberg's Satisfiers and Dissatisfiers
Hygiene-context factors Motivators-content factors
Extrinsic rewards Intrinsic rewards
Company policy and administration Sense of achievement
Supervision/relationship with supervisor Recognition
Working conditions The work itself
Remuneration: pay, salary Responsibility
Relationship with peers and with subordinates Advancement
Status/promotion Personal growth
Job security
Source: Brooks, I., Davenport, H., Stephens, J., Swailes, S. (2009) "Organizational Behaviour:
Individuals, Groups and Organization" 4th edition, England: Pearson Education Limited, p.93.

27
Parsons and Broadbride‘s (2006) contextual-adapted study of work motivation in a
retail setting which examined key factors for job motivation and satisfaction for charity
shop managers found that the study supported Hertzberg Two-Tactor theory in that
managers exhibited high levels of satisfaction with intrinsic factors (e.g. variety and
challenge of the job, high degree of control) and lower levels of satisfaction with
extrinsic factors (e.g.pay, job status, working conditions).
DeShields, Kara, and Kaynak‘ (2005) in their study of determinants of business student
satisfaction and retention employed another adapted version of Herzberg‘s motivation
model and the principal findings of this study supported Hertzberg Two-Factor theory.
The findings from Balmer and Baum‘s (1993) study of guest satisfaction in the
accommodation environment (hospitality industry) indicated that that Herzberg‘s
model also poses as a relevant theory when attempting to understand guest motivation
in hospitality industry (Lundberg et al., 2009 p.892).
Lundberg, Gudmundson and Andersson (2009) in their study where Herzberg‘s Two
Factor Theory of work motivation was tested empirically on seasonal workers in
hospitality and tourism found that the findings from the study supported Herzberg's
Two-Factor theory of work motivation.
Some criticisms facing this Herzberg Two-Factor theory include its limited application
for non professional or manual workers, oversimplification of potential sources of
satisfaction and dissatisfaction (Wigdor, 1967) and flaws in methodology (critical
incident techniques). Pinder (1998) criticized Herzberg claim that job content or job
enrichment by for example responsibility, achievement, recognition and advancement is
the only way to increase work motivation (Furnham, Forde, & Ferrari,1999; Parson &
Broadbride, 2006; Wright, 1989) by asserting that hygiene factors, like salary,
interpersonal relations and working conditions may also act as motivators. Another
criticism facing the two factor theory is the failure in accounting for the individual
differences of needs and values in its explanation of work motivation (Parson &
Broadbride, 2006; Tietjen & Myers, 1998).
2.2.7 Needs Hierarchy
Maslow (1943) proposed that individuals are motivated to satisfy a set of needs which
are hierarchically ranked according to their salience. Abraham Maslow (1954) created
his five-level hierarchy of needs by observing the growth and development of students:
physiological needs, security, love and belonging, self-esteem and self actualization.
Implicit in the Maslow hierarchy is the belief that individuals will strive to seek a higher
need when lower needs are fulfilled (Brooks, et al. 2009, p.88). Maslow described the
four basic layer of his hierarchy of needs: physiological, security, love and belonging

28
and esteem as "deficiency needs" or "d-needs" needs and emphasized that with
exception of the physiological needs, if these "deficiency needs" are not met, the
individual feels anxious and tense though the body gives no physical indication.
Abraham Maslow introduced the concept Metamotivation which he used in describing
the motivation of people who go beyond the scope of the basic needs and strive for
constant betterment (Goble,1970 p.62) and emphasized that metamotivated people are
driven by B-needs (Being Needs), instead of deficiency needs (D-Needs). Abraham
Maslow referred to a person's most fundamental needs as survival or physiological
needs and includes air, food, clothing, and shelter and that unless these needs are met,
the person cannot progress on the continuum to achieve higher levels of growth and
development (Hamel, Leclerc, & Lefrancois, 2003; Freitas & Leonard, 2011 p.9).
When the physiological needs are met, the individual will switch attention in seeking a
higher order need, that of security and further fulfillment through affiliation with
others. Individuals who enjoy sufficient physiological, security and social affiliation
may then be motivated to seek esteem of others and self respect or self esteem before
finally attempting to self-actualize.
Hamel et al., (2003) described in moving from survival needs to more social
development needs, one of the highest levels is self-actualization, where persons are
concerned about their legacy, the needs of humankind, and how to make the world a
better place for its inhabitants.
Dearnley & Matthew (2007) emphasized that in the nursing student, self-actualization
may be evidenced by critically reflective behaviors that promote the care of patients and
society (Freitas & Leonard, 2011 p.10). Self-actualization, according to Abraham
Maslow, depends on having met underlying needs and looking outward from oneself to
humankind.
The theory has not enjoyed unquestioned empirical support (Hall and Nougain, 1968;
Lawler and Suttle, 1972) and a number of problems and deficiencies have been noted.
Research has indicated that as managers advance within organizations their need for
security and safety needs tends to decrease, whereas social, esteem and self-
actualization needs increase (Lawler and Suttle, 1972). The same research also suggests
that individuals rarely satisfy their higher-order needs and they continue to strive for
status and autonomy even after experiencing considerable success in these areas.
Hofstede (1984) criticized the model as highly ethnocentric due to the fact that it
neglects to illustrate and expand upon the difference between the social and intellectual
needs of those raised in individualistic societies and those raised in collectivist societies.
Following research in two companies, Lawler and Suttle (1972) suggested that the
needs hierarchy could be reduced to just two levels: Physiological needs and all other
needs.

29
Alderfer (1972), who adapted Maslow's approach to the workplace also proposed three
categories of needs: existences (basic survival needs); relatedness (including social
interaction and respect of and recognition from others); and growth (self-fulfillment,
autonomy and success).
Alderfer's model suggested that needs may be activated simultaneously, as opposed to
the strict, hierarchical sequence of Maslow. Alderfer also proposed that if higher needs
are not satisfied an individual will regress in pursuit of lower-level needs which he
referred to as frustration-regression effect.
2.2.8 McClelland's Achievement Needs Theory
McClelland's achievement needs theory is a trichotomy of needs theory that proposes
that the work behavior of most individuals is motivated by three needs: need for
affiliation, need for power and need for achievement (McClelland,1961; Harrell, et al.,
1984 p.241;Brooks, et al., 2009 p.90). McClelland's Human Motivation Theory is also
known as Three Needs Theory, Acquired Needs Theory, Motivational Needs Theory,
and Learned Needs Theory6.
According to McClelland, individuals develop a dominant bias or emphasis towards one
of the three needs and he illustrated this with an example that those with a high
achievement need tend to seek situations where they have personal responsibility for
solving problems, managing projects and for overall performance, where feedback is
often clear and rapid, where tasks are moderately challenging and where innovation is
required (Brooks, et al, 2009 p.90-1).
McClelland theory also suggests that even in adulthood motivation is changeable and
that this could be done through training (Hein 2009). Training initiatives, modifying
and enhancing self-images, and encouraging individuals to seek new job challenges and
responsibilities are all means companies could use to increase motivation in the
workplace in-order to allow employees to achieve (Bowditch, Buono 2005).
A large body of research performed by McClelland and his associates which spans over
twenty years provides empirical support for the theory (e.g., McClelland, 1961, 1965,
1970, 1975; McClelland et al., 1976; McClelland & Winter, 1969; McClelland &
Boyatzis, 1982). Harrell & Stahl (1981) and Stahl & Harrell (1982) also demonstrated
the Theory's validity in a number of environments.
6Mind tools: http://www.mindtools.com/pages/article/human-motivation-theory.htm

30
McClelland & Burnham (1976) suggested that individuals who possess large affiliation
needs in formal organizational leadership positions tend to experience internal conflicts
and this comes about when their desire for warm friendly relationships with their
associates conflicts with the disciplinary requirements usually inherent in a formal
leadership position.
McClelland & Boyatzis (1982) evidence presented indicated that senior executives with
large power needs tend to be more successful than their contemporaries and argued that
large power needs for senior executives mean the individual is actively interested in the
"influence game", in which a senior executive must participate if he is to perform well.
They emphasized that such individuals tend to focus upon influence relationships with
their peers and subordinates, rather than upon the details of tasks to be accomplished
(Harrell, et al., 1984 p.243).
McClelland and Boyatzis (1984) in their study in the USA found that successful
managers are associated with high power needs and lower achievement needs and that
power appears to be the main determinant of success, particularly when success is
measured in terms of status and promotion to senior posts (Brooks et al., 2009 p.91).
McClelland identified and distinguished between two types of power: socialized power
and personalized power and he referred to the former as useful in assisting managers
and leaders in their attempts to achieve organizational and group goals whereas the
latter only serves the individual in seeking his or her need for domination.
Both dimensions of McClelland's Achievement Needs Theory are only valid and more
applicable in Anglo-American settings, and as such the theory has been criticized for
being North American bias because of its assumption of two cultural dimension:
Willing to accept moderate risk which in itself excludes countries with high
uncertainty avoidance and regarding performance which applies to countries
with almost only high quality of life characteristics (Buelens, Sinding &
Waldstrøm, 2011).
Another criticism facing the McClleland Theory is the failure in addressing
gender differences as his critiques recognizes that most of his evidence relates to
boys and men like most behavioural science in the early years (Pinder, 2008).
31
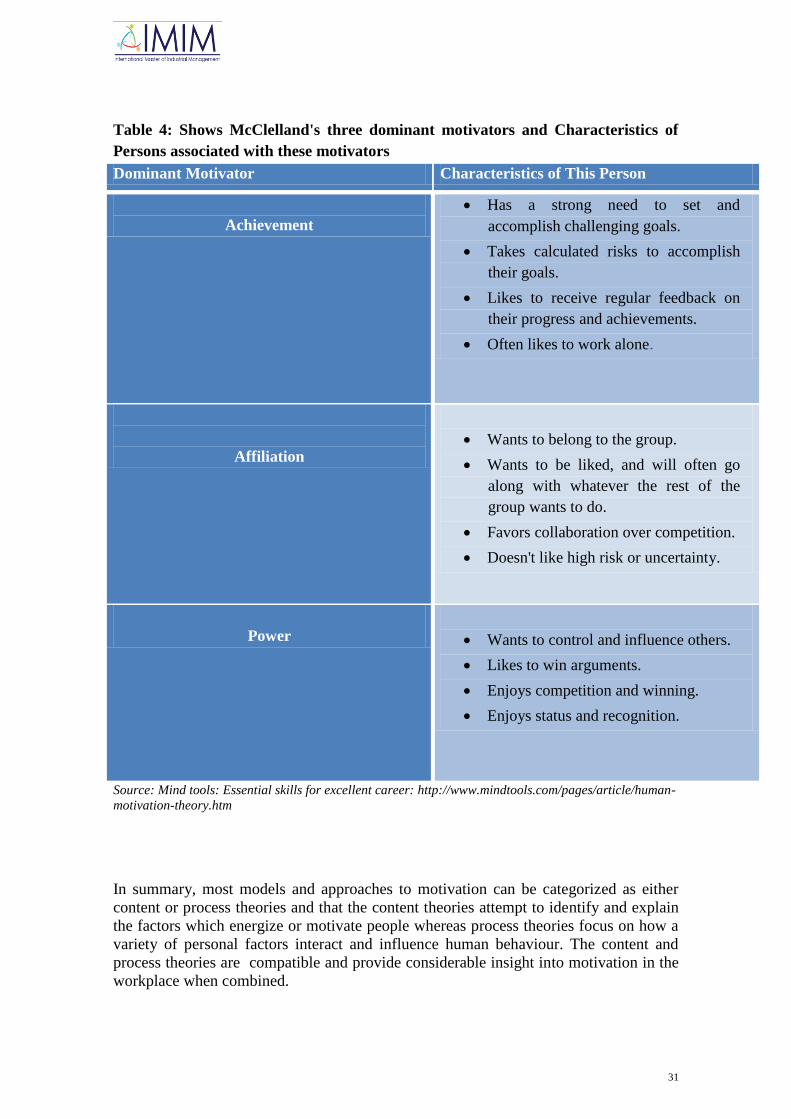
Table 4: Shows McClelland's three dominant motivators and Characteristics of
Persons associated with these motivators
Dominant Motivator Characteristics of This Person
Achievement
Has a strong need to set and
accomplish challenging goals.
Takes calculated risks to accomplish
their goals.
Likes to receive regular feedback on
their progress and achievements.
Often likes to work alone.
Affiliation
Wants to belong to the group.
Wants to be liked, and will often go
along with whatever the rest of the
group wants to do.
Favors collaboration over competition.
Doesn't like high risk or uncertainty.
Power
Wants to control and influence others.
Likes to win arguments.
Enjoys competition and winning.
Enjoys status and recognition.
Source: Mind tools: Essential skills for excellent career: http://www.mindtools.com/pages/article/human-
motivation-theory.htm
In summary, most models and approaches to motivation can be categorized as either
content or process theories and that the content theories attempt to identify and explain
the factors which energize or motivate people whereas process theories focus on how a
variety of personal factors interact and influence human behaviour. The content and
process theories are compatible and provide considerable insight into motivation in the
workplace when combined.

32
Herzberg Two-Factor theory would provide the opportunity to be able to understand
what reward factors when not available or inadequate could lead to dissatisfaction
among employees in the mining company and again when available has the highest
tendency in increasing employee satisfaction and motivation in the workplace.
McClelland's Achievement Needs Theory would also provide the guide and opportunity
in understanding the need for affiliation, need for power and need for achievement of
the employees in the mining company. Thus, the need for affiliation could be viewed as
Herzberg relationship with peers and subordinates (extrinsic/Hygiene-context factor)
where as the need for power and achievement could be viewed as Herzberg authority
and responsibility and sense of achievement ( intrinsic/motivator-content factors) which
would guide in assessing what brings about dissatisfaction, satisfaction and motivation
among employees in the mining company.
The needs Hierarchy would also offer the opportunity and guide in understanding the
Maslow deficiency needs or d-needs ( physiological, security, love and belonging and
esteem) which covers the basic survival needs referred by Herzberg as the Hygiene-
factors or context factors (such as salary and interpersonal relations) when assessing
what constitutes dissatisfaction in the mining company. Also, the theory provides the
opportunity in understanding Maslow higher level need referred to as the being needs or
"b-needs" (self actualization) which represent Herzberg growth needs referred to as
motivator or content factors (such as autonomy, sense of achievement, etc) which
would provide the opportunity in assessing what constitute employee satisfaction and
motivation in the workplace.
Adam Equity Theory would provide guide and opportunity in understanding how
people who are uncertain about their opinions and ability in the workplace would go
about evaluating themselves by comparing themselves to similar others. Thus, the
theory provides the opportunity to understand how employees compares their
input/output ratio with similar other people in order to judge whether the situation is
equitable or even favourable and the opposite effect (under-reward inequity).
Locke Goal Theory would provide the guide and opportunity in understanding what
conditions would lead to high motivation and performance in the mining company. The
theory stipulates that for high motivation and performance to be achieved in the
workplace, individuals must be set specific goals which are challenging, but acceptable
and receive feedback on performance.
The Porter and Lawler Expectancy model would provide the guide and opportunity in
understanding the relationship between employee satisfaction and performance in the
mining company under the basic underlying assumption that if performance in an
organization results in equitable and fair results, people will be more satisfied and that
performance is a product not only of effort but also of the individual‘s abilities and
characteristics together with his or her role perception.

33
2.3.0 Behavioural Management Perspective
From the behavioural management perspective, reward is a management control tool
that employers use in achieving desired behaviours from their employees in the
workplace. The term reward is therefore a tool for effective management in the
workplace and according to Steven Kerr (2004), Chief Learning Officer, Goldman
Sachs, ―One of the primary principles of effective management is that rewards should
be the third thing you work on as measurements come second, and both rewards and
measurements being subordinated to performance definition; i.e. clear and unambiguous
articulation of what needs to be done‖ Merchant K.A et al (2007 p.393).
Merchant K.A et al (2007 p.394) emphasized that performance-dependent rewards, or
incentives, provide the drive and impetus for the alignment of employees‘ natural self-
interests with the organization‘s objectives and serves three types of management
control benefits: Informational or effort directing purpose; motivational or effort
inducing purpose and personnel-related.
2.3.1 Informational or Effort directing purpose
Merchant et al (2007 p.394-395) elaborated that rewards have the ability and capacity to
catch employee's attention (attract), update and enlighten or remind them of the relative
importance of often- competing results areas, such as cost, quality, customer service,
asset management, and growth.
2.3.2 Motivational or effort inducing purpose
Merchant et al (2007, p.395) elaborated that some employees need incentives to bring to
bear the extra effort required to perform tasks well; that is, to work hard, do a good job,
and succeed. Skinner (1969) makes a point that offering rewards in exchange for hard
work, especially in service industries such as banks and other establishments in the
hospitality sector, is very important when it comes to influencing the perceptions of
employees. Skinner highlighted that the offered rewards has the capacity to shape
employees perception on how they value certain concepts.
2.3.3 Personnel-related purpose
Merchant et al (2007 p.395) emphasized that many employees‘ total compensation
packages are constituted by vital performance-dependent rewards and that organizations
promised some rewards because they wants to improve employee recruitment and
retention either by offering a package that is comparable or superior to those offered by
their competitors or by linking payments to an employee‘s continued employment.
34
He also highlighted that some firms also obviously offer compensation packages with
below average base salaries but with performance-dependent compensation elements
(variable pay) that provide the opportunity to earn above average total compensation if
excellent performance is forthcoming.
They also emphasized that these packages tend to appeal to employees who are
entrepreneurial, rather than risk averse, and those who are confident about their abilities
to produce superior results and as such these efforts to use compensation packages to
attract and retain a higher quality set of employees often form a key element of firms‘
personnel control strategy.
Merchant et al (2007 p.395) also outlined the non-control purposes served by incentive
systems and established that incentive systems that are performance-dependent make
compensation more variable with firm performance and in effect produces desirable
effects of
decreasing cash outlays when performance is poor
Smoothing earnings – compensation expense is lower when profits are lower.
They also emphasized that Incentive system design choices can also affect a firm‘s tax
payments and that some forms of compensation are not deductible for tax purposes, and
some deductions also are limited.
2.3.4 Overview of the Various Types of Reward
Gerhart and Milkovich (1993) classified the various reward programs as practiced and
researched on a number of dichotomous dimensions such as intrinsic versus extrinsic,
individual versus system wide, monetary versus nonmonetary, and fixed versus variable.
2.3.5 Intrinsic and Extrinsic Rewards
Chen et al (1999 p.48-49) highlighted that Intrinsic rewards are those rewards that an
individual experiences through performing a job well (e.g., feelings of competence,
autonomy) whereas extrinsic rewards are inducements or enticements (e.g., a bonus, a
commemorative plate) that organizations offer for good job performance. They also
classified work content factors such as autonomy and responsibility as intrinsic and
work context factors such as pay, job title and tenure as extrinsic factors. They also
subdivided extrinsic rewards into monetary and nonmonetary (socio-emotional).

35
2.3.6 Monetary and Nonmonetary Rewards
Chen, et al (1999 p.49) literature outlined the difference between these two rewards by
emphasizing that monetary rewards such as a pay raise, bonus, and stock options are
those that have substantial cash value whereas nonmonetary rewards such as awards and
recognition for good performance are symbolic rewards, satisfying socio-emotional
needs.
2.3.7 Collective and Individual Rewards
Chen, et al (1999 p.49) literature also outlined the difference between these two rewards
by emphasizing that system-wide rewards are those that are provided by the
organization to a broad classification of employees and includes but not limited to
medical insurance and profit sharing whereas Individual rewards are those provided to
particular individuals but not to all individuals in a category, such as a merit salary
increase. They also instigated that a variant form of the system-wide versus individual
reward distinction is the group versus individual-based rewards of which they
emphasized that individual-based rewards tend to be more differential (large difference
among individual members) as they are contingent upon individual performance
whereas group-based rewards are more egalitarian (small as they are contingent upon
group or organizational performance.
2.3.8 Fixed and Variable Rewards
Chen, et al (1999 p.49) literature also outlined the difference between these two rewards
by emphasizing that fixed rewards refer to rewards that are added onto base salary, such
as a merit pay increase and that variable rewards are rewards provided one time only,
such as a merit bonus. WorldatWork ―The Total Reward Association‖ also emphasized
that fixed pay is also known as base pay and that it is a nondiscretionary compensation
which does not vary with employee performance or result achieved. The organization
also established that variable pay is also known as ―pay at risk‖ as it changes directly
with employee level of performance or result achieved and it‘s a one-time payment that
must be re-established and re-earned each performance period7.
7 WorldatWork "The total Reward Associaation"
http://www.worldatwork.org/waw/home/html/compensation_home.jsp

36
2.3.9 Positive and Negative Rewards
Merchant, et al.(2007) defined the term reward as referring to things that employees
value (positive rewards) and he also referred to the negative rewards that organisation
sometimes provide as punishments. Below, Merchant, et al.(2007) illustrated good
examples of the positive and negative rewards of which most of them were
nonmonetary rewards with few monetary rewards.
Table 5 below illustrates some monetary and non-monetary rewards used in the
workplace. Money is an important form of reward which at the managerial
organizational levels is often linked to performance. Merchant, et al (2007 p.396)
classified monetary rewards into three categories: Salary Increases, Short term
Incentives and Long term Incentives.
Table 5: Shows Examples of some Positive and Negative Rewards used in
organizations.
Positive rewards Negative rewards (punishments)
Autonomy Interference in job from superiors
Power Loss of job
Opportunities to participate in import. Zero salary increase
decision-making processes Assignment to unimportant tasks
Salary increases Chastisement (public or private)
Bonuses No promotion
Stock options Demotion
Restricted stock Public humiliation
Praise
Recognition
Promotions
Titles
Job assignments
Office assignments
Reserved parking places
Country club memberships
Job security
Merchandise prizes
Vacation trips
Participation in executive development
programs
Time off
Source: Merchant, et al. (2007), "Management Control Systems: Performance Management, Evaluation
and incentives" 2nd edition, p. 394
37
2.4.0 Salary Increases
Merchant, et al (2007, p.396) argued that employees at all organizational levels are
offered salary increases by their employers which represent a small proportion of
employee‘s salaries but yet have considerable value as they represent not just a one-time
payment but rather provide an annuity that typically persists for many years as
employees salaries are rarely reduced. They also outlined that a portion of these salary
increases represent cost-of-living adjustment whiles the remainder represent merit-based
increases demonstrated through performance or the acquisition of skills that promise
improved performance in the future.
Several surveys such as Mercer Human Resource Consulting (2006 p.14-16)
"Worldwide Pay Survey" show that salary increases remain relatively stable over time
and are, on average, in the 2 to 3% range above inflation worldwide, although there is
quite some variation across countries depending on economic growth and labor market
conditions.
2.4.1 Short term incentives
Short-term incentives are often called annual incentive pay or bonuses which provides
cash payments based on performance of an individual or that of a group of which an
individual is a member, such as a work team, profit center, or even the firm as a whole
measured annually or less.
Merchant, et al (2007) highlighted that surveys carried out by Mercer Human Resource
Consulting (2006)"Worldwide Pay Survey, Hewitt Associates (2005/2006) "Salary
Increases Survey", and Work span (2005) indicates that while salary increases have
been mostly flat, or even declining, in recent years, the use of variable pay is on the
rise.
They also emphasized based on Towers Perrin (2005/2006 Worldwide Total
Remuneration Survey Report) among other survey reports that short-term incentives,
such as bonuses, commissions, and piece-rate payments are used nearly by all US firms
above minimal size, and increasingly larger firms in many other countries. They also
highlighted that companies which have at least one kind of short-term incentive plan
constitutes nearly 80%.
They also emphasized that short-term incentive awards constitute a large proportion of
the total annual compensation of higher-level managers or executives. A recent survey
among 13,500 executives of about 1,700 US firms across industries shows that 69% of
executives received annual bonuses and that the average bonus paid was 38.7% of base
salary.

38
2.4.2 Long-term incentives
Merchant, et al (2007 p.397) described long-term incentive as awards based on
performance measured over periods greater than one year with the primary objective in
rewarding employees for their role in maximizing the firm‘s long-term value and in
addition motivating employees in contributing to the firm‘s long-term success.
They also emphasized that long term incentives aim in attracting and retaining key
talent by making total expected compensation more lucrative; by encouraging employee
ownership of the firm; and by tying incentive payouts to service period requirements.
They argued that these rewards are restricted to relatively high levels of management
because the long-term success of the firm is more easily attributable or sensitive to
employee actions.
WorldatWork "The Total Rewards Association" also described long term incentive pay
as a form of variable pay, designed to focus and reward performance over a period
longer than one year and include stock options, restricted stock, performance shares,
performance units and cash8.
Merchant, et al (2007 p.397) highlighted that the most common long-term incentive
awards are equity-based which provide rewards based on changes in the value of the
firm‘s stock and includes the following: Stock option plans; Restricted Stock plans,
Performance Stock plans and Stock Appreciation plan.
2.4.3 Stock option plans
Stock option plans give employees the right to purchase a set number of shares of
company stock at a set price (i.e. the exercise or strike price) during a specified period
of time (i.e. after the options vest but before they expire).
Although stock option terms vary across firms, most options are granted at the money
(i.e. the exercise price is equal to the stock price on the day of grant) with a three to
five-year vesting rate (i.e. one third, one fourth, or one fifth of the options granted,
respectively, vest at the end of each of the first three, four, or five years), and a 10 - year
maturity (i.e. the options expire 10 years after they are granted).
When the stock price is above the option exercise price, the stock options are said to be
in the money and the employee can exercise the vested options and either hold the
8 WorldatWork "The Total Reward Association"
http://www.worldatwork.org/waw/home/html/compensation_home.jsp

39
shares or sell them with a gain. However, when the strike price of vested options is
higher than the stock price, the options are said to be underwater. Rather than having
motivational effects, underwater options often are a source of major retention and
morale problems, particularly if the firm‘s stock price malaise is deemed to persist.
While employees desire stock options because of the size of the potential gains, stock
options also have several attractive features for the granting firms. From an incentive
perspective, employees only benefit when the stock price goes up, so stock options
motivate employees to increase their company‘s stock price. This improves incentive
alignment as employees only benefit when shareholders benefit; that is, when the stock
price goes up and presumably value has been created.
Moreover, the potential for share ownership associated with stock options also affects
alignment by tying some of the employee‘s wealth to the company‘s future.
Finally, vesting schedules coupled with service-based restrictions that cause employees
to forfeit unvested options when they leave the firm are believed to both enhance
employees‘ long-term focus on the business as well as retention. Thus, stock options get
employees to think more like owners while enhancing retention of talent.
Stock options also allow the firm to provide incentive compensation without cash
outlay, which makes stock options a particularly attractive arrangement for small,
growing firms because it allows them to defer compensation costs.
2.4.3.1 Restricted stock plans
Deloitte (2005) indicated that the first choice of majority of the firms surveyed for
alternative forms of long-term equity-based incentives to replace traditional stock option
plans was restricted stock.
Restricted stock unlike stock options which only provide a reward when the stock price
exceeds the exercise price, has value when the stock price is flat or even declines.
Because full-value stock awards like restricted stock have less risk than stock options,
the firm can issue fewer shares compared with traditional stock options, thus causing
less dilution.
But for the same reason, restricted stock has been derided as a giveaway or pay-for-
pulse (rather than pay-for performance) because the restrictions on selling the stock
disappear over time even if the employee does little more than showing up for work.
For this reason, restricted stock is said to affect the retention rather than motivation of
employees.

40
2.4.3.2 Performance stock plans
To eliminate the giveaway perception of restricted stock and accentuate pay-for
performance, some firms have gravitated towards performance awards by making their
stock grants contingent on the achievement of stock or non-stock goals over a multiyear
performance period.
Types of performance awards include performance shares, performance share units, and
performance option. Performance options stem from alternative stock option plans that
make vesting or exercise of the options contingent on improvements in stock or
nonstock goals. Performance options come in different forms.
Premium options have exercise prices greater than the stock price on the grant date.
Indexed options have exercise prices contingent on performance relative to a peer group
of firms. Performance-vested options link the vesting of the options to the achievement
of performance targets, such as return on equity, earnings per share, or other financial or
operating measures (e.g. sales growth).
2.4.3.3 Stock Appreciation Plans
Stock Appreciation Rights (SARs) are similar to options in that the employee benefits
from appreciation in the company‘s stock price. They are different in that the employee
does not have to spend cash to acquire the stock.
But like stock options, the employee typically can exercise the SAR at any point during
the term (typically 10 years) after any specified vesting period. When the SAR is
exercised, the firm pays the employee cash (Cash SARs), stock (Stock SARs), or a
combination of both, in an amount equal to the stock‘s appreciation since the date of
grant. There are many other possible long-term incentive instruments, but most are
variants of stock options, restricted stock, performance awards, or stock appreciation
plans. Evidence suggests that approximately 50% of firms use more than one long-term
incentive.
In summary, the consideration of rewards system from the behaviour management
perspective which view reward as a third management control tool which comes after
performance and measurement respectively would provide the guide and opportunity in
achieving certain desirable behaviours in the mining company.
The consideration of performance-dependent rewards or incentive would provide the
generally understand of the three purposes served by these incentives: Informational or
effort directing, motivational or effort inducing and personnel-related purposes.

41
According to the behavioural management perspective, rewards may be positive and
negative and that the negative rewards are referred to as punishment. All forms of
rewards that employees value in the workplace are called positive rewards. The
understanding that rewards may be positive or negative provides the guide and
opportunity in understanding which choice of reward to go for in achieving a particular
behaviour in the workplace. According to behavioural management principles,
incentives, such as money, feedback and social recognition, have an effect on
employees‘ task performance.
The understanding according to the behavioural management perspective that incentives
may be defined as either short term or long term is very crucial when it comes to
selecting incentives in achieving certain behaviours in the workplace. Short term
incentives are often called annual incentive pay or bonuses which provides cash
payments based on performance of an individual or that of a group of which an
individual is a member, such as a work team, profit center, or even the firm as a whole
measured annually or less.
Long-term incentive are awards based on performance measured over periods greater
than one year with the primary objective in rewarding employees for their role in
maximizing the firm‘s long-term value and in addition motivating employees in
contributing to the firm‘s long-term success. The most common long-term incentive
awards are equity-based which provide rewards based on changes in the value of the
firm‘s stock and includes the following: Stock option plans; Restricted Stock plans,
Performance Stock plans and Stock Appreciation plan.
2.5.0 Total Reward Strategy
Cox et al.(2010, p.251) stated categorically that strategy is supposed to be about choice
and competitive differentiation, which is undermined when reward practices are simply
benchmarked and copied unthinkingly.
Designing and implementing a new reward strategy is a big challenge for many
organizations as they do not have even a written strategy. According to the U.K.
Chartered Institute for Personnel and Development‘s (CIPD‘s) recent annual reward
management survey of nearly 500 organizations (2007, p. 3), only 35% have a written
reward strategy. Moreover, 91% of managers surveyed believed that implementing a
reward strategy was difficult or extremely difficult (CIPD, 2007, p. 3). Reported
problems center on external environmental and regulatory changes, coupled with
perceived resistance from line managers and this is consistent with research that shows
slippage between the adoption and implementation of reward strategies.
Suff and Reilly (2004) provided a detailed review of the perils and pitfalls of variable
pay systems and Suff, Reilly, and Cox (2008) reviewed in detail the many problems

42
found in implementing individual performance related-pay (IPRP). Even in financial
service companies, which possess some of the characteristics most likely to support
IPRP.
Lewis (1998) found significant negative effects of pay systems on employee motivation
and performance. Cox (2005) carried out a comparative case-study analysis of three
types of variable pay system. The managers involved reported that the pay systems did
not have as much impact as they had hoped and, in many cases, had created damaging
side effects—for example, on teamworking.
Werner and Ward (2004) literature review conclusion of a large number of articles in
mostly U.S. journals emphasized that: ―The research on motivation shows that
individual incentives are positively related to work motivation, but the strength of the
relationship is overestimated and it may reduce intrinsic motivation in certain specific
situations‖ (p. 213).
Burgess and Metcalfe‘s (1999) meta-analysis of research on incentives from all over the
world leads them to conclude that ―employees do respond to cash incentives‖ but ―often
in sophisticated ways that may or may not benefit the organization‖ (p. 4). In the United
Kingdom, Brown and Nolan more damningly put it, ―research literature on the
consequences of cash incentives is generally . . . repetitive and disillusioning‖
(1988, p. 351).
Gerhart and Rynes (2003) tackled the problem that the focus on pay may be
counterproductive by pointing out that some research suggests that individuals who
place a higher relative value on pay may have characteristics that make them
undesirable for many roles. For example, they may be more risk seeking and have a
tendency to low organizational commitment. Blinder‘s (1990, p.7) advised the general
workforce population by emphasizing that ―changing the way employees are treated
may have more impact than changing the way they are paid‖ .
Cox et al. (2010, p.252) in their effort in trying to remedy the situation that "if it is
likely that managers are spending too much time trying to incentivize employees with
financial rewards and agonizing over the design of bonus schemes whose effectiveness
may be limited, why is this?" proposed three solutions which are as follows:
Firstly, managers are obsessed in connecting reward strategy to business
strategy, which had been the Holy Grail of reward since the early 1990s.
Secondly, research that might point us in a different direction away from
financial reward to influence employees is systematically ignored due to the
dominance of particular disciplines within management and business.

43
Thirdly, identifying, prioritizing, and implementing alternative methods of
influencing behavior to financial reward are even harder for managers than
wrestling with the minutiae of pay-system modeling, and they often appear to
lack the skills to create a totally rewarding context that can help to engage their
staff and encourage high performance.
Cox et al.(2010, p.252) in their effort in examining whether employee views are
neglected in the formulation of reward strategies, they emphasized that employee
expectations for involvement in reward systems are likely to be influenced by national
cultures. Employees in countries with more collective orientations to decision making
may not expect or want direct involvement, but they may expect managers to make
decisions that will meet their needs. In countries without strong collective bargaining,
employee involvement in reward-system design is often missing, with fewer than 10%
of employees contributing according to one U.K. survey (CIPD, 2006). The CIPD not
surprisingly found that 30% of organizations subsequently reported staff attitudes as a
barrier to the successful operation of the reward strategy (CIPD, 2006).
Werner and Ward (2004) were more skeptical and noted the paucity of research
investigating how organizational culture influences the development of reward systems.
Cox et al. (2010) emphasized that even where employees are offered voice in relation to
reward, it tends to consist of two narrow types with the First being the consideration of
employee preferences, which refers to their choices within a heavily circumscribed
system, exclusively consisting of material and mostly financial rewards.
Even research exploring cultural variations in attitudes to reward also seems remarkably
fixated on comparing perspectives on pay systems in different countries
(Mamman, Sulaiman, & Fadel, 1996). This work asks about ―within-system‖
preferences that offer the opportunity to influence design of scheme, but not the choice
of scheme itself.
O‘Neill (1995, p. 110) emphasized that even in common models to develop a total
reward strategy, employee views and preferences do not generally appear at all within
the ―workforce demographics‖ category. Discussions of total rewards in companies
often seem to focus very narrowly on flexible benefits arrangements, which, again, are
often implemented in a provider-led, relatively generic and packaged way, offering
employees relatively narrow choices as to the makeup of their rewards.
Reilly and Brown (2008, p. 43) argued that often there is little empirical or even
theoretical basis for much of the organizational activity on employee engagement, and
the link with reward practices is ―an under-emphasized, under-leveraged and still
misunderstood area.‖

44
Cox et al. (2010, p.256) emphasized that recent work on the concept of employee
―engagement‖ by both the Institute for Employment Studies and the CIPD in the United
Kingdom has shown that pay and benefits do not tend to appear as the most important
items in predicting positive employee behaviors, although little research has been
located that explores this concept in the rest of Europe.
Robinson et al. (2007) showed that feeling involved in and valued at the workplace,
together with job satisfaction, are the most important elements here. Ambrose and
Kulik‘s review also reports some evidence to show that praise and recognition from
supervisors had positive effects in improving employee performance across a variety of
occupations, but go on to note that research into this kind of reinforcement theory is in
its infancy (1999, p.266).
Smith, and Hansen (2002) emphasized that once employees are recruited, there is a
sharp distinction between the function of reward and recognition in organizations, using
the work of the motivation theorists to underpin them and also argued that reward
systems function as control mechanisms and will only yield minimally compliant
behaviors, whereas recognition mechanisms are more likely to reward exceptional effort
appropriately.
In summary, strategy offer sustainable competitive advantage for companies and that
companies must endeavour to differentiate their strategy from others in-order to reap
this benefit. The review of total reward strategy literature would provide a guide and
opportunity in understanding the various factors which had accounted for failures in
many companies and organizational-wide reward strategies. This would offer the
opportunity to cross check whether the case study company is not suffering from the
same problem

45
Table 6: Total Reward Strategy and Definition
Total Rewards Strategy Definition
COMPENSATION
Base pay
Merit pay
Incentives
Promotions
Pay Increases
Wage and Salaries
Base-pay increases based on employee
performance
Cash bonuses based on employee
performance
Base-pay increases based on potential to
perform new job
Base-pay increases based on length of
service with the organization
BENEFITS
Health and welfare
Paid time off
Retirement
Payment for injuries and illness both on
and off the job
Payment for vacation time or excused days
from work
Payment for work no longer performed
based on length of employment
PERSONAL GROWTH
Training
Career development
Performance management
Skill development through on- or off-the-
job instruction
On-the-job coaching to develop skills
Ongoing goal setting and feedback to
develop skills Source: Heneman, R.L (2007) " Implementing Total Rewards Strategies: A guide to successfully planning
and implementing a total rewards system" SHRM Foundation’s Effective Practice Guidelines Series, p.3

46
CHAPTER THREE
3.0 METHODOLOGY
3.1.0 The Setting-Corporate Profile of Golden Star Resources
Golden Star Resources (GSR) is a mid-tier gold mining company over a quarter-century
in age and total historical production of over two million ounces of gold. The Company
has two operating mines situated along the prolific Ashanti Gold Belt in Ghana, West
Africa. The company has a long-term commitment to sustainability with particular
emphasis on health, education and the environment.
Golden Star‘s goal is to grow its business in Ghana, other selected countries in West
Africa through organic growth and accretive acquisitions. The Company is well
financed and has a strong, experienced and operationally focused management team.
Golden Star Resources is currently running exploration and gold production activities in
the following countries: Ghana, Burkina Faso, Cote d'Ivoire, Niger, Sierra Leone,
Suriname and Brazil9.
3.1.1 Corporate Strategy
Since 1999 Golden Star has successfully transitioned from being a focused gold
explorer into a mid-tier gold producer, while still maintaining an emphasis on
exploration. The Company expects to grow its gold business with a continuing focus on
organic growth from the exploration and development of existing assets.
Recognizing that consolidation can lead to improved fundamentals and increased
competitive strength, Golden Star is open to transactions that bring producing and
exploration assets which have synergy with the Company's existing activities and will
improve shareholder value10
.
3.1.2 Vision and Values
To build a brand name mining company that:
Delivers superior returns to investors
Attracts and retains the best talent
Is committed to international best practices and conduct, and
9 Golden Star Resources Corporate Profile: http://www.gsr.com/Corporate/Index.asp
10 Golden Star Resources Corporate Strategy: http://www.gsr.com/Corporate/CorporateStrategy.asp

47
Is a partner of choice for host communities and governments11
.
3.1.3 The HR Configuration of Golden Star (Bogoso/Prestea) Limited
The HR configuration of Golden Star Resources include a broad range of HR practices,
such as staffing, learning, training and development, performance appraisal,
compensation and rewards, job design, internal promotion, job security, information
sharing and participation. GSR understands and recognizes it employees as the
company greatest asset and that in response to pressures from competitors, shareholders,
and customers, Golden Star Resources seek to increase its output, performance and
competitiveness in the market by leveraging the full capabilities of all employees. Thus
Golden Star Resources considers its human resource as key asset that constitute a source
of competitive advantage.
Golden Star Resources treat human resource management as a set of complementary
practices aligned with the firm‘s goals and strategies as means of providing the
company a basis of competitive advantage. GSR contingency of strategic approach
emphasizes the need for the HR practices to be contingent upon the company's business
strategy in order to be effective. Thus the company integrate the HRM with business
strategy more effectively to gain competitive advantage.
Golden Star Resources HR practices are configured on a mix of approaches such as the
resource-based, control based and market based.
The resource based view is geared towards the internal development of employee
competencies as opposed to the market acquisition of such competencies. GSR internal
development HR system is characterized by extensive training, promotion within,
developmental appraisal, skill-based pay and job security (contract jobs & permanent).
The control-based focuses on monitoring of employee behaviours, employees
compliance with process-based standards. The process-based standards can be divided
into two alternatives: process-oriented control or outcome-oriented control. GSR
Outcome-oriented control is characterized by extensive long-term rewards such as
stocks, long service awards (5 yrs of continuous service), employee participation and
involvement. GSR process-oriented control is characterized with fixed and explicit job
design, formalization evaluation through carefully prescribed job requirement and
efficiency based reward.
Golden Star Resources also embarks on Market- based HR system which emphasizes
staffing and deployment of skills for immediate contribution with some reliance on
11
Golden Star Resources Sustainability Report 2010:
http://www.gsr.com/PDFs/GSRAnnualSustainabilityReport2010.pdf

48
external labor market for securing the right people to do the jobs. This approach is used
to staff or deploy the right skills from the market when GSR has no suitable internal
candidate to fill a particular position. Thus GSR has employer brand of internal
recruitment of staff for available positions before consideration of the general public.
Also based on the value and uniqueness of employee skills, GSR HR configurations
could be categorized into four: commitment-based, productivity-based, compliance-
based, and collaborative-based:
GSR Commitment-based HR system fosters employee involvement and maximizes the
company's return on human capital investments. Here, GSR invest substantially in its
employees to develop unique skills in their current role through extensive training
initiatives. GSR encourages the employees to learn and master specific competences in
their very role. Pay are designed to link to job grade (seniority-based) and not based on
performance on the job. Therefore employees seek to excel in their current position
through good appraisal result to enable them to be moved to better job grades.
GSR Compliance-based HR activities focus on securing compliance with the terms and
conditions and that GSR HR activities concentrate on enforcing rules /regulations, along
with the attainment of pre-establish standards. Training and compensation are likely to
be job-based.
GSR collaborative-based HR systems encourage cooperation, collaboration and
information sharing between superiors and subordinates. The annual bonus scheme in
the form of financial reward (monetary) is awarded on individual basis based on
Companywide-performance. It is calculated based on the individual job grade (number
of months of employee job grade monthly salary, eg 2 months employee monthly
salary, 3 months employee monthly salary). The appraisal result also determines to
some degree the employee chances of promotion to a better job grade than his/her
current job grade. GSR encourages subordinates and superiors to develop trust and
collaboration with each other in accomplishing their duties as employees.
With the productivity-based, GSR after recognizing it does not have the persons with
the requisite skills quickly enter the external labor market to recruit people with the
requisite skills in order to keep productivity levels ongoing. Thus, in this scenario, the
company in some cases does not wait to develop people within the company for such
positions as delays could affect productivity levels and companywide performance and
in effect shareholder returns.
GSR uses cost reduction business strategy which involves striving in exploring and
producing cheaply than competitors by relying heavily on the experiences and
investment in its talents in gaining competitive advantage in areas such as employee
retention, recruitment and selection, manpower availability, etc. GSR HR practices for
cost reduction strategy maximize efficiency by using narrowly design jobs, close
monitoring and some level of Learning, training and development.
49
3.2.0 Research Design
The research was based along the continuum of positivism main paradigm. According
to Collis and Hussey (2009, p.55-57), a research paradigm is a framework that guides
how research should be conducted, based on people's philosophies and their
assumptions about the world and the nature of knowledge. Positivism is a paradigm that
originated in the natural sciences and is underpinned by the belief that social reality is
independent of people and the goal is the discovery of theories based on empirical
research. The philosophical assumptions underpinning the positivism paradigm of this
research study are the ontological, axiological and the methodological assumptions. The
ontological assumption considers that social reality is objective and external to the
research and that there is only one reality. The axiological assumption considers that
research is value-free and unbiased. The methodological assumption considers that the
process of research is deductive and the research is context free and that generalizations
lead to prediction, explanation and understanding and the results are accurate and
reliable through validity and reliability.
The researcher used a combined methodology of qualitative and quantitative study
embedded in a case study company and that the research was not very interpretivistic,
rather positivistic because there exists data out in the world which could be captured.
The data collection methods employed in this research study were questionnaire survey
and structured interview with the Human Resources and Administration Manager. This
implies that the researcher employed triangulation and to be more specific
methodological triangulation as more than one method (multiple sources of data) was
used to collect the data in this research study.
According to Easterby-Smith, Thorpe and Lowe (1991), methodological triangulation is
when more than one method is used to collect and/or analyze the data, but it is
important to choose from the same paradigm (Collis and Hussey 2009, p.85).
According to Collins and Hussey (2009, p.144), under a positivist paradigm, interviews
are structured, which means the questions are planned in advance (as in a questionnaire)
and all types of interviews can be conducted with individuals or groups, using face-to-
face, telephone, email or video conferencing methods. The distribution method
employed in the distribution of the questionnaire to the respondents was a face- to -face
method. Collins and Hussey (2009, p.193) emphasized that face-to-face method of
questionnaire distribution offers the advantage that response rates can be fairly high and
comprehensive data can be collected. The data obtained from this natural setting using
the questionnaire survey and the structured interview thus represents a primary source
of data.

50
3.2.1 Sample Size Determination
The unit of analysis is basically employees of Golden Star (Bogoso/Prestea) Limited
(GSB/PL). A sample of 278 employees was drawn from a population of 1029
employees based on Krejcie and Morgan (1970, p.610) and Collis and Hussey (2009,
p.210-11) minimum sample size determination.
According to Krejcie and Morgan (1970, p.610) and Collis and Hussey (2009, p.210-
11), ―the minimum sample size to allow results from a random sample to be generalized
to the population is much higher for a small population than it is for a large population
and that as the population increases, the sample size increases at a diminishing rate and
remain relatively constant at slightly more than 380 cases‖. The table shown below at
the end of this methodology section provides a structured way of determining the
sample size from a given population.
The Human Resources and Administration Department of Golden Star (Bogoso/Prestea)
Limited supplied the sampling frame from which the sample size of 278 was drawn.
The sampling frame supplied by GSB/PL Human Resources Department indicated that
GSB/PL has a total of 1029 employees of which 56 (5.4%) are in the management
category, 159 (15.5%) are senior staffs, 804 (78.1) % are junior staffs and 10 (1.0%) are
trainees. The sampling method used in this study was stratified sampling.
According to Collis and Hussey (2009, p.212), "Stratified sampling overcomes the
problem that a simple random sample might result in some members of the population
being significantly under-or over-represented and it does this by taking account of each
identifiable strata of the population. Based on the stratified sampling method, the
following percentages (5.4%, 15.5%, 78.1% and 1.0%) were then found out of the 278
sample size to establish the number of employees in each category to be sampled. Based
on this information, only 15, 43, 217 and 3 employees representing management, senior
staff, junior staff and trainees respectively from each category were sampled. In total
278 questionnaires were administered to the employees and in totality, it took seven
weeks to receive all the questionnaires from the respondents. The response rate was
found to be 100% as all the respondents finally handed in their responses though some
took longer time in handing over their responses. The 100% response rate could be
attributed to a number of factors such as the face-to-face method of questionnaire
distribution. Collins and Hussey (2009, p.193) emphasized that face-to-face method of
questionnaire distribution offers the advantage that response rates can be fairly high
and comprehensive data can be collected. The 100% response rate could also be
attributed to the sampling method employed as it allowed only a limited number of
employees in each category to participate in the study and that researcher is able to draw
randomly within each category of employees. When those employees who submitted
their responses late were asked what accounted for the long delays, most of them
attributed it to busy work schedule and absence from office.

51
Also, the Human Resources and Administration Manager of Golden Star
(Bogoso/Prestea) limited was interviewed on the GSB/PL reward systems in place and
the critical success factors considered in the design and implementation of the
company‘s reward systems.
In the study, the employees were categorized into four generational groups based on
their ages: Before 1940 (Silent Gen, n=0); 1940-1964 (Baby Boomer Gen, n=28); 1965-
1978 (Gen X, n=91) and 1979-1994 (Gen Y, n=159). Also, respondents were also
categorized into four staff categorizations: Management (n=15), Senior Officers (n=43),
Junior Officers (n=217) and Trainee (n=3)
Respondents were given five reward packages labeled Profile 1, Profile 2, Profile 3,
Profile 4 and Profile 5 of which they were asked to select which reward package they
prefer most and the minimum profile they would consider worth selecting. Respondents
were also asked to select from a predetermined list of reward factors which rewards
when in absence could lead to dissatisfaction in their current job. In similar manner,
respondents were also asked to select which factors would motivate them to stay in their
current job or role. The factors/dimensions considered in establishing each reward
package (Profile) and assessing employees dissatisfaction, satisfaction and motivation
were based partly on Cox et al. (2010, p.253) Total reward dimensions (adapted from
CIPD, 2007) and on Herzberg Two Factor Theory (Hygiene factors and Satisfiers).
Also respondents were given the opportunity to openly express which reward they
prefer most.
The data obtained from the respondents were analyzed based in two ways: Firstly, the
data was analyzed based on the generational group as Silent Generation, Baby Boom
Generation, Generation X and Generation Y and secondly based on the staff
categorization as management, senior staff, junior staff and trainees.

52
Table 7: Sample Size Determination
Determining Sample size from a given population
Population Sample size
10 10
100 80
200 132
300 169
400 196
500 217
700 248
1000 278
2000 322
3000 341
4000 351
5000 357
7000 364
10000 370
20000 377
50000 381
75000 382
≥1000000 384
Source: Adapted from Collis and Hussey (2009, p.211)
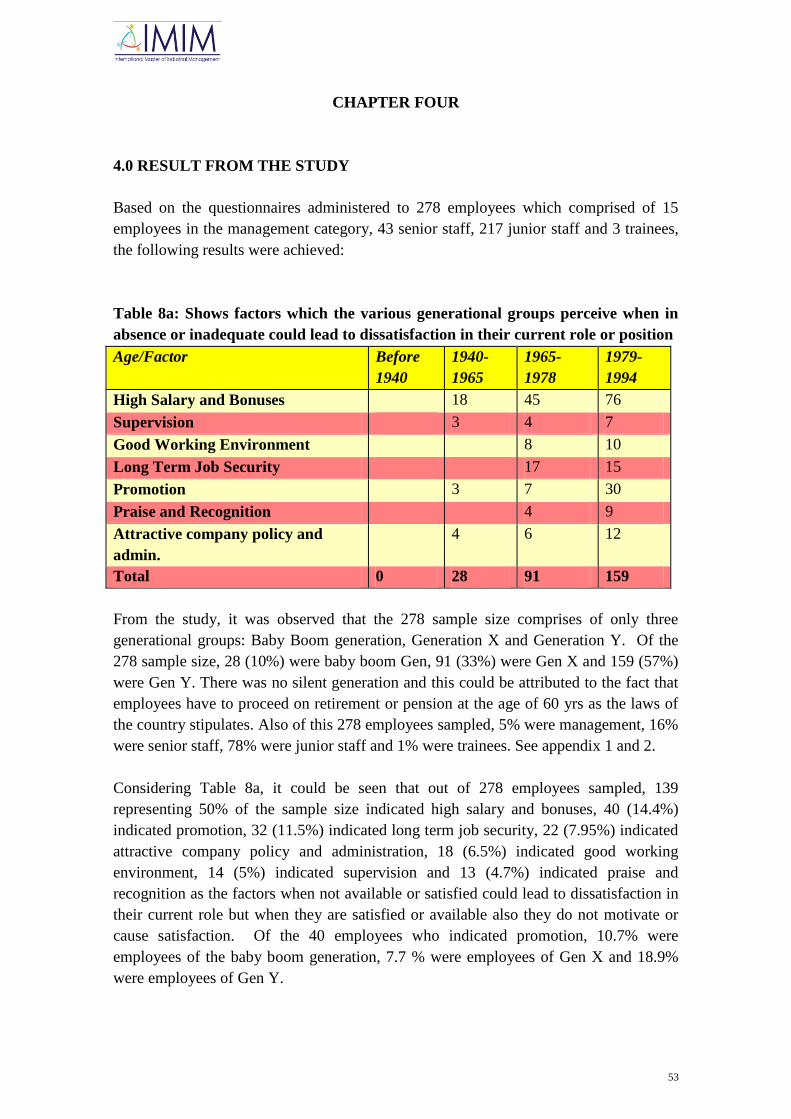
53
CHAPTER FOUR
4.0 RESULT FROM THE STUDY
Based on the questionnaires administered to 278 employees which comprised of 15
employees in the management category, 43 senior staff, 217 junior staff and 3 trainees,
the following results were achieved:
Table 8a: Shows factors which the various generational groups perceive when in
absence or inadequate could lead to dissatisfaction in their current role or position
Age/Factor Before
1940
1940-
1965
1965-
1978
1979-
1994
High Salary and Bonuses 18 45 76
Supervision 3 4 7
Good Working Environment 8 10
Long Term Job Security 17 15
Promotion 3 7 30
Praise and Recognition 4 9
Attractive company policy and
admin.
4 6 12
Total 0 28 91 159
From the study, it was observed that the 278 sample size comprises of only three
generational groups: Baby Boom generation, Generation X and Generation Y. Of the
278 sample size, 28 (10%) were baby boom Gen, 91 (33%) were Gen X and 159 (57%)
were Gen Y. There was no silent generation and this could be attributed to the fact that
employees have to proceed on retirement or pension at the age of 60 yrs as the laws of
the country stipulates. Also of this 278 employees sampled, 5% were management, 16%
were senior staff, 78% were junior staff and 1% were trainees. See appendix 1 and 2.
Considering Table 8a, it could be seen that out of 278 employees sampled, 139
representing 50% of the sample size indicated high salary and bonuses, 40 (14.4%)
indicated promotion, 32 (11.5%) indicated long term job security, 22 (7.95%) indicated
attractive company policy and administration, 18 (6.5%) indicated good working
environment, 14 (5%) indicated supervision and 13 (4.7%) indicated praise and
recognition as the factors when not available or satisfied could lead to dissatisfaction in
their current role but when they are satisfied or available also they do not motivate or
cause satisfaction. Of the 40 employees who indicated promotion, 10.7% were
employees of the baby boom generation, 7.7 % were employees of Gen X and 18.9%
were employees of Gen Y.

54
Aside, the Baby Boom generation which did not indicate good working environment,
long term job security and praises and recognition as factors when not available or
satisfied could lead to dissatisfaction in their current role or position, all other
generational groups indicated all the factors considered in the questionnaire.
Thus, the study partly confirms Brooks (2009, p.93-4) assertion that factors such as
salary or remuneration, job security, working conditions and company policies are
hygiene or contextual factors and that they are extrinsic to the actual work itself and
these factors can cause employee dissatisfaction when not satisfied or available but
when they are satisfied or available also they do not motivate or cause satisfaction but
only prevent employee dissatisfaction.
This study results also partly confirms Lundberg et al (2008, p. 891) emphasis that
according to Herzberg, factors such as company policy , salary, and interpersonal
relations can cause dissatisfaction when not satisfied and however when satisfied these
factors do not motivate or cause satisfaction, but they only prevent dissatisfaction.
Of the 139 (50%) out of 278 sampled employees who indicated high salary and
bonuses, as the factors when not available or satisfied could lead to dissatisfaction in
their current role or position, 64.29% were of Baby Boom GEN, 49.45% were of GEN
X and 47.80% were of GEN Y. Also, 26.67%, 60.47%, 49.31% and 66.67% were of
management, senior staff, junior staff and trainee categories respectively. Based on
employees higher responses to cash incentives, this study confirms Cox et. al (2010,
p.251) emphasis on Burgess and Metcalfe‘s (1999) meta-analysis of research on
incentives from all over the world which leads them to conclude that ―employees do
respond to cash incentives‖ but ―often in sophisticated ways that may or may not benefit
the organization‖
Table 8b: Shows factors which the various staff categories perceive when in
absence or inadequate could lead to dissatisfaction in their current role or position
Staff Category/Factor Management Senior Junior Trainee
High Salary and Bonuses 4 26 107 2
Supervision 1 2 11
Good Working Environment 4 2 12
Long term Job Security 4 28
Promotion 2 5 33
Praise and Recognition 1 11 1
Attractive com. policy and admin. 4 3 15
Total 15 43 217 3

55
Considering Table 8b, It could be seen that 66.67% of the trainees indicated high salary
and bonuses whereas 26.67%, 60.47% and 49.31% representing management, senior
staff and Junior staff categories respectively indicated high salary and bonuses as factors
when not available or satisfied could lead to dissatisfaction in their current role but
when they are satisfied or available also they do not motivate or cause satisfaction. Thus
the trainees being the youngest generation indicated the highest percentage that high
salary and bonuses only prevent employee dissatisfaction and that do not actually
motivate or brings about satisfaction. Of the 40 employees who indicated promotion,
13% were of management category, 12% were of senior staff category and 15% were
of junior staff category. The interest of employees in this reward system could be
attributed to the fact that employee promotion in the company goes with corresponding
increase in salary or pay level implying more increase in financial rewards and other
benefits.
In assessing which factors has the highest tendency of increasing employees level of
satisfaction and motivation in their current role or position, the following data were
obtained from the different generational groups and staff categories. The table below
depicts which factors employees perceive as having the highest tendency of increasing
their level of satisfaction and motivation in their current role or position
Table 9a: Shows factors which the various generational groups perceive as having
the highest tendency of increasing employee’s satisfaction and motivation in
current role or position.
Age/Factor Before
1940
1940-
1965
1965-
1978
1979-
1994
High Salary and Bonuses 12 34 67
Praise and Recognition 8 10
High Sense of Achievement 7 12
High Personal Growth 4 8 13
High Responsility 6 11
Promotion 12 17
Job Security 8 5 7
Flexible Work Schedule 4 11 22
0 28 91 159
Considering Table 9a, in assessing which factors leads to employee satisfaction and
motivation, out of the 278 respondents, 113 (40,65%) indicated high salary and
bonuses, 37 (13.3%) indicated flexible work schedule, 29 (10.43%) indicated
promotion, 25 (9%) indicated high personal growth, 20 (7.19%) indicated job security,
19 (6.84%) indicated high sense of achievement, 18 (6.48%) indicated praise and
recognition, 17 (6.11%) indicated high responsibility. Of the 113 employees who
indicated high salary and bonuses, 42.86% were of Baby Boom GEN, 37.36% were of
GEN X and 42.14% were of Gen Y. Out of this 113 employees who indicated high
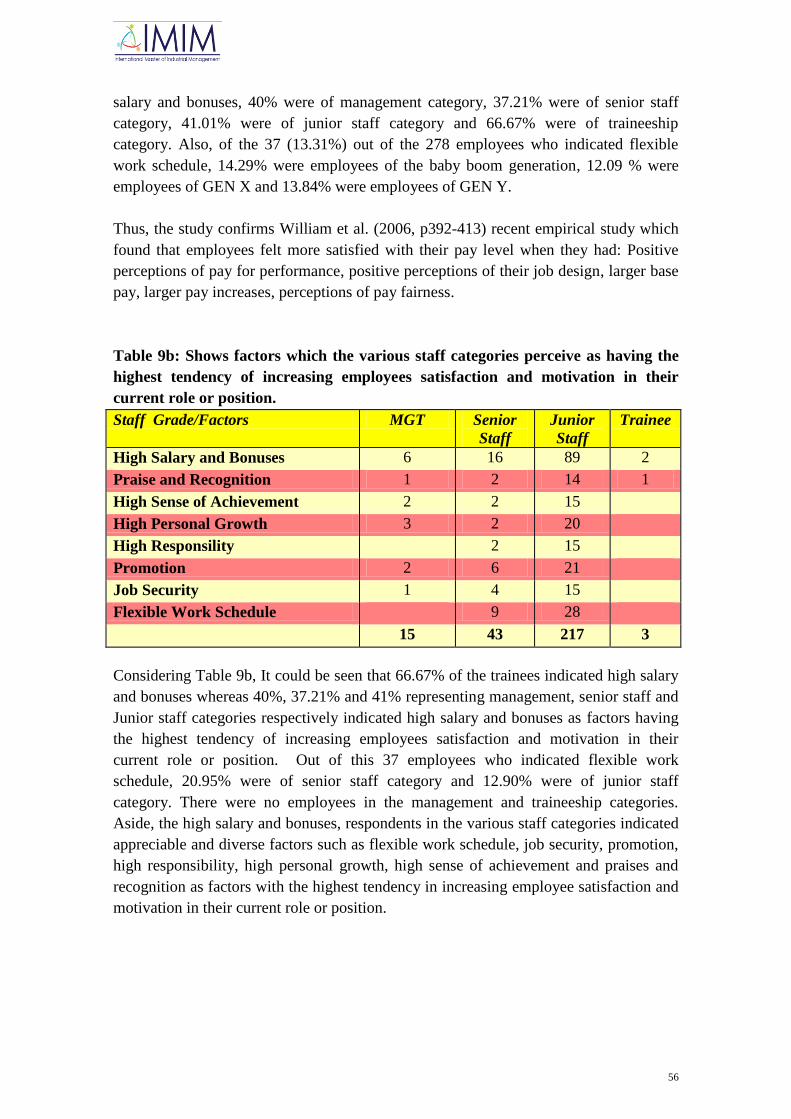
56
salary and bonuses, 40% were of management category, 37.21% were of senior staff
category, 41.01% were of junior staff category and 66.67% were of traineeship
category. Also, of the 37 (13.31%) out of the 278 employees who indicated flexible
work schedule, 14.29% were employees of the baby boom generation, 12.09 % were
employees of GEN X and 13.84% were employees of GEN Y.
Thus, the study confirms William et al. (2006, p392-413) recent empirical study which
found that employees felt more satisfied with their pay level when they had: Positive
perceptions of pay for performance, positive perceptions of their job design, larger base
pay, larger pay increases, perceptions of pay fairness.
Table 9b: Shows factors which the various staff categories perceive as having the
highest tendency of increasing employees satisfaction and motivation in their
current role or position.
Staff Grade/Factors MGT Senior
Staff
Junior
Staff
Trainee
High Salary and Bonuses 6 16 89 2
Praise and Recognition 1 2 14 1
High Sense of Achievement 2 2 15
High Personal Growth 3 2 20
High Responsility 2 15
Promotion 2 6 21
Job Security 1 4 15
Flexible Work Schedule 9 28
15 43 217 3
Considering Table 9b, It could be seen that 66.67% of the trainees indicated high salary
and bonuses whereas 40%, 37.21% and 41% representing management, senior staff and
Junior staff categories respectively indicated high salary and bonuses as factors having
the highest tendency of increasing employees satisfaction and motivation in their
current role or position. Out of this 37 employees who indicated flexible work
schedule, 20.95% were of senior staff category and 12.90% were of junior staff
category. There were no employees in the management and traineeship categories.
Aside, the high salary and bonuses, respondents in the various staff categories indicated
appreciable and diverse factors such as flexible work schedule, job security, promotion,
high responsibility, high personal growth, high sense of achievement and praises and
recognition as factors with the highest tendency in increasing employee satisfaction and
motivation in their current role or position.
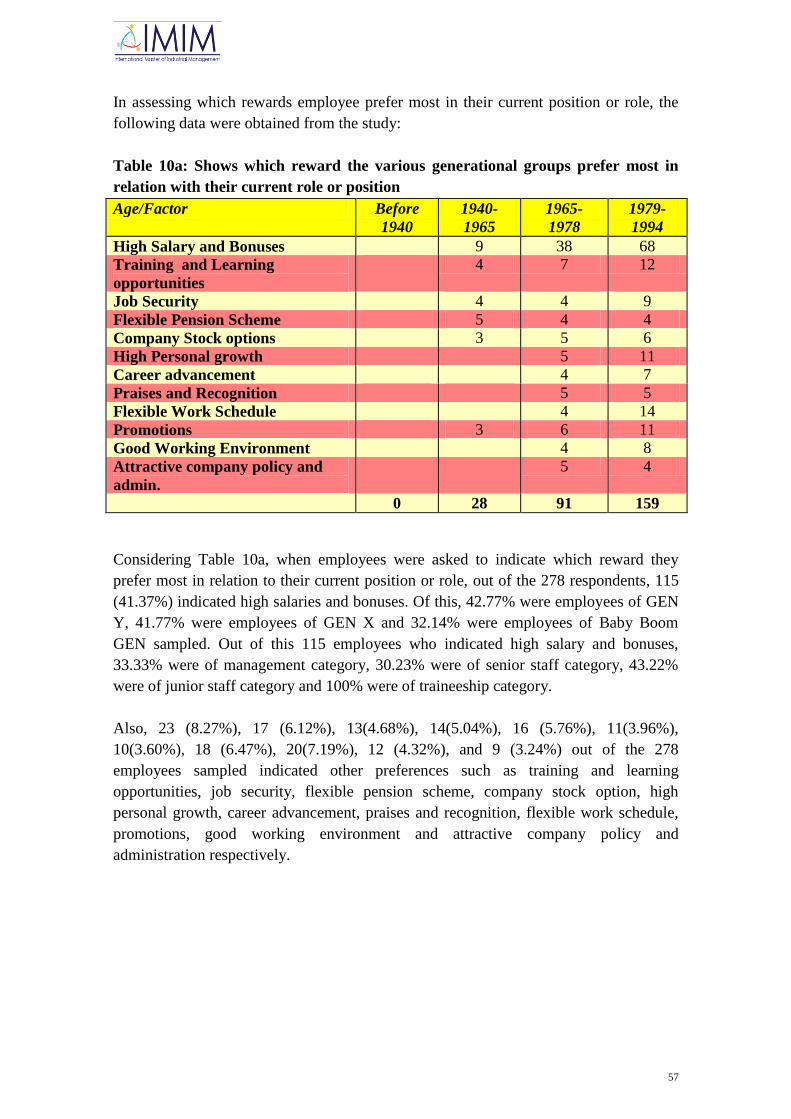
57
In assessing which rewards employee prefer most in their current position or role, the
following data were obtained from the study:
Table 10a: Shows which reward the various generational groups prefer most in
relation with their current role or position
Age/Factor Before
1940
1940-
1965
1965-
1978
1979-
1994
High Salary and Bonuses 9 38 68
Training and Learning
opportunities
4 7 12
Job Security 4 4 9
Flexible Pension Scheme 5 4 4
Company Stock options 3 5 6
High Personal growth 5 11
Career advancement 4 7
Praises and Recognition 5 5
Flexible Work Schedule 4 14
Promotions 3 6 11
Good Working Environment 4 8
Attractive company policy and
admin.
5 4
0 28 91 159
Considering Table 10a, when employees were asked to indicate which reward they
prefer most in relation to their current position or role, out of the 278 respondents, 115
(41.37%) indicated high salaries and bonuses. Of this, 42.77% were employees of GEN
Y, 41.77% were employees of GEN X and 32.14% were employees of Baby Boom
GEN sampled. Out of this 115 employees who indicated high salary and bonuses,
33.33% were of management category, 30.23% were of senior staff category, 43.22%
were of junior staff category and 100% were of traineeship category.
Also, 23 (8.27%), 17 (6.12%), 13(4.68%), 14(5.04%), 16 (5.76%), 11(3.96%),
10(3.60%), 18 (6.47%), 20(7.19%), 12 (4.32%), and 9 (3.24%) out of the 278
employees sampled indicated other preferences such as training and learning
opportunities, job security, flexible pension scheme, company stock option, high
personal growth, career advancement, praises and recognition, flexible work schedule,
promotions, good working environment and attractive company policy and
administration respectively.
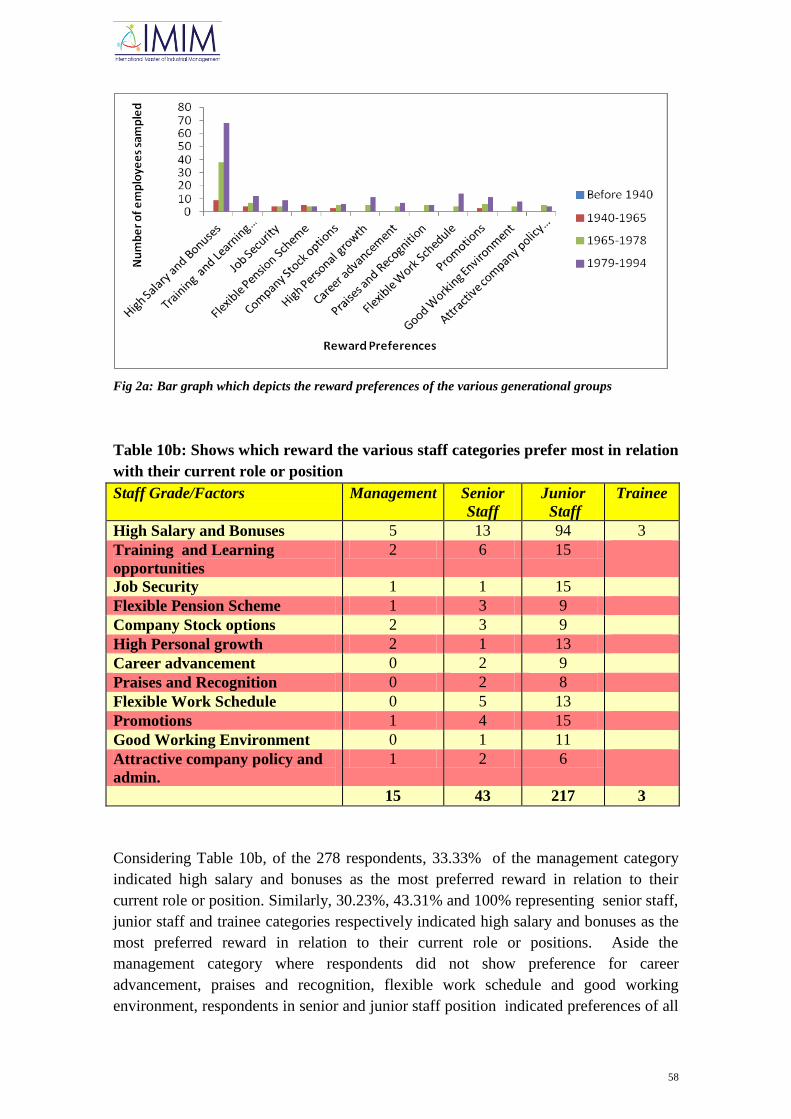
58
Fig 2a: Bar graph which depicts the reward preferences of the various generational groups
Table 10b: Shows which reward the various staff categories prefer most in relation
with their current role or position
Staff Grade/Factors Management Senior
Staff
Junior
Staff
Trainee
High Salary and Bonuses 5 13 94 3
Training and Learning
opportunities
2 6 15
Job Security 1 1 15
Flexible Pension Scheme 1 3 9
Company Stock options 2 3 9
High Personal growth 2 1 13
Career advancement 0 2 9
Praises and Recognition 0 2 8
Flexible Work Schedule 0 5 13
Promotions 1 4 15
Good Working Environment 0 1 11
Attractive company policy and
admin.
1 2 6
15 43 217 3
Considering Table 10b, of the 278 respondents, 33.33% of the management category
indicated high salary and bonuses as the most preferred reward in relation to their
current role or position. Similarly, 30.23%, 43.31% and 100% representing senior staff,
junior staff and trainee categories respectively indicated high salary and bonuses as the
most preferred reward in relation to their current role or positions. Aside the
management category where respondents did not show preference for career
advancement, praises and recognition, flexible work schedule and good working
environment, respondents in senior and junior staff position indicated preferences of all

59
these rewards in addition with other rewards such as high salary and bonuses, training
and learning opportunities, flexible pension scheme, company stock option, high
personal growth, promotion and attractive company policy and administration. Also
respondents in the traineeship category only indicated preference for high salary and
bonuses but did not indicate preferences for the other rewards.
Fig 2b: Bar graph which depicts the reward preferences of the various staff categorizations
In assessing which reward package profile employees prefer most, the following data
were obtained for the various generational groups and staff categories.
Table 11a: shows which reward package profiles the various generational groups
prefer most
Age/Reward Pack Profile Before
1940
1940-
1965
1965-
1978
1979-
1994
Profile 1 6 3 4
Profile 2 10 2 41
Profile 3 2 56 62
Profile 4 3 21 29
Profile 5 7 9 23
Total 0 28 91 159

60
Table 11b: shows which reward package profiles the various staff categories
prefer most
Staff Grade/
Reward Pack. Profile
Management Senior
Staff
Junior
Staff
Trainee
Profile 1 1 12
Profile 2 3 13 36 1
Profile 3 6 18 95 1
Profile 4 4 8 40 1
Profile 5 2 3 34
Total 15 43 217 3
Considering Table 11a and 11b, out of the 278 employees sampled, 120 (43.17%)
indicated reward package Profile 3 as most preferred package, 53 (19.06%) indicated
reward package Profile 2, 53 (19.06%) reward package Profile 4, 39 (14.03%) indicated
reward package profile 5 and 13(4.68%) indicated reward package profile 1. Of the 120
employees who indicated reward package profile 3 as the most preferred option, 7.14%
were of Baby Boom GEN, 61.54% were of GEN X and 38.99% were of GEN Y. Out of
the 120 employees who indicated reward package Profile 3 as the most preferred option,
40.00% were of management category, 41.86% were of senior staff category, 43.78%
were of junior staff category and 33.33% were of traineeship category.
Similarly, of the 53 employees who indicated reward package Profile 2 as the most
preferred option, 35.71% were of Baby Boom GEN, 2.20% were of GEN X and 25.79%
were of GEN Y. Out of the 53 employees who indicated reward package Profile 2 as
the most preferred option, 20.00% were of management category, 30.23% were of
senior staff category, 16.59% were of junior staff category and 33.33% were of
traineeship category.
Similarly, of the 53 employees who indicated reward package Profile 4 as the most
preferred option, 10.71% were of Baby Boom GEN, 23.08% were of GEN X and
18.241% were of GEN Y. Out of the 53 employees who indicated reward package
Profile 4 as the most preferred option, 26.67% were of management category, 18.60%
were of senior staff category, 18.43% were of junior staff category and 33.33% were of
traineeship category.
Similarly, of the 39 employees who indicated reward package Profile 5 as the most
preferred option, 25.00% were of Baby Boom GEN, 9.89% were of GEN X and 14.47%
were of GEN Y. Out of the 39 employees who indicated reward package Profile 5 as
the most preferred option, 13.33% were of management category, 6.98% were of senior
staff category and 16.67% were of junior staff category.

61
Similarly, of the 13 employees who indicated reward package Profile 1 as the most
preferred option, 21.43% were of Baby Boom GEN, 3.30% were of GEN X and 2.52%
were of GEN Y. Out of the 13 employees who indicated reward package Profile 1 as
the most preferred option, 2.33% were of senior staff category and 5.53% were of junior
staff category.
According to Warneke et al. (2011, p.238), in particular, job choice depends on job
satisfaction, which in turn depends on the package of the wage and non-wage
characteristics of the job (Clark, 1997; Rosen, 1974; Thaler and Rosen, 1976; van
Ophem, 1991). Also, reward preferences have been found to relate closely to job
preferences and to job search decisions (Cable and Judge, 1994; Jurgensen, 1978), and
have a tendency to change across the life course and different types of work and
therefore a good idea or understanding of the reward preferences of an ideal job
applicant might help the organization in increasing its attractiveness and becoming
economically more effective (Cable and Judge, 1994).
In analyzing the reward package profile 3, it could be seen that it is more financially
oriented with the job tenure being short term. This implies that the younger generations
like GEN X and GEN Y lookout for more financial incentives rather than the tenure of
employment (Job security). It could also be implicated those younger generations like
GEN X and GEN Y places more emphasis on financial incentives than intrinsic factors
such as career advancement and personal growth. Management high preference for
Profile 3 could also be attributed to the high Salary and high bonuses as well as share
ownership plan. The high preference of junior staffs for this profile could mainly be
attributed to the high financial incentives attached to this option. The high preference of
senior staffs for this profile could also be attributed to the high financial benefits and
high opportunity to grow through personal coach or mentors.
With regards to reward package profile 2, the high preference of the baby boom
generation could be attributed mainly to the long term tenure of employment (job
security), the flexible pension scheme which would offer staff opportunity to extend
their pension dates and earn higher pension benefits and the share ownership plan.
Most of these baby boomers are close to their pension age and as such they are seeking
ways which would give them the opportunity to extend their tenure of employment (job
security) and thus earn the corresponding higher pension benefits. Also, because most
of the baby boom GEN are close to pension age, they prefer to stay in one job than
having to be moving from one job to another. Some studies have indicated that by age,
preferences shift from pay raises to other benefits and become more diverse
(Doering et al. 1983).
Doering et al. (1983), who analysed some classical studies, found that older employees
preferred increased pension and related benefits and were willing to forego pay
increases, additional vacations and shorter work weeks in order to acquire them. The
preference of the GEN X for this option could be attributed to the high intrinsic factors
62
such as intensive overseas training and learning opportunities, personal growth and
career advancement. Both the baby boomers and GEN Xers preference could also be
attributed to the high level of internal promotions as promotions basically comes with
increases in salaries and other benefits which they might be anticipating as attractive.
GEN Y exhibited low preference and this could be attributed to the fact that the package
is more focussed on retirement benefits and less financially oriented and they might be
of the opinion that they are not yet close to the pension age to be focusing deeply on
pension benefits.
With regards to reward package profile 4, the higher preferences of the GEN Y and
GEN X could be attributed to high financial incentives, in-house learning and training
opportunities on annual basis and high potential for personal growth. The few
employees of the baby boom GEN who indicated profile 4 as the most preferred option
could had been attracted by the long term tenure of employment (job security). Also,
the absence of flexible pension scheme and benefits as well as limited share ownership
plan to all employees except management members could have accounted for the lower
percentage of the Baby Boom GEN which indicated preference for profile 4.
With regards to the reward package profile 5, 25% of the Baby Boom GEN indicated
their most preferred option as profile 5 and this could be attributed to factors such as life
employment tenure (job security) and extraordinary pension package for employees.
The 9.89% and 14.47% of the GEN X and GEN Y respectively who indicated their
most preferred option as profile 5 could be attributed to the learning and training
opportunities on annual basis, high potential for career advancement and high potential
for personal growth.
With regards to the reward package profile 1, 21.43% of the Baby Boom GEN indicated
their most preferred option as profile 1 and this could be attributed mainly to factors
such as long term tenure of employment (long term job security), flexible pension
scheme such as higher pension benefits for those who extends their pension date and
higher bonuses (financial incentive). The 3.30% and 2.52% of the GEN X and GEN Y
respectively who indicated their most preferred option as profile 1 could be attributed to
the high bonuses (financial incentives), learning and training opportunities on annual
basis, potential for career advancement and high potential for personal growth.
Therefore based on the five (5) profiles analyzed, it could be deduced that employees
of all generational groups places high priority on financial incentives rather than any
other benefit. Aside, the financial incentives, the GEN X and GEN Y exhibited high
level of preference of intrinsic factors such as training and learning opportunities,
personal growth and career advancement. These two generations placed less emphasis
on the job security (both long term and short term) whiles choosing their reward
package profiles.
Also, the Baby Boom generation placed much emphasis on the job security and the
pension benefits. It was observed that baby boomers showed higher preference for long

63
term job security rather short term job security. This is because most of the baby
boomers are in their late fifties and as such are close to proceeding on pension and they
would not like to be competing for jobs in the job market with the younger generations
as employers prefer the younger generations.
Also, the baby boomers exhibited higher preferences for pension benefits of which the
younger generations showed little or no interest all.
Fig 3a: Depicts the preferred reward package profile of the various generational groups
Fig 3b: Depicts the preferred reward package profile of the various staff categorizations

64
In assessing which minimum reward package profile the various generational groups
and staff categories would consider worth selecting, the following data were obtained
from the study:
Table 12a: Shows minimum reward package profile the various generational
groups consider worth selecting
Age/Reward
Pack. Profiles
Before
1940
1940-
1965
1965-
1978
1979-
1994
Profile 1 2 9 10
Profile 2 19 15 17
Profile 3 2 41 65
Profile 4 3 19 50
Profile 5 2 7 17
Total 0 28 91 159
Considering Table 12a, in assessing the minimum reward package profile the various
generational groups consider worth selecting, Out of the 278 respondents, 108(38.85%)
indicated profile 3, 72 (25.90%) indicated profile 4, 51 (18.35%) indicated profile 2,
26 (9.35%) indicated profile 5 and 21(7.55%) indicated profile 1. Of the 108
respondents who indicated profile 3, 7.14% were of Baby Boom GEN, 45.05% were of
GEN X and 40.88% were of Gen Y. Of the 72 respondents who indicated profile 4,
10.71% were of Baby Boom GEN, 20.88% were of GEN X and 31.45% were of Gen Y.
Of the 51 respondents who indicated profile 2, 67.86% were of Baby Boom GEN,
16.48% were of GEN X and 10.69% were of Gen Y. Of the 26 respondents who
indicated profile 5, 7.14% were of Baby Boom GEN, 7.69% were of GEN X and
10.69% were of Gen Y. Of the 21 respondents who indicated profile 1, 7.14% were of
Baby Boom GEN, 9.89% were of GEN X and 6.29% were of Gen Y.
Fig 4a: Depicts the minimum reward package profile the various generational groups consider worth
selecting
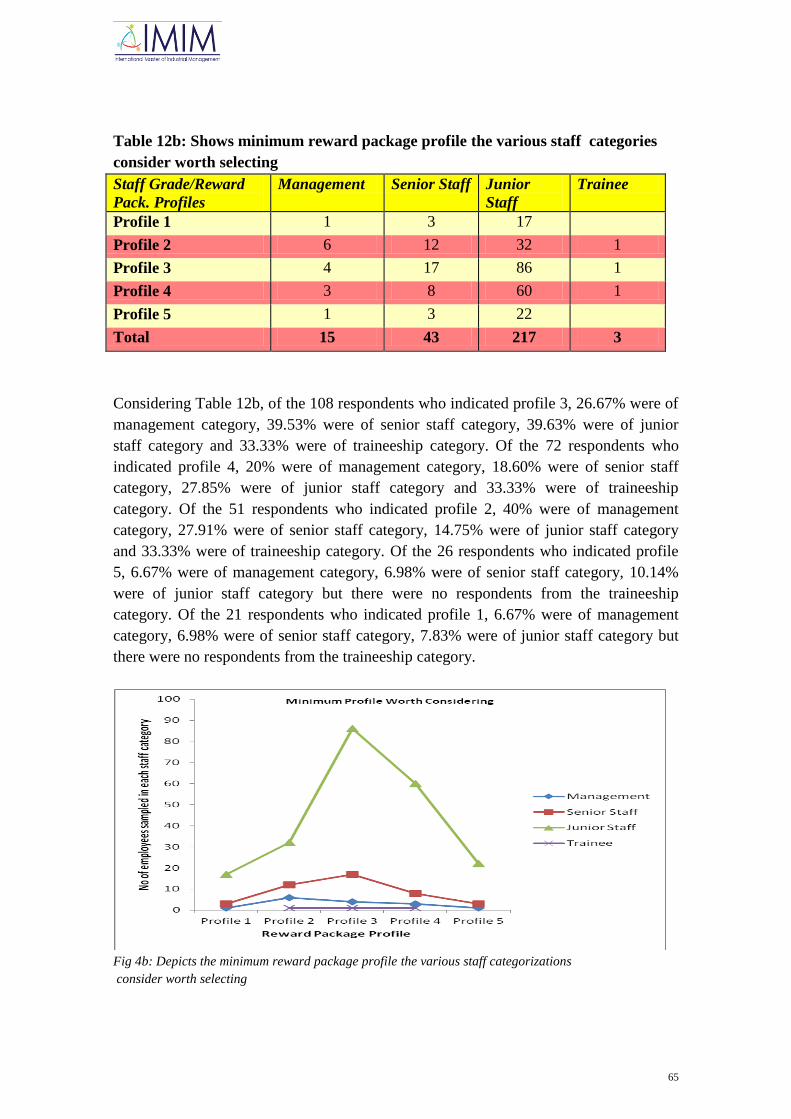
65
Table 12b: Shows minimum reward package profile the various staff categories
consider worth selecting
Staff Grade/Reward
Pack. Profiles
Management Senior Staff Junior
Staff
Trainee
Profile 1 1 3 17
Profile 2 6 12 32 1
Profile 3 4 17 86 1
Profile 4 3 8 60 1
Profile 5 1 3 22
Total 15 43 217 3
Considering Table 12b, of the 108 respondents who indicated profile 3, 26.67% were of
management category, 39.53% were of senior staff category, 39.63% were of junior
staff category and 33.33% were of traineeship category. Of the 72 respondents who
indicated profile 4, 20% were of management category, 18.60% were of senior staff
category, 27.85% were of junior staff category and 33.33% were of traineeship
category. Of the 51 respondents who indicated profile 2, 40% were of management
category, 27.91% were of senior staff category, 14.75% were of junior staff category
and 33.33% were of traineeship category. Of the 26 respondents who indicated profile
5, 6.67% were of management category, 6.98% were of senior staff category, 10.14%
were of junior staff category but there were no respondents from the traineeship
category. Of the 21 respondents who indicated profile 1, 6.67% were of management
category, 6.98% were of senior staff category, 7.83% were of junior staff category but
there were no respondents from the traineeship category.
Fig 4b: Depicts the minimum reward package profile the various staff categorizations
consider worth selecting
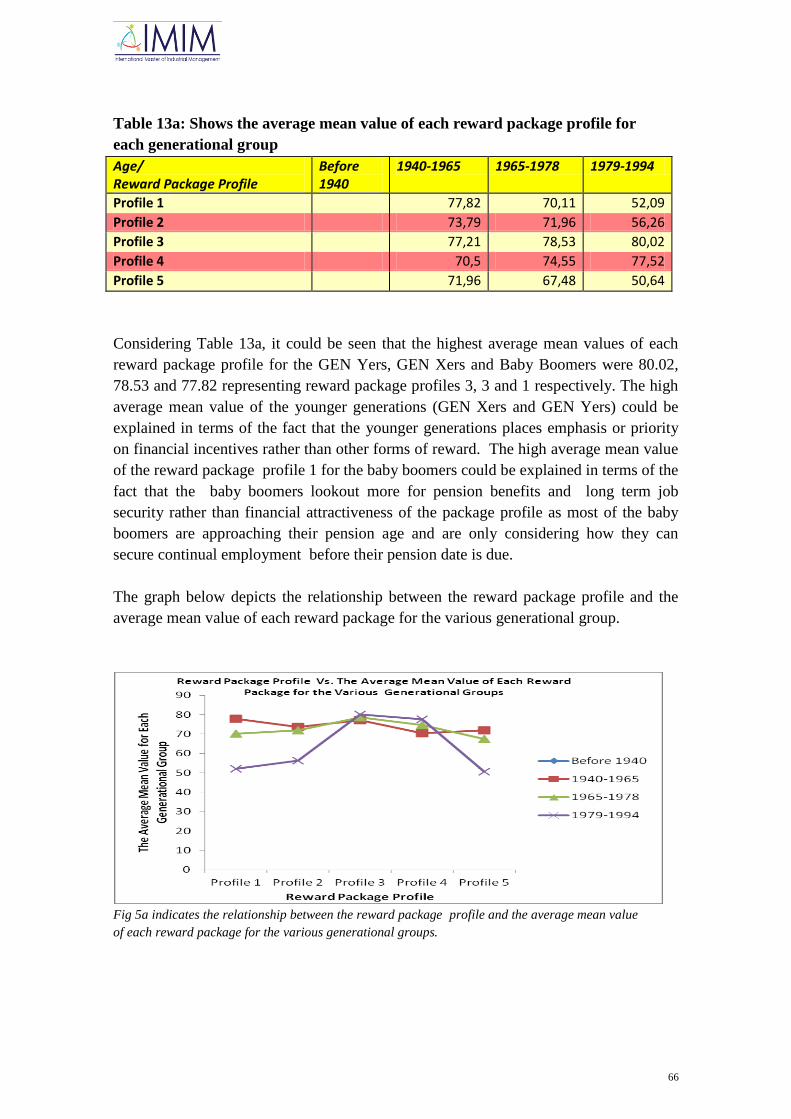
66
Table 13a: Shows the average mean value of each reward package profile for
each generational group
Age/ Reward Package Profile
Before 1940
1940-1965 1965-1978 1979-1994
Profile 1 77,82 70,11 52,09
Profile 2 73,79 71,96 56,26
Profile 3 77,21 78,53 80,02
Profile 4 70,5 74,55 77,52
Profile 5 71,96 67,48 50,64
Considering Table 13a, it could be seen that the highest average mean values of each
reward package profile for the GEN Yers, GEN Xers and Baby Boomers were 80.02,
78.53 and 77.82 representing reward package profiles 3, 3 and 1 respectively. The high
average mean value of the younger generations (GEN Xers and GEN Yers) could be
explained in terms of the fact that the younger generations places emphasis or priority
on financial incentives rather than other forms of reward. The high average mean value
of the reward package profile 1 for the baby boomers could be explained in terms of the
fact that the baby boomers lookout more for pension benefits and long term job
security rather than financial attractiveness of the package profile as most of the baby
boomers are approaching their pension age and are only considering how they can
secure continual employment before their pension date is due.
The graph below depicts the relationship between the reward package profile and the
average mean value of each reward package for the various generational group.
Fig 5a indicates the relationship between the reward package profile and the average mean value
of each reward package for the various generational groups.
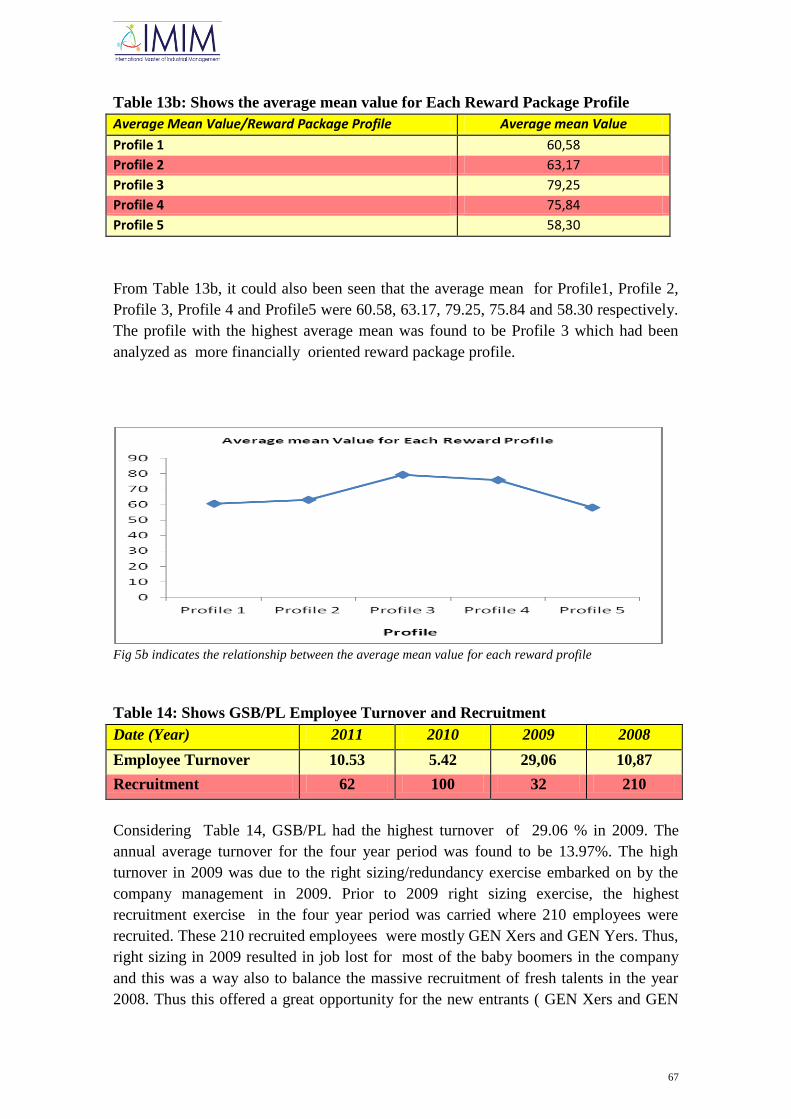
67
Table 13b: Shows the average mean value for Each Reward Package Profile
Average Mean Value/Reward Package Profile Average mean Value
Profile 1 60,58
Profile 2 63,17
Profile 3 79,25
Profile 4 75,84
Profile 5 58,30
From Table 13b, it could also been seen that the average mean for Profile1, Profile 2,
Profile 3, Profile 4 and Profile5 were 60.58, 63.17, 79.25, 75.84 and 58.30 respectively.
The profile with the highest average mean was found to be Profile 3 which had been
analyzed as more financially oriented reward package profile.
Fig 5b indicates the relationship between the average mean value for each reward profile
Table 14: Shows GSB/PL Employee Turnover and Recruitment
Date (Year) 2011 2010 2009 2008
Employee Turnover 10.53 5.42 29,06 10,87
Recruitment 62 100 32 210
Considering Table 14, GSB/PL had the highest turnover of 29.06 % in 2009. The
annual average turnover for the four year period was found to be 13.97%. The high
turnover in 2009 was due to the right sizing/redundancy exercise embarked on by the
company management in 2009. Prior to 2009 right sizing exercise, the highest
recruitment exercise in the four year period was carried where 210 employees were
recruited. These 210 recruited employees were mostly GEN Xers and GEN Yers. Thus,
right sizing in 2009 resulted in job lost for most of the baby boomers in the company
and this was a way also to balance the massive recruitment of fresh talents in the year
2008. Thus this offered a great opportunity for the new entrants ( GEN Xers and GEN

68
Yers) to be trained by the baby boomers for at least a year before most of them left the
company through the redundancy exercise.
The high annual average turnover of 13.9% gives a clear impression that GSB/PL
reward systems had not been able to meet its goal of attracting, retaining, motivating
and developing talents in the company. Although, labour movement within the
Ghanaian mining industry is very high, it could clearly be seen that GSB/PL reward
systems have done little in combating this issue of high labour movement. In assessing
GSB//PL rewards system, it could clearly be seen that most of the rewards currently
operational are extrinsic in nature with few intrinsic rewards which have the potential of
motivating the workforce in their current role or position. Thus though, GSB/PL
rewards system comprises of a number of diverse rewards, the company is still
challenged with how the rewards system could lure valuable labour force from exiting
from the company to other companies mainly because of better and attractive reward
packages.
Below is a graph depicting GSB/PL employee turnover and recruitment for the period
2008 t0 2011.
Fig 6: GSB/PL employee Turnover and Recruitment for the period 2008-2011

69
CHAPTER FIVE
5.0 DISCUSSION OF RESULTS AND FINDINGS
5.1.0 Questionnaire Results and Analysis
In understanding the perception of the different generational groups in the workplace
regarding employee reward preferences and the design and implementation of reward
systems, the study answered the following research questions which provided the
grounds in concluding this paper.
What rewards do employees of the different generational groups prefer most?
What rewards do the different generational groups perceive to prevent
employees dissatisfaction?
What rewards do the different generational groups perceive to enhance
employees satisfaction and motivation?
What are the critical success factors and phases involved in the design and
implementation of reward systems
From the result in table 8a and 8b, the question as to what rewards do the different
generational groups perceive to prevent employee dissatisfaction had been answered as
the it had been found that all the generational groups perceive rewards such as high
salary and bonuses, supervision, promotion and attractive company policy and
administration as only prevent dissatisfaction but do not actually bring about
satisfaction and motivation. This thus confirms theories and assertions such as Brooks
(2009, p.93-4) assertion that factors such as salary or remuneration, job security,
working conditions and company policies are hygiene or contextual factors and that
they are extrinsic to the actual work itself and these factors can cause employee
dissatisfaction when not satisfied or available but when they are satisfied or available
also they do not motivate or cause satisfaction but only prevent employee
dissatisfaction. This study also partly confirms Lundberg et al (2008, p. 891) emphasis
that according to Herzberg, factors such as company policy , salary, and interpersonal
relations can cause dissatisfaction when not satisfied and however when satisfied these
factors do not motivate or cause satisfaction, but they only prevent dissatisfaction.
Also, result from table 9a and 9b clearly answered the question as to what rewards do
the different generational groups perceive to enhance employees satisfaction and
motivation by identifying that all the three generational groups involved in this study
perceive high salary and bonuses, high personal growth, job security and flexible work
schedule as rewards factors when in absence or inadequate could lead to lack of
satisfaction and motivation in the workplace but when available has the highest
tendency in enhancing employee satisfaction and motivation in the workplace.
In-addition, GEN Xers and Yers indicated that reward factors such as praise and
recognition, high sense of achievement, high responsibility and promotion all enhances

70
employee satisfaction and motivation in the current role or position. But the study partly
confirms Herzberg Two-Factor Theory (motivators) which asserts that factors such as
praise and recognition, high sense of achievement, the work itself, advancement,
personal growth and high responsibility has a tendency of increasing employee
satisfaction and motivation in the workplace. Although Herzberg Two-Factor Theory
(Dissatisfiers and Motivators) views high salary and bonuses as factors which only
prevent dissatisfaction but not actually enhancing satisfaction and motivation, this study
identified that in the mining company, employees view or perceive high salary and
bonuses as factors which prevent dissatisfaction, and also enhances satisfaction and
motivation in the workplace at the same time.
The study supports Pinder (1998) criticism of Herzberg claim that job content or job
enrichment by for example responsibility, achievement, recognition and advancement is
the only way to increase work motivation (Furnham, Forde, & Ferrari,1999; Parson &
Broadbride, 2006; Wright, 1989) by asserting that hygiene factors, like salary,
interpersonal relations and working conditions may also act as motivators.
The study also confirms William et al. (2006, p392-413) recent empirical study which
found that employees felt more satisfied with their pay level when they had: Positive
perceptions of pay for performance, positive perceptions of their job design, larger base
pay, larger pay increases, perceptions of pay fairness.
The study again clearly supports and confirms the tradiational belief that pay is prime
and in some cases the only source of motivation.
Also, result from 10a and 10b clearly answered the question as to what rewards do the
different generational groups prefer most by identifying that all the three generational
groups involved in this study prefer high salary and bonuses, training and learning
opportunities, job security, flexible pension scheme, company stock options and
promotion. Also in-addition to this, GEN Xers and Yers indicated other reward
preferences such as high personal growth, praises and recognition, career advancement,
flexible work schedule, good working environment and attractive company policy and
administration of which the baby boomers did not indicate any preference.
Also, result from table 11a and 11b clearly answered the question as to what reward
package profile do the different generational groups prefer most by indicating that
profile 3 was the most preferred option, followed by profiles 2 and 4, followed by
profile 5 and then profile 1. Most of the respondents who indicated profile 3 as the most
preferred option were of mostly GEN Xers and Yers and a few baby boomers. Also,
most of the respondents who indicated profile 2 as the most preferred option were
mostly baby boomers and GEN Yers and a few of GEN Xers. Also, most of the
respondents who indicated profile 4 as the most preferred option were mostly GEN Xers
and Yers and a few of the baby boomers and were found in all the staff categories.
Also, most of the respondents who indicated profile 5 as the most preferred option were
mostly baby boomers and GEN Yers and a few of GEN X and were found in all the
staff categoriesexcept the Traineeship category. Again, most of the respondents who

71
indicated profile 1 as the most preferred option were mostly baby boomers and a few of
GEN Xers and Yersand were found in only the senior staff and junior staff categories.
According to Warneke et al. (2011, p.238), in particular, job choice depends on job
satisfaction, which in turn depends on the package of the wage and non-wage
characteristics of the job (Clark, 1997; Rosen, 1974; Thaler and Rosen, 1976; van
Ophem, 1991). The high preference of package profile 3 could be implicated that those
younger generations (GEN Xers and Yers) places less emphasis on the tenure of
employment (job security) but more emphasis on financial incentives than intrinsic
factors such as career advancement and personal growth.
Also, the high preference of reward package profile 2 by the baby boomers could be
explained in terms Doering et al. (1983) assertion that some studies have indicated that
by age, employee preferences shift from pay raises to other benefits and become more
diverse. Doering et al. (1983), who analysed some classical studies, found that older
employees preferred increased pension and related benefits and were willing to forego
pay increases, additional vacations and shorter work weeks in order to acquire them.
The baby boomers places more emphasis on tenure of employment (long term job
security) and flexible pension benefts/scheme. This is because most of the baby
boomers are close to pension age and as such they prefer to stay on one job than having
to be moving from one job to another and competing with the younger generations in
the job market for employment as employers prefer mostly GEN Xers and Yers.
The preference of the GEN X for this option could be attributed to the high intrinsic
factors such as intensive overseas training and learning opportunities, personal growth
and career advancement. Both the baby boomers and GEN Xers preference could also
be attributed to the high level of internal promotions as promotions basically comes
with increases in salaries and other benefits which they might be anticipating as
attractive. The low preference of GEN Yers could be attributed to the fact that the
package is more focused on retirement benefits and less financially oriented and they
might be of the opinion that they are not yet close to the pension age to be focusing
deeply on pension benefits.
Considering reward package profile 4, the higher preferences of the GEN Y and GEN X
could be attributed to high financial incentives, and intrinsic factors such as in-house
learning and training opportunities and high potential for personal growth. The low
preference of the baby boomers could be explained in terms of the fact that profile 4
lacks flexible pension benefits of which the baby boomers are more interested
even-though profile 4 has a long tenure of employment (long term job security) which
they also consider in choosing their reward package profile.
Considering reward package profile 5, the higher preference of the baby boomers could
be explained in terms of the life employment tenure (long term job security) and
extraordinary pension package for employees. The lower preference of the GEN Xers
72
and Yers could be explained in terms of the low financial incentives attached to this
profile 5.
Considering reward package profile 1, the higher preference of the Baby Boomer could
be attributed mainly to factors such as long term tenure of employment (long term job
security), flexible pension scheme such as higher pension benefits for those who
extends their pension date and higher bonuses (financial incentive). The lower
preferences of the GEN Xers and Yers could be attributed to the fact that the reward
package profile is not financially oriented as high bonuses cannot be guaranteed
payment at all times. The few of the GEN Xers and Yers who indicated this profile
could be attributed to the high bonuses, learning and training opportunities on annual
basis, potential for career advancement and high potential for personal growth.
Therefore based on the five (5) profiles analyzed, it could be deduced that GEN Xers
and Yers place highest priority on high financial incentives rather than any other
benefit. Aside, the financial incentives, the GEN X and GEN Y exhibited high priority
and preferences for intrinsic factors such as training and learning opportunities,
personal growth and career advancement but less priority and preferences for job
security and pension benefits whiles choosing their reward package profiles.
On the contrarily, the baby boomers placed highest priority and preference on long term
job security and pension benefits and were willing to forego high financial incentives
for long term job security and flexible pension benefits whiles choosing their reward
package profiles.
Also, result from 12a and 12b clearly answered the question as to what minimum
reward package profile do the different generational groups consider worth selecting, as
the respondents indicated mostly profile 3 of which it was dominated by GEN Xers and
Yers with few baby boomers. The higher indication by the GEN Xers and Yers could
be attributed to the high financial incentives attached to this profile whiles the low baby
boomers gives an indication that the profile 3 has less flexible pension benefits and long
term job security.
Also, result from 13a and 13b clearly explained the average mean values of the various
reward package profiles for the different generational groups. The high average mean
value of the younger generations (GEN Xers and GEN Yers) could be explained in
terms of the fact that the younger generations places emphasis or priority on financial
incentives rather than other forms of reward. The high average mean value of the
reward package profile 1 for the baby boomers could be explained in terms of the fact
that the baby boomers lookout more for pension benefits and long term job security
rather than financial attractiveness of the package profile as most of the baby boomers
are approaching their pension age and are only considering how they can secure
continual employment before their pension date is due.

73
Also, result from table 14 gives a vivid explanation of GSB/PL reward system
performance in relation to its turnover and recruitment activities. The high annual
average turnover of 13.9% gives a perfect indication that the company had not been
able to meet its goal of attracting, retaining, motivating and developing talents in the
company. In assessing GSB//PL rewards system, it could clearly be seen that most of
the rewards currently operational are extrinsic in nature with few intrinsic rewards
which have the potential of motivating the workforce in their current role or position.
5.2.0 Human Resources and Administration Manager Interview Results
When the Human Resources and Administration Manager was asked what are the
current reward systems in place for their employees, he accentuated that the GSB/PL
current total reward system includes high salary levels (pay increases), a bonus scheme,
training and learning opportunities (Both in-house and external trainings such as
training in other mining companies in Ghana and overseas), job security (permanent
position/long term), Stock options, retirement/pension benefits such as social security,
provident fund (20% of employees basic salary) where employee contribute 10% of his
basic salary and employer contribute equivalent 10% of employee basic salary on behalf
of employee bringing the total PF contribution on behalf of the employee as 20% of
employee basic salary), promotions, attractive company policies and administration,
good working environment and flexible working environment (Work-life balance
basically arranged at the departmental levels between managers, supervisors and
subordinates), Long service awards (for employees in every five years of continuous
service to the company) recognition of employees performance and benefits such as
housing, Health insurance, Vacation/Annual leave benefits, transportation/bussing
service, messing (provision of meals to employees only when at work), and educational
benefits (for employees dependants). The human resources manager emphasized that
the bonus scheme also comprises of components such as Safety, Operating cost, Gold
production (ounces of gold produced) target on monthly basis
When the Human Resources and Administration Manager was asked what are the
critical success factors considered in the design and implementation of GSB/PL
reward systems, he emphasized on five factors as follows: Profiling of the
workforce during the assessment phase, Strong leadership commitment and
support, clear articulation of the system objectives, effective and efficient
communication and employee involvement.
The Human Resources and Administration Manager emphasized that during the
assessment phase profiling of the entire workforce play a key role in understanding
employee preferences for rewards and which rewards to be included in the entire total
reward package for employees. As suggested by Love well (2011), "one of the first
steps which should be carried out is profiling the whole workforce. This investigation
will surely reveal to be useful both during the designing stage, in order to help and

74
determine the most appropriate benefits to be included in the benefits catalogue and
during the implementation stage,
in order to identify the most effective and suitable communication method and approach
in order to catch staff's attention"12
.
The HR and Administration manager emphasized that strong leadership (management)
commitment and support during the design and implementation of the GSB/PL reward
systems in place contributes to a large extent the overall success of the company's
rewards system over the years.
The HR and Administration manager emphasized what has contributed again to
GSB/PL over the past years had been clear articulation of the company‘s reward system
objectives. Thus, prior to the design and implementation of the rewards system,
employees are made known of the objectives of the total reward system.
The HR and Administration manager emphasized that effective and efficient
communication to the entire workforce the value of the overall reward package also
plays a very important role in ensuring GSB/PL successful reward systems in place.
"According to KPMG (2002), Paying particular care on effectively and properly
communicating to each member of staff the value of the overall reward package he/she
receives appears, then, to be particularly crucial. Since pay increases could be unlikely
or, at best, not as generous as they had been during the previous years, the importance
of effectively communicating staff the worthiness of their current reward package could
help organisations to improve staff‘s morale or, if anyth ing, to soften the negative
impact that belt tightening periods can generate over staff (NorthgateArinso, 2009)"13
.
Also, according to Hay Group (2008), "ensuring that individuals truly understand and
properly value each component of reward can turn to be particularly useful and effective
in order to ―developing or reinforcing a branding for reward and benefits within an
organisation‖14
The HR and Administration manager emphasized that employee involvement during the
assessment, design and implementation phases has contributed to GSB/PL reward
systems over the years. He underscored that though individual employees do not
directly take part in the design and implementation process, internal surveys normally
conducted on employee reward preferences periodically in itself help management to
incorporate or indirectly involve employees views and perceptions during the
assessment phase. Also, the union represents the voice of the workforce during the
12
http://rosariolongo.blogspot.co.uk/2011/11/designing-and-developing-flexible.html
13 http://rosariolongo.blogspot.com/2011/12/total-reward-statements-influence-on.html
14 http://rosariolongo.blogspot.com/2011/12/total-reward-statements-influence-on.html

75
design and implementation process and ensure that employee preferences are more
represented in the total reward system.
When the Human Resources and Administration Manager was asked what are the
phases involved in the design and implementation of the GSB/PL Reward Systems,
he highlighted on four phases as follows: assessment, design, execution and
evaluation.
The Human Resource and Administration manager emphasized that the assessment
phase basically involves the evaluation of the company‘s current total rewards system
and generation of ideas for improving it. This involves internal surveys on employee
reward preferences and attitudes towards them, industry benchmark surveys and
examining current reward strategies and documenting the findings and
recommendations for the design and execution phase.
The Human Resource and Administration manager emphasized that the design phase
involves the identification of which employees and organizational attributes to reward
and which types of reward to offer. He accentuated that during this phase, consideration
is given to the full range of reward strategies, including benefits, compensation, work
environment, personal and professional development.
The Human Resource and Administration manager emphasized once the designed phase
is completed, the designed total rewards system moves to the execution phase of the
implementation process which involves putting the new system in place in the
organization. This phase gives consideration to numerous issues such as eligibility, top
management support, measurement, etc.
The Human Resource and Administration manager emphasized that the last step of the
design and implementation process is evaluation which involves comparing the actual
results of the executed total rewards strategies against the desired results. The
conducting of this evaluation could show top management that the company's
investment in its total rewards system has paid off. Corby et al.(2005, p.4-24) asserts
that of course, conducting an evaluation can be unnerving if you fear that the selected
reward strategies are in fact not delivering as anticipated. He emphasized that
encouraging the measurement of the outcomes of the executed total rewards system and
interpreting the findings correctly help to obtain the most from the evaluation phase.
5.3.0 Findings from the study
It was found from the study that all the generational groups sampled ( baby
boomers, GEN X and GEN Y) placed higher emphasis or priority on financial
incentives (high salary and bonuses) over any other incentives when respondents
were asked to indicate the reward they prefer most. Thus financial rewards such

76
as higher salaries and bonuses were the most frequently indicated as preferred
reward. But when rewards were considered as a total package profile, greater
number of the baby boomers placed more emphasis or priority on packages with
highly flexible pension benefits, long term job security and high internal
promotions eventhough the salary and bonus components of the packages
(profile) were not that attract. The GEN X and GEN Y groups still maintained
their reward package profile preferences based on high financial incentives,
training and learning opportunities, personal growth and career advancement.
Aside the high preferences for high salary and bonuses by all the generational
groups, few of the GEN X and GEN Y also exhibited other preferences for
both intrinsic and extrinsic rewards such as high personal growth, flexible work
schedule, attractive company policy and administration, career advancement,
working environment, job security and praises and recognition of which the
baby boomers did not indicate any preference or interest.
All the three generational groups (Baby Boomers, GEN X and GEN Y) indicated
high salary and bonuses as factor which causes employee dissatisfaction when
not satisfied or available but when they are satisfied or available also do not
motivate or cause satisfaction. Thus the three generational groups confirmed
Herzberg theory that factors such as salary or remuneration, job security,
working conditions and company policies can cause employee dissatisfaction
when not satisfied or available but when they are satisfied or available also these
factors do not motivate or cause satisfaction and so these factors only prevent
employee dissatisfaction (Herzberg, 1971; Herzberg, Mausner, &Bloch
Snyderman, 2005).
It was found from the study that all generational groups sampled (baby boomers,
GEN X and GEN Y) indicated high salaries and bonuses as factor which could
lead to lack of satisfaction and motivation of the employee in his current role or
position when not available or satisfied. This finding is thus in contrast with
Herzberg claim that pay (high salaries and bonuses) is only an extrinsic factor
and that when is available or satisfied, pay does not bring satisfaction and
motivation but rather prevents dissatisfaction. This finding is also in-line with
the traditional belief that pay is prime, or in some cases the only source of
motivation.
It was found from the HR and Administration manager interview that GSB/PL
rewards currently operational and accessible by employees include high salary
levels (pay increases), a bonus scheme, training and learning opportunities
(both in-house and external trainings such as training in other mining companies
in Ghana and overseas), job security (permanent position/long term), Stock
options, Retirement/Pension benefits such as social security, provident fund
(20% of employees basic salary) where employee contribute 10% of his basic
salary and employer contribute equivalent 10% of employee basic salary on

77
behalf of employee bringing the total PF contribution on behalf of the employee
as 20% of employee basic salary), promotions, attractive company policies and
administration, praises and recognition, good working environment, flexible
work schedule (Work-life balance basically arranged at the departmental levels
between managers, supervisors and subordinates), Long service awards (for
employees in every five years of continuous service to the company) and
benefits such as housing, Health insurance, Vacation/Annual leave benefits,
transportation/bussing service, messing (provision of meals to employees only
when at work), and educational benefits (for employees dependants).
It was found from the HR and Administration manager interview that the critical
success factors in the design and implementation of GSB/PL rewards system
include profiling of the entire workforce during the assessment phase, leadership
(management) commitment and support, clear articulation of the company's
reward system objectives, effective and efficient communication and employee
involvement.
It was also found from the HR and Administration Manager interview that there
are four phases involved in the design and implementation of GSB/PL rewards
system and these phases include assessment, design, implementation and
evaluation.

78
CHAPTER SIX
6.0 CONCLUSION AND RECOMMENDATION
6.1.0 Conclusion
According to Kaplan (2007, p.12-19), "Total reward strategy is a holistic approach
aligning with business strategy and people strategy; it encompasses everything
employees value in their employment relationship like compensation, benefits,
development and the work environment". In an age of stiffening competition and
increasing pressure to do more with less, GSB/PL cannot afford to ignore the strategic
value that a well-designed total rewards system could provide. Thus a well-thought-out
and skillfully implemented rewards program could give GSB/PL competitive edge
either in the form of employee retention, productivity, job satisfaction, service quality
and more of which the company require most in excelling in the global market.
This study is unique and further advances our understanding of reward preferences and
performance by focusing on the mining industry and setting in an environment
(Africa) of which little is known in literature about employee preferences for reward as
almost all literature on rewards systems are mostly carried out in the North American
and the European (mostly UK) settings.
First and foremost, the study contributes new insights into the notion of employees
reward preferences by identifying what reward and reward package profiles the
different generational groups prefer most.
Secondly, the study demonstrates the perception of the different generational groups
that factors such as high salary and bonuses, job security, working conditions and
company policies when available or satisfied prevent employee dissatisfaction but do
not actually leads to motivation and satisfaction. This study also represents a
confirmatory test of the Herzberg Two Factor Theory (The hygiene factors).
Thirdly, the study demonstrates the perception of the different generational groups that
financial rewards such as high salary and bonuses causes or contributes to employee
satisfaction and motivation. This also represents a non-confirmatory test of the
Herzberg Two Factor Theory ( The motivators) which states emphatically that only
intrinsic rewards contributes to employee satisfaction and motivation.
Fourthly, the study outlined GSB/PL rewards system currently operational and
accessible by employees of the company as a variety of extrinsic rewards both financial
and non financial rewards such as high salary (pay increases), bonus scheme, training
and learning opportunities, job security, promotion, attractive company policies and

79
administration, flexible work schedule, long service awards and benefits such as
housing, health insurance, transport or bussing service and many more.
The study also emphasizes GSB/PL critical success factors in the design and
implementation of their current rewards system as including profiling of the entire
workforce during the assessment phase, leadership (management) commitment and
support, clear articulation of objectives, effective and efficient communication and
employee involvement. The study finally highlights on the phases involved in the
design and implementation of the GSB/PL rewards system as assessment, design,
execution and evaluation phases.
Despite all the three generational groups indicated high preferences for high salary and
bonuses (financial rewards), the few employees in these three generational groups
which indicated preferences for other non-financial rewards could be implicated that
employees as individuals are distinct and motivated by different things and that in
satisfying their needs, GSB/PL must maintain a wide variety of reward packages to be
able to satisfy a greater number of the work forces.
GSB/PL high average annual turnover of 13.97% is implicative that the company's
rewards system had done little in accomplishing its objectives of attracting, retaining,
motivating and developing new talents and that it must be varied to include more
intrinsic rewards so as to have a close balance of intrinsic and extrinsic rewards to be
able to accomplish the system objectives as planned
6.2.0 Recommendation
It is recommended that to be effective, when designing and implementing
reward–performance practices, managers must be cognizant of a range of
context specific and confounding forces that could potentially influence the
performance implications of different types of rewards.
It is recommended that during designing and implementation of the GSB/PL
rewards systems, the management and other team members responsible for the
design and implementation of the company's reward system review the abundant
literature on rewards system to gather sufficient information and ideas and be
able to develop more attractive and better rewards system for their employees.
It is recommended that GSB/PL introduces more intrinsic rewards such as high
personal growth, career advancement, etc as such rewards have great potential of
enhancing employee satisfaction and motivation.

80
It is recommended that the team responsible for the design and implementation
of the GSB/PL reward systems during communication with their employees
abide greatly by the Titanium Rule: "Do unto others, keeping their preferences
in mind" as this rule makes messages far more persuasive. The Titanium rule
makes it possible for someone of a different generation during communication
to adapt other persons preferences instead of sticking with one‘s own personal
style.
It is recommended that employers consider changing the way employees are
treated in the in the workplace as that have more impact rather than changing the
way they are paid (Blinder, 1990).
It is recommended that employers should be aware and prepared to act
accordingly as employees may seek, value, and respond to rewards that are not
directly financial but involve quite different outcomes such as career
development or training opportunities, meeting working time preferences,
personal recognition, and gaining a sense of meaning from work.
It is recommended that in order to grasp both the variety and similarity of reward
preferences across an increasingly diverse workforce profile, employer
(GSB/PL) will need to consult and involve employees there more carefully and
extensively Cox et al (2010, p.256).

81
BIBLIOGRAPHY
Adams, J.S. (1963) "Towards an understanding of inequity", Journal of Abnormal
Social Psychology, 67, pp.422-36
Adams, J.S. (1965) "Inequity in social exchange" in Berkowitz, L. (ed.) Advances in
Experimental Social Psychology, Vol. 2. New York: Academic Press
Alderfer, C.P. (1972) "Existence, Relatedness and Growth", New York: Collier
Macmillian.
Ambrose, M. L., & Kulik, C. T. (1999)."Old friends, new faces: motivation research in
the 1990s", Journal of Management, 25(3), 231–292.
Arksey, H. and Knight, P. (1999) "Interviewing for Social Scientist, London:Sage.
Armstrong, M. (1999) "Employee Reward" (2nd ed.), London: IPD House.
Balmer, S., & Baum, T. (1993). Applying Herzberg‘s hygiene factors to the changing
accommodation environment. International Journal of Contemporary Hospitality
Management, 5(2), p.32–35.
Bandura, A., & Cervone, D. (1983) "Self-evaluative and self-efficacy mechanisms
governing the motivational effects of goal systems" Journal of Personality and Social
Psychology, 45, p.1017–1028
Bartol, K. M. and Srivastava, A. (2002). ‗Encouraging knowledge sharing: the role of
organizational reward systems‘. Journal of Leadership and Organization Studies, 9, 64–
76.
Beer, M., Spector, B., Lawrence, P.R., Mills, D.Q., and Walton, R.E. (eds.) (1985)
"Human Resource Management: General Manager‘s Perspective", New York: The Free
Press.
Blinder, A. (Ed.). (1990). Paying for productivity. New York: Brookings Institution
Press.
Blum, M. L. (1949) "Industrial Psychology and its Social Foundations", New York:
Harper & Brothers.
Bowditch, J.L. & Buono, A.F. (2005) "A primer on organizational behaviour" 6th
edition, New York :John Wiley & Sons

82
Boxall, P. and Purcell, J. (2003). Strategy and Human Resource Management. New
York: Palgrave Macmillan
Brooks I., Davenport H., Stephens J., Swailes S. (2009) ―Organizational Behaviour:
Individuals, Groups and Organization‖ 4th
edition, England: Prentice Hall, page 79-100
Brown, W., & Nolan, P. (1988). Wages and productivity: The contribution of industrial
relations research to an understanding of pay determination. British Journal of Industrial
Relations, 26, 339–361.
Buelens, M., Sinding, K. & Waldstrøm, C. (2011) "Organizational Behaviour" 4th edn,
McGraw-Hill
Cable, D.M., and Judge, T.A. (1994), ‗Pay Preferences and Job Search Decision: A
Person–organization Fit Perspective,‘ Personnel Psychology, 47, 2, 317–348.
Cadsby, C. B., Song, F. and Tapon, F. (2007). ‗Sorting and incentive effects of pay for
performance: an experimental investigation‘. Academy of Management Journal, 50,
387–405.
Campbell, J.P., Pritchard, R.D., 1976. "Motivation theory in industrial and
organizational psychology" In: Dunnette, M.D., Hough, L.M. (Eds.), Handbook of
Industrial and Organizational Psychology. Wiley, New York, pp. 63–130.
Chen, Y., Lou, H., (2002) "Toward an understanding of the behavioral intention to use a
groupware application", Journal of End User Computing 14, 1–16.
Chiang, C. F., Jang, S.C.,(2008) " An expectancy theory model for hotel employee
motivation", International Journal of Hospitality Management 27 (2008) 313–322
Chiang, F.F.T., and Birch, T. (2007) "The Transferability of Management Practices:
Examining Cross-national Differences in Reward Preferences", Human Relations, 60, 9,
1293–1330.
Chiu, R.K., Luk, V.W.-M., and Tang, T.L.-P. (2002) "Retaining and Motivating
Employees: Compensation Preferences in Hong Kong and China", Personnel Review,
31, 4, 402–431.
Chartered Institute of Personnel and Development (CIPD). (2006). Annual reward
management survey. London: Author
Chartered Institute of Personnel and Development (CIPD). (2007). Annual reward
management survey. London: Author.

83
Clark, A.E. (1997), ―Job satisfaction and gender: why are women so happy at work‖,
Labour Economics, Vol. 4 No. 4, pp. 341-72.
Collis, J & Hussey, R. (2009) ―Business Research: A practical Guide for Undergraduate
and Postgraduate Students‖ 3rd
Edition, Basingstoke: Palgrave Macmillan, pp.56-278
Corby, S., White, G., & Stanworth, C. (2005). No news is good news? Evaluating new
pay systems. Human Resource Management Journal, 15: 4-24.
Cox, A. (2005). The outcomes of variable pay systems: Tales of multiple costs and
unforeseen consequences. International Journal of Human Resource Management, 18,
1475–1497.
Cox, A, Brown, D., Reilly, P. (2010) "Reward Strategy: Time for a More Realistic
Reconceptualization and Reinterpretation?" Thunderbird International Business Review
Vol. 52, No. 3, p.249-259
Dearnley, C., & Matthew, B. (2007) "Factors that contribute to undergraduate student
success" Teaching in Higher Education, 12(3), p.377−391.
DeShields, O. W., Jr., Kara, A., & Kaynak, E. (2005) "Determinants of business student
satisfaction and retention in higher education: applying Herzberg‘s Two-Factor Theor",
International Journal of Educational Management, 19(2), p.128–139.
Doering, M., Rhodes, S., and Schuster, M. (1983), The Aging Worker. Research and
Recommendations, Beverly Hills, CA: Sage Publications.
Dries, N., Pepermans, R., De Kerpel, E. (2008) "Exploring four (4) Generations Belief
About Career: Is Satisfied the New Successful?", Journal of Managerial Psychology,
23,8, p.907-928
Easterby-Smith, M., Thorpe, R. and Lowe, A. (1991) "Management Research: An
Introduction, London:Sage.
Fernandes, F. N. (1998). Total Reward-An Actuarial Perspective. Actuarial Research
Paper, No.116.
Festinger, L. (1954) "A theory of social comparison processes" Human Relations, 7,
p.117–140.
Foot M., Hook C., (2008) ―Introducing Human Resource Management`` 5 edition,
England: Prentice Hall

84
Freitas, F.A., Leonard, L.J. (2011) "Maslow's hierarchy of needs and student academic
success" Teaching and Learning in Nursing (2011) 6, p.9–13
Frombrun, C., Tichy, N.M., and Devanna, M.A. (eds.) (1984),"Strategic Human
Resource Management", New York: Wiley.
Furnham, A., Forde, L., & Ferrari, K. (1999) "Personality and work motivation",
Personality and Individual Differences, 26(6), 1035–1043.
Gerhart, B., & Rynes, S. (2003). Compensation. London: Sage.
Geurts, S., Schaufeli, W., & De Jonge, J. (1998). "Burnout and intention to leave among
mental health-care professionals: A social psychological approach", Journal of Social
and Clinical Psychology, 17, p.341–362
Goble, F. The Third Force: The Psychology of Abraham Maslow. Richmond, Ca:
Maurice Bassett Publishing, 1970. P.62.
Goodman, P. A and Friedman, A. (1971) "An examination of Adams' theory of equity"
Administrative Science Quarterly, 16.
Greenberg, J. (1990) "Employee theft as a reaction to underpayment inequity: The
hidden cost of pay cuts". Journal of Applied Psychology, 75, p.561–568.
Güngör, P. (2011)"The Relationship between Reward Management System and
Employee Performance with the Mediating Role of Motivation: A Quantitative Study
on Global Banks"Procedia Social and Behavioral Sciences 24 (2011) p.1511
Hall, D. T. and Nougaim, K.E. (1968) "An Examination of Maslow's Need Hierarchy
in an Organizational Setting" Organizational behavior and human performance, 3, p.12-
35
Hamel, S., Leclerc, G., & Lefrancois, R. (2003) "A psychological outlook on the
concept of transcendent actualization" The International Journal for the Psychology of
Religion, 13(1), p. 3−15.
Hansen, F., Smith, M., & Hansen, R. (2002). Rewards and recognition in employee
motivation. Compensation & Benefits Review, 34(5), 64–72.
Harackiewicz, J. M., Manderlink, G., & Sansone, C. (1984). "Rewarding pinball
wizardry: Effects of evaluation and cue value on intrinsic interest", Journal of
Personality and Social Psychology, 47, p.287–300.

85
Harrell, A. & Stahl, M. A.,(1981) "Behavioral Decision Theory Approach For
Measuring McClelland's Trichotomy of Needs", Journal of Applied Psychology, pp
242-247
Harrell, A. M. & Stahl, M. J. (1984) "Mcclelland's trichotomy of needs theory and the
job satisfaction and work performance of CPA firm professionals" Accounting
Organizations and Society, Vol 9, No 3/4, Pergamon Press Ltd, pp 241-252
Hein, H.H. (2009) "Motivation: motivationsteori og praktisk anvendelse",1st edn, Hans
Reitzel, Kbh.
Heneman, H. G., III and Judge, T. A. (2000). ‗Compensation attitudes‘. In Rynes, S. L.
and Gerhart, B.(Eds), Compensation in Organizations: Current Research and Practice.
San Francisco, CA: Jossey-Bass, 61–103.
Heneman, H.G., Schwab, E.P., (1972) "Evaluation of research on expectancy
predictions of employee performance", Psychological Bulletin 78, 1–9.
Heneman, R.L (2007) " Implementing Total Rewards Strategies: A guide to
successfully planning and implementing a total rewards system" SHRM Foundation‘s
Effective Practice Guidelines Series, p.3
Herzberg, F. (1969) "One more time: How do you motivate employees?" Harvard
Business Review, 46(1), p.53-62
Herzberg, (1966) ―Work and the Nature of Man‖ Cleveland, OH: World Publishing,
1966
Hofstede, G (1984). "The cultural relativity of the quality of life concept". Academy of
Management Review 9 (3): 389–398. doi:10.2307/258280. JSTOR 258280.
http://www.nyegaards.com/yansafiles/Geert%20Hofstede%20cultural%20attitudes.pdf
Human Resource Consulting 2006 Worldwide Pay Survey; Hewitt Associates‘
2005/2006 Salary Increase Survey; World-at-Work 2005/2006 and 2004/2005 Salary
Budget Survey
Jurgensen, C.E. (1978), ‗Job Preferences (What Makes a Job Good or Bad?),‘ Journal of
Applied Psychology, 63, 3, 267–276.
Kanfer, R., and Ackerman, P.L. (2004), ‗Aging, Adult Development and Work
Motivation,‘ Academy of Management Review, 29, 3, 440–458
Kanungo, R.M., and Mendonca, M. (1988) "Evaluating Employee Compensation"
California Management Review, 31, 23–39.

86
Kaplan, S. L. (2007). Business Strategy, People Strategy and Total Rewards. Benefits &
Compensation Digest, Vol. 44, No. 9, pp. 12-19.
Kerr, S. ―Executives Ask: How and Why Should Firms and Their Employees Set
Goals,‖ Academy of Management Executive, 18, no. 4 (November 2004), pp. 122–3.
Krejcie, R. V and Morgan, D. W (1970) ―Determining sample size for research
activities‖ Educational and Psychological Measurement, 30, pp.607-10.
Kubal, D., Newman, J. (2008) "Workforce: Work-Life Balance Becoming a Key Tool
for Retention" http://www.workforce.com/article/20080507/Tools/305079992
LaPorte, R., & Nath, R. (1976) "Role of performance goals in prose learning" Journal of
Educational Psychology, 68, 260–264.
Latham, G. P., & Yukl, G. A. (1975)."Assigned versus participative goal setting with
educated and uneducated wood workers2, Journal of Applied Psychology, 60, 299–302.
Lawler, E. E. III (2000). Rewarding Excellence: Pay Strategies for the New Economy.
San Francisco, CA: Jossey-Bass.
Lawler, E.E. III. (1990) "Strategic Pay: Aligning Organizational Strategies and Pay
Systems", San Francisco, CA: Jossey-Bass Inc.
Lawler, E.E. (1973) "Motivation in Work Organizations", New York: Brooks-Cole
Publishing.
Lawler, E. E. and Suttle, J.L. (1972) " A causal correlation test of the need hierarchy
Concept", Organizational behavior and human performance,7, p.265-287
Leonard, N.H. (1999) "Work motivation: The Incorporation of Self-Concept-Based
Processes" Human Relations, 52/8, p.970.
Lewis, P. (1998). Managing performance-related pay based on evidence from the
financial services sector. Human Resource Management Journal, 8(2), 66–77.
Locke, E., & Bryan, J. (1967). Performance goals as determinants of level of
performance and boredom. Journal of Applied Psychology, 51, p.120–130
Locke, E. A., & Bryan, J. (1968) "Goal setting as a determinant of the effects of
knowledge of score in performance", American Journal of Psychology, 81, p.398–406.

87
Locke, E. A., & Bryan, J. (1969) "The directing function of goals in task performance",
Organizational Behavior and Human Performance, 4, p.35–42
Locke, E. A., Chah, D., Harrison, S., & Lustgarten, N. (1989) "Separating the effects of
goal specificity from goal level" Organizational Behavior and Human Performance, 43,
p.270–287.
Locke, E. A., Smith, K., Erez, M., Chah, D., & Schaffer, A. (1994) "The effects of intra-
individual goal conflict on performance", Journal of Management, 20, 67–91.
Locke, E. A. & Latham, G. P. (2002). Building a practically useful theory of goal
setting and task motivation. American Psychologist, 57, 706.
http://www.owlnet.rice.edu/~antonvillado/courses/08c_psyc101002/Research%20Repor
t%204.pdf
Lundberg, C., Gudmundson, A., Andersson, T.D. (2009)" Herzberg‘s Two-Factor
Theory of work motivation tested empirically on seasonal workers in hospitality and
tourism" Tourism Management 30 p.890–899
Mamman, A., Sulaiman, M., & Fadel, A. (1996). Attitudes to pay systems: An
exploratory study within and across cultures. International Journal of Human Resource
Management, 7(1), 101–121.
Martin, J. and Harder, J. (1994) ―Bread and roses: Justice and the distribution of
financial and socio-emotional rewards in organizations,‖ Social Justice Res., vol. 7, no.
3, pp. 241–264
Maslow , A. H. (1943) "A theory of human motivation" Psychological Review, 50 (4),
p.370-396
Maslow, A. H. (1954). Motivation and personality, 3rd ed. New York: Longman.
McClelland, D. C, (1961) " The Achieving Society" New York :Van Nostrand
McClelland, D.C. (1965) "Achievement and Entrepreneurship A Longitudinal Study",
Journal of Personality and Social Psychology (1965) pp 389-392
McCielland, D C & Wmter, D. (1969) "Motivating Economic Achievement" New York:
New York Free Press
McClelland, D. C., (1975) Power. "The lnner Experience" New York: Irvmgton
McClelland, D. C. & Burnham, D. H. (1976) "Power is the Great Motivator", USA:
Harvard Busmess Review (1976) pp 54, 100-110

88
McClelland, D. C., Atkmson, J., Clark, R. & Lowell, E. (1976) "The Achievement
Motive" New York: Irvmgton,
McClelland, D. C. & Boyatzis, R. E. (1982) "Leadership Motive and Long-Term
Success in Management", Journal of Applied Psychology (1982), pp 737-743
Mento, A., Locke, E., & Klein, H. (1992) "Relationship of goal level to valence and
instrumentality" Journal of Applied Psychology, 77, p.395–405.
Mercer Human Resource Consulting (2006) " Worldwide Pay Survey", the results of
which are also reported in summary format in Workspan (December 2005), p.14-16.
Mitchell, T.R., 1974. Expectancy models of job satisfaction, occupational preference
and effort: a theoretical, methodological and empirical appraisal. Psychological Bulletin
81, 1053–1077.
Mitchell, T.R., Biglan, A., (1971) "Instrumentality theories: current uses in
psychology", Psychological Bulletin 76 (6), 432–454.
Nelson, B. (2007) "One Size Does Not Fit All" Financial and Insurance Meetings, 43,1,
p.35-37
O‘Neill, G. (1995). Framework for developing a total reward strategy.Asia Pacific
Journal of Human Resources, 33, 103–117.
Parsons, E., & Broadbride, A. (2006). Job motivation and satisfaction: unpacking the
key factors for charity shop managers. Journal of Retailing and Consumer Services,
13(2), 121–131
Perry, L. S. (1993) "Effects of inequity on job satisfaction and self-evaluation in a
national sample of African-American workers", Journal of Social Psychology, 133,
565–573.
Pinder, C. (1984) "Work Motivation", Glenview, IL:Scot, Foresman.
Pinder, C. (1998) "Work motivation in organizational behaviour" USA: Prentice Hall.
Pinder, C.C. (2008), Work motivation in organizational behavior, 2nd edn, Psychology
Press, New York, NY.
Porter, L.W., Lawler, E.E., (1968) "Managerial Attitudes and Performance".
Homewood, IL: Irwin

89
Rainey, H.G. (1982) "Reward Preferences Among Public and Private Managers: In
Search of Service Ethic", American Review of Public Administration, 16, 4, 288–302.
Reilly, P., & Brown, D. (2008). Employee engagement: What is the relationship with
reward management? WorldatWork Journal, 17(4), 37–47.
Robinson D., Hooker H., & Hayday S. (2007). Engagement: The continuing story.
Report 447. Brighton, UK: Institute for Employment Studies.
Rosen, S. (1974), ―Hedonic prices and implicit market: product differentiation in pure
competition‖, Journal of Political Economy, Vol. 82 No. 1, pp. 34-55.
Rothkopf, E., & Billington, M. (l979) "Goal-guided learning from text: Inferring a
descriptive processing model from inspection times and eye movements", Journal of
Educational Psychology, 71, p.310–327.
Schaufeli, W. B., Van Dierendonck, D., & Van Gorp, K. (1996) "Burnout and
reciprocity: Towards a dual-level social exchange model" Work & Stress, 10, p. 224–
237.
Schuler, R.S., and Jackson, S.E. (1996) " Human Resource Management: Positioning
for the 21st Century", (6th ed.), New York: West Publishing Company.
Seijts, G. H., & Latham, G. P. (2000b) "The effects of goal setting and group size on
performance in a social dilemma", Canadian Journal of Behavioural Science, 32, 104–
116.
Shapiro, S. L., Trevino, L. K., & Victor, B. (1995) "Correlates of employee theft: A
multidimensional justice perspective" International Journal of Conflict Management, 6,
p.404–414.
Skinner, B.F., (1969) "Contingencies of Reinforcement: Appleton-Century-Crofts",
New York
Stahl, M & Harrell, A.(1981) "Modeling Effort Decisions With Behavioral Decision
Theory Toward An Individual Differences Model of Expectancy Theory",
Organizational Behavior and Human Performance, pp 303-325
Stahl, M & Harrell, A. (1982) "The Evolution and Validation of a Behavioral Decision
Theory Measurement Approach to Achievement, Power and Affiliation, Journal of
Applied Psychology
Steers, R. M.,& Porter, L.W. (1991) "Motivation and work behaviour" New York:
McGraw Hill

90
Suff, P., & Reilly, P. (2004). Flexing your remuneration: Variable pay at work.
Brighton: IES.
Suff, P., Reilly, P., & Cox, A. (2008). Paying for performance: New trends in
performance-related pay. Brighton: IES.
Sun, L. Y., Aryee, S. and Law, K. S. (2007). ‗High-performance human resource
practices, citizenship behaviour, and organizational performance: a relational
perspective‘. Academy of Management Journal, 50, 558–77.
Tarris, T. W., Kalimo, R. and Schaufeli, W.B.,(2002) ―Inequity at work: its
measurement and association with worker health‖ work & stress, 2002, vol. 16, no. 4,
287–301 http://www.tandfonline.com/doi/pdf/10.1080/0267837021000054500
Thaler, R. and Rosen, S. (1976), ―The value of saving a life: evidence from the labor
market‖, in Terleckyj, N.E. (Ed.), Household Production and Consumption, Columbia
University Press for NBER, New York, NY, pp. 265-98.
Tietjen, M. A., & Myers, R. M. (1998) "Motivation and job satisfaction" Management
Decision, 36(4), p.226–231.
Tien, F.F., (2000) "To what degree does the desire for promotion motivate faculty to
perform research? Testing the expectancy theory", Research in Higher Education 41 (6),
723–752.
Tolman, E. and Honzik, C. (1930) "Introduction and removal of reward and maze
performance of rats" University of California Publications in Psychology, 4, pp.257-75.
Tyler, T.R. and Bies, R.J. (1990)"Beyond formal procedures: The interpersonal context
of procedural justice", in Caroll, J.S (ed.), Applied Social Psychology and Organizatioal
Settings. Hillsdale, NJ: Lawrence Erlbaum, pp. 77-98
Van Dierendonck, D., Schaufeli, W. B., & Sixma, H. J. (1994) "Burnout among general
practitioners: A perspective from equity theory", Journal of Social and Clinical
Psychology, 13, p.86–100.
Van Dierendonck, D., Schaufeli, W. B., & Buunk, B. P. (1996) "Inequality among
human service professionals: Measurement and relation to burnout", Basic and Applied
Social Psychology, 18, p.429–451.
Van Yperen, N. W., Hagedoorn, M., & Geurts, S. A. E. (1996) "Intent to leave and
absenteeism as reactions to perceived inequity: The role of psychological and social
constraints" Journal of Occupational and Organizational Psychology, 69, p.367–372.

91
Van Yperen, N. W. (1998) "Informational support, equity and burnout: The moderating
effect of self-efficacy" Journal of Occupational and Organizational Psychology, 71,
p.29–33.
Van Eerde, W., Thierry, H., (1996) "Vroom‘s expectancy models and work related
criteria: a meta-analysis", Journal of Applied Psychology 81 (5), 575–586.
Van Ophem, H. (1991), ―Wages, nonwage job characteristics and the search behavior of
employees‖, Review of Economics and Statistics, Vol. 73 No. 1, pp. 145-51.
Vansteenkiste, M., Lens, W., De Witte, H., Feather, N.T., (2005) " Understanding
unemployed people‘s job search behavior, unemployment experience and well-being: a
comparison of expectancy-value theory and self-determination theory", British Journal
of Social Psychology 44 (2), 268–286
Vroom, V.H., (1964) "Work and Motivation" Wiley, New York.
Warneke, D.; Schneider, M (2011) " Expatriate compensation packages: what do
employees prefer?" Cross Cultural Management: An International Journal Vol. 18 No.
2, 2011, pp. 236-256 DOI 10.1108/13527601111126049
Werner, S., & Ward, S. (2004). Recent compensation research: An eclectic review.
Human Resource Management Review, 14, 201–227.
Williams, M.L., McDaniel, M.A., & Nguyen, N.T. (2006). A meta-analysis of the
antecedents and consequences of pay level satisfaction. Journal of Applied Psychology,
91:2, 392-413.
Wood, R., & Locke, E. (1990) "Goal setting and strategy effects on complex tasks", In
B. Staw & L. Cummings (Eds.), Research in organizational behavior (Vol. 12, p. 73–
109). Greenwich, CT: JAI Press.
WorldatWork- The Total Rewards Association:
http://www.worldatwork.org/waw/aboutus/html/aboutus-wh
WorldatWork "The total Reward Associaation"
http://www.worldatwork.org/waw/home/html/compensation_home.jsp
Wright, P. (1989) "Motivation and job satisfaction" In C. Molander (Ed.), Human
resource management. Lund, Sweden: Student litterature.
Zemke, R.,Raines, C., Filipczak, B. (1999) "Generations at Work" Managing the Clash
of Veterans, Boomers, Xers, Nexters in York Workplace, AMACOM, p. 24-33

92
APPENDICES
Appendix 1: GSB/PL Generational Groups Sampled
Appendix 2: GSB/PL Staff Categorization Sampled
Appendix 3: GSB/PL Employee Trunover

93
Appendix 4: GSB/PL Recruitment
Appendix 5: Map of Bogoso/Prestea Gold Mine Concession
Please tick the appropriate box that applies to you.
1. Demographic data:
�Born: before 1940 � Born: 1940-1964 � Born: 1965-1978 � Born 1979-1994
Nationality: ................................................... Sex : � Male � Female
Department: ................................................... Marital Status: � Single � Married
Staff Grade: �Junior Officer �Senior Officer �Management
Staff categorization: � Permanent �Direct Contractor �Trainee
2. Is this your first job? � Yes � No
3. If No, which of the following could be the reason (s) for leaving your previous job (s) ? (Tick as many
boxes as apply)

94
� Low Salary & Bonuses � Lack of Learning/Training opportunities � Lack of Personal
Growth � Lack of Recognition of Performance � Poor Working
Relationships � Lack of Promotion � Lack of Sense of
Achievement � Lack of Job Security � Lack of flexible work schedule � Unattractive Company Policy and Administration � Other
4. If Other (s), please specify here -------------------------------------------------------------------------------------
-------------------------------------------------------------------------------------------------------------------------------
--------------------------------------------------------------------------------
5. Which of the following rewards/incentive compensation plans do you prefer and value most?
� Short term Incentive plan � Long term incentive plan �A combination of the two If you prefer Short term incentive plan please proceed on to Question 6
If you prefer combination of the two please proceed on to Question 6
If you prefer Long term incentives plan please proceed on to Question 7
6. Which of the following short term incentive plans do you prefer and value most?
� Annual Company-wide Bonus plan � Monthly Departmental Bonus plan
� Monthly Company-wide Bonus plan � A Combination
7. Which of the following Long term incentive plans do you value and prefer most?
� A solid retirement plan where employer match employee contributions up to a percentage of
employee paycheck with a vested plan.
� Provision of stock option plans at discounted rate for employees who have been with the company for
five (5) years
8. Aside your monthly salary, which of these forms of reward do you value most?
� Short term financial rewards such as bonuses and annual profit sharing
� Non Financial rewards such as commendation, autonomy, authority
� A combination of these two forms of rewards
9. Which one of the following factors when in absence or inadequate could lead to
dissatisfaction in your current role or position?
� High Salary & Bonuses � Supervision � Good Working
Environment � Long term Job Security � Promotion �
Praise and Recognition � Attractive Company Policy and
Administration
10. Which one of the following factors has the highest tendency of increasing your level
of satisfaction and motivation in your current role or position?

95
� High Salary & Bonuses � Praise and Recognition � High Sense of
Achievement � High Personal Growth � High Responsibility �
Promotion � Job Security � Flexible Work Schedule
11. Which one of the following benefits do you value most?
� Flexible Pension Benefit � Health Insurance Benefit � Holiday/Vacation
Benefit � Housing Benefit � Transportation Benefits � Education benefits
For Question 12 to 14 please rate your level of need in terms of achievement,
affiliation and power on a scale of 1 to 7 by ticking the appropriate box where
1=Low and 7=high
12. How would you rate your need for achievement on a scale of 1 to 7? 1=Low and
7=High �1 �2 �3 �4 �5
�6 �7
13. How would you rate your need for affiliation on a scale of 1 to 7? 1=Low and
7=High �1 �2 �3 �4 �5
�6 �7
14. How would you rate your need for power on a scale of 1 to 7? 1=Low and 7=High
�1 �2 �3 �4 �5 �6 �7
15. Please rate each of these reward package profiles offered for a Job position X
between 100 (the reward package meet my expectations) and 0 (the reward package
does not meet my expectations at all)
� Reward Package for Profile 1:
Remuneration: Low Salary and High bonuses
learning and training opportunities: Inside company on yearly basis
Job security: long term
Personal growth: assigned a personal coach
Career advancement: fair career growth and advancement
Flexible Pension scheme: Higher Pension benefits for those who extends their pension
date.
Share ownership plan: limited in number to Junior staff but unlimited to other
employees.

96
� Reward Package for Profile 2:
Remuneration: Low Salary and low bonuses
learning and training opportunities: Intensive overseas training opportunities every 5
years
Job security: long term
Personal growth: assigned a mentor and personal coach on recruitment
Career advancement: High level of internal promotion, career growth and advancement
Flexible Pension scheme: Higher Pension benefits for those who extends their pension
date.
Share ownership plan: unlimited in number to employees at all levels.
� Reward Package for Profile 3:
Remuneration: High Salary and High bonuses
learning and training opportunities: Limited in-house learning & training opportunities
Job security: short-term
Personal growth: assigned a personal coach
Career advancement: limited opportunity for career advancement
Flexible Pension scheme: No pension benefit
Share ownership plan: limited to management
� Reward Package for Profile 4:
Remuneration: High Salary and Low bonuses
learning and training opportunities: In-house learning/training opportunities on yearly
basis
Job security: long term
Personal growth: Assigned a personal coach
Career advancement: Fair opportunity for career advancement
Flexible Pension scheme: No pension benefit for those who go on early pension.
Share ownership plan: limited in number to all employees except management members
� Reward Package for Profile 5:
Remuneration: Low Salary and Low bonuses
learning and training opportunities: Inside company on yearly basis
Job security: life employment
Personal growth: assigned a personal coach
Career advancement: high opportunity for career advancement
Flexible Pension scheme: extraordinary pension package
Share ownership plan: limited in number to all employees
9. Based on your ratings above, which is the lowest reward package profile that will
worth considering?
� Profile 1 � Profile 2 � Profile 3 � Profile 4 �
Profile 5

97
10. Which reward(s)/incentive(s) do you prefer most in relation to your current job
position?
----------------------------------------------------------------------------------------------------------
----------------------------------------------------------------------------------------------------------
11. Which rewards/incentives motivate you more to stay in your current position/job?
----------------------------------------------------------------------------------------------------------
----------------------------------------------------------------------------------------------------------
HR INTERVIEW
1. Brief description of GSB/PL HR configuration
2. What is the total number of employees in GSB/PL?
3. What proportion of the total employees constitute each categorize below:
A. Management :
B. Senior Officers:
C. Junior Officers
D: Trainee
4. What was GSB/PL employee turnover in the following years: 2011, 2010, 2009,
2008?
Date (Years) 2011 2010 2009 2008
Employee
Turnover
5. What was the total number of employees recruited in each of the following
years: 2011, 2010, 2009, 2008
Date (Years) 2011 2010 2009 2008
Employee
Recruitment
6. What are the current GSB/PL reward systems in place for their employees?
7. What critical success factors do you consider in the design and implementation
of GSB/PL reward systems?
8. What are the phases involved in design and implementation of GSB/PL Reward
Systems
Appendix 6: Questionnaire Survey