How Data Center Infrastructure Management Software Improves Planning and Cuts Operational Costs
29
How Data Center Infrastructure Management Software Improves Planning and Cuts Operational Costs Schneider Electric – Data Center Science Center WP 107 Presentation – February 2014 Schneider Electric – Data Center Science Center WP 107 Presentation – February 2014 Schneider Electric Data Center Science Center White Paper 107
-
Upload
schneider-electric -
Category
Software
-
view
384 -
download
1
Transcript of How Data Center Infrastructure Management Software Improves Planning and Cuts Operational Costs

How Data Center Infrastructure Management Software Improves Planning and Cuts Operational Costs
Schneider Electric – Data Center Science Center WP 107 Presentation – February 2014 Schneider Electric – Data Center Science Center WP 107 Presentation – February 2014
Schneider Electric Data Center Science Center White Paper 107
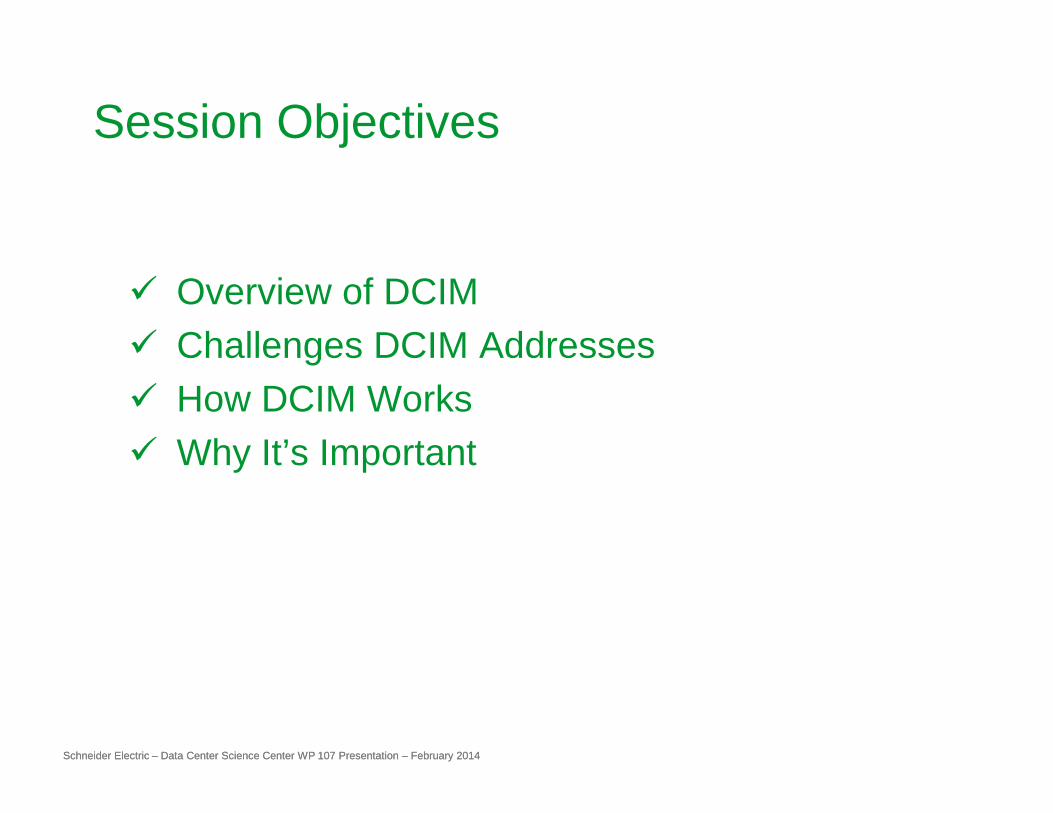
Session Objectives
� Overview of DCIM� Challenges DCIM Addresses� How DCIM Works
Schneider Electric – Data Center Science Center WP 107 Presentation – February 2014 Schneider Electric – Data Center Science Center WP 107 Presentation – February 2014
� How DCIM Works� Why It’s Important

Key Take Away
Do You Have The Right
Tools?
Schneider Electric – Data Center Science Center WP 107 Presentation – February 2014 Schneider Electric – Data Center Science Center WP 107 Presentation – February 2014

Business Applications
IT Infrastructure
Overview Of DCIM
Schneider Electric – Data Center Science Center WP 107 Presentation – February 2014 Schneider Electric – Data Center Science Center WP 107 Presentation – February 2014
Data Center / Facilities InfrastructurePower | Cooling | Racks | Security | Environment
IT InfrastructureServers | Storage | Networking

Challenges DCIM Addresses
Respond Faster to the Business
Maintain Availability Lower Costs
DC Consolidation
Schneider Electric – Data Center Science Center WP 107 Presentation – February 2014 Schneider Electric – Data Center Science Center WP 107 Presentation – February 2014
Capacity Planning
Business
Need to dramatically simplify planning, designing, deploying & operating data centers
Cloud Computing
DC Consolidation
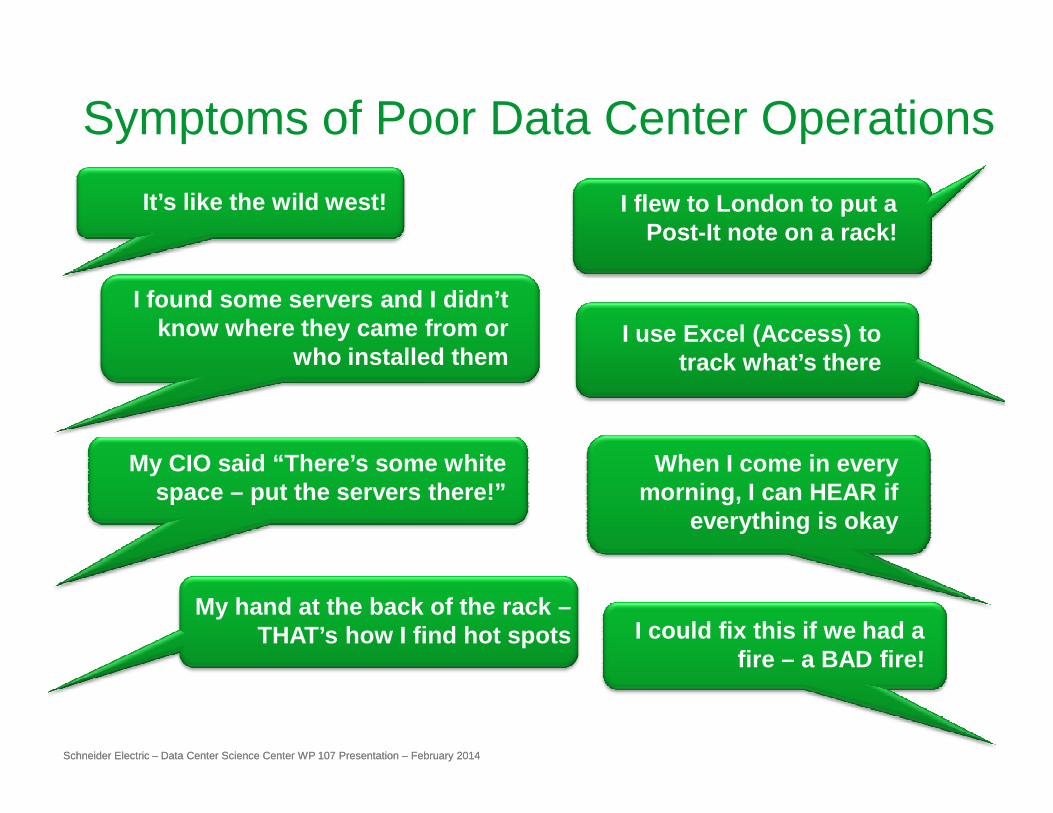
Symptoms of Poor Data Center Operations
I flew to London to put a Post-It note on a rack!
It’s like the wild west!
I use Excel (Access) to track what’s there
I found some servers and I didn’t know where they came from or
who installed them
Schneider Electric – Data Center Science Center WP 107 Presentation – February 2014 Schneider Electric – Data Center Science Center WP 107 Presentation – February 2014
My CIO said “There’s some white space – put the servers there!”
When I come in every morning, I can HEAR if
everything is okay
My hand at the back of the rack –THAT’s how I find hot spots I could fix this if we had a
fire – a BAD fire!

Planning
Schneider Electric – Data Center Science Center WP 107 Presentation – February 2014 Schneider Electric – Data Center Science Center WP 107 Presentation – February 2014
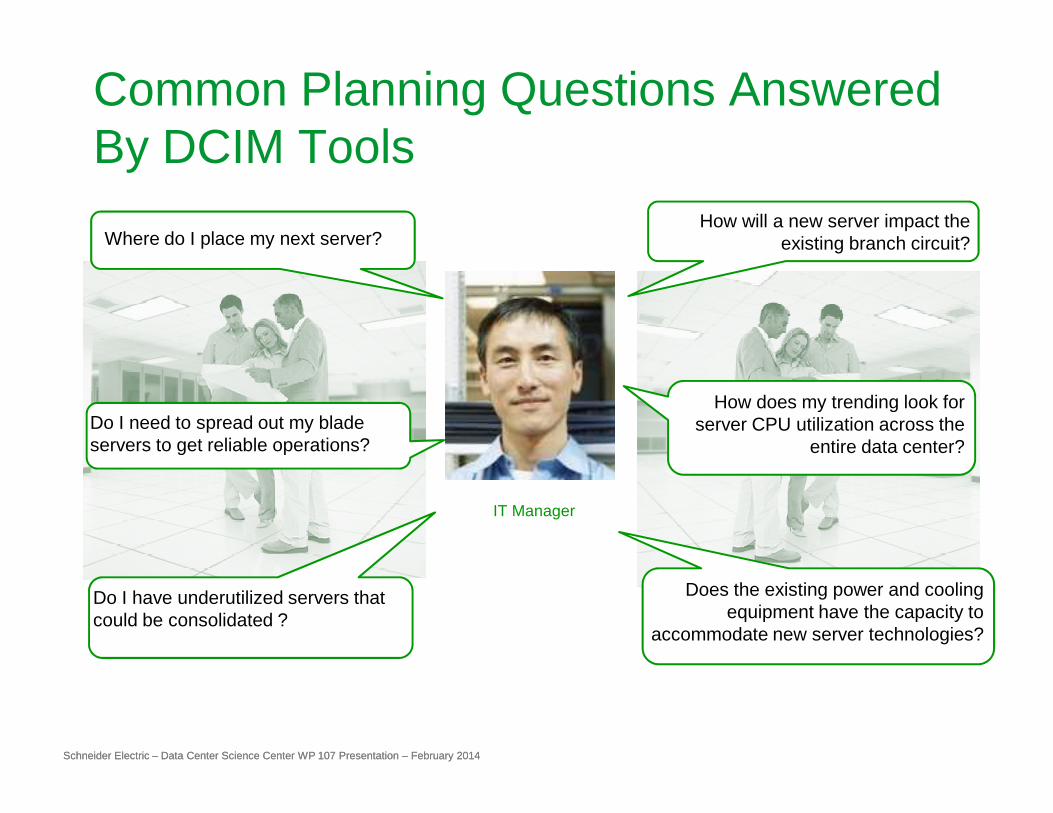
Common Planning Questions Answered By DCIM Tools
How does my trending look for
How will a new server impact the existing branch circuit? Where do I place my next server?
Schneider Electric – Data Center Science Center WP 107 Presentation – February 2014 Schneider Electric – Data Center Science Center WP 107 Presentation – February 2014
How does my trending look for server CPU utilization across the
entire data center? Do I need to spread out my blade servers to get reliable operations?
Does the existing power and cooling equipment have the capacity to
accommodate new server technologies?
IT Manager
Do I have underutilized servers that could be consolidated ?

Provisioning New Systems
Schneider Electric – Data Center Science Center WP 107 Presentation – February 2014 Schneider Electric – Data Center Science Center WP 107 Presentation – February 2014
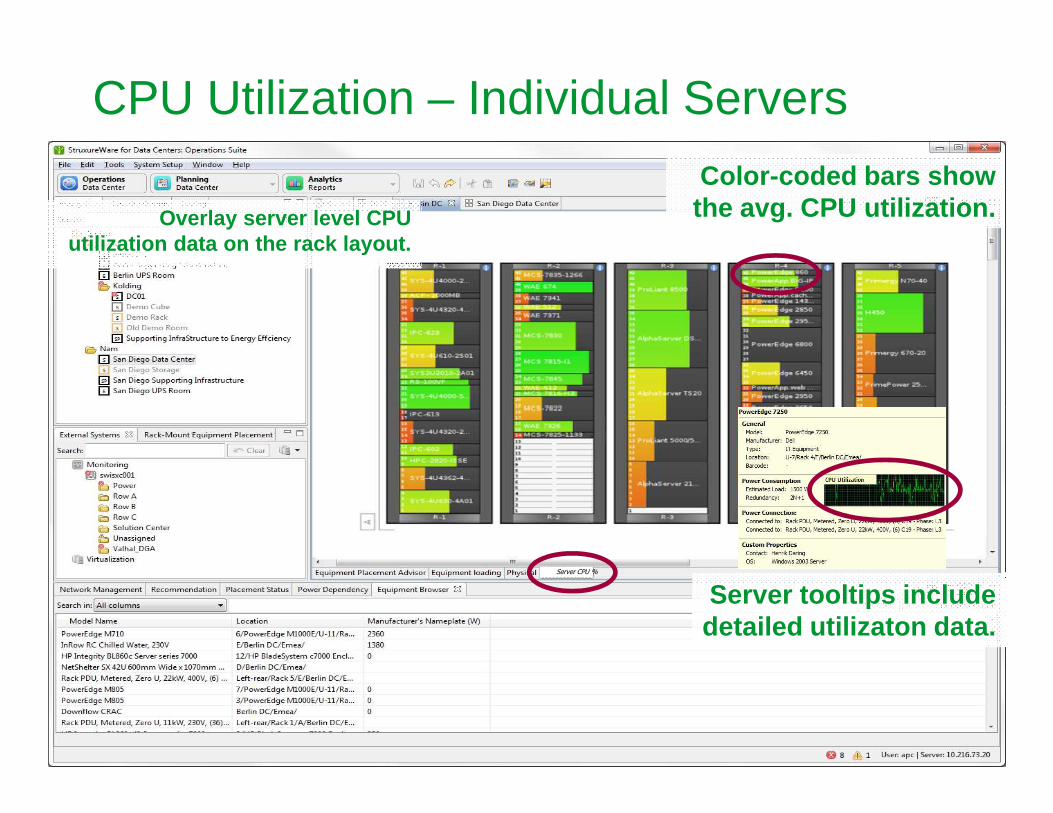
Overlay server level CPU utilization data on the rack layout.
Color-coded bars show the avg. CPU utilization.
CPU Utilization – Individual Servers
Schneider Electric – Data Center Science Center WP 107 Presentation – February 2014 Schneider Electric – Data Center Science Center WP 107 Presentation – February 2014
Server CPU %
Server tooltips include detailed utilizaton data.

CPU Utilization – Trending for Entire DC
Schneider Electric – Data Center Science Center WP 107 Presentation – February 2014 Schneider Electric – Data Center Science Center WP 107 Presentation – February 2014
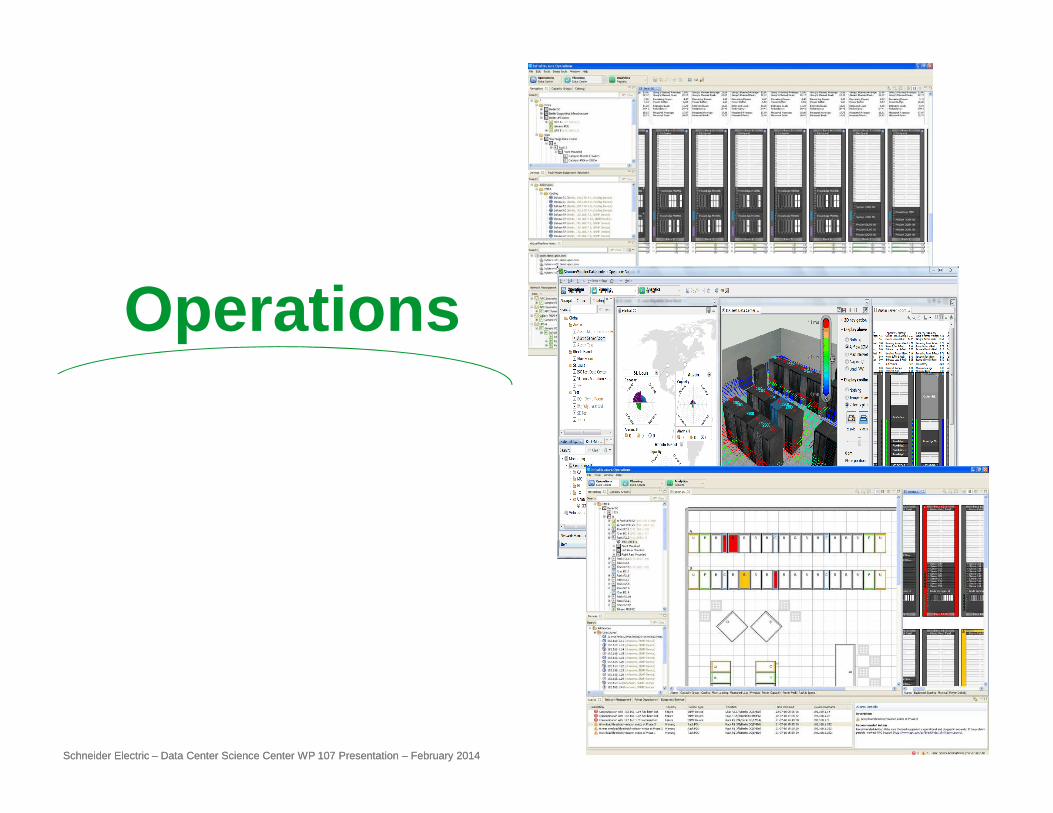
Operations
Schneider Electric – Data Center Science Center WP 107 Presentation – February 2014 Schneider Electric – Data Center Science Center WP 107 Presentation – February 2014
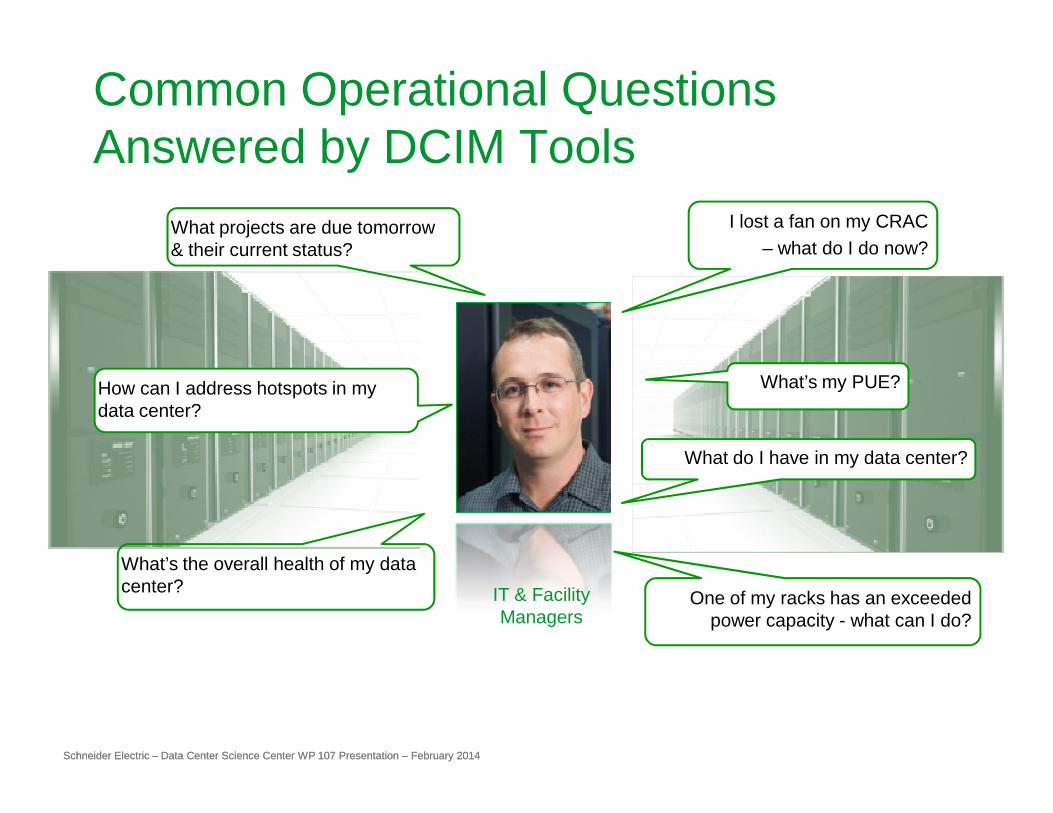
Common Operational Questions Answered by DCIM Tools
What projects are due tomorrow & their current status?
I lost a fan on my CRAC – what do I do now?
How can I address hotspots in my data center?
What’s my PUE?
Schneider Electric – Data Center Science Center WP 107 Presentation – February 2014 Schneider Electric – Data Center Science Center WP 107 Presentation – February 2014
One of my racks has an exceeded power capacity - what can I do?
data center?
What’s the overall health of my data center? IT & Facility
Managers
What do I have in my data center?
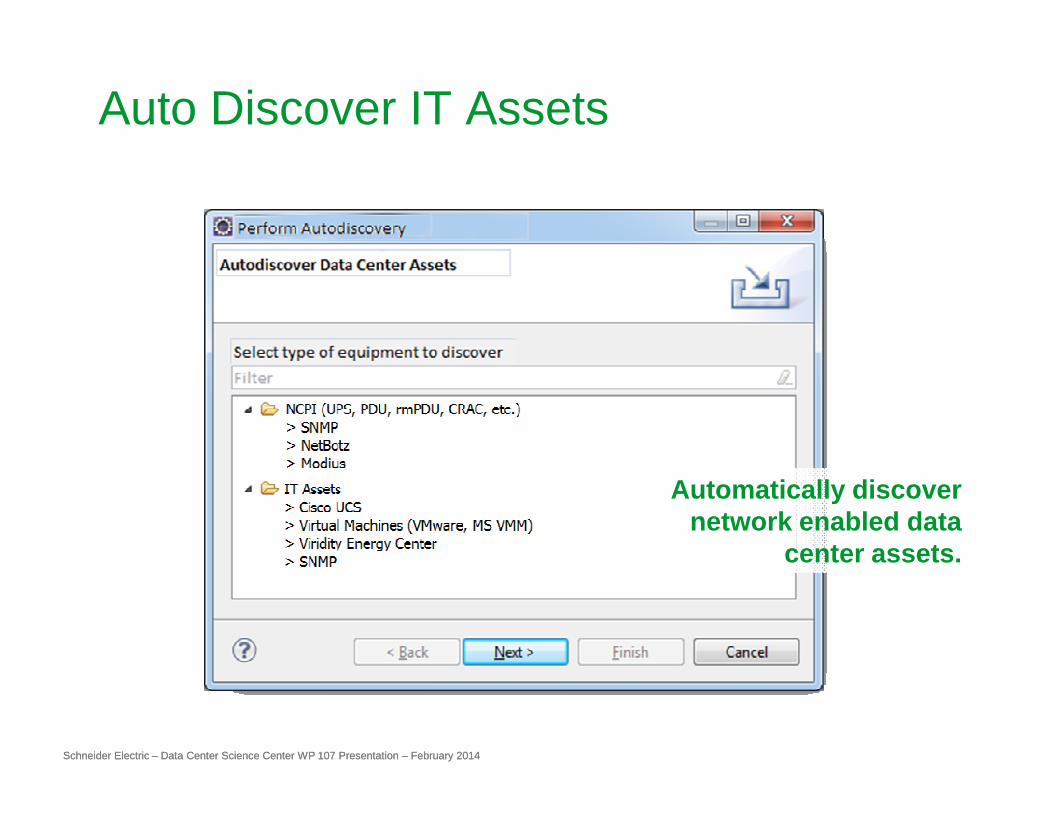
Auto Discover IT Assets
Schneider Electric – Data Center Science Center WP 107 Presentation – February 2014 Schneider Electric – Data Center Science Center WP 107 Presentation – February 2014
Automatically discover network enabled data
center assets.

Discovered assets can be placed directly into the data
center model.
Provision Discovered Assets
Schneider Electric – Data Center Science Center WP 107 Presentation – February 2014 Schneider Electric – Data Center Science Center WP 107 Presentation – February 2014
The model is populated based on the data retrieved during discovery.

Capacity & Alarms in One View
Schneider Electric – Data Center Science Center WP 107 Presentation – February 2014 Schneider Electric – Data Center Science Center WP 107 Presentation – February 2014

●Highlighting entire rack where alarm is present
Alarm View
Schneider Electric – Data Center Science Center WP 107 Presentation – February 2014 Schneider Electric – Data Center Science Center WP 107 Presentation – February 2014

Measure Real-Time Power●Real-time Power Consumption > Power Details Overlay
Real-time power consumption displayed as an overlay on floor and rack layout
Schneider Electric – Data Center Science Center WP 107 Presentation – February 2014 Schneider Electric – Data Center Science Center WP 107 Presentation – February 2014
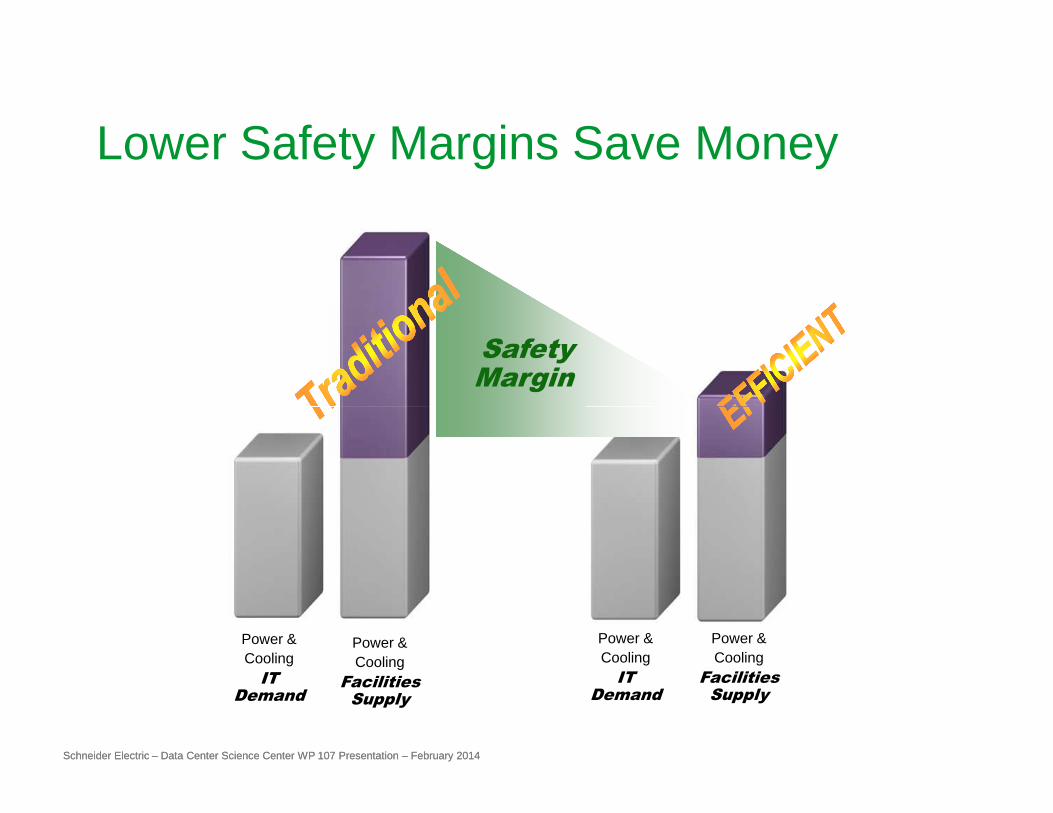
Lower Safety Margins Save Money
SafetyMargin
Schneider Electric – Data Center Science Center WP 107 Presentation – February 2014 Schneider Electric – Data Center Science Center WP 107 Presentation – February 2014
Power &Cooling
IT Demand
Power &Cooling
Facilities Supply
Power &Cooling
IT Demand
Power &Cooling
Facilities Supply
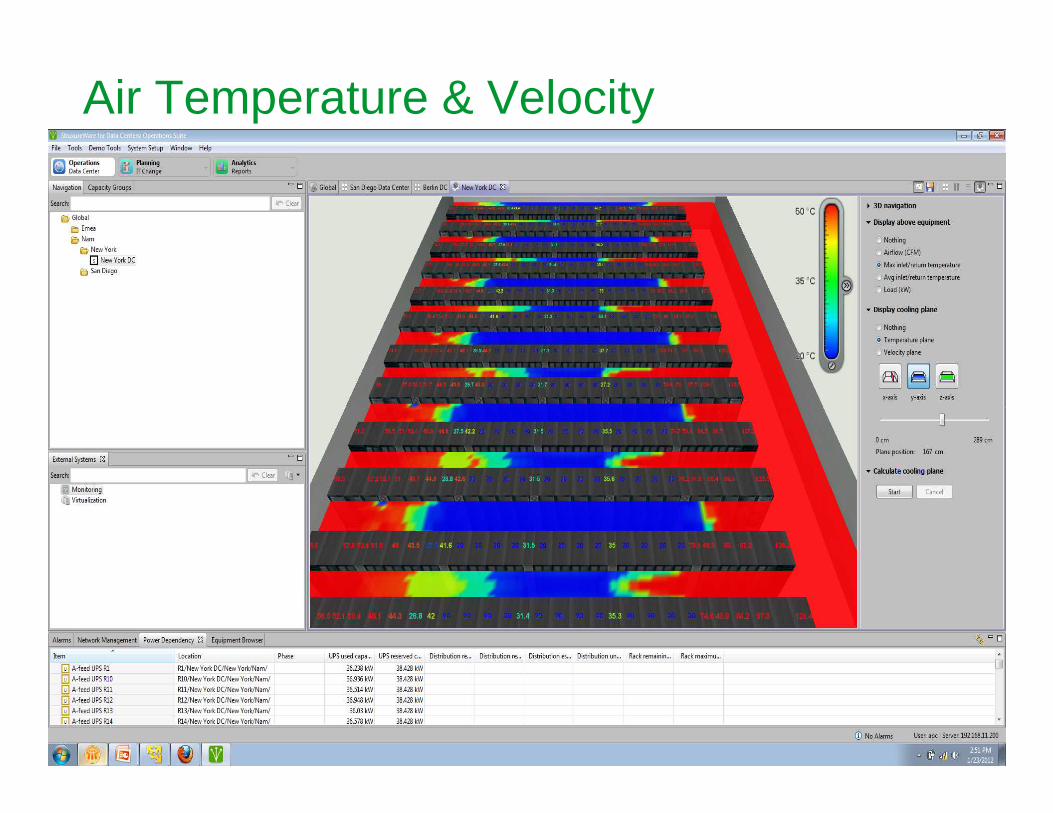
Air Temperature & Velocity
Schneider Electric – Data Center Science Center WP 107 Presentation – February 2014 Schneider Electric – Data Center Science Center WP 107 Presentation – February 2014
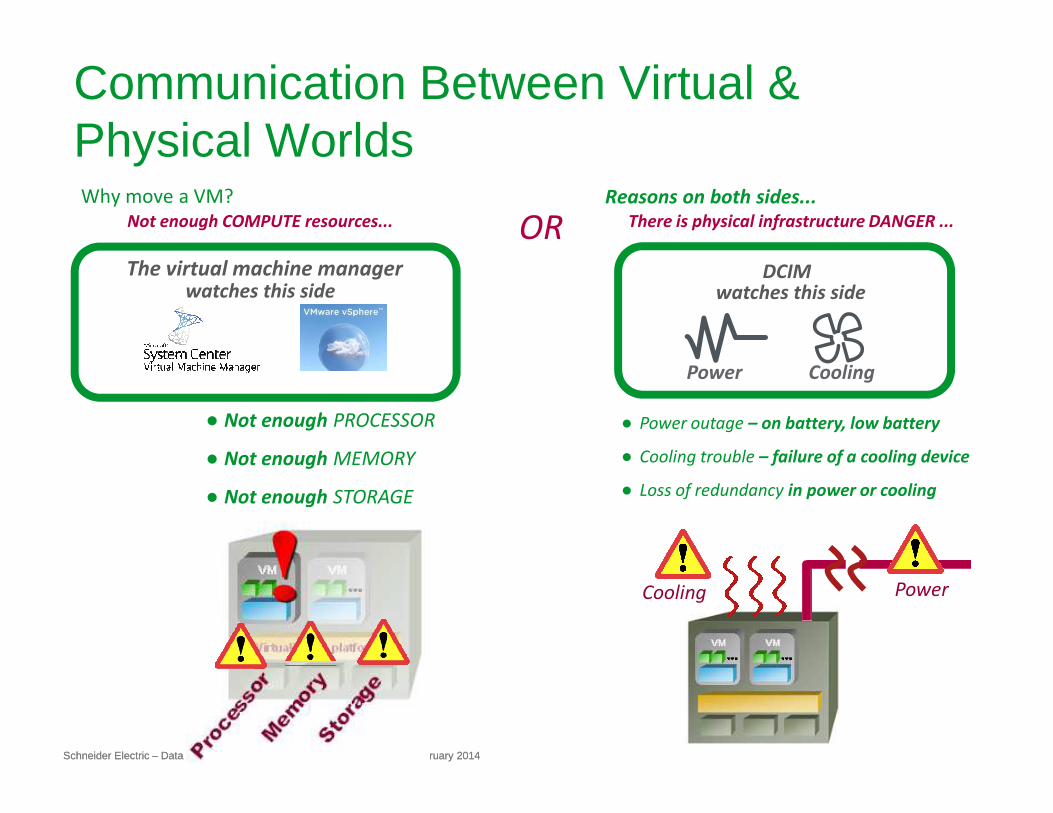
Why move a VM?
Not enough PROCESSOR
Not enough COMPUTE resources... There is physical infrastructure DANGER ...ORThe virtual machine manager
watches this sideDCIM
watches this side
Power Cooling
Reasons on both sides...
Communication Between Virtual & Physical Worlds
Schneider Electric – Data Center Science Center WP 107 Presentation – February 2014 Schneider Electric – Data Center Science Center WP 107 Presentation – February 2014
● Not enough PROCESSOR
● Not enough MEMORY
● Not enough STORAGE
● Power outage – on battery, low battery
● Cooling trouble – failure of a cooling device
● Loss of redundancy in power or cooling
PowerCooling
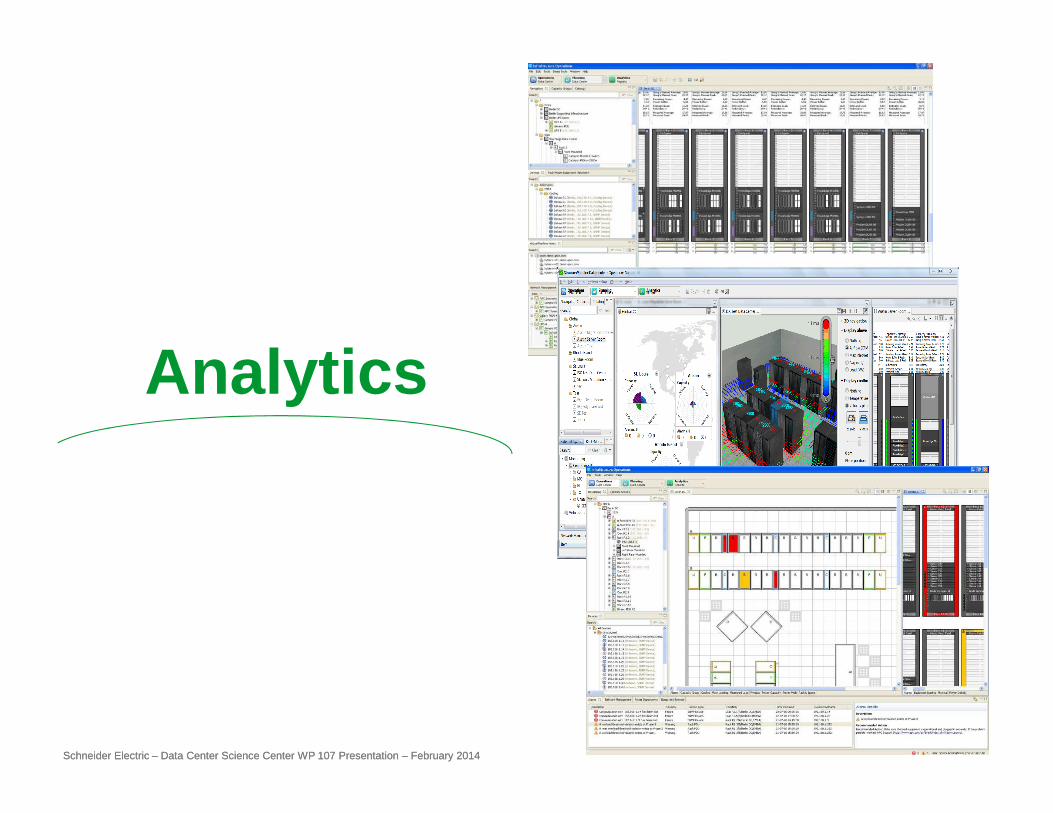
Analytics
Schneider Electric – Data Center Science Center WP 107 Presentation – February 2014 Schneider Electric – Data Center Science Center WP 107 Presentation – February 2014
Analytics

Common Analytical Questions Answered By DCIM Tools
How can I reduce my operational How do I know if our energy
What’s the cost of running my data center?
When will I need to build another data center?
Schneider Electric – Data Center Science Center WP 107 Presentation – February 2014 Schneider Electric – Data Center Science Center WP 107 Presentation – February 2014
How can I reduce my operational expenses?
How do I know if our energyefficiency initiative succeeded?
When will my data center run out of power and cooling capacity?
CIO
Have we met our regulatory requirements?

Capacity Dashboard
Schneider Electric – Data Center Science Center WP 107 Presentation – February 2014 Schneider Electric – Data Center Science Center WP 107 Presentation – February 2014
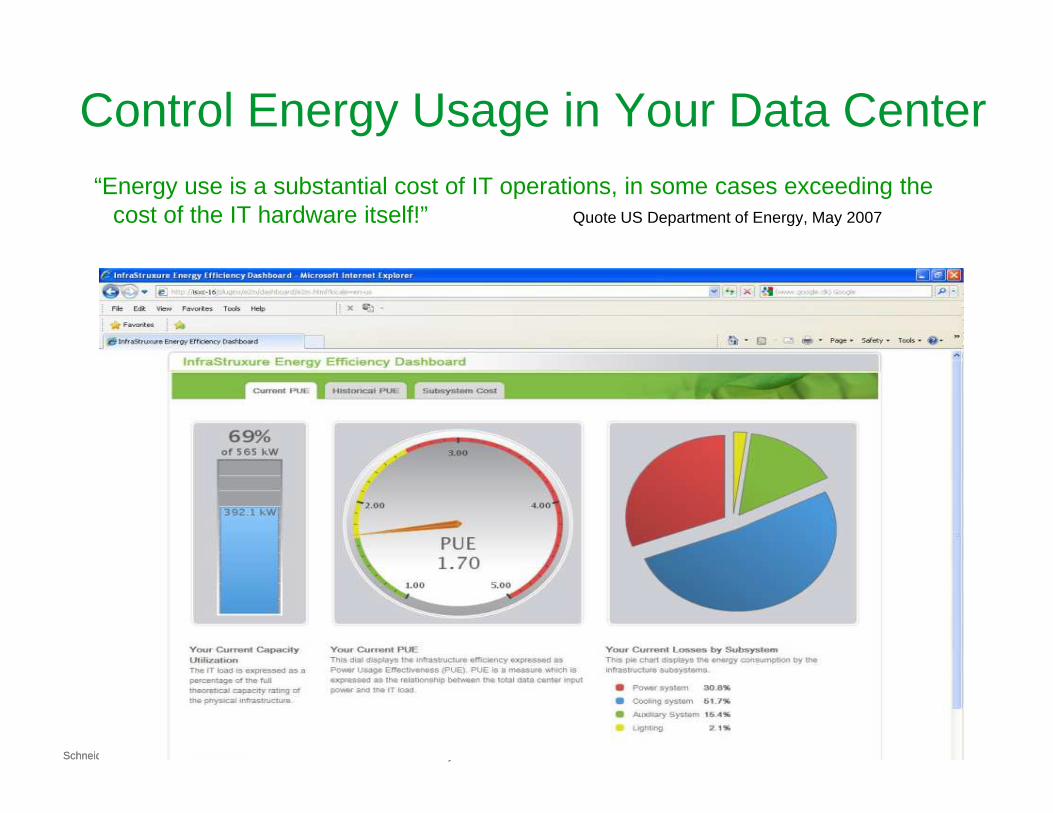
Control Energy Usage in Your Data Center“Energy use is a substantial cost of IT operations, in some cases exceeding the
cost of the IT hardware itself!” Quote US Department of Energy, May 2007
Schneider Electric – Data Center Science Center WP 107 Presentation – February 2014 Schneider Electric – Data Center Science Center WP 107 Presentation – February 2014

Why It’s Important?
Automate Manual Processes � Reporting, inventory, moves/adds/changes, capacity planning, outage
impact analysis, energy measurementsRespond faster to business initiatives by as much as 50%
Financial Benefits� Improve OpEx and CapEx� Reduce costs by 10-30% annually � 3 -18 month ROI is typical
Schneider Electric – Data Center Science Center WP 107 Presentation – February 2014 Schneider Electric – Data Center Science Center WP 107 Presentation – February 2014
� Respond faster to business initiatives by as much as 50%� Dramatically improve productivity
Improve Operational Intelligence � Measure Data Center performance (Energy Efficiency, Resource Utilization,
Process Efficiency)� Link KPI’s to strategies & actions that drive improvement� Holistic view of Data Center for all roles
Overall, DCIM helps you gain control of your infrastructure so that it doesn’t control your business!
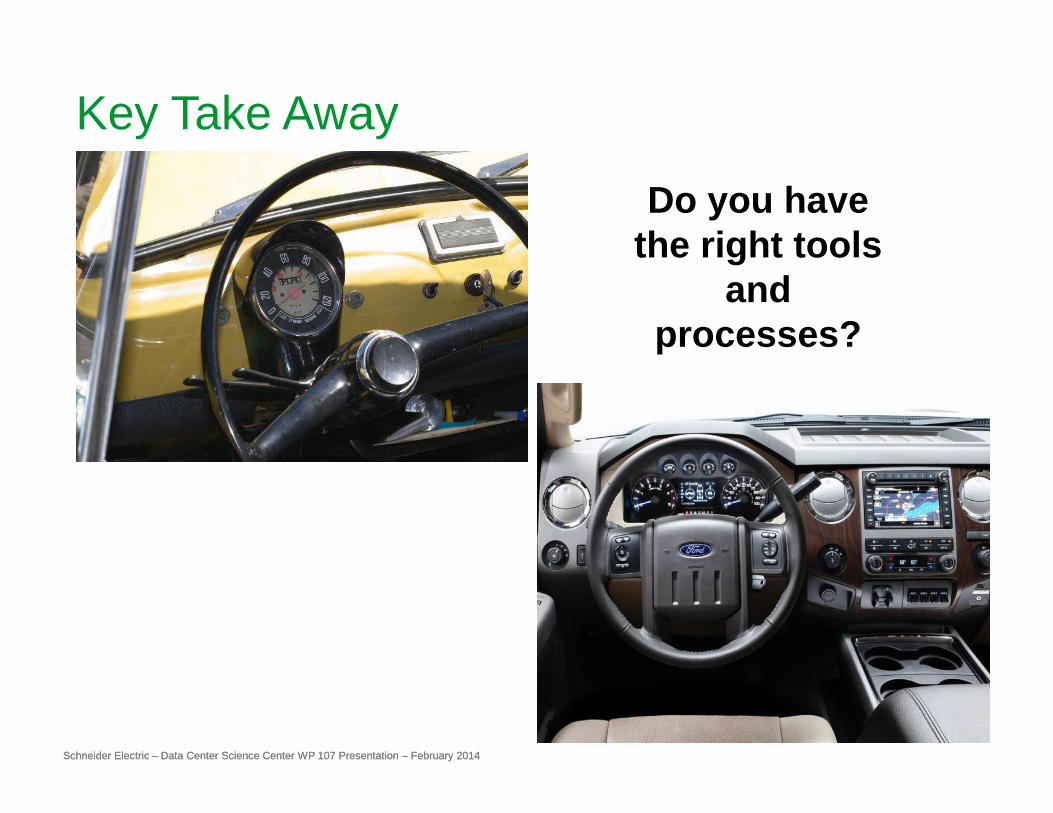
Key Take Away
Do you have the right tools
and processes?
Schneider Electric – Data Center Science Center WP 107 Presentation – February 2014 Schneider Electric – Data Center Science Center WP 107 Presentation – February 2014

Resources
Classification of Data Center Management Software ToolsWhite Paper 104
Virtualization and Cloud Computing, Optimized Power, Cooling and Management Maximizes Benefits
Schneider Electric – Data Center Science Center WP 107 Presentation – February 2014 Schneider Electric – Data Center Science Center WP 107 Presentation – February 2014
Cooling and Management Maximizes BenefitsWhite Paper 118
Power and Cooling Capacity Management For Data CentersWhite Paper 150
Browse allWhite Paperswhitepapers.apc.com

Resources
Power Sizing CalculatorTradeOff Tool 1
Energy Allocation CalculatorTradeOff Tool 2
Schneider Electric – Data Center Science Center WP 107 Presentation – February 2014 Schneider Electric – Data Center Science Center WP 107 Presentation – February 2014
TradeOff Tool 2
Energy Efficiency CalculatorTradeOff Tool 6
Browse allTradeOff Tools™tools.apc.com