How business customers judge solutions: solution quality ...
51
1 How business customers judge solutions: solution quality and value-in-use Emma K. Macdonald Associate Professor of Marketing Cranfield School of Management Cranfield University Bedfordshire, MK43-0AL, UNITED KINGDOM [email protected] Adjunct Senior Research Fellow Ehrenberg-Bass Institute for Marketing Science, University of South Australia, AUSTRALIA Michael Kleinaltenkamp Professor of Business and Services Marketing School of Business and Economics Freie Universitaet Berlin 14195 Berlin, GERMANY +49 (0)30 838-524 71 [email protected] Hugh N. Wilson Professor of Strategic Marketing Cranfield School of Management Cranfield University Bedfordshire, MK43-0AL, UNITED KINGDOM [email protected] Journal of Marketing May 2016, Vol. 80, No. 3, pp. 96-120 doi: http://dx.doi.org/10.1509/jm.15.0109 Acknowledgements The authors gratefully acknowledge funding from the Engineering and Physical Sciences Research Council, UK, through the Cranfield Innovative Manufacturing Research Centre (grant number EP/E001874/1). The authors also acknowledge with thanks the assistance of Tim Baines, Marko Bastl, Helen Bruce, Ignas Bruder, Alice Duda, Steve Evans, Rick Greenough, Mark Johnson, Helen Lockett, Veronica Martinez, Andy Neely, Kamran Razmdoost, Emanuel Said, Mark Tang, Amir Toossi, and the anonymous practitioner informants. They also thank the three anonymous JM reviewers and associate editor for their helpful suggestions on previous versions of the manuscript.
Transcript of How business customers judge solutions: solution quality ...
1
How business customers judge solutions: solution quality and value-in-use
Emma K. Macdonald
Associate Professor of Marketing
Cranfield School of Management
Cranfield University
Bedfordshire, MK43-0AL, UNITED KINGDOM
Adjunct Senior Research Fellow
Ehrenberg-Bass Institute for Marketing Science,
University of South Australia, AUSTRALIA
Michael Kleinaltenkamp
Professor of Business and Services Marketing
School of Business and Economics
Freie Universitaet Berlin
14195 Berlin, GERMANY
+49 (0)30 838-524 71
Hugh N. Wilson
Professor of Strategic Marketing
Cranfield School of Management
Cranfield University
Bedfordshire, MK43-0AL, UNITED KINGDOM
Journal of Marketing
May 2016, Vol. 80, No. 3, pp. 96-120
doi: http://dx.doi.org/10.1509/jm.15.0109
Acknowledgements
The authors gratefully acknowledge funding from the Engineering and Physical Sciences
Research Council, UK, through the Cranfield Innovative Manufacturing Research Centre
(grant number EP/E001874/1). The authors also acknowledge with thanks the assistance of
Tim Baines, Marko Bastl, Helen Bruce, Ignas Bruder, Alice Duda, Steve Evans, Rick
Greenough, Mark Johnson, Helen Lockett, Veronica Martinez, Andy Neely, Kamran
Razmdoost, Emanuel Said, Mark Tang, Amir Toossi, and the anonymous practitioner
informants. They also thank the three anonymous JM reviewers and associate editor for their
helpful suggestions on previous versions of the manuscript.
mn1178
Text Box
Journal of Marketing: May 2016, Vol. 80, No. 3, pp. 96-120 DOI: 10.1509/jm.15.0109
li2106
Text Box
Published by American Marketing Association. This is the Author Accepted Manuscript. This article may be used for personal use only.
2
How business customers judge solutions: solution quality and value-in-use
Abstract
Many manufacturers look to business solutions to provide growth, but success is far from
guaranteed, and how solutions can create superior perceived value is not clear. This article
explores what constitutes value for customers from solutions over time, conceptualized as
value-in-use, and how this arises from quality perceptions of the solution’s components. A
framework for solution quality and value-in-use is developed through 36 interviews
combining repertory grid technique and means-end chains. Significantly extending the extant
view of quality as a function of the supplier’s products and services, findings show that
customers also assess the quality of their own resources and processes, and of the joint
resource integration process. Contrasting strongly with prior research, value-in-use
corresponds not just to collective, organizational goals but also to individuals’ goals. Four
moderators of the quality-value relationship demonstrate customer heterogeneity across both
firms and roles within what the authors term the usage center. When shifting towards
solutions, manufacturers require very different approaches to market research, account
management, solution design and quality control, including the need for a value auditing
process.
Keywords: Business solutions, customer perceived value, quality, resource integration,
repertory grid, means-end chains
3
Under pressure from market maturity and globalization, many manufacturing firms are
looking to services for growth in revenue and profits (Kowalkowski et al. 2015). While in
some instances services and products form distinct offers, a significant trend from
automotives and aerospace to pharmaceuticals and IT is to provide solutions, “products and
services combined into innovative offerings” (Shankar, Berry, and Dotzel 2009, p. 95). We
adopt this as a working definition, though we subsequently refine it in light of our findings.
Worldwide about 30% of manufacturers provide such solutions, ranging from 20% in China
to 55% in the US (Neely, Benedettini, and Visnjic 2011).
Solutions promise to provide differentiation where the core product is becoming
commoditized. An example is Rolls-Royce’s archetypal solution TotalCare, begun in 1997
with American Airlines, which combines an engine and its servicing in a long-term contract.
As the manufacturer retains reliability data across numerous airlines, it can accurately predict
and pre-empt engine problems, providing a reliability benefit as well as reducing the airline’s
financial risk (Kim, Cohen, and Netessine 2007). While GE soon launched its own variant,
the Rolls-Royce model has proved difficult to copy. Solutions can also enable suppliers to
compete in expanded profit pools, providing a route to growth for firms such as Xerox and
IBM in industries where equipment prices have fallen dramatically over the last 20 years.
Shifting towards solutions is, however, far from a guaranteed route to improved
performance. Manufacturers offering product-service solutions on average appear to have
lower profits than those that do not (Neely 2008). Supplier margins may decrease,
particularly early in such a transition when services provide less than 20-30% of turnover
(Fang, Palmatier, and Steenkamp 2008). It would appear that solutions providers face a sharp
learning curve, but what they need to learn is not clear.
There has been some research progress in helping manufacturers understand what drives
successful solutions. For example, through supplier interviews Ulaga and Reinartz (2011)
4
identify capabilities needed by suppliers, calling for complementary research with customers.
Tuli, Kohli, and Bharadwaj (2007) find that suppliers and customers indeed see solutions
differently: whereas suppliers tend to view solutions as simply a bundle of products and
services, customers emphasize the importance of the relational processes of solution design
and delivery. Processes can be defined as “the procedures, tasks, mechanisms, activities and
interactions that support the co‐creation of value” (Payne, Storbacka, and Frow 2008, p. 85).
These solution processes draw on a set of resources (Ulaga and Reinartz 2011), the tangible
and intangible entities available to the firm which enable it to produce a market offering that
has value for some market segments (Hunt and Madhavaram 2012); an example of such a
resource is Rolls-Royce’s engine reliability database. The research challenge remains to
explore how a solution combining these processes and resources succeeds or fails.
In this article, we take a customer perspective to this challenge, guided by the overall
research question: how do business customers judge solutions and the value they create?
Despite the fundamental position of value within the marketing discipline (see the AMA’s
(2013) definition), practitioners continue to express difficulties in understanding the drivers
of customer perceived value (Marketing Science Institute 2014). Scholarly work on this issue
focuses on the concept of quality, with a substantial body of both conceptual (Woodruff
1997; Zeithaml 1988) and empirical (Bolton and Drew 1991) literature examining product
and service quality as antecedent to value. Solutions are, though, more than the sum of their
product and service parts (Tuli, Kohli, and Bharadwaj 2007; Ulaga and Reinartz 2011).
Solutions solve a business problem not simply by enhancing the quality of component
products and services but through integration of these components (Nordin and Kowalkowski
2010; Storbacka 2011). For example, the increased flight reliability claimed by Rolls-Royce’s
TotalCare results from the taut integration of product features such as automated engine state
reporting, services such as dynamic maintenance scheduling, and the airline’s own processes

5
such as flight scheduling. There is thus a need for grounded discovery of how the quality of
solutions is judged. Our first objective is therefore to explore how customers assess solution
quality. Following Zeithaml (1988), we define quality as the perceived excellence or
superiority of an entity, in this case a solution.
Implicit in our research question is the further requirement to explore what value from
solutions comprises. Empirically, value has received less attention than quality. While some
prior work examines value in business markets (Ulaga and Eggert 2006), the constructs by
which the value of solutions is judged have yet to be explored. Our second objective is
therefore to understand what constitutes value for solution customers. In this relational
context, this value perception is of interest not just at the moment of exchange but throughout
the solution’s relational processes. We accordingly draw on service literature and focus on
value-in-use (Grönroos and Voima 2013; Vargo and Lusch 2004), which we define, adapting
previous definitions (Macdonald et al. 2011; Payne, Storbacka, and Frow 2008; Woodruff
1997), as all customer perceived consequences arising from a solution that facilitate or hinder
achieving the customer’s goals. We expand on this definition in the following section.
We address our research question through 36 interviews of industrial solutions customers,
using repertory grid technique (Goffin and Koners 2011) along with means-end chains
(Reynolds and Gutman 1988) to explore the links between quality and value. We thereby
make three main contributions to literature on quality, value and solutions. First, we find that
customers assess the quality not just of the processes and resources of the supplier but also of
customer and joint ones—a significant extension of the quality concept (Golder, Mitra and
Moorman 2012) which may apply more broadly in both business and consumer markets.
Second, we find that customers link their solution quality perceptions to individual value-in-
use constructs as well as collective ones. This significantly extends the dominant view of
value in business markets as a function of organizational goals (Ulaga and Eggert 2006);
6
equally, it contrasts in the opposite direction with the dominant typologies of consumer value
which relate exclusively to the goals of the individual, even if some of these goals such as
status relate to the individual’s position in social groups (Holbrook 1999; Sheth, Newman,
and Gross 1991). Third, we identify moderators of the relationship between solution quality
and value-in-use, demonstrating heterogeneity in how solutions are judged arising both from
the manager’s role in what we term the usage center, and from firm characteristics.
Overall, these findings suggest a very different view of value from that which
predominates among both scholars and practitioners. A solution’s value proposition is not
proposed by the supplier alone but is jointly designed by the supplier and the customer; it
depends on the quality not just of the supplier’s resources and processes but also of customer
and joint ones; and the value that arises is not predetermined and simply verified (Storbacka
2011) but is, rather, continually optimized by both parties. Shifting towards solutions
therefore involves far more than pricing a product/service bundle. For example, suppliers
need a joint resource integration effort with the customer to take customization decisions
such as where the boundary between the firms should lie; they require competences in
optimizing not just their own processes but also those of the customer; they need to
continually audit and enhance the value from the solution, rather than simply meeting the
contract; and they require market research that extends beyond the customer’s judgement of
the supplier to include the customer’s judgement of their own resources and processes.
The article proceeds as follows. We expand on our conception of value-in-use and solution
quality. We then explain our use of repertory grid and means-end chains. An overview of the
emergent conceptual framework is followed by sections detailing value-in-use, solution
quality, and moderators of their relationship. Finally, we discuss theoretical contributions,
including a refined definition of solutions; practitioner implications; and research directions.
7
Understanding solution quality and value-in-use
Table 1 shows exemplars of empirical work on value, with an emphasis on studies that
explicitly or implicitly also include quality perceptions. In some earlier literature the terms
are almost equivalent, value being seen as a function purely of quality and price (Cronin,
Brady, and Hult 2000; Desarbo, Jedidi, and Sinha 2001). More commonly, quality is
distinguished from the anticipated or realized benefits of a product or service (Bolton and
Drew 1991; Ulaga 2003), while price is generalized to costs (Ulaga and Eggert 2006),
sacrifices (Faroughian et al. 2012), or “what is given” by the customer (Zeithaml 1988).
Insert Table 1 about here
The relationship between quality and value (Zeithaml 1988) can be conceptually
underpinned by goal theory (Woodruff 1997). Individuals have a goal hierarchy in which
higher-level ‘abstract goals’ such as the desire to protect the natural environment relate to
lower-level ‘concrete goals’ such as to buy a hybrid electric car (Barsalou 1991; Peterman
1997). Similarly, a manufacturing manager may associate the abstract goal of overall
equipment effectiveness with the concrete goal of fast response times for repairs (Macdonald
et al. 2011). The customer essentially hypothesizes a causal chain or ‘ladder’ (Reynolds and
Gutman 1988) from product features to their desired outcomes from use—the concept of
attribution (Raghubir and Corfman 1999). These outcomes constitute value-in-use —
generally interpreted as the customer’s functional and/or hedonic outcome, purpose or
objective that is served through product/service usage (Woodruff 1997).
These goals may be preventative, such as avoiding high prices, or promotional, such as
looking good to others (Chitturi, Raghunathan, and Mahajan 2008). A goal-based conception
of value-in-use hence integrates the notions of benefits and sacrifices, as a sacrifice such as a
high price corresponds to low achievement of the goal of minimizing the price paid
(Macdonald et al. 2011). Similarly, customers may have a goal to minimize their effort
8
(Mathwick, Malhotra, and Rigdon 2001). With this goal perspective, the notion of trade-offs
of benefits against sacrifices is more precisely described as the customer balancing and
prioritizing between all goals (Epp and Price 2011).
Further work has extended the application of goal theory to suggest that value arises not
only through product usage processes but at any point in the customer journey (Lemke, Clark,
and Wilson 2011). This has led to the suggestion of such alternative terms as value-in-context
(Vargo and Lusch 2016), value-in-social-context (Edvardsson, Tronvoll, and Gruber 2011),
and experiential value (Mathwick, Malhotra, and Rigdon 2001). While we adopt the term
value-in-use to avoid unnecessary terminological multiplicity, its definition needs to allow for
goals to be met at any point in the relational process of a solution; hence our definition of
value-in-use provided earlier as all customer perceived consequences arising from a solution
that facilitate or hinder achieving the customer’s goals.
This definition distinguishes value-in-use from value-in-exchange, the product or service
attributes promised by the supplier and expected by the customer at the time of purchase
(Grönroos and Voima 2013). This does not automatically translate into value-in-use, which is
also dependent on other resources, such as a customer’s own skills, and other processes, such
as peer-to-peer processes (McColl-Kennedy et al. 2012). In this vocabulary, some studies
referring simply to value examine value-in-exchange (e.g. Sweeney and Soutar 2001) while
others examine value-in-use, such as Sirdeshmukh, Singh, and Sabol (2002)’s study of the
value perceived through service delivery.
The customer’s role in creating value-in-use also has implications for quality. Literature
on quality overwhelmingly assumes that value arises from the quality of the supplier’s
offering (Zeithaml 1988; Ulaga and Eggert 2006). Golder, Mitra, and Moorman (2012),
however, call for further focus on the under-researched topic of the quality implications of
co-production. In a solutions context, if value is “realized from integration of resources
9
through activities and interactions with collaborators in the customer’s service network”
(McColl-Kennedy et al. 2012, p. 1), the question arises whether customer evaluation is
focused not just on supplier processes but also on customer ones (Payne, Storbacka, and Frow
2008). This leads us to ask whether these customer processes, too, have a quality—a
perceived excellence or superiority.
From these concepts follow a number of implications for empirical work, as illustrated in
the column headings of Table 1. First, in order to understand how solution quality leads to
value-in-use, it is necessary to allow for the possibility that the customer may make quality
appraisals not only of supplier processes and resources but also of customer ones. Second, as
goals are multifarious, value-in-use is inherently multidimensional. Hence, it is important to
understand the more granular constructs by which value is perceived (Ulaga and Eggert
2006). Third, as value-in-use is inherently phenomenological (Vargo and Lusch 2016), it may
be perceived differently by different people within the customer firm. We define the group of
individuals involved in the use of a solution as the usage center. While most previous
research has focused on a single informant—most commonly a purchasing manager—to
represent each customer firm, exploration of value-in-use requires the perspectives of
multiple members of this usage center. Fourth, goal theory suggests that individuals have
both their own individual goals and shared, collective goals (Epp and Price 2011). While
consumer research has been criticised for dominantly ignoring collective goals (Epp and
Price 2011), Table 1 illustrates our earlier observation that the opposite bias may be present
in business research, in which value is assumed to be purely collective, despite the known
importance of personal motivations in decisions on suppliers (Johnston and Bonoma 1981).
In a solutions context, one would expect uncovering value-in-use perceptions and not just
quality perceptions to be particularly critical to an understanding of what makes for
successful solutions. Solutions are not only customized (Nordin and Kowalkowski 2010),
10
they also affect such fundamental issues as the division of tasks between customer and
supplier firms (Macdonald et al. 2011). For example, Rolls-Royce has taken over large
numbers of service personnel from some of its TotalCare clients. Comparing two options
such as in-house maintenance versus adoption of TotalCare cannot readily be done on the
basis of product or service quality alone, as the very entities being compared differ
substantially. Instead, one would expect such diverse solutions to require comparison further
up the goal hierarchy at the level of value-in-use (Storbacka 2011): in this instance, by
judging the extent to which the total solution keeps the plane in the air at maximum reliability
and minimum total cost—hence Rolls-Royce’s trademark “Power by the hour”.
Accordingly, in our empirical work, we elicit from multiple members of the usage center
how solution quality is appraised, while allowing for the possibility that the answers may
extend beyond the quality of supplier inputs alone. We also explore how these quality
appraisals relate to the multiple facets of value-in-use, without prior assumption as to whether
customer goals are collective, individual, or both.
Research Method
Sample
We study members of the usage center in four manufacturers, eliciting their solution quality
and value-in-use perceptions relating to factory equipment and its maintenance, repair and
operations. The firms were in a spread of sectors: medical devices (which we call DeviceCo),
printing (PrintCo), pharmaceuticals (HealthCo), and building products (BuildCo). Solution
innovation in factory equipment includes not only maintenance but also such services as parts
procurement and stores management (Kastalli and Van Looy 2013). In each company, an
exploratory interview led to identification of other usage center members. A sample was
drawn up representing four main usage center roles that emerged: maintenance, operations,
purchasing, and general management. 8 to 10 interviews were held in each company, totaling
11
36 interviewees. Interviews averaged 47 minutes. See Table 2.
Insert Table 2 and Table 3 about here
Insert Figure 1 about here
Data collection and analysis
We synthesized literature on repertory grid technique, means-end chaining, and qualitative
data reliability to develop a robust method for eliciting quality and value constructs and their
relationships: see Table 3. Deriving from Kelly’s (1963) personal construct theory, repertory
grid technique uses structured interviews to identify the constructs by which human
judgements are made. It is useful when these judgements are from tacit knowledge (Brown
and Detoy 1988) and it has high test-retest reliability (Smith 2000). Applications within
management include supplier quality (Goffin, Lemke, and Szwejczewski 2006), cognitions
about IT (Tan and Hunter 2002), new product development (Goffin and Koners 2011), and
experience quality (Lemke, Clark, and Wilson 2011). We used the technique to identify the
constructs by which interviewees judge solutions. As these constructs were generally at the
more concrete level of quality in the customer’s goal hierarchy, we combined the technique
with means-end chains, or laddering (Gutman 1982), to elicit the more abstract value
constructs. See Figure 1 for an example grid and related ladder.
Following Goffin, Lemke, and Szwejczewski (2006), the first stage of analysis identified
quality constructs (Table 4) and value-in-use constructs (Table 5) from the grids and
transcripts, and named these with reference to literature following the approach of Gioia,
Corley and Hamilton (2012). Following Tuli, Kohli, and Bharadwaj (2007) amongst others,
inter-coder reliability was checked with the proportional reduction in loss method (Rust and
Cooil 1994).
The second stage of analysis involved recording ladders between constructs and deriving
from them an implications matrix which summarizes the links, or ‘implications’, between
quality and value constructs (Reynolds and Gutman 1988). See Table 6, which also includes
12
three indices summarizing the role of constructs: abstractness is the average level of a
construct in the ladder from concrete (approaching 0) to abstract (approaching 1); centrality
measures how often a construct appears in a ladder; and, prestige is an index of how often a
construct is the destination in implications, as a proportion of all implications in the matrix
(Pieters, Baumgartner, and Allen 1995). A more detailed implications matrix is provided in
the Web Appendix. From this matrix, we drew up a hierarchical value map summarizing the
constructs and their relationships (Reynolds and Gutman 1988, Gengler and Reynolds 1995):
see Figure 2. To examine customer heterogeneity, Figure 4 shows similar maps for sub-
samples including companies and roles. See Table 3 for further details of the method.
How value-in-use arises from solution quality
Tables 4 and 5 present solution quality and value-in-use constructs, with definitions and
illustrative quotations. (The code following each quotation indicates company, interviewee
and construct number; for example, H2-15 is construct #15 elicited from HealthCo’s
Interviewee #2.) The relationship between solution quality and value-in-use is reported in the
implications matrix (Table 6) and the related hierarchical value map (Figure 2). We integrate
these findings in the framework of Figure 3, and begin with an overview based on this figure.
Insert Tables 4, 5 and 6 about here
Insert Figures 2 and 3 about here
In evaluating a solution, customers assess the quality not just of the supplier’s resources and
processes but equally of their own. Furthermore, the resource integration process for which
both parties are responsible plays a central role, drawing upon resources from both, and in
turn being central to value creation. Suppliers, then, do not deliver solutions; rather, suppliers
and customers co-create them. This joint contribution to solution quality is a significant
departure from the weight of research into quality, which regards quality only as a function of
the supplier’s actions. It is also at odds with common market research practice, in which
13
suppliers ask customers purely about their assessment of the supplier and not their assessment
of their own processes or indeed joint ones.
This symmetry between supplier and customer is also seen in two further processes: value
auditing by the supplier and by the customer. The supplier’s value auditing process extends
the set of solution processes identified by Tuli, Kohli, and Bharadwaj (2007). Furthermore,
this monitoring and optimizing of value-in-use is equally an important customer process—
and both of these processes themselves form part of the customer’s quality assessment.
An emergent finding is that the value-in-use that is thereby co-created is individual and
not just collective. Managers within a usage center perceive multiple dimensions of both
collective value-in-use, constructs relating to the goals of the organization, and individual
value-in-use, constructs relating to the individual’s personal role and interests. This is in stark
contrast to the predominant, albeit implicit, view of value in business relationships as a
function of organizational outcomes alone (Ulaga and Eggert 2006). We next consider the
components of Figure 3 in more detail, beginning with value-in-use and followed by solution
quality, before turning to heterogeneity in quality and value perceptions.
Collective value-in-use
As might be expected, several of the nine collective value-in-use constructs (see Table 5)
relate to improved operational performance of the customer firm: avoiding downtime, fast
problem-solving, low costs, and fixed capital reduction. Process improvement to the
customer’s processes is valued both in itself (centrality=.15, second only to low costs among
value-in-use constructs; details are available in the Web Appendix) and as a means to achieve
these operational gains (abstractness=.69, the least abstract of the value-in-use constructs);
here we again note the centrality of the customer’s processes in solution success. Operational
performance is a core motivation for solutions and frequently forms the basis for pre-sale
conversations with suppliers (Ulaga and Reinartz 2011), though we found that achievement
14
of performance gains is only rarely embedded in the contract, despite research attention to
performance-based contracting (Kowalkowski et al. 2015).
Two further constructs represent value which is more likely to be emergent through the
solution: the solution’s impact on the innovativeness and competitive advantage of the
customer. For example, a central stores manager commented on the importance of innovative
ideas within his somewhat traditional printing firm: “I’m quite positive that we needed
somebody from an outside industry to lead us a bit more. Yes, I would say there is an
improvement because you’ve got a different opinion, different angle from an outside firm.”
(P6-24). Competitive advantage occurs where the solution improves the customer’s own
market position. This formed part of the solution appraisal by an engineering manager in
DeviceCo: “these guys have a much more commercial focus, whereas [supplier] has been
treated up to now as an improvement to our service, as opposed to ‘can you give us any
competitive advantage?’” (D2-84). These value-in-use constructs go beyond those typically
seen in business value research (Ulaga and Eggert 2006). Their emergent nature raises the
issue of how either party can track their occurrence; this forms part of the role of the value
auditing processes which we return to later.
Two final constructs correspond to preventative goals and, in particular, risk management.
A solution can result in reduced financial risk through the supplier taking on this risk.
Equally, the resource integration process may provide better risk management with third
parties, as discussed at PrintCo: “if there’s a problem with anything breaking in warranty
[with any of our suppliers] then [a representative from the solution provider] would recover
this money as well” (P6-28). In the opposite direction, dependence avoidance is expressed in
the concern that through the transfer of some responsibilities to the supplier, the customer
risks losing competencies such as sourcing expertise. This was a concern aired by
interviewees at PrintCo, for example: “It’s no use putting all your eggs in one basket, as they
15
might be a global supplier but it’s no good if all they can get us is in [city name]” (P5-35).
While these risk-related constructs are absent from much literature on business value such as
that reviewed in Table 1, they seem a natural consequence of the redrawing of boundaries
between supplier and customer that can occur in a solution’s resource integration process
(which we consider in more detail below). We summarize these observations as follows:
Proposition 1: Collective value-in-use includes emergent dimensions which may go beyond
those anticipated at the time of exchange.
Individual value-in-use
Extending previous work on how business customers judge value, we found that six
constructs corresponding to goals of the individual form part of the evaluation of the solution.
Three relate to job ease (Glass and Camarigg 1992). The first is task simplicity, the simplicity
and time efficiency of the processes comprising one’s job. For example, PrintCo’s
outsourcing of day-to-day operations of a factory’s production line stores had a beneficial
impact on the working life of the stores manager: “I’m responsible overall for all procedures
governing all our stores. I am still linked with the repairs, but obviously [supplier] now
manage it day to day, whereas before I was actually doing it all the time” (P6-1). BuildCo’s
maintenance manager found on the contrary that a solution did not aid task simplicity: “It
doesn’t get my job done…and by the time I have explained to him, what’s the point? I can do
the job myself” (B4-13). Task simplicity is valued in part due to its impact on work-life
balance. A related and also commonly occurring construct is pressure reduction, minimized
pressure and stress in one’s daily job. Typical is an engineer at HealthCo who preferred a
solution which reduced the personal pressure on him when equipment failed: “It’ll save you
stress and pressure: when you’re designing something you’re not under pressure, because you
know that if you make an improvement it’s a plus, whereas if a [production] line is down,
there’s pressure and that is very important” (H2-48). The third construct relating to job ease is

16
perceived control, a perception of control over processes and resources comprising one’s job.
A project engineer appreciated the control benefits of a solution which involved an on-site
customer representative at DeviceCo: “They are on site, yes, so I suppose I have a neck to
grab at the end of each evening if something goes wrong” (D8-4). The pressure reduction and
perceived control constructs are in line with the insights of stress theory (Lazarus 1990) that
the degree of perceived stress has an impact on the assessed quality of an encounter.
The fourth of the individual value-in-use constructs is uncertainty reduction, minimized
uncertainty related to processes and decisions comprising one’s job. This is illustrated by a
maintenance technician at HealthCo: “some suppliers will work with you and collaborate
with you, so you get a sense with them of complete confidence; you stop challenging,
questioning, seeing every report because you know they’re going to deliver, they’re going to
take care of it” (H9-52). This echoes research in the service sector showing that customers
seek to reduce their perceived uncertainty and purchase anxiety during the buying process
(Berry 1995); our data show that reducing uncertainty is also valued after the sale.
The final two constructs relate to the individual’s social context. Personal reputation,
being viewed as a person with high job competence, can be affected negatively as well as
positively by the quality of the solution. A maintenance manager at DeviceCo relayed the
reputational damage to him and his team that could arise from a supplier’s slow response
time compounded by lack of skills in the customer organization: “It’s not good for us to be
saying we can’t fix it…We’re not trained enough, so we’re under pressure straight away and
we look poor…because [supplier staff] can’t come on site” (D7-13). Social comfort, feeling
comfortable with other people involved in one’s work, is a function of individual personal
relationships. It can also be aided by processes which lead to repeated contact with the same
person, as observed by DeviceCo’s maintenance engineer: “Working with the individuals is
17
the main thing. If you can’t work with the individual who’s sorting out your problems, where
are you going? It’s all personal. All day, every day I’ll be with him” (D8-11).
The role of individual motivations has largely been ignored in the literature on
organizational buying behavior (a notable exception being Hollman, Jarvis and Bitner, 2015).
Yet our data show that individual value-in-use plays a substantial role in solutions evaluation
(centrality=.32, against centrality of collective value-in-use of .60; see Table 6). Hence:
Proposition 2: The value-in-use from solutions is judged relative to the individual goals of
usage center members (individual value-in-use) and not just organizational goals (collective
value-in-use).
Individual and collective value-in-use have very similar abstractness (.81 and .83
respectively). Table 6 shows that individual value-in-use sometimes ladders to collective
value-in-use (36 direct implications); for example, an individual’s task simplicity can lead to
fast problem solving (9 implications). Equally, collective value-in-use can ladder to
individual value-in-use (36 implications); for example, fast problem solving can lead to
pressure reduction for an individual (5 implications). We therefore propose:
Proposition 3: Individual value-in-use and collective value-in-use interact, as the achievement
of individual goals can support collective goals and vice versa.
Supplier Resource Quality and Customer Resource Quality
We next turn to solution quality, beginning with resource quality. We have commented that
extant quality research across multiple sectors dominantly views value as arising from the
quality of what the supplier provides. Our data show that solution customers do indeed judge
supplier resource quality at three levels: employee, organization and network. This
evaluation is, however, mirrored in their assessment of the quality of their own resources, as
can be seen in Table 4, though a fourth construct, customer orientation, is found only in the
supplier evaluation. The interplay between customer and supplier resources in solution design
is exemplified by a maintenance coordinator from HealthCo discussing the importance of
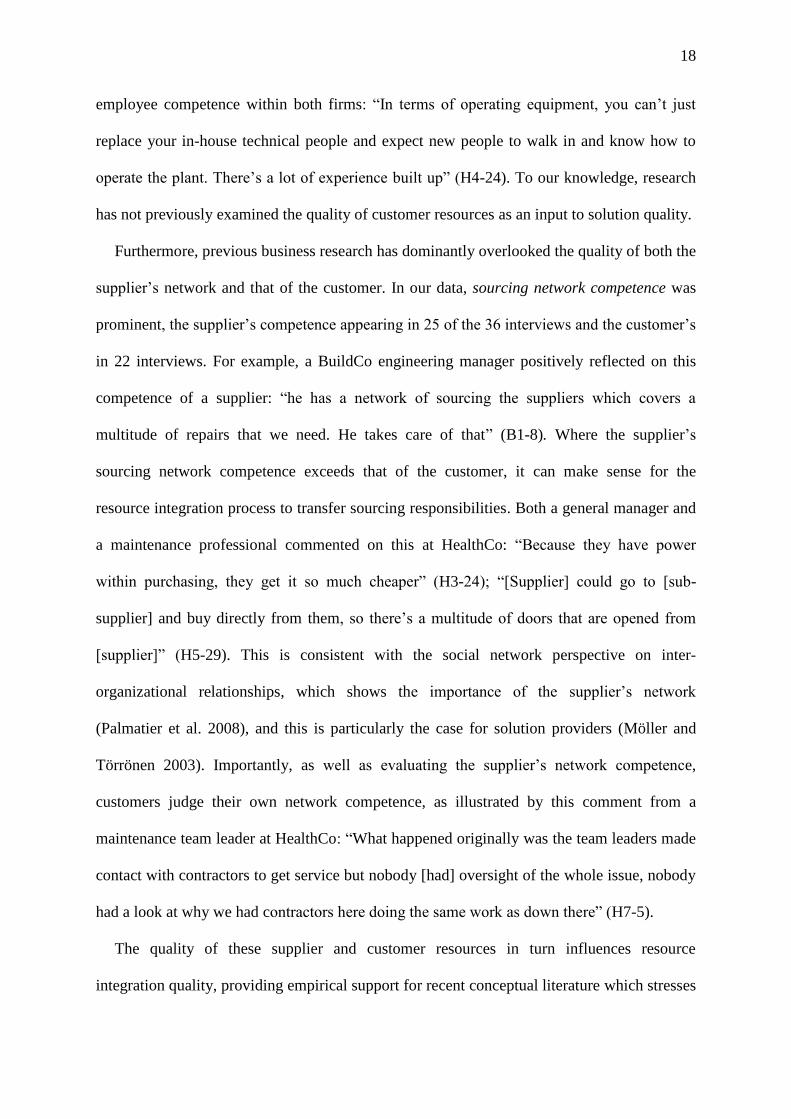
18
employee competence within both firms: “In terms of operating equipment, you can’t just
replace your in-house technical people and expect new people to walk in and know how to
operate the plant. There’s a lot of experience built up” (H4-24). To our knowledge, research
has not previously examined the quality of customer resources as an input to solution quality.
Furthermore, previous business research has dominantly overlooked the quality of both the
supplier’s network and that of the customer. In our data, sourcing network competence was
prominent, the supplier’s competence appearing in 25 of the 36 interviews and the customer’s
in 22 interviews. For example, a BuildCo engineering manager positively reflected on this
competence of a supplier: “he has a network of sourcing the suppliers which covers a
multitude of repairs that we need. He takes care of that” (B1-8). Where the supplier’s
sourcing network competence exceeds that of the customer, it can make sense for the
resource integration process to transfer sourcing responsibilities. Both a general manager and
a maintenance professional commented on this at HealthCo: “Because they have power
within purchasing, they get it so much cheaper” (H3-24); “[Supplier] could go to [sub-
supplier] and buy directly from them, so there’s a multitude of doors that are opened from
[supplier]” (H5-29). This is consistent with the social network perspective on inter-
organizational relationships, which shows the importance of the supplier’s network
(Palmatier et al. 2008), and this is particularly the case for solution providers (Möller and
Törrönen 2003). Importantly, as well as evaluating the supplier’s network competence,
customers judge their own network competence, as illustrated by this comment from a
maintenance team leader at HealthCo: “What happened originally was the team leaders made
contact with contractors to get service but nobody [had] oversight of the whole issue, nobody
had a look at why we had contractors here doing the same work as down there” (H7-5).
The quality of these supplier and customer resources in turn influences resource
integration quality, providing empirical support for recent conceptual literature which stresses
19
that value-in-use emerges from resource integration (Grönroos and Voima 2013; Vargo and
Lusch 2016). Equally, however, supplier and customer resource quality frequently ladder
directly to value-in-use at both collective and individual levels (see Table 6). In conclusion:
Proposition 4: In addition to supplier resource quality, customer resource quality is
instrumental in contributing to value-in-use.
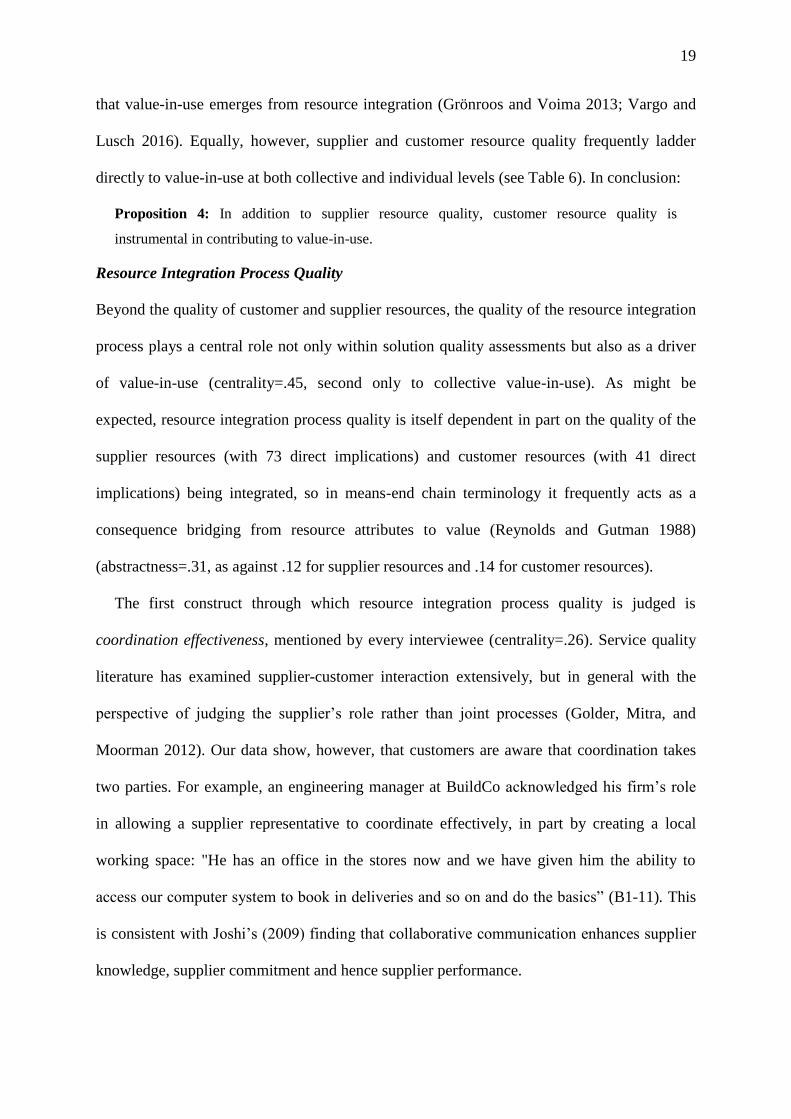
Resource Integration Process Quality
Beyond the quality of customer and supplier resources, the quality of the resource integration
process plays a central role not only within solution quality assessments but also as a driver
of value-in-use (centrality=.45, second only to collective value-in-use). As might be
expected, resource integration process quality is itself dependent in part on the quality of the
supplier resources (with 73 direct implications) and customer resources (with 41 direct
implications) being integrated, so in means-end chain terminology it frequently acts as a
consequence bridging from resource attributes to value (Reynolds and Gutman 1988)
(abstractness=.31, as against .12 for supplier resources and .14 for customer resources).
The first construct through which resource integration process quality is judged is
coordination effectiveness, mentioned by every interviewee (centrality=.26). Service quality
literature has examined supplier-customer interaction extensively, but in general with the
perspective of judging the supplier’s role rather than joint processes (Golder, Mitra, and
Moorman 2012). Our data show, however, that customers are aware that coordination takes
two parties. For example, an engineering manager at BuildCo acknowledged his firm’s role
in allowing a supplier representative to coordinate effectively, in part by creating a local
working space: "He has an office in the stores now and we have given him the ability to
access our computer system to book in deliveries and so on and do the basics” (B1-11). This
is consistent with Joshi’s (2009) finding that collaborative communication enhances supplier
knowledge, supplier commitment and hence supplier performance.
20
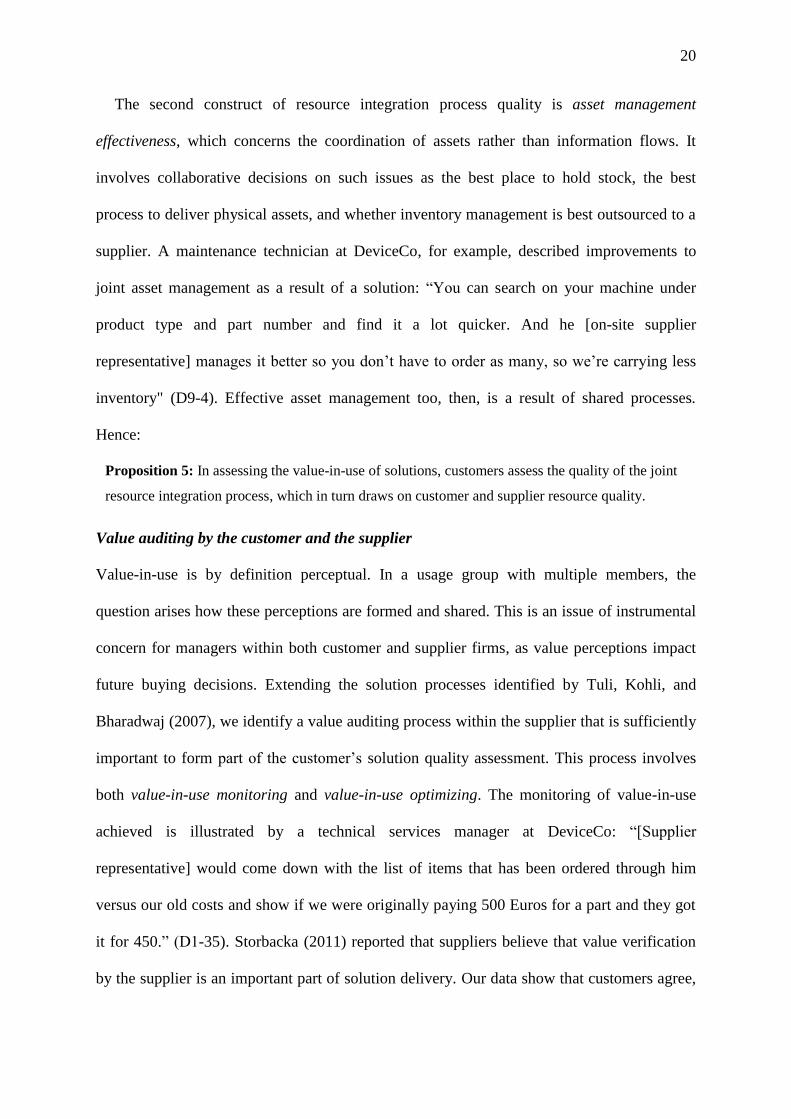
The second construct of resource integration process quality is asset management
effectiveness, which concerns the coordination of assets rather than information flows. It
involves collaborative decisions on such issues as the best place to hold stock, the best
process to deliver physical assets, and whether inventory management is best outsourced to a
supplier. A maintenance technician at DeviceCo, for example, described improvements to
joint asset management as a result of a solution: “You can search on your machine under
product type and part number and find it a lot quicker. And he [on-site supplier
representative] manages it better so you don’t have to order as many, so we’re carrying less
inventory" (D9-4). Effective asset management too, then, is a result of shared processes.
Hence:
Proposition 5: In assessing the value-in-use of solutions, customers assess the quality of the joint
resource integration process, which in turn draws on customer and supplier resource quality.
Value auditing by the customer and the supplier
Value-in-use is by definition perceptual. In a usage group with multiple members, the
question arises how these perceptions are formed and shared. This is an issue of instrumental
concern for managers within both customer and supplier firms, as value perceptions impact
future buying decisions. Extending the solution processes identified by Tuli, Kohli, and
Bharadwaj (2007), we identify a value auditing process within the supplier that is sufficiently
important to form part of the customer’s solution quality assessment. This process involves
both value-in-use monitoring and value-in-use optimizing. The monitoring of value-in-use
achieved is illustrated by a technical services manager at DeviceCo: “[Supplier
representative] would come down with the list of items that has been ordered through him
versus our old costs and show if we were originally paying 500 Euros for a part and they got
it for 450.” (D1-35). Storbacka (2011) reported that suppliers believe that value verification
by the supplier is an important part of solution delivery. Our data show that customers agree,
21
and furthermore that this value auditing is quality-assessed by the customer. Moreover, we
find that a closely related value auditing process in the customer firm is also quality-assessed
as part of solution quality appraisal. An engineering manager, for example, reported that “we
typically have a weekly review internally with the value teams here where they have to
review usage and cost. I have engineers in each of the teams who are responsible for the
consumable spend on a weekly basis and who get measured as part of their performance
appraisal. So [the supplier] guys work very closely with our engineers to make sure they’ve
got the information” (D2-39).
This process of value monitoring and optimization goes considerably beyond the
traditional role of quality control. Customers wish suppliers not just to deliver their part of the
contract to high quality but also proactively to seek further ways beyond the contract to add
value. Furthermore, the quality of this value management is itself assessed by the customer.
As these value auditing processes focus on explicit and generally measurable benefits to the
firm, it is not surprising that our data show the respective quality assessments are primarily
linked with collective value-in-use constructs, with relatively few links to individual value-in-
use (see Table 6 and Figure 2). Thus:
Proposition 6: The quality of value-in-use auditing processes by the supplier and the customer
impacts collective value-in-use.
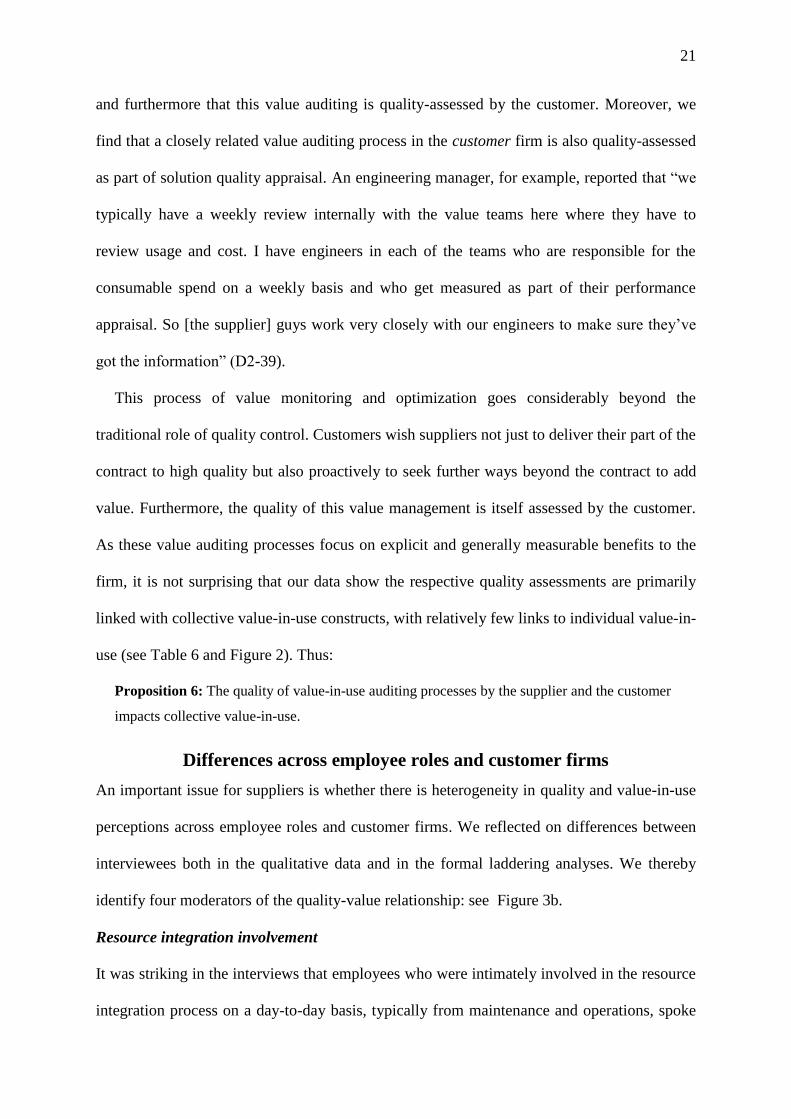
Differences across employee roles and customer firms
An important issue for suppliers is whether there is heterogeneity in quality and value-in-use
perceptions across employee roles and customer firms. We reflected on differences between
interviewees both in the qualitative data and in the formal laddering analyses. We thereby
identify four moderators of the quality-value relationship: see Figure 3b.
Resource integration involvement
It was striking in the interviews that employees who were intimately involved in the resource
integration process on a day-to-day basis, typically from maintenance and operations, spoke
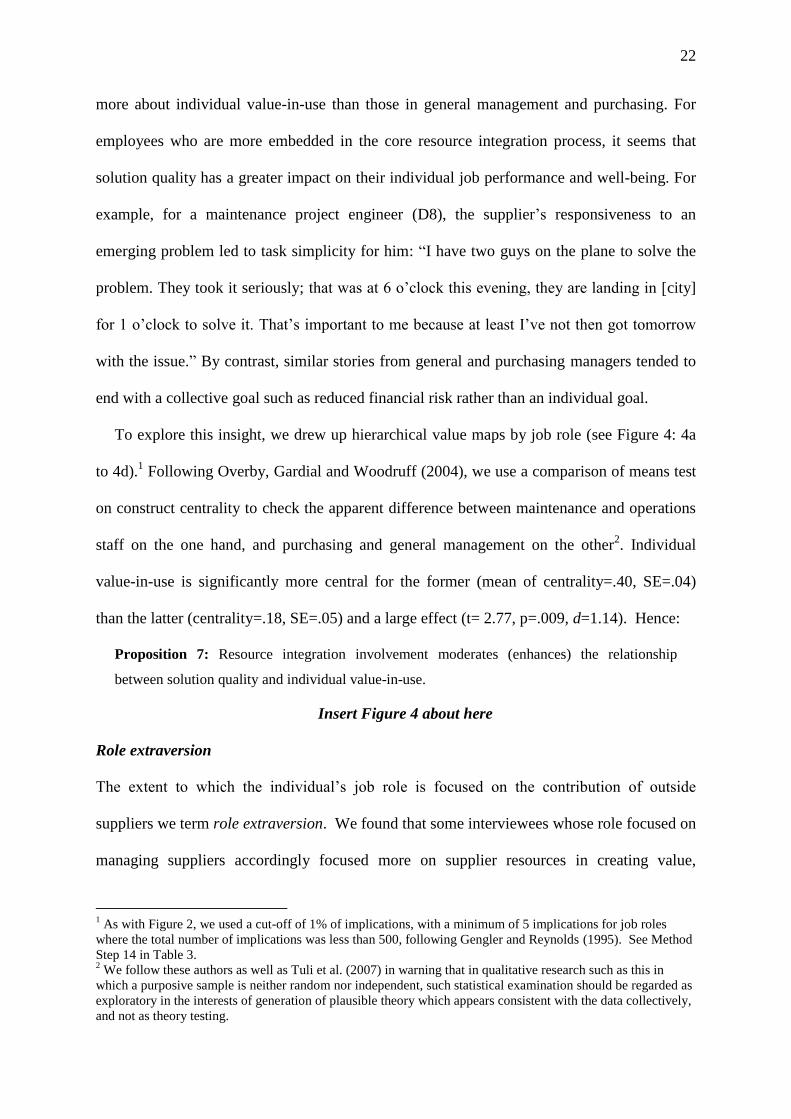
22
more about individual value-in-use than those in general management and purchasing. For
employees who are more embedded in the core resource integration process, it seems that
solution quality has a greater impact on their individual job performance and well-being. For
example, for a maintenance project engineer (D8), the supplier’s responsiveness to an
emerging problem led to task simplicity for him: “I have two guys on the plane to solve the
problem. They took it seriously; that was at 6 o’clock this evening, they are landing in [city]
for 1 o’clock to solve it. That’s important to me because at least I’ve not then got tomorrow
with the issue.” By contrast, similar stories from general and purchasing managers tended to
end with a collective goal such as reduced financial risk rather than an individual goal.
To explore this insight, we drew up hierarchical value maps by job role (see Figure 4: 4a
to 4d).1 Following Overby, Gardial and Woodruff (2004), we use a comparison of means test
on construct centrality to check the apparent difference between maintenance and operations
staff on the one hand, and purchasing and general management on the other2. Individual
value-in-use is significantly more central for the former (mean of centrality=.40, SE=.04)
than the latter (centrality=.18, SE=.05) and a large effect (t= 2.77, p=.009, d=1.14). Hence:
Proposition 7: Resource integration involvement moderates (enhances) the relationship
between solution quality and individual value-in-use.
Insert Figure 4 about here
Role extraversion
The extent to which the individual’s job role is focused on the contribution of outside
suppliers we term role extraversion. We found that some interviewees whose role focused on
managing suppliers accordingly focused more on supplier resources in creating value,
1 As with Figure 2, we used a cut-off of 1% of implications, with a minimum of 5 implications for job roles
where the total number of implications was less than 500, following Gengler and Reynolds (1995). See Method
Step 14 in Table 3. 2 We follow these authors as well as Tuli et al. (2007) in warning that in qualitative research such as this in
which a purposive sample is neither random nor independent, such statistical examination should be regarded as
exploratory in the interests of generation of plausible theory which appears consistent with the data collectively,
and not as theory testing.
23
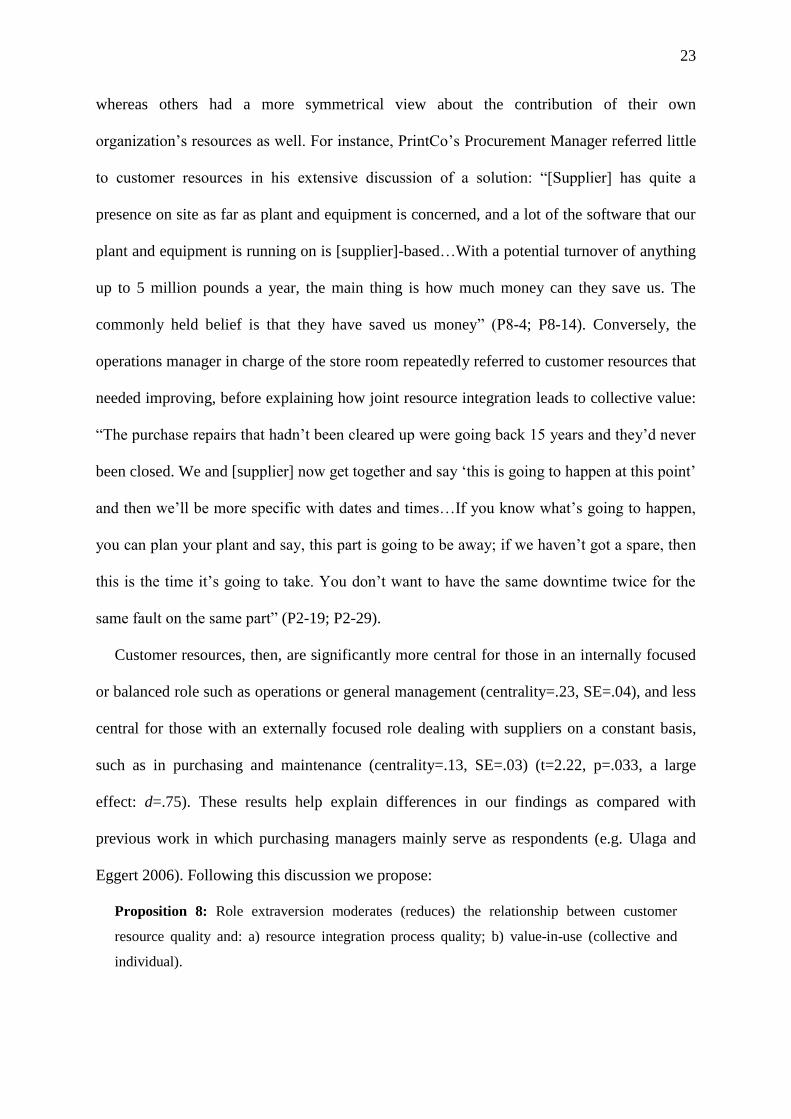
whereas others had a more symmetrical view about the contribution of their own
organization’s resources as well. For instance, PrintCo’s Procurement Manager referred little
to customer resources in his extensive discussion of a solution: “[Supplier] has quite a
presence on site as far as plant and equipment is concerned, and a lot of the software that our
plant and equipment is running on is [supplier]-based…With a potential turnover of anything
up to 5 million pounds a year, the main thing is how much money can they save us. The
commonly held belief is that they have saved us money” (P8-4; P8-14). Conversely, the
operations manager in charge of the store room repeatedly referred to customer resources that
needed improving, before explaining how joint resource integration leads to collective value:
“The purchase repairs that hadn’t been cleared up were going back 15 years and they’d never
been closed. We and [supplier] now get together and say ‘this is going to happen at this point’
and then we’ll be more specific with dates and times…If you know what’s going to happen,
you can plan your plant and say, this part is going to be away; if we haven’t got a spare, then
this is the time it’s going to take. You don’t want to have the same downtime twice for the
same fault on the same part” (P2-19; P2-29).
Customer resources, then, are significantly more central for those in an internally focused
or balanced role such as operations or general management (centrality=.23, SE=.04), and less
central for those with an externally focused role dealing with suppliers on a constant basis,
such as in purchasing and maintenance (centrality=.13, SE=.03) (t=2.22, p=.033, a large
effect: d=.75). These results help explain differences in our findings as compared with
previous work in which purchasing managers mainly serve as respondents (e.g. Ulaga and
Eggert 2006). Following this discussion we propose:
Proposition 8: Role extraversion moderates (reduces) the relationship between customer
resource quality and: a) resource integration process quality; b) value-in-use (collective and
individual).
24
Solution ownership
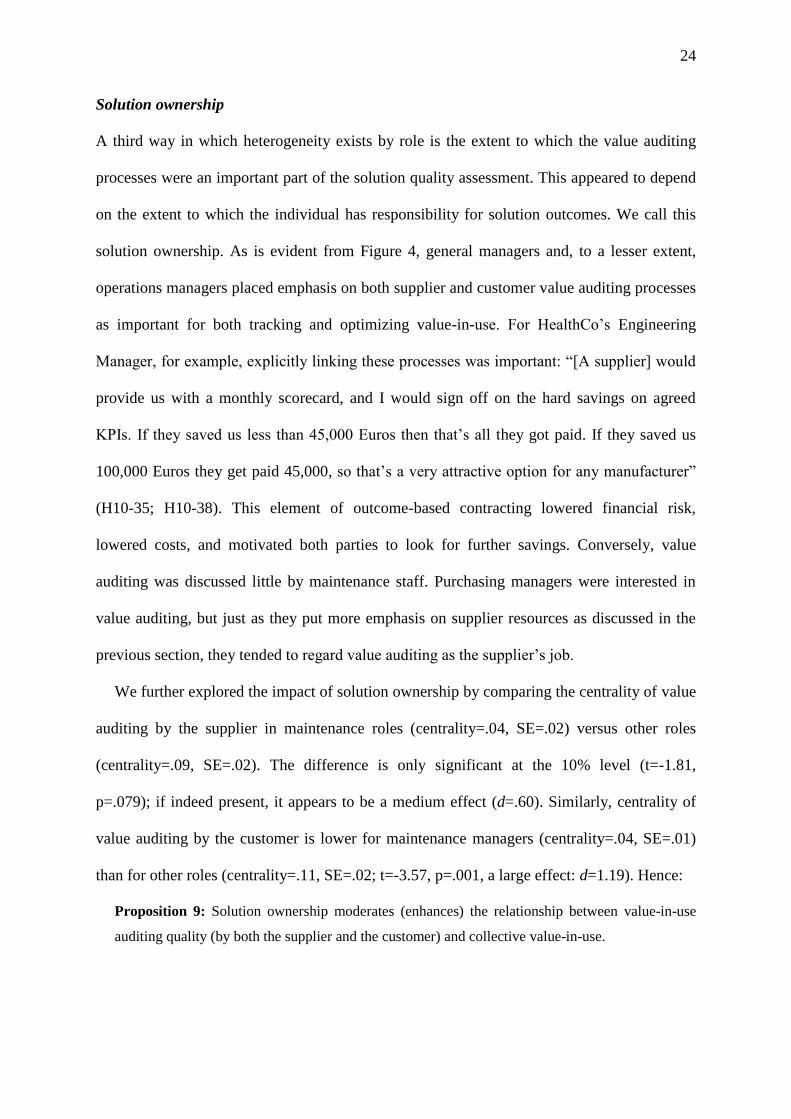
A third way in which heterogeneity exists by role is the extent to which the value auditing
processes were an important part of the solution quality assessment. This appeared to depend
on the extent to which the individual has responsibility for solution outcomes. We call this
solution ownership. As is evident from Figure 4, general managers and, to a lesser extent,
operations managers placed emphasis on both supplier and customer value auditing processes
as important for both tracking and optimizing value-in-use. For HealthCo’s Engineering
Manager, for example, explicitly linking these processes was important: “[A supplier] would
provide us with a monthly scorecard, and I would sign off on the hard savings on agreed
KPIs. If they saved us less than 45,000 Euros then that’s all they got paid. If they saved us
100,000 Euros they get paid 45,000, so that’s a very attractive option for any manufacturer”
(H10-35; H10-38). This element of outcome-based contracting lowered financial risk,
lowered costs, and motivated both parties to look for further savings. Conversely, value
auditing was discussed little by maintenance staff. Purchasing managers were interested in
value auditing, but just as they put more emphasis on supplier resources as discussed in the
previous section, they tended to regard value auditing as the supplier’s job.
We further explored the impact of solution ownership by comparing the centrality of value
auditing by the supplier in maintenance roles (centrality=.04, SE=.02) versus other roles
(centrality=.09, SE=.02). The difference is only significant at the 10% level (t=-1.81,
p=.079); if indeed present, it appears to be a medium effect (d=.60). Similarly, centrality of
value auditing by the customer is lower for maintenance managers (centrality=.04, SE=.01)
than for other roles (centrality=.11, SE=.02; t=-3.57, p=.001, a large effect: d=1.19). Hence:
Proposition 9: Solution ownership moderates (enhances) the relationship between value-in-use
auditing quality (by both the supplier and the customer) and collective value-in-use.
25
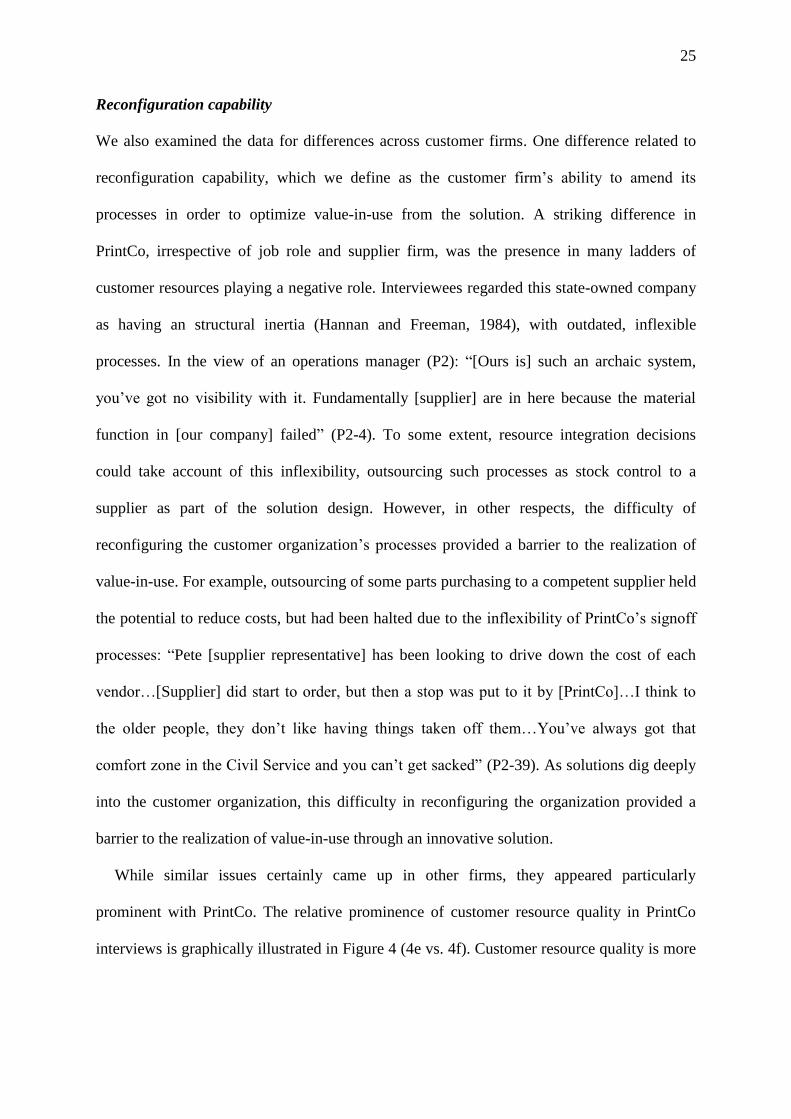
Reconfiguration capability
We also examined the data for differences across customer firms. One difference related to
reconfiguration capability, which we define as the customer firm’s ability to amend its
processes in order to optimize value-in-use from the solution. A striking difference in
PrintCo, irrespective of job role and supplier firm, was the presence in many ladders of
customer resources playing a negative role. Interviewees regarded this state-owned company
as having an structural inertia (Hannan and Freeman, 1984), with outdated, inflexible
processes. In the view of an operations manager (P2): “[Ours is] such an archaic system,
you’ve got no visibility with it. Fundamentally [supplier] are in here because the material
function in [our company] failed” (P2-4). To some extent, resource integration decisions
could take account of this inflexibility, outsourcing such processes as stock control to a
supplier as part of the solution design. However, in other respects, the difficulty of
reconfiguring the customer organization’s processes provided a barrier to the realization of
value-in-use. For example, outsourcing of some parts purchasing to a competent supplier held
the potential to reduce costs, but had been halted due to the inflexibility of PrintCo’s signoff
processes: “Pete [supplier representative] has been looking to drive down the cost of each
vendor…[Supplier] did start to order, but then a stop was put to it by [PrintCo]…I think to
the older people, they don’t like having things taken off them…You’ve always got that
comfort zone in the Civil Service and you can’t get sacked” (P2-39). As solutions dig deeply
into the customer organization, this difficulty in reconfiguring the organization provided a
barrier to the realization of value-in-use through an innovative solution.
While similar issues certainly came up in other firms, they appeared particularly
prominent with PrintCo. The relative prominence of customer resource quality in PrintCo
interviews is graphically illustrated in Figure 4 (4e vs. 4f). Customer resource quality is more
26
central for those in PrintCo than the other three companies (centrality=.26, SE=.05, vs
centrality=.15, SE=.02; t=2.28, p=.03, a large effect: d=.84). We therefore propose:
Proposition 10: A customer firm’s reconfiguration capability moderates (reduces) the
relationship between customer resource quality and: a) resource integration process quality; b)
value-in-use (collective and individual).
Conclusions
This study aimed to explore how business customers assess solution quality as antecedent to
value, and what constitutes the value-in-use that results from the solution. Figure 3 presents
the resulting framework. In assessing solution quality, customers evaluate not just the quality
of supplier resources, but the quality of their own resources and of the joint resource
integration process. They also judge the quality of the value-in-use auditing of both parties
(see all constructs listed in Table 4). These contribute to value-in-use at both collective and
individual levels, judged through the constructs of Table 5. Laddering surfaces the central
role of the resource integration process that draws on resources from both parties and in turn
is central to value creation: see Figure 2. We identify moderators of the relationship between
solution quality and value-in-use (Figure 3b).
These findings make three main contributions to literature on solutions and, more broadly,
on quality and value. The first is the conception of solution quality and elicitation of its
components, which critically include quality assessments of both parties’ resources and
processes, and not just those of the supplier. This contrasts with the overwhelming focus in
quality research on the quality of the supplier’s offerings alone (Bolton and Drew 1991;
Sivakumar, Li, and Dong 2014; Ulaga and Eggert 2006). While both conceptual (Vargo and
Lusch 2004) and empirical (Macdonald et al. 2011) work on co-creation acknowledges the
role of the customer’s usage process, our data show that in a solutions context the customer’s
role is not simply to use the supplier’s offering; rather, the very nature of the solution is
jointly designed and evolved through the joint resource integration process, which
27
importantly is itself quality-assessed by the customer. Innovation occurs as this process draws
on both supplier and customer resource assessments to redefine the boundary between
supplier and customer. An example is in the quality assessment of both the supplier’s and the
customer’s sourcing network competence; where the supplier’s network is perceived to be
superior to the customer’s, the customer may configure their supply network to make more
use of the supplier as an intermediary. Hence, our data suggest that a solution’s value
proposition is itself co-created through the resource integration process. Furthermore, this
value proposition is not simply delivered; rollout of the solution does not just involve meeting
pre-defined goals. Rather, value-in-use is itself managed, redefined and optimized throughout
the value auditing processes of both the supplier and the customer. These processes are
sufficiently critical that they themselves are quality-assessed.
Overall, then, our data paint a radically different view of quality from the traditional view
of the supplier’s product and service quality alone. Most fundamentally, both practitioners
and scholars seem to have a blind spot, looking for quality in the wrong place: it resides not
purely in the supplier’s actions at the customer interface, but also in the customer’s own
resources and processes, as well as in the supplier-customer relationship through quality
assessment of the resource integration process. Golder, Mitra, and Moorman (2012) observe
that customer co-production can impact on the quality of the supplier’s offering, which in
turn can impact on the customer’s experience of and evaluation of the offering; for example,
self-assembling furniture may impact on the quality of the assembled item. We add that co-
production processes themselves are quality-assessed by the customer.
Our second contribution is the grounded elicitation of what constitutes the value-in-use
that results from solution quality. Again, the picture that emerges is very different from the
extant view. Whereas business literature overwhelmingly assumes value to be a function of
the firm’s collective goals, we find that business solutions are also judged relative to the
28
individual goals of usage center members. While this may prove true for a broader range of
business offerings, it is perhaps particularly the case for product-service solutions, where the
redefinition of organizational boundaries within the resource integration process makes
profound changes to the working lives of customer staff. The extent to which these changes
are positively perceived by individuals is instrumental in how the solution is judged. Equally,
some dimensions of collective value-in-use are emergent and to some extent tacit rather than
formally specified in advance: process improvement, dependence avoidance, and the impact
on the customer’s competitive advantage and innovativeness.
Our third contribution is in uncovering heterogeneity in how solutions are judged. While
work on heterogeneity in the quality-value relationship is rare, it has received some attention
in consumer markets (Overby et al. 2004). We add to this by identifying moderators in the
solution context: resource integration involvement, role extraversion, solution ownership, and
reconfiguration capability. We thereby contribute to the interest in service literature on how
value depends on context (Vargo and Lusch 2016; Edvardsson, Tronvoll, and Gruber 2011).
Collectively, these findings suggest a very different view of solutions from that in the
existing literature. Current definitions emphasize that solutions a) integrate products and
services; b) are customized by the supplier; c) exist to solve a customer (organizational)
problem; and d) achieve better (organizational) outcomes than the sum of the individual
product and service components (Nordin and Kowalkowski 2010; Shankar, Berry, and Dotzel
2009; Storbacka 2011; Tuli, Kohli, and Bharadwaj, 2007). We add that solutions d) also
integrate customer resources and processes; e) are customized through a joint resource
integration process; f) are judged in terms of individual as well as organizational value-in-
use; and g) are continually optimized to meet emergent goals. We accordingly propose a
revised definition of business solutions as: The combining of supplier and customer processes
and resources through a joint resource integration process to create collective and individual

29
value-in-use, which is monitored and optimized through value auditing processes.
Implications for Practice
Our findings shed light on how manufacturers can succeed in shifting towards solutions. Our
field conversations with manufacturers suggest that some regard a solution primarily as a
pricing tactic to increase margins through bundling of products and services. However, as
Figure 3 shows, an additional range of skills is needed to provide high-quality solutions. Most
critically, the supplier needs to work with the customer to create an effective resource
integration process which combines the resources of both. This process requires a range of
asset management decisions to be made between the customer and supplier, answering
questions such as (in this maintenance and operations context) where to hold stock, who will
maintain what equipment, who is best placed to purchase equipment, and who can best
develop predictive maintenance systems. The answer should be contingent on the quality of
the resources that each party brings to bear. For example, a supplier to both DeviceCo and
HealthCo applied the same approach with each, taking over the sourcing of some parts from
the customer as part of the solution. However, while the supplier’s sourcing network
competence in the devices sector was considerable, regulatory differences in the health sector
meant that this aspect of the solution did not work well. The resource integration process,
then, is integral to the joint development of the value proposition, not subsequent to it.
In the above example, resource integration redefined the boundary between supplier and
customer; this is not uncommon. For example, Finland’s Neste Oil achieved a price premium
with shipping operator Tallink by taking over the customer’s oil stocks and switching oil
storage from trucks to a ship, reducing overall cost. The supplier also took over some
financial hedging as it could achieve better market rates (Neste Corporation 2016). Such
boundary shifting carries risks as well as benefits for the supplier. In order to gain greater
access to service profit pools, for example, Rolls-Royce’s TotalCare solution makes long-
30
term service pricing commitments for which the firm carries risk. Over-optimistic pricing of
some of these contracts has given the company financial problems years later. Taking risk
away from the customer only makes sense if the supplier can reduce that risk, estimate it,
mitigate it, and price for it. A compromise we saw on several occasions in our data was to
contract on value-in-use for only part of the contract. Another example of this is DHL’s
solution for a train operator, where the provision of food and drink logistics to station and
train buffets was contracted at around cost, with additional payments dependent on the
travelling consumer’s satisfaction with the buffet, which was staffed by the train operator.
Neither party could achieve this value-in-use on their own, but this element of outcome-based
contracting aligned their interests in achieving successful resource integration without
exposing either to excessive risk.
Making this resource integration process work requires high coordination effectiveness—
again, a quality of the dyad rather than of the supplier. Our data suggest that what works well
here is integrated teams, typically involving supplier personnel working permanently on site
at the customer’s premises. DHL’s successful Customer4Life initiative takes this integration
logic further than most: its account plans for its key accounts are written not by account
managers but by a joint team with the customer, and they are distributed in both firms.
To make resource integration work, the employee competence and customer orientation
required of supplier staff is critical. More broadly, the resource integration process can only
improve on the prior situation if the supplier brings to bear some superior resources.
Importantly, these go beyond the ability to serve competently (the traditional notion of
service quality) to emphasize an ability to improve the customer’s processes. Solutions
providers hence need to redesign not only their own offerings but also their customer’s
processes, to optimize not product quality but value-in-use. For example, Neste helped
Tallink refit its engines to use more efficient and environmentally friendly oil, lowering the
31
shipping firm’s total journey cost as well as its environmental objectives.
This reconfiguration of customer processes can lead to resistances within the customer
firm as its employees may fear losing influence or even their jobs, or because they just want
to avoid any changes within their job roles. This leads to the necessity to jointly design at an
early stage adequate change management strategies in order to overcome such conflicts and
capture the overall success of a solution. Another potential challenge to be borne in mind
when altering customer processes to improve solution quality is that these changes may
disrupt the solution quality for the customer and other suppliers. For example, UK
telecommunications firm BT provided its CRM system to its key distributors to help them
share a single customer view on the end customer’s relationship with BT. While helping the
distributor to sell and service BT products, this added complexity for the distributor in
navigating between BT’s system and its own database for other equipment suppliers.
The combining of joint processes and resources raises the issue of quality control. In a
preferred solution, both the supplier and the customer are engaged in quality control, and
their chief focus is not on what the supplier delivers but on the value-in-use jointly created.
Developing an effective value-in-use auditing process should therefore be a high priority for
solutions providers. This process needs to monitor the value-in-use created by the solution,
including emergent benefits such as unanticipated innovations or improved competitive
advantage; the value-in-use typology of Table 5 forms a checklist as to where these benefits
may lie, though others are possible. The auditing process also needs to optimize that value-in-
use, continuously looking for ways to increase valued outcomes, irrespective of whether they
form part of the contract or not. What seems to work best is for this process to be tautly
coupled with the customer’s auditing efforts, giving the partnership’s joint findings
credibility with senior management. For example, DHL holds quarterly reviews in which
benefits and problems for both parties are openly shared and tracked, and further value
32
creating opportunities are brainstormed. Reflecting the symmetry between customer and
supplier in our conceptual framework, these meetings are noticeably open, with both parties
declaring their satisfaction with the other and listing ways in which the other could improve.
This value-in-use auditing should be a key focus of account managers, given its importance
both in generating and signaling beneficial outcomes within the customer firm. Perhaps
solutions providers should rebrand quality control as value control.
When renewal decisions approach, account managers will also wish to be aware of the
distinct emphases of different members of the usage group revealed by our moderator
analysis. Hands-on employees (such as operations and maintenance staff) who are deeply
involved in resource integration focus more than others on individual value-in-use
dimensions such as task simplicity. Account managers may need to take account of these
individual motivations despite their absence from the formal outputs of the customer’s value-
in-use auditing processes. In addition, employees such as purchasing managers who spend
more time dealing with suppliers (which we term role extraversion) are likely to be less
concerned than others with the quality of customer resources. And finally, roles with low
responsibility for the solution’s commercial success (such as maintenance managers) place
less emphasis on value-in-use auditing than others. Conversations with customers will need
tailoring to these different interests.
Many of these conversations around individual value-in-use, however, cannot easily be
undertaken by marketing or sales people; it is service and operations staff involved in the
various processes of resource integration who are in a position to optimize such value. This
leads to the necessity of an integrated communications strategy, so that all supplier activities
in the customer journey aim at increasing quality and value perceptions. Again, this points to
a broader role for key account managers, who need to manage contacts with purchasing and
general managers, but also to coordinate wider communication activities with the customer.
33
A final management implication relates to market research. We have commented that the
picture of solution quality emerging from our data is radically different from the literature’s
extant view of product and service quality; it is equally different from the implicit view
embedded in most firms’ customer insight processes. Suppliers’ satisfaction surveys and
interviews commonly focus purely on capturing the customer’s view of the supplier’s
products and services, and in particular on moments of service delivery. While important,
these moments only form part of the solution; equally important in value creation are the
customer’s assessment of the quality of their own resources as well as of the joint resource
integration process. Suppliers need to expand the scope of their customer insight substantially
in order to uncover these perceptions. Furthermore, this insight should go beyond quality to
incorporate value-in-use perceptions. Unlike the customer’s value auditing process which
focuses purely on collective value, suppliers may wish to include individual value-in-use in
such market research. Such qualitative techniques as open interviews or, ideally, participant
or non-participant observation could be used to check and, if necessary, extend the set of
individual value-in-use constructs we have identified in further contexts. Surveys could then
track the extent to which the solution is creating or destroying individual value-in-use,
through items for each construct. Where feasible, survey research needs to avoid the trap of a
single purchasing respondent, but rather include multiple job roles across the usage group.
Research Directions
One important research direction is to conduct quantitative research exploring the antecedents
and outcomes of solution quality and value-in-use. This could usefully check the proposition
that value-in-use mediates the relationship between solution quality and overall satisfaction
(Yang and Peterson 2004). The many other issues requiring examination include how
customers trade off or otherwise combine value-in-use constructs in determining satisfaction
and purchase behaviors; how value-in-use perceptions of individuals impact on collective
34
decision-making about supplier choice; and whether value-in-use is judged absolutely or
relative to expectations at the moment of purchase. The relative role of collective value-in-
use constructs versus individual ones in determining behavioral outcomes forms a
particularly interesting research direction. Research is also needed into whether, in
customers’ decisions on supplier choice, they distinguish between value-in-use failures that
arise from supplier processes versus those that arise from their own customer processes or the
joint resource integration process. These questions ideally require data combining quality and
value-in-use perceptions with behaviors, if possible using longitudinal approaches.
Longitudinal data might also aid in exploration of the dynamics of value-in-use, extending
work on the dynamics of service quality (Sivakumar, Li, and Dong 2014). Our literature
review summarized in Table 1 suggests that all these research questions are just as relevant in
consumer markets as in business relationships.
References
Aarikka-Stenroos, Leena and Elina Jaakkola (2012), “Value Co-creation in Knowledge Intensive
Business Services: A Dyadic Perspective on the Joint Problem Solving Process,” Industrial
Marketing Management, 41 (1), 15–26.
American Marketing Association (AMA) (2013), “AMA Definition of Marketing”,
https://www.ama.org/AboutAMA/Pages/Definition-of-Marketing.aspx.
Barsalou, Lawrence W. (1991), “Deriving Categories to Achieve Goals,” Psychology of Learning and
Motivation, 27, 1-64.
Berry, Leonard L. (1995), “Relationship Marketing of Services—Growing Interest, Emerging
Perspectives,” Journal of the Academy of Marketing Science, 23 (4), 236-245.
Bolton, Ruth N. and James H. Drew (1991), “A Multistage Model of Customers’ Assessments of
Service Quality and Value,” Journal of Consumer Research, 17, 375-384.
Brown, Cathleen A. and Charles J. Detoy (1988), “A Comparison of the Personal Constructs of
Management in New and Experienced Managers,” in Introducing Psychological Research: Sixty
Studies that Shape Psychology, Philip Banyard and Andrew Grayson, eds. London: Macmillan.
Chitturi, Ravindra, Rajagopal Raghunathan, and Vijay Mahajan (2008), “Delight by Design: The Role
of Hedonic Versus Utilitarian Benefits,” Journal of Marketing, 72 (May), 48-63.
35
Cronin, J. Joseph, Michael K. Brady, and G. Tomas M. Hult (2000), “Assessing the Effects of
Quality, Value, and Customer Satisfaction on Consumer Behavioral Intentions in Service
Environments,” Journal of Retailing, 76 (2), 193–218.
Desarbo, Wayne S., Kamel Jedidi, and Indrajit Sinha (2001), “Customer Value Analysis in a
Heterogeneous Market,” Strategic Management Journal, 22 (9), 845–857.
Edvardsson, Bo, Bård Tronvoll, and Thorsten Gruber (2011), “Expanding Understanding of Service
Exchange and Value Co-Creation,” Journal of the Academy of Marketing Science, 39(2), 327–39.
Epp, Amber M. and Linda L. Price (2011), “Designing Solutions Around Customer Network Identity
Goals,” Journal of Marketing, 75 (2), 36 –54.
Fang, Eric, Robert W. Palmatier, and Jan-Benedict E. M. Steenkamp (2008), “Effect of Service
Transition Strategies on Firm Value,” Journal of Marketing, 72, 1-14.
Faroughian, Frank F., Stavros P. Kalafatis, Lesley Ledden, Phillip Samouel, and Markos H. Tsogas
(2012), “Value and Risk in Business-to-business E-banking,” Industrial Marketing Management,
41 (1), 68–81.
Gengler, Charles E. and Thomas J. Reynolds (1995), “Consumer Understanding and Advertising
Strategy: Analysis and Strategic Translation of Laddering Data,” Journal of Advertising
Research, 35(4), 19-33.
Glass, Jennifer and Valerie Camarigg (1992), “Gender, Parenthood, and Job-Family Compatibility,”
American Journal of Sociology, 98, 131-151.
Goffin, Keith and Ursula Koners (2011), “Tacit Knowledge, Lessons Learned and New Product
Development,” Journal of Product Innovation Management, 28 (2), 300-318.
——— , Fred Lemke, and Marek Szwejczewski (2006), “An Exploratory Study of ‘Close’ Supplier-
manufacturer Relationships,” Journal of Operations Management, 25, 189-209.
Gioia, Dennis A., Kevin G. Corley, and Aimee L. Hamilton (2012),”Seeking Qualitative Rigor in
Inductive Research: Notes on the Gioia methodology,” Organizational Research Methods, 16 (1),
15–31.
Golder, Peter N., Debanjan Mitra, and Christine Moorman (2012), “What is Quality? An Integrative
Framework of Processes and States,” Journal of Marketing, 76 (July), 1–23.
Grönroos, Christian and Päivi Voima (2013), “Critical Service Logic: Making Sense of Value
Creation and Co-creation,” Journal of the Academy of Marketing Science, 41, 133–150.
Gutman, Jonathan (1982), “A Means-end Chain Model Based on Consumer Categorization
Processes,” Journal of Marketing, 46 (2), 60-72.
Hannan Michael T. and John Freeman (1984), “Structural Inertia and Organizational Change”,
American Sociological Review, 49, 149-164
Holbrook, Morris B. (1999), Consumer Value: A Framework for Analysis and Research. Routledge.
36
Hollmann, Thomas, Cheryl B. Jarvis, and Mary Jo Bitner (2015), “Reaching the Breaking Point: A
Dynamic Process Theory of Business-to-Business Customer Defection,” Journal of the Academy
of Marketing Science, 43 (2), 257-278.
Hunt, Shelby D. and Sreedhar Madhavaram (2012), “Managerial Action and Resource-Advantage
Theory: Conceptual Frameworks Emanating from a Positive Theory of Competition,” Journal of
Business & Industrial Marketing, 27 (7), 582–591.
Johnston, Wesley J. and Thomas V. Bonoma (1981), “The Buying Center: Structure and Interaction
Patterns,” Journal of Marketing, 45 (3), 143-156.
Joshi, Ashwin W. (2009), “Continuous Supplier Performance Improvement: Effects of Collaborative
Communication and Control,” Journal of Marketing, 73 (1), 133-150.
Kastalli, Ivanka V. and Bart Van Looy (2013), “Servitization: Disentangling the Impact of Service
Business Model Innovation on Manufacturing Firm Performance,” Journal of Operations
Management, 31 (4), 169–180.
Keeney, Ralph L. (1999), “The Value of Internet Commerce to the Customer,” Management Science,
45 (4), 533-542.
Kelly, George A. (1963), A Theory of Personality: The Psychology of Personal Constructs. London:
Norton.
Kim, Sang-Hyun, Morris A. Cohen, and Serguei Netessine (2007), “Performance Contracting in
After-Sales Service Supply Chains,” Management Science, 53 (12), 1843-1858.
Kowalkowski, Christian, Charlotta Windahl, Daniel Kindström, and Heiko Gebauer (2015), “What
Service Transition? Rethinking Established Assumptions about Manufacturers' Service-led
Growth Strategies,” Industrial Marketing Management, 44 (2), 59–69.
Lam, Shun Y., Venkatesh Shankar, M. Krishna Erramilli, and Bvsan Murthy (2004), “Customer
Value, Satisfaction, Loyalty, and Switching Costs: An Illustration from a Business-to-Business
Service Context,” Journal of the Academy of Marketing Science, 32 (3), 293-311.
Lazarus, Richard S. (1990), “Theory-Based Stress Measurement,” Psychological Inquiry, 1 (1), 3-13.
Lemke, Fred, Moira Clark, and Hugh Wilson (2011), “Customer Experience Quality: An Exploration
in Business and Consumer Contexts Using Repertory Grid Technique,” Journal of the Academy
of Marketing Science, 39 (6), 846–869.
Macdonald, Emma K., Hugh N. Wilson, Veronica Martinez, and Amir Toossi (2011), “Assessing
Value-in-Use: A Conceptual Framework and Exploratory Study,” Industrial Marketing
Management, 40 (5), 671-682.
Marketing Science Institute (2014), 2014-2016 Research Priorities, Cambridge: MSI.
Mathwick, Charla, Naresh Malhotra, and Edward Rigdon (2001), “Experiential Value:
Conceptualization, Measurement and Application in the Catalog and Internet Shopping
Environment,” Journal of Retailing, 77 (1), 39-56.
37
McColl-Kennedy, Janet R., Stephen L. Vargo, Tracey S. Dagger, Jillian C. Sweeney, and Yasmin van
Kasteren (2012), “Health Care Customer Value Cocreation Practice Styles,” Journal of Service
Research, 12 (4), 370-389.
Möller, Kristian and Pekka Törrönen (2003), “Business Suppliers' Value Creation Potential: A
Capability-based Analysis,” Industrial Marketing Management, 32 (2), 109–118.
Neely, Andy (2008), “Exploring the Financial Consequences of the Servitization of Manufacturing,”
Operations Management Research, 1(2), 103-118.
——— , Ornella Benedettini, and Ivanka Visnjic (2011), “The Servitization of Manufacturing:
Further Evidence,” European Operations Management Association Conference, Cambridge, July.
Neste Corporation (2016), “Neste and AS Tallink Grupp Continue and Deepen Strategic Partnership,”
Press Release, 27 January. Helsinki: Neste Corporation.
Nordin, Fredrik and Christian Kowalkowski (2010), “Solutions Offerings: A Critical Review and
Reconceptualization,” Journal of Service Management, 21 (4), 441–459.
Overby, Jeffrey W., Sarah Fisher Gardial, and Robert B. Woodruff (2004), “French Versus American
Consumers' Attachment of Value to a Product in a Common Consumption Context: A Cross-
National Comparison,” Journal of the Academy of Marketing Science, 32 (4), 437-460.
Palmatier, Robert W., Lisa K. Scheer, Kenneth R. Evans, and Todd J. Arnold (2008), “Achieving
Relationship Marketing Effectiveness in Business-to-business Exchanges,” Journal of the
Academy of Marketing Science, 36 (2), 174-190.
Payne, Adrian F., Kaj Storbacka, and Pennie Frow (2008), “Managing the Co-creation of Value,”
Journal of the Academy of Marketing Science, 36 (1), 83-96.
Peterman, Michelle L. (1997), “The Effects of Concrete and Abstract Consumer Goals on Information
Processing,” Psychology and Marketing, 14 (6), 561-583.
Pieters, Rik, Hans Baumgartner, and Doug Allen (1995), “A means-end chain approach to consumer
goal structures,” International Journal of Research in Marketing, 12 (3), 227-244
Raghubir, Priya and Kim Corfman (1999), “When Do Price Promotions Affect Pretrial Brand
Evaluations?” Journal of Marketing Research, 36 (2), 211-22.
Reynolds, Thomas J., and Jonathan Gutman (1988), “Laddering Theory, Method, Analysis, and
Interpretation,” Journal of Advertising Research, 28 (1), 11–31.
Rust, Roland T. and Bruce Cooil (1994), “Reliability Measures for Qualitative Data: Theory and
Implications”, Journal of Marketing Research, 31, 1-14.
Shankar, Venkatesh, Leonard L. Berry, and Thomas Dotzel (2009), “A Practical Guide to Combining
Products and Services,” Harvard Business Review, 87, 94-99.
Sheth, Jagdish N., Bruce I. Newman, and Barbara L. Gross (1991), “Why We Buy What We Buy: A
Theory of Consumption Values,” Journal of Business Research, 22 (2), 159-170.
Sirdeshmukh, Deepak, Jagdip Singh, and Barry Sabol (2002), “Consumer Trust, Value, and Loyalty
in Relational Exchanges,” Journal of Marketing, 66 (1), 15-37.
38
Sivakumar, K., Mei Li, and Beibei Dong (2014), “Service Quality: The Impact of Frequency, Timing,
Proximity, and Sequence of Failures and Delights,” Journal of Marketing, 78 (1), 41-58.
Smith, Holly J. (2000), “The Reliability and Validity of Structural Measures Derived from Repertory
Grids,” Journal of Constructivist Psychology, 13 (3), 221-230.
Storbacka, Kaj (2011), “A Solution Business Model: Capabilities and Management Practices for
Integrated Solutions,” Industrial Marketing Management, 40 (5), 699–711.
Sweeney, Jillian C., Tracey S. Danaher, and Lester W. Johnson (1999), “The Role of Perceived Risk
in the Quality-Value Relationship: A Study in a Retail Environment,” Journal of Retailing, 75
(1), 77–105.
——— and Geoff N. Soutar (2001), "Consumer Perceived Value: The Development of a Multiple
Item Scale", Journal of Retailing, 77 (2), 203-220.
Tan, Felix B. and M. Gordon Hunter (2002), "The Repertory Grid Technique: A Method for the Study
of Cognition in Information Systems," MIS Quarterly, 26 (1), 39-57.
Tuli, Kapil R., Ajay K. Kohli, and Sundar G. Bharadwaj (2007), “Rethinking Customer Solutions:
From Product Bundles to Relational Processes,” Journal of Marketing, 71 (3), 1-17.
Ulaga, Wolfgang (2003), “Capturing Value Creation in Business Relationships: A Customer
Perspective”, Industrial Marketing Management, 32 (8), 677-93.
——— and Andreas Eggert (2006), “Value-based Differentiation in Business Relationships: Gaining
and Sustaining Key Supplier Status,” Journal of Marketing, 70 (1), 119–136.
——— and Werner J. Reinartz (2011), “Hybrid Offerings: How Manufacturing Firms combine
Goods and Services Successfully,” Journal of Marketing, 75 (6), 5–23.
Vargo, Steven L. and Robert F. Lusch (2004), “Evolving to a New Dominant Logic of Marketing,”
Journal of Marketing, 68 (1), 1-17.
——— and ——— (2016), “Institutions and Axioms: An Extension and Update of Service-
Dominant Logic,” Journal of the Academy of Marketing Science Vol 44 (1), 5–23.
Walter, Achim, Thomas Ritter, and Hans-Georg Gemünden (2001), “Value Creation in Buyer–Seller
Relationships: Theoretical Considerations and Empirical Results from a Supplier's Perspective,”
Industrial Marketing Management, 30 (4), 365–377.
Woodruff, Robert B. (1997), “Customer Value: The Next Source for Competitive Advantage,”
Journal of the Academy of Marketing Science, 25 (2), 139-153.
Yang, Zhilin and Robin T. Peterson (2004), “Customer Perceived Value, Satisfaction, and Loyalty:
The Role of Switching Costs,” Psychology and Marketing, 21 (10), 799–822.
Zeithaml, Valerie (1988), “Consumer Perceptions of Price, Quality, and Value: A Means-End Model
and Synthesis of Evidence,” Journal of Marketing, 52 (July), 2-22.
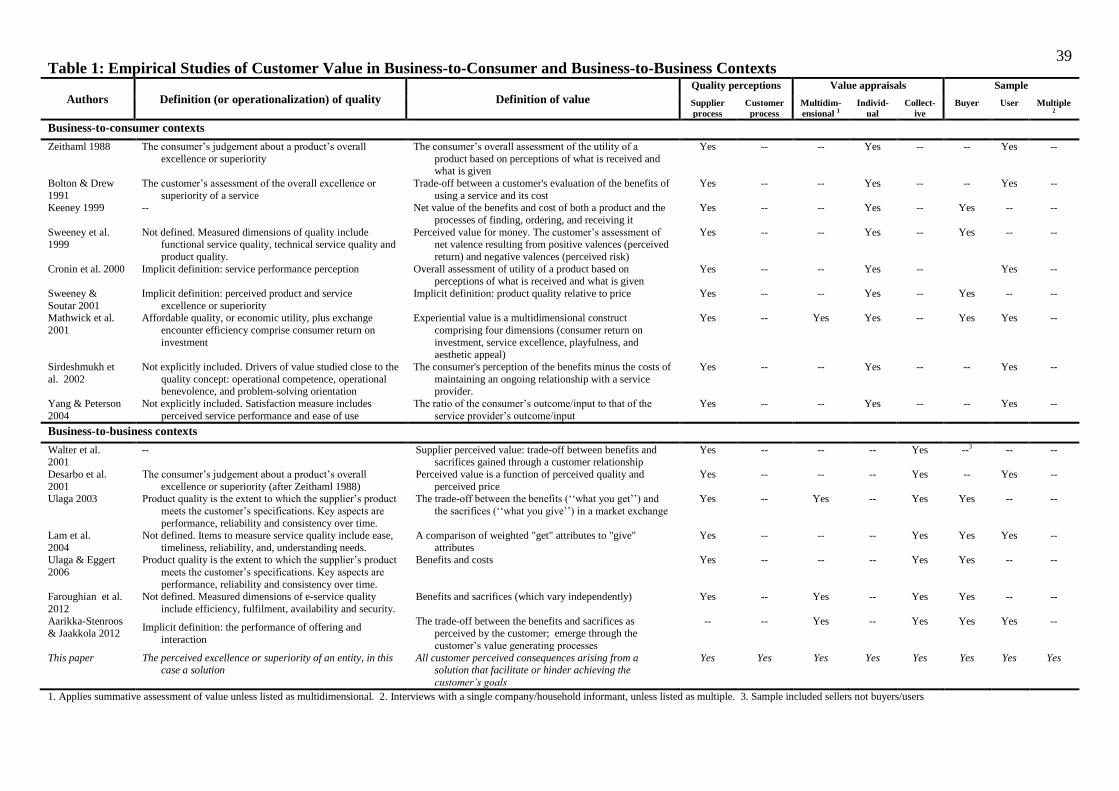
39 Table 1: Empirical Studies of Customer Value in Business-to-Consumer and Business-to-Business Contexts
Authors Definition (or operationalization) of quality Definition of value
Quality perceptions Value appraisals Sample
Supplier
process
Customer
process
Multidim-
ensional 1
Individ-
ual
Collect-
ive
Buyer
User
Multiple2
Business-to-consumer contexts
Zeithaml 1988 The consumer’s judgement about a product’s overall
excellence or superiority
The consumer’s overall assessment of the utility of a
product based on perceptions of what is received and what is given
Yes -- -- Yes -- -- Yes --
Bolton & Drew
1991
The customer’s assessment of the overall excellence or
superiority of a service
Trade-off between a customer's evaluation of the benefits of
using a service and its cost
Yes -- -- Yes -- -- Yes --
Keeney 1999 -- Net value of the benefits and cost of both a product and the
processes of finding, ordering, and receiving it
Yes -- -- Yes -- Yes -- --
Sweeney et al. 1999
Not defined. Measured dimensions of quality include functional service quality, technical service quality and
product quality.
Perceived value for money. The customer’s assessment of net valence resulting from positive valences (perceived
return) and negative valences (perceived risk)
Yes -- -- Yes -- Yes -- --
Cronin et al. 2000 Implicit definition: service performance perception Overall assessment of utility of a product based on perceptions of what is received and what is given
Yes -- -- Yes -- Yes --
Sweeney &
Soutar 2001
Implicit definition: perceived product and service
excellence or superiority
Implicit definition: product quality relative to price Yes -- -- Yes -- Yes -- --
Mathwick et al.
2001
Affordable quality, or economic utility, plus exchange
encounter efficiency comprise consumer return on
investment
Experiential value is a multidimensional construct
comprising four dimensions (consumer return on
investment, service excellence, playfulness, and aesthetic appeal)
Yes -- Yes Yes -- Yes Yes --
Sirdeshmukh et
al. 2002
Not explicitly included. Drivers of value studied close to the
quality concept: operational competence, operational benevolence, and problem-solving orientation
The consumer's perception of the benefits minus the costs of
maintaining an ongoing relationship with a service provider.
Yes -- -- Yes -- -- Yes --
Yang & Peterson
2004
Not explicitly included. Satisfaction measure includes
perceived service performance and ease of use
The ratio of the consumer’s outcome/input to that of the
service provider’s outcome/input
Yes -- -- Yes -- -- Yes --
Business-to-business contexts
Walter et al. 2001
-- Supplier perceived value: trade-off between benefits and sacrifices gained through a customer relationship
Yes -- -- -- Yes --3 -- --
Desarbo et al.
2001
The consumer’s judgement about a product’s overall
excellence or superiority (after Zeithaml 1988)
Perceived value is a function of perceived quality and
perceived price
Yes -- -- -- Yes -- Yes --
Ulaga 2003 Product quality is the extent to which the supplier’s product
meets the customer’s specifications. Key aspects are
performance, reliability and consistency over time.
The trade-off between the benefits (‘‘what you get’’) and
the sacrifices (‘‘what you give’’) in a market exchange
Yes -- Yes -- Yes Yes -- --
Lam et al.
2004
Not defined. Items to measure service quality include ease,
timeliness, reliability, and, understanding needs.
A comparison of weighted "get" attributes to "give"
attributes
Yes -- -- -- Yes Yes Yes --
Ulaga & Eggert
2006
Product quality is the extent to which the supplier’s product
meets the customer’s specifications. Key aspects are
performance, reliability and consistency over time.
Benefits and costs Yes -- -- -- Yes Yes -- --
Faroughian et al.
2012
Not defined. Measured dimensions of e-service quality
include efficiency, fulfilment, availability and security.
Benefits and sacrifices (which vary independently) Yes -- Yes -- Yes Yes -- --
Aarikka-Stenroos & Jaakkola 2012
Implicit definition: the performance of offering and
interaction
The trade-off between the benefits and sacrifices as perceived by the customer; emerge through the
customer’s value generating processes
-- -- Yes -- Yes Yes Yes --
This paper The perceived excellence or superiority of an entity, in this case a solution
All customer perceived consequences arising from a solution that facilitate or hinder achieving the
customer’s goals
Yes Yes Yes Yes Yes Yes Yes Yes
1. Applies summative assessment of value unless listed as multidimensional. 2. Interviews with a single company/household informant, unless listed as multiple. 3. Sample included sellers not buyers/users
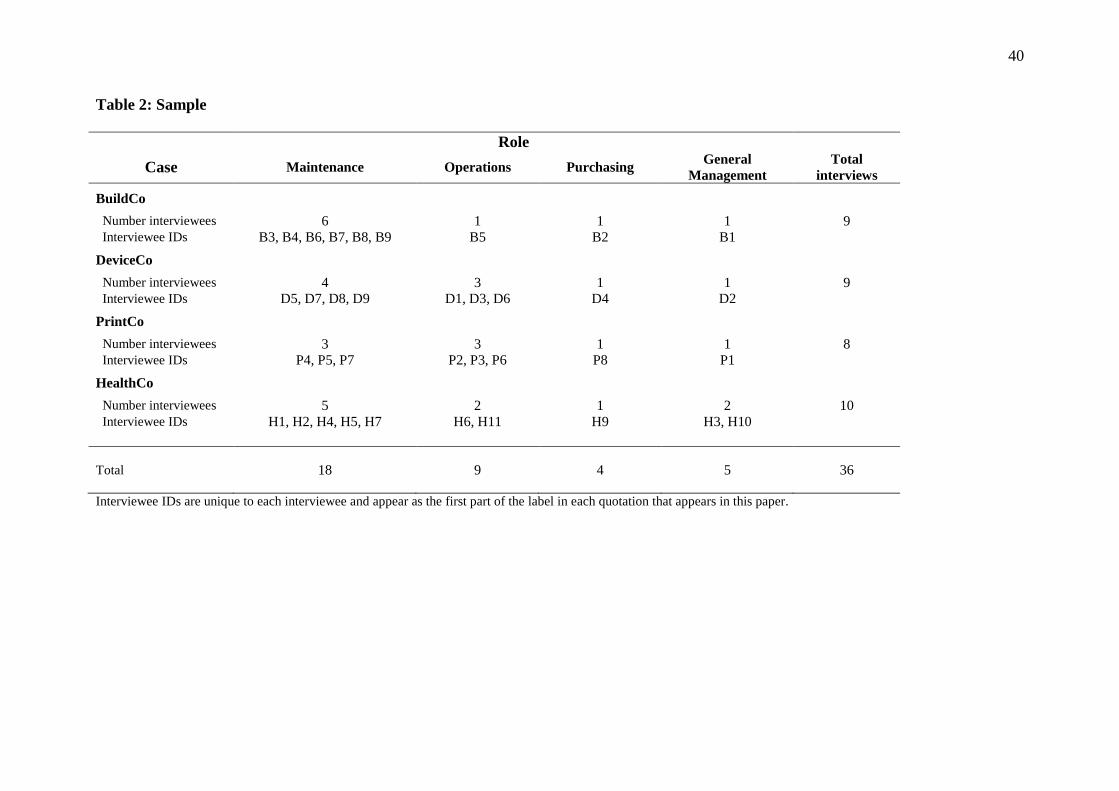
40
Table 2: Sample
Role
Case Maintenance Operations Purchasing General
Management
Total
interviews
BuildCo
Number interviewees 6 1 1 1 9 Interviewee IDs B3, B4, B6, B7, B8, B9 B5 B2 B1
DeviceCo
Number interviewees 4 3 1 1 9 Interviewee IDs D5, D7, D8, D9 D1, D3, D6 D4 D2
PrintCo
Number interviewees 3 3 1 1 8 Interviewee IDs P4, P5, P7 P2, P3, P6 P8 P1
HealthCo
Number interviewees 5 2 1 2 10 Interviewee IDs H1, H2, H4, H5, H7 H6, H11 H9 H3, H10
Total
18 9 4 5 36
Interviewee IDs are unique to each interviewee and appear as the first part of the label in each quotation that appears in this paper.
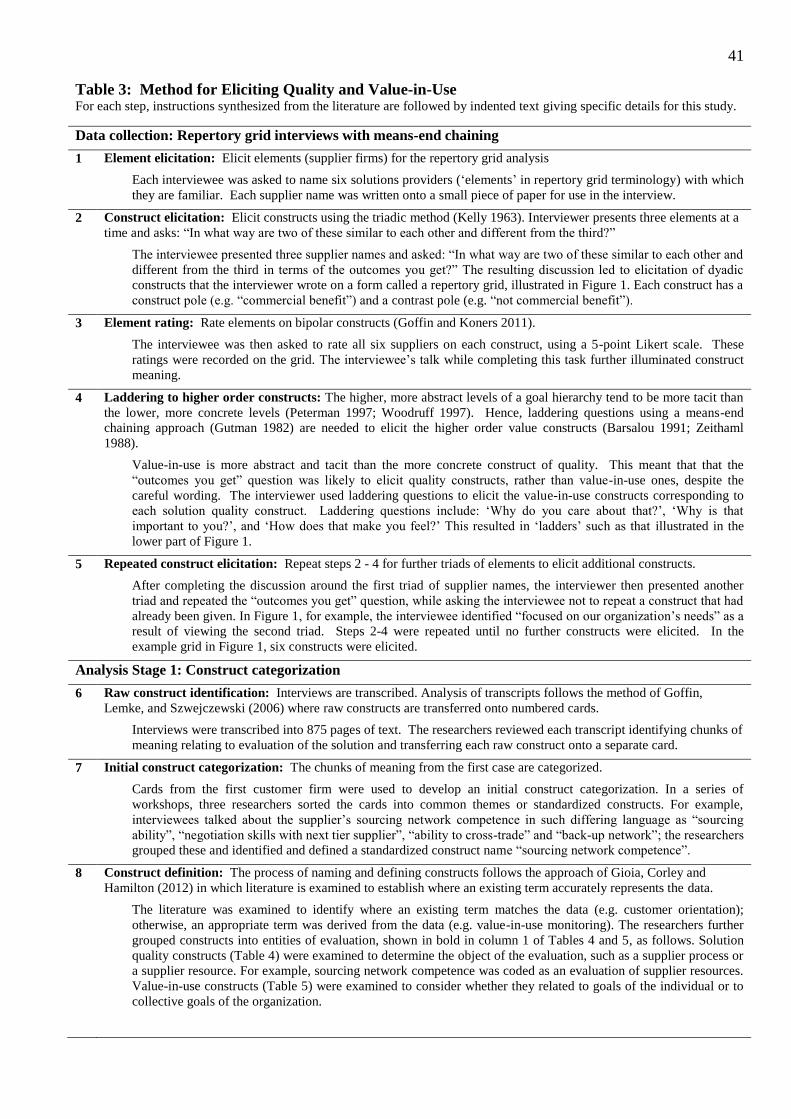
41
Table 3: Method for Eliciting Quality and Value-in-Use For each step, instructions synthesized from the literature are followed by indented text giving specific details for this study.
Data collection: Repertory grid interviews with means-end chaining
1 Element elicitation: Elicit elements (supplier firms) for the repertory grid analysis
Each interviewee was asked to name six solutions providers (‘elements’ in repertory grid terminology) with which
they are familiar. Each supplier name was written onto a small piece of paper for use in the interview.
2 Construct elicitation: Elicit constructs using the triadic method (Kelly 1963). Interviewer presents three elements at a
time and asks: “In what way are two of these similar to each other and different from the third?”
The interviewee presented three supplier names and asked: “In what way are two of these similar to each other and
different from the third in terms of the outcomes you get?” The resulting discussion led to elicitation of dyadic
constructs that the interviewer wrote on a form called a repertory grid, illustrated in Figure 1. Each construct has a
construct pole (e.g. “commercial benefit”) and a contrast pole (e.g. “not commercial benefit”).
3 Element rating: Rate elements on bipolar constructs (Goffin and Koners 2011).
The interviewee was then asked to rate all six suppliers on each construct, using a 5-point Likert scale. These
ratings were recorded on the grid. The interviewee’s talk while completing this task further illuminated construct
meaning.
4 Laddering to higher order constructs: The higher, more abstract levels of a goal hierarchy tend to be more tacit than
the lower, more concrete levels (Peterman 1997; Woodruff 1997). Hence, laddering questions using a means-end
chaining approach (Gutman 1982) are needed to elicit the higher order value constructs (Barsalou 1991; Zeithaml
1988).
Value-in-use is more abstract and tacit than the more concrete construct of quality. This meant that that the
“outcomes you get” question was likely to elicit quality constructs, rather than value-in-use ones, despite the
careful wording. The interviewer used laddering questions to elicit the value-in-use constructs corresponding to
each solution quality construct. Laddering questions include: ‘Why do you care about that?’, ‘Why is that
important to you?’, and ‘How does that make you feel?’ This resulted in ‘ladders’ such as that illustrated in the
lower part of Figure 1.
5 Repeated construct elicitation: Repeat steps 2 - 4 for further triads of elements to elicit additional constructs.
After completing the discussion around the first triad of supplier names, the interviewer then presented another
triad and repeated the “outcomes you get” question, while asking the interviewee not to repeat a construct that had
already been given. In Figure 1, for example, the interviewee identified “focused on our organization’s needs” as a
result of viewing the second triad. Steps 2-4 were repeated until no further constructs were elicited. In the
example grid in Figure 1, six constructs were elicited.
Analysis Stage 1: Construct categorization
6 Raw construct identification: Interviews are transcribed. Analysis of transcripts follows the method of Goffin,
Lemke, and Szwejczewski (2006) where raw constructs are transferred onto numbered cards.
Interviews were transcribed into 875 pages of text. The researchers reviewed each transcript identifying chunks of
meaning relating to evaluation of the solution and transferring each raw construct onto a separate card.
7 Initial construct categorization: The chunks of meaning from the first case are categorized.
Cards from the first customer firm were used to develop an initial construct categorization. In a series of
workshops, three researchers sorted the cards into common themes or standardized constructs. For example,
interviewees talked about the supplier’s sourcing network competence in such differing language as “sourcing
ability”, “negotiation skills with next tier supplier”, “ability to cross-trade” and “back-up network”; the researchers
grouped these and identified and defined a standardized construct name “sourcing network competence”.
8 Construct definition: The process of naming and defining constructs follows the approach of Gioia, Corley and
Hamilton (2012) in which literature is examined to establish where an existing term accurately represents the data.
The literature was examined to identify where an existing term matches the data (e.g. customer orientation);
otherwise, an appropriate term was derived from the data (e.g. value-in-use monitoring). The researchers further
grouped constructs into entities of evaluation, shown in bold in column 1 of Tables 4 and 5, as follows. Solution
quality constructs (Table 4) were examined to determine the object of the evaluation, such as a supplier process or
a supplier resource. For example, sourcing network competence was coded as an evaluation of supplier resources.
Value-in-use constructs (Table 5) were examined to consider whether they related to goals of the individual or to
collective goals of the organization.
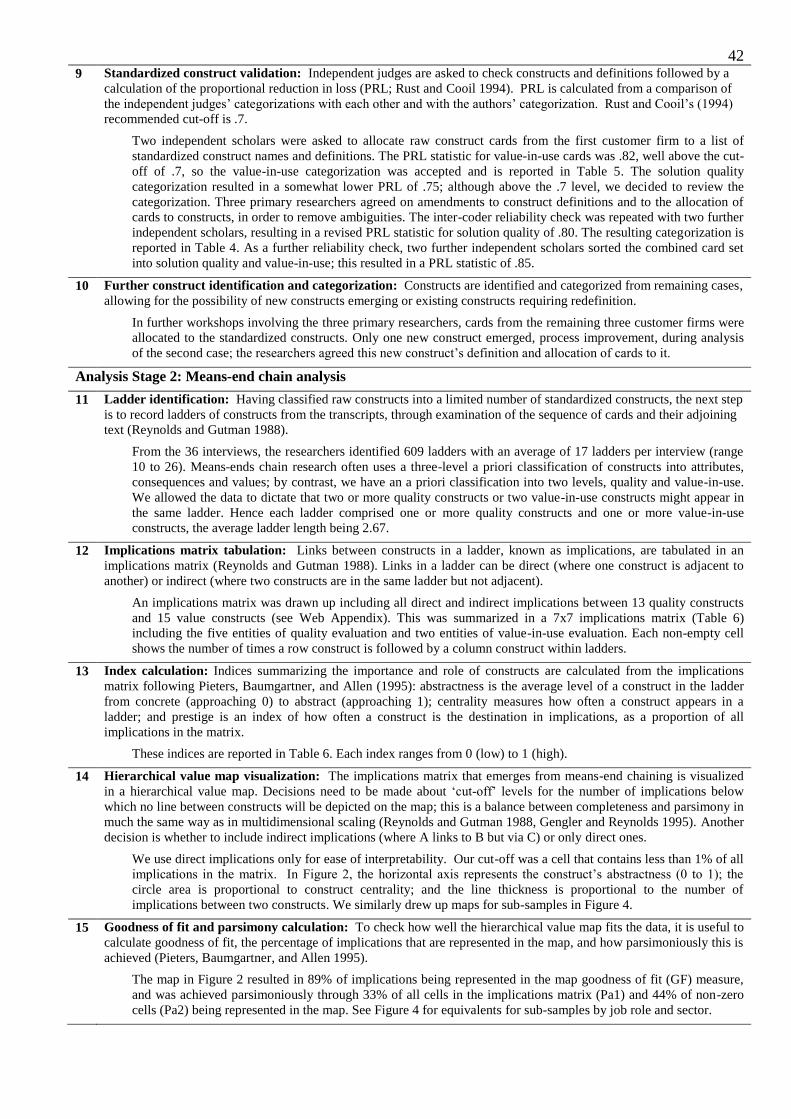
42 9 Standardized construct validation: Independent judges are asked to check constructs and definitions followed by a
calculation of the proportional reduction in loss (PRL; Rust and Cooil 1994). PRL is calculated from a comparison of
the independent judges’ categorizations with each other and with the authors’ categorization. Rust and Cooil’s (1994)
recommended cut-off is .7.
Two independent scholars were asked to allocate raw construct cards from the first customer firm to a list of
standardized construct names and definitions. The PRL statistic for value-in-use cards was .82, well above the cut-
off of .7, so the value-in-use categorization was accepted and is reported in Table 5. The solution quality
categorization resulted in a somewhat lower PRL of .75; although above the .7 level, we decided to review the
categorization. Three primary researchers agreed on amendments to construct definitions and to the allocation of
cards to constructs, in order to remove ambiguities. The inter-coder reliability check was repeated with two further
independent scholars, resulting in a revised PRL statistic for solution quality of .80. The resulting categorization is
reported in Table 4. As a further reliability check, two further independent scholars sorted the combined card set
into solution quality and value-in-use; this resulted in a PRL statistic of .85.
10 Further construct identification and categorization: Constructs are identified and categorized from remaining cases,
allowing for the possibility of new constructs emerging or existing constructs requiring redefinition.
In further workshops involving the three primary researchers, cards from the remaining three customer firms were
allocated to the standardized constructs. Only one new construct emerged, process improvement, during analysis
of the second case; the researchers agreed this new construct’s definition and allocation of cards to it.
Analysis Stage 2: Means-end chain analysis
11 Ladder identification: Having classified raw constructs into a limited number of standardized constructs, the next step
is to record ladders of constructs from the transcripts, through examination of the sequence of cards and their adjoining
text (Reynolds and Gutman 1988).
From the 36 interviews, the researchers identified 609 ladders with an average of 17 ladders per interview (range
10 to 26). Means-ends chain research often uses a three-level a priori classification of constructs into attributes,
consequences and values; by contrast, we have an a priori classification into two levels, quality and value-in-use.
We allowed the data to dictate that two or more quality constructs or two value-in-use constructs might appear in
the same ladder. Hence each ladder comprised one or more quality constructs and one or more value-in-use
constructs, the average ladder length being 2.67.
12 Implications matrix tabulation: Links between constructs in a ladder, known as implications, are tabulated in an
implications matrix (Reynolds and Gutman 1988). Links in a ladder can be direct (where one construct is adjacent to
another) or indirect (where two constructs are in the same ladder but not adjacent).
An implications matrix was drawn up including all direct and indirect implications between 13 quality constructs
and 15 value constructs (see Web Appendix). This was summarized in a 7x7 implications matrix (Table 6)
including the five entities of quality evaluation and two entities of value-in-use evaluation. Each non-empty cell
shows the number of times a row construct is followed by a column construct within ladders.
13 Index calculation: Indices summarizing the importance and role of constructs are calculated from the implications
matrix following Pieters, Baumgartner, and Allen (1995): abstractness is the average level of a construct in the ladder
from concrete (approaching 0) to abstract (approaching 1); centrality measures how often a construct appears in a
ladder; and prestige is an index of how often a construct is the destination in implications, as a proportion of all
implications in the matrix.
These indices are reported in Table 6. Each index ranges from 0 (low) to 1 (high).
14 Hierarchical value map visualization: The implications matrix that emerges from means-end chaining is visualized
in a hierarchical value map. Decisions need to be made about ‘cut-off’ levels for the number of implications below
which no line between constructs will be depicted on the map; this is a balance between completeness and parsimony in
much the same way as in multidimensional scaling (Reynolds and Gutman 1988, Gengler and Reynolds 1995). Another
decision is whether to include indirect implications (where A links to B but via C) or only direct ones.
We use direct implications only for ease of interpretability. Our cut-off was a cell that contains less than 1% of all
implications in the matrix. In Figure 2, the horizontal axis represents the construct’s abstractness (0 to 1); the
circle area is proportional to construct centrality; and the line thickness is proportional to the number of
implications between two constructs. We similarly drew up maps for sub-samples in Figure 4.
15 Goodness of fit and parsimony calculation: To check how well the hierarchical value map fits the data, it is useful to
calculate goodness of fit, the percentage of implications that are represented in the map, and how parsimoniously this is
achieved (Pieters, Baumgartner, and Allen 1995).
The map in Figure 2 resulted in 89% of implications being represented in the map goodness of fit (GF) measure,
and was achieved parsimoniously through 33% of all cells in the implications matrix (Pa1) and 44% of non-zero
cells (Pa2) being represented in the map. See Figure 4 for equivalents for sub-samples by job role and sector.
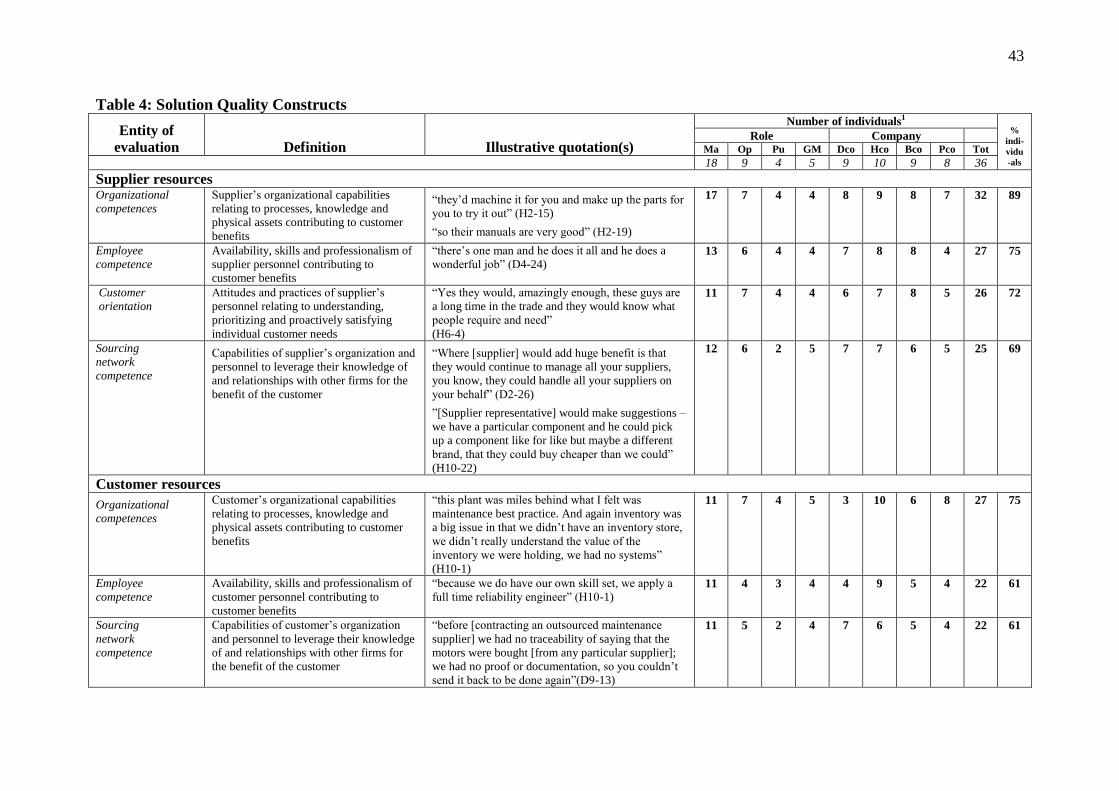
43
Table 4: Solution Quality Constructs
Entity of
evaluation Definition Illustrative quotation(s)
Number of individuals1
%
indi-
vidu
-als
Role Company Ma Op Pu GM Dco Hco Bco Pco Tot
18 9 4 5 9 10 9 8 36
Supplier resources
Organizational
competences
Supplier’s organizational capabilities
relating to processes, knowledge and
physical assets contributing to customer
benefits
“they’d machine it for you and make up the parts for
you to try it out” (H2-15)
“so their manuals are very good” (H2-19)
17 7 4 4 8 9 8 7 32 89
Employee
competence
Availability, skills and professionalism of
supplier personnel contributing to
customer benefits
“there’s one man and he does it all and he does a
wonderful job” (D4-24) 13 6 4 4 7 8 8 4 27 75
Customer
orientation
Attitudes and practices of supplier’s
personnel relating to understanding,
prioritizing and proactively satisfying
individual customer needs
“Yes they would, amazingly enough, these guys are
a long time in the trade and they would know what
people require and need”
(H6-4)
11 7 4 4 6 7 8 5 26 72
Sourcing
network
competence
Capabilities of supplier’s organization and
personnel to leverage their knowledge of
and relationships with other firms for the
benefit of the customer
“Where [supplier] would add huge benefit is that
they would continue to manage all your suppliers,
you know, they could handle all your suppliers on
your behalf” (D2-26)
”[Supplier representative] would make suggestions –
we have a particular component and he could pick
up a component like for like but maybe a different
brand, that they could buy cheaper than we could”
(H10-22)
12 6 2 5 7 7 6 5 25 69
Customer resources
Organizational
competences
Customer’s organizational capabilities
relating to processes, knowledge and
physical assets contributing to customer
benefits
“this plant was miles behind what I felt was
maintenance best practice. And again inventory was
a big issue in that we didn’t have an inventory store,
we didn’t really understand the value of the
inventory we were holding, we had no systems”
(H10-1)
11 7 4 5 3 10 6 8 27 75
Employee
competence
Availability, skills and professionalism of
customer personnel contributing to
customer benefits
“because we do have our own skill set, we apply a
full time reliability engineer” (H10-1) 11 4 3 4 4 9 5 4 22 61
Sourcing
network
competence
Capabilities of customer’s organization
and personnel to leverage their knowledge
of and relationships with other firms for
the benefit of the customer
“before [contracting an outsourced maintenance
supplier] we had no traceability of saying that the
motors were bought [from any particular supplier];
we had no proof or documentation, so you couldn’t
send it back to be done again”(D9-13)
11 5 2 4 7 6 5 4 22 61
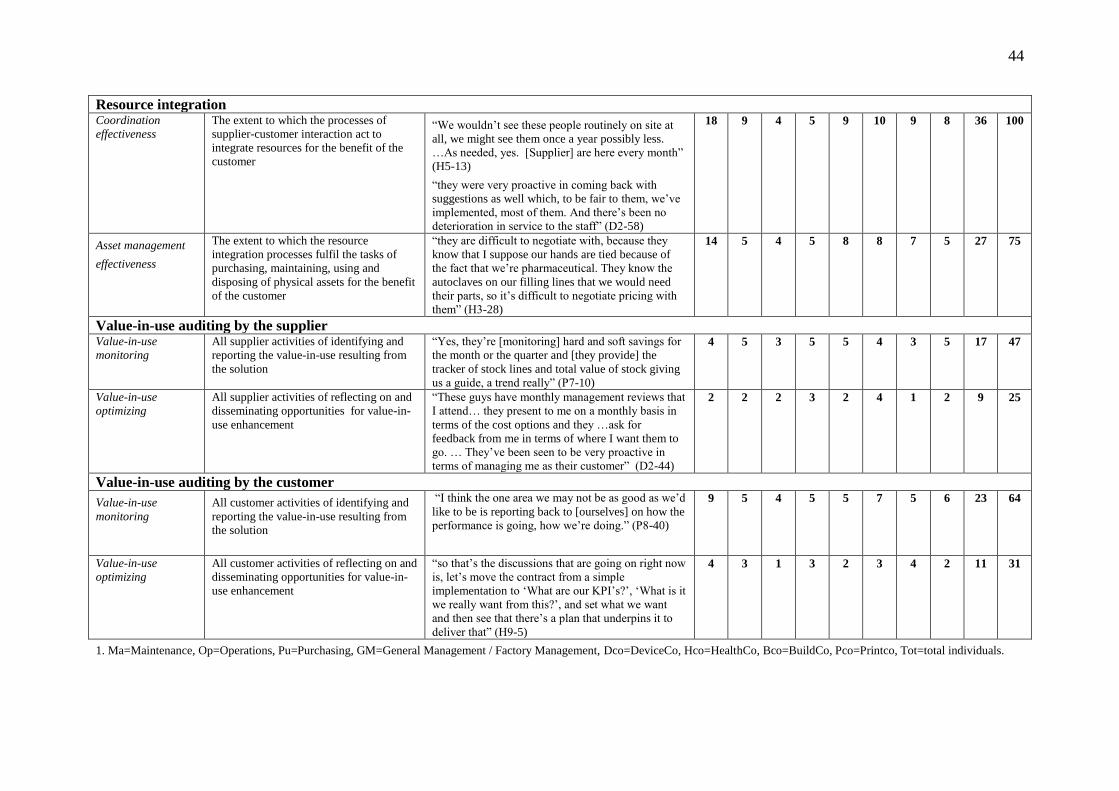
44
Resource integration
Coordination
effectiveness
The extent to which the processes of
supplier-customer interaction act to
integrate resources for the benefit of the
customer
“We wouldn’t see these people routinely on site at
all, we might see them once a year possibly less.
…As needed, yes. [Supplier] are here every month”
(H5-13)
“they were very proactive in coming back with
suggestions as well which, to be fair to them, we’ve
implemented, most of them. And there’s been no
deterioration in service to the staff” (D2-58)
18 9 4 5 9 10 9 8 36 100
Asset management
effectiveness
The extent to which the resource
integration processes fulfil the tasks of
purchasing, maintaining, using and
disposing of physical assets for the benefit
of the customer
“they are difficult to negotiate with, because they
know that I suppose our hands are tied because of
the fact that we’re pharmaceutical. They know the
autoclaves on our filling lines that we would need
their parts, so it’s difficult to negotiate pricing with
them” (H3-28)
14 5 4 5 8 8 7 5 27 75
Value-in-use auditing by the supplier Value-in-use
monitoring
All supplier activities of identifying and
reporting the value-in-use resulting from
the solution
“Yes, they’re [monitoring] hard and soft savings for
the month or the quarter and [they provide] the
tracker of stock lines and total value of stock giving
us a guide, a trend really” (P7-10)
4 5 3 5 5 4 3 5 17 47
Value-in-use
optimizing
All supplier activities of reflecting on and
disseminating opportunities for value-in-
use enhancement
“These guys have monthly management reviews that
I attend… they present to me on a monthly basis in
terms of the cost options and they …ask for
feedback from me in terms of where I want them to
go. … They’ve been seen to be very proactive in
terms of managing me as their customer” (D2-44)
2 2 2 3 2 4 1 2 9 25
Value-in-use auditing by the customer
Value-in-use
monitoring
All customer activities of identifying and
reporting the value-in-use resulting from
the solution
“I think the one area we may not be as good as we’d
like to be is reporting back to [ourselves] on how the
performance is going, how we’re doing.” (P8-40)
9 5 4 5 5 7 5 6 23 64
Value-in-use
optimizing
All customer activities of reflecting on and
disseminating opportunities for value-in-
use enhancement
“so that’s the discussions that are going on right now
is, let’s move the contract from a simple
implementation to ‘What are our KPI’s?’, ‘What is it
we really want from this?’, and set what we want
and then see that there’s a plan that underpins it to
deliver that” (H9-5)
4 3 1 3 2 3 4 2 11 31
1. Ma=Maintenance, Op=Operations, Pu=Purchasing, GM=General Management / Factory Management, Dco=DeviceCo, Hco=HealthCo, Bco=BuildCo, Pco=Printco, Tot=total individuals.
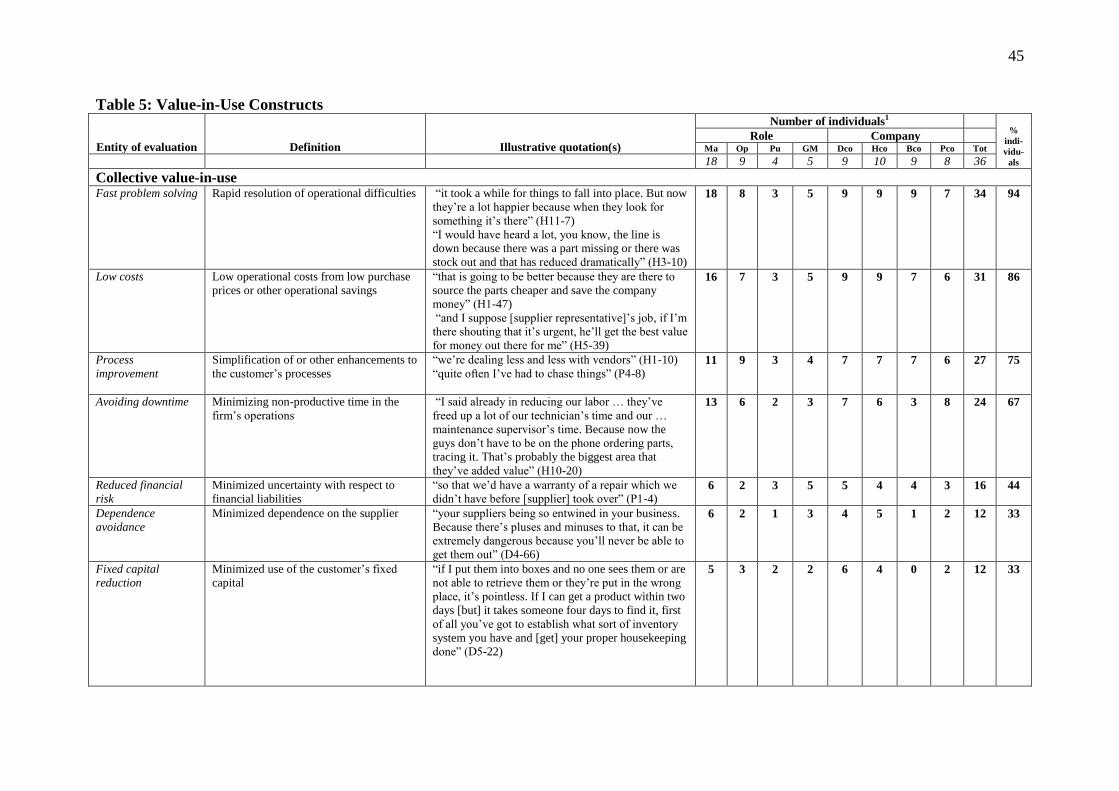
45
Table 5: Value-in-Use Constructs
Entity of evaluation Definition Illustrative quotation(s)
Number of individuals1
%
indi-
vidu-
als
Role Company Ma Op Pu GM Dco Hco Bco Pco Tot
18 9 4 5 9 10 9 8 36
Collective value-in-use Fast problem solving Rapid resolution of operational difficulties “it took a while for things to fall into place. But now
they’re a lot happier because when they look for
something it’s there” (H11-7)
“I would have heard a lot, you know, the line is
down because there was a part missing or there was
stock out and that has reduced dramatically” (H3-10)
18 8 3 5 9 9 9 7 34 94
Low costs Low operational costs from low purchase
prices or other operational savings
“that is going to be better because they are there to
source the parts cheaper and save the company
money” (H1-47)
“and I suppose [supplier representative]’s job, if I’m
there shouting that it’s urgent, he’ll get the best value
for money out there for me” (H5-39)
16 7 3 5 9 9 7 6 31 86
Process
improvement
Simplification of or other enhancements to
the customer’s processes
“we’re dealing less and less with vendors” (H1-10)
“quite often I’ve had to chase things” (P4-8)
11 9 3 4 7 7 7 6 27 75
Avoiding downtime Minimizing non-productive time in the
firm’s operations
“I said already in reducing our labor … they’ve
freed up a lot of our technician’s time and our …
maintenance supervisor’s time. Because now the
guys don’t have to be on the phone ordering parts,
tracing it. That’s probably the biggest area that
they’ve added value” (H10-20)
13 6 2 3 7 6 3 8 24 67
Reduced financial
risk
Minimized uncertainty with respect to
financial liabilities
“so that we’d have a warranty of a repair which we
didn’t have before [supplier] took over” (P1-4) 6 2 3 5 5 4 4 3 16 44
Dependence
avoidance
Minimized dependence on the supplier “your suppliers being so entwined in your business.
Because there’s pluses and minuses to that, it can be
extremely dangerous because you’ll never be able to
get them out” (D4-66)
6 2 1 3 4 5 1 2 12 33
Fixed capital
reduction
Minimized use of the customer’s fixed
capital
“if I put them into boxes and no one sees them or are
not able to retrieve them or they’re put in the wrong
place, it’s pointless. If I can get a product within two
days [but] it takes someone four days to find it, first
of all you’ve got to establish what sort of inventory
system you have and [get] your proper housekeeping
done” (D5-22)
5 3 2 2 6 4 0 2 12 33
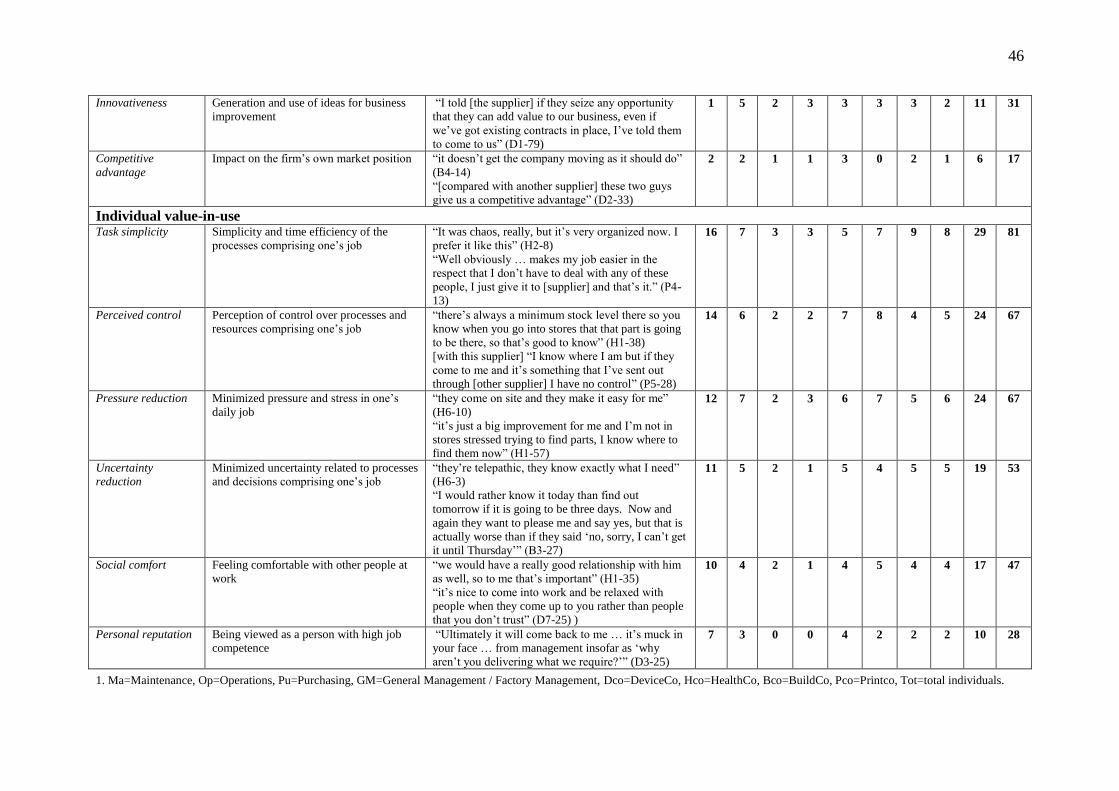
46
Innovativeness Generation and use of ideas for business
improvement
“I told [the supplier] if they seize any opportunity
that they can add value to our business, even if
we’ve got existing contracts in place, I’ve told them
to come to us” (D1-79)
1 5 2 3 3 3 3 2 11 31
Competitive
advantage
Impact on the firm’s own market position “it doesn’t get the company moving as it should do”
(B4-14)
“[compared with another supplier] these two guys
give us a competitive advantage” (D2-33)
2 2 1 1 3 0 2 1 6 17
Individual value-in-use Task simplicity Simplicity and time efficiency of the
processes comprising one’s job
“It was chaos, really, but it’s very organized now. I
prefer it like this” (H2-8)
“Well obviously … makes my job easier in the
respect that I don’t have to deal with any of these
people, I just give it to [supplier] and that’s it.” (P4-
13)
16 7 3 3 5 7 9 8 29 81
Perceived control Perception of control over processes and
resources comprising one’s job
“there’s always a minimum stock level there so you
know when you go into stores that that part is going
to be there, so that’s good to know” (H1-38)
[with this supplier] “I know where I am but if they
come to me and it’s something that I’ve sent out
through [other supplier] I have no control” (P5-28)
14 6 2 2 7 8 4 5 24 67
Pressure reduction Minimized pressure and stress in one’s
daily job
“they come on site and they make it easy for me”
(H6-10)
“it’s just a big improvement for me and I’m not in
stores stressed trying to find parts, I know where to
find them now” (H1-57)
12 7 2 3 6 7 5 6 24 67
Uncertainty
reduction
Minimized uncertainty related to processes
and decisions comprising one’s job
“they’re telepathic, they know exactly what I need”
(H6-3)
“I would rather know it today than find out
tomorrow if it is going to be three days. Now and
again they want to please me and say yes, but that is
actually worse than if they said ‘no, sorry, I can’t get
it until Thursday’” (B3-27)
11 5 2 1 5 4 5 5 19 53
Social comfort Feeling comfortable with other people at
work
“we would have a really good relationship with him
as well, so to me that’s important” (H1-35)
“it’s nice to come into work and be relaxed with
people when they come up to you rather than people
that you don’t trust” (D7-25) )
10 4 2 1 4 5 4 4 17 47
Personal reputation Being viewed as a person with high job
competence
“Ultimately it will come back to me … it’s muck in
your face … from management insofar as ‘why
aren’t you delivering what we require?’” (D3-25)
7 3 0 0 4 2 2 2 10 28
1. Ma=Maintenance, Op=Operations, Pu=Purchasing, GM=General Management / Factory Management, Dco=DeviceCo, Hco=HealthCo, Bco=BuildCo, Pco=Printco, Tot=total individuals.
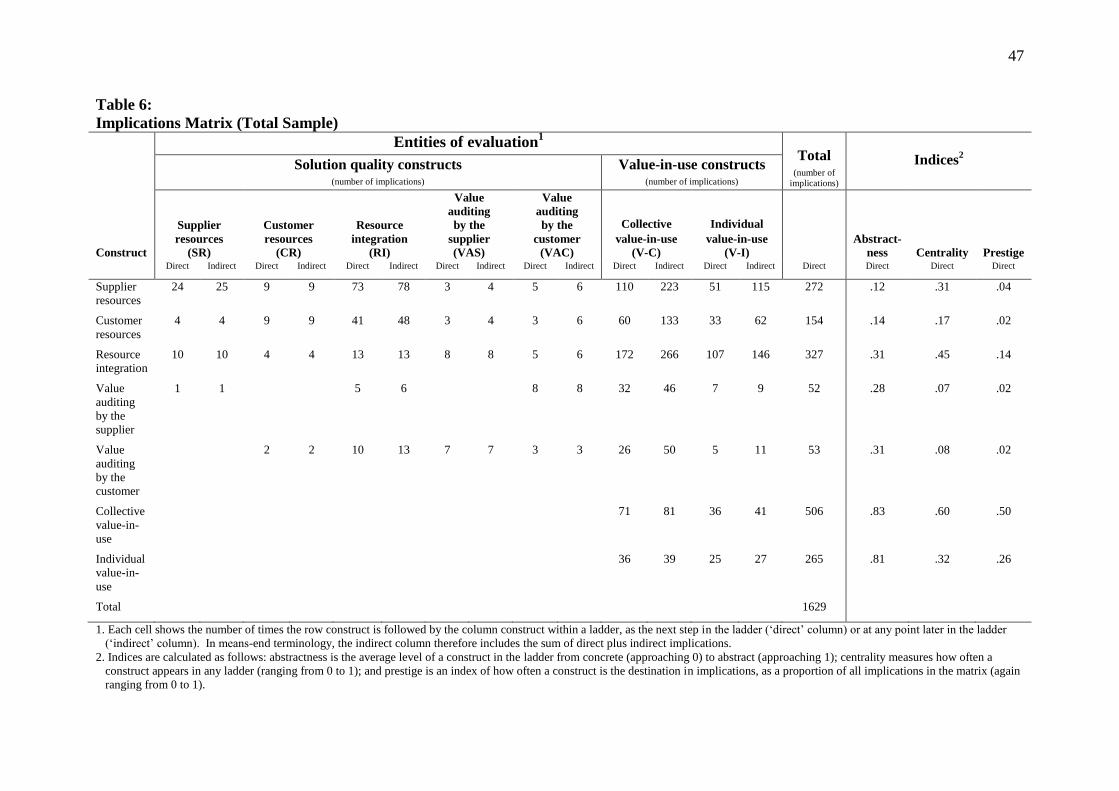
47
Table 6:
Implications Matrix (Total Sample)
Construct
Entities of evaluation1
Total (number of
implications)
Indices2
Solution quality constructs
(number of implications)
Value-in-use constructs (number of implications)
Supplier
resources
(SR)
Customer
resources
(CR)
Resource
integration
(RI)
Value
auditing
by the
supplier
(VAS)
Value
auditing
by the
customer
(VAC)
Collective
value-in-use
(V-C)
Individual
value-in-use
(V-I)
Abstract-
ness Centrality Prestige
Direct Indirect Direct Indirect Direct Indirect Direct Indirect Direct Indirect Direct Indirect Direct Indirect Direct Direct Direct Direct
Supplier
resources
24 25 9 9 73 78 3 4 5 6 110 223 51 115 272 .12 .31 .04
Customer
resources
4 4 9 9 41 48 3 4 3 6 60 133 33 62 154 .14 .17 .02
Resource
integration
10 10 4 4 13 13 8 8 5 6 172 266 107 146 327 .31 .45 .14
Value
auditing
by the
supplier
1 1 5 6 8 8 32 46 7 9 52 .28 .07 .02
Value
auditing
by the
customer
2 2 10 13 7 7 3 3 26 50 5 11 53 .31 .08 .02
Collective
value-in-
use
71 81 36 41 506 .83 .60 .50
Individual
value-in-
use
36 39 25 27 265 .81 .32 .26
Total 1629
1. Each cell shows the number of times the row construct is followed by the column construct within a ladder, as the next step in the ladder (‘direct’ column) or at any point later in the ladder
(‘indirect’ column). In means-end terminology, the indirect column therefore includes the sum of direct plus indirect implications.
2. Indices are calculated as follows: abstractness is the average level of a construct in the ladder from concrete (approaching 0) to abstract (approaching 1); centrality measures how often a
construct appears in any ladder (ranging from 0 to 1); and prestige is an index of how often a construct is the destination in implications, as a proportion of all implications in the matrix (again
ranging from 0 to 1).

48
Figure 1: Example of Repertory Grid and Laddering - Engineering Manager (D2), DeviceCo
Repertory Grid SUPPLIERS
# Construct pole
(1)
Supplier
1
Supplier
2
Supplier
3
Supplier
4
Supplier
5
Supplier
6
Contrast pole
(5)
1 Gives us purchasing power 4 2 2 3 1 2 No benefit to the prices we pay
2 Focused on our organization’s needs 5 2 1 2 2 3 Not much focus on our organization
3 Tries to be seamless with us 3 2 2 2/3 2 1 Just delivers
4 Embedded 3 2 2 3/4 2 2 Replaceable
5 Motivated to reduce our costs 4 2 2 3 1 2 Accepts the status quo
6 Monthly or quarterly reviews 5 2 2 3 1 2 No regular reviews
Each row (numbered 1 to 6 in this example) represents a construct by which the interviewee assesses solution suppliers. Each of six suppliers named by the customer is rated from 1 to 5 on each
construct, where 1 represents the “construct pole” (e.g., “Embedded”) and 5 represents the “contrast pole” (e.g., “Replaceable”).
Example Ladder COLLECTIVE VALUE-IN-USE -
COMPETITIVE ADVANTAGE:
“We’re driving our lead time down. Our lead
time three years ago was 16 days …it now takes
4 and a half days and within three years we
want it less than a day, so maintenance is
becoming a real competitive advantage for us.”
COLLECTIVE VALUE-IN-USE -
AVOIDING DOWNTIME:
“9 times out of 10 when a machine goes
down here…the machine is off for 2 or
3 days and that’s a real problem … The
key metric for me is up time on
machines …[supplier] absolutely do
that for us.”
RESOURCE INTEGRATION –
ASSET MANAGEMENT
EFFECTIVENESS :
“[Supplier] manage our suppliers on
our behalf…you have a supplier
who’s very proactively managing
your spares, and making sure you
have the right mix of spares.”
SUPPLIER RESOURCES –
ORGANIZATIONAL COMPETENCES:
“[Supplier] was one of the few companies we felt gave
us the most complete offering for what we were looking
for at the time…Doing a statistical analysis and saying
we need to hold more of these and less of these … They
were very proactive in coming back with suggestions as
well.”
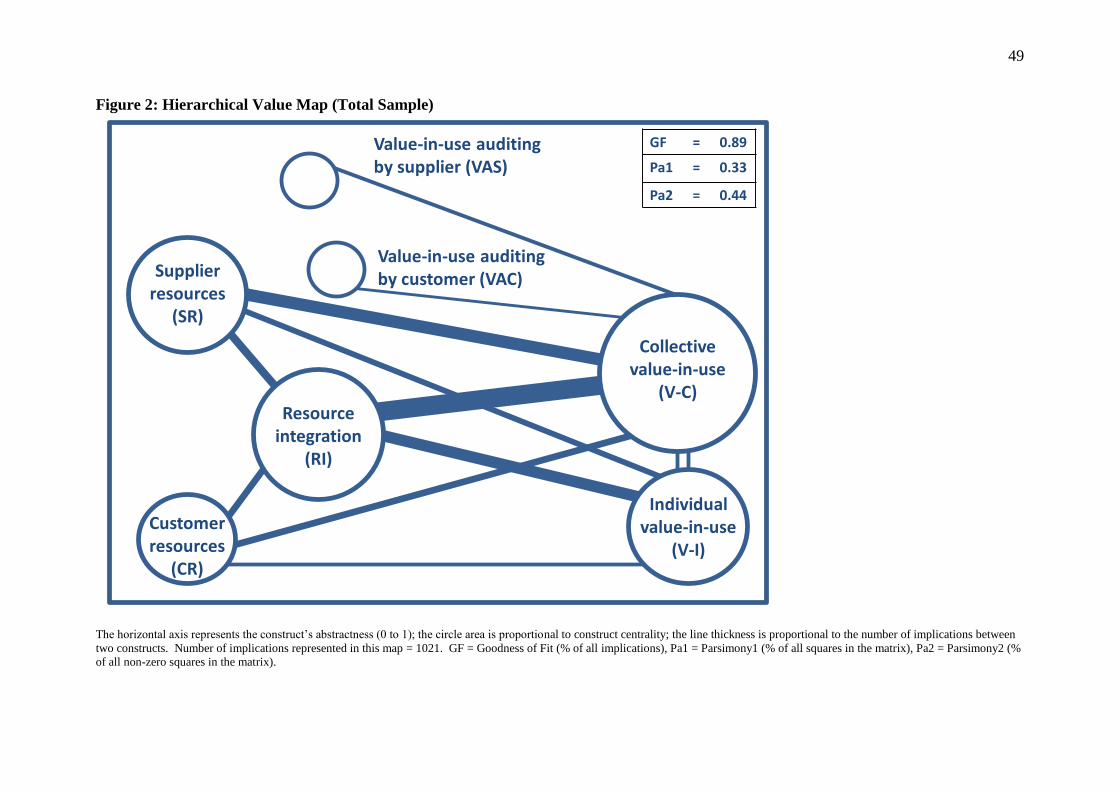
49
Figure 2: Hierarchical Value Map (Total Sample)
Value-in-use auditing by supplier (VAS)
GF = 0.89
Pa1 = 0.33
Pa2 = 0.44
Supplierresources
(SR)
Customerresources
(CR)
Resourceintegration
(RI)
Collective value-in-use
(V-C)
Individual value-in-use
(V-I)
Value-in-use auditing by customer (VAC)
The horizontal axis represents the construct’s abstractness (0 to 1); the circle area is proportional to construct centrality; the line thickness is proportional to the number of implications between
two constructs. Number of implications represented in this map = 1021. GF = Goodness of Fit (% of all implications), Pa1 = Parsimony1 (% of all squares in the matrix), Pa2 = Parsimony2 (%
of all non-zero squares in the matrix).
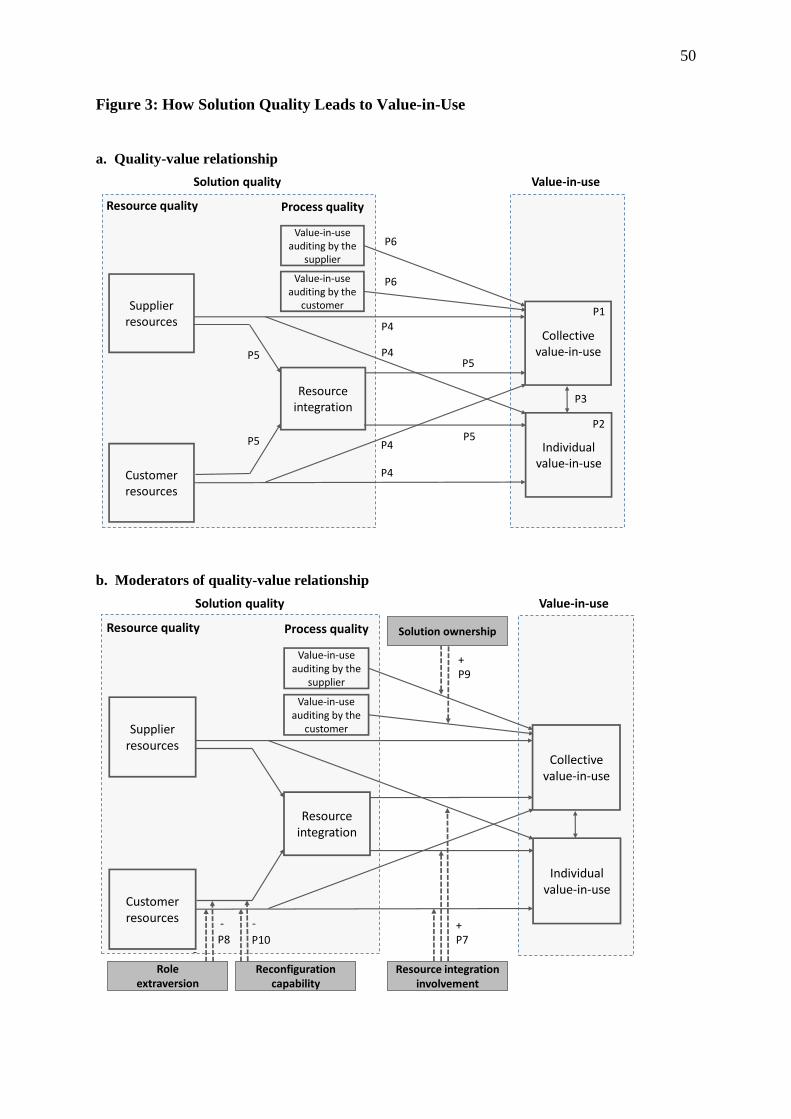
50
Figure 3: How Solution Quality Leads to Value-in-Use
a. Quality-value relationship
Supplierresources
Collectivevalue-in-use
Individualvalue-in-use
Resource integration
Value-in-use auditing by the
customer
Resource quality Process quality
Value-in-use
Value-in-use auditing by the
supplier
Solution quality
P3
P5
P2
P1
P5
P5
P6
P6
P5
P4
P4
P4
P4
Customerresources
b. Moderators of quality-value relationship
Supplierresources
Collectivevalue-in-use
Individualvalue-in-use
Resource integration
Value-in-use auditing by the
customer
Resource quality Process quality
Value-in-use
Value-in-use auditing by the
supplier
Solution quality
-
P10-
P8
-
Resource integration involvement
+P7
Reconfigurationcapability
Roleextraversion
Solution ownership
+P9
Customerresources
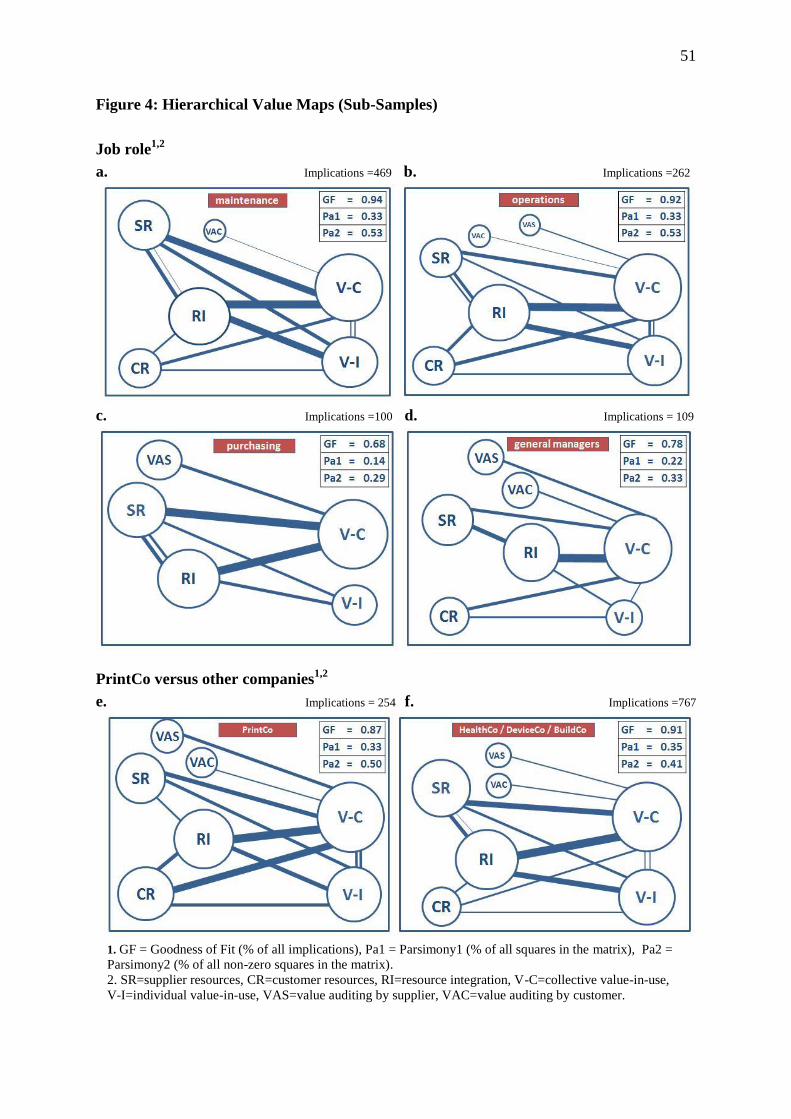
51
Figure 4: Hierarchical Value Maps (Sub-Samples)
Job role1,2
a. Implications =469 b. Implications =262
c. Implications =100 d. Implications = 109
PrintCo versus other companies1,2
e. Implications = 254 f. Implications =767
1. GF = Goodness of Fit (% of all implications), Pa1 = Parsimony1 (% of all squares in the matrix), Pa2 =
Parsimony2 (% of all non-zero squares in the matrix).
2. SR=supplier resources, CR=customer resources, RI=resource integration, V-C=collective value-in-use,
V-I=individual value-in-use, VAS=value auditing by supplier, VAC=value auditing by customer.