How are Researchers Using Data from State Longitudinal Systems? Sean W. Mulvenon, Ph.D. Professor of...
43
How are Researchers Using Data from State Longitudinal Systems? Sean W. Mulvenon, Ph.D. Professor of Educational Statistics Billingsley Chair for Educational Research and Policy Studies University of Arkansas
-
Upload
christian-benson -
Category
Documents
-
view
213 -
download
0
Transcript of How are Researchers Using Data from State Longitudinal Systems? Sean W. Mulvenon, Ph.D. Professor of...

How are Researchers Using Data from State Longitudinal Systems?
Sean W. Mulvenon, Ph.D.Professor of Educational StatisticsBillingsley Chair for Educational Research and Policy StudiesUniversity of Arkansas
Background
Ph.D. Arizona State (1993) Power estimation in repeated measures designs …
growth models
Professor of Educational Statistics, University of Arkansas
Spent 31 months as Senior Advisor Office of the Deputy Secretary U.S. Department of Education – Growth Models Internal report on growth models

“We need to use value-added analysis!” (Teacher, 2005) Why? What are value-added analyses? What type of data do you have? Does everyone agree?
What are you trying to do?

Review of Literature using Longitudinal Data Systems Interesting, but problematic in most cases
Great ideas! Problematic due to lack of understanding of the actual
longitudinal data structure What can you do with the data?
Incongruence in reporting and models Analysis and models correct, but too complicated for
extension to professional development for teachers
[Note: 50% of values from studies that are recomputed are shown to be incorrect in multiple regression class]

Use of Longitudinal Data Systems for Research What are you trying to do?
Identify research questions and objectivesDevelop appropriate data setsSelect the appropriate analyses
Goals of Presentation
What are Longitudinal Data Systems (LDS) Implications for LDS with School Improvement
and Policy associated with NCLB Evaluate Use of Growth Models with LDS
Strengths Weaknesses Limitations Challenges
Expand research capacity to use growth models in school

Longitudinal Data Systems
Issues that must be addressed:MatchingMergingFunctionality of data systemsData quality
Merging Data Sets What data are you merging? For what
purpose? What do you expect to happen?
Traditionally, data are merged on one variableAll matches considered successful matchesDifferent models
Probabilistic neural net (probabilities) “Bashing” (Just merge) Multiple merging variables SQL joins

Data Merging What to expect? (Fantasyland Model)
A state system has 1,300,000 students K – 12 for two consecutive years and approximately 100,000 students per grade.
Growth Model for Grades 3 – 8 A total of six grades in growth model or 600,000 possible
students? No! Grade 3 new in 2nd year Grade 8 exited from previous year
Only 500,000 students expected in growth model! Can create confusion in system, i.e., 99.1% match rate,
but only 495,500 students in model from 1.3 million
Data Merging for Growth Models
Data Merging should go beyond match rate to consider horizontal and vertical functionality of merged data sets!Horizontally functional data setsVertically functional data setsWhat the ….?
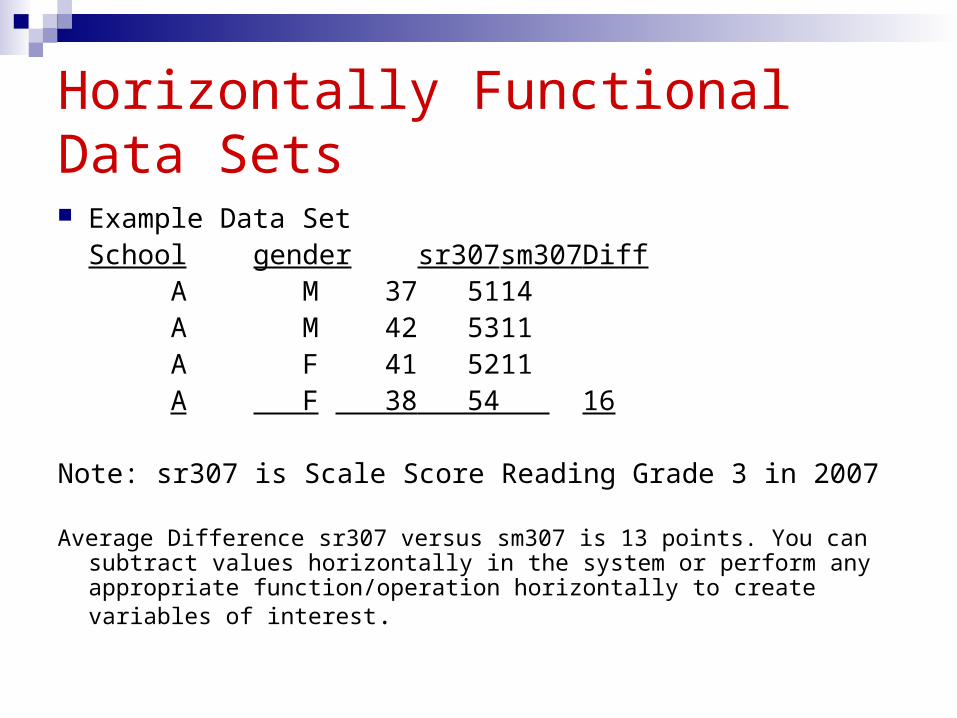
Horizontally Functional Data Sets
Example Data SetSchool gender sr307 sm307Diff A M 37 51 14 A M 42 53 11 A F 41 52 11 A F 38 54 16
Note: sr307 is Scale Score Reading Grade 3 in 2007
Average Difference sr307 versus sm307 is 13 points. You can subtract values horizontally in the system or perform any appropriate function/operation horizontally to create variables of interest.

Vertically Functional Data Sets Example Data Set School gender sr307 sm307
A M 37 51 A M 42 53 A F 41 52 A F 38 54
I can sum the columns to produce average performance for grade 3 Reading and Math of 39.5 and 52.5, respectively.
You can sum or operate on the columns vertically, i.e. a vertically functional data set!
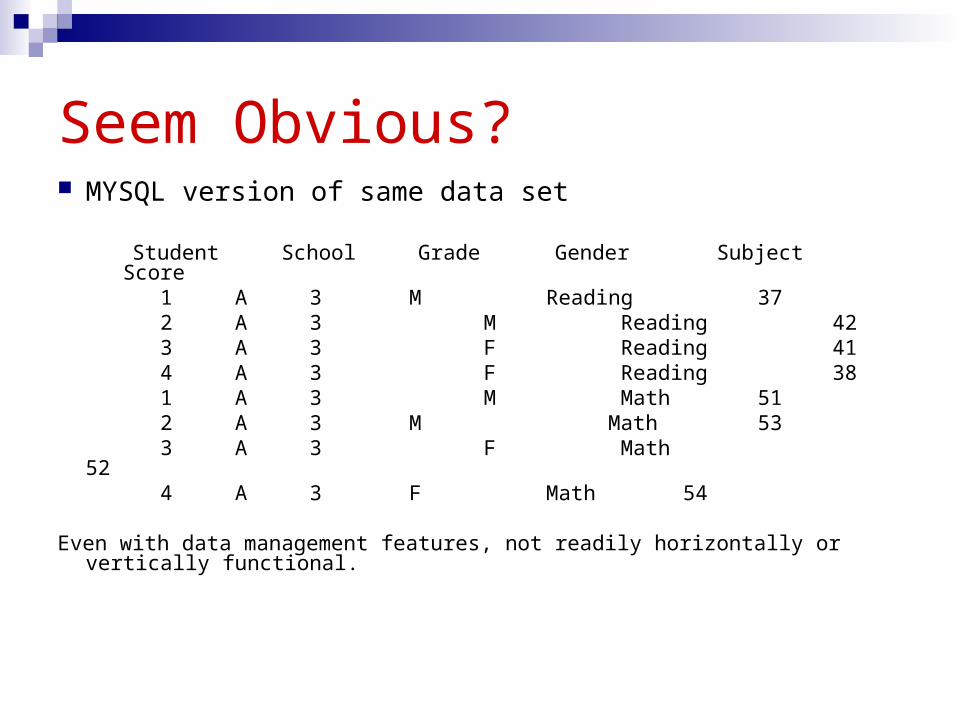
Seem Obvious? MYSQL version of same data set
Student School Grade Gender Subject Score 1 A 3 M Reading 37
2 A 3 M Reading 42 3 A 3 F Reading 41 4 A 3 F Reading 38 1 A 3 M Math 51 2 A 3 M Math 53 3 A 3 F Math 52 4 A 3 F Math 54
Even with data management features, not readily horizontally or vertically functional.

Assessing Data Quality
You must cross-validate data with other data sources 30,000 3rd and 4th Grade Students Merged
2006 100% of students had an assigned FRLP status 2007 100% of students had an assigned FRLP status
Cross-Tabulation revealed 12% of these students changed their FRLP status
This is simply too volatile for FRLP Expected half that volatility Typically data quality would be reported as high However, clearly there is reporting problem with this FRLP
data

Implications of Data Quality Example
Which status do you assign in growth model? Students’ 2006 FRLP status Students’ 2007 FRLP status
What about the unmatched students?
What patterns are evident that impacted data quality?
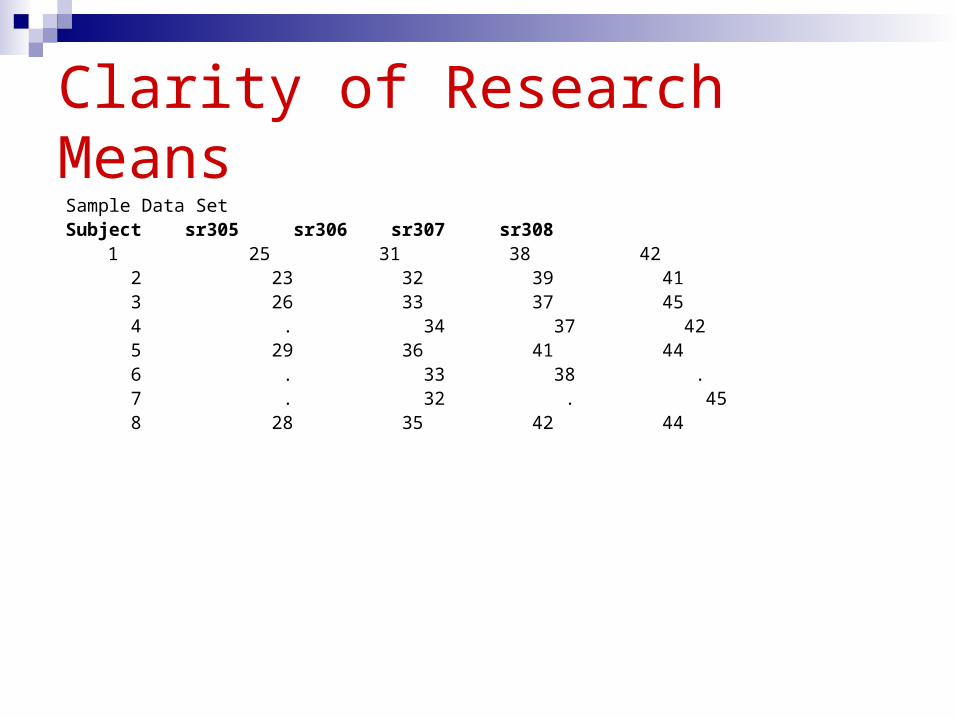
Clarity of Research MeansSample Data SetSubject sr305 sr306 sr307 sr308
1 25 31 38 42 2 23 32 39 41 3 26 33 37 45 4 . 34 37 42 5 29 36 41 44 6 . 33 38 . 7 . 32 . 45 8 28 35 42 44

Most researchers will run repeated measures models. The results are predicated on model 2, not model 1 means:
Model 1: Reported Mean1 = 26.20 Mean2 = 33.25 Mean3 = 38.86 Mean4 = 43.29
Model 2: Employed Mean1 = 26.20 Mean2 = 33.40 Mean3 = 39.40 Mean4 = 43.20
75 80
75 80
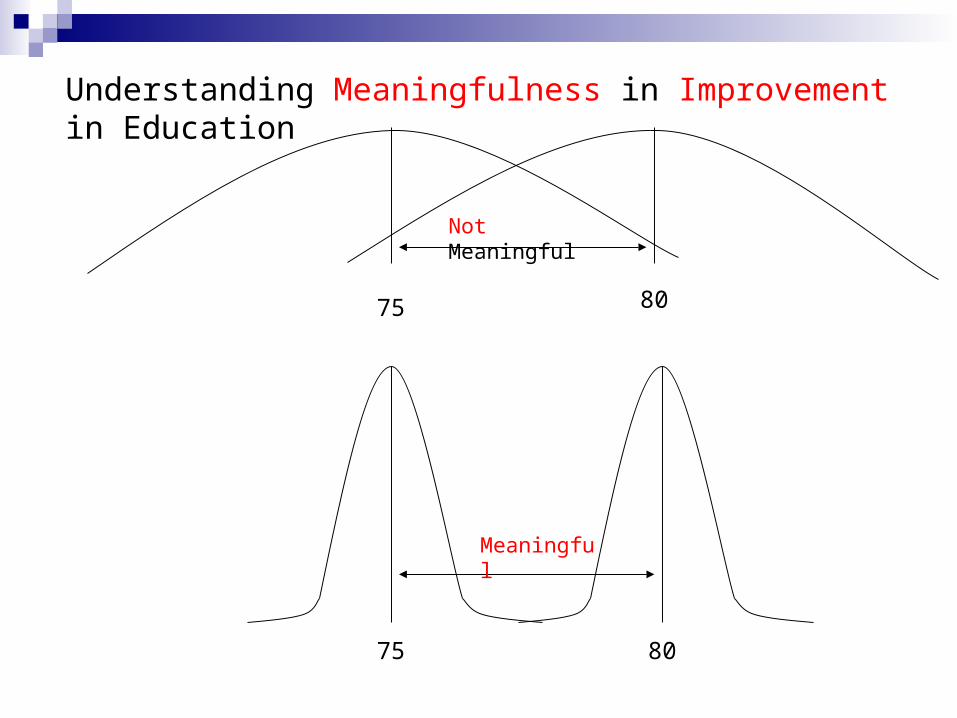
Understanding Meaningfulness in Improvement in Education
Not Meaningful
Meaningful
Data Quality
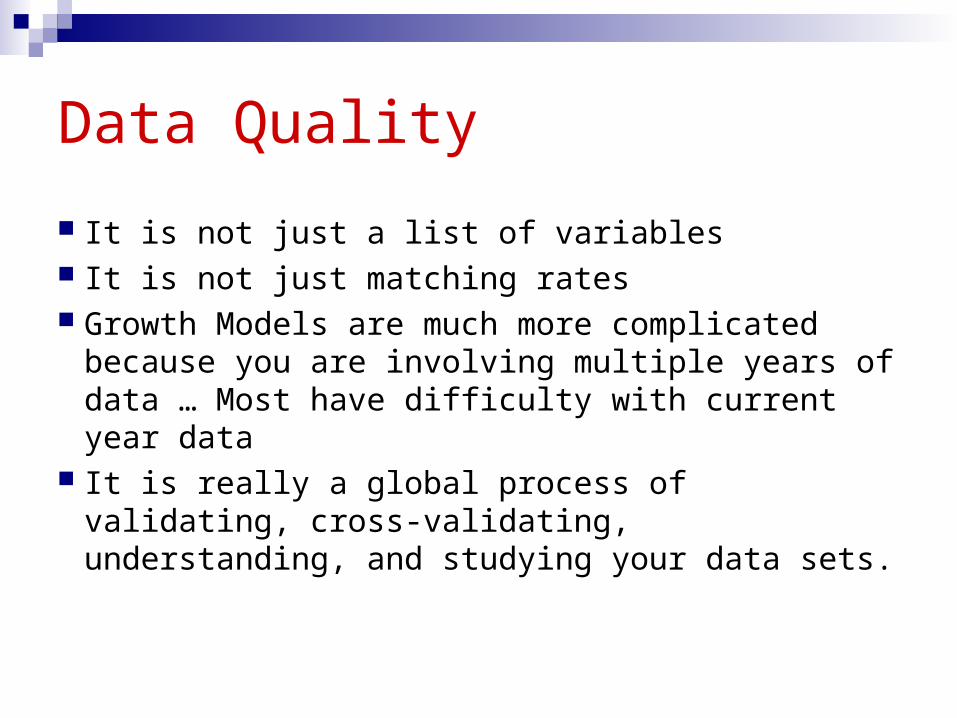
It is not just a list of variables It is not just matching rates Growth Models are much more complicated
because you are involving multiple years of data … Most have difficulty with current year data
It is really a global process of validating, cross-validating, understanding, and studying your data sets.

Growth Modeling is a Field in Statistics Difference Scores Trend analyses Randomized Block Designs
Covariance models Univariate models Multivariate models
Hierarchical Linear Models Value-Added Models
Latent Growth Curve Models Structural Equation Models
Regression/Projection Models
All potentially appropriate

NCLB Methods for Growth Models
Equipercentile Models Growth Trajectory Models

Year 1 Year 2
30th Percentile Scale Score 600
70th Percentile Scale Score 650
30th Percentile Scale Score 640
70th Percentile Scale Score 670
Expected Gain = 20 Points
Expected Gain = 40 Points
Actual Gain = 22 Points (PGI = 1.1)
Actual Gain = 36 Points (PGI = .90
Performance Growth Index (PGI)
Actual Growth Expected Growth
PGI =
22 20
1.1=
Value-Added Gain!

Value Added
*Red Lines represent predicted student improvement
*Blue Lines represent actual student improvement
*Value-Added is the increases over what was predicted for student performance
Representing “Value-Added” Increases in Student Performance
Value Added
Student A
Student B
Actual
Actual
Predicted
Predicted

Growth Models Research: Develop Goals Identify student improvement
District? School? Classroom*?
Predict Performance Student?
Identify curriculum areas in need of improvement Grade? Class?
Professional Development Target areas to provide instructional support
*Note: Classroom is “Code” for teacher level!

Growth Models Research: Evaluate test data Can we actually measure student achievement
or change in student achievement? Student level
Linking data … accuracy Are the tests valid? Vertically equated? Vertically articulated? Multi- versus Uni-Dimensional
Correlation versus redundancy? Issue of content strands
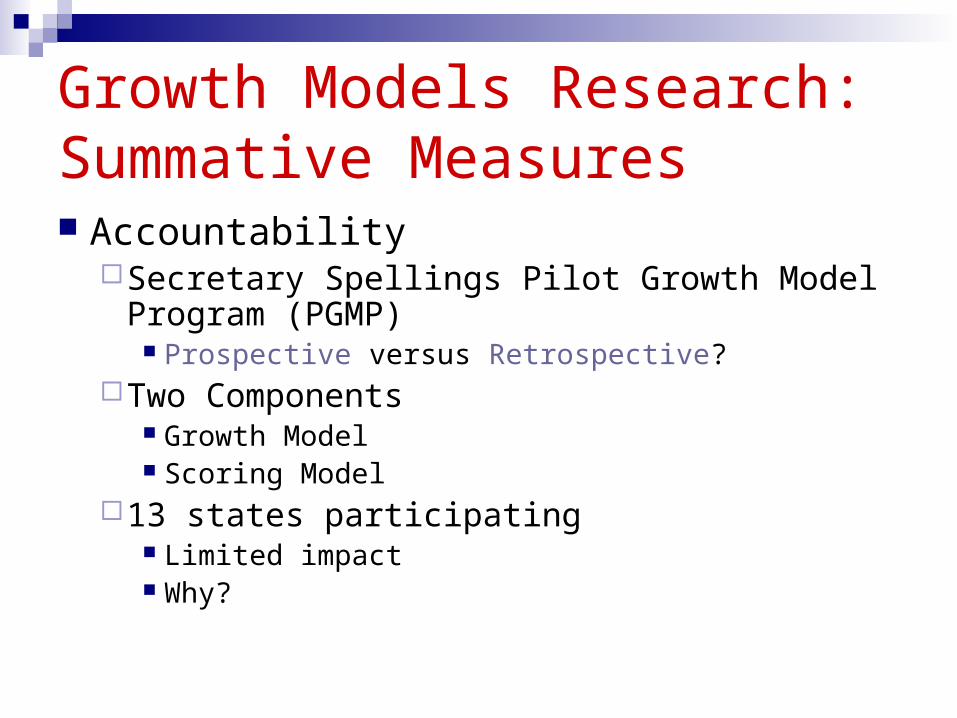
Growth Models Research: Summative Measures Accountability
Secretary Spellings Pilot Growth Model Program (PGMP)
Prospective versus Retrospective?Two Components
Growth Model Scoring Model
13 states participating Limited impact Why?
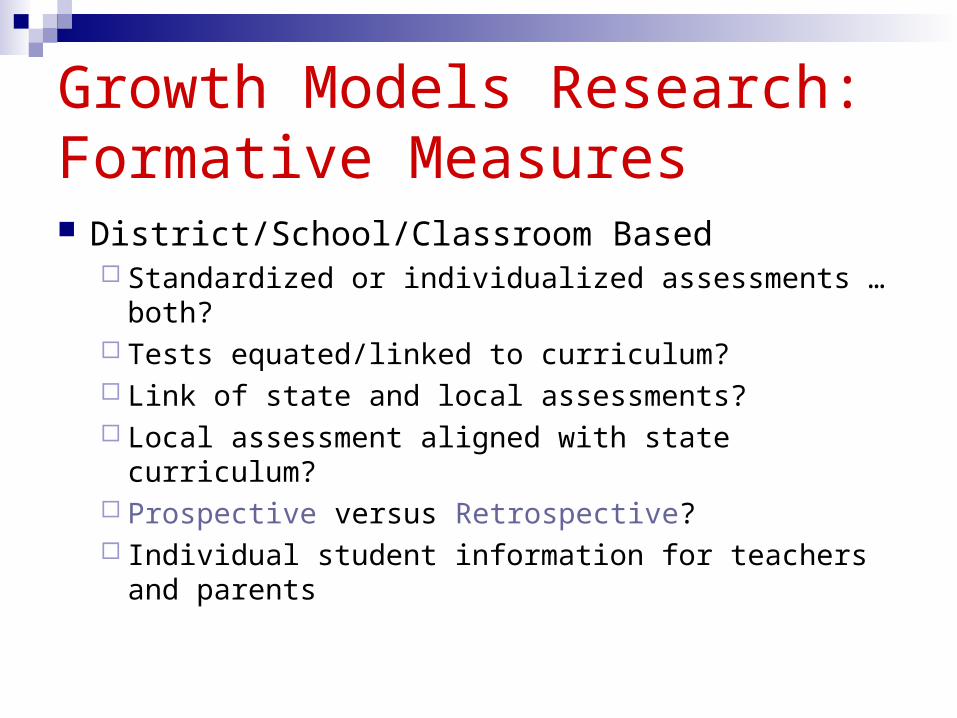
Growth Models Research:Formative Measures District/School/Classroom Based
Standardized or individualized assessments … both? Tests equated/linked to curriculum? Link of state and local assessments? Local assessment aligned with state curriculum? Prospective versus Retrospective? Individual student information for teachers and
parents

Growth Models Research: Methodology What is Appropriate?
Student matching? Across all groups Change in status (FRLP)
Covariance models? Use of demographics in models
Imputation procedures? Missing data
Confidence intervals How and where to apply?
What are the decision rules? What constitutes adequate growth?
Use of results? Ability of educational stakeholders to understand the results

Growth Models Research: Outcomes Professional development
Using results in constructive professional development
Reporting resultsPersonnel reports (Private)Parent reports (Private)School, district or state level reports (Public)

Example of Research QuestionExpected Scale Score Growth for Students at the
Proficiency Cut Score -- Arkansas
Grade Progression Gain
Literacy Mathematics
3 to 4 59 points 59 points
4 to 5 45 points 45 points
5 to 6 37 points 37 points
6 to 7 32 points 32 points
7 to 8 27 points 27 points
3 to 8 200 points 200 points

Arkansas Scale Scores Grades 3 - 8: Non-Linear and Autoregressive
Proficiency Expecations for Arkansas Benchmark
450
500
550
600
650
700
750
3 4 5 6 7 8
Grade
Scale
Sco
re
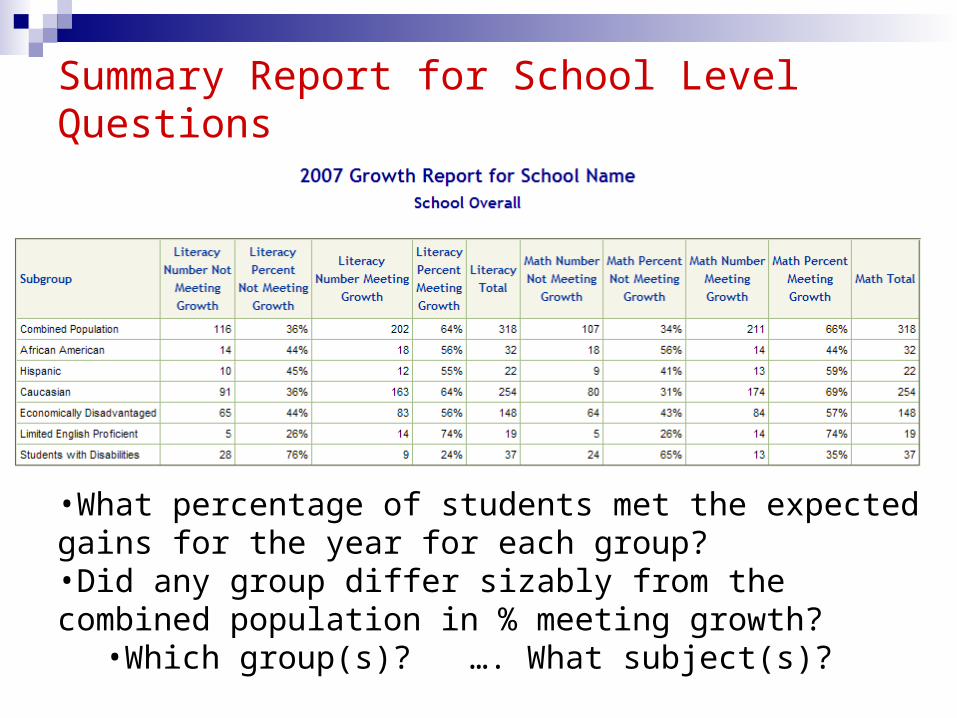
Summary Report for School Level Questions
•What percentage of students met the expected gains for the year for each group?•Did any group differ sizably from the combined population in % meeting growth?
•Which group(s)? …. What subject(s)?


Researchers are Summarizing Growth Information
Evaluating why students did not make expected progress Evaluating why students did make expected progress Evaluating the differences for these two groups of students Identifying if any systematic changes to instruction,
materials, pacing, order of presentation, etc. impact growth of students As a whole or for certain sub groups
Identifying if any individual characteristics or situations negatively impacted growth Investigating possible curriculum modifications that may
help specific students achieve as expected?

Key Research Questions Being Investigated: Classroom and Student Level
Which students did not meet expected growth? Is there a pattern among the students who did not meet growth? Which students did not meet the proficiency threshold (lost
ground this year)? Is there a pattern? What do you know about the students’ performance in the
subject that may inform further instructional action or intervention?
What additional information do you need to guide your instructional decisions?
What resources do you have to gather the additional information?

An Example … District Growth Model Analysis Outcomes
Professional Development Teacher programs and reviews Computerized data for teachers and
principals Student assessments of performance Early intervention strategies for
studentsPublic reporting of school
performance Making “real” educational
improvements Outpacing national trends
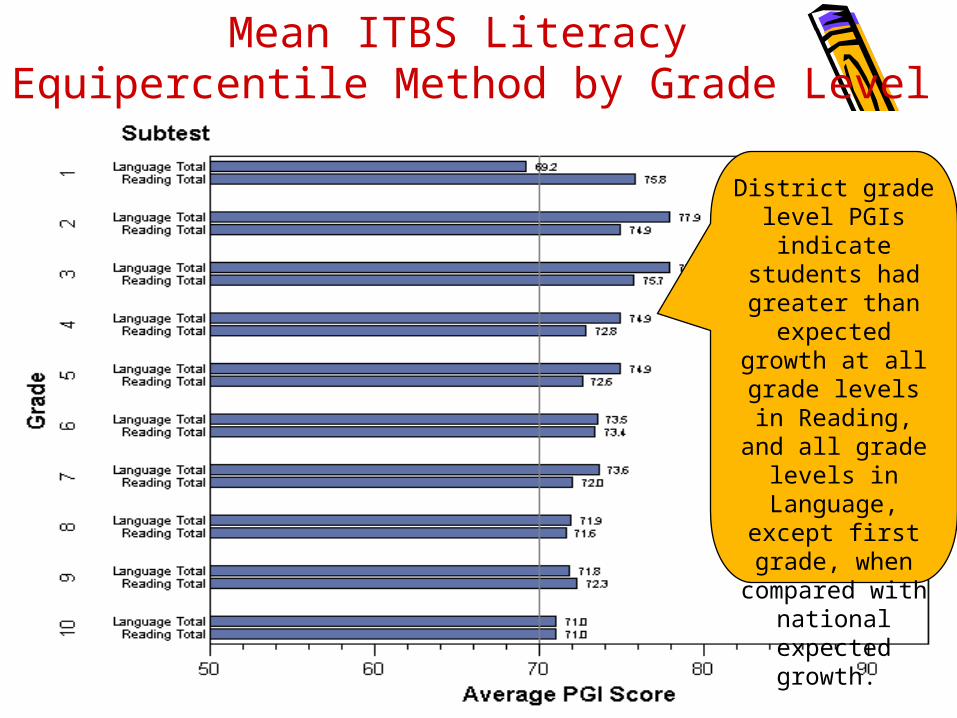
Mean ITBS Literacy Equipercentile Method by Grade Level
District grade level PGIs indicate students had greater than
expected growth at all grade levels in Reading, and all grade levels in
Language, except first grade, when compared with
national expected growth.
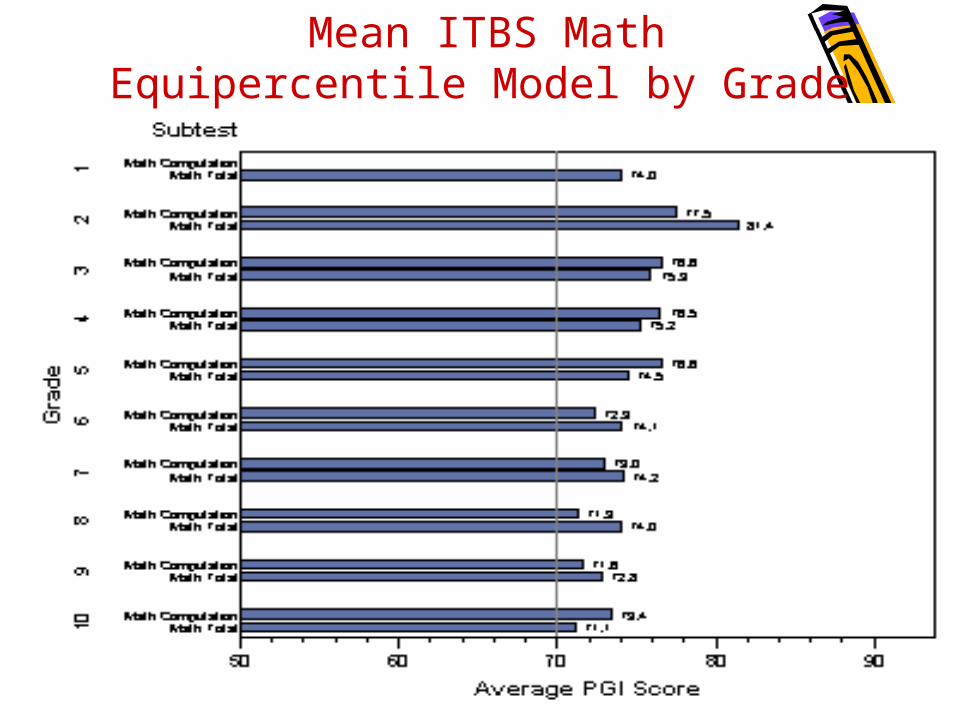
Mean ITBS MathEquipercentile Model by Grade

Teacher Classroom Performance: Identifying areas for professional development
60
62
64
66
68
70
72
74
76
78
Teacher 1 Teacher 2 Teacher 3
2004
2005
2006
2007

Comparison of School Performance on ITBS NRT: National Percentile Rank vs PGI Score
55
66
49
61
52
6870 6971 6970 70
0
10
20
30
40
50
60
70
80
90
100
MiddleSchool 1 MiddleSchool 2
AnalysisAlthough one school outperforms the other according to national percentile ranking, the lower performing school is making greater gains with their students. The higher performing school should look closely at their 7th graders to determine why they are not making expected growth across all subject areas
ITBS PGI ITBS PGI

Closing Comments:Impact of Growth Models
Represent the best method to comprehensively evaluate student achievement Link to curriculum effectiveness Link to professional development
Limited Expertise in Education About 50 Ph.D.’s annually in this field
Demonstrated need to expand this field Understanding the quality and limitations of your data set
is paramount!

Closing Comments:Growth Models Work in Education Growth models definitely work in education!!!! No such thing as “the” growth model
Integrate with specific needs and goals
Incorporate with professional development programs
Develop internal capacity/critical mass to help with your growth models


![The PLA Army’s Struggle for Identityindianstrategicknowledgeonline.com/web/6[1].pdf · The PLA Army’s Struggle for Identity James C. Mulvenon B efore the atrocities of September](https://static.fdocuments.us/doc/165x107/5e81dfd144d22a52f103d596/the-pla-armyas-struggle-for-identityindianstra-1pdf-the-pla-armyas-struggle.jpg)