How are galaxies influenced by their environment?
48
How are galaxies influenced by their environment? rachel somerville STScI Predictions & insights from hierarchical models with thanks to Eric Bell the COMBO/GEMS team Risa Wechsler Andrey Kravtsov Sandy Faber
description
Predictions & insights from hierarchical models. How are galaxies influenced by their environment?. rachel somerville STScI. with thanks to Eric Bell the COMBO/GEMS team Risa Wechsler Andrey Kravtsov Sandy Faber. what are observations telling us?. - PowerPoint PPT Presentation
Transcript of How are galaxies influenced by their environment?
How are galaxies influenced by their
environment?
rachel somervilleSTScI
Predictions & insights from hierarchical models
with thanks toEric Bell the COMBO/GEMS teamRisa WechslerAndrey KravtsovSandy Faber
what are observations telling us?
old wisdom: familiar correlations between galaxy observables
color-morphologycolor-magnitudeluminosity-metallicity
new wisdom: correlation between intrinsic/physical properties , e.g.
stellar mass and star formation ratestellar mass & metallicity
new wisdom: many fundamental galaxy properties have bimodal distributions, divided by a critical stellar mass

Baldry et al. 2003co
lor
luminosity
SDSS: color and magnitude
Blanton et al. 2003
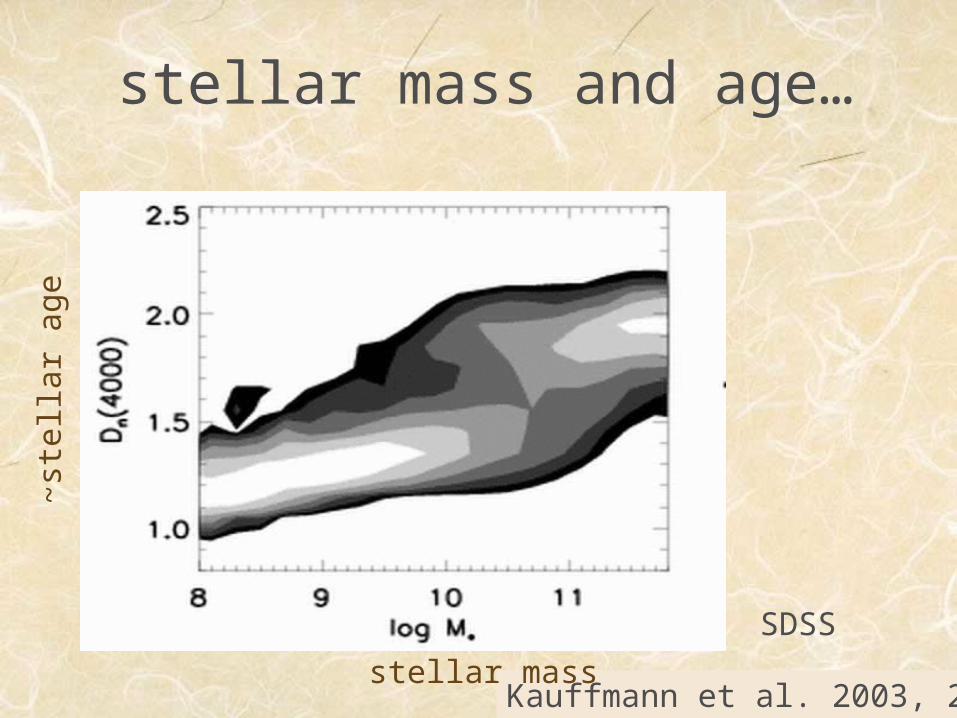
stellar mass and age…~s
tell
ar a
ge
Kauffmann et al. 2003, 2004
SDSS
stellar mass
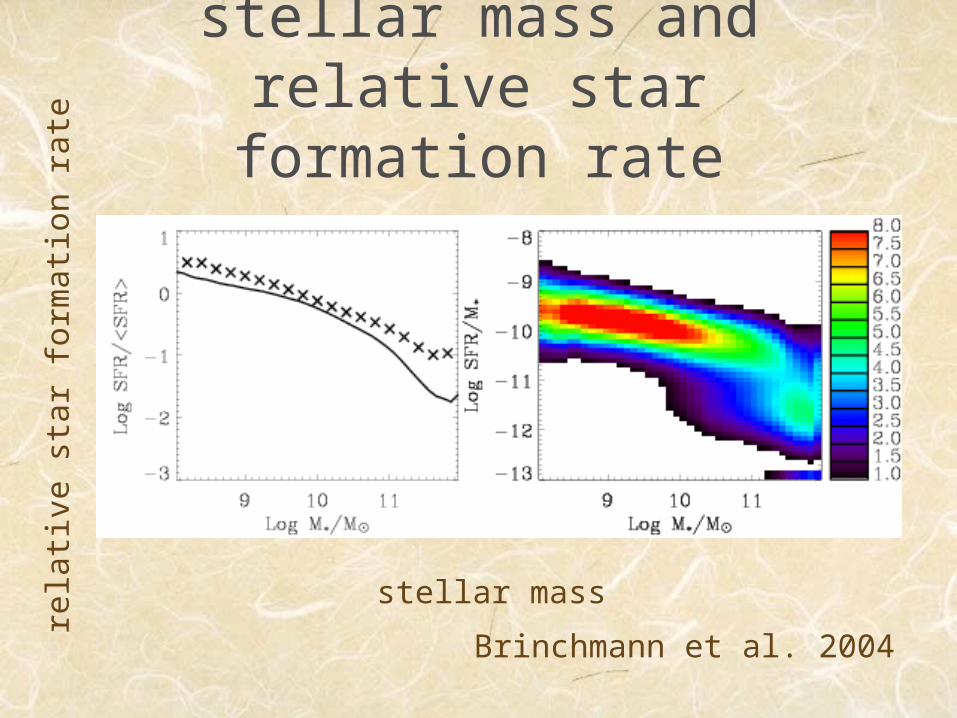
stellar mass and relative star formation rate
rela
tive
sta
r fo
rmat
ion
rate
stellar mass
Brinchmann et al. 2004
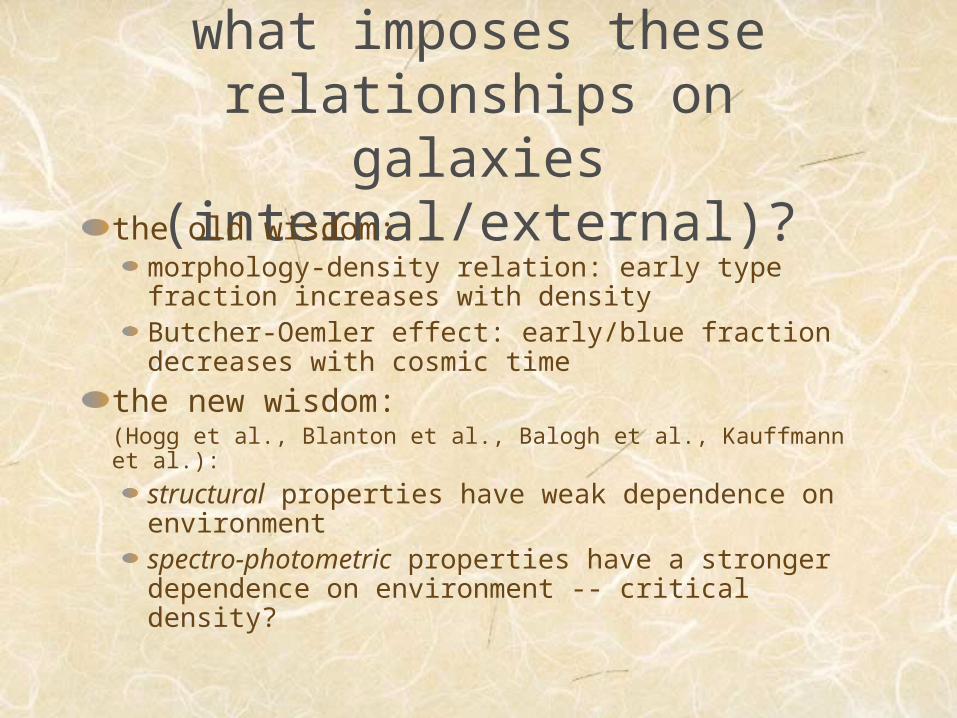
what imposes these relationships on galaxies
(internal/external)?the old wisdom:
morphology-density relation: early type fraction increases with densityButcher-Oemler effect: early/blue fraction decreases with cosmic time
the new wisdom:(Hogg et al., Blanton et al., Balogh et al., Kauffmann et al.):
structural properties have weak dependence on environment spectro-photometric properties have a stronger dependence on environment -- critical density?
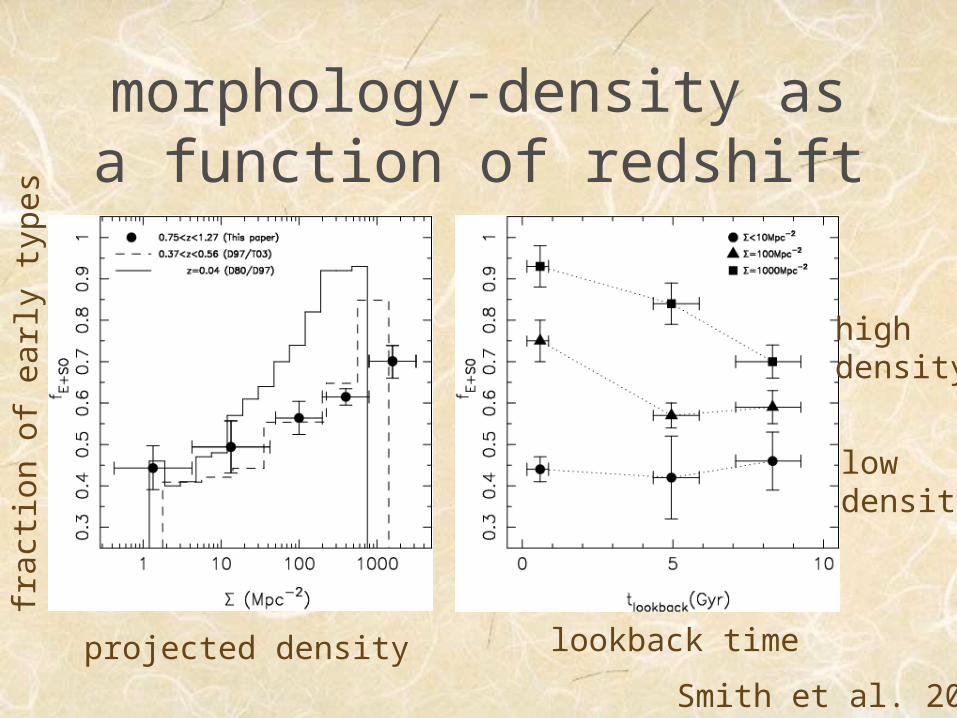
morphology-density as a function of redshift
Smith et al. 2004
low density
high density
frac
tion
of
earl
y ty
pes
projected density lookback time
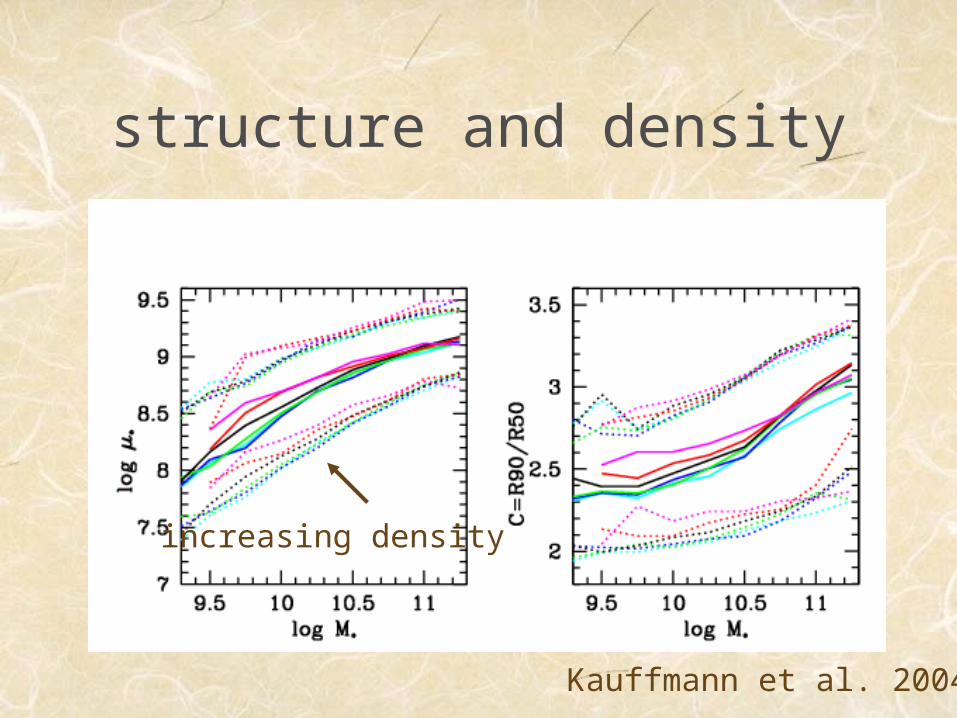
structure and density
Kauffmann et al. 2004
increasing density
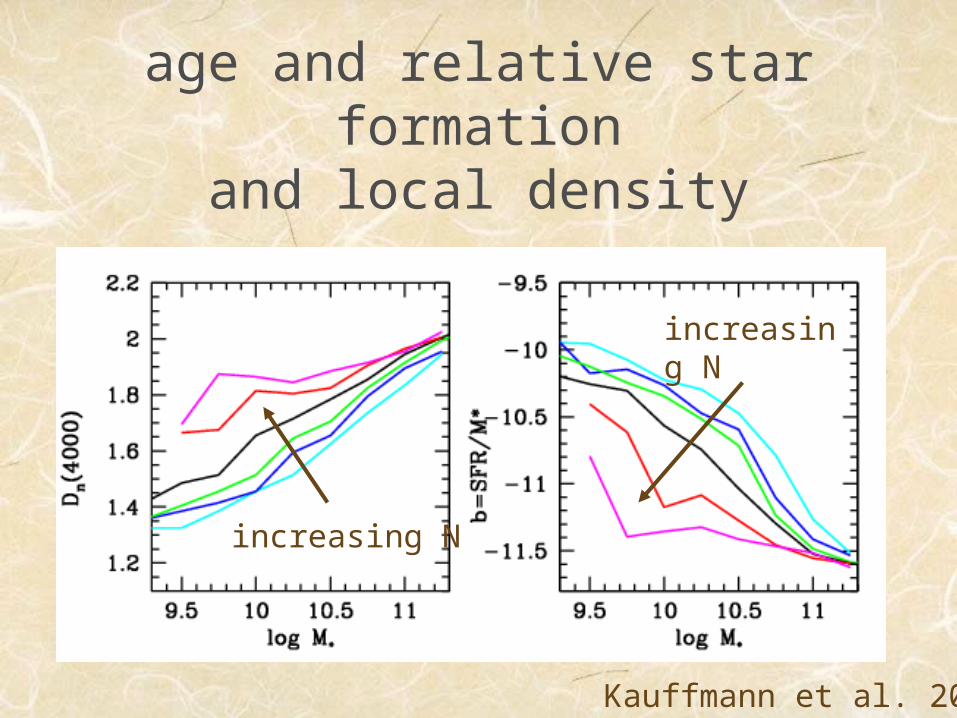
age and relative star formation
and local density
increasing N
Kauffmann et al. 2004
increasing N
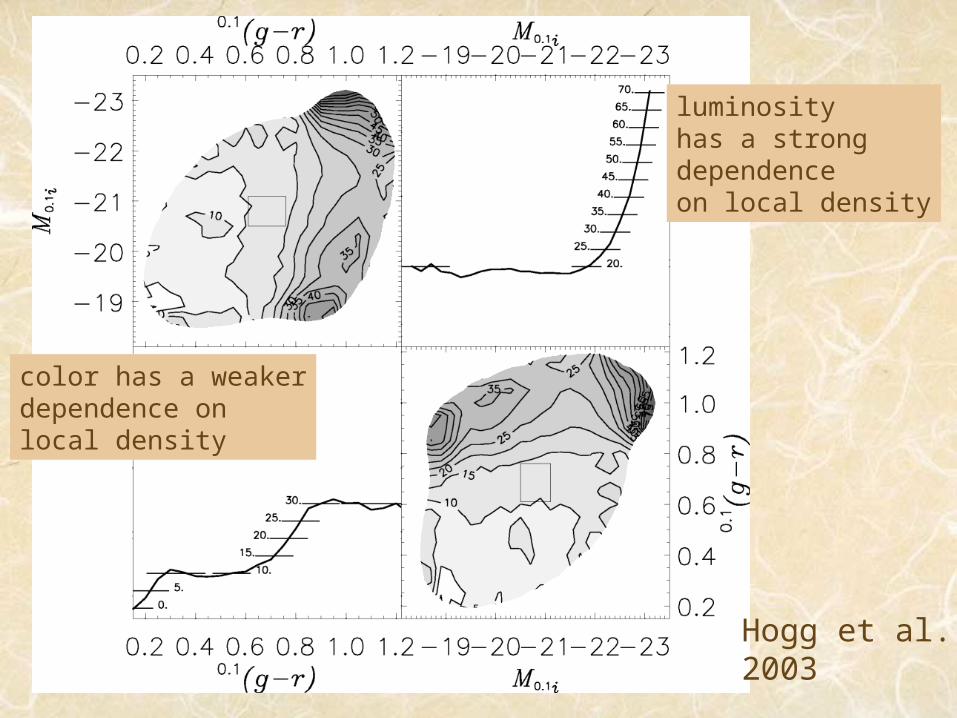
Hogg et al. 2003
luminosity has a strongdependenceon local density
color has a weakerdependence on local density
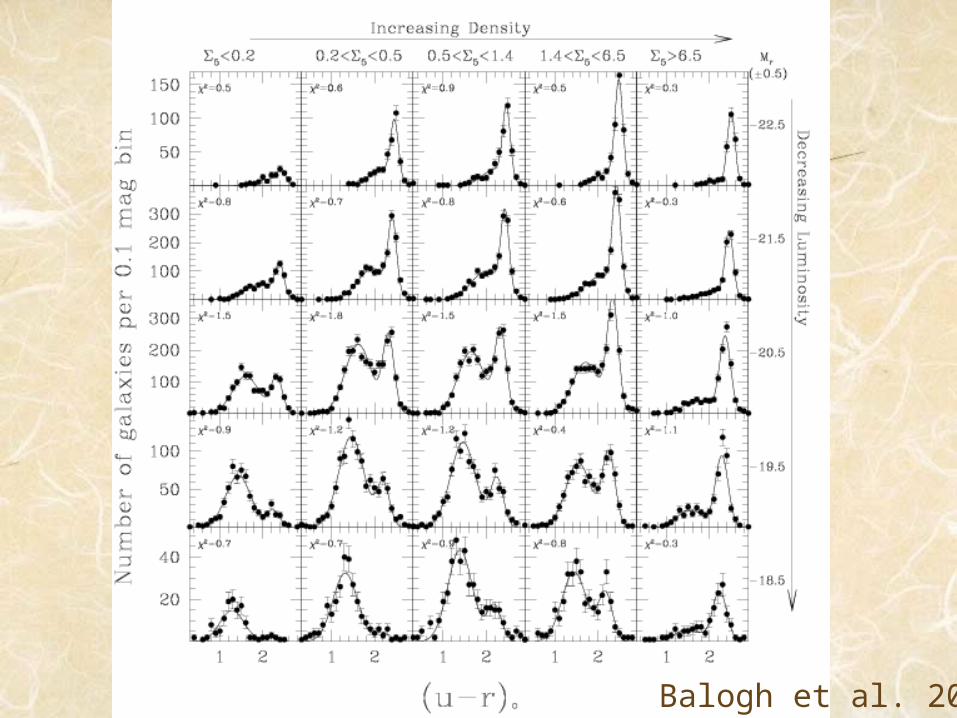
Balogh et al. 2004
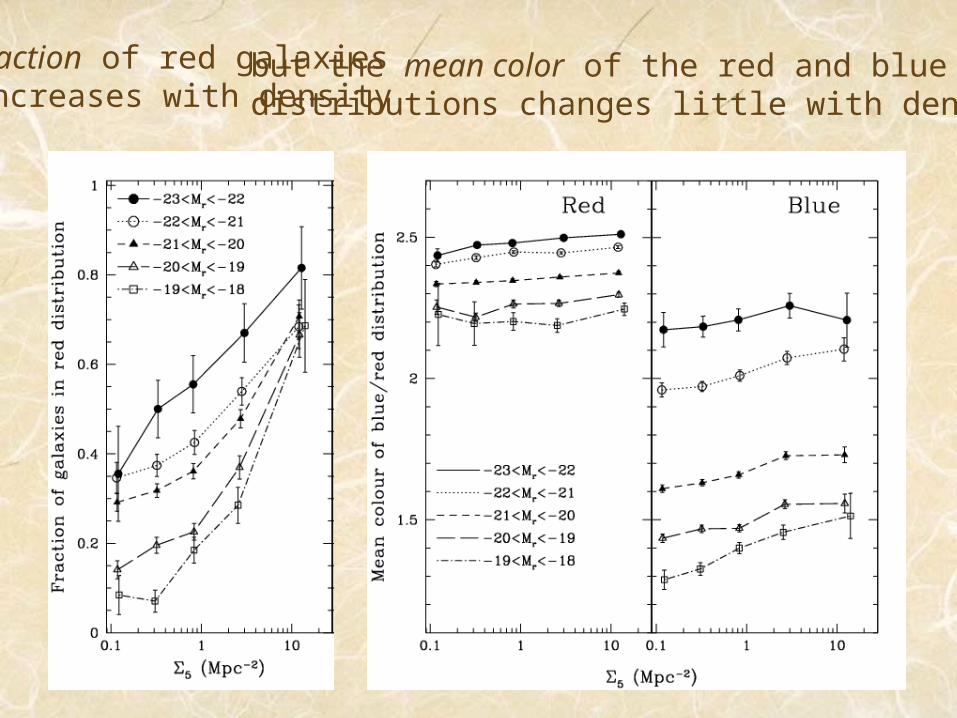
fraction of red galaxiesincreases with density
but the mean color of the red and bluedistributions changes little with density
colo
r
magnitude
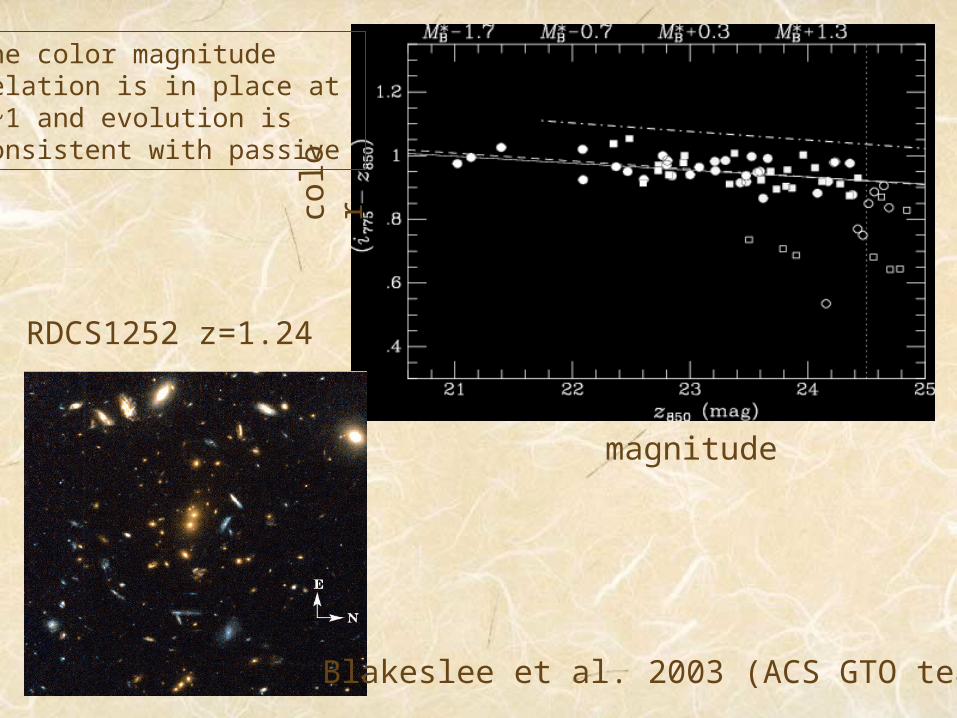
Blakeslee et al. 2003 (ACS GTO team)
RDCS1252 z=1.24
the color magnituderelation is in place at z~1 and evolution is consistent with passive
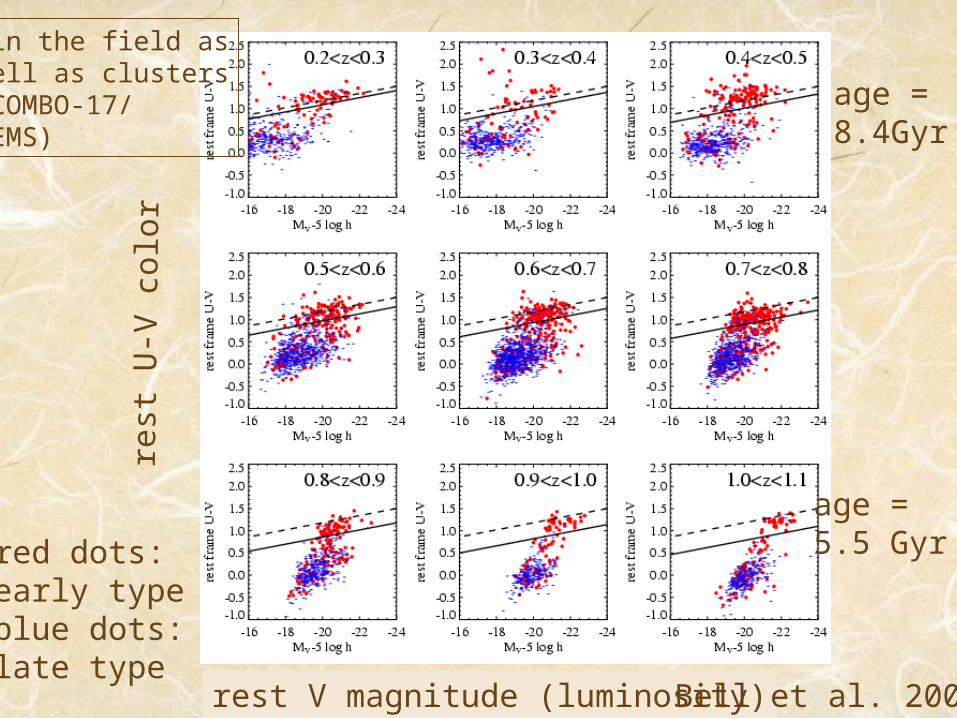
red dots:early typeblue dots:late type
rest
U-V
col
or
rest V magnitude (luminosity)
age =8.4Gyr
age = 5.5 Gyr
Bell et al. 2003
…in the field aswell as clusters(COMBO-17/GEMS)
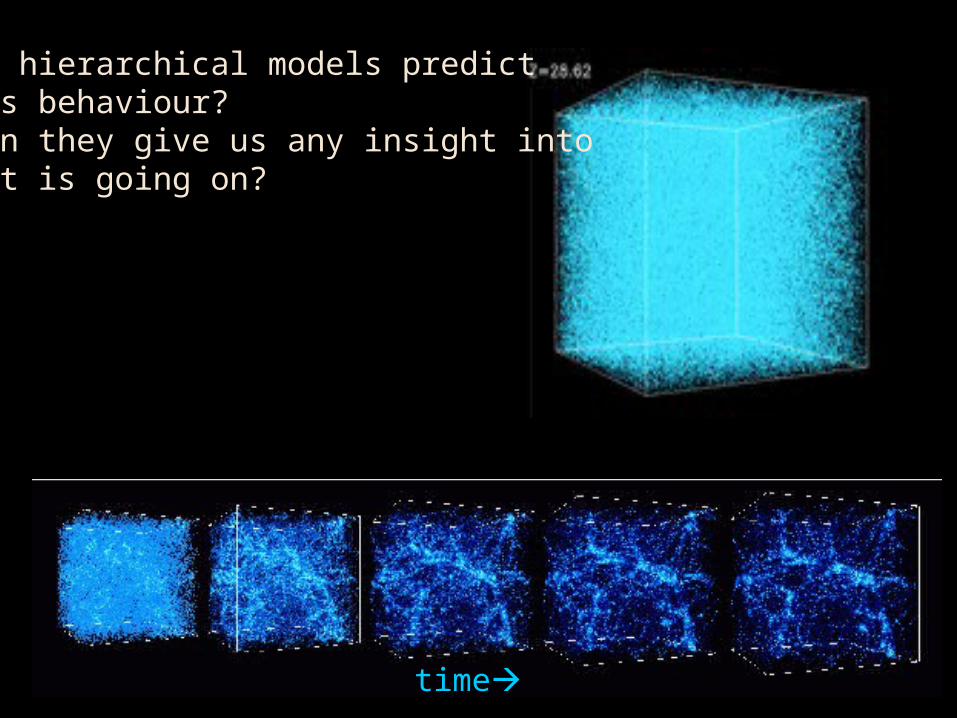
time
•do hierarchical models predictthis behaviour?•can they give us any insight intowhat is going on?
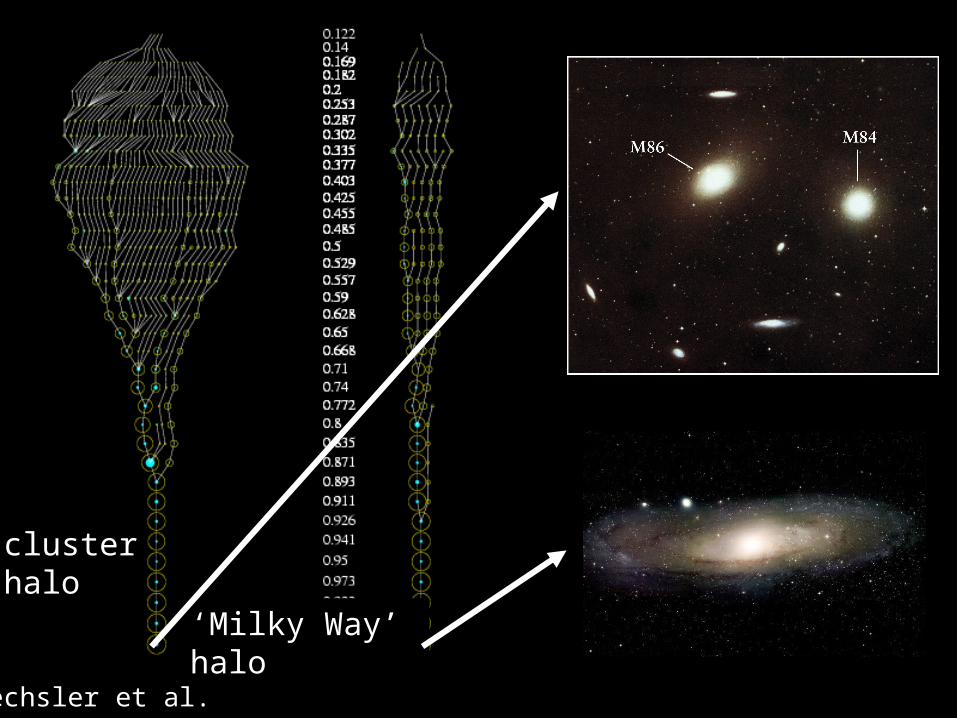
Wechsler et al.
cluster halo
‘Milky Way’ halo
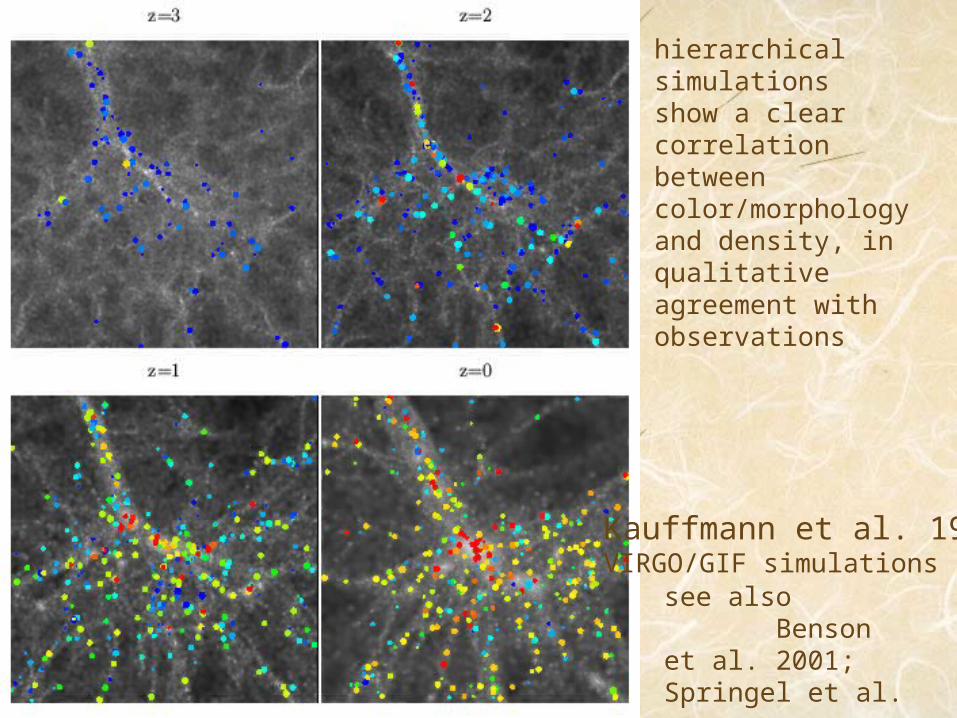
Kauffmann et al. 1999VIRGO/GIF simulationssee also Benson et al. 2001;
Springel et al. 2001
hierarchical simulationsshow a clear correlationbetween color/morphologyand density, in qualitativeagreement with observations
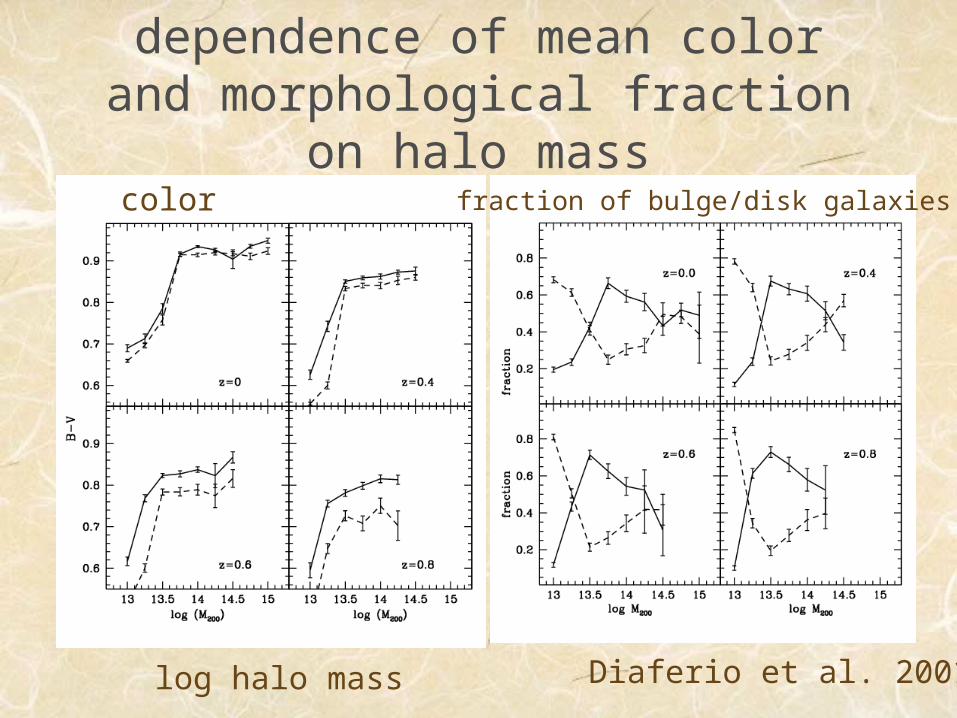
dependence of mean color and morphological fraction on halo
mass
Diaferio et al. 2001
color fraction of bulge/disk galaxies
log halo mass

primordial power spectrum
star formationstellar feedbackchemical enrichment
collisional heatingradiative cooling
merger tree
stellar populationsdust absorption & emission
galaxy galaxy observablesobservables
inflation
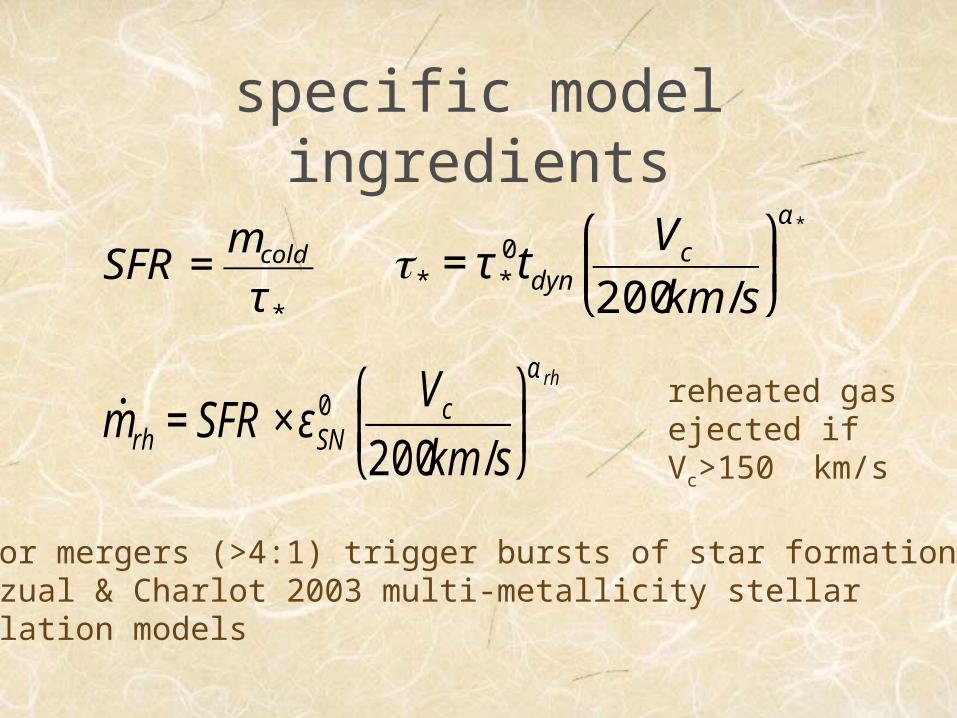
specific model ingredients
€
SFR =mcold
τ *
€
τ* = τ *0tdyn
Vc
200km /s
⎛
⎝ ⎜
⎞
⎠ ⎟α *
€
˙ m rh = SFR ×εSN0 Vc
200km /s
⎛
⎝ ⎜
⎞
⎠ ⎟α rh reheated gas
ejected if Vc>150 km/s
•major mergers (>4:1) trigger bursts of star formation•Bruzual & Charlot 2003 multi-metallicity stellarpopulation models
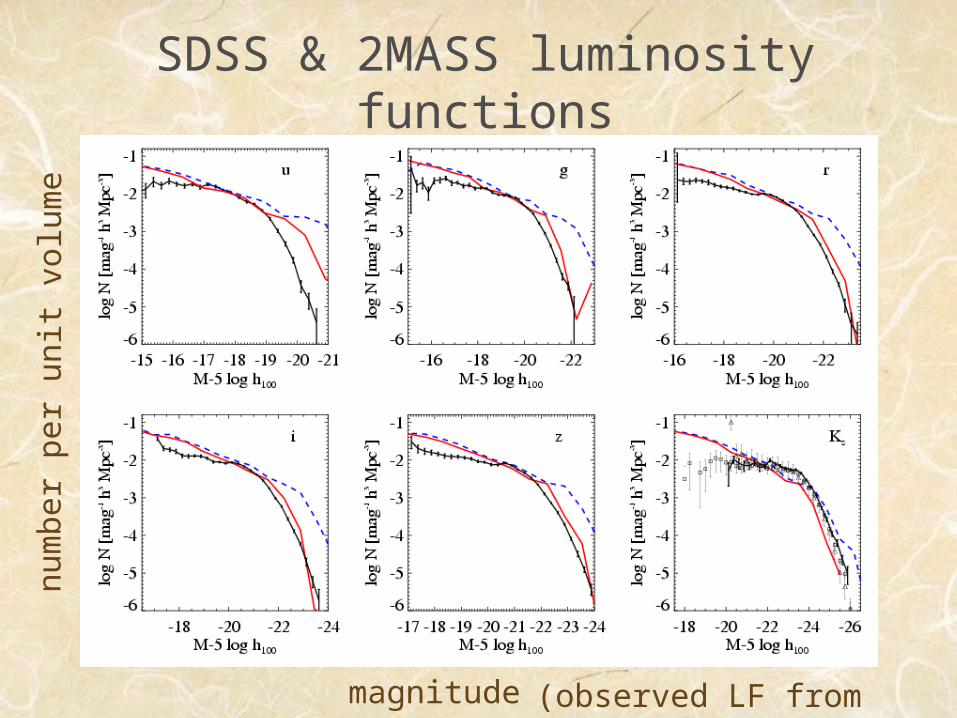
SDSS & 2MASS luminosity functions
n um
ber
p er
u nit
vol
ume
magnitude
u-band g-band r-band
i-band z-band K-band
(observed LF from Bell et al.
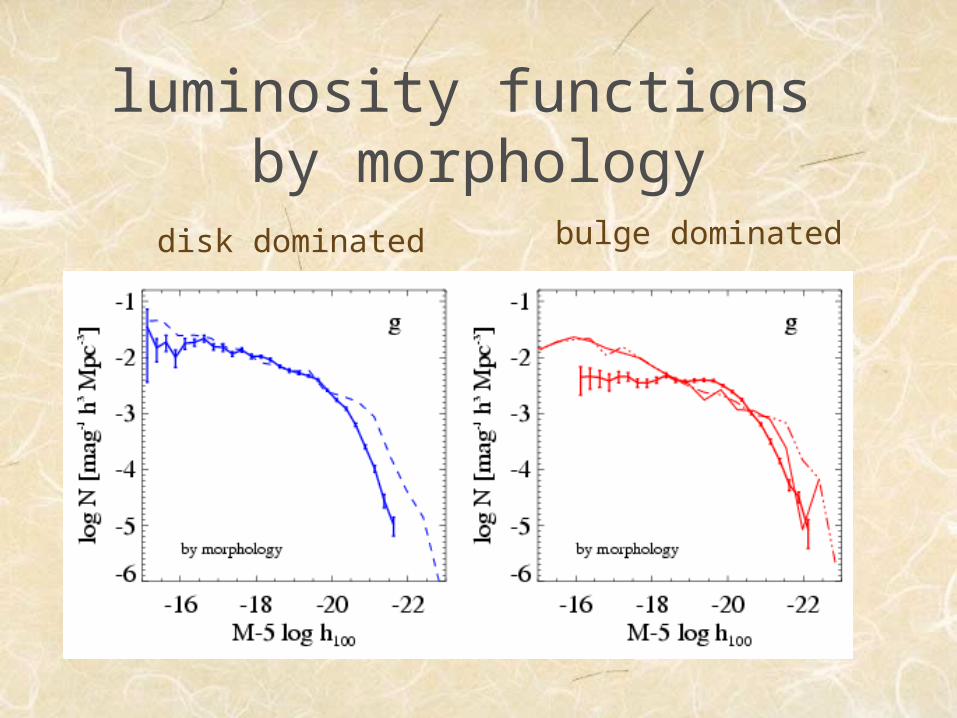
luminosity functions by morphology
disk dominated bulge dominated
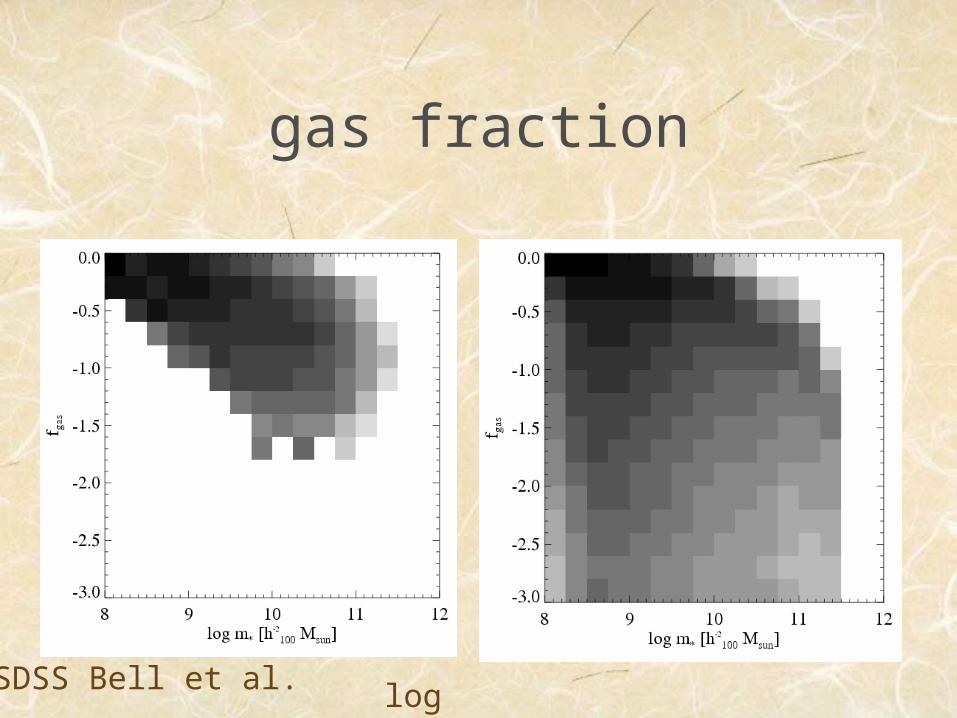
gas fraction
log stellar massSDSS Bell et al.

gas fraction distributionsincreasing stellar mass -->

color-magnitude relation
r-band magnitude

color histogramsbright-->
faint
g-r color
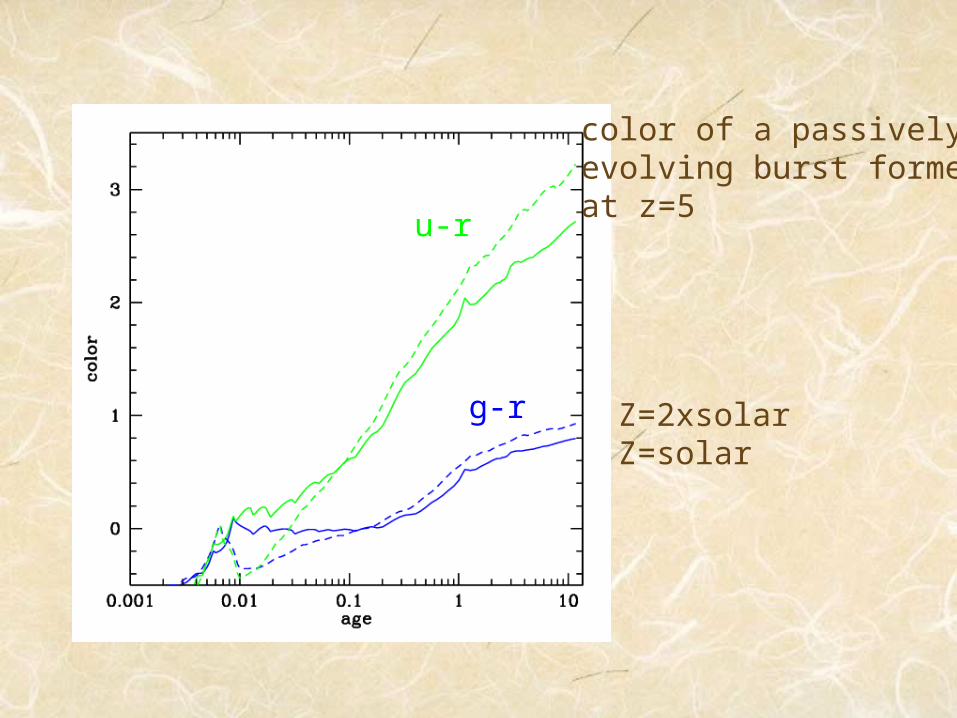
color of a passivelyevolving burst formedat z=5
u-r
g-r Z=2xsolarZ=solar
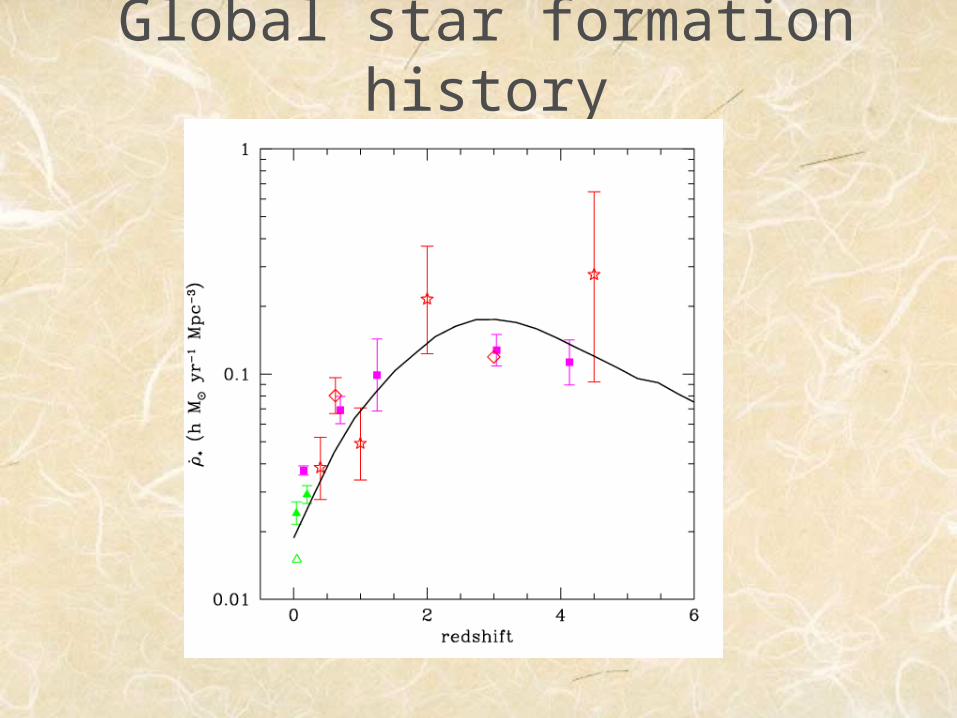
Global star formation history
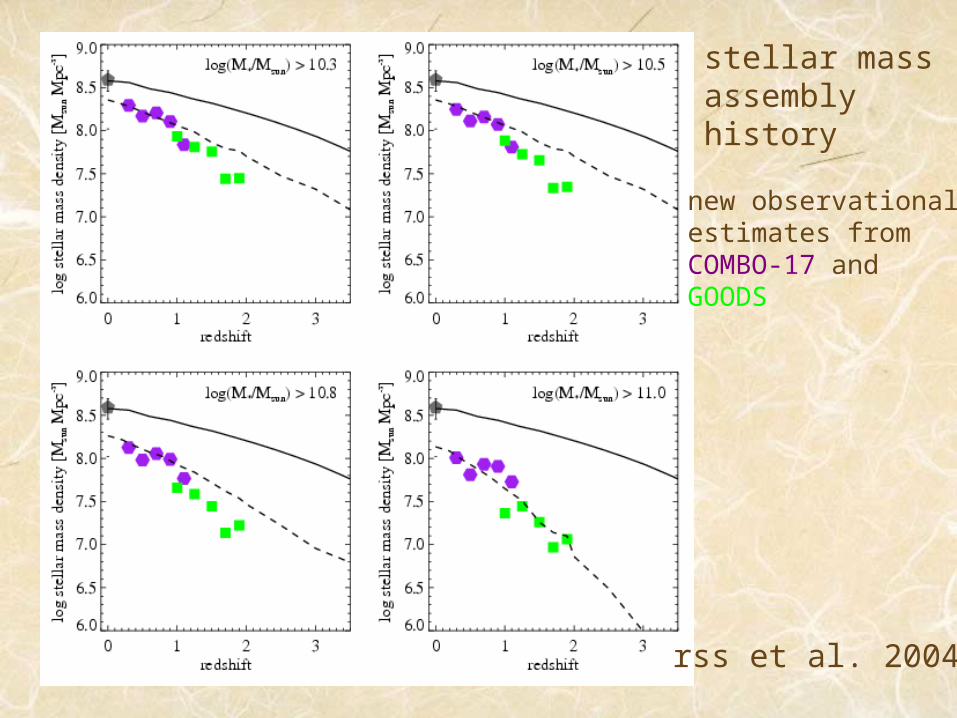
stellar massassemblyhistory
rss et al. 2004
new observationalestimates fromCOMBO-17 andGOODS

stellar mass assembly history
rss et al. 2004
estimates fromGlazebrook et al. (GDDS)Rudnick et al. (FIRES)Dickinson et al. (HDFN)Fontana et al. (K20)
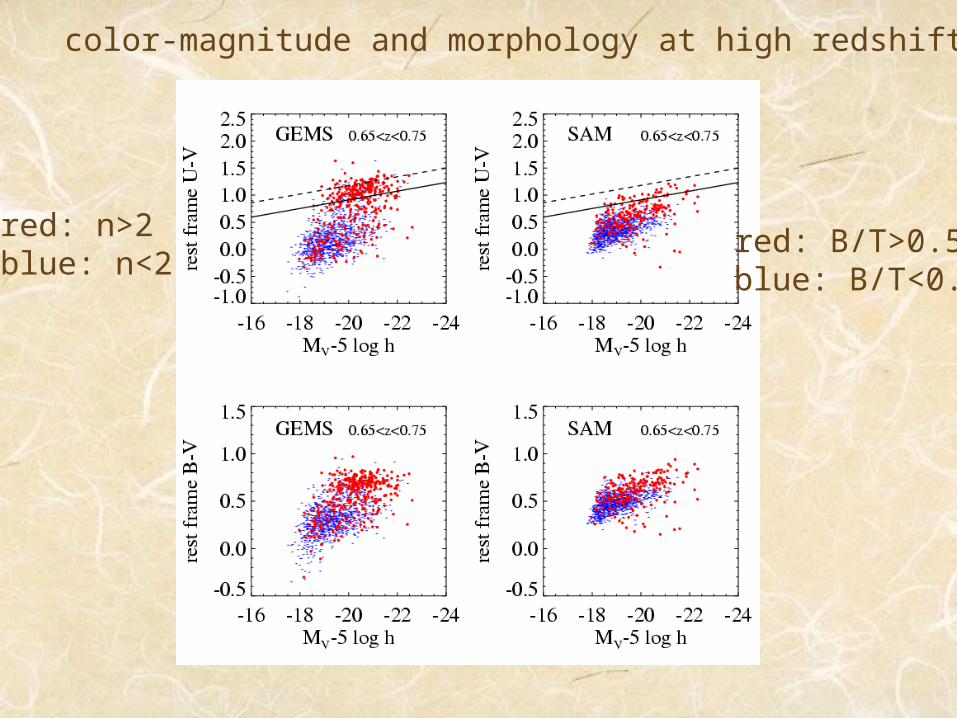
red: n>2blue: n<2
red: B/T>0.5blue: B/T<0.5
color-magnitude and morphology at high redshift
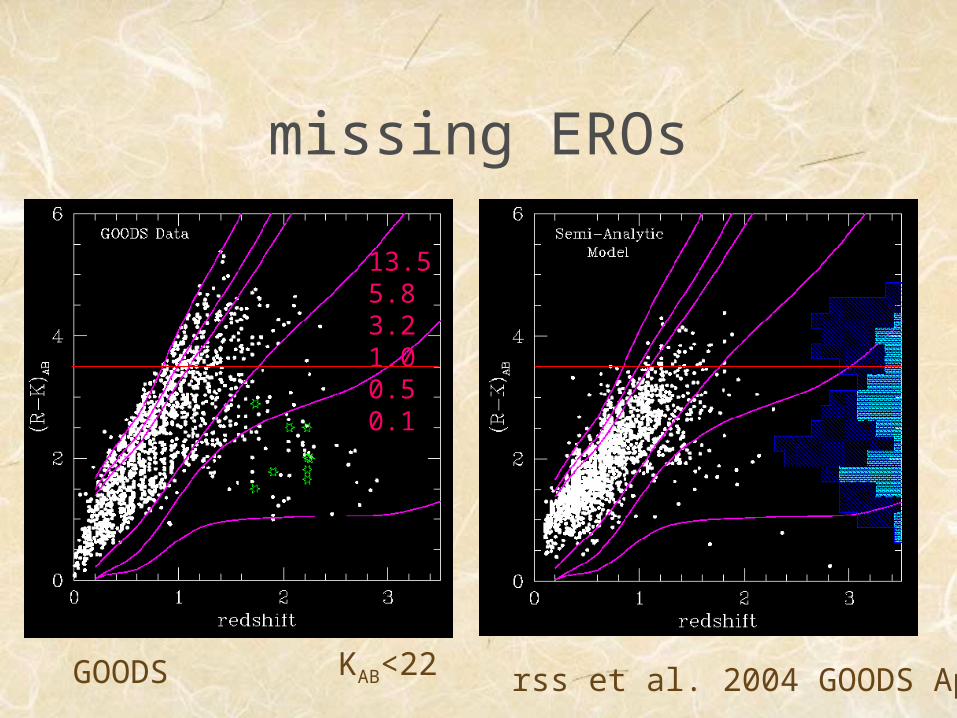
KAB<22
13.55.83.21.00.50.1
rss et al. 2004 GOODS ApJLGOODS
missing EROs
status: low redshift
hierarchical models can be made to reproduce global luminosity/stellar mass distributions at low redshift but don’t produce enough luminous red galaxiescolor magnitude relation has correct slope (well, sort of) but distributions do not match data and are not bimodal
status: high redshift
hierarchical models produce enough massive galaxies to z~2but, do not produce enough red galaxiesthe mean stellar ages of the massive galaxies are old enough -- color problem is caused by ‘frosting’ of young stars
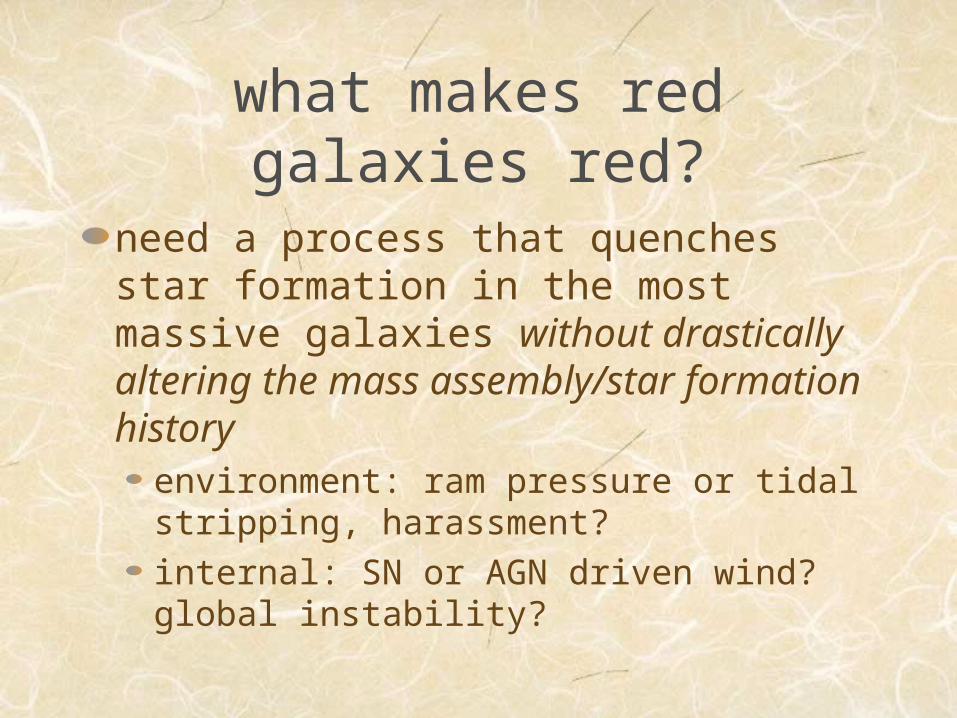
what makes red galaxies red?
need a process that quenches star formation in the most massive galaxies without drastically altering the mass assembly/star formation history
environment: ram pressure or tidal stripping, harassment?internal: SN or AGN driven wind? global instability?

neighbor counts (R=2 Mpc)
L=114 Mpc mp=3x10⁸ M_sun r_force=1.5 kpc
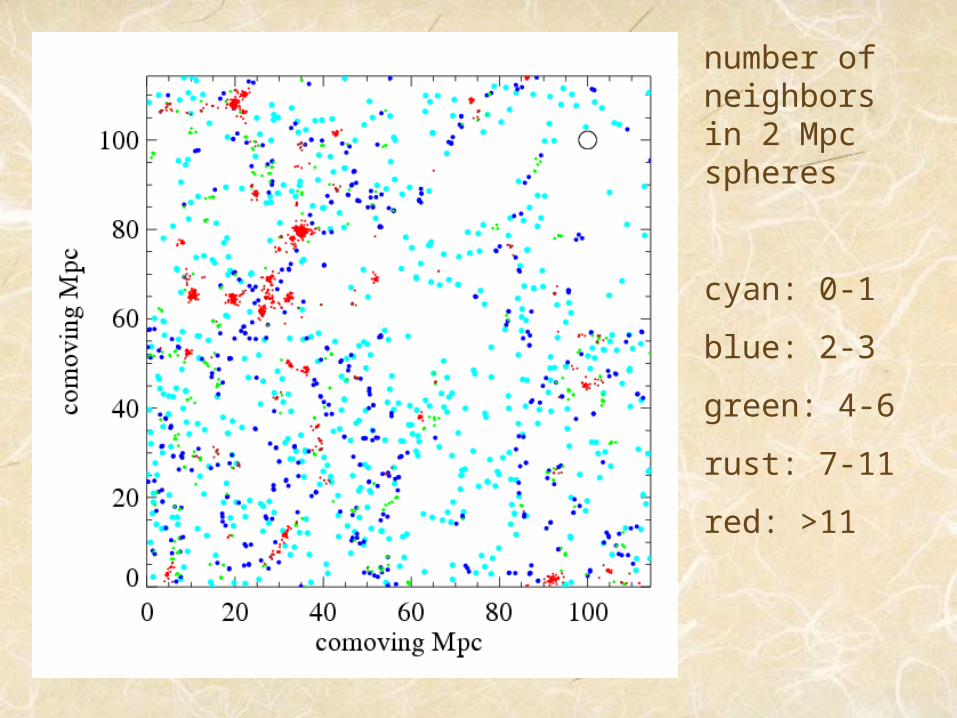
number of neighbors in 2 Mpc spheres
cyan: 0-1
blue: 2-3
green: 4-6
rust: 7-11
red: >11
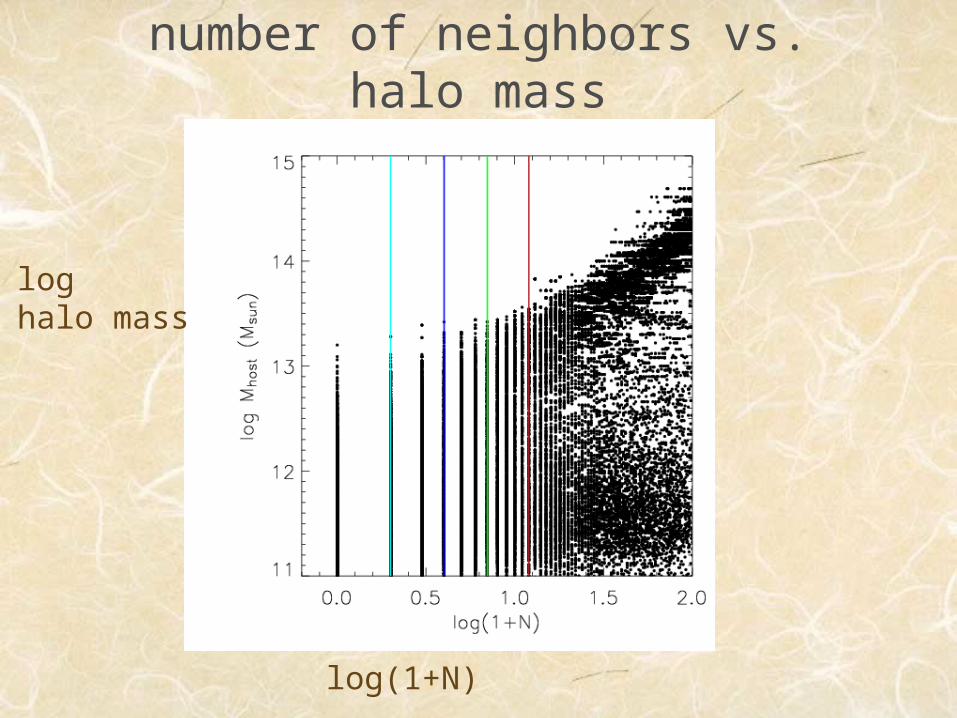
number of neighbors vs. halo mass
log(1+N)
log halo mass
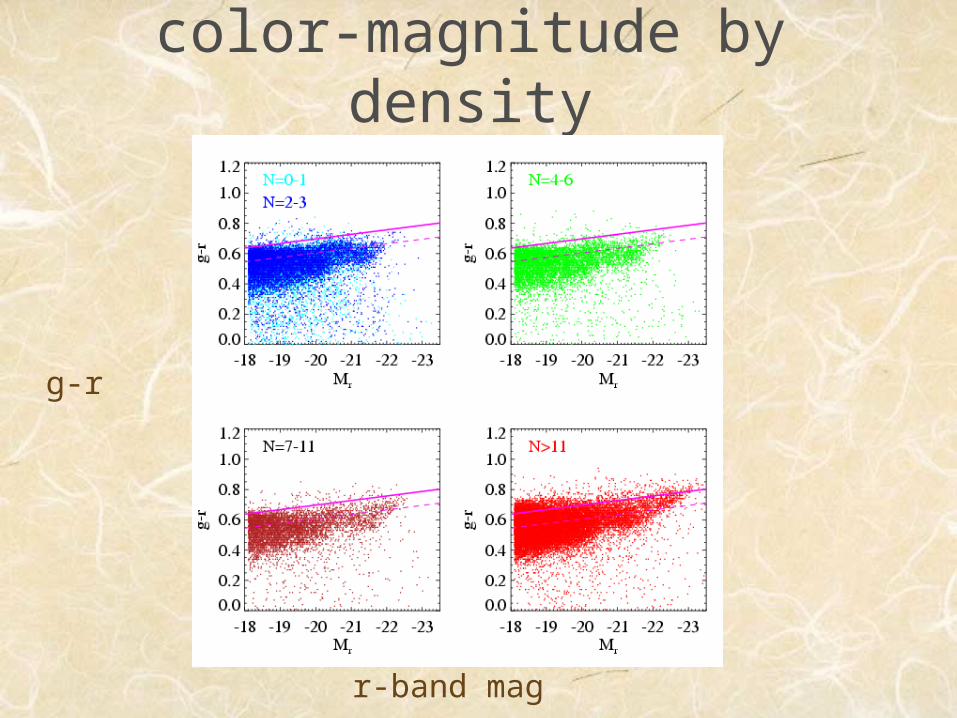
color-magnitude by density
g-r
r-band mag

Kauffmann et al. 2004
N=0-1 N>17
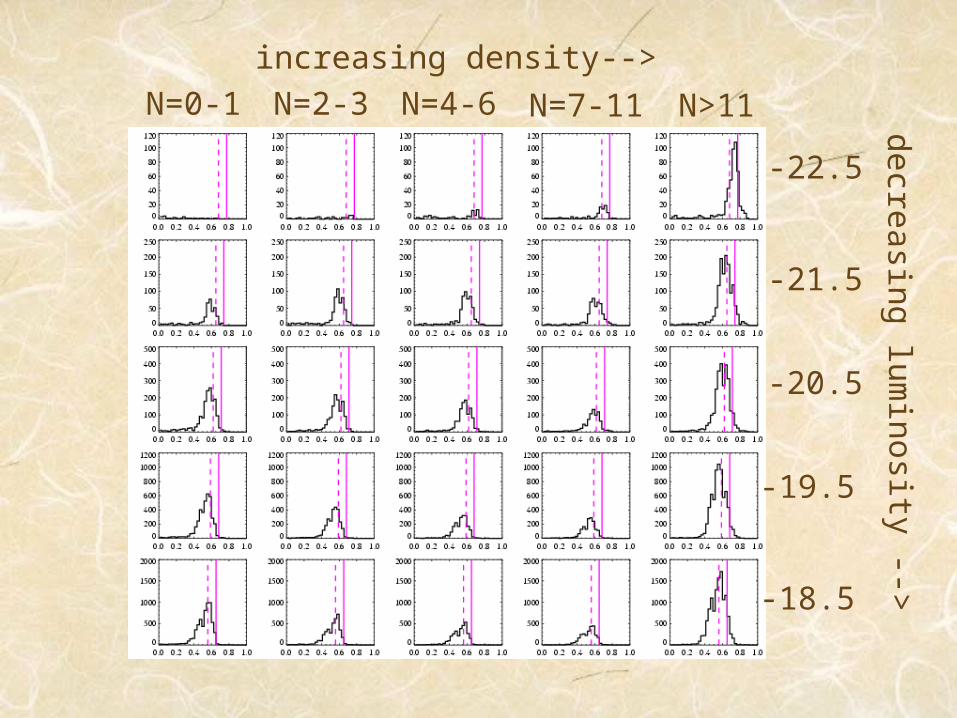
increasing density-->decreasing lum
ino si ty - ->
N=0-1 N=2-3 N=4-6 N=7-11 N>11
-22.5
-21.5
-20.5
-19.5
-18.5
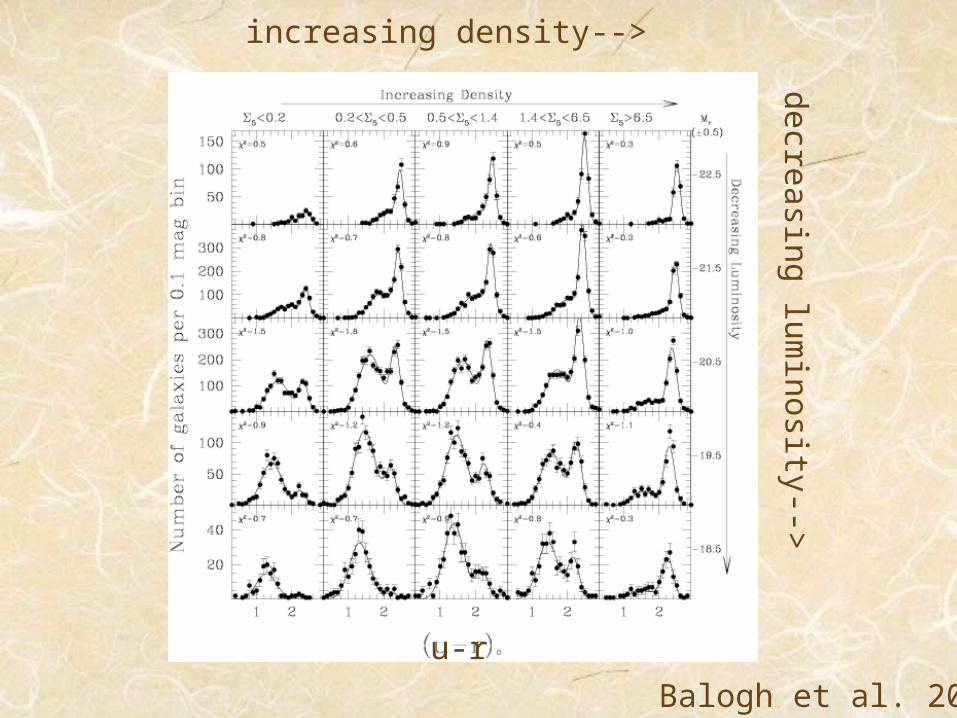
Balogh et al. 2004
increasing density-->
decreasing luminosity-->
u-r
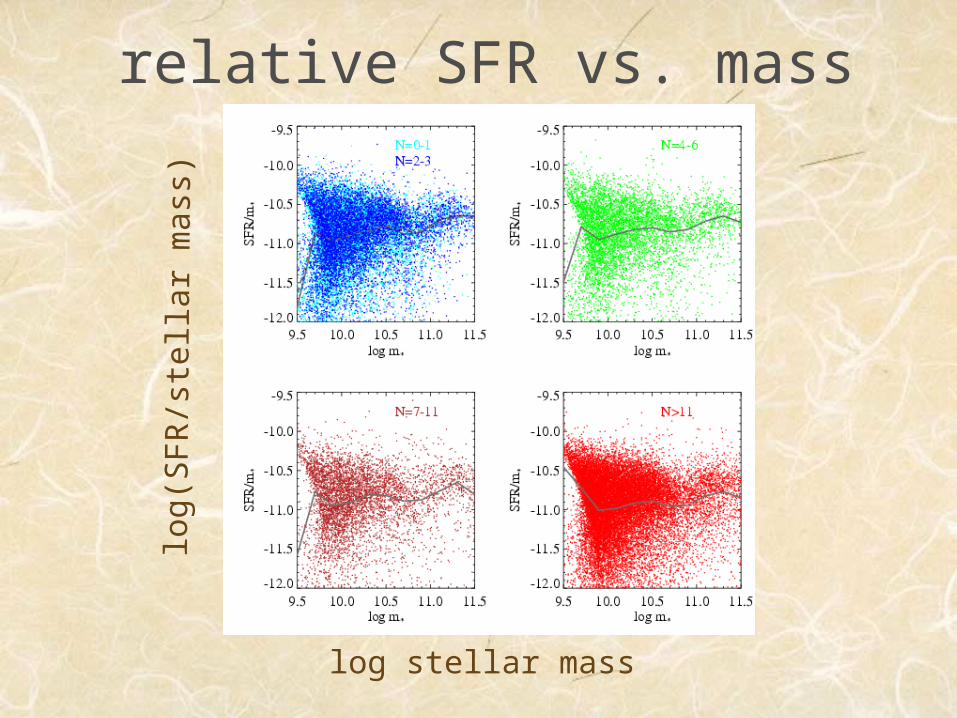
relative SFR vs. mass
log stellar mass
log(
SF
R/s
tell
ar m
ass)
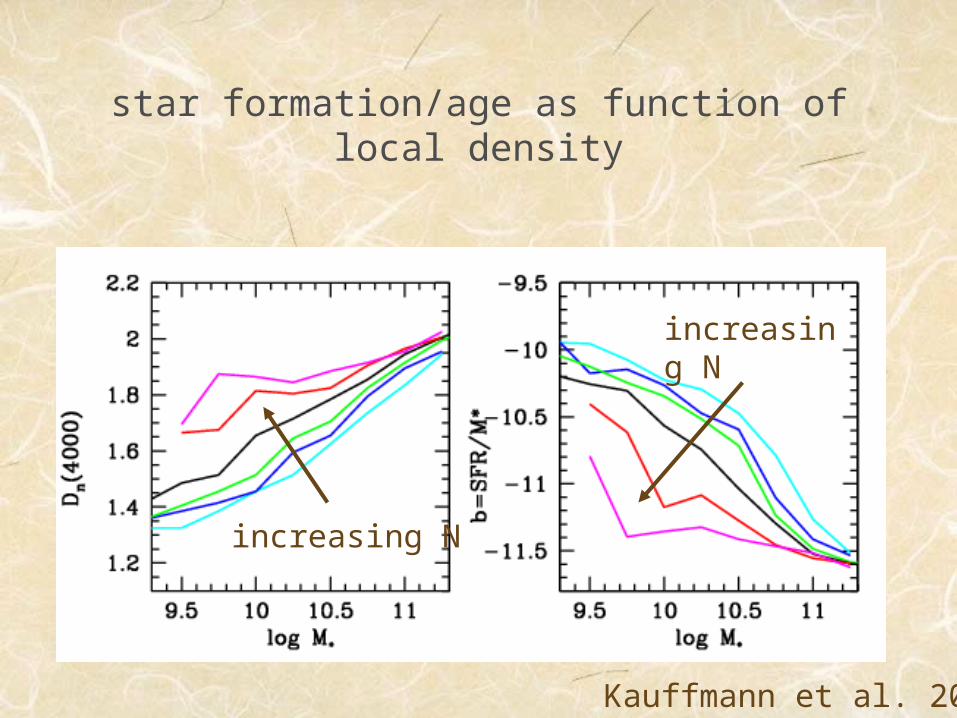
star formation/age as function of local density
increasing N
Kauffmann et al. 2004
increasing N
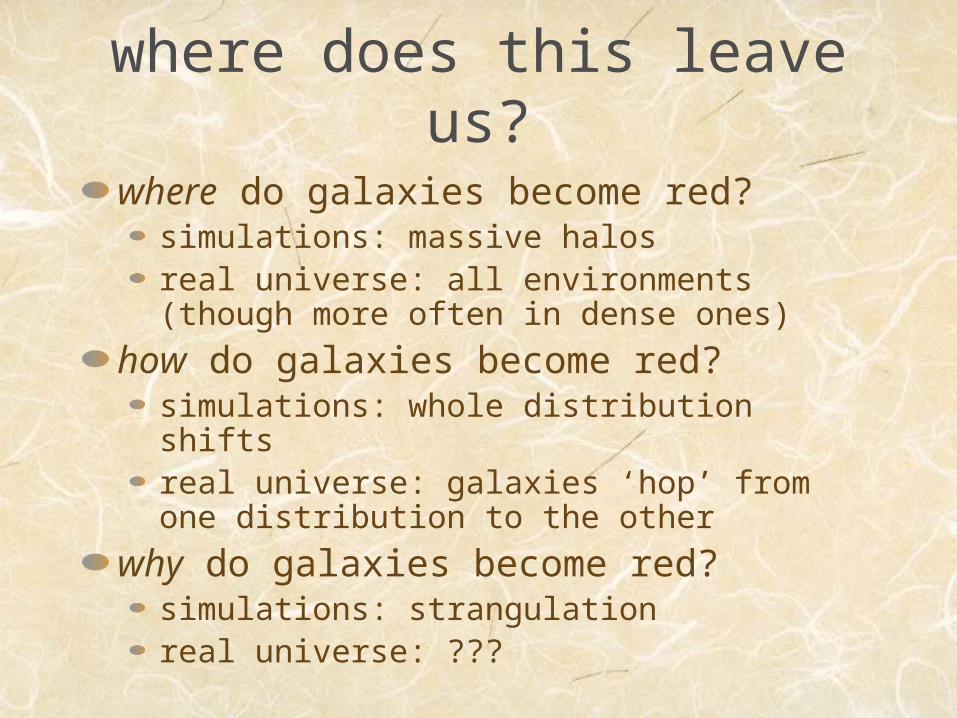
where does this leave us?
where do galaxies become red?simulations: massive halosreal universe: all environments (though more often in dense ones)
how do galaxies become red?simulations: whole distribution shiftsreal universe: galaxies ‘hop’ from one distribution to the other
why do galaxies become red?simulations: strangulationreal universe: ???
internal processes
all gas driven out of galaxy after a merger by SN or AGN winds?
has almost no effect on colors because of continuous infall of fresh gas
star formation ‘turned off’ when a bulge (BH?) has grown beyond a critical mass?
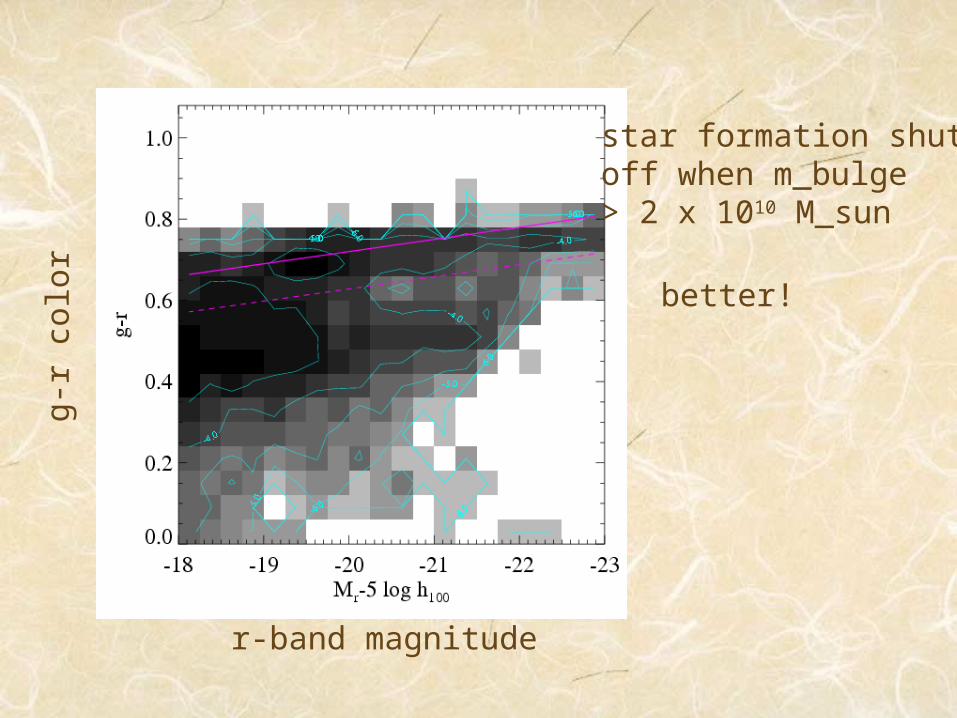
g-r
colo
r
r-band magnitude
star formation shutoff when m_bulge> 2 x 10¹⁰ M_sun
better!
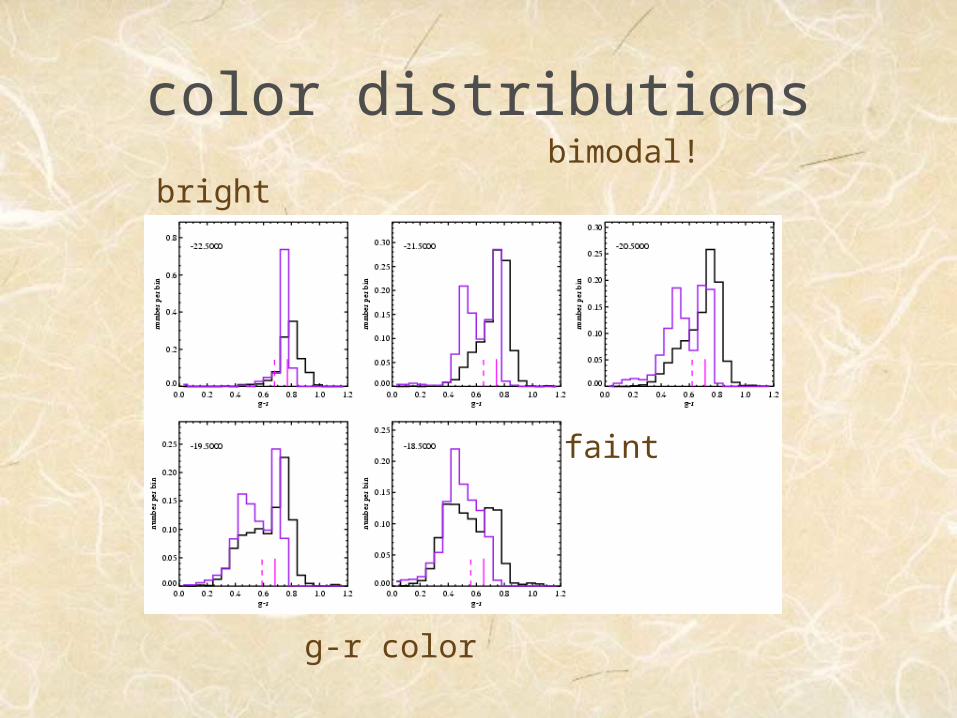
color distributions
bright
faint
g-r color
bimodal!