How Americans Pay Their Bills: Sizing Bill Pay … · How Americans Pay Their Bills: Sizing Bill...
85
© 2017 Aite Group. All rights reserved. Reproduction of this white paper by any means is strictly prohibited. How Americans Pay Their Bills: Sizing Bill Pay Channels and Methods JANUARY 2017 David Albertazzi This white paper was commissioned by ACI Worldwide and written by Aite Group. All views and opinions expressed and all information presented are that of Aite Group. ACI Worldwide provides this white paper for informational purposes only.
Transcript of How Americans Pay Their Bills: Sizing Bill Pay … · How Americans Pay Their Bills: Sizing Bill...
© 2017 Aite Group. All rights reserved. Reproduction of this white paper by any means is strictly prohibited.
How Americans Pay Their Bills: Sizing Bill Pay Channels and Methods
JANUARY 2017
David Albertazzi
This white paper was commissioned by ACI Worldwide and written by Aite Group. All views and
opinions expressed and all information presented are that of Aite Group. ACI Worldwide
provides this white paper for informational purposes only.
How Americans Pay Their Bills: Sizing Bill Pay Channels and Methods JANUARY 2017
© 2017 Aite Group LLC. All rights reserved. Reproduction of this report by any means is strictly prohibited. 101 Arch Street, Suite 501, Boston, MA 02110 • Tel +1.617.338.6050 • Fax +1.617.338.6078 • [email protected] • www.aitegroup.com
2
TABLE OF CONTENTS IMPACT POINTS .............................................................................................................................................. 6
INTRODUCTION .............................................................................................................................................. 7
METHODOLOGY ........................................................................................................................................ 7
BILL PAYMENT BY CHANNEL AND METHOD ................................................................................................... 8
CATEGORIES OF BILLS PAID ....................................................................................................................... 9
AVERAGE AMOUNT PER BILL .................................................................................................................. 12
SEGMENTATION OF BILLS PAID .............................................................................................................. 13
BILL PAYMENT BY BILL CATEGORY ................................................................................................................ 23
CABLE/TV/INTERNET ............................................................................................................................... 23
MORTGAGE ............................................................................................................................................. 25
RENT ....................................................................................................................................................... 27
OTHER REAL ESTATE FEES ....................................................................................................................... 29
PROPERTY TAXES .................................................................................................................................... 31
WATER/SEWER ....................................................................................................................................... 33
ELECTRICITY............................................................................................................................................. 35
GAS/OIL ................................................................................................................................................... 37
GARBAGE ................................................................................................................................................ 39
PROPERTY INSURANCE ........................................................................................................................... 41
LANDLINE PHONES .................................................................................................................................. 43
HOME SECURITY ..................................................................................................................................... 45
AUTO/CAR LOAN/LEASE PAYMENTS ....................................................................................................... 47
AUTO/CAR INSURANCE ........................................................................................................................... 49
VEHICLE REGISTRATION .......................................................................................................................... 51
MAJOR CREDIT CARDS ............................................................................................................................ 53
RETAIL/DEPARTMENT STORE CREDIT CARDS ......................................................................................... 55
STUDENT LOANS ..................................................................................................................................... 57
OTHER LOANS ......................................................................................................................................... 59
FEDERAL INCOME TAXES ........................................................................................................................ 61
STATE INCOME TAXES ............................................................................................................................. 63
PARKING TICKETS/COURT FEES AND FINES ............................................................................................ 65
UNIVERSITIES/COLLEGES/TRADE SCHOOLS ............................................................................................ 67
PUBLIC/PRIVATE PRESCHOOL/ELEMENTARY SCHOOL/ SECONDARY SCHOOL ....................................... 69
CELLPHONES/WIRELESS PHONES ............................................................................................................ 71
LIFE INSURANCE ...................................................................................................................................... 73
HEALTH INSURANCE ................................................................................................................................ 75
MEDICAL ................................................................................................................................................. 77
CHARITABLE DONATIONS ....................................................................................................................... 79
CONCLUSION ................................................................................................................................................ 82
How Americans Pay Their Bills: Sizing Bill Pay Channels and Methods JANUARY 2017
© 2017 Aite Group LLC. All rights reserved. Reproduction of this report by any means is strictly prohibited. 101 Arch Street, Suite 501, Boston, MA 02110 • Tel +1.617.338.6050 • Fax +1.617.338.6078 • [email protected] • www.aitegroup.com
3
RELATED AITE GROUP RESEARCH ................................................................................................................. 83
ABOUT AITE GROUP...................................................................................................................................... 84
AUTHOR INFORMATION ......................................................................................................................... 84
CONTACT ................................................................................................................................................. 84
ABOUT ACI WORLDWIDE .............................................................................................................................. 85
LIST OF FIGURES FIGURE 1: BILL PAYMENT TYPES ................................................................................................................... 14
FIGURE 2: 2016 ONE-TIME BILL PAYMENT VOLUME BY CHANNEL .............................................................. 14
FIGURE 3: 2016 ONE-TIME BILL PAYMENT GDV BY CHANNEL ...................................................................... 15
FIGURE 4: 2016 RECURRING BILL PAYMENT VOLUME BY CHANNEL ............................................................ 15
FIGURE 5: 2016 RECURRING BILL PAYMENT GDV BY CHANNEL ................................................................... 16
FIGURE 6: PERCENTAGE OF ONLINE BILL VOLUME BY TYPE OF SITE ............................................................ 17
FIGURE 7: 2016 BILL VOLUME BY METHOD .................................................................................................. 17
FIGURE 8: PERCENTAGE OF BILL VOLUME BY METHOD ............................................................................... 18
FIGURE 9: 2016 GDV BY METHOD ................................................................................................................ 18
FIGURE 10: PERCENTAGE OF GDV BY METHOD............................................................................................ 19
FIGURE 11: PERCENTAGE OF ONE-TIME BILLS PAID BY CHANNEL BY GENERATION .................................... 20
FIGURE 12: PERCENTAGE OF RECURRING BILLS PAID BY CHANNEL BY GENERATION ................................. 20
FIGURE 13: PERCENTAGE OF ONLINE BILLS PAID BY TYPE OF SITE BY GENERATION ................................... 21
FIGURE 14: PERCENTAGE OF ONLINE BILLS PAID BY GENERATION .............................................................. 21
FIGURE 15: 2016 PERCENTAGE OF BILLS PAID BY METHOD BY GENERATION ............................................. 22
LIST OF TABLES TABLE A: CATEGORIES OF BILLS—DEFINITIONS .............................................................................................. 8
TABLE B: ESTIMATED 2016 U.S. CONSUMER BILL VOLUME ........................................................................... 9
TABLE C: CHANGE IN NUMBER OF BILLS, 2010 TO 2016 .............................................................................. 11
TABLE D: CHANGE IN GDV OF BILLS, 2010 TO 2016 ..................................................................................... 11
TABLE E: 2016 AVERAGE BILL AMOUNT AND CHANGE IN HOW PAYMENT IS MADE FROM TWO YEARS AGO
............................................................................................................................................................. 12
TABLE F: CABLE/TV/INTERNET ONE-TIME BILL PAYMENT VOLUME ............................................................. 23
TABLE G: CABLE/TV/INTERNET RECURRING BILL PAYMENT VOLUME ......................................................... 24
TABLE H: MORTGAGE ONE-TIME BILL PAYMENT VOLUME .......................................................................... 25
TABLE I: MORTGAGE RECURRING BILL PAYMENT VOLUME ......................................................................... 26
TABLE J: RENT ONE-TIME BILL PAYMENT VOLUME ...................................................................................... 27
TABLE K: RENT RECURRING BILL PAYMENT VOLUME ................................................................................... 29
TABLE L: OTHER REAL ESTATE FEES ONE-TIME BILL PAYMENT VOLUME ..................................................... 29
TABLE M: OTHER REAL ESTATE FEES RECURRING BILL PAYMENT VOLUME ................................................. 31
TABLE N: PROPERTY TAXES ONE-TIME BILL PAYMENT VOLUME.................................................................. 31
How Americans Pay Their Bills: Sizing Bill Pay Channels and Methods JANUARY 2017
© 2017 Aite Group LLC. All rights reserved. Reproduction of this report by any means is strictly prohibited. 101 Arch Street, Suite 501, Boston, MA 02110 • Tel +1.617.338.6050 • Fax +1.617.338.6078 • [email protected] • www.aitegroup.com
4
TABLE O: PROPERTY TAXES RECURRING BILL PAYMENT VOLUME ............................................................... 33
TABLE P: WATER/SEWER ONE-TIME BILL PAYMENT VOLUME ..................................................................... 33
TABLE Q: WATER/SEWER RECURRING BILL PAYMENT VOLUME .................................................................. 35
TABLE R: ELECTRICITY ONE-TIME BILL PAYMENT VOLUME .......................................................................... 35
TABLE S: ELECTRICITY RECURRING BILL PAYMENT VOLUME ........................................................................ 37
TABLE T: GAS/OIL ONE-TIME BILL PAYMENT VOLUME................................................................................. 37
TABLE U: GAS/OIL RECURRING BILL PAYMENT VOLUME ............................................................................. 39
TABLE V: GARBAGE ONE-TIME BILL PAYMENT VOLUME .............................................................................. 39
TABLE W: GARBAGE RECURRING BILL PAYMENT VOLUME .......................................................................... 41
TABLE X: PROPERTY INSURANCE ONE-TIME BILL PAYMENT VOLUME ......................................................... 41
TABLE Y: PROPERTY INSURANCE RECURRING BILL PAYMENT VOLUME ....................................................... 43
TABLE Z: LANDLINE PHONES ONE-TIME BILL PAYMENT VOLUME ................................................................ 43
TABLE AA: LANDLINE PHONES RECURRING BILL PAYMENT VOLUME .......................................................... 45
TABLE BB: HOME SECURITY ONE-TIME BILL PAYMENT VOLUME ................................................................. 45
TABLE CC: HOME SECURITY RECURRING BILL PAYMENT VOLUME .............................................................. 47
TABLE DD: AUTO/CAR LOAN/LEASE ONE-TIME BILL PAYMENT VOLUME .................................................... 47
TABLE EE: AUTO/CAR LOAN/LEASE RECURRING BILL PAYMENT VOLUME ................................................... 49
TABLE FF: AUTO/CAR INSURANCE ONE-TIME BILL PAYMENT VOLUME ....................................................... 49
TABLE GG: AUTO/CAR INSURANCE RECURRING BILL PAYMENT VOLUME ................................................... 51
TABLE HH: VEHICLE REGISTRATION ONE-TIME BILL PAYMENT VOLUME ..................................................... 51
TABLE II: VEHICLE REGISTRATION RECURRING BILL PAYMENT VOLUME ..................................................... 53
TABLE JJ: MAJOR CREDIT CARDS ONE-TIME BILL PAYMENT VOLUME ......................................................... 53
TABLE KK: MAJOR CREDIT CARDS RECURRING BILL PAYMENT VOLUME ..................................................... 55
TABLE LL: RETAIL/DEPARTMENT STORE CREDIT CARDS ONE-TIME BILL PAYMENT VOLUME ...................... 55
TABLE MM: RETAIL/DEPARTMENT STORE CREDIT CARDS RECURRING BILL PAYMENT VOLUME ................ 57
TABLE NN: STUDENT LOANS ONE-TIME BILL PAYMENT VOLUME ................................................................ 57
TABLE OO: STUDENT LOANS RECURRING BILL PAYMENT VOLUME ............................................................. 59
TABLE PP: OTHER LOANS ONE-TIME BILL PAYMENT VOLUME ..................................................................... 59
TABLE QQ: OTHER LOANS RECURRING BILL PAYMENT VOLUME ................................................................. 61
TABLE RR: FEDERAL INCOME TAXES ONE-TIME BILL PAYMENT VOLUME .................................................... 61
TABLE SS: FEDERAL INCOME TAXES RECURRING BILL PAYMENT VOLUME .................................................. 63
TABLE TT: STATE INCOME TAXES ONE-TIME BILL PAYMENT VOLUME ......................................................... 63
TABLE UU: STATE INCOME TAXES RECURRING BILL PAYMENT VOLUME ..................................................... 65
TABLE VV: PARKING TICKETS/COURT FEES AND FINES ONE-TIME BILL PAYMENT VOLUME ....................... 65
TABLE WW: PARKING TICKETS/COURT FEES AND FINES RECURRING BILL PAYMENT VOLUME .................. 67
TABLE XX: UNIVERSITIES/COLLEGES/TRADE SCHOOLS ONE-TIME BILL PAYMENT VOLUME ........................ 67
TABLE YY: UNIVERSITIES/COLLEGES/TRADE SCHOOLS RECURRING BILL PAYMENT VOLUME ..................... 69
TABLE ZZ: PUBLIC/PRIVATE PRESCHOOL/ELEMENTARY SCHOOL/SECONDARY SCHOOL ONE-TIME BILL
PAYMENT VOLUME ............................................................................................................................. 69
How Americans Pay Their Bills: Sizing Bill Pay Channels and Methods JANUARY 2017
© 2017 Aite Group LLC. All rights reserved. Reproduction of this report by any means is strictly prohibited. 101 Arch Street, Suite 501, Boston, MA 02110 • Tel +1.617.338.6050 • Fax +1.617.338.6078 • [email protected] • www.aitegroup.com
5
TABLE AAA: PUBLIC/PRIVATE PRESCHOOL/ELEMENTARY SCHOOL/SECONDARY SCHOOL RECURRING BILL
PAYMENT VOLUME ............................................................................................................................. 71
TABLE BBB: CELLPHONE/WIRELESS PHONE ONE-TIME BILL PAYMENT VOLUME ........................................ 71
TABLE CCC: CELLPHONE/WIRELESS PHONE RECURRING BILL PAYMENT VOLUME ...................................... 73
TABLE DDD: LIFE INSURANCE ONE-TIME BILL PAYMENT VOLUME .............................................................. 73
TABLE EEE: LIFE INSURANCE RECURRING BILL PAYMENT VOLUME ............................................................. 75
TABLE FFF: HEALTH INSURANCE ONE-TIME BILL PAYMENT VOLUME .......................................................... 75
TABLE GGG: HEALTH INSURANCE RECURRING BILL PAYMENT VOLUME ..................................................... 77
TABLE HHH: MEDICAL ONE-TIME BILL PAYMENT VOLUME .......................................................................... 77
TABLE III: MEDICAL RECURRING BILL PAYMENT VOLUME ........................................................................... 79
TABLE JJJ: CHARITABLE DONATIONS ONE-TIME BILL PAYMENT VOLUME ................................................... 79
TABLE KKK: CHARITABLE DONATIONS RECURRING BILL PAYMENT VOLUME .............................................. 81

How Americans Pay Their Bills: Sizing Bill Pay Channels and Methods JANUARY 2017
© 2017 Aite Group LLC. All rights reserved. Reproduction of this report by any means is strictly prohibited. 101 Arch Street, Suite 501, Boston, MA 02110 • Tel +1.617.338.6050 • Fax +1.617.338.6078 • [email protected] • www.aitegroup.com
6
IMPACT POINTS
This Impact Report is based on a Q3 2016 Aite Group survey of 2,429 U.S.
consumers. It is intended for firms that provide consumer bill payment services
and companies seeking to understand consumers’ bill pay behavior.
Across the most frequently paid types of bills in 2016, U.S. consumers paid more
than 14.7 billion bills, spending US$3.9 trillion. Bills for utilities, credit cards,
cable/TV/internet, and cellphones account for roughly half of all bills paid.
Among the 14.7 billion bills paid in 2016, approximately 10 billion, or 68%, are
made as one-time payments, and 4.7 billion, or 32%, are set up on a recurring
basis.
Among the 14.7 billion bills, approximately 8.2 billion, or 56%, are made online
via a biller, bank, or third-party website.
The percentage of online payments made on biller sites has grown from 62% in
2010 to 73% in 2016 at the expense of bank bill pay, which declined from 38% in
2010 to 27% in 2016.
Payments made through the Automated Clearing House (ACH) exceed 6.8
billion, and Americans still write slightly more than 2.5 billion checks, provide
their debit card information to pay nearly 2.2 billion bills, and use their credit
card information to pay another 2.2 billion bills.
The use of mail to make one-time bill payments differs by generation, with 40%
of the bills paid by seniors sent through the mail. That percentage declines with
each younger generation, down to 15% for millennials.
The use of billers’ websites represents 44% of all one-time bill payments made
by millennials, while it represents 19% for seniors.
As a percentage of recurring bills paid, the use of biller sites declines with age, at
53% for millennials and 38% for seniors, and mail or phone bill pay is highest
among seniors (34%) and lowest among Generation Xers (19%).
In terms of payment methods, seniors pay a larger percentage of bills using
checks than do younger generations: 31% for seniors versus only 8% for
millennials. Millennials and Gen Xers, however, pay more of their bills using
debit cards than older consumers do.

How Americans Pay Their Bills: Sizing Bill Pay Channels and Methods JANUARY 2017
© 2017 Aite Group LLC. All rights reserved. Reproduction of this report by any means is strictly prohibited. 101 Arch Street, Suite 501, Boston, MA 02110 • Tel +1.617.338.6050 • Fax +1.617.338.6078 • [email protected] • www.aitegroup.com
7
INTRODUCTION
U.S. consumers pay a lot of bills: approximately 14.7 billion bills in 2016, shelling out roughly
US$3.9 trillion. What was once a relatively simple transaction, usually involving handing over
cash or writing a check, has evolved into a wide range of transactions involving many different
payment methods and channels. Over the last few years, consumers have been significantly
reprioritizing how and when they pay their bills, often based on cash flow and convenience.
This Impact Report, sponsored by ACI Worldwide, first sizes the channels and methods
consumers used to pay their most common bills in 2016 and uncovers insights into how all
generations—seniors, baby boomers, Gen Xers, and millennials—are conducting bill payment
activities. Second, the report analyzes bill payment volume and gross dollar value across the 29
most popular bill categories.
The report will be of interest to payment executives who are interested in keeping tabs on U.S.
consumer bill payment trends as well as to the vendor community servicing the bill payment
market.
METHODOLOGY
The following analysis is based on a Q3 2016 Aite Group survey of 2,429 U.S. consumers. The
survey was conducted online among U.S. consumers who participated in a research panel. The
profile of the sample is in proportion to the U.S. population for age, gender, income, geographic
region, and race. The data for the full sample for each year have a margin of error of 3 points at
the 95% level of confidence; statistical tests of significance were conducted at the 95% level of
confidence.
Participants in the research indicated that they are involved in paying most or all of the bills in
their households. Much of the analysis in the report is based on the volume of bills paid by these
households:
31,238 bill types/285,382 bills paid by 2,429 respondents in 2016
6,748 bill types paid by 1,107 respondents in 2013
52,319 bill types/595,493 bills paid by 4,696 respondents in 2010
Population data from the United States Census Bureau was used to calculate projections for the
total U.S. bill payment market.
Further, in this report, bill payment behavior is analyzed by age of the bill payer—actually, the
bill payer’s generation. For this purpose, seniors are defined as individuals who were born before
1946, baby boomers between 1946 and 1964, Gen Xers between 1965 and 1980, and Gen Yers
or millennials between 1981 and 2000.
How Americans Pay Their Bills: Sizing Bill Pay Channels and Methods JANUARY 2017
© 2017 Aite Group LLC. All rights reserved. Reproduction of this report by any means is strictly prohibited. 101 Arch Street, Suite 501, Boston, MA 02110 • Tel +1.617.338.6050 • Fax +1.617.338.6078 • [email protected] • www.aitegroup.com
8
BILL PAYMENT BY CHANNEL AND METHOD
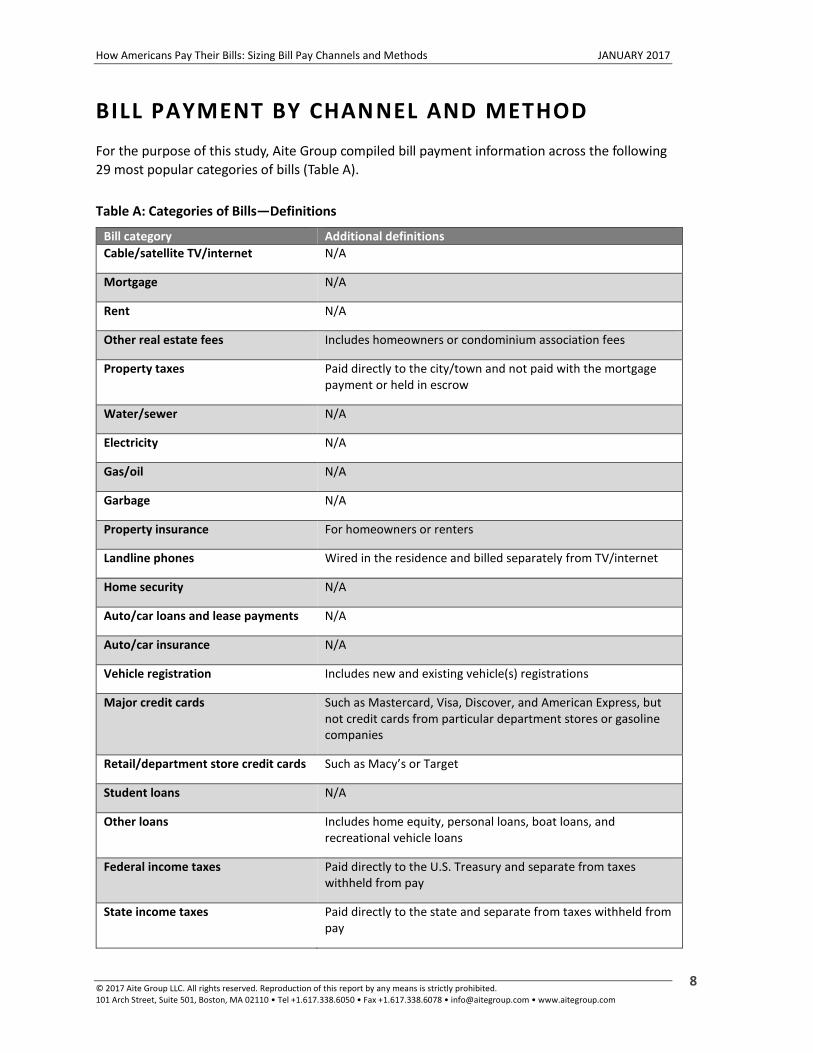
For the purpose of this study, Aite Group compiled bill payment information across the following
29 most popular categories of bills (Table A).
Table A: Categories of Bills—Definitions
Bill category Additional definitions
Cable/satellite TV/internet N/A
Mortgage N/A
Rent N/A
Other real estate fees Includes homeowners or condominium association fees
Property taxes Paid directly to the city/town and not paid with the mortgage payment or held in escrow
Water/sewer N/A
Electricity N/A
Gas/oil N/A
Garbage N/A
Property insurance For homeowners or renters
Landline phones Wired in the residence and billed separately from TV/internet
Home security N/A
Auto/car loans and lease payments N/A
Auto/car insurance N/A
Vehicle registration Includes new and existing vehicle(s) registrations
Major credit cards Such as Mastercard, Visa, Discover, and American Express, but not credit cards from particular department stores or gasoline companies
Retail/department store credit cards Such as Macy’s or Target
Student loans N/A
Other loans Includes home equity, personal loans, boat loans, and recreational vehicle loans
Federal income taxes Paid directly to the U.S. Treasury and separate from taxes withheld from pay
State income taxes Paid directly to the state and separate from taxes withheld from pay
How Americans Pay Their Bills: Sizing Bill Pay Channels and Methods JANUARY 2017
© 2017 Aite Group LLC. All rights reserved. Reproduction of this report by any means is strictly prohibited. 101 Arch Street, Suite 501, Boston, MA 02110 • Tel +1.617.338.6050 • Fax +1.617.338.6078 • [email protected] • www.aitegroup.com
9
Bill category Additional definitions
Parking tickets/court fees and fines N/A
Universities/colleges/trade schools For public or private higher education tuition, fees, and room and board
Public/private preschool/elementary school/secondary school
For tuition, activity fees, transportation fees, after-school care, etc.
Cellphones/wireless phones N/A
Life insurance N/A
Health insurance Paid specifically by the individual and not through payroll deduction
Medical payments Such as hospital, laboratory, doctor, or dentist bills, not including copays
Charitable donations Made either as a one-time or as a monthly payment
Source: Aite Group survey of 2,429 U.S. consumers, Q3 2016
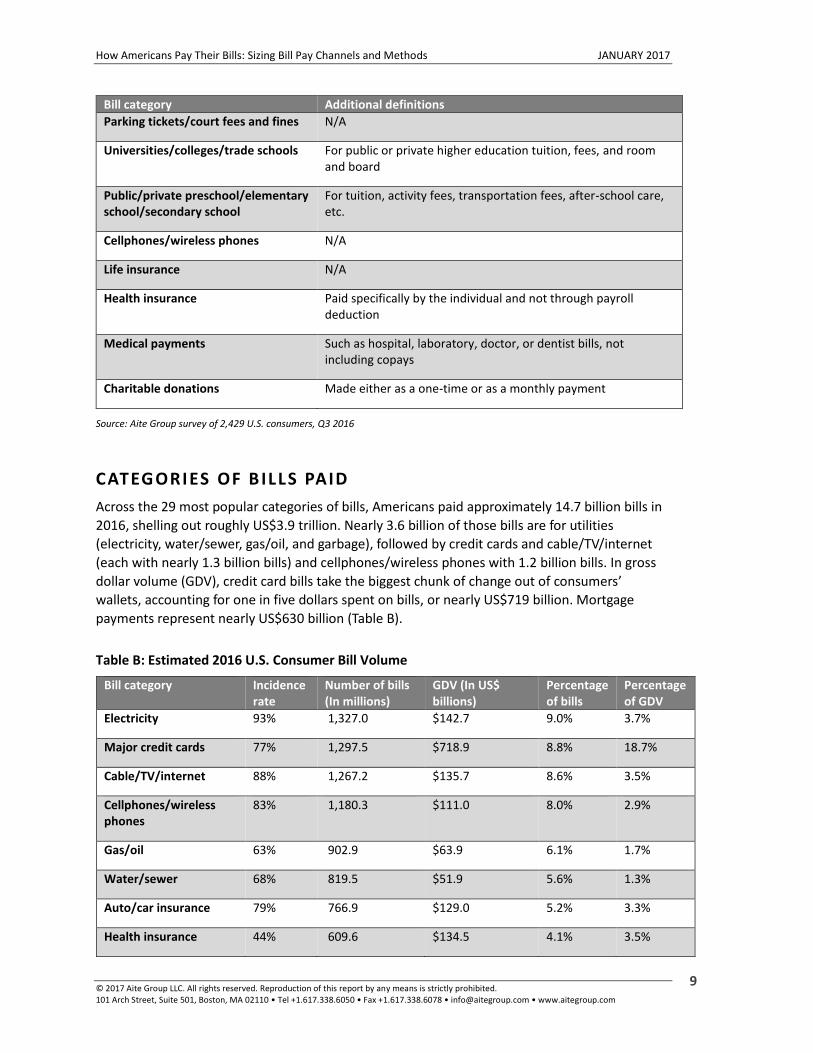
CATEG ORIES OF B ILLS PAID
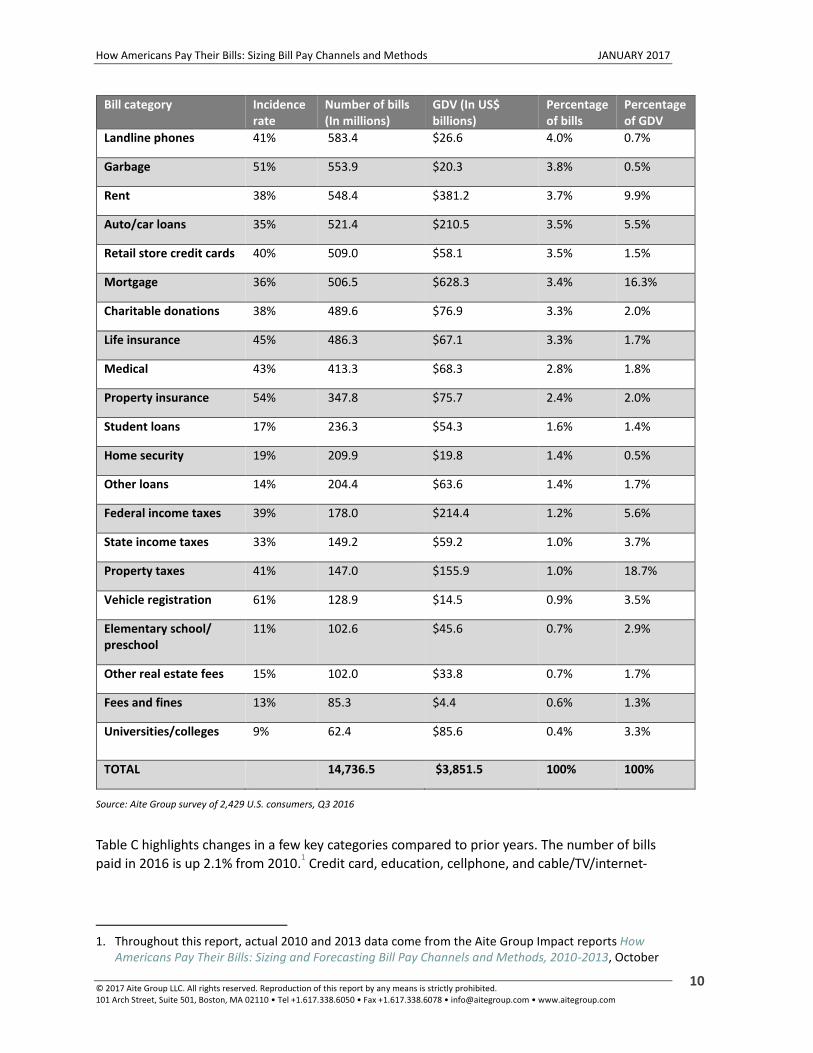
Across the 29 most popular categories of bills, Americans paid approximately 14.7 billion bills in
2016, shelling out roughly US$3.9 trillion. Nearly 3.6 billion of those bills are for utilities
(electricity, water/sewer, gas/oil, and garbage), followed by credit cards and cable/TV/internet
(each with nearly 1.3 billion bills) and cellphones/wireless phones with 1.2 billion bills. In gross
dollar volume (GDV), credit card bills take the biggest chunk of change out of consumers’
wallets, accounting for one in five dollars spent on bills, or nearly US$719 billion. Mortgage
payments represent nearly US$630 billion (Table B).
Table B: Estimated 2016 U.S. Consumer Bill Volume
Bill category Incidence rate
Number of bills (In millions)
GDV (In US$ billions)
Percentage of bills
Percentage of GDV
Electricity 93% 1,327.0 $142.7 9.0% 3.7%
Major credit cards 77% 1,297.5 $718.9 8.8% 18.7%
Cable/TV/internet 88% 1,267.2 $135.7 8.6% 3.5%
Cellphones/wireless phones
83% 1,180.3 $111.0 8.0% 2.9%
Gas/oil 63% 902.9 $63.9 6.1% 1.7%
Water/sewer 68% 819.5 $51.9 5.6% 1.3%
Auto/car insurance 79% 766.9 $129.0 5.2% 3.3%
Health insurance 44% 609.6 $134.5 4.1% 3.5%
How Americans Pay Their Bills: Sizing Bill Pay Channels and Methods JANUARY 2017
© 2017 Aite Group LLC. All rights reserved. Reproduction of this report by any means is strictly prohibited. 101 Arch Street, Suite 501, Boston, MA 02110 • Tel +1.617.338.6050 • Fax +1.617.338.6078 • [email protected] • www.aitegroup.com
10
Bill category Incidence rate
Number of bills (In millions)
GDV (In US$ billions)
Percentage of bills
Percentage of GDV
Landline phones 41% 583.4 $26.6 4.0% 0.7%
Garbage 51% 553.9 $20.3 3.8% 0.5%
Rent 38% 548.4 $381.2 3.7% 9.9%
Auto/car loans 35% 521.4 $210.5 3.5% 5.5%
Retail store credit cards 40% 509.0 $58.1 3.5% 1.5%
Mortgage 36% 506.5 $628.3 3.4% 16.3%
Charitable donations 38% 489.6 $76.9 3.3% 2.0%
Life insurance 45% 486.3 $67.1 3.3% 1.7%
Medical 43% 413.3 $68.3 2.8% 1.8%
Property insurance 54% 347.8 $75.7 2.4% 2.0%
Student loans 17% 236.3 $54.3 1.6% 1.4%
Home security 19% 209.9 $19.8 1.4% 0.5%
Other loans 14% 204.4 $63.6 1.4% 1.7%
Federal income taxes 39% 178.0 $214.4 1.2% 5.6%
State income taxes 33% 149.2 $59.2 1.0% 3.7%
Property taxes 41% 147.0 $155.9 1.0% 18.7%
Vehicle registration 61% 128.9 $14.5 0.9% 3.5%
Elementary school/ preschool
11% 102.6 $45.6 0.7% 2.9%
Other real estate fees 15% 102.0 $33.8 0.7% 1.7%
Fees and fines 13% 85.3 $4.4 0.6% 1.3%
Universities/colleges 9% 62.4 $85.6 0.4% 3.3%
TOTAL 14,736.5 $3,851.5 100% 100%
Source: Aite Group survey of 2,429 U.S. consumers, Q3 2016
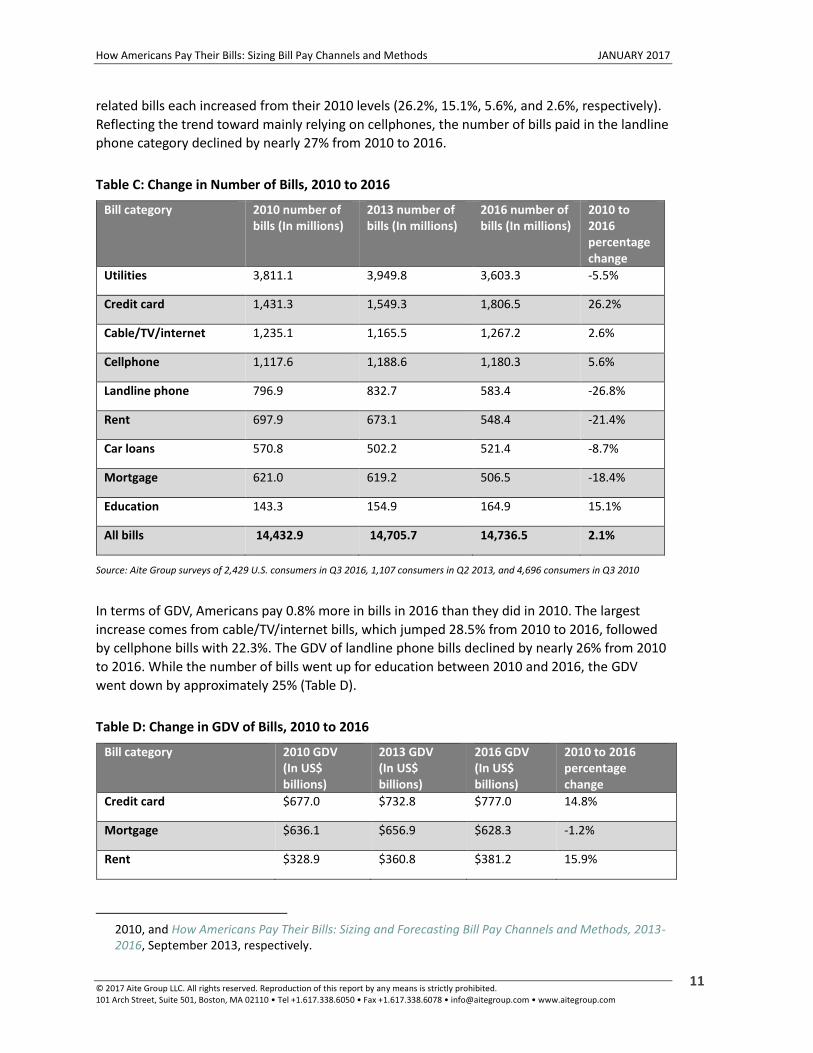
Table C highlights changes in a few key categories compared to prior years. The number of bills
paid in 2016 is up 2.1% from 2010.1 Credit card, education, cellphone, and cable/TV/internet-
1. Throughout this report, actual 2010 and 2013 data come from the Aite Group Impact reports How
Americans Pay Their Bills: Sizing and Forecasting Bill Pay Channels and Methods, 2010-2013, October
How Americans Pay Their Bills: Sizing Bill Pay Channels and Methods JANUARY 2017
© 2017 Aite Group LLC. All rights reserved. Reproduction of this report by any means is strictly prohibited. 101 Arch Street, Suite 501, Boston, MA 02110 • Tel +1.617.338.6050 • Fax +1.617.338.6078 • [email protected] • www.aitegroup.com
11
related bills each increased from their 2010 levels (26.2%, 15.1%, 5.6%, and 2.6%, respectively).
Reflecting the trend toward mainly relying on cellphones, the number of bills paid in the landline
phone category declined by nearly 27% from 2010 to 2016.
Table C: Change in Number of Bills, 2010 to 2016
Bill category 2010 number of bills (In millions)
2013 number of bills (In millions)
2016 number of bills (In millions)
2010 to 2016 percentage change
Utilities 3,811.1 3,949.8 3,603.3 -5.5%
Credit card 1,431.3 1,549.3 1,806.5 26.2%
Cable/TV/internet 1,235.1 1,165.5 1,267.2 2.6%
Cellphone 1,117.6 1,188.6 1,180.3 5.6%
Landline phone 796.9 832.7 583.4 -26.8%
Rent 697.9 673.1 548.4 -21.4%
Car loans 570.8 502.2 521.4 -8.7%
Mortgage 621.0 619.2 506.5 -18.4%
Education 143.3 154.9 164.9 15.1%
All bills 14,432.9 14,705.7 14,736.5 2.1%
Source: Aite Group surveys of 2,429 U.S. consumers in Q3 2016, 1,107 consumers in Q2 2013, and 4,696 consumers in Q3 2010
In terms of GDV, Americans pay 0.8% more in bills in 2016 than they did in 2010. The largest
increase comes from cable/TV/internet bills, which jumped 28.5% from 2010 to 2016, followed
by cellphone bills with 22.3%. The GDV of landline phone bills declined by nearly 26% from 2010
to 2016. While the number of bills went up for education between 2010 and 2016, the GDV
went down by approximately 25% (Table D).
Table D: Change in GDV of Bills, 2010 to 2016
Bill category 2010 GDV (In US$ billions)
2013 GDV (In US$ billions)
2016 GDV (In US$ billions)
2010 to 2016 percentage change
Credit card $677.0 $732.8 $777.0 14.8%
Mortgage $636.1 $656.9 $628.3 -1.2%
Rent $328.9 $360.8 $381.2 15.9%
2010, and How Americans Pay Their Bills: Sizing and Forecasting Bill Pay Channels and Methods, 2013-2016, September 2013, respectively.

How Americans Pay Their Bills: Sizing Bill Pay Channels and Methods JANUARY 2017
© 2017 Aite Group LLC. All rights reserved. Reproduction of this report by any means is strictly prohibited. 101 Arch Street, Suite 501, Boston, MA 02110 • Tel +1.617.338.6050 • Fax +1.617.338.6078 • [email protected] • www.aitegroup.com
12
Bill category 2010 GDV (In US$ billions)
2013 GDV (In US$ billions)
2016 GDV (In US$ billions)
2010 to 2016 percentage change
Utilities $300.1 $321.9 $278.8 -7.1%
Car loans $220.6 $227.0 $210.5 -4.6%
Cable/TV/internet $105.6 $149.2 $135.7 28.5%
Education $175.3 $189.6 $131.1 -25.2%
Cellphone $90.7 $96.3 $111.0 22.3%
Landline phone $36.0 $37.5 $26.6 -26.0%
All bills $3,588.8 $3,807.6 $3,851.5 0.8%
Source: Aite Group surveys of 2,429 U.S. consumers in Q3 2016, 1,107 consumers in Q2 2013, and 4,696 consumers in Q3 2010
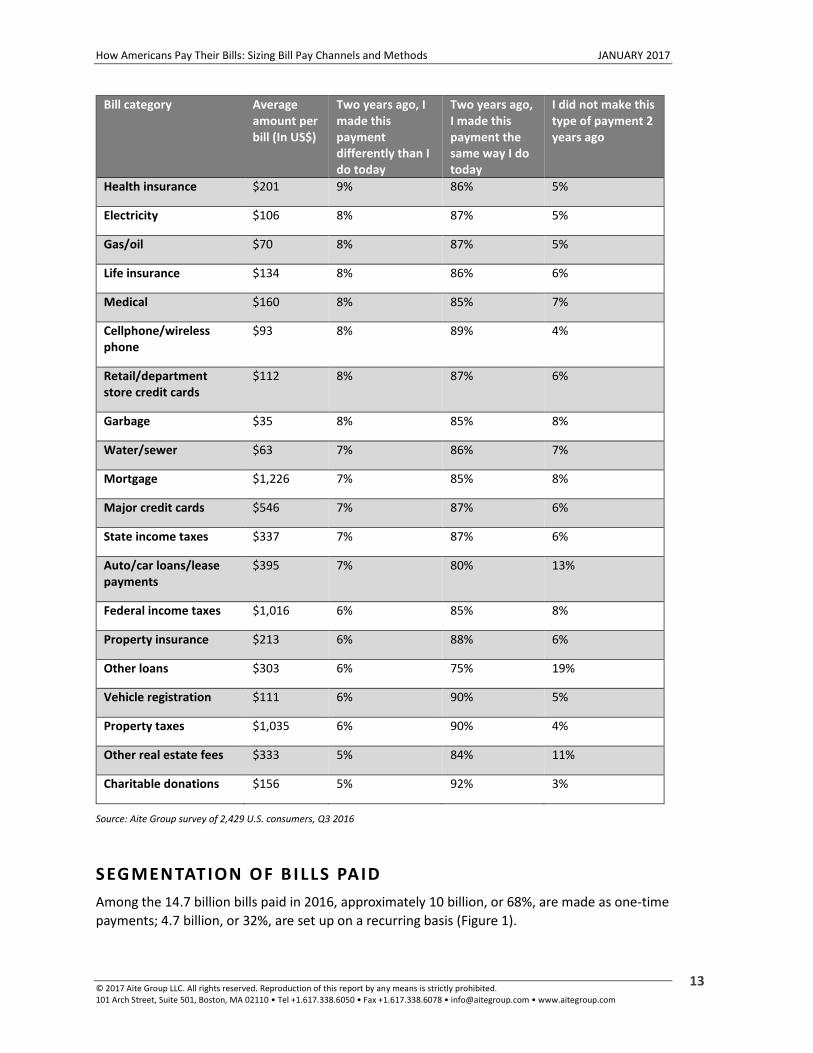
AVERAGE AMOUNT PER B ILL
The top five bill categories with the highest average amount per bill are mortgage payments
(US$1,226), university/college payments (US$1,218), property taxes (US$1,035), federal income
taxes (US$1,016), and rent payments (US$689). Fifteen percent of fees and fines, 14% of
elementary school/preschool payments, and 14% of university/college payments were made
differently two years ago (Table E).
Table E: 2016 Average Bill Amount and Change in How Payment Is Made From Two Years Ago
Bill category Average amount per bill (In US$)
Two years ago, I made this payment differently than I do today
Two years ago, I made this payment the same way I do today
I did not make this type of payment 2 years ago
Fees and fines $49 15% 67% 18%
Elementary school/ preschool
$437 14% 75% 11%
Universities/colleges $1,218 14% 67% 20%
Home security $93 13% 77% 9%
Student loans $220 10% 71% 18%
Rent $689 10% 76% 14%
Cable/satellite TV/internet
$106 10% 82% 9%
Landline phones $44 9% 87% 4%
Auto/car insurance $167 9% 86% 5%
How Americans Pay Their Bills: Sizing Bill Pay Channels and Methods JANUARY 2017
© 2017 Aite Group LLC. All rights reserved. Reproduction of this report by any means is strictly prohibited. 101 Arch Street, Suite 501, Boston, MA 02110 • Tel +1.617.338.6050 • Fax +1.617.338.6078 • [email protected] • www.aitegroup.com
13
Bill category Average amount per bill (In US$)
Two years ago, I made this payment differently than I do today
Two years ago, I made this payment the same way I do today
I did not make this type of payment 2 years ago
Health insurance $201 9% 86% 5%
Electricity $106 8% 87% 5%
Gas/oil $70 8% 87% 5%
Life insurance $134 8% 86% 6%
Medical $160 8% 85% 7%
Cellphone/wireless phone
$93 8% 89% 4%
Retail/department store credit cards
$112 8% 87% 6%
Garbage $35 8% 85% 8%
Water/sewer $63 7% 86% 7%
Mortgage $1,226 7% 85% 8%
Major credit cards $546 7% 87% 6%
State income taxes $337 7% 87% 6%
Auto/car loans/lease payments
$395 7% 80% 13%
Federal income taxes $1,016 6% 85% 8%
Property insurance $213 6% 88% 6%
Other loans $303 6% 75% 19%
Vehicle registration $111 6% 90% 5%
Property taxes $1,035 6% 90% 4%
Other real estate fees $333 5% 84% 11%
Charitable donations $156 5% 92% 3%
Source: Aite Group survey of 2,429 U.S. consumers, Q3 2016
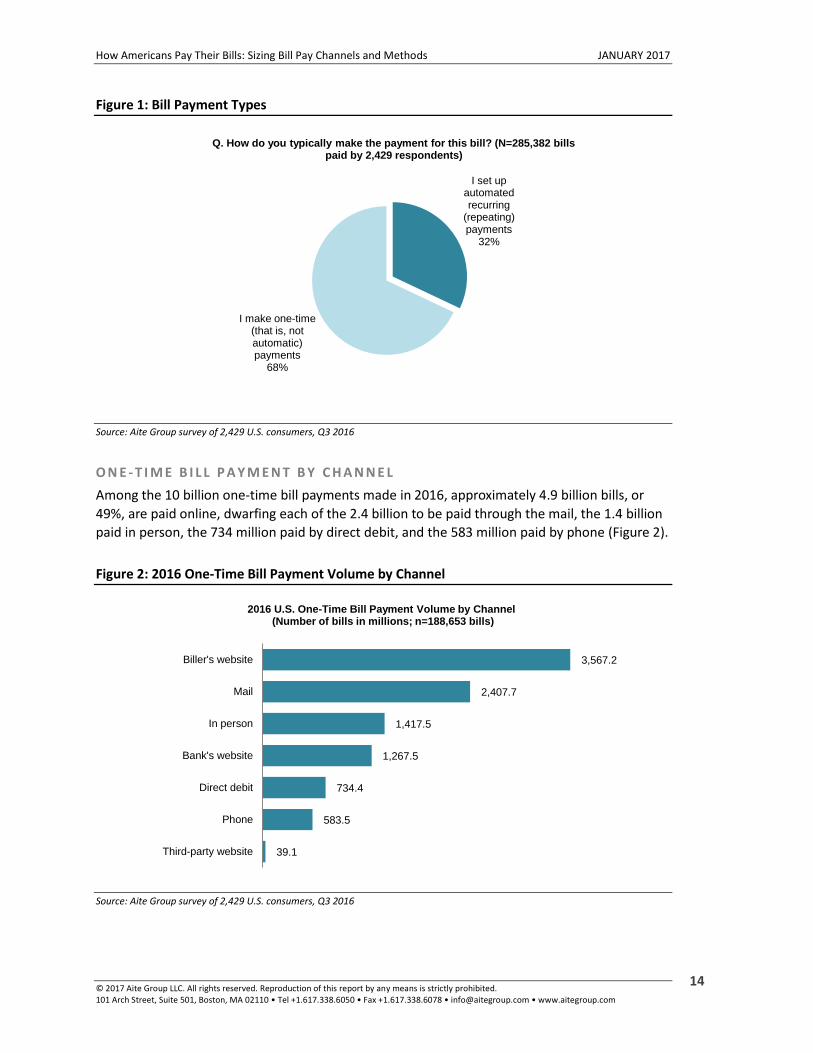
SEG MENTATION OF B ILLS PAID
Among the 14.7 billion bills paid in 2016, approximately 10 billion, or 68%, are made as one-time
payments; 4.7 billion, or 32%, are set up on a recurring basis (Figure 1).
How Americans Pay Their Bills: Sizing Bill Pay Channels and Methods JANUARY 2017
© 2017 Aite Group LLC. All rights reserved. Reproduction of this report by any means is strictly prohibited. 101 Arch Street, Suite 501, Boston, MA 02110 • Tel +1.617.338.6050 • Fax +1.617.338.6078 • [email protected] • www.aitegroup.com
14
Figure 1: Bill Payment Types
Source: Aite Group survey of 2,429 U.S. consumers, Q3 2016
O N E - T I M E B I L L P A Y M E N T B Y C H A N N E L
Among the 10 billion one-time bill payments made in 2016, approximately 4.9 billion bills, or
49%, are paid online, dwarfing each of the 2.4 billion to be paid through the mail, the 1.4 billion
paid in person, the 734 million paid by direct debit, and the 583 million paid by phone (Figure 2).
Figure 2: 2016 One-Time Bill Payment Volume by Channel
Source: Aite Group survey of 2,429 U.S. consumers, Q3 2016
I set up automated recurring
(repeating) payments
32%
I make one-time (that is, not automatic) payments
68%
Q. How do you typically make the payment for this bill? (N=285,382 bills paid by 2,429 respondents)
39.1
583.5
734.4
1,267.5
1,417.5
2,407.7
3,567.2
Third-party website
Phone
Direct debit
Bank's website
In person
Biller's website
2016 U.S. One-Time Bill Payment Volume by Channel(Number of bills in millions; n=188,653 bills)
How Americans Pay Their Bills: Sizing Bill Pay Channels and Methods JANUARY 2017
© 2017 Aite Group LLC. All rights reserved. Reproduction of this report by any means is strictly prohibited. 101 Arch Street, Suite 501, Boston, MA 02110 • Tel +1.617.338.6050 • Fax +1.617.338.6078 • [email protected] • www.aitegroup.com
15
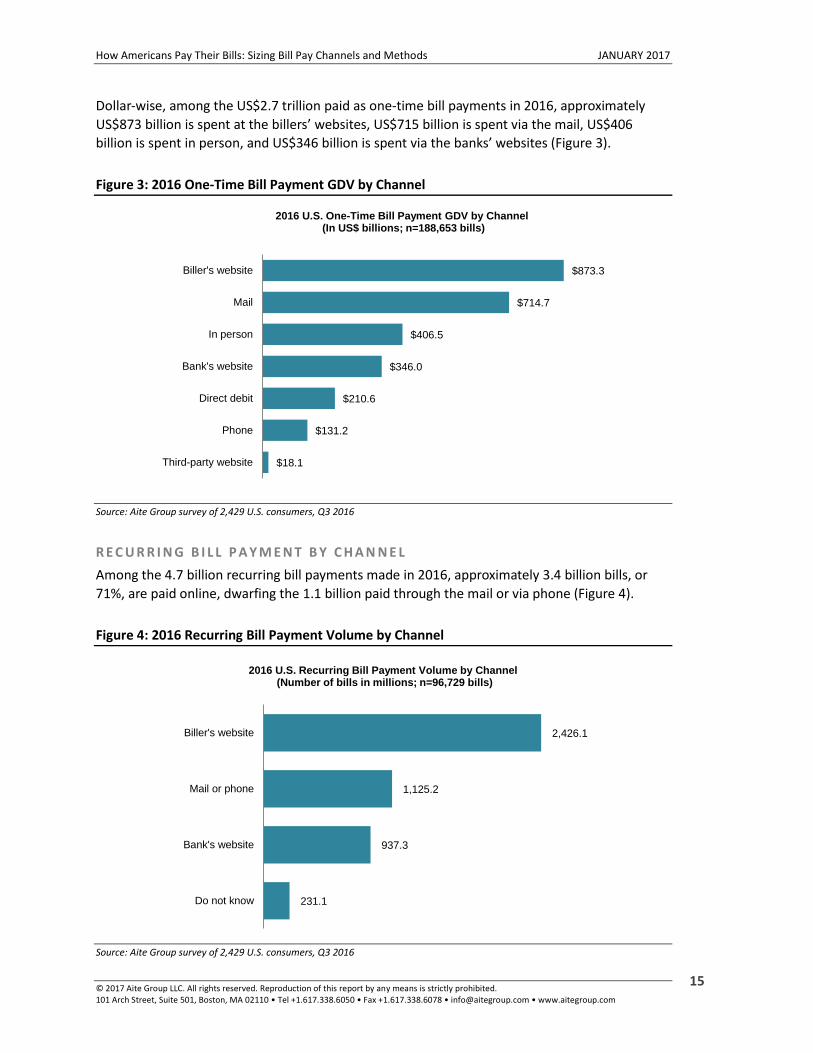
Dollar-wise, among the US$2.7 trillion paid as one-time bill payments in 2016, approximately
US$873 billion is spent at the billers’ websites, US$715 billion is spent via the mail, US$406
billion is spent in person, and US$346 billion is spent via the banks’ websites (Figure 3).
Figure 3: 2016 One-Time Bill Payment GDV by Channel
Source: Aite Group survey of 2,429 U.S. consumers, Q3 2016
R E C U R R I N G B I L L P A Y M E N T B Y C H A N N E L
Among the 4.7 billion recurring bill payments made in 2016, approximately 3.4 billion bills, or
71%, are paid online, dwarfing the 1.1 billion paid through the mail or via phone (Figure 4).
Figure 4: 2016 Recurring Bill Payment Volume by Channel
Source: Aite Group survey of 2,429 U.S. consumers, Q3 2016
$18.1
$131.2
$210.6
$346.0
$406.5
$714.7
$873.3
Third-party website
Phone
Direct debit
Bank's website
In person
Biller's website
2016 U.S. One-Time Bill Payment GDV by Channel(In US$ billions; n=188,653 bills)
231.1
937.3
1,125.2
2,426.1
Do not know
Bank's website
Mail or phone
Biller's website
2016 U.S. Recurring Bill Payment Volume by Channel(Number of bills in millions; n=96,729 bills)
How Americans Pay Their Bills: Sizing Bill Pay Channels and Methods JANUARY 2017
© 2017 Aite Group LLC. All rights reserved. Reproduction of this report by any means is strictly prohibited. 101 Arch Street, Suite 501, Boston, MA 02110 • Tel +1.617.338.6050 • Fax +1.617.338.6078 • [email protected] • www.aitegroup.com
16
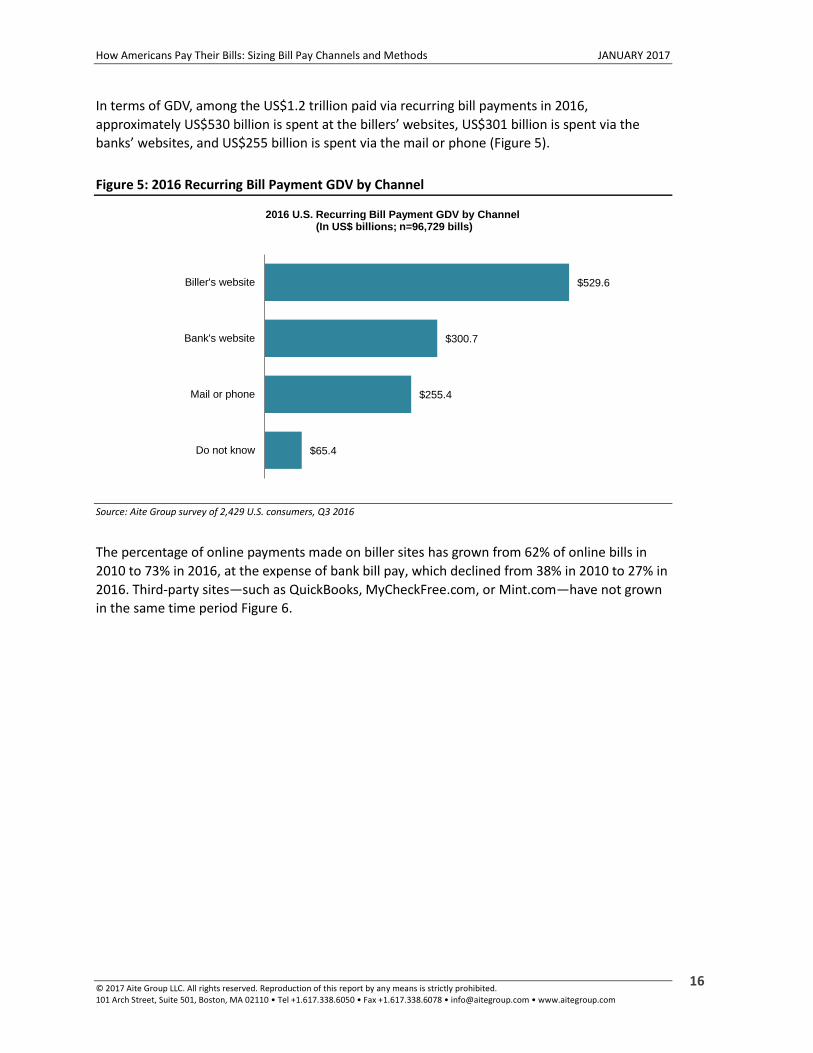
In terms of GDV, among the US$1.2 trillion paid via recurring bill payments in 2016,
approximately US$530 billion is spent at the billers’ websites, US$301 billion is spent via the
banks’ websites, and US$255 billion is spent via the mail or phone (Figure 5).
Figure 5: 2016 Recurring Bill Payment GDV by Channel
Source: Aite Group survey of 2,429 U.S. consumers, Q3 2016
The percentage of online payments made on biller sites has grown from 62% of online bills in
2010 to 73% in 2016, at the expense of bank bill pay, which declined from 38% in 2010 to 27% in
2016. Third-party sites—such as QuickBooks, MyCheckFree.com, or Mint.com—have not grown
in the same time period Figure 6.
$65.4
$255.4
$300.7
$529.6
Do not know
Mail or phone
Bank's website
Biller's website
2016 U.S. Recurring Bill Payment GDV by Channel(In US$ billions; n=96,729 bills)

How Americans Pay Their Bills: Sizing Bill Pay Channels and Methods JANUARY 2017
© 2017 Aite Group LLC. All rights reserved. Reproduction of this report by any means is strictly prohibited. 101 Arch Street, Suite 501, Boston, MA 02110 • Tel +1.617.338.6050 • Fax +1.617.338.6078 • [email protected] • www.aitegroup.com
17
Figure 6: Percentage of Online Bill Volume by Type of Site
Source: Aite Group surveys of 2,429 U.S. consumers in Q3 2016, 1,107 consumers in Q2 2013, and 4,696 consumers in Q3 2010
B I L L P A Y M E N T B Y M E T H O D
Payments made through ACH exceed 6.8 billion in 2016. Americans write slightly more than 2.5
billion checks to pay their bills in 2016, but they provide their debit card information to pay more
than 2.2 billion bills and their credit card information to pay another 2.2 billion bills (Figure 7).
Figure 7: 2016 Bill Volume by Method
Source: Aite Group survey of 2,429 U.S. consumers, Q3 2016
62%69% 73%
38% 30% 27%
2% 0.5%
2010 (n=225,310 bills) 2013 (n=3,566 bill types) 2016 (n=162,265 bills)
Percentage of Online Bill Volume by Type of Site, 2010 vs. 2013 vs. 2016
Third-partywebsite
Bank website
Biller website
126.3
276.6
523.7
2,223.1
2,246.8
2,538.7
6,801.3
Prepaid debit card
Money order
Cash
Credit card
Debit card
Check
ACH
2016 U.S. Bill Payment Volume by Method of Payment(Number of bills in millions; N=285,382 bills)
How Americans Pay Their Bills: Sizing Bill Pay Channels and Methods JANUARY 2017
© 2017 Aite Group LLC. All rights reserved. Reproduction of this report by any means is strictly prohibited. 101 Arch Street, Suite 501, Boston, MA 02110 • Tel +1.617.338.6050 • Fax +1.617.338.6078 • [email protected] • www.aitegroup.com
18
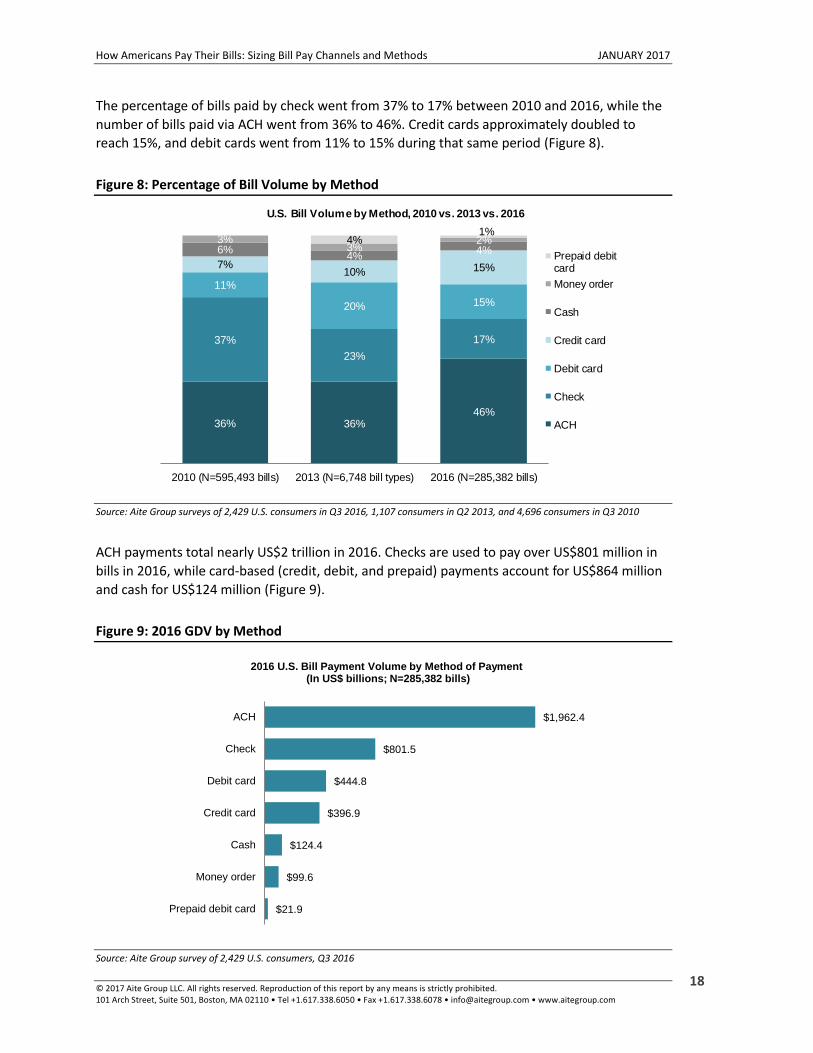
The percentage of bills paid by check went from 37% to 17% between 2010 and 2016, while the
number of bills paid via ACH went from 36% to 46%. Credit cards approximately doubled to
reach 15%, and debit cards went from 11% to 15% during that same period (Figure 8).
Figure 8: Percentage of Bill Volume by Method
Source: Aite Group surveys of 2,429 U.S. consumers in Q3 2016, 1,107 consumers in Q2 2013, and 4,696 consumers in Q3 2010
ACH payments total nearly US$2 trillion in 2016. Checks are used to pay over US$801 million in
bills in 2016, while card-based (credit, debit, and prepaid) payments account for US$864 million
and cash for US$124 million (Figure 9).
Figure 9: 2016 GDV by Method
Source: Aite Group survey of 2,429 U.S. consumers, Q3 2016
36% 36%46%
37%
23%
17%
11%
20% 15%
7%10% 15%
6%4%
4%3%
3%2%4%1%
2010 (N=595,493 bills) 2013 (N=6,748 bill types) 2016 (N=285,382 bills)
U.S. Bill Volume by Method, 2010 vs. 2013 vs. 2016
Prepaid debitcard
Money order
Cash
Credit card
Debit card
Check
ACH
$21.9
$99.6
$124.4
$396.9
$444.8
$801.5
$1,962.4
Prepaid debit card
Money order
Cash
Credit card
Debit card
Check
ACH
2016 U.S. Bill Payment Volume by Method of Payment(In US$ billions; N=285,382 bills)
How Americans Pay Their Bills: Sizing Bill Pay Channels and Methods JANUARY 2017
© 2017 Aite Group LLC. All rights reserved. Reproduction of this report by any means is strictly prohibited. 101 Arch Street, Suite 501, Boston, MA 02110 • Tel +1.617.338.6050 • Fax +1.617.338.6078 • [email protected] • www.aitegroup.com
19
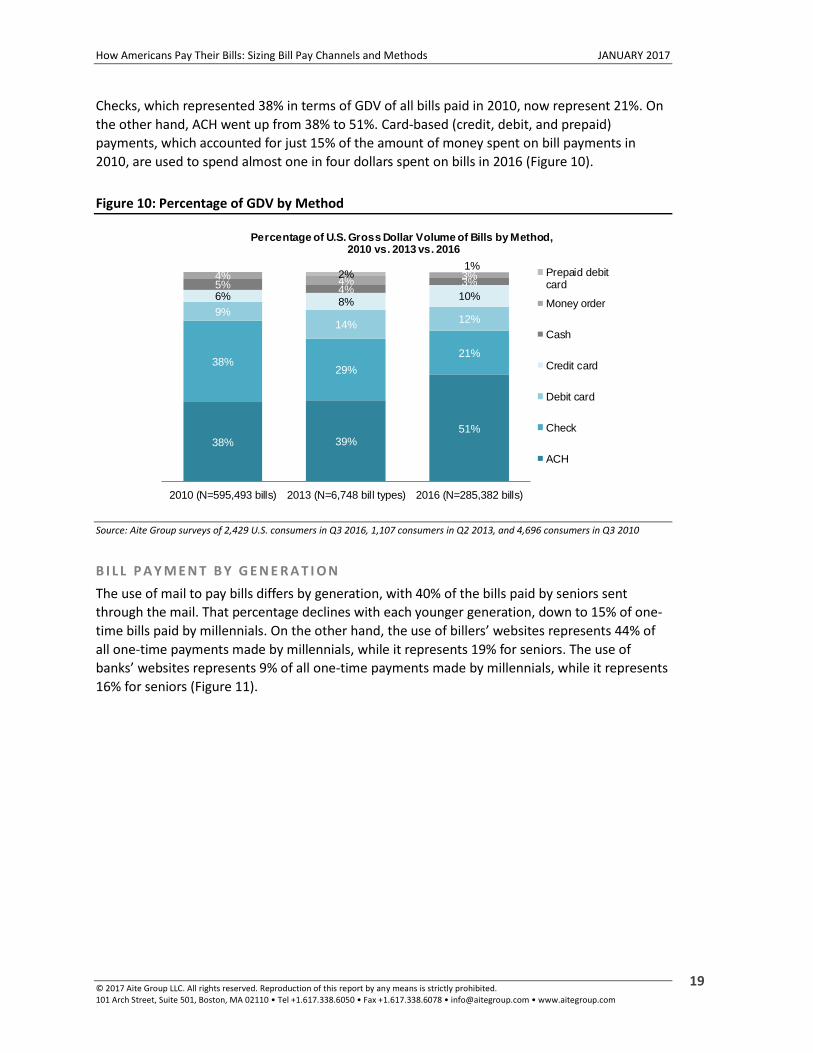
Checks, which represented 38% in terms of GDV of all bills paid in 2010, now represent 21%. On
the other hand, ACH went up from 38% to 51%. Card-based (credit, debit, and prepaid)
payments, which accounted for just 15% of the amount of money spent on bill payments in
2010, are used to spend almost one in four dollars spent on bills in 2016 (Figure 10).
Figure 10: Percentage of GDV by Method
Source: Aite Group surveys of 2,429 U.S. consumers in Q3 2016, 1,107 consumers in Q2 2013, and 4,696 consumers in Q3 2010
B I L L P A Y M E N T B Y G E N E R A T I O N
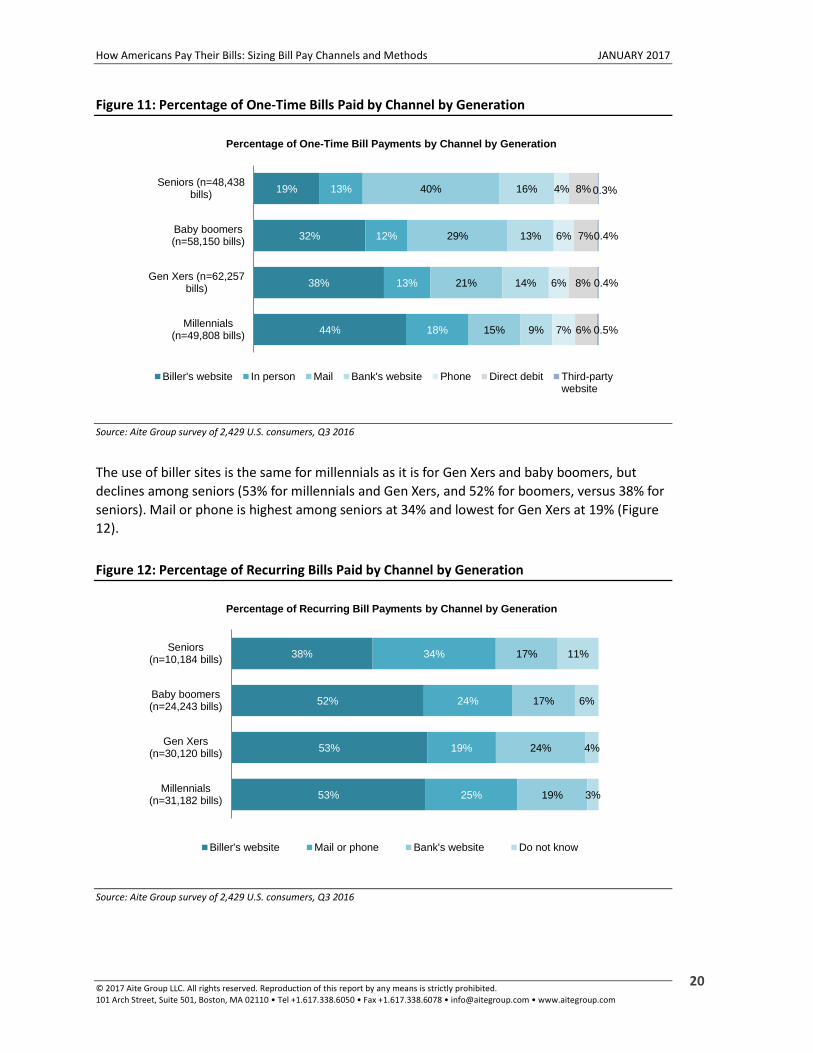
The use of mail to pay bills differs by generation, with 40% of the bills paid by seniors sent
through the mail. That percentage declines with each younger generation, down to 15% of one-
time bills paid by millennials. On the other hand, the use of billers’ websites represents 44% of
all one-time payments made by millennials, while it represents 19% for seniors. The use of
banks’ websites represents 9% of all one-time payments made by millennials, while it represents
16% for seniors (Figure 11).
38% 39%51%
38%29%
21%
9%14%
12%
6%8%
10%5% 4%
3%4%
4% 3%2%1%
2010 (N=595,493 bills) 2013 (N=6,748 bill types) 2016 (N=285,382 bills)
Percentage of U.S. Gross Dollar Volume of Bills by Method,2010 vs. 2013 vs. 2016
Prepaid debitcard
Money order
Cash
Credit card
Debit card
Check
ACH
How Americans Pay Their Bills: Sizing Bill Pay Channels and Methods JANUARY 2017
© 2017 Aite Group LLC. All rights reserved. Reproduction of this report by any means is strictly prohibited. 101 Arch Street, Suite 501, Boston, MA 02110 • Tel +1.617.338.6050 • Fax +1.617.338.6078 • [email protected] • www.aitegroup.com
20
Figure 11: Percentage of One-Time Bills Paid by Channel by Generation
Source: Aite Group survey of 2,429 U.S. consumers, Q3 2016
The use of biller sites is the same for millennials as it is for Gen Xers and baby boomers, but
declines among seniors (53% for millennials and Gen Xers, and 52% for boomers, versus 38% for
seniors). Mail or phone is highest among seniors at 34% and lowest for Gen Xers at 19% (Figure
12).
Figure 12: Percentage of Recurring Bills Paid by Channel by Generation
Source: Aite Group survey of 2,429 U.S. consumers, Q3 2016
44%
38%
32%
19%
18%
13%
12%
13%
15%
21%
29%
40%
9%
14%
13%
16%
7%
6%
6%
4%
6%
8%
7%
8%
0.5%
0.4%
0.4%
0.3%
Millennials(n=49,808 bills)
Gen Xers (n=62,257bills)
Baby boomers(n=58,150 bills)
Seniors (n=48,438bills)
Percentage of One-Time Bill Payments by Channel by Generation
Biller's website In person Mail Bank's website Phone Direct debit Third-partywebsite
53%
53%
52%
38%
25%
19%
24%
34%
19%
24%
17%
17%
3%
4%
6%
11%
Millennials(n=31,182 bills)
Gen Xers(n=30,120 bills)
Baby boomers(n=24,243 bills)
Seniors(n=10,184 bills)
Percentage of Recurring Bill Payments by Channel by Generation
Biller's website Mail or phone Bank's website Do not know
How Americans Pay Their Bills: Sizing Bill Pay Channels and Methods JANUARY 2017
© 2017 Aite Group LLC. All rights reserved. Reproduction of this report by any means is strictly prohibited. 101 Arch Street, Suite 501, Boston, MA 02110 • Tel +1.617.338.6050 • Fax +1.617.338.6078 • [email protected] • www.aitegroup.com
21
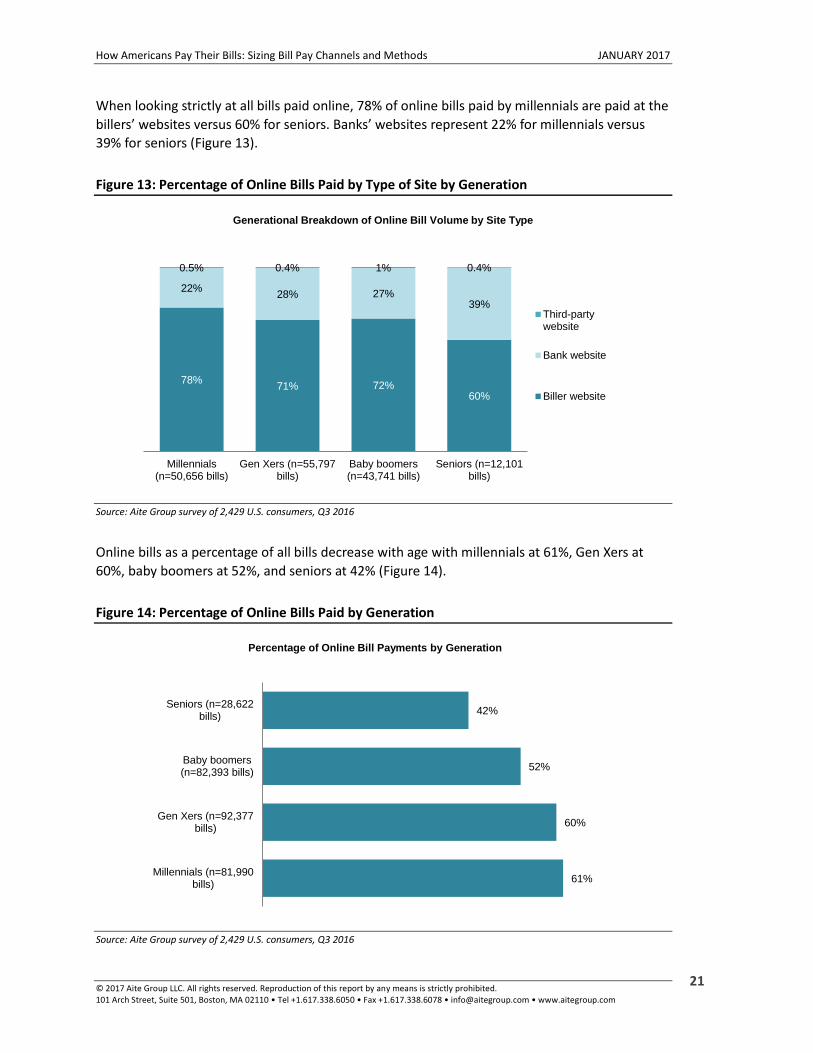
When looking strictly at all bills paid online, 78% of online bills paid by millennials are paid at the
billers’ websites versus 60% for seniors. Banks’ websites represent 22% for millennials versus
39% for seniors (Figure 13).
Figure 13: Percentage of Online Bills Paid by Type of Site by Generation
Source: Aite Group survey of 2,429 U.S. consumers, Q3 2016
Online bills as a percentage of all bills decrease with age with millennials at 61%, Gen Xers at
60%, baby boomers at 52%, and seniors at 42% (Figure 14).
Figure 14: Percentage of Online Bills Paid by Generation
Source: Aite Group survey of 2,429 U.S. consumers, Q3 2016
78%71% 72%
60%
22%28% 27%
39%
0.5% 0.4% 1% 0.4%
Millennials(n=50,656 bills)
Gen Xers (n=55,797bills)
Baby boomers(n=43,741 bills)
Seniors (n=12,101bills)
Generational Breakdown of Online Bill Volume by Site Type
Third-partywebsite
Bank website
Biller website
61%
60%
52%
42%
Millennials (n=81,990bills)
Gen Xers (n=92,377bills)
Baby boomers(n=82,393 bills)
Seniors (n=28,622bills)
Percentage of Online Bill Payments by Generation

How Americans Pay Their Bills: Sizing Bill Pay Channels and Methods JANUARY 2017
© 2017 Aite Group LLC. All rights reserved. Reproduction of this report by any means is strictly prohibited. 101 Arch Street, Suite 501, Boston, MA 02110 • Tel +1.617.338.6050 • Fax +1.617.338.6078 • [email protected] • www.aitegroup.com
22
In terms of payment methods, seniors pay a larger percentage of bills using checks than do
younger generations: 31% for seniors versus 23% for baby boomers, 15% for Gen Xers, and only
8% for millennials. Millennials and Gen Xers, however, pay more of their bills using debit cards
than older consumers do: 22% and 16%, respectively, versus 11% for baby boomers and 5% for
seniors. All other methods of payment remain fairly consistent across generations (Figure 15).
Figure 15: 2016 Percentage of Bills Paid by Method by Generation
Source: Aite Group survey of 2,429 U.S. consumers, Q3 2016
44% 47% 47% 48%
22% 16%11% 5%
18%15%
13%13%
8%15%
23% 31%
4% 4% 3%2%2% 3% 2%1% 1% 1%
Millennials(n=81,990 bills)
Gen Xers(n=92,377 bills)
Baby boomers(n=82,393 bills)
Seniors (n=28,622bills)
Percentage of Bill Payments by Instrument by Generation
Prepaid debitcard
Money order
Cash
Check
Credit card
Debit card
ACH
How Americans Pay Their Bills: Sizing Bill Pay Channels and Methods JANUARY 2017
© 2017 Aite Group LLC. All rights reserved. Reproduction of this report by any means is strictly prohibited. 101 Arch Street, Suite 501, Boston, MA 02110 • Tel +1.617.338.6050 • Fax +1.617.338.6078 • [email protected] • www.aitegroup.com
23
BILL PAYMENT BY BILL CATEGORY
This section of the report breaks down the data across the 29 most popular categories of bills for
both one-time and recurring bill payments.
CABLE/TV/INTERNET
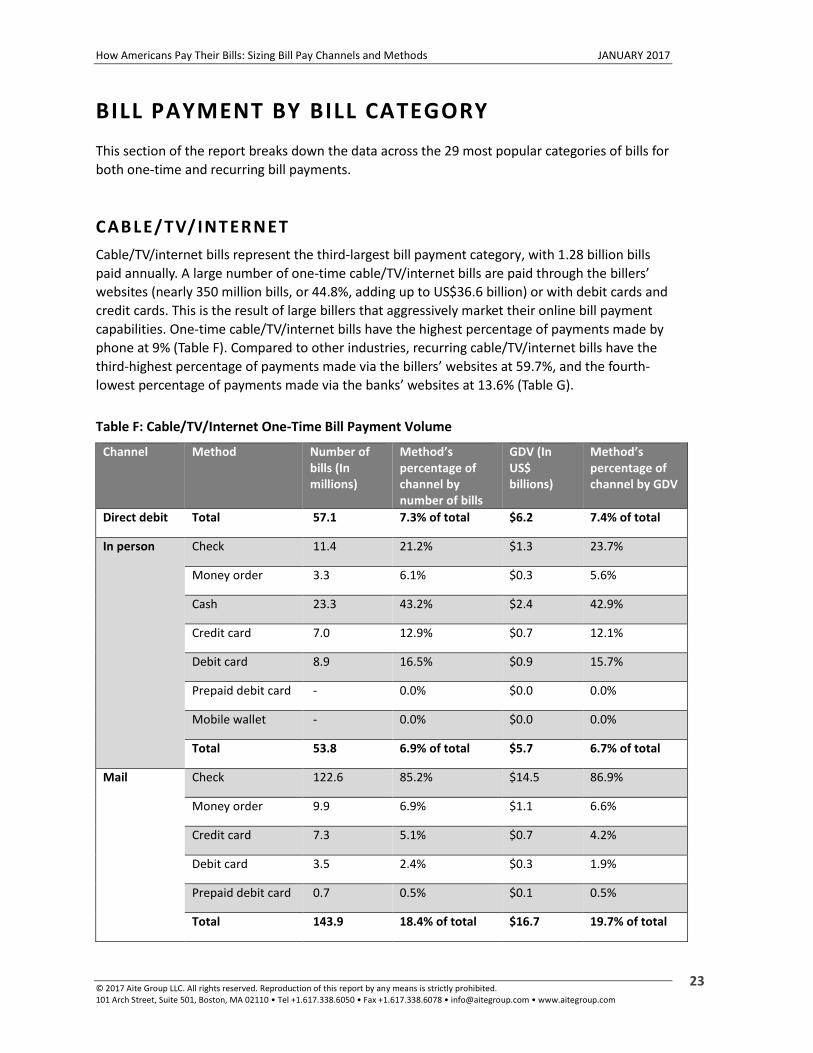
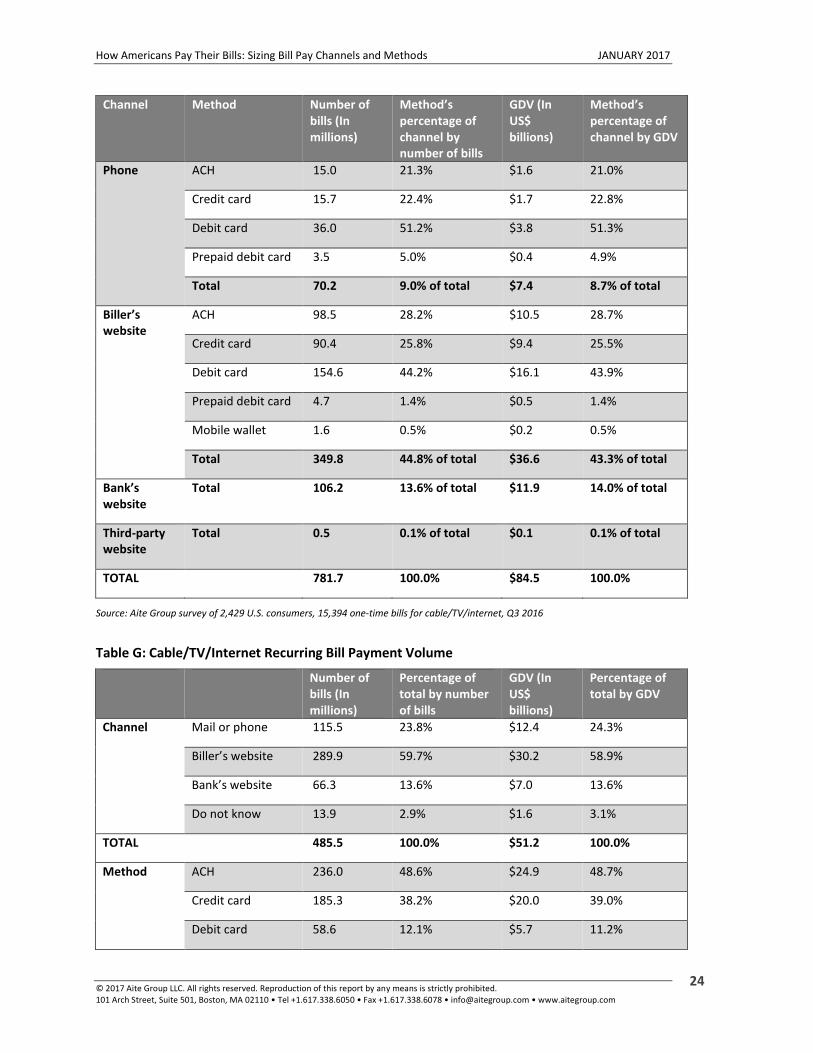
Cable/TV/internet bills represent the third-largest bill payment category, with 1.28 billion bills
paid annually. A large number of one-time cable/TV/internet bills are paid through the billers’
websites (nearly 350 million bills, or 44.8%, adding up to US$36.6 billion) or with debit cards and
credit cards. This is the result of large billers that aggressively market their online bill payment
capabilities. One-time cable/TV/internet bills have the highest percentage of payments made by
phone at 9% (Table F). Compared to other industries, recurring cable/TV/internet bills have the
third-highest percentage of payments made via the billers’ websites at 59.7%, and the fourth-
lowest percentage of payments made via the banks’ websites at 13.6% (Table G).
Table F: Cable/TV/Internet One-Time Bill Payment Volume
Channel Method Number of bills (In millions)
Method’s percentage of channel by number of bills
GDV (In US$ billions)
Method’s percentage of channel by GDV
Direct debit Total 57.1 7.3% of total $6.2 7.4% of total
In person Check 11.4 21.2% $1.3 23.7%
Money order 3.3 6.1% $0.3 5.6%
Cash 23.3 43.2% $2.4 42.9%
Credit card 7.0 12.9% $0.7 12.1%
Debit card 8.9 16.5% $0.9 15.7%
Prepaid debit card - 0.0% $0.0 0.0%
Mobile wallet - 0.0% $0.0 0.0%
Total 53.8 6.9% of total $5.7 6.7% of total
Mail Check 122.6 85.2% $14.5 86.9%
Money order 9.9 6.9% $1.1 6.6%
Credit card 7.3 5.1% $0.7 4.2%
Debit card 3.5 2.4% $0.3 1.9%
Prepaid debit card 0.7 0.5% $0.1 0.5%
Total 143.9 18.4% of total $16.7 19.7% of total
How Americans Pay Their Bills: Sizing Bill Pay Channels and Methods JANUARY 2017
© 2017 Aite Group LLC. All rights reserved. Reproduction of this report by any means is strictly prohibited. 101 Arch Street, Suite 501, Boston, MA 02110 • Tel +1.617.338.6050 • Fax +1.617.338.6078 • [email protected] • www.aitegroup.com
24
Channel Method Number of bills (In millions)
Method’s percentage of channel by number of bills
GDV (In US$ billions)
Method’s percentage of channel by GDV
Phone ACH 15.0 21.3% $1.6 21.0%
Credit card 15.7 22.4% $1.7 22.8%
Debit card 36.0 51.2% $3.8 51.3%
Prepaid debit card 3.5 5.0% $0.4 4.9%
Total 70.2 9.0% of total $7.4 8.7% of total
Biller’s website
ACH 98.5 28.2% $10.5 28.7%
Credit card 90.4 25.8% $9.4 25.5%
Debit card 154.6 44.2% $16.1 43.9%
Prepaid debit card 4.7 1.4% $0.5 1.4%
Mobile wallet 1.6 0.5% $0.2 0.5%
Total 349.8 44.8% of total $36.6 43.3% of total
Bank’s website
Total 106.2 13.6% of total $11.9 14.0% of total
Third-party website
Total 0.5 0.1% of total $0.1 0.1% of total
TOTAL 781.7 100.0% $84.5 100.0%
Source: Aite Group survey of 2,429 U.S. consumers, 15,394 one-time bills for cable/TV/internet, Q3 2016
Table G: Cable/TV/Internet Recurring Bill Payment Volume
Number of bills (In millions)
Percentage of total by number of bills
GDV (In US$ billions)
Percentage of total by GDV
Channel Mail or phone 115.5 23.8% $12.4 24.3%
Biller’s website 289.9 59.7% $30.2 58.9%
Bank’s website 66.3 13.6% $7.0 13.6%
Do not know 13.9 2.9% $1.6 3.1%
TOTAL 485.5 100.0% $51.2 100.0%
Method ACH 236.0 48.6% $24.9 48.7%
Credit card 185.3 38.2% $20.0 39.0%
Debit card 58.6 12.1% $5.7 11.2%
How Americans Pay Their Bills: Sizing Bill Pay Channels and Methods JANUARY 2017
© 2017 Aite Group LLC. All rights reserved. Reproduction of this report by any means is strictly prohibited. 101 Arch Street, Suite 501, Boston, MA 02110 • Tel +1.617.338.6050 • Fax +1.617.338.6078 • [email protected] • www.aitegroup.com
25
Number of bills (In millions)
Percentage of total by number of bills
GDV (In US$ billions)
Percentage of total by GDV
Prepaid debit card 5.6 1.2% $0.5 1.1%
TOTAL 485.5 100.0% $51.2 100.0%
Source: Aite Group survey of 2,429 U.S. consumers, 9,288 recurring bills for cable/TV/internet, Q3 2016
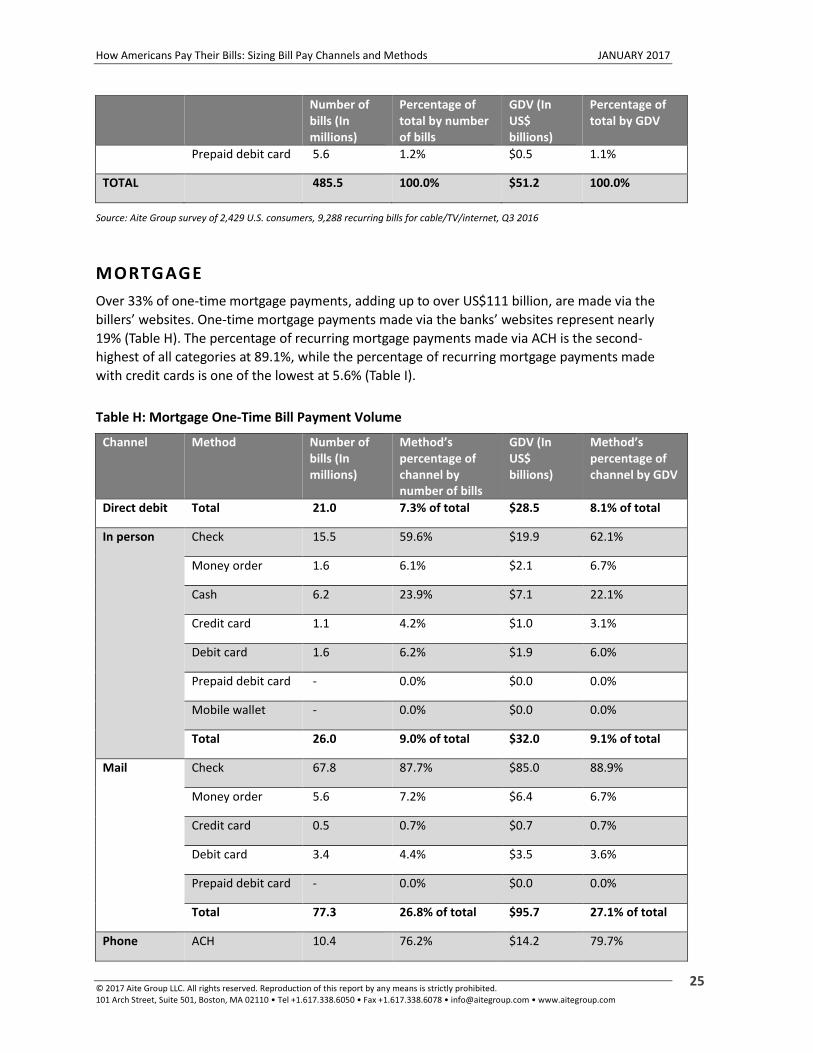
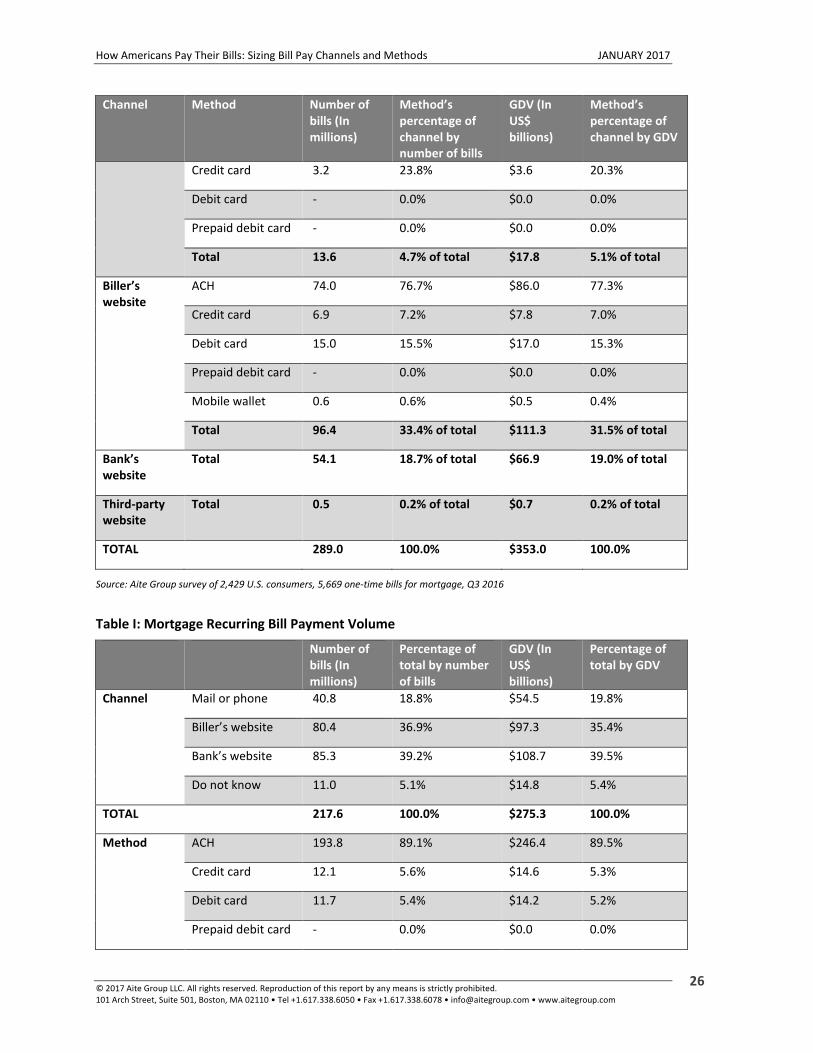
MORTGAGE
Over 33% of one-time mortgage payments, adding up to over US$111 billion, are made via the
billers’ websites. One-time mortgage payments made via the banks’ websites represent nearly
19% (Table H). The percentage of recurring mortgage payments made via ACH is the second-
highest of all categories at 89.1%, while the percentage of recurring mortgage payments made
with credit cards is one of the lowest at 5.6% (Table I).
Table H: Mortgage One-Time Bill Payment Volume
Channel Method Number of bills (In millions)
Method’s percentage of channel by number of bills
GDV (In US$ billions)
Method’s percentage of channel by GDV
Direct debit Total 21.0 7.3% of total $28.5 8.1% of total
In person Check 15.5 59.6% $19.9 62.1%
Money order 1.6 6.1% $2.1 6.7%
Cash 6.2 23.9% $7.1 22.1%
Credit card 1.1 4.2% $1.0 3.1%
Debit card 1.6 6.2% $1.9 6.0%
Prepaid debit card - 0.0% $0.0 0.0%
Mobile wallet - 0.0% $0.0 0.0%
Total 26.0 9.0% of total $32.0 9.1% of total
Mail Check 67.8 87.7% $85.0 88.9%
Money order 5.6 7.2% $6.4 6.7%
Credit card 0.5 0.7% $0.7 0.7%
Debit card 3.4 4.4% $3.5 3.6%
Prepaid debit card - 0.0% $0.0 0.0%
Total 77.3 26.8% of total $95.7 27.1% of total
Phone ACH 10.4 76.2% $14.2 79.7%
How Americans Pay Their Bills: Sizing Bill Pay Channels and Methods JANUARY 2017
© 2017 Aite Group LLC. All rights reserved. Reproduction of this report by any means is strictly prohibited. 101 Arch Street, Suite 501, Boston, MA 02110 • Tel +1.617.338.6050 • Fax +1.617.338.6078 • [email protected] • www.aitegroup.com
26
Channel Method Number of bills (In millions)
Method’s percentage of channel by number of bills
GDV (In US$ billions)
Method’s percentage of channel by GDV
Credit card 3.2 23.8% $3.6 20.3%
Debit card - 0.0% $0.0 0.0%
Prepaid debit card - 0.0% $0.0 0.0%
Total 13.6 4.7% of total $17.8 5.1% of total
Biller’s website
ACH 74.0 76.7% $86.0 77.3%
Credit card 6.9 7.2% $7.8 7.0%
Debit card 15.0 15.5% $17.0 15.3%
Prepaid debit card - 0.0% $0.0 0.0%
Mobile wallet 0.6 0.6% $0.5 0.4%
Total 96.4 33.4% of total $111.3 31.5% of total
Bank’s website
Total 54.1 18.7% of total $66.9 19.0% of total
Third-party website
Total 0.5 0.2% of total $0.7 0.2% of total
TOTAL 289.0 100.0% $353.0 100.0%
Source: Aite Group survey of 2,429 U.S. consumers, 5,669 one-time bills for mortgage, Q3 2016
Table I: Mortgage Recurring Bill Payment Volume
Number of bills (In millions)
Percentage of total by number of bills
GDV (In US$ billions)
Percentage of total by GDV
Channel Mail or phone 40.8 18.8% $54.5 19.8%
Biller’s website 80.4 36.9% $97.3 35.4%
Bank’s website 85.3 39.2% $108.7 39.5%
Do not know 11.0 5.1% $14.8 5.4%
TOTAL 217.6 100.0% $275.3 100.0%
Method ACH 193.8 89.1% $246.4 89.5%
Credit card 12.1 5.6% $14.6 5.3%
Debit card 11.7 5.4% $14.2 5.2%
Prepaid debit card - 0.0% $0.0 0.0%
How Americans Pay Their Bills: Sizing Bill Pay Channels and Methods JANUARY 2017
© 2017 Aite Group LLC. All rights reserved. Reproduction of this report by any means is strictly prohibited. 101 Arch Street, Suite 501, Boston, MA 02110 • Tel +1.617.338.6050 • Fax +1.617.338.6078 • [email protected] • www.aitegroup.com
27
Number of bills (In millions)
Percentage of total by number of bills
GDV (In US$ billions)
Percentage of total by GDV
TOTAL 217.6 100.0% $275.3 100.0%
Source: Aite Group survey of 2,429 U.S. consumers, 4,287 recurring bills for mortgage, Q3 2016
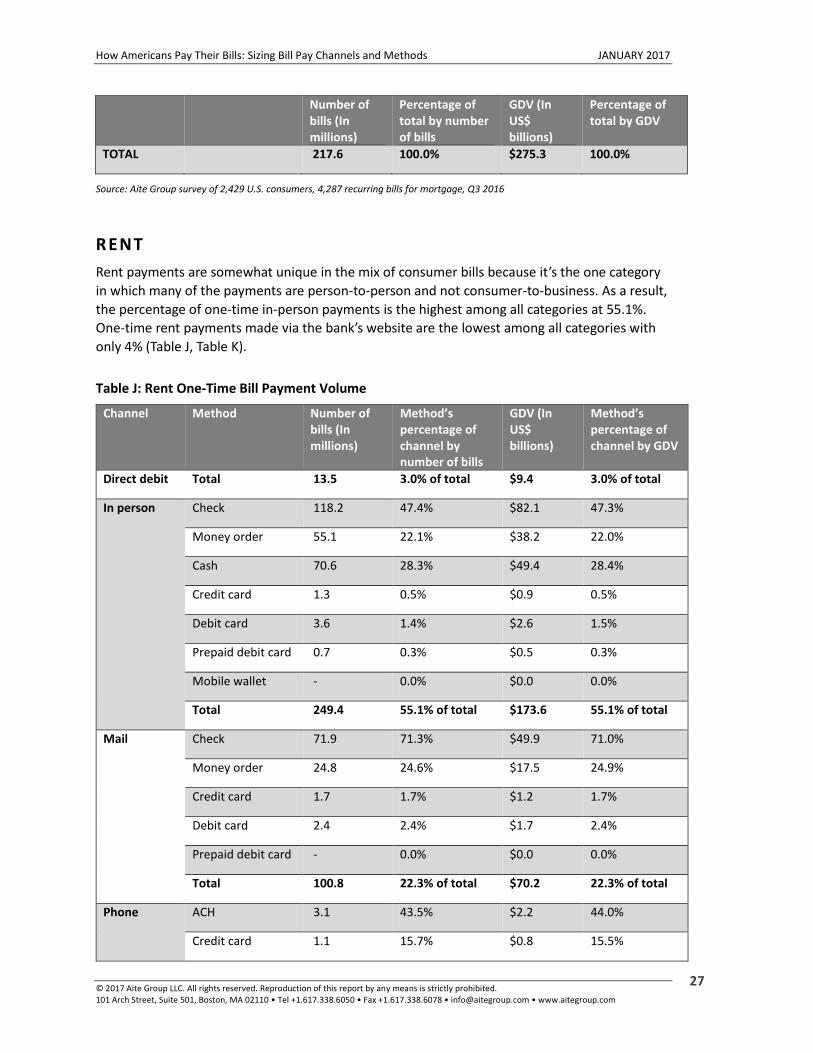
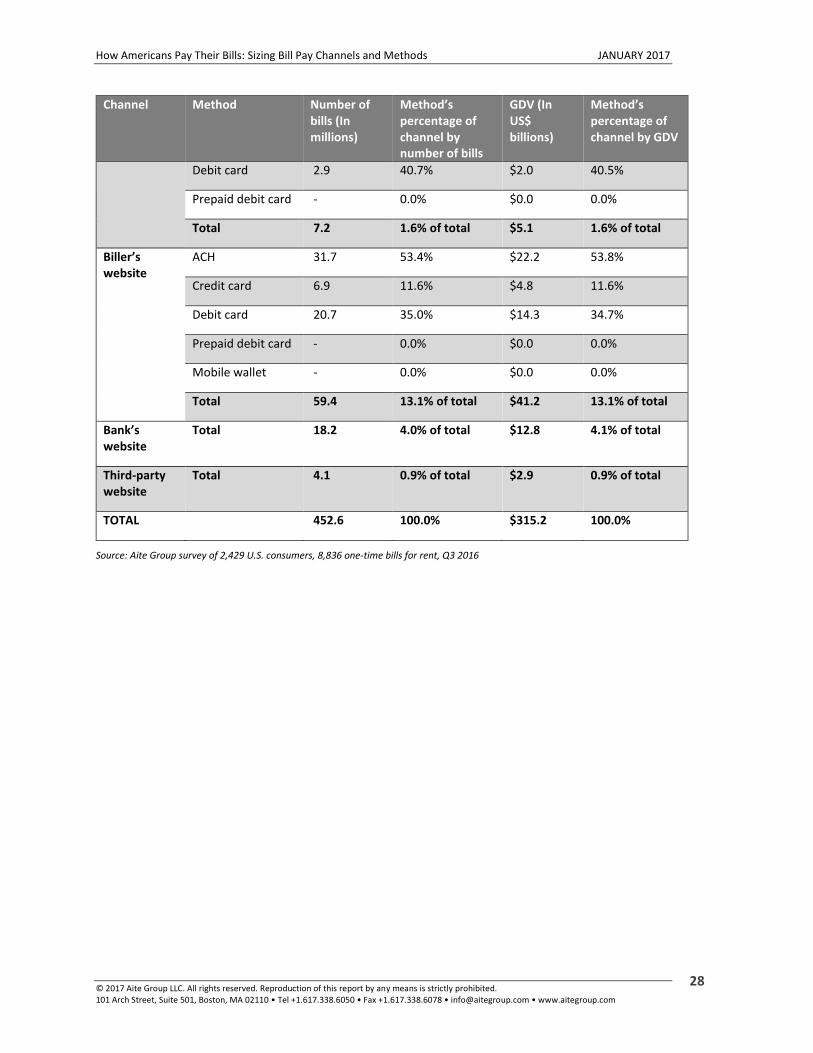
RENT
Rent payments are somewhat unique in the mix of consumer bills because it’s the one category
in which many of the payments are person-to-person and not consumer-to-business. As a result,
the percentage of one-time in-person payments is the highest among all categories at 55.1%.
One-time rent payments made via the bank’s website are the lowest among all categories with
only 4% (Table J, Table K).
Table J: Rent One-Time Bill Payment Volume
Channel Method Number of bills (In millions)
Method’s percentage of channel by number of bills
GDV (In US$ billions)
Method’s percentage of channel by GDV
Direct debit Total 13.5 3.0% of total $9.4 3.0% of total
In person Check 118.2 47.4% $82.1 47.3%
Money order 55.1 22.1% $38.2 22.0%
Cash 70.6 28.3% $49.4 28.4%
Credit card 1.3 0.5% $0.9 0.5%
Debit card 3.6 1.4% $2.6 1.5%
Prepaid debit card 0.7 0.3% $0.5 0.3%
Mobile wallet - 0.0% $0.0 0.0%
Total 249.4 55.1% of total $173.6 55.1% of total
Mail Check 71.9 71.3% $49.9 71.0%
Money order 24.8 24.6% $17.5 24.9%
Credit card 1.7 1.7% $1.2 1.7%
Debit card 2.4 2.4% $1.7 2.4%
Prepaid debit card - 0.0% $0.0 0.0%
Total 100.8 22.3% of total $70.2 22.3% of total
Phone ACH 3.1 43.5% $2.2 44.0%
Credit card 1.1 15.7% $0.8 15.5%
How Americans Pay Their Bills: Sizing Bill Pay Channels and Methods JANUARY 2017
© 2017 Aite Group LLC. All rights reserved. Reproduction of this report by any means is strictly prohibited. 101 Arch Street, Suite 501, Boston, MA 02110 • Tel +1.617.338.6050 • Fax +1.617.338.6078 • [email protected] • www.aitegroup.com
28
Channel Method Number of bills (In millions)
Method’s percentage of channel by number of bills
GDV (In US$ billions)
Method’s percentage of channel by GDV
Debit card 2.9 40.7% $2.0 40.5%
Prepaid debit card - 0.0% $0.0 0.0%
Total 7.2 1.6% of total $5.1 1.6% of total
Biller’s website
ACH 31.7 53.4% $22.2 53.8%
Credit card 6.9 11.6% $4.8 11.6%
Debit card 20.7 35.0% $14.3 34.7%
Prepaid debit card - 0.0% $0.0 0.0%
Mobile wallet - 0.0% $0.0 0.0%
Total 59.4 13.1% of total $41.2 13.1% of total
Bank’s website
Total 18.2 4.0% of total $12.8 4.1% of total
Third-party website
Total 4.1 0.9% of total $2.9 0.9% of total
TOTAL 452.6 100.0% $315.2 100.0%
Source: Aite Group survey of 2,429 U.S. consumers, 8,836 one-time bills for rent, Q3 2016
How Americans Pay Their Bills: Sizing Bill Pay Channels and Methods JANUARY 2017
© 2017 Aite Group LLC. All rights reserved. Reproduction of this report by any means is strictly prohibited. 101 Arch Street, Suite 501, Boston, MA 02110 • Tel +1.617.338.6050 • Fax +1.617.338.6078 • [email protected] • www.aitegroup.com
29
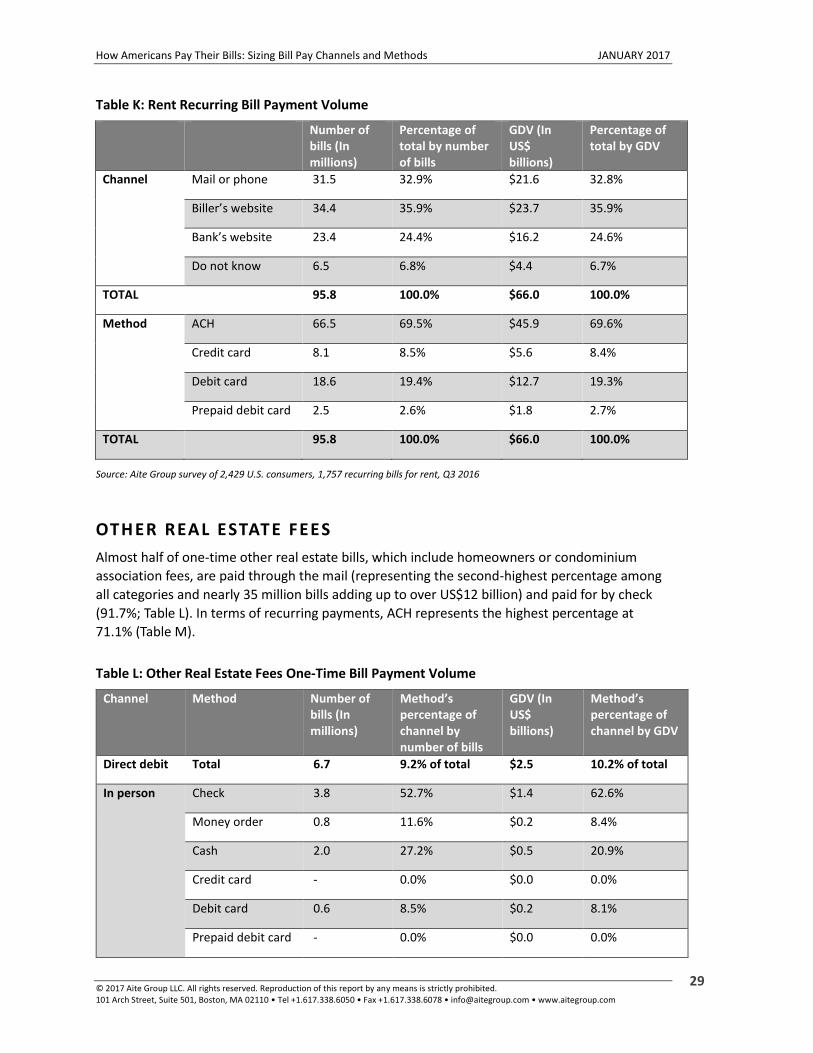
Table K: Rent Recurring Bill Payment Volume
Number of bills (In millions)
Percentage of total by number of bills
GDV (In US$ billions)
Percentage of total by GDV
Channel Mail or phone 31.5 32.9% $21.6 32.8%
Biller’s website 34.4 35.9% $23.7 35.9%
Bank’s website 23.4 24.4% $16.2 24.6%
Do not know 6.5 6.8% $4.4 6.7%
TOTAL 95.8 100.0% $66.0 100.0%
Method ACH 66.5 69.5% $45.9 69.6%
Credit card 8.1 8.5% $5.6 8.4%
Debit card 18.6 19.4% $12.7 19.3%
Prepaid debit card 2.5 2.6% $1.8 2.7%
TOTAL 95.8 100.0% $66.0 100.0%
Source: Aite Group survey of 2,429 U.S. consumers, 1,757 recurring bills for rent, Q3 2016
OTHER REAL ESTATE FEES
Almost half of one-time other real estate bills, which include homeowners or condominium
association fees, are paid through the mail (representing the second-highest percentage among
all categories and nearly 35 million bills adding up to over US$12 billion) and paid for by check
(91.7%; Table L). In terms of recurring payments, ACH represents the highest percentage at
71.1% (Table M).
Table L: Other Real Estate Fees One-Time Bill Payment Volume
Channel Method Number of bills (In millions)
Method’s percentage of channel by number of bills
GDV (In US$ billions)
Method’s percentage of channel by GDV
Direct debit Total 6.7 9.2% of total $2.5 10.2% of total
In person Check 3.8 52.7% $1.4 62.6%
Money order 0.8 11.6% $0.2 8.4%
Cash 2.0 27.2% $0.5 20.9%
Credit card - 0.0% $0.0 0.0%
Debit card 0.6 8.5% $0.2 8.1%
Prepaid debit card - 0.0% $0.0 0.0%

How Americans Pay Their Bills: Sizing Bill Pay Channels and Methods JANUARY 2017
© 2017 Aite Group LLC. All rights reserved. Reproduction of this report by any means is strictly prohibited. 101 Arch Street, Suite 501, Boston, MA 02110 • Tel +1.617.338.6050 • Fax +1.617.338.6078 • [email protected] • www.aitegroup.com
30
Channel Method Number of bills (In millions)
Method’s percentage of channel by number of bills
GDV (In US$ billions)
Method’s percentage of channel by GDV
Mobile wallet - 0.0% $0.0 0.0%
Total 7.3 9.9% of total $2.2 9.0% of total
Mail Check 31.8 91.7% $11.4 93.9%
Money order 1.1 3.3% $0.3 2.3%
Credit card 0.6 1.6% $0.1 0.8%
Debit card 1.2 3.4% $0.4 3.0%
Prepaid debit card - 0.0% $0.0 0.0%
Total 34.6 47.5% of total $12.1 48.8% of total
Phone ACH 0.3 20.0% $0.1 20.0%
Credit card 0.9 60.0% $0.3 60.0%
Debit card 0.3 20.0% $0.1 20.0%
Prepaid debit card - 0.0% $0.0 0.0%
Total 1.4 2.0% of total $0.4 1.8% of total
Biller’s website
ACH 9.2 65.4% $3.1 68.9%
Credit card 2.9 20.6% $0.9 20.6%
Debit card 1.7 12.1% $0.4 9.4%
Prepaid debit card - 0.0% $0.0 0.0%
Mobile wallet 0.3 2.0% $0.0 1.1%
Total 14.1 19.3% of total $4.4 17.9% of total
Bank’s website
Total 8.7 11.9% of total $3.0 12.0% of total
Third-party website
Total 0.2 0.3% of total $0.1 0.4% of total
TOTAL 73.0 100.0% $24.8 100.0%
Source: Aite Group survey of 2,429 U.S. consumers, 1,183 one-time bills for other real estate fees, Q3 2016
How Americans Pay Their Bills: Sizing Bill Pay Channels and Methods JANUARY 2017
© 2017 Aite Group LLC. All rights reserved. Reproduction of this report by any means is strictly prohibited. 101 Arch Street, Suite 501, Boston, MA 02110 • Tel +1.617.338.6050 • Fax +1.617.338.6078 • [email protected] • www.aitegroup.com
31
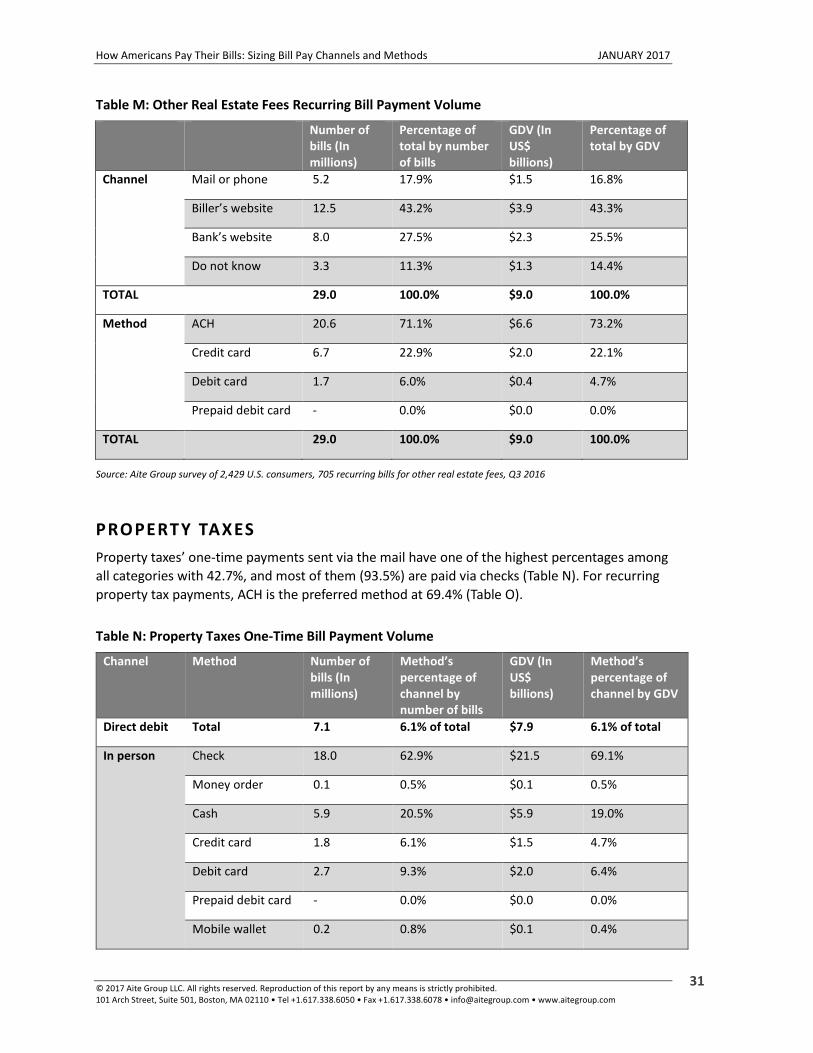
Table M: Other Real Estate Fees Recurring Bill Payment Volume
Number of bills (In millions)
Percentage of total by number of bills
GDV (In US$ billions)
Percentage of total by GDV
Channel Mail or phone 5.2 17.9% $1.5 16.8%
Biller’s website 12.5 43.2% $3.9 43.3%
Bank’s website 8.0 27.5% $2.3 25.5%
Do not know 3.3 11.3% $1.3 14.4%
TOTAL 29.0 100.0% $9.0 100.0%
Method ACH 20.6 71.1% $6.6 73.2%
Credit card 6.7 22.9% $2.0 22.1%
Debit card 1.7 6.0% $0.4 4.7%
Prepaid debit card - 0.0% $0.0 0.0%
TOTAL 29.0 100.0% $9.0 100.0%
Source: Aite Group survey of 2,429 U.S. consumers, 705 recurring bills for other real estate fees, Q3 2016
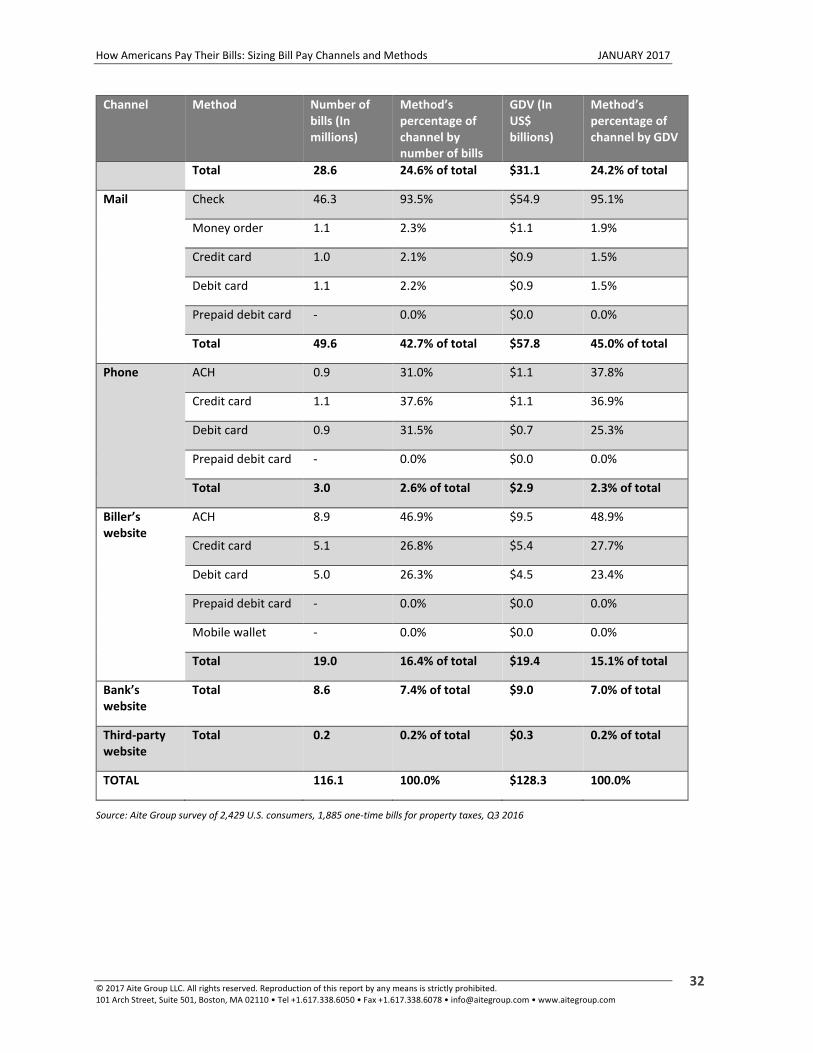
PROPERTY TAXES
Property taxes’ one-time payments sent via the mail have one of the highest percentages among
all categories with 42.7%, and most of them (93.5%) are paid via checks (Table N). For recurring
property tax payments, ACH is the preferred method at 69.4% (Table O).
Table N: Property Taxes One-Time Bill Payment Volume
Channel Method Number of bills (In millions)
Method’s percentage of channel by number of bills
GDV (In US$ billions)
Method’s percentage of channel by GDV
Direct debit Total 7.1 6.1% of total $7.9 6.1% of total
In person Check 18.0 62.9% $21.5 69.1%
Money order 0.1 0.5% $0.1 0.5%
Cash 5.9 20.5% $5.9 19.0%
Credit card 1.8 6.1% $1.5 4.7%
Debit card 2.7 9.3% $2.0 6.4%
Prepaid debit card - 0.0% $0.0 0.0%
Mobile wallet 0.2 0.8% $0.1 0.4%
How Americans Pay Their Bills: Sizing Bill Pay Channels and Methods JANUARY 2017
© 2017 Aite Group LLC. All rights reserved. Reproduction of this report by any means is strictly prohibited. 101 Arch Street, Suite 501, Boston, MA 02110 • Tel +1.617.338.6050 • Fax +1.617.338.6078 • [email protected] • www.aitegroup.com
32
Channel Method Number of bills (In millions)
Method’s percentage of channel by number of bills
GDV (In US$ billions)
Method’s percentage of channel by GDV
Total 28.6 24.6% of total $31.1 24.2% of total
Mail Check 46.3 93.5% $54.9 95.1%
Money order 1.1 2.3% $1.1 1.9%
Credit card 1.0 2.1% $0.9 1.5%
Debit card 1.1 2.2% $0.9 1.5%
Prepaid debit card - 0.0% $0.0 0.0%
Total 49.6 42.7% of total $57.8 45.0% of total
Phone ACH 0.9 31.0% $1.1 37.8%
Credit card 1.1 37.6% $1.1 36.9%
Debit card 0.9 31.5% $0.7 25.3%
Prepaid debit card - 0.0% $0.0 0.0%
Total 3.0 2.6% of total $2.9 2.3% of total
Biller’s website
ACH 8.9 46.9% $9.5 48.9%
Credit card 5.1 26.8% $5.4 27.7%
Debit card 5.0 26.3% $4.5 23.4%
Prepaid debit card - 0.0% $0.0 0.0%
Mobile wallet - 0.0% $0.0 0.0%
Total 19.0 16.4% of total $19.4 15.1% of total
Bank’s website
Total 8.6 7.4% of total $9.0 7.0% of total
Third-party website
Total 0.2 0.2% of total $0.3 0.2% of total
TOTAL 116.1 100.0% $128.3 100.0%
Source: Aite Group survey of 2,429 U.S. consumers, 1,885 one-time bills for property taxes, Q3 2016
How Americans Pay Their Bills: Sizing Bill Pay Channels and Methods JANUARY 2017
© 2017 Aite Group LLC. All rights reserved. Reproduction of this report by any means is strictly prohibited. 101 Arch Street, Suite 501, Boston, MA 02110 • Tel +1.617.338.6050 • Fax +1.617.338.6078 • [email protected] • www.aitegroup.com
33
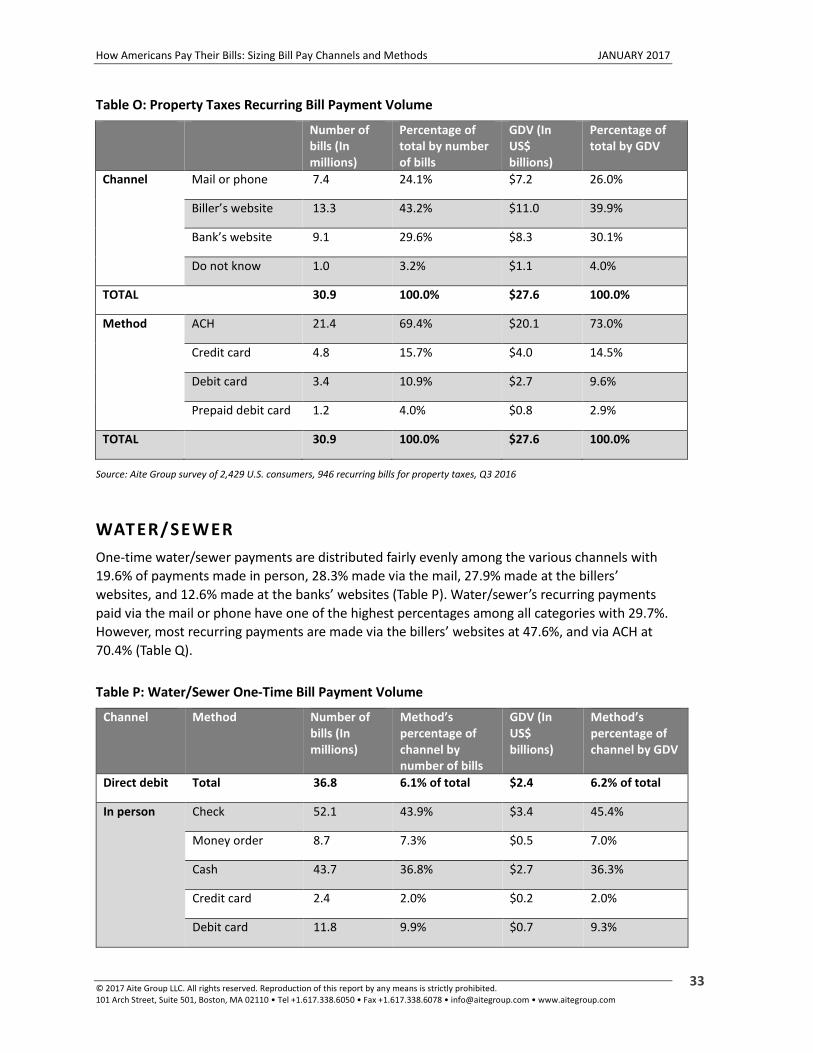
Table O: Property Taxes Recurring Bill Payment Volume
Number of bills (In millions)
Percentage of total by number of bills
GDV (In US$ billions)
Percentage of total by GDV
Channel Mail or phone 7.4 24.1% $7.2 26.0%
Biller’s website 13.3 43.2% $11.0 39.9%
Bank’s website 9.1 29.6% $8.3 30.1%
Do not know 1.0 3.2% $1.1 4.0%
TOTAL 30.9 100.0% $27.6 100.0%
Method ACH 21.4 69.4% $20.1 73.0%
Credit card 4.8 15.7% $4.0 14.5%
Debit card 3.4 10.9% $2.7 9.6%
Prepaid debit card 1.2 4.0% $0.8 2.9%
TOTAL 30.9 100.0% $27.6 100.0%
Source: Aite Group survey of 2,429 U.S. consumers, 946 recurring bills for property taxes, Q3 2016
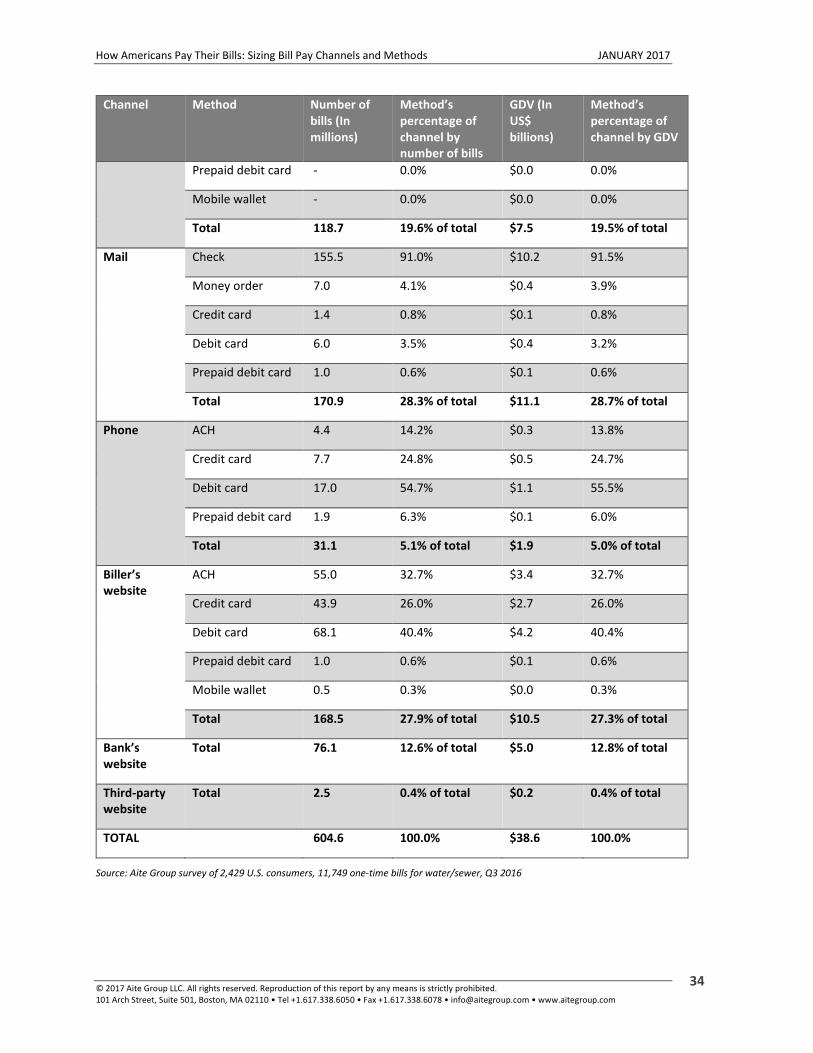
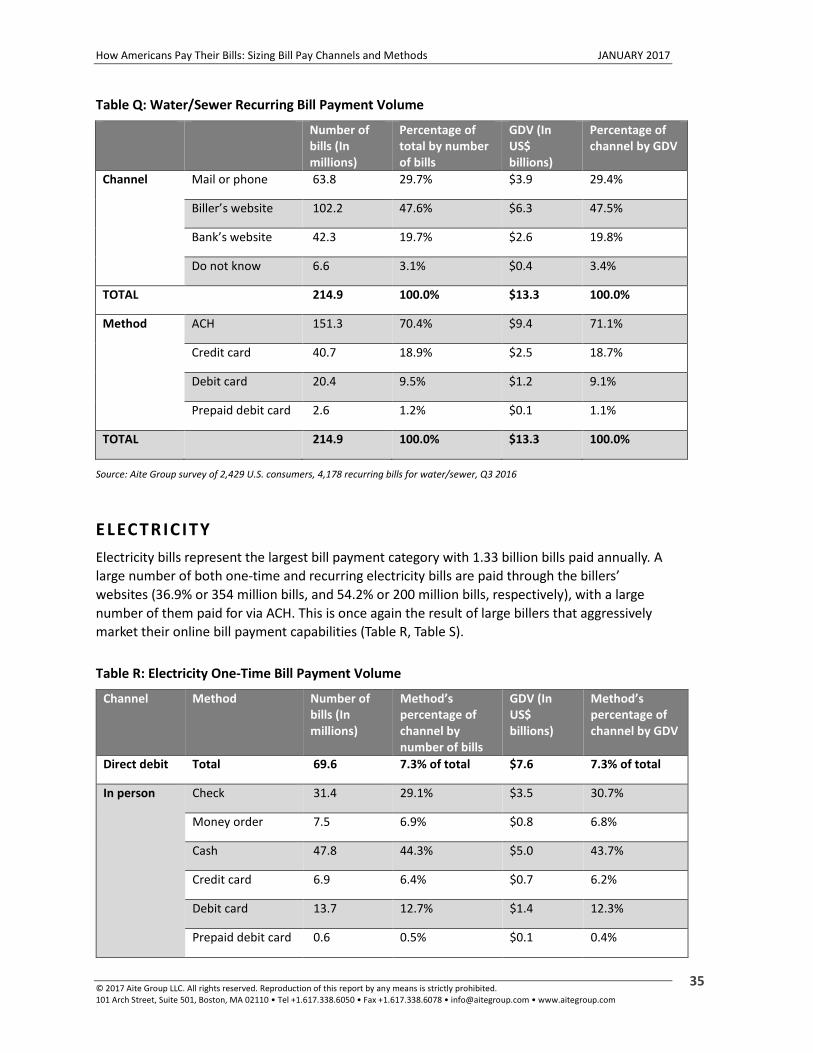
WATER/SEWER
One-time water/sewer payments are distributed fairly evenly among the various channels with
19.6% of payments made in person, 28.3% made via the mail, 27.9% made at the billers’
websites, and 12.6% made at the banks’ websites (Table P). Water/sewer’s recurring payments
paid via the mail or phone have one of the highest percentages among all categories with 29.7%.
However, most recurring payments are made via the billers’ websites at 47.6%, and via ACH at
70.4% (Table Q).
Table P: Water/Sewer One-Time Bill Payment Volume
Channel Method Number of bills (In millions)
Method’s percentage of channel by number of bills
GDV (In US$ billions)
Method’s percentage of channel by GDV
Direct debit Total 36.8 6.1% of total $2.4 6.2% of total
In person Check 52.1 43.9% $3.4 45.4%
Money order 8.7 7.3% $0.5 7.0%
Cash 43.7 36.8% $2.7 36.3%
Credit card 2.4 2.0% $0.2 2.0%
Debit card 11.8 9.9% $0.7 9.3%
How Americans Pay Their Bills: Sizing Bill Pay Channels and Methods JANUARY 2017
© 2017 Aite Group LLC. All rights reserved. Reproduction of this report by any means is strictly prohibited. 101 Arch Street, Suite 501, Boston, MA 02110 • Tel +1.617.338.6050 • Fax +1.617.338.6078 • [email protected] • www.aitegroup.com
34
Channel Method Number of bills (In millions)
Method’s percentage of channel by number of bills
GDV (In US$ billions)
Method’s percentage of channel by GDV
Prepaid debit card - 0.0% $0.0 0.0%
Mobile wallet - 0.0% $0.0 0.0%
Total 118.7 19.6% of total $7.5 19.5% of total
Mail Check 155.5 91.0% $10.2 91.5%
Money order 7.0 4.1% $0.4 3.9%
Credit card 1.4 0.8% $0.1 0.8%
Debit card 6.0 3.5% $0.4 3.2%
Prepaid debit card 1.0 0.6% $0.1 0.6%
Total 170.9 28.3% of total $11.1 28.7% of total
Phone ACH 4.4 14.2% $0.3 13.8%
Credit card 7.7 24.8% $0.5 24.7%
Debit card 17.0 54.7% $1.1 55.5%
Prepaid debit card 1.9 6.3% $0.1 6.0%
Total 31.1 5.1% of total $1.9 5.0% of total
Biller’s website
ACH 55.0 32.7% $3.4 32.7%
Credit card 43.9 26.0% $2.7 26.0%
Debit card 68.1 40.4% $4.2 40.4%
Prepaid debit card 1.0 0.6% $0.1 0.6%
Mobile wallet 0.5 0.3% $0.0 0.3%
Total 168.5 27.9% of total $10.5 27.3% of total
Bank’s website
Total 76.1 12.6% of total $5.0 12.8% of total
Third-party website
Total 2.5 0.4% of total $0.2 0.4% of total
TOTAL 604.6 100.0% $38.6 100.0%
Source: Aite Group survey of 2,429 U.S. consumers, 11,749 one-time bills for water/sewer, Q3 2016
How Americans Pay Their Bills: Sizing Bill Pay Channels and Methods JANUARY 2017
© 2017 Aite Group LLC. All rights reserved. Reproduction of this report by any means is strictly prohibited. 101 Arch Street, Suite 501, Boston, MA 02110 • Tel +1.617.338.6050 • Fax +1.617.338.6078 • [email protected] • www.aitegroup.com
35
Table Q: Water/Sewer Recurring Bill Payment Volume
Number of bills (In millions)
Percentage of total by number of bills
GDV (In US$ billions)
Percentage of channel by GDV
Channel Mail or phone 63.8 29.7% $3.9 29.4%
Biller’s website 102.2 47.6% $6.3 47.5%
Bank’s website 42.3 19.7% $2.6 19.8%
Do not know 6.6 3.1% $0.4 3.4%
TOTAL 214.9 100.0% $13.3 100.0%
Method ACH 151.3 70.4% $9.4 71.1%
Credit card 40.7 18.9% $2.5 18.7%
Debit card 20.4 9.5% $1.2 9.1%
Prepaid debit card 2.6 1.2% $0.1 1.1%
TOTAL 214.9 100.0% $13.3 100.0%
Source: Aite Group survey of 2,429 U.S. consumers, 4,178 recurring bills for water/sewer, Q3 2016
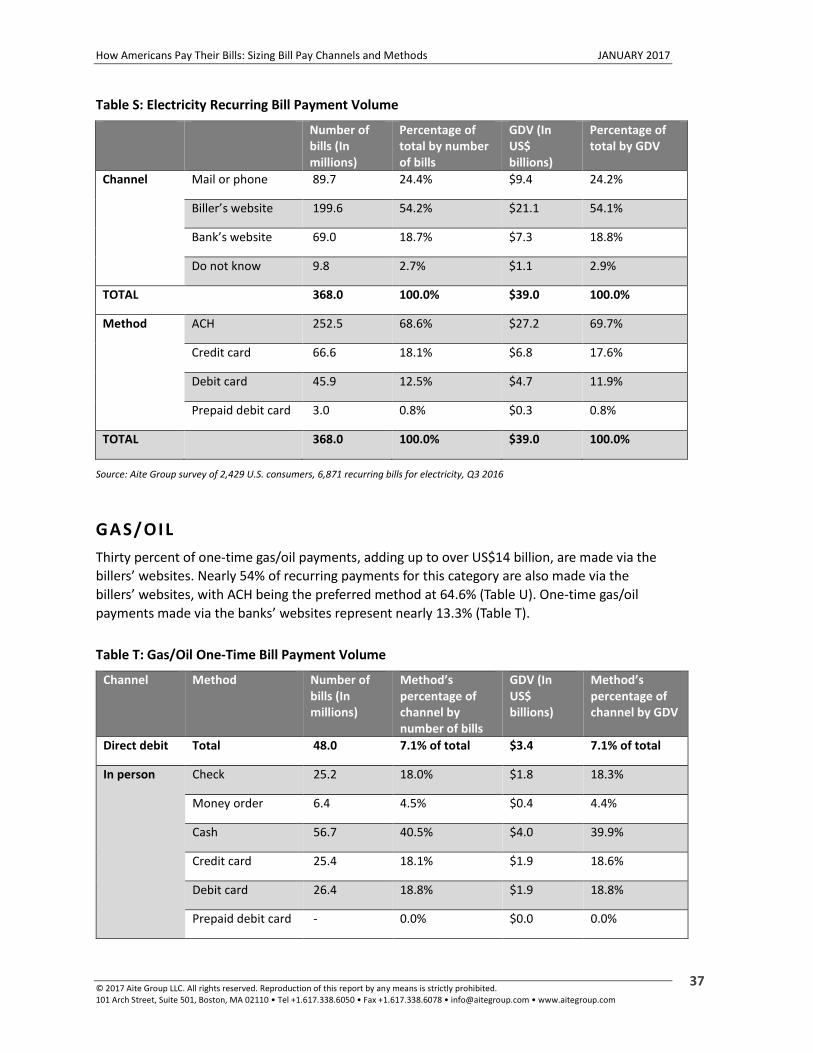
ELECTRIC ITY
Electricity bills represent the largest bill payment category with 1.33 billion bills paid annually. A
large number of both one-time and recurring electricity bills are paid through the billers’
websites (36.9% or 354 million bills, and 54.2% or 200 million bills, respectively), with a large
number of them paid for via ACH. This is once again the result of large billers that aggressively
market their online bill payment capabilities (Table R, Table S).
Table R: Electricity One-Time Bill Payment Volume
Channel Method Number of bills (In millions)
Method’s percentage of channel by number of bills
GDV (In US$ billions)
Method’s percentage of channel by GDV
Direct debit Total 69.6 7.3% of total $7.6 7.3% of total
In person Check 31.4 29.1% $3.5 30.7%
Money order 7.5 6.9% $0.8 6.8%
Cash 47.8 44.3% $5.0 43.7%
Credit card 6.9 6.4% $0.7 6.2%
Debit card 13.7 12.7% $1.4 12.3%
Prepaid debit card 0.6 0.5% $0.1 0.4%

How Americans Pay Their Bills: Sizing Bill Pay Channels and Methods JANUARY 2017
© 2017 Aite Group LLC. All rights reserved. Reproduction of this report by any means is strictly prohibited. 101 Arch Street, Suite 501, Boston, MA 02110 • Tel +1.617.338.6050 • Fax +1.617.338.6078 • [email protected] • www.aitegroup.com
36
Channel Method Number of bills (In millions)
Method’s percentage of channel by number of bills
GDV (In US$ billions)
Method’s percentage of channel by GDV
Mobile wallet - 0.0% $0.0 0.0%
Total 107.9 11.3% of total $11.5 11.1% of total
Mail Check 194.6 86.9% $21.9 87.8%
Money order 16.1 7.2% $1.7 7.0%
Credit card 3.4 1.5% $0.3 1.4%
Debit card 9.3 4.2% $0.9 3.6%
Prepaid debit card 0.6 0.3% $0.1 0.2%
Total 223.9 23.4% of total $24.9 24.0% of total
Phone ACH 15.7 25.1% $1.7 25.9%
Credit card 10.0 16.1% $1.0 15.9%
Debit card 34.5 55.2% $3.6 54.4%
Prepaid debit card 2.3 3.7% $0.2 3.8%
Total 62.5 6.5% of total $6.6 6.3% of total
Biller’s website
ACH 162.7 45.9% $17.5 46.6%
Credit card 60.8 17.1% $6.4 17.0%
Debit card 125.1 35.3% $13.1 34.8%
Prepaid debit card 5.2 1.5% $0.5 1.4%
Mobile wallet 0.5 0.2% $0.1 0.2%
Total 354.3 36.9% of total $37.5 36.2% of total
Bank’s website
Total 135.9 14.2% of total $15.0 14.5% of total
Third-party website
Total 4.9 0.5% of total $0.5 0.5% of total
TOTAL 958.9 100.0% $103.7 100.0%
Source: Aite Group survey of 2,429 U.S. consumers, 18,933 one-time bills for electricity, Q3 2016
How Americans Pay Their Bills: Sizing Bill Pay Channels and Methods JANUARY 2017
© 2017 Aite Group LLC. All rights reserved. Reproduction of this report by any means is strictly prohibited. 101 Arch Street, Suite 501, Boston, MA 02110 • Tel +1.617.338.6050 • Fax +1.617.338.6078 • [email protected] • www.aitegroup.com
37
Table S: Electricity Recurring Bill Payment Volume
Number of bills (In millions)
Percentage of total by number of bills
GDV (In US$ billions)
Percentage of total by GDV
Channel Mail or phone 89.7 24.4% $9.4 24.2%
Biller’s website 199.6 54.2% $21.1 54.1%
Bank’s website 69.0 18.7% $7.3 18.8%
Do not know 9.8 2.7% $1.1 2.9%
TOTAL 368.0 100.0% $39.0 100.0%
Method ACH 252.5 68.6% $27.2 69.7%
Credit card 66.6 18.1% $6.8 17.6%
Debit card 45.9 12.5% $4.7 11.9%
Prepaid debit card 3.0 0.8% $0.3 0.8%
TOTAL 368.0 100.0% $39.0 100.0%
Source: Aite Group survey of 2,429 U.S. consumers, 6,871 recurring bills for electricity, Q3 2016
GAS/OIL
Thirty percent of one-time gas/oil payments, adding up to over US$14 billion, are made via the
billers’ websites. Nearly 54% of recurring payments for this category are also made via the
billers’ websites, with ACH being the preferred method at 64.6% (Table U). One-time gas/oil
payments made via the banks’ websites represent nearly 13.3% (Table T).
Table T: Gas/Oil One-Time Bill Payment Volume
Channel Method Number of bills (In millions)
Method’s percentage of channel by number of bills
GDV (In US$ billions)
Method’s percentage of channel by GDV
Direct debit Total 48.0 7.1% of total $3.4 7.1% of total
In person Check 25.2 18.0% $1.8 18.3%
Money order 6.4 4.5% $0.4 4.4%
Cash 56.7 40.5% $4.0 39.9%
Credit card 25.4 18.1% $1.9 18.6%
Debit card 26.4 18.8% $1.9 18.8%
Prepaid debit card - 0.0% $0.0 0.0%

How Americans Pay Their Bills: Sizing Bill Pay Channels and Methods JANUARY 2017
© 2017 Aite Group LLC. All rights reserved. Reproduction of this report by any means is strictly prohibited. 101 Arch Street, Suite 501, Boston, MA 02110 • Tel +1.617.338.6050 • Fax +1.617.338.6078 • [email protected] • www.aitegroup.com
38
Channel Method Number of bills (In millions)
Method’s percentage of channel by number of bills
GDV (In US$ billions)
Method’s percentage of channel by GDV
Mobile wallet - 0.0% $0.0 0.0%
Total 140.1 20.7% of total $10.0 20.8% of total
Mail Check 125.8 82.5% $9.1 83.3%
Money order 11.4 7.5% $0.8 7.0%
Credit card 7.0 4.6% $0.5 4.4%
Debit card 8.3 5.4% $0.6 5.2%
Prepaid debit card - 0.0% $0.0 0.0%
Total 152.4 22.5% of total $11.0 22.8% of total
Phone ACH 6.0 14.9% $0.4 15.2%
Credit card 11.6 28.7% $0.8 28.6%
Debit card 20.3 50.5% $1.4 50.3%
Prepaid debit card 2.4 5.9% $0.2 5.9%
Total 40.2 5.9% of total $2.8 5.9% of total
Biller’s website
ACH 92.0 45.0% $6.5 45.4%
Credit card 43.9 21.5% $3.1 21.8%
Debit card 65.6 32.1% $4.5 31.5%
Prepaid debit card 1.2 0.6% $0.1 0.5%
Mobile wallet 1.7 0.8% $0.1 0.8%
Total 204.3 30.1% of total $14.3 29.6% of total
Bank’s website
Total 90.1 13.3% of total $6.5 13.5% of total
Third-party website
Total 2.9 0.4% of total $0.2 0.4% of total
TOTAL 678.1 100.0% $48.2 100.0%
Source: Aite Group survey of 2,429 U.S. consumers, 13,312 one-time bills for gas/oil, Q3 2016

How Americans Pay Their Bills: Sizing Bill Pay Channels and Methods JANUARY 2017
© 2017 Aite Group LLC. All rights reserved. Reproduction of this report by any means is strictly prohibited. 101 Arch Street, Suite 501, Boston, MA 02110 • Tel +1.617.338.6050 • Fax +1.617.338.6078 • [email protected] • www.aitegroup.com
39
Table U: Gas/Oil Recurring Bill Payment Volume
Number of bills (In millions)
Percentage of total by number of bills
GDV (In US$ billions)
Percentage of total by GDV
Channel Mail or phone 58.7 26.1% $4.2 26.4%
Biller’s website 120.3 53.5% $8.3 52.9%
Bank’s website 38.7 17.2% $2.7 17.4%
Do not know 7.1 3.2% $0.5 3.3%
TOTAL 224.8 100.0% $15.7 100.0%
Method ACH 145.2 64.6% $10.2 65.1%
Credit card 48.4 21.5% $3.4 21.4%
Debit card 30.0 13.4% $2.0 13.0%
Prepaid debit card 1.2 0.5% $0.1 0.6%
TOTAL 224.8 100.0% $15.7 100.0%
Source: Aite Group survey of 2,429 U.S. consumers, 4,192 recurring bills for gas/oil, Q3 2016
GARBAGE
Nearly 32%, or 123 million, of one-time garbage bills are paid through the mail, with 89.5% of
them paid for by check. These billers are typically smaller billers that have not aggressively
marketed their online presence and bill payment capabilities (Table V, Table W).
Table V: Garbage One-Time Bill Payment Volume
Channel Method Number of bills (In millions)
Method’s percentage of channel by number of bills
GDV (In US$ billions)
Method’s percentage of channel by GDV
Direct debit Total 25.1 6.4% of total $0.9 6.3% of total
In person Check 20.6 30.5% $0.8 31.1%
Money order 5.9 8.7% $0.2 8.4%
Cash 32.5 48.2% $1.2 48.2%
Credit card 1.7 2.6% $0.1 2.5%
Debit card 6.8 10.1% $0.2 9.8%
Prepaid debit card - 0.0% $0.0 0.0%
Mobile wallet - 0.0% $0.0 0.0%

How Americans Pay Their Bills: Sizing Bill Pay Channels and Methods JANUARY 2017
© 2017 Aite Group LLC. All rights reserved. Reproduction of this report by any means is strictly prohibited. 101 Arch Street, Suite 501, Boston, MA 02110 • Tel +1.617.338.6050 • Fax +1.617.338.6078 • [email protected] • www.aitegroup.com
40
Channel Method Number of bills (In millions)
Method’s percentage of channel by number of bills
GDV (In US$ billions)
Method’s percentage of channel by GDV
Total 67.5 17.3% of total $2.5 17.1% of total
Mail Check 110.4 89.5% $4.1 89.9%
Money order 7.5 6.1% $0.3 5.7%
Credit card 0.9 0.7% $0.0 0.7%
Debit card 2.8 2.3% $0.1 2.2%
Prepaid debit card 1.8 1.4% $0.1 1.4%
Total 123.3 31.5% of total $4.6 31.9% of total
Phone ACH 5.0 21.4% $0.2 21.0%
Credit card 5.7 24.7% $0.2 23.7%
Debit card 11.6 50.0% $0.4 51.1%
Prepaid debit card 0.9 4.0% $0.0 4.1%
Total 23.2 5.9% of total $0.9 6.0% of total
Biller’s website
ACH 30.2 30.3% $1.1 30.1%
Credit card 29.2 29.3% $1.1 30.0%
Debit card 38.7 39.0% $1.4 38.5%
Prepaid debit card 0.5 0.5% $0.0 0.5%
Mobile wallet 0.9 0.9% $0.0 0.9%
Total 99.5 25.4% of total $3.6 25.2% of total
Bank’s website
Total 52.0 13.3% of total $1.9 13.3% of total
Third-party website
Total 0.9 0.2% of total $0.0 0.2% of total
TOTAL 391.5 100.0% $14.4 100.0%
Source: Aite Group survey of 2,429 U.S. consumers, 7,571 one-time bills for garbage, Q3 2016
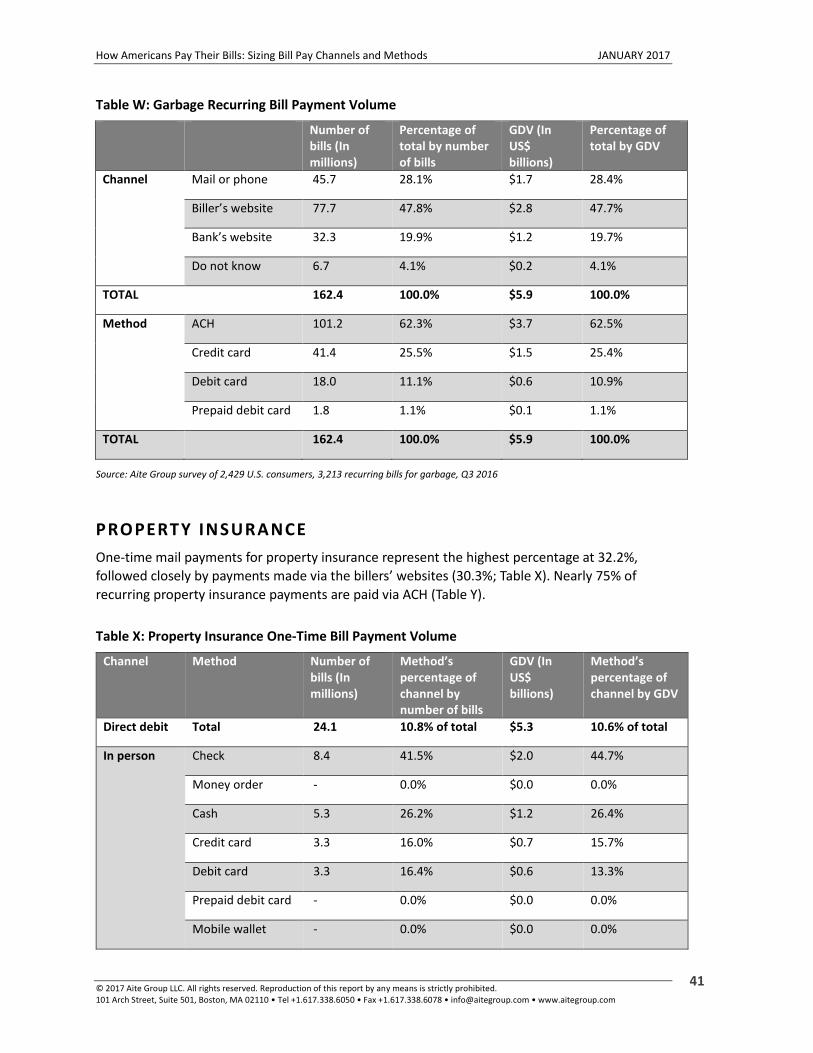
How Americans Pay Their Bills: Sizing Bill Pay Channels and Methods JANUARY 2017
© 2017 Aite Group LLC. All rights reserved. Reproduction of this report by any means is strictly prohibited. 101 Arch Street, Suite 501, Boston, MA 02110 • Tel +1.617.338.6050 • Fax +1.617.338.6078 • [email protected] • www.aitegroup.com
41
Table W: Garbage Recurring Bill Payment Volume
Number of bills (In millions)
Percentage of total by number of bills
GDV (In US$ billions)
Percentage of total by GDV
Channel Mail or phone 45.7 28.1% $1.7 28.4%
Biller’s website 77.7 47.8% $2.8 47.7%
Bank’s website 32.3 19.9% $1.2 19.7%
Do not know 6.7 4.1% $0.2 4.1%
TOTAL 162.4 100.0% $5.9 100.0%
Method ACH 101.2 62.3% $3.7 62.5%
Credit card 41.4 25.5% $1.5 25.4%
Debit card 18.0 11.1% $0.6 10.9%
Prepaid debit card 1.8 1.1% $0.1 1.1%
TOTAL 162.4 100.0% $5.9 100.0%
Source: Aite Group survey of 2,429 U.S. consumers, 3,213 recurring bills for garbage, Q3 2016
PROPERTY INSURANCE
One-time mail payments for property insurance represent the highest percentage at 32.2%,
followed closely by payments made via the billers’ websites (30.3%; Table X). Nearly 75% of
recurring property insurance payments are paid via ACH (Table Y).
Table X: Property Insurance One-Time Bill Payment Volume
Channel Method Number of bills (In millions)
Method’s percentage of channel by number of bills
GDV (In US$ billions)
Method’s percentage of channel by GDV
Direct debit Total 24.1 10.8% of total $5.3 10.6% of total
In person Check 8.4 41.5% $2.0 44.7%
Money order - 0.0% $0.0 0.0%
Cash 5.3 26.2% $1.2 26.4%
Credit card 3.3 16.0% $0.7 15.7%
Debit card 3.3 16.4% $0.6 13.3%
Prepaid debit card - 0.0% $0.0 0.0%
Mobile wallet - 0.0% $0.0 0.0%

How Americans Pay Their Bills: Sizing Bill Pay Channels and Methods JANUARY 2017
© 2017 Aite Group LLC. All rights reserved. Reproduction of this report by any means is strictly prohibited. 101 Arch Street, Suite 501, Boston, MA 02110 • Tel +1.617.338.6050 • Fax +1.617.338.6078 • [email protected] • www.aitegroup.com
42
Channel Method Number of bills (In millions)
Method’s percentage of channel by number of bills
GDV (In US$ billions)
Method’s percentage of channel by GDV
Total 20.3 9.0% of total $4.4 8.7% of total
Mail Check 63.8 88.3% $15.1 89.8%
Money order 2.7 3.7% $0.5 3.2%
Credit card 2.8 3.9% $0.6 3.7%
Debit card 2.9 4.0% $0.6 3.3%
Prepaid debit card - 0.0% $0.0 0.0%
Total 72.2 32.2% of total $16.8 33.6% of total
Phone ACH 3.4 25.6% $0.7 23.9%
Credit card 6.5 49.0% $1.5 51.9%
Debit card 3.1 23.5% $0.6 22.0%
Prepaid debit card 0.2 1.8% $0.1 2.1%
Total 13.2 5.9% of total $2.9 5.8% of total
Biller’s website
ACH 26.4 38.9% $5.8 39.0%
Credit card 23.2 34.1% $5.2 35.3%
Debit card 17.2 25.3% $3.6 24.1%
Prepaid debit card 1.2 1.8% $0.2 1.5%
Mobile wallet - 0.0% $0.0 0.0%
Total 68.0 30.3% of total $14.7 29.5% of total
Bank’s website
Total 26.0 11.6% of total $5.8 11.6% of total
Third-party website
Total 0.5 0.2% of total $0.1 0.2% of total
TOTAL 224.3 100.0% $50.0 100.0%
Source: Aite Group survey of 2,429 U.S. consumers, 3,687 one-time bills for property insurance, Q3 2016

How Americans Pay Their Bills: Sizing Bill Pay Channels and Methods JANUARY 2017
© 2017 Aite Group LLC. All rights reserved. Reproduction of this report by any means is strictly prohibited. 101 Arch Street, Suite 501, Boston, MA 02110 • Tel +1.617.338.6050 • Fax +1.617.338.6078 • [email protected] • www.aitegroup.com
43
Table Y: Property Insurance Recurring Bill Payment Volume
Number of bills (In millions)
Percentage of total by number of bills
GDV (In US$ billions)
Percentage of total by GDV
Channel Mail or phone 32.7 26.5% $6.9 27.1%
Biller’s website 57.0 46.2% $11.6 45.3%
Bank’s website 24.6 20.0% $5.0 19.6%
Do not know 9.1 7.3% $2.1 8.0%
TOTAL 123.5 100.0% $25.6 100.0%
Method ACH 92.4 74.8% $19.4 75.8%
Credit card 19.7 15.9% $4.1 16.0%
Debit card 11.0 8.9% $2.0 7.9%
Prepaid debit card 0.4 0.3% $0.1 0.2%
TOTAL 123.5 100.0% $25.6 100.0%
Source: Aite Group survey of 2,429 U.S. consumers, 3,036 recurring bills for property insurance, Q3 2016
LANDLINE PHONES
Reflecting the trend toward mainly relying on cellphones, the number of bills paid in the landline
phone category has declined over the last few years, adding up to 583 million bills for 2016.
Nearly 39% of one-time landline phone bills are paid via the billers’ websites and are about
evenly distributed between ACH (34.4%), debit cards (33.1%), and credit cards (32%). Twenty-
nine percent of the payments are also made via the mail, with over 86% paid by check (Table Z).
Over half of recurring landline phone bills are paid via the billers’ websites and ACH (Table AA).
Table Z: Landline Phones One-Time Bill Payment Volume
Channel Method Number of bills (In millions)
Method’s percentage of channel by number of bills
GDV (In US$ billions)
Method’s percentage of channel by GDV
Direct debit Total 26.6 7.4% of total $1.2 7.5% of total
In person Check 3.8 20.7% $0.2 19.7%
Money order 1.1 5.9% $0.0 5.9%
Cash 6.6 36.3% $0.3 35.0%
Credit card 2.9 16.0% $0.1 16.1%
Debit card 3.2 17.5% $0.2 20.2%

How Americans Pay Their Bills: Sizing Bill Pay Channels and Methods JANUARY 2017
© 2017 Aite Group LLC. All rights reserved. Reproduction of this report by any means is strictly prohibited. 101 Arch Street, Suite 501, Boston, MA 02110 • Tel +1.617.338.6050 • Fax +1.617.338.6078 • [email protected] • www.aitegroup.com
44
Channel Method Number of bills (In millions)
Method’s percentage of channel by number of bills
GDV (In US$ billions)
Method’s percentage of channel by GDV
Prepaid debit card 0.7 3.6% $0.0 3.1%
Mobile wallet - 0.0% $0.0 0.0%
Total 18.2 5.0% of total $0.8 5.1% of total
Mail Check 91.1 86.2% $4.1 85.4%
Money order 7.4 7.0% $0.3 7.1%
Credit card 4.3 4.1% $0.2 4.5%
Debit card 2.8 2.6% $0.1 2.9%
Prepaid debit card - 0.0% $0.0 0.0%
Total 105.6 29.2% of total $4.8 29.3% of total
Phone ACH 4.2 19.7% $0.2 20.9%
Credit card 6.2 29.1% $0.3 28.8%
Debit card 10.3 48.1% $0.5 47.6%
Prepaid debit card 0.7 3.1% $0.0 2.7%
Total 21.4 5.9% of total $1.0 5.8% of total
Biller’s website
ACH 48.3 34.4% $2.1 33.8%
Credit card 44.9 32.0% $2.0 32.0%
Debit card 46.4 33.1% $2.1 33.8%
Prepaid debit card 0.5 0.4% $0.0 0.4%
Mobile wallet - 0.0% $0.0 0.0%
Total 140.2 38.7% of total $6.3 38.5% of total
Bank’s website
Total 49.7 13.7% of total $2.2 13.6% of total
Third-party website
Total 0.5 0.1% of total $0.0 0.2% of total
TOTAL 362.2 100.0% $16.3 100.0%
Source: Aite Group survey of 2,429 U.S. consumers, 6,868 one-time bills for landline phones, Q3 2016
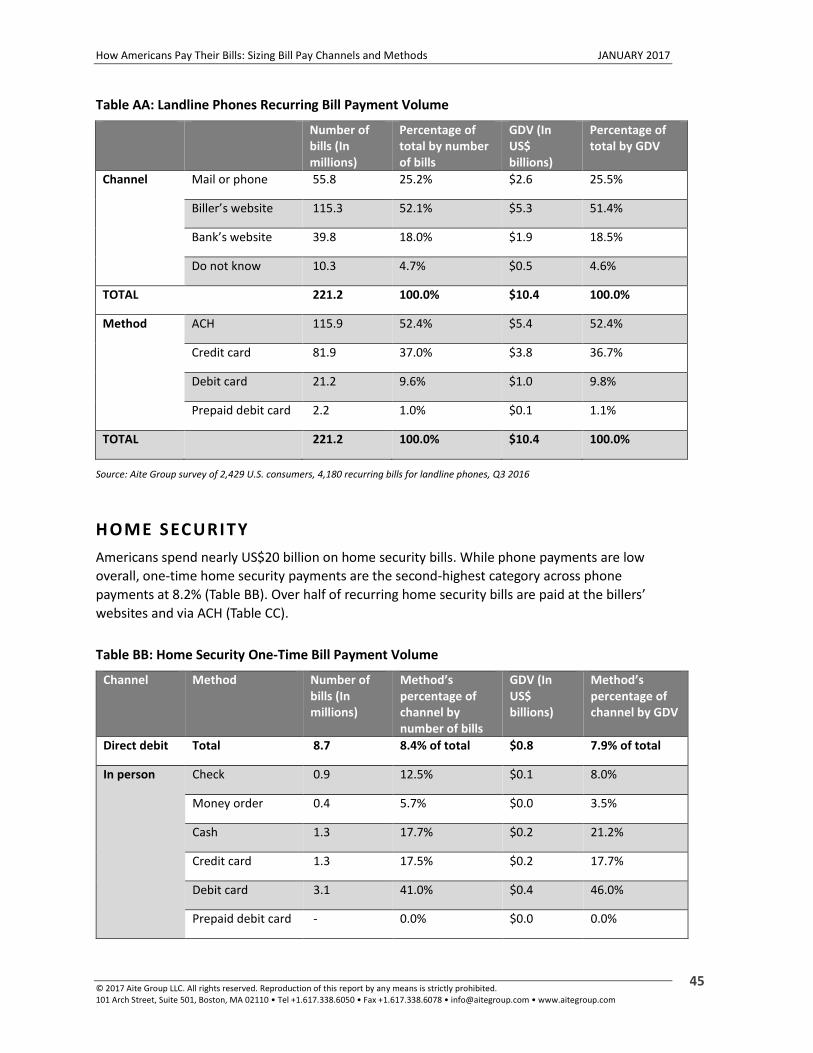
How Americans Pay Their Bills: Sizing Bill Pay Channels and Methods JANUARY 2017
© 2017 Aite Group LLC. All rights reserved. Reproduction of this report by any means is strictly prohibited. 101 Arch Street, Suite 501, Boston, MA 02110 • Tel +1.617.338.6050 • Fax +1.617.338.6078 • [email protected] • www.aitegroup.com
45
Table AA: Landline Phones Recurring Bill Payment Volume
Number of bills (In millions)
Percentage of total by number of bills
GDV (In US$ billions)
Percentage of total by GDV
Channel Mail or phone 55.8 25.2% $2.6 25.5%
Biller’s website 115.3 52.1% $5.3 51.4%
Bank’s website 39.8 18.0% $1.9 18.5%
Do not know 10.3 4.7% $0.5 4.6%
TOTAL 221.2 100.0% $10.4 100.0%
Method ACH 115.9 52.4% $5.4 52.4%
Credit card 81.9 37.0% $3.8 36.7%
Debit card 21.2 9.6% $1.0 9.8%
Prepaid debit card 2.2 1.0% $0.1 1.1%
TOTAL 221.2 100.0% $10.4 100.0%
Source: Aite Group survey of 2,429 U.S. consumers, 4,180 recurring bills for landline phones, Q3 2016
HOME SECURITY
Americans spend nearly US$20 billion on home security bills. While phone payments are low
overall, one-time home security payments are the second-highest category across phone
payments at 8.2% (Table BB). Over half of recurring home security bills are paid at the billers’
websites and via ACH (Table CC).
Table BB: Home Security One-Time Bill Payment Volume
Channel Method Number of bills (In millions)
Method’s percentage of channel by number of bills
GDV (In US$ billions)
Method’s percentage of channel by GDV
Direct debit Total 8.7 8.4% of total $0.8 7.9% of total
In person Check 0.9 12.5% $0.1 8.0%
Money order 0.4 5.7% $0.0 3.5%
Cash 1.3 17.7% $0.2 21.2%
Credit card 1.3 17.5% $0.2 17.7%
Debit card 3.1 41.0% $0.4 46.0%
Prepaid debit card - 0.0% $0.0 0.0%

How Americans Pay Their Bills: Sizing Bill Pay Channels and Methods JANUARY 2017
© 2017 Aite Group LLC. All rights reserved. Reproduction of this report by any means is strictly prohibited. 101 Arch Street, Suite 501, Boston, MA 02110 • Tel +1.617.338.6050 • Fax +1.617.338.6078 • [email protected] • www.aitegroup.com
46
Channel Method Number of bills (In millions)
Method’s percentage of channel by number of bills
GDV (In US$ billions)
Method’s percentage of channel by GDV
Mobile wallet 0.4 5.7% $0.0 3.5%
Total 7.6 7.3% of total $0.9 9.0% of total
Mail Check 22.6 76.0% $1.8 70.7%
Money order 2.2 7.4% $0.2 8.4%
Credit card 3.1 10.4% $0.3 13.3%
Debit card 1.4 4.7% $0.1 5.1%
Prepaid debit card 0.4 1.5% $0.1 2.4%
Total 29.8 28.6% of total $2.5 26.3% of total
Phone ACH 1.4 16.4% $0.2 19.4%
Credit card 4.5 52.8% $0.4 46.7%
Debit card 2.2 25.6% $0.2 26.3%
Prepaid debit card 0.4 5.2% $0.1 7.5%
Total 8.6 8.2% of total $0.8 8.4% of total
Biller’s website
ACH 12.8 36.2% $1.2 33.5%
Credit card 12.1 34.2% $1.2 35.4%
Debit card 10.0 28.4% $1.0 30.2%
Prepaid debit card 0.4 1.2% $0.0 0.9%
Mobile wallet - 0.0% $0.0 0.0%
Total 35.4 34.0% of total $3.5 35.8% of total
Bank’s website
Total 14.1 13.5% of total $1.2 12.6% of total
Third-party website
Total - 0.0% of total $0.0 0.0% of total
TOTAL 104.1 100.0% $9.7 100.0%
Source: Aite Group survey of 2,429 U.S. consumers, 1,883 one-time bills for home security, Q3 2016
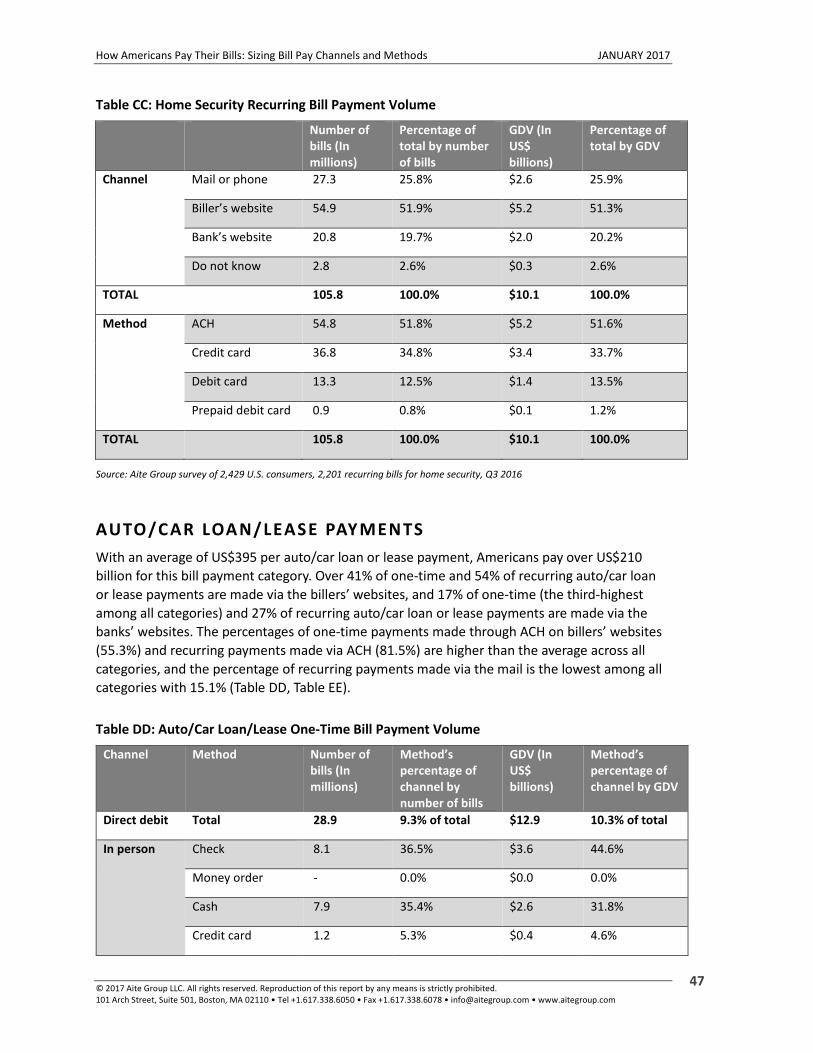
How Americans Pay Their Bills: Sizing Bill Pay Channels and Methods JANUARY 2017
© 2017 Aite Group LLC. All rights reserved. Reproduction of this report by any means is strictly prohibited. 101 Arch Street, Suite 501, Boston, MA 02110 • Tel +1.617.338.6050 • Fax +1.617.338.6078 • [email protected] • www.aitegroup.com
47
Table CC: Home Security Recurring Bill Payment Volume
Number of bills (In millions)
Percentage of total by number of bills
GDV (In US$ billions)
Percentage of total by GDV
Channel Mail or phone 27.3 25.8% $2.6 25.9%
Biller’s website 54.9 51.9% $5.2 51.3%
Bank’s website 20.8 19.7% $2.0 20.2%
Do not know 2.8 2.6% $0.3 2.6%
TOTAL 105.8 100.0% $10.1 100.0%
Method ACH 54.8 51.8% $5.2 51.6%
Credit card 36.8 34.8% $3.4 33.7%
Debit card 13.3 12.5% $1.4 13.5%
Prepaid debit card 0.9 0.8% $0.1 1.2%
TOTAL 105.8 100.0% $10.1 100.0%
Source: Aite Group survey of 2,429 U.S. consumers, 2,201 recurring bills for home security, Q3 2016
AUTO/CAR LOAN/LEASE PAYMENTS
With an average of US$395 per auto/car loan or lease payment, Americans pay over US$210
billion for this bill payment category. Over 41% of one-time and 54% of recurring auto/car loan
or lease payments are made via the billers’ websites, and 17% of one-time (the third-highest
among all categories) and 27% of recurring auto/car loan or lease payments are made via the
banks’ websites. The percentages of one-time payments made through ACH on billers’ websites
(55.3%) and recurring payments made via ACH (81.5%) are higher than the average across all
categories, and the percentage of recurring payments made via the mail is the lowest among all
categories with 15.1% (Table DD, Table EE).
Table DD: Auto/Car Loan/Lease One-Time Bill Payment Volume
Channel Method Number of bills (In millions)
Method’s percentage of channel by number of bills
GDV (In US$ billions)
Method’s percentage of channel by GDV
Direct debit Total 28.9 9.3% of total $12.9 10.3% of total
In person Check 8.1 36.5% $3.6 44.6%
Money order - 0.0% $0.0 0.0%
Cash 7.9 35.4% $2.6 31.8%
Credit card 1.2 5.3% $0.4 4.6%
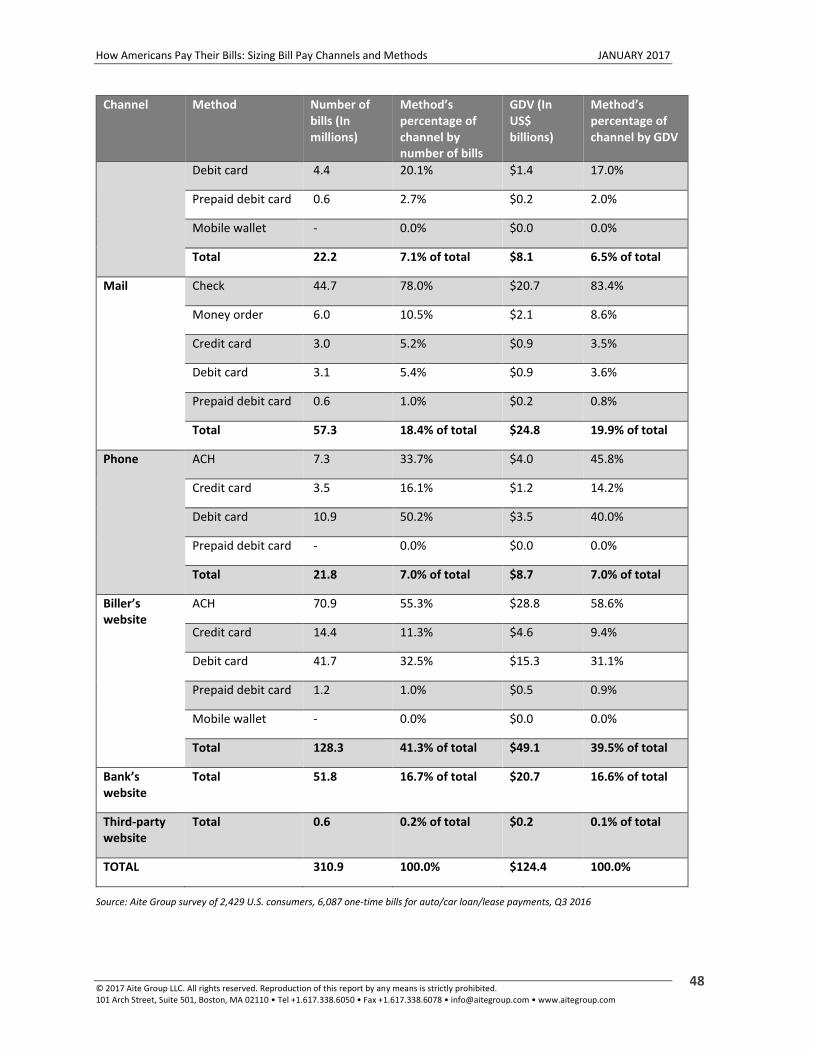
How Americans Pay Their Bills: Sizing Bill Pay Channels and Methods JANUARY 2017
© 2017 Aite Group LLC. All rights reserved. Reproduction of this report by any means is strictly prohibited. 101 Arch Street, Suite 501, Boston, MA 02110 • Tel +1.617.338.6050 • Fax +1.617.338.6078 • [email protected] • www.aitegroup.com
48
Channel Method Number of bills (In millions)
Method’s percentage of channel by number of bills
GDV (In US$ billions)
Method’s percentage of channel by GDV
Debit card 4.4 20.1% $1.4 17.0%
Prepaid debit card 0.6 2.7% $0.2 2.0%
Mobile wallet - 0.0% $0.0 0.0%
Total 22.2 7.1% of total $8.1 6.5% of total
Mail Check 44.7 78.0% $20.7 83.4%
Money order 6.0 10.5% $2.1 8.6%
Credit card 3.0 5.2% $0.9 3.5%
Debit card 3.1 5.4% $0.9 3.6%
Prepaid debit card 0.6 1.0% $0.2 0.8%
Total 57.3 18.4% of total $24.8 19.9% of total
Phone ACH 7.3 33.7% $4.0 45.8%
Credit card 3.5 16.1% $1.2 14.2%
Debit card 10.9 50.2% $3.5 40.0%
Prepaid debit card - 0.0% $0.0 0.0%
Total 21.8 7.0% of total $8.7 7.0% of total
Biller’s website
ACH 70.9 55.3% $28.8 58.6%
Credit card 14.4 11.3% $4.6 9.4%
Debit card 41.7 32.5% $15.3 31.1%
Prepaid debit card 1.2 1.0% $0.5 0.9%
Mobile wallet - 0.0% $0.0 0.0%
Total 128.3 41.3% of total $49.1 39.5% of total
Bank’s website
Total 51.8 16.7% of total $20.7 16.6% of total
Third-party website
Total 0.6 0.2% of total $0.2 0.1% of total
TOTAL 310.9 100.0% $124.4 100.0%
Source: Aite Group survey of 2,429 U.S. consumers, 6,087 one-time bills for auto/car loan/lease payments, Q3 2016
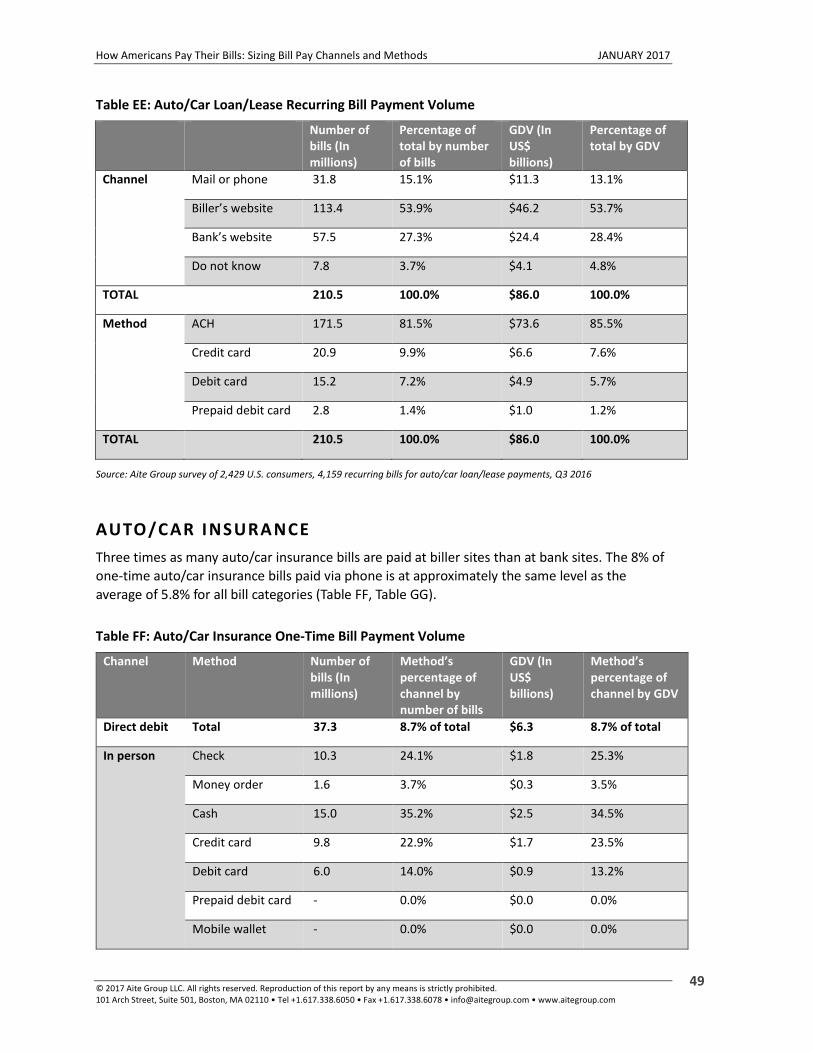
How Americans Pay Their Bills: Sizing Bill Pay Channels and Methods JANUARY 2017
© 2017 Aite Group LLC. All rights reserved. Reproduction of this report by any means is strictly prohibited. 101 Arch Street, Suite 501, Boston, MA 02110 • Tel +1.617.338.6050 • Fax +1.617.338.6078 • [email protected] • www.aitegroup.com
49
Table EE: Auto/Car Loan/Lease Recurring Bill Payment Volume
Number of bills (In millions)
Percentage of total by number of bills
GDV (In US$ billions)
Percentage of total by GDV
Channel Mail or phone 31.8 15.1% $11.3 13.1%
Biller’s website 113.4 53.9% $46.2 53.7%
Bank’s website 57.5 27.3% $24.4 28.4%
Do not know 7.8 3.7% $4.1 4.8%
TOTAL 210.5 100.0% $86.0 100.0%
Method ACH 171.5 81.5% $73.6 85.5%
Credit card 20.9 9.9% $6.6 7.6%
Debit card 15.2 7.2% $4.9 5.7%
Prepaid debit card 2.8 1.4% $1.0 1.2%
TOTAL 210.5 100.0% $86.0 100.0%
Source: Aite Group survey of 2,429 U.S. consumers, 4,159 recurring bills for auto/car loan/lease payments, Q3 2016
AUTO/CAR INSURANCE
Three times as many auto/car insurance bills are paid at biller sites than at bank sites. The 8% of
one-time auto/car insurance bills paid via phone is at approximately the same level as the
average of 5.8% for all bill categories (Table FF, Table GG).
Table FF: Auto/Car Insurance One-Time Bill Payment Volume
Channel Method Number of bills (In millions)
Method’s percentage of channel by number of bills
GDV (In US$ billions)
Method’s percentage of channel by GDV
Direct debit Total 37.3 8.7% of total $6.3 8.7% of total
In person Check 10.3 24.1% $1.8 25.3%
Money order 1.6 3.7% $0.3 3.5%
Cash 15.0 35.2% $2.5 34.5%
Credit card 9.8 22.9% $1.7 23.5%
Debit card 6.0 14.0% $0.9 13.2%
Prepaid debit card - 0.0% $0.0 0.0%
Mobile wallet - 0.0% $0.0 0.0%

How Americans Pay Their Bills: Sizing Bill Pay Channels and Methods JANUARY 2017
© 2017 Aite Group LLC. All rights reserved. Reproduction of this report by any means is strictly prohibited. 101 Arch Street, Suite 501, Boston, MA 02110 • Tel +1.617.338.6050 • Fax +1.617.338.6078 • [email protected] • www.aitegroup.com
50
Channel Method Number of bills (In millions)
Method’s percentage of channel by number of bills
GDV (In US$ billions)
Method’s percentage of channel by GDV
Total 42.6 9.9% of total $7.2 9.8% of total
Mail Check 76.1 83.4% $13.6 84.6%
Money order 6.4 7.1% $1.1 6.7%
Credit card 4.1 4.5% $0.7 4.2%
Debit card 3.8 4.1% $0.6 3.8%
Prepaid debit card 0.8 0.9% $0.1 0.8%
Total 91.3 21.2% of total $16.1 22.0% of total
Phone ACH 7.0 20.2% $1.2 20.0%
Credit card 11.1 32.2% $2.0 33.8%
Debit card 15.2 43.9% $2.5 42.6%
Prepaid debit card 1.3 3.7% $0.2 3.6%
Total 34.6 8.0% of total $5.8 8.0% of total
Biller’s website
ACH 46.4 27.2% $7.9 27.5%
Credit card 60.7 35.6% $10.3 36.0%
Debit card 59.1 34.6% $9.7 33.9%
Prepaid debit card 2.4 1.4% $0.4 1.5%
Mobile wallet 1.9 1.1% $0.3 1.1%
Total 170.6 39.7% of total $28.5 39.1% of total
Bank’s website
Total 53.7 12.5% of total $9.1 12.5% of total
Third-party website
Total - 0.0% of total $0.0 0.0% of total
TOTAL 430.0 100.0% $73.1 100.0%
Source: Aite Group survey of 2,429 U.S. consumers, 7,142 one-time bills for auto/car insurance, Q3 2016
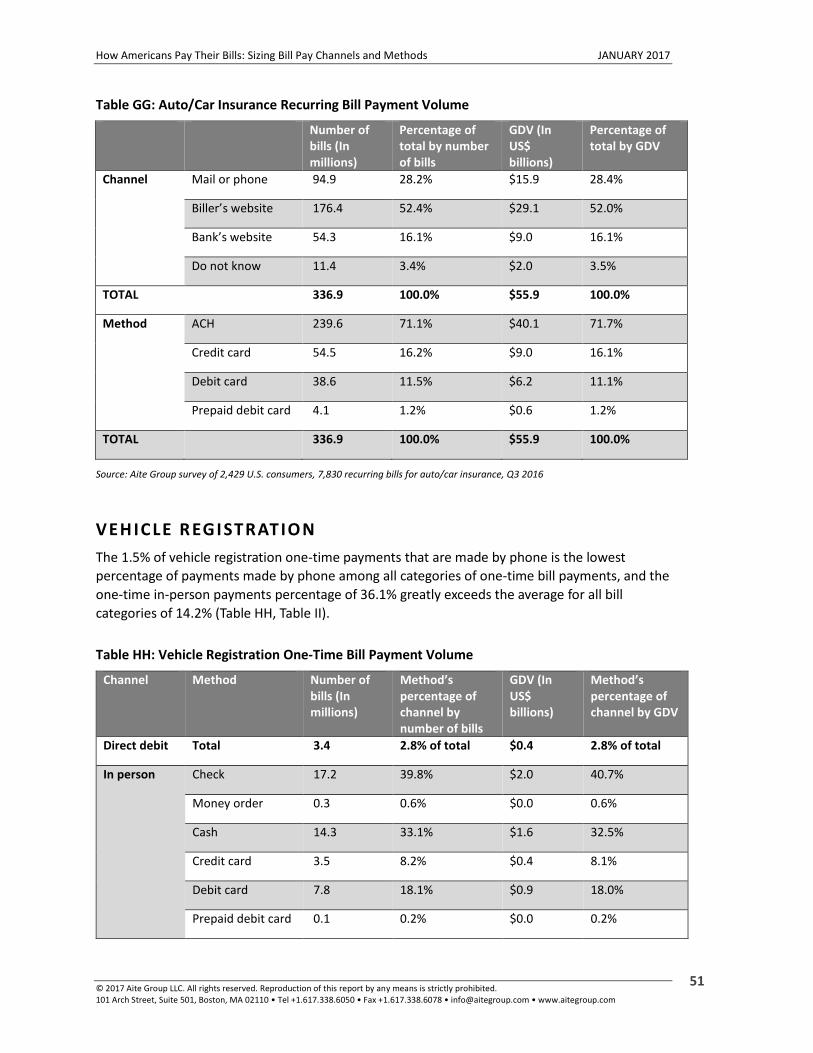
How Americans Pay Their Bills: Sizing Bill Pay Channels and Methods JANUARY 2017
© 2017 Aite Group LLC. All rights reserved. Reproduction of this report by any means is strictly prohibited. 101 Arch Street, Suite 501, Boston, MA 02110 • Tel +1.617.338.6050 • Fax +1.617.338.6078 • [email protected] • www.aitegroup.com
51
Table GG: Auto/Car Insurance Recurring Bill Payment Volume
Number of bills (In millions)
Percentage of total by number of bills
GDV (In US$ billions)
Percentage of total by GDV
Channel Mail or phone 94.9 28.2% $15.9 28.4%
Biller’s website 176.4 52.4% $29.1 52.0%
Bank’s website 54.3 16.1% $9.0 16.1%
Do not know 11.4 3.4% $2.0 3.5%
TOTAL 336.9 100.0% $55.9 100.0%
Method ACH 239.6 71.1% $40.1 71.7%
Credit card 54.5 16.2% $9.0 16.1%
Debit card 38.6 11.5% $6.2 11.1%
Prepaid debit card 4.1 1.2% $0.6 1.2%
TOTAL 336.9 100.0% $55.9 100.0%
Source: Aite Group survey of 2,429 U.S. consumers, 7,830 recurring bills for auto/car insurance, Q3 2016
VEHICLE REGISTRATION
The 1.5% of vehicle registration one-time payments that are made by phone is the lowest
percentage of payments made by phone among all categories of one-time bill payments, and the
one-time in-person payments percentage of 36.1% greatly exceeds the average for all bill
categories of 14.2% (Table HH, Table II).
Table HH: Vehicle Registration One-Time Bill Payment Volume
Channel Method Number of bills (In millions)
Method’s percentage of channel by number of bills
GDV (In US$ billions)
Method’s percentage of channel by GDV
Direct debit Total 3.4 2.8% of total $0.4 2.8% of total
In person Check 17.2 39.8% $2.0 40.7%
Money order 0.3 0.6% $0.0 0.6%
Cash 14.3 33.1% $1.6 32.5%
Credit card 3.5 8.2% $0.4 8.1%
Debit card 7.8 18.1% $0.9 18.0%
Prepaid debit card 0.1 0.2% $0.0 0.2%
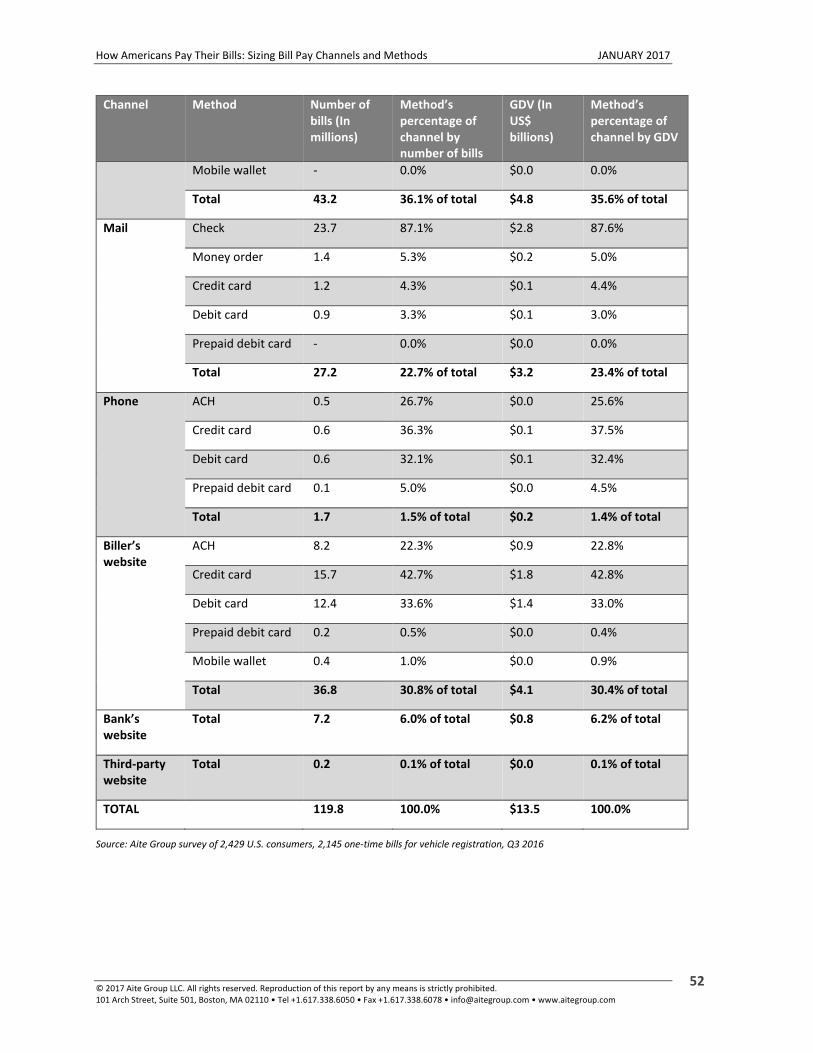
How Americans Pay Their Bills: Sizing Bill Pay Channels and Methods JANUARY 2017
© 2017 Aite Group LLC. All rights reserved. Reproduction of this report by any means is strictly prohibited. 101 Arch Street, Suite 501, Boston, MA 02110 • Tel +1.617.338.6050 • Fax +1.617.338.6078 • [email protected] • www.aitegroup.com
52
Channel Method Number of bills (In millions)
Method’s percentage of channel by number of bills
GDV (In US$ billions)
Method’s percentage of channel by GDV
Mobile wallet - 0.0% $0.0 0.0%
Total 43.2 36.1% of total $4.8 35.6% of total
Mail Check 23.7 87.1% $2.8 87.6%
Money order 1.4 5.3% $0.2 5.0%
Credit card 1.2 4.3% $0.1 4.4%
Debit card 0.9 3.3% $0.1 3.0%
Prepaid debit card - 0.0% $0.0 0.0%
Total 27.2 22.7% of total $3.2 23.4% of total
Phone ACH 0.5 26.7% $0.0 25.6%
Credit card 0.6 36.3% $0.1 37.5%
Debit card 0.6 32.1% $0.1 32.4%
Prepaid debit card 0.1 5.0% $0.0 4.5%
Total 1.7 1.5% of total $0.2 1.4% of total
Biller’s website
ACH 8.2 22.3% $0.9 22.8%
Credit card 15.7 42.7% $1.8 42.8%
Debit card 12.4 33.6% $1.4 33.0%
Prepaid debit card 0.2 0.5% $0.0 0.4%
Mobile wallet 0.4 1.0% $0.0 0.9%
Total 36.8 30.8% of total $4.1 30.4% of total
Bank’s website
Total 7.2 6.0% of total $0.8 6.2% of total
Third-party website
Total 0.2 0.1% of total $0.0 0.1% of total
TOTAL 119.8 100.0% $13.5 100.0%
Source: Aite Group survey of 2,429 U.S. consumers, 2,145 one-time bills for vehicle registration, Q3 2016
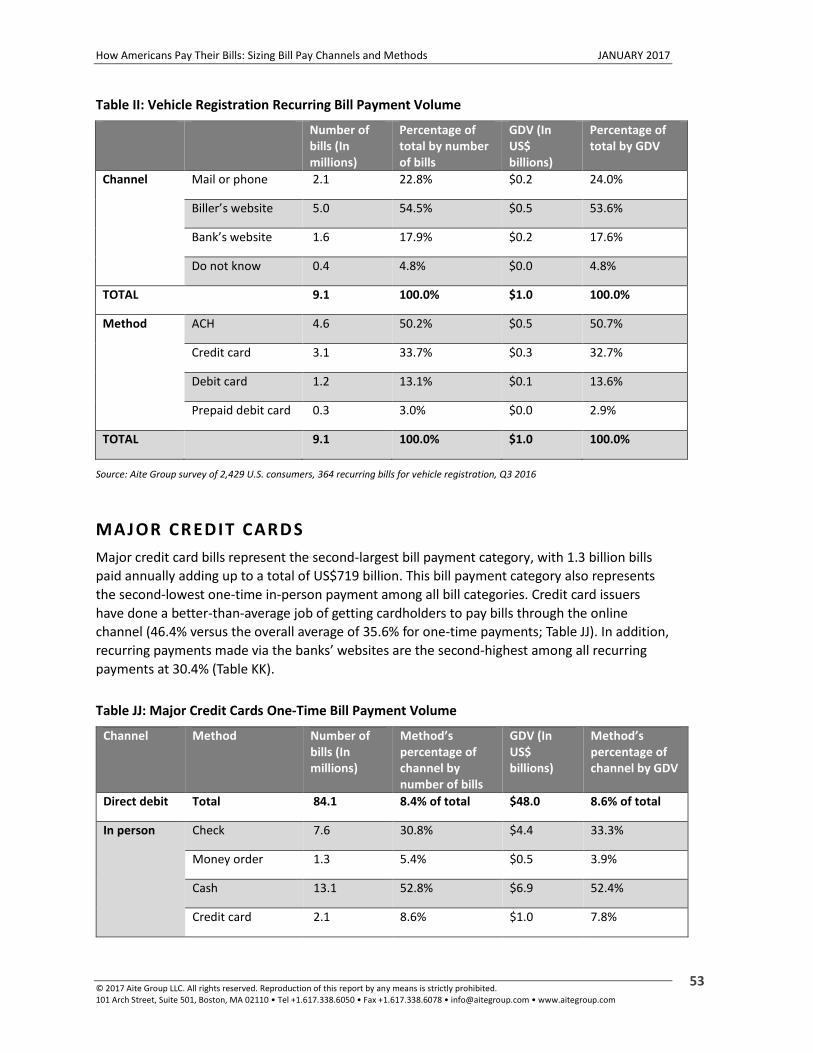
How Americans Pay Their Bills: Sizing Bill Pay Channels and Methods JANUARY 2017
© 2017 Aite Group LLC. All rights reserved. Reproduction of this report by any means is strictly prohibited. 101 Arch Street, Suite 501, Boston, MA 02110 • Tel +1.617.338.6050 • Fax +1.617.338.6078 • [email protected] • www.aitegroup.com
53
Table II: Vehicle Registration Recurring Bill Payment Volume
Number of bills (In millions)
Percentage of total by number of bills
GDV (In US$ billions)
Percentage of total by GDV
Channel Mail or phone 2.1 22.8% $0.2 24.0%
Biller’s website 5.0 54.5% $0.5 53.6%
Bank’s website 1.6 17.9% $0.2 17.6%
Do not know 0.4 4.8% $0.0 4.8%
TOTAL 9.1 100.0% $1.0 100.0%
Method ACH 4.6 50.2% $0.5 50.7%
Credit card 3.1 33.7% $0.3 32.7%
Debit card 1.2 13.1% $0.1 13.6%
Prepaid debit card 0.3 3.0% $0.0 2.9%
TOTAL 9.1 100.0% $1.0 100.0%
Source: Aite Group survey of 2,429 U.S. consumers, 364 recurring bills for vehicle registration, Q3 2016
MA JOR CREDIT CARDS
Major credit card bills represent the second-largest bill payment category, with 1.3 billion bills
paid annually adding up to a total of US$719 billion. This bill payment category also represents
the second-lowest one-time in-person payment among all bill categories. Credit card issuers
have done a better-than-average job of getting cardholders to pay bills through the online
channel (46.4% versus the overall average of 35.6% for one-time payments; Table JJ). In addition,
recurring payments made via the banks’ websites are the second-highest among all recurring
payments at 30.4% (Table KK).
Table JJ: Major Credit Cards One-Time Bill Payment Volume
Channel Method Number of bills (In millions)
Method’s percentage of channel by number of bills
GDV (In US$ billions)
Method’s percentage of channel by GDV
Direct debit Total 84.1 8.4% of total $48.0 8.6% of total
In person Check 7.6 30.8% $4.4 33.3%
Money order 1.3 5.4% $0.5 3.9%
Cash 13.1 52.8% $6.9 52.4%
Credit card 2.1 8.6% $1.0 7.8%
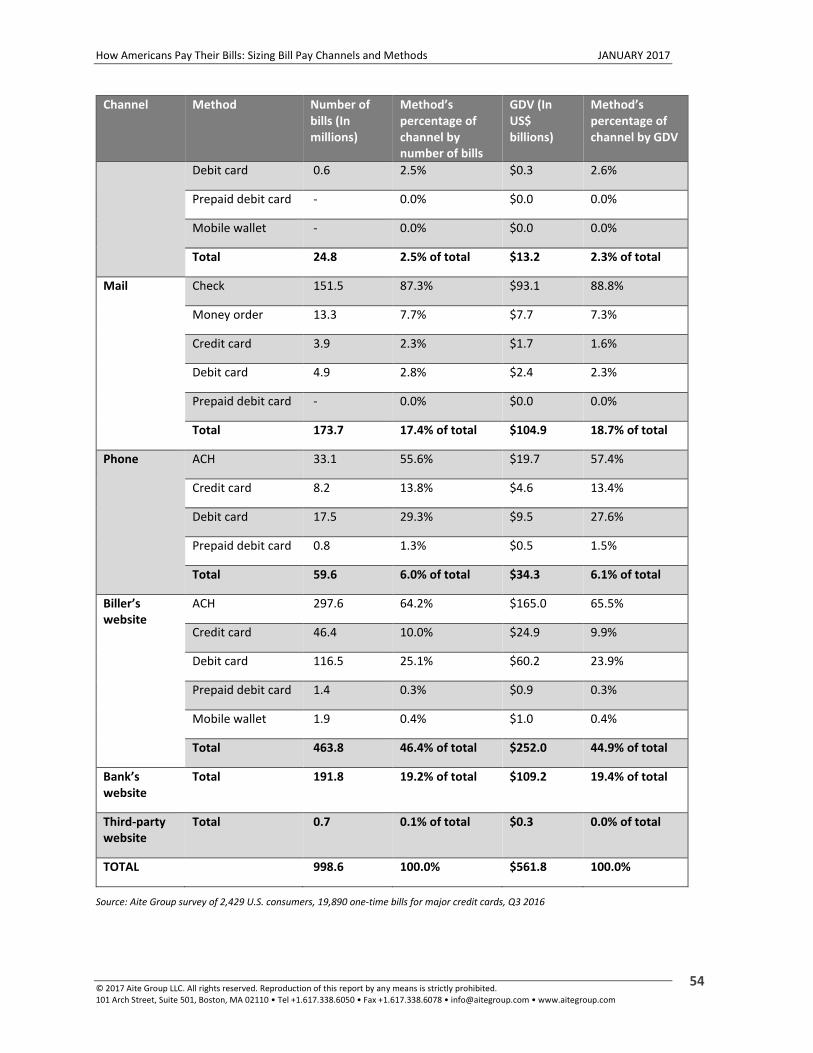
How Americans Pay Their Bills: Sizing Bill Pay Channels and Methods JANUARY 2017
© 2017 Aite Group LLC. All rights reserved. Reproduction of this report by any means is strictly prohibited. 101 Arch Street, Suite 501, Boston, MA 02110 • Tel +1.617.338.6050 • Fax +1.617.338.6078 • [email protected] • www.aitegroup.com
54
Channel Method Number of bills (In millions)
Method’s percentage of channel by number of bills
GDV (In US$ billions)
Method’s percentage of channel by GDV
Debit card 0.6 2.5% $0.3 2.6%
Prepaid debit card - 0.0% $0.0 0.0%
Mobile wallet - 0.0% $0.0 0.0%
Total 24.8 2.5% of total $13.2 2.3% of total
Mail Check 151.5 87.3% $93.1 88.8%
Money order 13.3 7.7% $7.7 7.3%
Credit card 3.9 2.3% $1.7 1.6%
Debit card 4.9 2.8% $2.4 2.3%
Prepaid debit card - 0.0% $0.0 0.0%
Total 173.7 17.4% of total $104.9 18.7% of total
Phone ACH 33.1 55.6% $19.7 57.4%
Credit card 8.2 13.8% $4.6 13.4%
Debit card 17.5 29.3% $9.5 27.6%
Prepaid debit card 0.8 1.3% $0.5 1.5%
Total 59.6 6.0% of total $34.3 6.1% of total
Biller’s website
ACH 297.6 64.2% $165.0 65.5%
Credit card 46.4 10.0% $24.9 9.9%
Debit card 116.5 25.1% $60.2 23.9%
Prepaid debit card 1.4 0.3% $0.9 0.3%
Mobile wallet 1.9 0.4% $1.0 0.4%
Total 463.8 46.4% of total $252.0 44.9% of total
Bank’s website
Total 191.8 19.2% of total $109.2 19.4% of total
Third-party website
Total 0.7 0.1% of total $0.3 0.0% of total
TOTAL 998.6 100.0% $561.8 100.0%
Source: Aite Group survey of 2,429 U.S. consumers, 19,890 one-time bills for major credit cards, Q3 2016

How Americans Pay Their Bills: Sizing Bill Pay Channels and Methods JANUARY 2017
© 2017 Aite Group LLC. All rights reserved. Reproduction of this report by any means is strictly prohibited. 101 Arch Street, Suite 501, Boston, MA 02110 • Tel +1.617.338.6050 • Fax +1.617.338.6078 • [email protected] • www.aitegroup.com
55
Table KK: Major Credit Cards Recurring Bill Payment Volume
Number of bills (In millions)
Percentage of total by number of bills
GDV (In US$ billions)
Percentage of total by GDV
Channel Mail or phone 52.9 17.7% $27.4 17.5%
Biller’s website 150.9 50.5% $80.8 51.4%
Bank’s website 90.8 30.4% $46.3 29.5%
Do not know 4.3 1.4% $2.6 1.6%
TOTAL 298.9 100.0% $157.1 100.0%
Method ACH 222.0 74.3% $119.8 76.2%
Credit card 46.1 15.4% $22.2 14.1%
Debit card 26.9 9.0% $13.5 8.6%
Prepaid debit card 3.9 1.3% $1.7 1.1%
TOTAL 298.9 100.0% $157.1 100.0%
Source: Aite Group survey of 2,429 U.S. consumers, 5,244 recurring bills for major credit cards, Q3 2016
RETAIL/DEPARTMENT STORE CREDIT CARDS
Retail/department store credit cards, which include store credit cards specific to stores such as Macy’s or Target, are tied with major credit cards as the second-highest recurring payments made via the banks’ websites at 30.4% (Table LL, Table MM).
Table LL: Retail/Department Store Credit Cards One-Time Bill Payment Volume
Channel Method Number of bills (In millions)
Method’s percentage of channel by number of bills
GDV (In US$ billions)
Method’s percentage of channel by GDV
Direct debit Total 22.6 5.5% of total $2.5 5.5% of total
In person Check 6.0 19.7% $0.6 18.2%
Money order 0.5 1.8% $0.1 1.9%
Cash 9.3 30.7% $1.1 30.9%
Credit card 4.3 14.3% $0.5 14.8%
Debit card 9.0 29.9% $1.0 30.6%
Prepaid debit card 1.1 3.6% $0.1 3.5%
Mobile wallet - 0.0% $0.0 0.0%
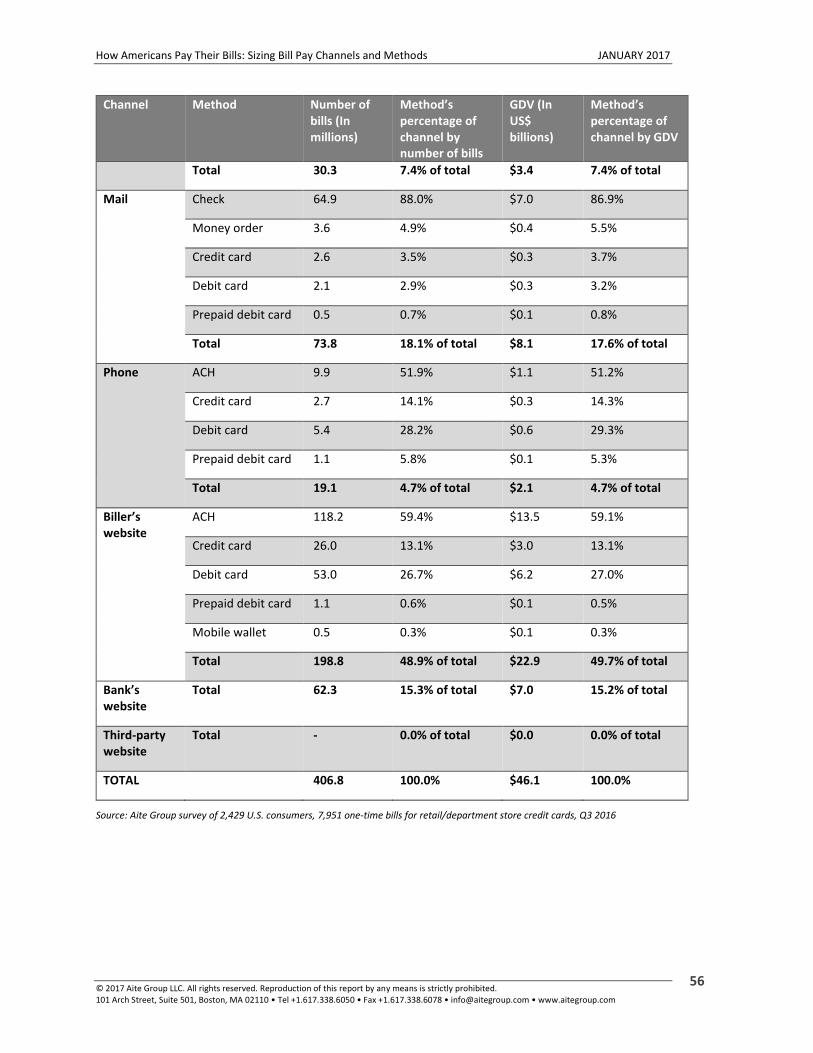
How Americans Pay Their Bills: Sizing Bill Pay Channels and Methods JANUARY 2017
© 2017 Aite Group LLC. All rights reserved. Reproduction of this report by any means is strictly prohibited. 101 Arch Street, Suite 501, Boston, MA 02110 • Tel +1.617.338.6050 • Fax +1.617.338.6078 • [email protected] • www.aitegroup.com
56
Channel Method Number of bills (In millions)
Method’s percentage of channel by number of bills
GDV (In US$ billions)
Method’s percentage of channel by GDV
Total 30.3 7.4% of total $3.4 7.4% of total
Mail Check 64.9 88.0% $7.0 86.9%
Money order 3.6 4.9% $0.4 5.5%
Credit card 2.6 3.5% $0.3 3.7%
Debit card 2.1 2.9% $0.3 3.2%
Prepaid debit card 0.5 0.7% $0.1 0.8%
Total 73.8 18.1% of total $8.1 17.6% of total
Phone ACH 9.9 51.9% $1.1 51.2%
Credit card 2.7 14.1% $0.3 14.3%
Debit card 5.4 28.2% $0.6 29.3%
Prepaid debit card 1.1 5.8% $0.1 5.3%
Total 19.1 4.7% of total $2.1 4.7% of total
Biller’s website
ACH 118.2 59.4% $13.5 59.1%
Credit card 26.0 13.1% $3.0 13.1%
Debit card 53.0 26.7% $6.2 27.0%
Prepaid debit card 1.1 0.6% $0.1 0.5%
Mobile wallet 0.5 0.3% $0.1 0.3%
Total 198.8 48.9% of total $22.9 49.7% of total
Bank’s website
Total 62.3 15.3% of total $7.0 15.2% of total
Third-party website
Total - 0.0% of total $0.0 0.0% of total
TOTAL 406.8 100.0% $46.1 100.0%
Source: Aite Group survey of 2,429 U.S. consumers, 7,951 one-time bills for retail/department store credit cards, Q3 2016
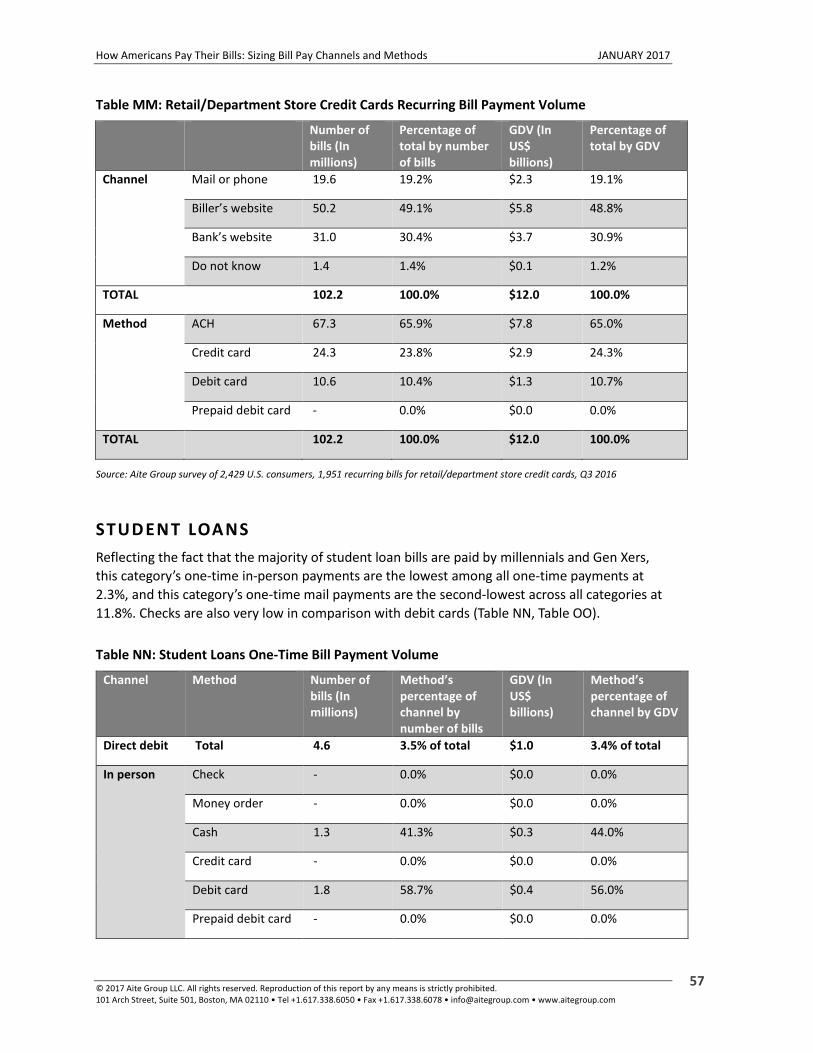
How Americans Pay Their Bills: Sizing Bill Pay Channels and Methods JANUARY 2017
© 2017 Aite Group LLC. All rights reserved. Reproduction of this report by any means is strictly prohibited. 101 Arch Street, Suite 501, Boston, MA 02110 • Tel +1.617.338.6050 • Fax +1.617.338.6078 • [email protected] • www.aitegroup.com
57
Table MM: Retail/Department Store Credit Cards Recurring Bill Payment Volume
Number of bills (In millions)
Percentage of total by number of bills
GDV (In US$ billions)
Percentage of total by GDV
Channel Mail or phone 19.6 19.2% $2.3 19.1%
Biller’s website 50.2 49.1% $5.8 48.8%
Bank’s website 31.0 30.4% $3.7 30.9%
Do not know 1.4 1.4% $0.1 1.2%
TOTAL 102.2 100.0% $12.0 100.0%
Method ACH 67.3 65.9% $7.8 65.0%
Credit card 24.3 23.8% $2.9 24.3%
Debit card 10.6 10.4% $1.3 10.7%
Prepaid debit card - 0.0% $0.0 0.0%
TOTAL 102.2 100.0% $12.0 100.0%
Source: Aite Group survey of 2,429 U.S. consumers, 1,951 recurring bills for retail/department store credit cards, Q3 2016
STUDENT LOANS
Reflecting the fact that the majority of student loan bills are paid by millennials and Gen Xers,
this category’s one-time in-person payments are the lowest among all one-time payments at
2.3%, and this category’s one-time mail payments are the second-lowest across all categories at
11.8%. Checks are also very low in comparison with debit cards (Table NN, Table OO).
Table NN: Student Loans One-Time Bill Payment Volume
Channel Method Number of bills (In millions)
Method’s percentage of channel by number of bills
GDV (In US$ billions)
Method’s percentage of channel by GDV
Direct debit Total 4.6 3.5% of total $1.0 3.4% of total
In person Check - 0.0% $0.0 0.0%
Money order - 0.0% $0.0 0.0%
Cash 1.3 41.3% $0.3 44.0%
Credit card - 0.0% $0.0 0.0%
Debit card 1.8 58.7% $0.4 56.0%
Prepaid debit card - 0.0% $0.0 0.0%

How Americans Pay Their Bills: Sizing Bill Pay Channels and Methods JANUARY 2017
© 2017 Aite Group LLC. All rights reserved. Reproduction of this report by any means is strictly prohibited. 101 Arch Street, Suite 501, Boston, MA 02110 • Tel +1.617.338.6050 • Fax +1.617.338.6078 • [email protected] • www.aitegroup.com
58
Channel Method Number of bills (In millions)
Method’s percentage of channel by number of bills
GDV (In US$ billions)
Method’s percentage of channel by GDV
Mobile wallet - 0.0% $0.0 0.0%
Total 3.1 2.3% of total $0.7 2.4% of total
Mail Check 6.1 39.4% $1.4 39.9%
Money order 3.2 20.6% $0.7 20.2%
Credit card 2.8 18.4% $0.6 18.3%
Debit card 2.8 17.8% $0.6 17.6%
Prepaid debit card 0.6 3.9% $0.1 3.9%
Total 15.5 11.8% of total $3.5 11.4% of total
Phone ACH 5.2 59.0% $1.2 57.1%
Credit card - 0.0% $0.0 0.0%
Debit card 3.6 41.0% $0.9 42.9%
Prepaid debit card - 0.0% $0.0 0.0%
Total 8.7 6.7% of total $2.0 6.7% of total
Biller’s website
ACH 53.0 60.3% $12.3 60.4%
Credit card 12.8 14.5% $3.0 14.7%
Debit card 21.6 24.6% $4.9 24.3%
Prepaid debit card 0.5 0.6% $0.1 0.6%
Mobile wallet - 0.0% $0.0 0.0%
Total 87.9 67.0% of total $20.4 67.3% of total
Bank’s website
Total 10.8 8.2% of total $2.5 8.2% of total
Third-party website
Total 0.7 0.5% of total $0.2 0.6% of total
TOTAL 131.3 100.0% $30.2 100.0%
Source: Aite Group survey of 2,429 U.S. consumers, 2,404 one-time bills for student loans, Q3 2016
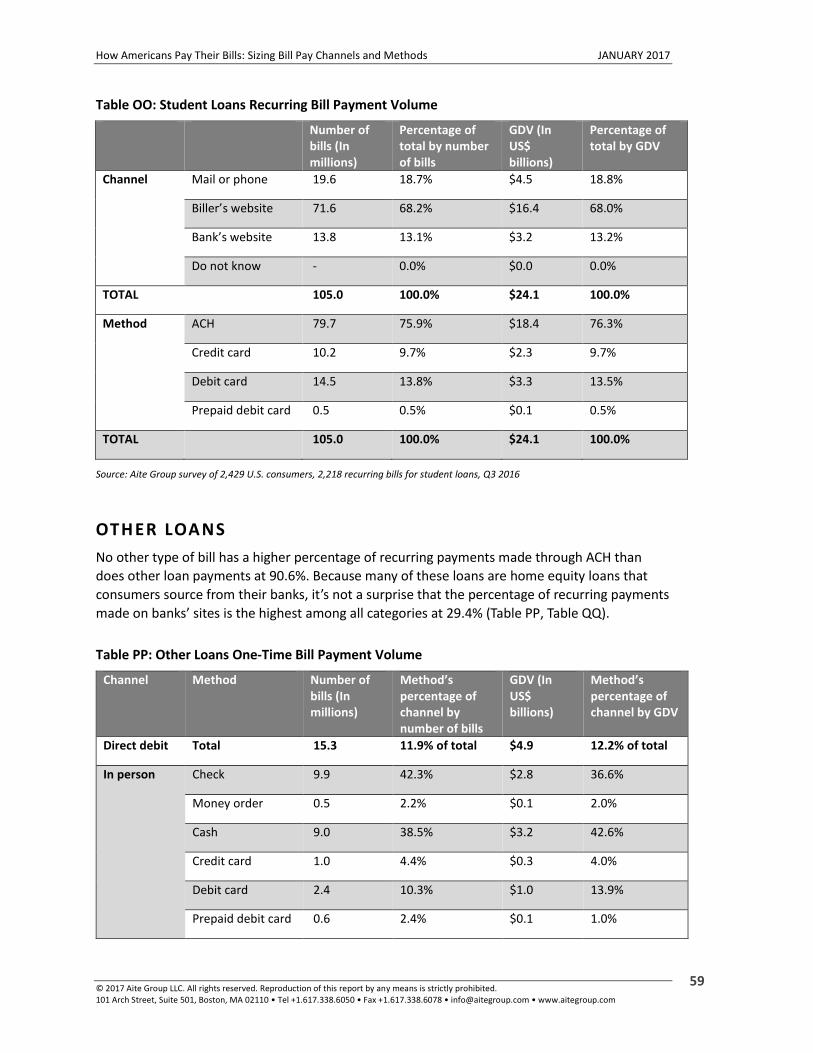
How Americans Pay Their Bills: Sizing Bill Pay Channels and Methods JANUARY 2017
© 2017 Aite Group LLC. All rights reserved. Reproduction of this report by any means is strictly prohibited. 101 Arch Street, Suite 501, Boston, MA 02110 • Tel +1.617.338.6050 • Fax +1.617.338.6078 • [email protected] • www.aitegroup.com
59
Table OO: Student Loans Recurring Bill Payment Volume
Number of bills (In millions)
Percentage of total by number of bills
GDV (In US$ billions)
Percentage of total by GDV
Channel Mail or phone 19.6 18.7% $4.5 18.8%
Biller’s website 71.6 68.2% $16.4 68.0%
Bank’s website 13.8 13.1% $3.2 13.2%
Do not know - 0.0% $0.0 0.0%
TOTAL 105.0 100.0% $24.1 100.0%
Method ACH 79.7 75.9% $18.4 76.3%
Credit card 10.2 9.7% $2.3 9.7%
Debit card 14.5 13.8% $3.3 13.5%
Prepaid debit card 0.5 0.5% $0.1 0.5%
TOTAL 105.0 100.0% $24.1 100.0%
Source: Aite Group survey of 2,429 U.S. consumers, 2,218 recurring bills for student loans, Q3 2016
OTHER LOANS
No other type of bill has a higher percentage of recurring payments made through ACH than
does other loan payments at 90.6%. Because many of these loans are home equity loans that
consumers source from their banks, it’s not a surprise that the percentage of recurring payments
made on banks’ sites is the highest among all categories at 29.4% (Table PP, Table QQ).
Table PP: Other Loans One-Time Bill Payment Volume
Channel Method Number of bills (In millions)
Method’s percentage of channel by number of bills
GDV (In US$ billions)
Method’s percentage of channel by GDV
Direct debit Total 15.3 11.9% of total $4.9 12.2% of total
In person Check 9.9 42.3% $2.8 36.6%
Money order 0.5 2.2% $0.1 2.0%
Cash 9.0 38.5% $3.2 42.6%
Credit card 1.0 4.4% $0.3 4.0%
Debit card 2.4 10.3% $1.0 13.9%
Prepaid debit card 0.6 2.4% $0.1 1.0%

How Americans Pay Their Bills: Sizing Bill Pay Channels and Methods JANUARY 2017
© 2017 Aite Group LLC. All rights reserved. Reproduction of this report by any means is strictly prohibited. 101 Arch Street, Suite 501, Boston, MA 02110 • Tel +1.617.338.6050 • Fax +1.617.338.6078 • [email protected] • www.aitegroup.com
60
Channel Method Number of bills (In millions)
Method’s percentage of channel by number of bills
GDV (In US$ billions)
Method’s percentage of channel by GDV
Mobile wallet - 0.0% $0.0 0.0%
Total 23.4 18.1% of total $7.5 18.7% of total
Mail Check 16.6 94.0% $6.6 96.7%
Money order 0.6 3.1% $0.1 1.1%
Credit card - 0.0% $0.0 0.0%
Debit card 0.5 2.9% $0.1 2.2%
Prepaid debit card - 0.0% $0.0 0.0%
Total 17.7 13.8% of total $6.8 16.8% of total
Phone ACH 5.0 51.7% $1.8 65.4%
Credit card 1.7 18.0% $0.5 17.3%
Debit card 2.2 22.9% $0.3 11.0%
Prepaid debit card 0.7 7.4% $0.2 6.3%
Total 9.7 7.5% of total $2.7 6.8% of total
Biller’s website
ACH 23.4 60.4% $6.5 63.5%
Credit card 1.7 4.5% $0.8 7.8%
Debit card 13.0 33.7% $2.9 28.0%
Prepaid debit card - 0.0% $0.0 0.0%
Mobile wallet 0.6 1.4% $0.1 0.7%
Total 38.7 30.0% of total $10.2 25.4% of total
Bank’s website
Total 24.0 18.7% of total $8.1 20.1% of total
Third-party website
Total - 0.0% of total $0.0 0.0% of total
TOTAL 128.7 100.0% $40.4 100.0%
Source: Aite Group survey of 2,429 U.S. consumers, 2,325 one-time bills for other loans, Q3 2016
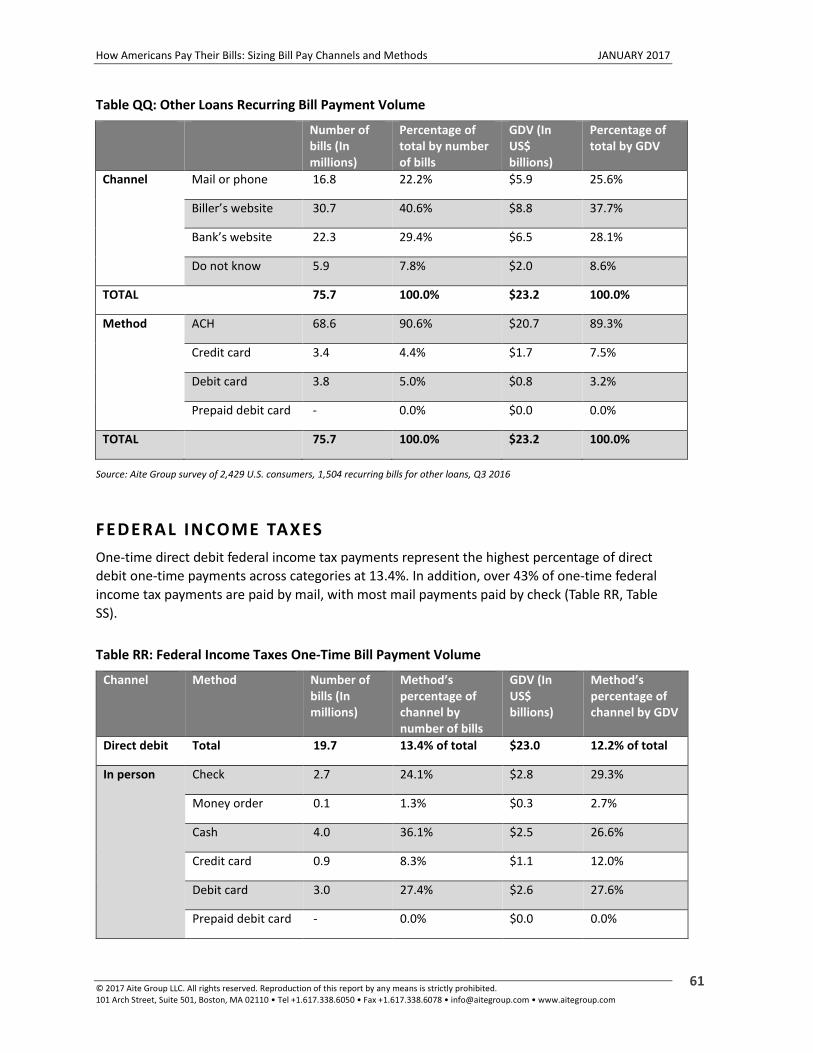
How Americans Pay Their Bills: Sizing Bill Pay Channels and Methods JANUARY 2017
© 2017 Aite Group LLC. All rights reserved. Reproduction of this report by any means is strictly prohibited. 101 Arch Street, Suite 501, Boston, MA 02110 • Tel +1.617.338.6050 • Fax +1.617.338.6078 • [email protected] • www.aitegroup.com
61
Table QQ: Other Loans Recurring Bill Payment Volume
Number of bills (In millions)
Percentage of total by number of bills
GDV (In US$ billions)
Percentage of total by GDV
Channel Mail or phone 16.8 22.2% $5.9 25.6%
Biller’s website 30.7 40.6% $8.8 37.7%
Bank’s website 22.3 29.4% $6.5 28.1%
Do not know 5.9 7.8% $2.0 8.6%
TOTAL 75.7 100.0% $23.2 100.0%
Method ACH 68.6 90.6% $20.7 89.3%
Credit card 3.4 4.4% $1.7 7.5%
Debit card 3.8 5.0% $0.8 3.2%
Prepaid debit card - 0.0% $0.0 0.0%
TOTAL 75.7 100.0% $23.2 100.0%
Source: Aite Group survey of 2,429 U.S. consumers, 1,504 recurring bills for other loans, Q3 2016
FEDERAL INCOME TAXES
One-time direct debit federal income tax payments represent the highest percentage of direct
debit one-time payments across categories at 13.4%. In addition, over 43% of one-time federal
income tax payments are paid by mail, with most mail payments paid by check (Table RR, Table
SS).
Table RR: Federal Income Taxes One-Time Bill Payment Volume
Channel Method Number of bills (In millions)
Method’s percentage of channel by number of bills
GDV (In US$ billions)
Method’s percentage of channel by GDV
Direct debit Total 19.7 13.4% of total $23.0 12.2% of total
In person Check 2.7 24.1% $2.8 29.3%
Money order 0.1 1.3% $0.3 2.7%
Cash 4.0 36.1% $2.5 26.6%
Credit card 0.9 8.3% $1.1 12.0%
Debit card 3.0 27.4% $2.6 27.6%
Prepaid debit card - 0.0% $0.0 0.0%

How Americans Pay Their Bills: Sizing Bill Pay Channels and Methods JANUARY 2017
© 2017 Aite Group LLC. All rights reserved. Reproduction of this report by any means is strictly prohibited. 101 Arch Street, Suite 501, Boston, MA 02110 • Tel +1.617.338.6050 • Fax +1.617.338.6078 • [email protected] • www.aitegroup.com
62
Channel Method Number of bills (In millions)
Method’s percentage of channel by number of bills
GDV (In US$ billions)
Method’s percentage of channel by GDV
Mobile wallet 0.3 2.8% $0.2 1.8%
Total 11.1 7.5% of total $9.5 5.1% of total
Mail Check 56.1 88.0% $86.3 91.3%
Money order 2.8 4.3% $3.3 3.5%
Credit card 2.1 3.3% $2.2 2.3%
Debit card 2.6 4.1% $2.5 2.7%
Prepaid debit card 0.1 0.2% $0.3 0.3%
Total 63.8 43.3% of total $94.6 50.4% of total
Phone ACH 1.4 44.4% $1.2 41.3%
Credit card 0.8 25.4% $0.9 30.3%
Debit card 0.6 20.1% $0.7 22.5%
Prepaid debit card 0.3 10.1% $0.2 5.9%
Total 3.1 2.1% of total $2.9 1.5% of total
Biller’s website
ACH 19.1 55.3% $21.7 56.4%
Credit card 5.7 16.6% $7.3 19.0%
Debit card 9.3 26.8% $9.1 23.6%
Prepaid debit card 0.3 0.9% $0.2 0.4%
Mobile wallet 0.2 0.5% $0.2 0.6%
Total 34.6 23.5% of total $38.5 20.5% of total
Bank’s website
Total 8.3 5.6% of total $10.1 5.4% of total
Third-party website
Total 6.9 4.7% of total $9.1 4.9% of total
TOTAL 147.4 100.0% $187.7 100.0%
Source: Aite Group survey of 2,429 U.S. consumers, 2,345 one-time bills for federal income taxes, Q3 2016
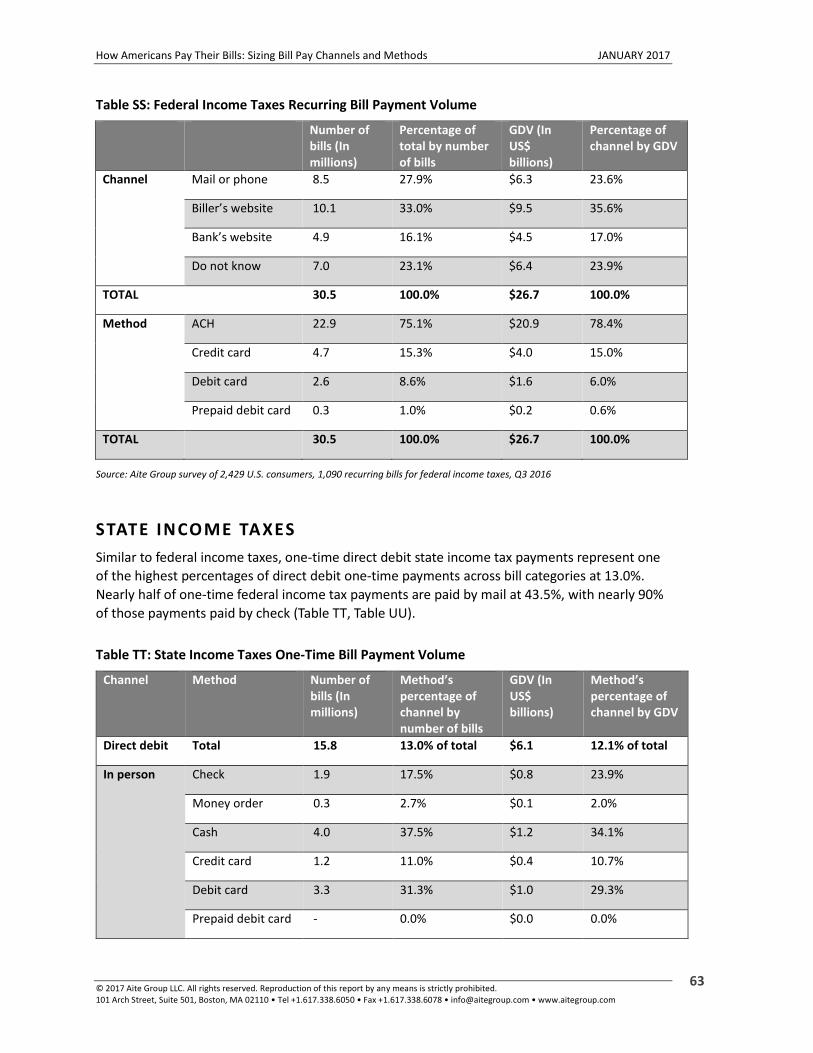
How Americans Pay Their Bills: Sizing Bill Pay Channels and Methods JANUARY 2017
© 2017 Aite Group LLC. All rights reserved. Reproduction of this report by any means is strictly prohibited. 101 Arch Street, Suite 501, Boston, MA 02110 • Tel +1.617.338.6050 • Fax +1.617.338.6078 • [email protected] • www.aitegroup.com
63
Table SS: Federal Income Taxes Recurring Bill Payment Volume
Number of bills (In millions)
Percentage of total by number of bills
GDV (In US$ billions)
Percentage of channel by GDV
Channel Mail or phone 8.5 27.9% $6.3 23.6%
Biller’s website 10.1 33.0% $9.5 35.6%
Bank’s website 4.9 16.1% $4.5 17.0%
Do not know 7.0 23.1% $6.4 23.9%
TOTAL 30.5 100.0% $26.7 100.0%
Method ACH 22.9 75.1% $20.9 78.4%
Credit card 4.7 15.3% $4.0 15.0%
Debit card 2.6 8.6% $1.6 6.0%
Prepaid debit card 0.3 1.0% $0.2 0.6%
TOTAL 30.5 100.0% $26.7 100.0%
Source: Aite Group survey of 2,429 U.S. consumers, 1,090 recurring bills for federal income taxes, Q3 2016
STATE INCOME TAXES
Similar to federal income taxes, one-time direct debit state income tax payments represent one
of the highest percentages of direct debit one-time payments across bill categories at 13.0%.
Nearly half of one-time federal income tax payments are paid by mail at 43.5%, with nearly 90%
of those payments paid by check (Table TT, Table UU).
Table TT: State Income Taxes One-Time Bill Payment Volume
Channel Method Number of bills (In millions)
Method’s percentage of channel by number of bills
GDV (In US$ billions)
Method’s percentage of channel by GDV
Direct debit Total 15.8 13.0% of total $6.1 12.1% of total
In person Check 1.9 17.5% $0.8 23.9%
Money order 0.3 2.7% $0.1 2.0%
Cash 4.0 37.5% $1.2 34.1%
Credit card 1.2 11.0% $0.4 10.7%
Debit card 3.3 31.3% $1.0 29.3%
Prepaid debit card - 0.0% $0.0 0.0%

How Americans Pay Their Bills: Sizing Bill Pay Channels and Methods JANUARY 2017
© 2017 Aite Group LLC. All rights reserved. Reproduction of this report by any means is strictly prohibited. 101 Arch Street, Suite 501, Boston, MA 02110 • Tel +1.617.338.6050 • Fax +1.617.338.6078 • [email protected] • www.aitegroup.com
64
Channel Method Number of bills (In millions)
Method’s percentage of channel by number of bills
GDV (In US$ billions)
Method’s percentage of channel by GDV
Mobile wallet - 0.0% $0.0 0.0%
Total 10.6 8.7% of total $3.4 6.7% of total
Mail Check 47.6 89.8% $22.5 91.3%
Money order 3.7 6.9% $1.3 5.4%
Credit card 0.6 1.1% $0.3 1.2%
Debit card 0.9 1.7% $0.4 1.5%
Prepaid debit card 0.3 0.5% $0.1 0.6%
Total 53.0 43.5% of total $24.6 48.8% of total
Phone ACH 1.0 40.0% $0.3 31.1%
Credit card 0.6 23.9% $0.2 25.6%
Debit card 0.9 36.0% $0.4 43.3%
Prepaid debit card - 0.0% $0.0 0.0%
Total 2.5 2.0% of total $0.9 1.7% of total
Biller’s website
ACH 14.3 51.9% $5.5 52.8%
Credit card 4.2 15.3% $1.8 17.2%
Debit card 8.6 31.1% $3.0 28.6%
Prepaid debit card 0.3 1.1% $0.1 0.7%
Mobile wallet 0.2 0.6% $0.1 0.8%
Total 27.5 22.6% of total $10.3 20.5% of total
Bank’s website
Total 8.3 6.9% of total $3.3 6.5% of total
Third-party website
Total 4.0 3.3% of total $1.8 3.7% of total
TOTAL 121.8 100.0% $50.4 100.0%
Source: Aite Group survey of 2,429 U.S. consumers, 1,861 one-time bills for state income taxes, Q3 2016
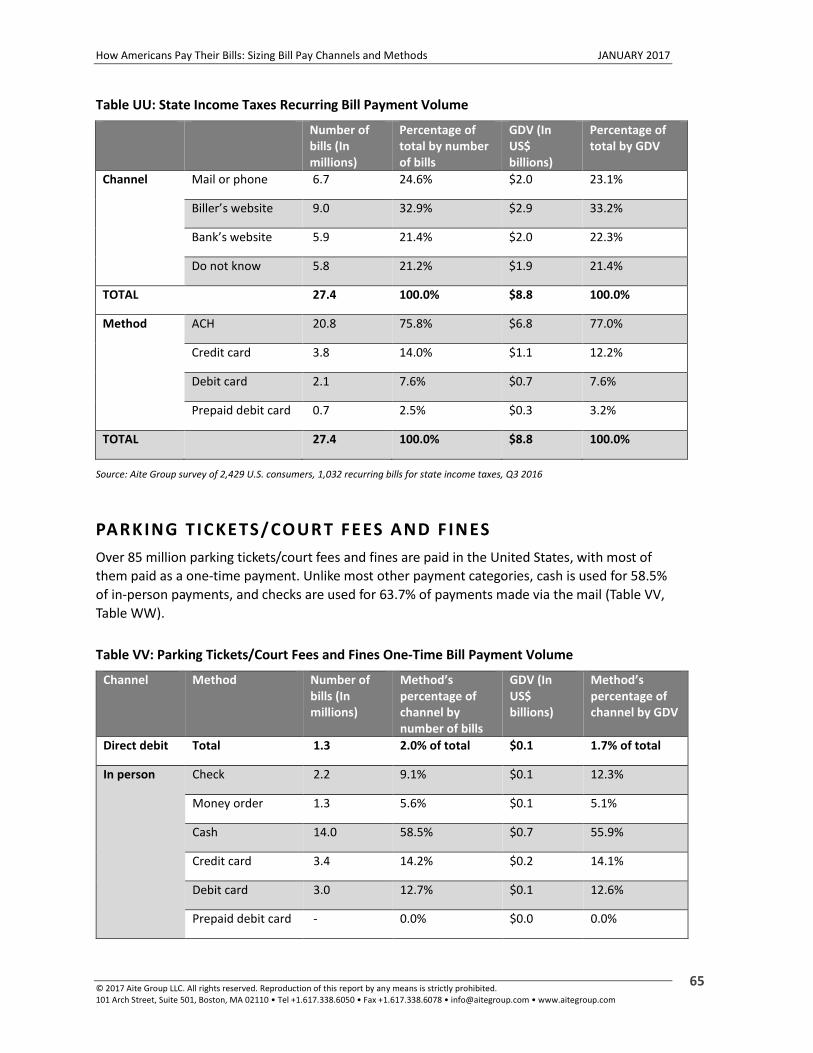
How Americans Pay Their Bills: Sizing Bill Pay Channels and Methods JANUARY 2017
© 2017 Aite Group LLC. All rights reserved. Reproduction of this report by any means is strictly prohibited. 101 Arch Street, Suite 501, Boston, MA 02110 • Tel +1.617.338.6050 • Fax +1.617.338.6078 • [email protected] • www.aitegroup.com
65
Table UU: State Income Taxes Recurring Bill Payment Volume
Number of bills (In millions)
Percentage of total by number of bills
GDV (In US$ billions)
Percentage of total by GDV
Channel Mail or phone 6.7 24.6% $2.0 23.1%
Biller’s website 9.0 32.9% $2.9 33.2%
Bank’s website 5.9 21.4% $2.0 22.3%
Do not know 5.8 21.2% $1.9 21.4%
TOTAL 27.4 100.0% $8.8 100.0%
Method ACH 20.8 75.8% $6.8 77.0%
Credit card 3.8 14.0% $1.1 12.2%
Debit card 2.1 7.6% $0.7 7.6%
Prepaid debit card 0.7 2.5% $0.3 3.2%
TOTAL 27.4 100.0% $8.8 100.0%
Source: Aite Group survey of 2,429 U.S. consumers, 1,032 recurring bills for state income taxes, Q3 2016
PARKING T ICKETS/COUR T FEES AND F INES
Over 85 million parking tickets/court fees and fines are paid in the United States, with most of
them paid as a one-time payment. Unlike most other payment categories, cash is used for 58.5%
of in-person payments, and checks are used for 63.7% of payments made via the mail (Table VV,
Table WW).
Table VV: Parking Tickets/Court Fees and Fines One-Time Bill Payment Volume
Channel Method Number of bills (In millions)
Method’s percentage of channel by number of bills
GDV (In US$ billions)
Method’s percentage of channel by GDV
Direct debit Total 1.3 2.0% of total $0.1 1.7% of total
In person Check 2.2 9.1% $0.1 12.3%
Money order 1.3 5.6% $0.1 5.1%
Cash 14.0 58.5% $0.7 55.9%
Credit card 3.4 14.2% $0.2 14.1%
Debit card 3.0 12.7% $0.1 12.6%
Prepaid debit card - 0.0% $0.0 0.0%

How Americans Pay Their Bills: Sizing Bill Pay Channels and Methods JANUARY 2017
© 2017 Aite Group LLC. All rights reserved. Reproduction of this report by any means is strictly prohibited. 101 Arch Street, Suite 501, Boston, MA 02110 • Tel +1.617.338.6050 • Fax +1.617.338.6078 • [email protected] • www.aitegroup.com
66
Channel Method Number of bills (In millions)
Method’s percentage of channel by number of bills
GDV (In US$ billions)
Method’s percentage of channel by GDV
Mobile wallet - 0.0% $0.0 0.0%
Total 24.0 35.1% of total $1.2 33.2% of total
Mail Check 10.1 63.7% $0.7 68.8%
Money order 2.8 17.9% $0.1 15.1%
Credit card 1.4 8.9% $0.1 7.6%
Debit card 1.5 9.6% $0.1 8.5%
Prepaid debit card - 0.0% $0.0 0.0%
Total 15.9 23.2% of total $1.0 26.9% of total
Phone ACH 0.4 11.5% $0.0 14.7%
Credit card 0.8 23.5% $0.0 24.4%
Debit card 1.9 59.2% $0.1 53.5%
Prepaid debit card 0.2 5.8% $0.0 7.4%
Total 3.2 4.7% of total $0.2 4.7% of total
Biller’s website
ACH 1.6 8.8% $0.1 10.2%
Credit card 8.6 46.2% $0.4 45.0%
Debit card 8.4 45.0% $0.4 44.7%
Prepaid debit card - 0.0% $0.0 0.0%
Mobile wallet - 0.0% $0.0 0.0%
Total 18.6 27.3% of total $0.9 26.3% of total
Bank’s website
Total 4.5 6.7% of total $0.2 6.3% of total
Third-party website
Total 0.7 1.0% of total $0.0 1.0% of total
TOTAL 68.3 100.0% $3.6 100.0%
Source: Aite Group survey of 2,429 U.S. consumers, 1,131 one-time bills for parking tickets/court fees and fines, Q3 2016
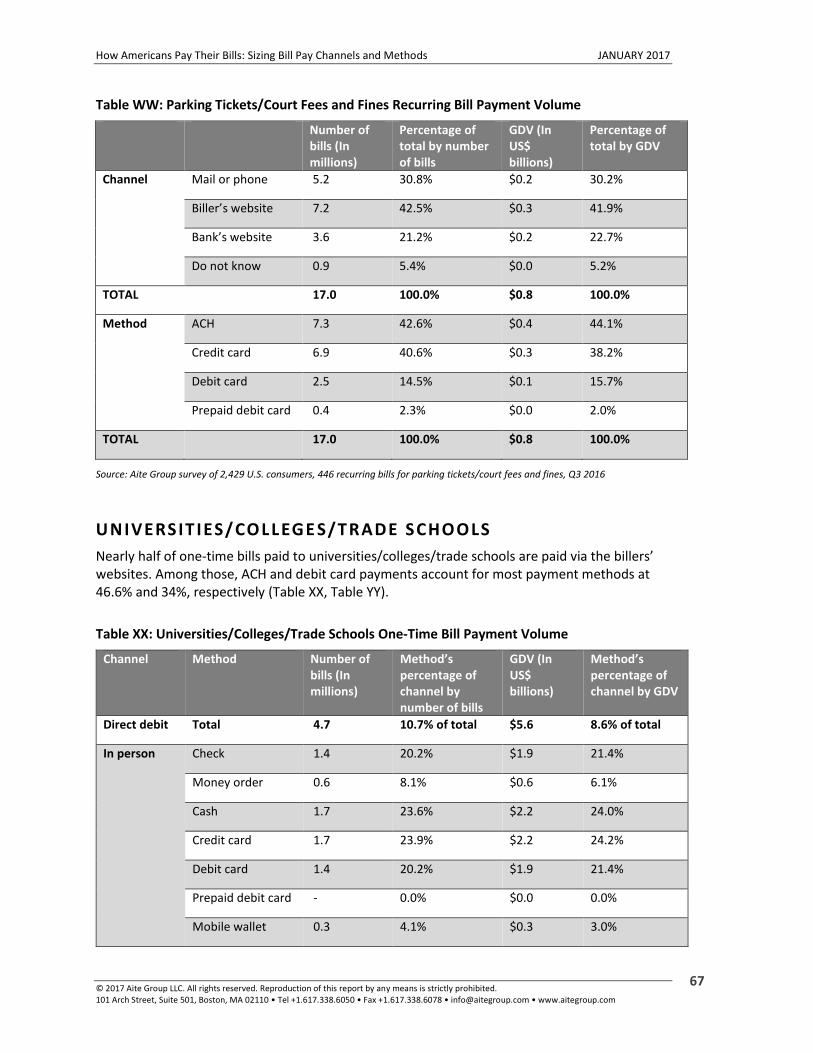
How Americans Pay Their Bills: Sizing Bill Pay Channels and Methods JANUARY 2017
© 2017 Aite Group LLC. All rights reserved. Reproduction of this report by any means is strictly prohibited. 101 Arch Street, Suite 501, Boston, MA 02110 • Tel +1.617.338.6050 • Fax +1.617.338.6078 • [email protected] • www.aitegroup.com
67
Table WW: Parking Tickets/Court Fees and Fines Recurring Bill Payment Volume
Number of bills (In millions)
Percentage of total by number of bills
GDV (In US$ billions)
Percentage of total by GDV
Channel Mail or phone 5.2 30.8% $0.2 30.2%
Biller’s website 7.2 42.5% $0.3 41.9%
Bank’s website 3.6 21.2% $0.2 22.7%
Do not know 0.9 5.4% $0.0 5.2%
TOTAL 17.0 100.0% $0.8 100.0%
Method ACH 7.3 42.6% $0.4 44.1%
Credit card 6.9 40.6% $0.3 38.2%
Debit card 2.5 14.5% $0.1 15.7%
Prepaid debit card 0.4 2.3% $0.0 2.0%
TOTAL 17.0 100.0% $0.8 100.0%
Source: Aite Group survey of 2,429 U.S. consumers, 446 recurring bills for parking tickets/court fees and fines, Q3 2016
UNIVERSIT IES/COLLEGE S/TRADE SCHOOLS
Nearly half of one-time bills paid to universities/colleges/trade schools are paid via the billers’ websites. Among those, ACH and debit card payments account for most payment methods at 46.6% and 34%, respectively (Table XX, Table YY).
Table XX: Universities/Colleges/Trade Schools One-Time Bill Payment Volume
Channel Method Number of bills (In millions)
Method’s percentage of channel by number of bills
GDV (In US$ billions)
Method’s percentage of channel by GDV
Direct debit Total 4.7 10.7% of total $5.6 8.6% of total
In person Check 1.4 20.2% $1.9 21.4%
Money order 0.6 8.1% $0.6 6.1%
Cash 1.7 23.6% $2.2 24.0%
Credit card 1.7 23.9% $2.2 24.2%
Debit card 1.4 20.2% $1.9 21.4%
Prepaid debit card - 0.0% $0.0 0.0%
Mobile wallet 0.3 4.1% $0.3 3.0%
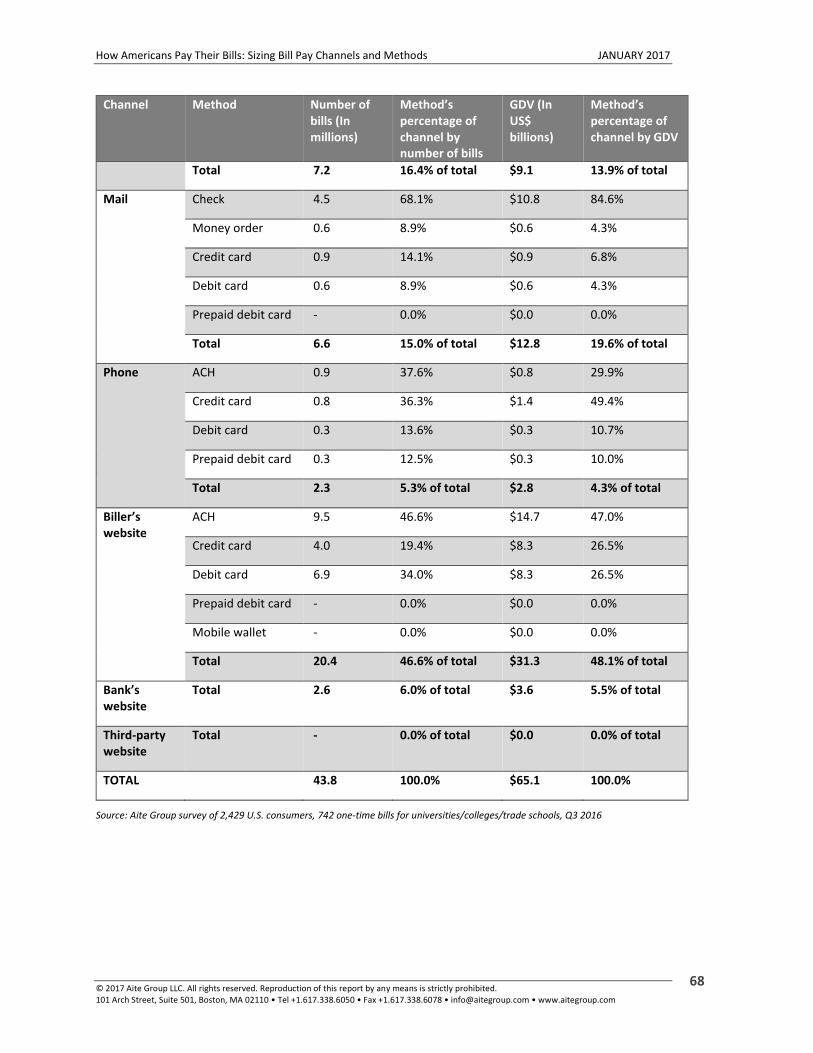
How Americans Pay Their Bills: Sizing Bill Pay Channels and Methods JANUARY 2017
© 2017 Aite Group LLC. All rights reserved. Reproduction of this report by any means is strictly prohibited. 101 Arch Street, Suite 501, Boston, MA 02110 • Tel +1.617.338.6050 • Fax +1.617.338.6078 • [email protected] • www.aitegroup.com
68
Channel Method Number of bills (In millions)
Method’s percentage of channel by number of bills
GDV (In US$ billions)
Method’s percentage of channel by GDV
Total 7.2 16.4% of total $9.1 13.9% of total
Mail Check 4.5 68.1% $10.8 84.6%
Money order 0.6 8.9% $0.6 4.3%
Credit card 0.9 14.1% $0.9 6.8%
Debit card 0.6 8.9% $0.6 4.3%
Prepaid debit card - 0.0% $0.0 0.0%
Total 6.6 15.0% of total $12.8 19.6% of total
Phone ACH 0.9 37.6% $0.8 29.9%
Credit card 0.8 36.3% $1.4 49.4%
Debit card 0.3 13.6% $0.3 10.7%
Prepaid debit card 0.3 12.5% $0.3 10.0%
Total 2.3 5.3% of total $2.8 4.3% of total
Biller’s website
ACH 9.5 46.6% $14.7 47.0%
Credit card 4.0 19.4% $8.3 26.5%
Debit card 6.9 34.0% $8.3 26.5%
Prepaid debit card - 0.0% $0.0 0.0%
Mobile wallet - 0.0% $0.0 0.0%
Total 20.4 46.6% of total $31.3 48.1% of total
Bank’s website
Total 2.6 6.0% of total $3.6 5.5% of total
Third-party website
Total - 0.0% of total $0.0 0.0% of total
TOTAL 43.8 100.0% $65.1 100.0%
Source: Aite Group survey of 2,429 U.S. consumers, 742 one-time bills for universities/colleges/trade schools, Q3 2016
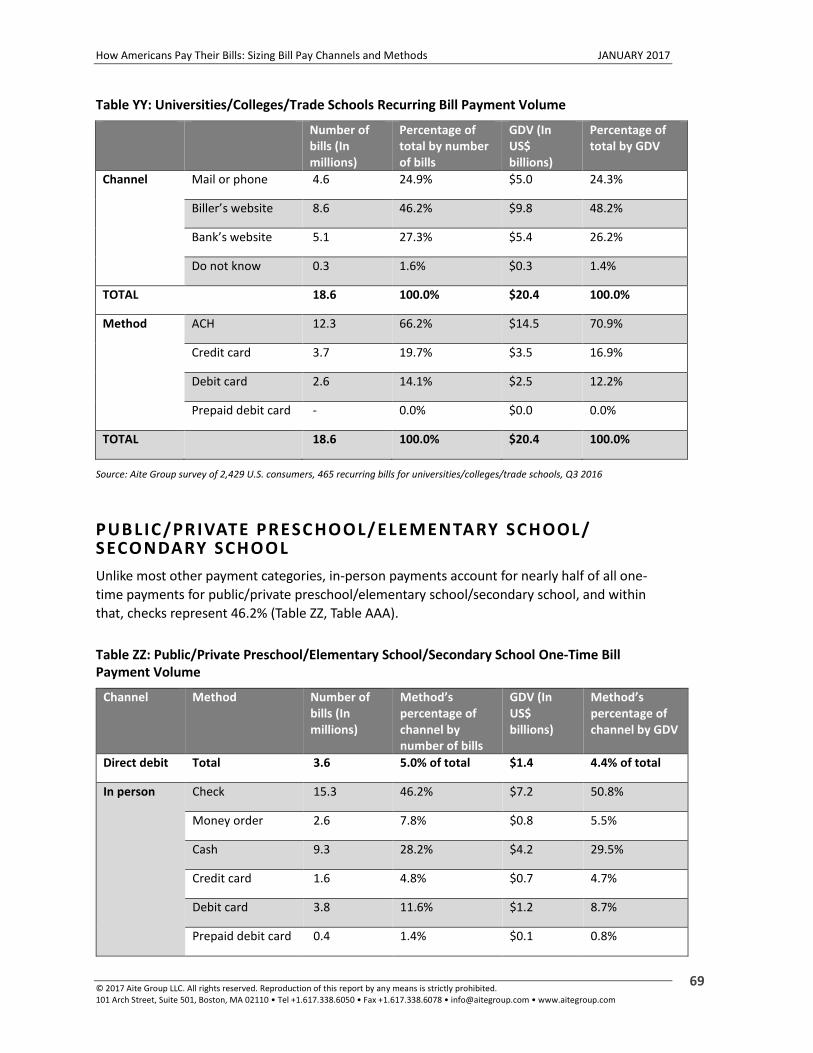
How Americans Pay Their Bills: Sizing Bill Pay Channels and Methods JANUARY 2017
© 2017 Aite Group LLC. All rights reserved. Reproduction of this report by any means is strictly prohibited. 101 Arch Street, Suite 501, Boston, MA 02110 • Tel +1.617.338.6050 • Fax +1.617.338.6078 • [email protected] • www.aitegroup.com
69
Table YY: Universities/Colleges/Trade Schools Recurring Bill Payment Volume
Number of bills (In millions)
Percentage of total by number of bills
GDV (In US$ billions)
Percentage of total by GDV
Channel Mail or phone 4.6 24.9% $5.0 24.3%
Biller’s website 8.6 46.2% $9.8 48.2%
Bank’s website 5.1 27.3% $5.4 26.2%
Do not know 0.3 1.6% $0.3 1.4%
TOTAL 18.6 100.0% $20.4 100.0%
Method ACH 12.3 66.2% $14.5 70.9%
Credit card 3.7 19.7% $3.5 16.9%
Debit card 2.6 14.1% $2.5 12.2%
Prepaid debit card - 0.0% $0.0 0.0%
TOTAL 18.6 100.0% $20.4 100.0%
Source: Aite Group survey of 2,429 U.S. consumers, 465 recurring bills for universities/colleges/trade schools, Q3 2016
PUBLIC/PRIVATE PRESC HOOL/ ELEMENTARY SCHOOL/ SECONDARY SCHOOL
Unlike most other payment categories, in-person payments account for nearly half of all one-
time payments for public/private preschool/elementary school/secondary school, and within
that, checks represent 46.2% (Table ZZ, Table AAA).
Table ZZ: Public/Private Preschool/Elementary School/Secondary School One-Time Bill Payment Volume
Channel Method Number of bills (In millions)
Method’s percentage of channel by number of bills
GDV (In US$ billions)
Method’s percentage of channel by GDV
Direct debit Total 3.6 5.0% of total $1.4 4.4% of total
In person Check 15.3 46.2% $7.2 50.8%
Money order 2.6 7.8% $0.8 5.5%
Cash 9.3 28.2% $4.2 29.5%
Credit card 1.6 4.8% $0.7 4.7%
Debit card 3.8 11.6% $1.2 8.7%
Prepaid debit card 0.4 1.4% $0.1 0.8%

How Americans Pay Their Bills: Sizing Bill Pay Channels and Methods JANUARY 2017
© 2017 Aite Group LLC. All rights reserved. Reproduction of this report by any means is strictly prohibited. 101 Arch Street, Suite 501, Boston, MA 02110 • Tel +1.617.338.6050 • Fax +1.617.338.6078 • [email protected] • www.aitegroup.com
70
Channel Method Number of bills (In millions)
Method’s percentage of channel by number of bills
GDV (In US$ billions)
Method’s percentage of channel by GDV
Mobile wallet - 0.0% $0.0 0.0%
Total 33.0 45.6% of total $14.1 42.6% of total
Mail Check 8.5 88.0% $4.9 89.7%
Money order 0.4 3.8% $0.2 4.2%
Credit card 0.3 3.6% $0.2 4.0%
Debit card 0.4 4.6% $0.1 2.1%
Prepaid debit card - 0.0% $0.0 0.0%
Total 9.6 13.3% of total $5.4 16.4% of total
Phone ACH 0.8 25.8% $0.3 23.2%
Credit card 1.5 48.4% $0.8 53.7%
Debit card 0.3 11.3% $0.2 15.2%
Prepaid debit card 0.4 14.5% $0.1 7.9%
Total 3.1 4.2% of total $1.4 4.3% of total
Biller’s website
ACH 4.7 28.0% $2.1 27.4%
Credit card 4.8 28.7% $2.0 26.2%
Debit card 6.9 41.3% $3.3 43.5%
Prepaid debit card 0.3 2.1% $0.2 2.9%
Mobile wallet - 0.0% $0.0 0.0%
Total 16.7 23.0% of total $7.6 22.9% of total
Bank’s website
Total 5.7 7.8% of total $2.7 8.1% of total
Third-party website
Total 0.7 1.0% of total $0.4 1.3% of total
TOTAL 72.4 100.0% $33.1 100.0%
Source: Aite Group survey of 2,429 U.S. consumers, 1,356 one-time bills for public/private preschool/elementary school/secondary school, Q3 2016
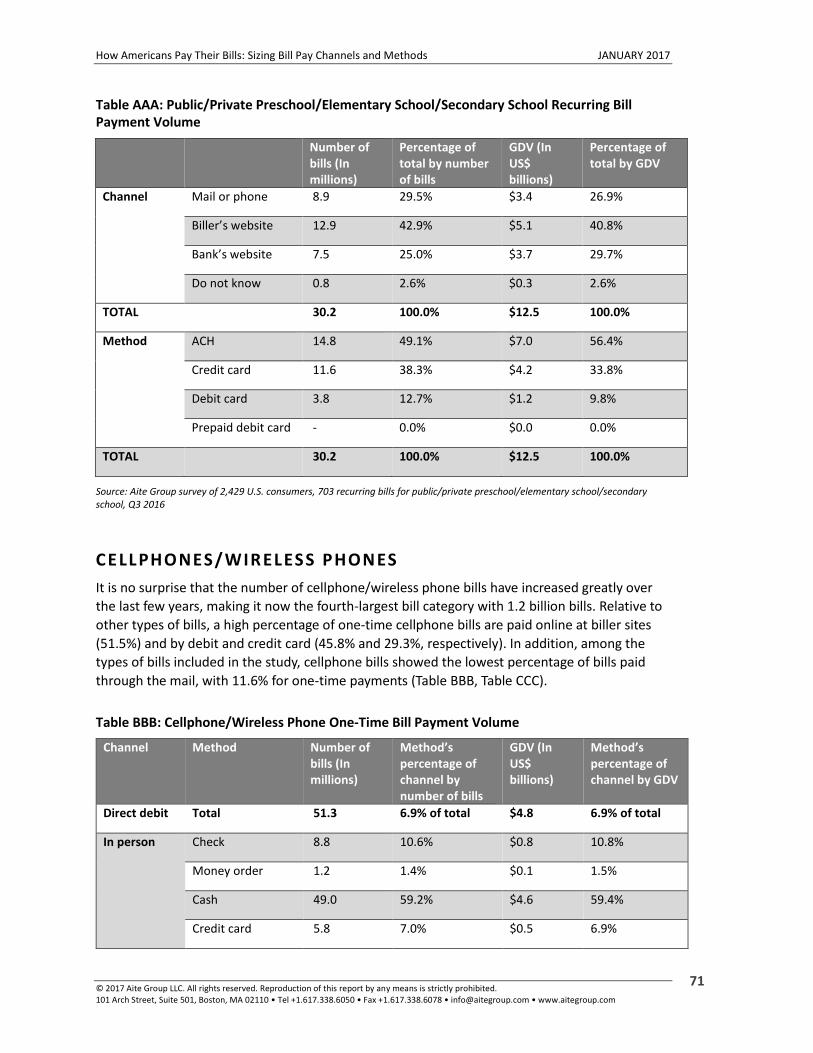
How Americans Pay Their Bills: Sizing Bill Pay Channels and Methods JANUARY 2017
© 2017 Aite Group LLC. All rights reserved. Reproduction of this report by any means is strictly prohibited. 101 Arch Street, Suite 501, Boston, MA 02110 • Tel +1.617.338.6050 • Fax +1.617.338.6078 • [email protected] • www.aitegroup.com
71
Table AAA: Public/Private Preschool/Elementary School/Secondary School Recurring Bill Payment Volume
Number of bills (In millions)
Percentage of total by number of bills
GDV (In US$ billions)
Percentage of total by GDV
Channel Mail or phone 8.9 29.5% $3.4 26.9%
Biller’s website 12.9 42.9% $5.1 40.8%
Bank’s website 7.5 25.0% $3.7 29.7%
Do not know 0.8 2.6% $0.3 2.6%
TOTAL 30.2 100.0% $12.5 100.0%
Method ACH 14.8 49.1% $7.0 56.4%
Credit card 11.6 38.3% $4.2 33.8%
Debit card 3.8 12.7% $1.2 9.8%
Prepaid debit card - 0.0% $0.0 0.0%
TOTAL 30.2 100.0% $12.5 100.0%
Source: Aite Group survey of 2,429 U.S. consumers, 703 recurring bills for public/private preschool/elementary school/secondary school, Q3 2016
CELLPHONES/WIRELESS PHONES
It is no surprise that the number of cellphone/wireless phone bills have increased greatly over
the last few years, making it now the fourth-largest bill category with 1.2 billion bills. Relative to
other types of bills, a high percentage of one-time cellphone bills are paid online at biller sites
(51.5%) and by debit and credit card (45.8% and 29.3%, respectively). In addition, among the
types of bills included in the study, cellphone bills showed the lowest percentage of bills paid
through the mail, with 11.6% for one-time payments (Table BBB, Table CCC).
Table BBB: Cellphone/Wireless Phone One-Time Bill Payment Volume
Channel Method Number of bills (In millions)
Method’s percentage of channel by number of bills
GDV (In US$ billions)
Method’s percentage of channel by GDV
Direct debit Total 51.3 6.9% of total $4.8 6.9% of total
In person Check 8.8 10.6% $0.8 10.8%
Money order 1.2 1.4% $0.1 1.5%
Cash 49.0 59.2% $4.6 59.4%
Credit card 5.8 7.0% $0.5 6.9%

How Americans Pay Their Bills: Sizing Bill Pay Channels and Methods JANUARY 2017
© 2017 Aite Group LLC. All rights reserved. Reproduction of this report by any means is strictly prohibited. 101 Arch Street, Suite 501, Boston, MA 02110 • Tel +1.617.338.6050 • Fax +1.617.338.6078 • [email protected] • www.aitegroup.com
72
Channel Method Number of bills (In millions)
Method’s percentage of channel by number of bills
GDV (In US$ billions)
Method’s percentage of channel by GDV
Debit card 17.3 20.9% $1.6 20.5%
Prepaid debit card 0.6 0.8% $0.1 0.8%
Mobile wallet - 0.0% $0.0 0.0%
Total 82.8 11.1% of total $7.8 11.1% of total
Mail Check 70.6 81.4% $6.5 80.9%
Money order 6.8 7.9% $0.7 8.5%
Credit card 3.4 3.9% $0.3 3.9%
Debit card 5.4 6.2% $0.5 6.1%
Prepaid debit card 0.5 0.6% $0.1 0.7%
Total 86.7 11.6% of total $8.1 11.5% of total
Phone ACH 9.1 16.8% $0.9 16.7%
Credit card 11.8 21.8% $1.1 21.5%
Debit card 26.6 49.3% $2.5 49.7%
Prepaid debit card 6.5 12.0% $0.6 12.1%
Total 54.0 7.2% of total $5.1 7.3% of total
Biller’s website
ACH 84.9 22.1% $8.0 22.0%
Credit card 112.5 29.3% $10.5 28.8%
Debit card 176.0 45.8% $16.8 46.2%
Prepaid debit card 6.9 1.8% $0.7 1.8%
Mobile wallet 4.0 1.0% $0.4 1.1%
Total 384.4 51.5% of total $36.4 51.8% of total
Bank’s website
Total 83.6 11.2% of total $7.8 11.1% of total
Third-party website
Total 3.1 0.4% of total $0.3 0.4% of total
TOTAL 745.9 100.0% $70.3 100.0%
Source: Aite Group survey of 2,429 U.S. consumers, 14,248 one-time bills for cellphones/wireless phones, Q3 2016

How Americans Pay Their Bills: Sizing Bill Pay Channels and Methods JANUARY 2017
© 2017 Aite Group LLC. All rights reserved. Reproduction of this report by any means is strictly prohibited. 101 Arch Street, Suite 501, Boston, MA 02110 • Tel +1.617.338.6050 • Fax +1.617.338.6078 • [email protected] • www.aitegroup.com
73
Table CCC: Cellphone/Wireless Phone Recurring Bill Payment Volume
Number of bills (In millions)
Percentage of total by number of bills
GDV (In US$ billions)
Percentage of total by GDV
Channel Mail or phone 80.3 18.5% $7.3 18.1%
Biller’s website 282.8 65.1% $26.6 65.6%
Bank’s website 60.0 13.8% $5.6 13.8%
Do not know 11.3 2.6% $1.1 2.6%
TOTAL 434.4 100.0% $40.6 100.0%
Method ACH 195.5 45.0% $18.3 45.1%
Credit card 162.1 37.3% $15.1 37.1%
Debit card 67.5 15.5% $6.3 15.6%
Prepaid debit card 9.4 2.2% $0.9 2.2%
TOTAL 434.4 100.0% $40.6 100.0%
Source: Aite Group survey of 2,429 U.S. consumers, 8,682 recurring bills for cellphones/wireless phones, Q3 2016
L IFE INSURANCE
Among all types of bills, life insurance bills showed one of the highest percentages of bills paid
through the mail, with 38.3% for one-time payments. For mail-in one-time payments, check
payments are exceptionally high at 80.8%, and for recurring payments, ACH represents 80.2%
(Table DDD, Table EEE).
Table DDD: Life Insurance One-Time Bill Payment Volume
Channel Method Number of bills (In millions)
Method’s percentage of channel by number of bills
GDV (In US$ billions)
Method’s percentage of channel by GDV
Direct debit Total 21.1 9.7% of total $3.0 9.8% of total
In person Check 3.3 20.9% $0.4 20.3%
Money order 1.3 8.0% $0.2 7.5%
Cash 2.6 16.5% $0.3 15.4%
Credit card 2.3 14.4% $0.3 15.1%
Debit card 6.4 40.2% $0.9 41.7%
Prepaid debit card - 0.0% $0.0 0.0%

How Americans Pay Their Bills: Sizing Bill Pay Channels and Methods JANUARY 2017
© 2017 Aite Group LLC. All rights reserved. Reproduction of this report by any means is strictly prohibited. 101 Arch Street, Suite 501, Boston, MA 02110 • Tel +1.617.338.6050 • Fax +1.617.338.6078 • [email protected] • www.aitegroup.com
74
Channel Method Number of bills (In millions)
Method’s percentage of channel by number of bills
GDV (In US$ billions)
Method’s percentage of channel by GDV
Mobile wallet - 0.0% $0.0 0.0%
Total 15.9 7.3% of total $2.2 7.1% of total
Mail Check 67.6 80.8% $9.4 80.5%
Money order 7.5 9.0% $1.1 9.0%
Credit card 3.6 4.3% $0.5 4.4%
Debit card 4.1 4.9% $0.6 5.0%
Prepaid debit card 0.9 1.0% $0.1 1.1%
Total 83.7 38.3% of total $11.7 38.5% of total
Phone ACH 5.5 42.6% $0.8 43.5%
Credit card 3.5 26.8% $0.5 25.9%
Debit card 3.6 27.5% $0.5 27.9%
Prepaid debit card 0.4 3.1% $0.0 2.6%
Total 12.9 5.9% of total $1.8 6.0% of total
Biller’s website
ACH 26.3 44.1% $3.7 44.1%
Credit card 15.3 25.6% $2.2 26.2%
Debit card 17.6 29.5% $2.4 28.9%
Prepaid debit card 0.5 0.8% $0.1 0.8%
Mobile wallet - 0.0% $0.0 0.0%
Total 59.6 27.3% of total $8.3 27.3% of total
Bank’s website
Total 24.7 11.3% of total $3.4 11.1% of total
Third-party website
Total 0.5 0.2% of total $0.1 0.2% of total
TOTAL 218.5 100.0% $30.4 100.0%
Source: Aite Group survey of 2,429 U.S. consumers, 3,280 one-time bills for life insurance, Q3 2016

How Americans Pay Their Bills: Sizing Bill Pay Channels and Methods JANUARY 2017
© 2017 Aite Group LLC. All rights reserved. Reproduction of this report by any means is strictly prohibited. 101 Arch Street, Suite 501, Boston, MA 02110 • Tel +1.617.338.6050 • Fax +1.617.338.6078 • [email protected] • www.aitegroup.com
75
Table EEE: Life Insurance Recurring Bill Payment Volume
Number of bills (In millions)
Percentage of total by number of bills
GDV (In US$ billions)
Percentage of total by GDV
Channel Mail or phone 82.0 30.6% $11.4 31.0%
Biller’s website 113.9 42.5% $15.6 42.6%
Bank’s website 43.0 16.1% $5.7 15.7%
Do not know 28.9 10.8% $4.0 10.8%
TOTAL 267.8 100.0% $36.7 100.0%
Method ACH 214.7 80.2% $29.5 80.4%
Credit card 35.6 13.3% $4.8 13.2%
Debit card 16.6 6.2% $2.2 6.1%
Prepaid debit card 0.9 0.4% $0.1 0.4%
TOTAL 267.8 100.0% $36.7 100.0%
Source: Aite Group survey of 2,429 U.S. consumers, 6,107 recurring bills for life insurance, Q3 2016
HEALTH INSURANCE
Over two-thirds of health insurance one-time bill payments, which are payments paid specifically
by the individual and not through payroll deduction, are made via the billers’ websites and by
mail. Eighty-seven percent of the mail-in payments are made by check, and 78% of recurring
health insurance payments are made via ACH (Table FFF, Table GGG).
Table FFF: Health Insurance One-Time Bill Payment Volume
Channel Method Number of bills (In millions)
Method’s percentage of channel by number of bills
GDV (In US$ billions)
Method’s percentage of channel by GDV
Direct debit Total 34.7 12.7% of total $7.8 12.8% of total
In person Check 4.3 27.1% $0.9 30.5%
Money order 0.5 3.1% $0.1 3.2%
Cash 3.9 24.5% $0.8 26.5%
Credit card 2.5 16.0% $0.4 14.6%
Debit card 3.1 19.7% $0.5 16.5%
Prepaid debit card 1.0 6.3% $0.2 5.9%

How Americans Pay Their Bills: Sizing Bill Pay Channels and Methods JANUARY 2017
© 2017 Aite Group LLC. All rights reserved. Reproduction of this report by any means is strictly prohibited. 101 Arch Street, Suite 501, Boston, MA 02110 • Tel +1.617.338.6050 • Fax +1.617.338.6078 • [email protected] • www.aitegroup.com
76
Channel Method Number of bills (In millions)
Method’s percentage of channel by number of bills
GDV (In US$ billions)
Method’s percentage of channel by GDV
Mobile wallet 0.5 3.3% $0.1 2.7%
Total 15.9 5.8% of total $3.0 4.9% of total
Mail Check 66.1 87.0% $15.6 88.3%
Money order 4.5 6.0% $1.0 5.6%
Credit card 2.8 3.7% $0.6 3.6%
Debit card 2.5 3.4% $0.4 2.5%
Prepaid debit card - 0.0% $0.0 0.0%
Total 76.0 27.9% of total $17.7 29.1% of total
Phone ACH 4.5 25.4% $1.0 24.8%
Credit card 6.7 37.7% $1.5 37.5%
Debit card 6.5 36.9% $1.5 37.7%
Prepaid debit card - 0.0% $0.0 0.0%
Total 17.7 6.5% of total $4.1 6.7% of total
Biller’s website
ACH 31.6 33.3% $7.3 35.0%
Credit card 26.3 27.7% $5.9 28.5%
Debit card 35.1 36.9% $7.3 34.8%
Prepaid debit card 1.0 1.0% $0.2 0.9%
Mobile wallet 1.0 1.1% $0.2 0.8%
Total 95.1 34.9% of total $20.8 34.3% of total
Bank’s website
Total 32.4 11.9% of total $7.2 11.9% of total
Third-party website
Total 0.7 0.2% of total $0.2 0.3% of total
TOTAL 272.5 100.0% $60.7 100.0%
Source: Aite Group survey of 2,429 U.S. consumers, 4,891 one-time bills for health insurance, Q3 2016

How Americans Pay Their Bills: Sizing Bill Pay Channels and Methods JANUARY 2017
© 2017 Aite Group LLC. All rights reserved. Reproduction of this report by any means is strictly prohibited. 101 Arch Street, Suite 501, Boston, MA 02110 • Tel +1.617.338.6050 • Fax +1.617.338.6078 • [email protected] • www.aitegroup.com
77
Table GGG: Health Insurance Recurring Bill Payment Volume
Number of bills (In millions)
Percentage of total by number of bills
GDV (In US$ billions)
Percentage of total by GDV
Channel Mail or phone 81.3 24.1% $18.0 24.4%
Biller’s website 158.4 47.0% $34.4 46.6%
Bank’s website 52.8 15.7% $11.1 15.1%
Do not know 44.6 13.2% $10.3 14.0%
TOTAL 337.1 100.0% $73.8 100.0%
Method ACH 263.1 78.1% $59.3 80.3%
Credit card 52.6 15.6% $10.6 14.3%
Debit card 16.4 4.9% $2.9 4.0%
Prepaid debit card 4.9 1.5% $1.0 1.3%
TOTAL 337.1 100.0% $73.8 100.0%
Source: Aite Group survey of 2,429 U.S. consumers, 6,733 recurring bills for health insurance, Q3 2016
MEDICAL
In this study, medical payments include payments related to hospital, laboratory, doctor, or
dentist bills other than copays. Similar to health insurance payments, a large number of one-
time medical bill payments are made via the billers’ websites and by mail. Eighty percent of the
mail-in payments are made by check, and 71.5% of recurring medical payments are made via
ACH (Table HHH, Table III).
Table HHH: Medical One-Time Bill Payment Volume
Channel Method Number of bills (In millions)
Method’s percentage of channel by number of bills
GDV (In US$ billions)
Method’s percentage of channel by GDV
Direct debit Total 24.6 7.4% of total $4.0 7.3% of total
In person Check 7.6 13.3% $1.2 13.1%
Money order - 0.0% $0.0 0.0%
Cash 11.6 20.2% $1.9 20.3%
Credit card 21.3 37.2% $3.6 37.6%
Debit card 15.6 27.3% $2.6 27.2%
Prepaid debit card 1.1 2.0% $0.2 1.8%
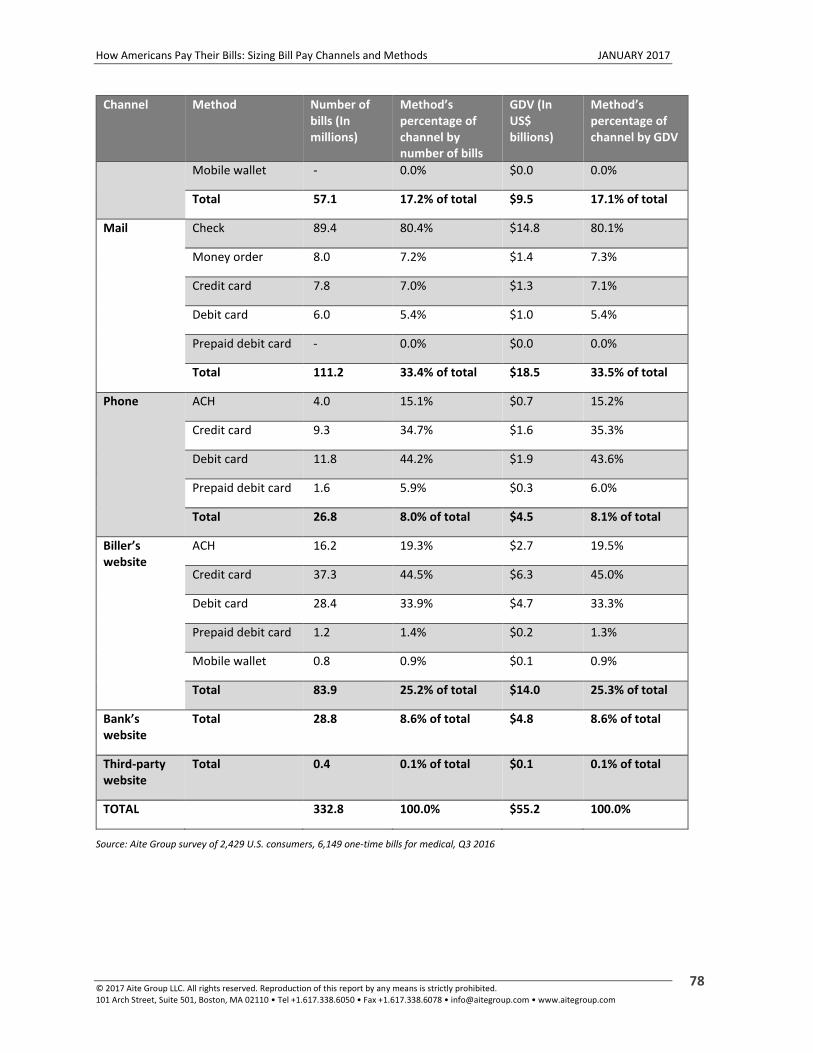
How Americans Pay Their Bills: Sizing Bill Pay Channels and Methods JANUARY 2017
© 2017 Aite Group LLC. All rights reserved. Reproduction of this report by any means is strictly prohibited. 101 Arch Street, Suite 501, Boston, MA 02110 • Tel +1.617.338.6050 • Fax +1.617.338.6078 • [email protected] • www.aitegroup.com
78
Channel Method Number of bills (In millions)
Method’s percentage of channel by number of bills
GDV (In US$ billions)
Method’s percentage of channel by GDV
Mobile wallet - 0.0% $0.0 0.0%
Total 57.1 17.2% of total $9.5 17.1% of total
Mail Check 89.4 80.4% $14.8 80.1%
Money order 8.0 7.2% $1.4 7.3%
Credit card 7.8 7.0% $1.3 7.1%
Debit card 6.0 5.4% $1.0 5.4%
Prepaid debit card - 0.0% $0.0 0.0%
Total 111.2 33.4% of total $18.5 33.5% of total
Phone ACH 4.0 15.1% $0.7 15.2%
Credit card 9.3 34.7% $1.6 35.3%
Debit card 11.8 44.2% $1.9 43.6%
Prepaid debit card 1.6 5.9% $0.3 6.0%
Total 26.8 8.0% of total $4.5 8.1% of total
Biller’s website
ACH 16.2 19.3% $2.7 19.5%
Credit card 37.3 44.5% $6.3 45.0%
Debit card 28.4 33.9% $4.7 33.3%
Prepaid debit card 1.2 1.4% $0.2 1.3%
Mobile wallet 0.8 0.9% $0.1 0.9%
Total 83.9 25.2% of total $14.0 25.3% of total
Bank’s website
Total 28.8 8.6% of total $4.8 8.6% of total
Third-party website
Total 0.4 0.1% of total $0.1 0.1% of total
TOTAL 332.8 100.0% $55.2 100.0%
Source: Aite Group survey of 2,429 U.S. consumers, 6,149 one-time bills for medical, Q3 2016
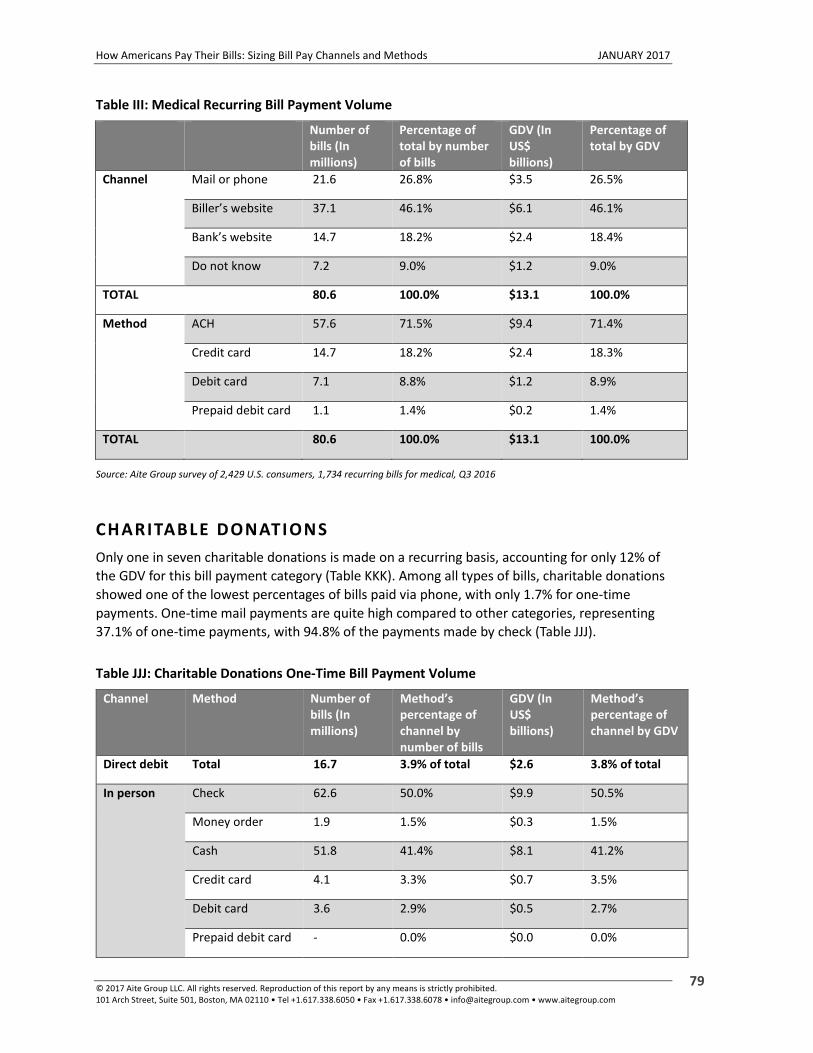
How Americans Pay Their Bills: Sizing Bill Pay Channels and Methods JANUARY 2017
© 2017 Aite Group LLC. All rights reserved. Reproduction of this report by any means is strictly prohibited. 101 Arch Street, Suite 501, Boston, MA 02110 • Tel +1.617.338.6050 • Fax +1.617.338.6078 • [email protected] • www.aitegroup.com
79
Table III: Medical Recurring Bill Payment Volume
Number of bills (In millions)
Percentage of total by number of bills
GDV (In US$ billions)
Percentage of total by GDV
Channel Mail or phone 21.6 26.8% $3.5 26.5%
Biller’s website 37.1 46.1% $6.1 46.1%
Bank’s website 14.7 18.2% $2.4 18.4%
Do not know 7.2 9.0% $1.2 9.0%
TOTAL 80.6 100.0% $13.1 100.0%
Method ACH 57.6 71.5% $9.4 71.4%
Credit card 14.7 18.2% $2.4 18.3%
Debit card 7.1 8.8% $1.2 8.9%
Prepaid debit card 1.1 1.4% $0.2 1.4%
TOTAL 80.6 100.0% $13.1 100.0%
Source: Aite Group survey of 2,429 U.S. consumers, 1,734 recurring bills for medical, Q3 2016
CHARITABLE DONATIONS
Only one in seven charitable donations is made on a recurring basis, accounting for only 12% of
the GDV for this bill payment category (Table KKK). Among all types of bills, charitable donations
showed one of the lowest percentages of bills paid via phone, with only 1.7% for one-time
payments. One-time mail payments are quite high compared to other categories, representing
37.1% of one-time payments, with 94.8% of the payments made by check (Table JJJ).
Table JJJ: Charitable Donations One-Time Bill Payment Volume
Channel Method Number of bills (In millions)
Method’s percentage of channel by number of bills
GDV (In US$ billions)
Method’s percentage of channel by GDV
Direct debit Total 16.7 3.9% of total $2.6 3.8% of total
In person Check 62.6 50.0% $9.9 50.5%
Money order 1.9 1.5% $0.3 1.5%
Cash 51.8 41.4% $8.1 41.2%
Credit card 4.1 3.3% $0.7 3.5%
Debit card 3.6 2.9% $0.5 2.7%
Prepaid debit card - 0.0% $0.0 0.0%

How Americans Pay Their Bills: Sizing Bill Pay Channels and Methods JANUARY 2017
© 2017 Aite Group LLC. All rights reserved. Reproduction of this report by any means is strictly prohibited. 101 Arch Street, Suite 501, Boston, MA 02110 • Tel +1.617.338.6050 • Fax +1.617.338.6078 • [email protected] • www.aitegroup.com
80
Channel Method Number of bills (In millions)
Method’s percentage of channel by number of bills
GDV (In US$ billions)
Method’s percentage of channel by GDV
Mobile wallet 1.1 0.8% $0.1 0.7%
Total 125.1 29.0% of total $19.7 29.0% of total
Mail Check 151.8 94.8% $23.8 94.6%
Money order 3.4 2.1% $0.6 2.3%
Credit card 4.0 2.5% $0.6 2.4%
Debit card 1.0 0.6% $0.2 0.7%
Prepaid debit card - 0.0% $0.0 0.0%
Total 160.2 37.1% of total $25.1 37.0% of total
Phone ACH - 0.0% $0.0 0.0%
Credit card 4.4 60.9% $0.7 62.3%
Debit card 2.2 31.2% $0.4 29.6%
Prepaid debit card 0.6 7.9% $0.1 8.0%
Total 7.2 1.7% of total $1.2 1.8% of total
Biller’s website
ACH 15.7 17.0% $2.5 16.9%
Credit card 45.7 49.3% $7.1 48.9%
Debit card 27.8 29.9% $4.4 30.2%
Prepaid debit card 0.4 0.5% $0.1 0.5%
Mobile wallet 3.1 3.3% $0.5 3.5%
Total 92.8 21.5% of total $14.6 21.5% of total
Bank’s website
Total 27.2 6.3% of total $4.4 6.5% of total
Third-party website
Total 2.3 0.5% of total $0.3 0.5% of total
TOTAL 431.4 100.0% $67.9 100.0%
Source: Aite Group survey of 2,429 U.S. consumers, 7,736 one-time bills for charitable donations, Q3 2016
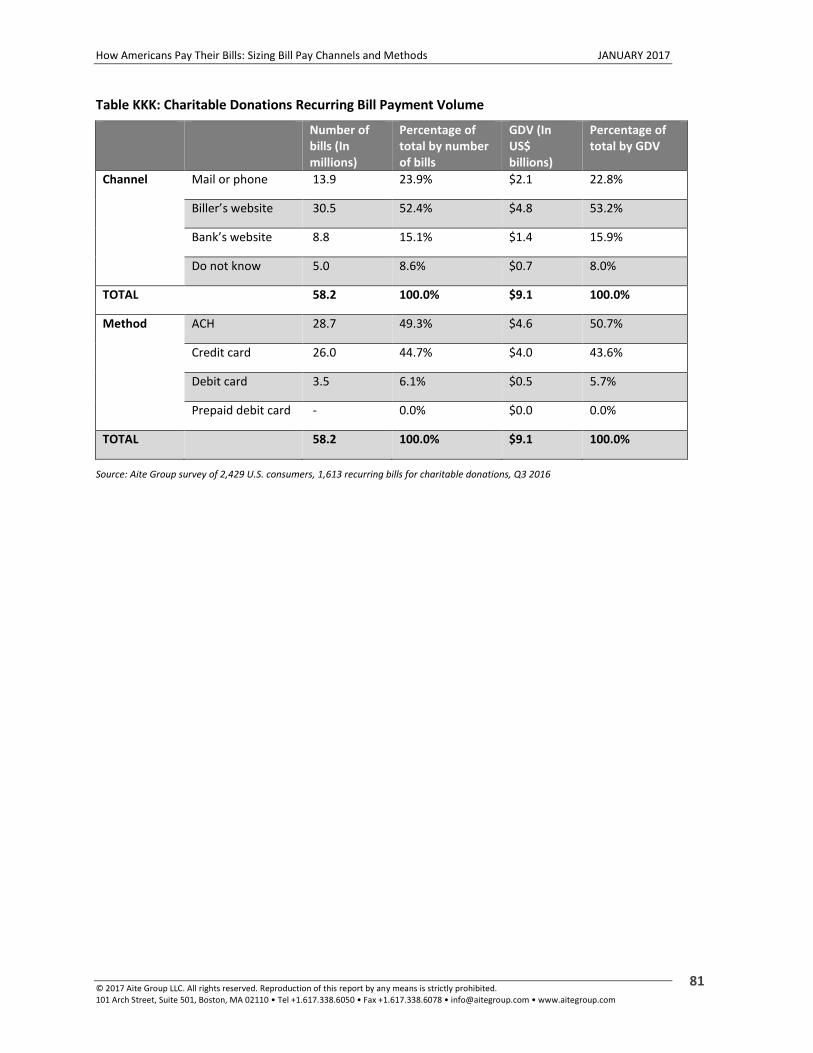
How Americans Pay Their Bills: Sizing Bill Pay Channels and Methods JANUARY 2017
© 2017 Aite Group LLC. All rights reserved. Reproduction of this report by any means is strictly prohibited. 101 Arch Street, Suite 501, Boston, MA 02110 • Tel +1.617.338.6050 • Fax +1.617.338.6078 • [email protected] • www.aitegroup.com
81
Table KKK: Charitable Donations Recurring Bill Payment Volume
Number of bills (In millions)
Percentage of total by number of bills
GDV (In US$ billions)
Percentage of total by GDV
Channel Mail or phone 13.9 23.9% $2.1 22.8%
Biller’s website 30.5 52.4% $4.8 53.2%
Bank’s website 8.8 15.1% $1.4 15.9%
Do not know 5.0 8.6% $0.7 8.0%
TOTAL 58.2 100.0% $9.1 100.0%
Method ACH 28.7 49.3% $4.6 50.7%
Credit card 26.0 44.7% $4.0 43.6%
Debit card 3.5 6.1% $0.5 5.7%
Prepaid debit card - 0.0% $0.0 0.0%
TOTAL 58.2 100.0% $9.1 100.0%
Source: Aite Group survey of 2,429 U.S. consumers, 1,613 recurring bills for charitable donations, Q3 2016
How Americans Pay Their Bills: Sizing Bill Pay Channels and Methods JANUARY 2017
© 2017 Aite Group LLC. All rights reserved. Reproduction of this report by any means is strictly prohibited. 101 Arch Street, Suite 501, Boston, MA 02110 • Tel +1.617.338.6050 • Fax +1.617.338.6078 • [email protected] • www.aitegroup.com
82
CONCLUSION
Based on our study of the bill payment behaviors of U.S. consumers, Aite Group concludes the
following:
Customer demographics and behaviors are shifting. Bill payment behaviors and
methods vary greatly across generations and across the various bill payment
categories. By and large, the always-connected, mobile-first customers are more
likely to select their various service providers for richer online or mobile capabilities.
Banks and billers need to have a long-term view and dedicate resources to digital
channels. Consumer behavior at large is slow to change, and many still pay bills
through the mail, in person, and by check. Nevertheless, consumer behavior is
clearly shifting. By investing now and encouraging consumers to migrate to self-
service channels, banks and billers will reap the benefits later.
Banks and billers should attempt to remove frictions and barriers from bill
payment activities. Benefitting from a shorter and easier payment process,
consumers are far more likely to complete such processes via automated channels,
ultimately resulting in higher consumer satisfaction.
Faster payments offer a great opportunity to banks and billers. While consumer
ACH bill payments already account for over 46% of total bill payments, there is an
opportunity for payment providers at large to develop cost-effective, innovative
payment solutions that take advantage of same-day processing, which will help
meet consumers’ expectations for immediacy.
Banks and billers should look to their payment vendors and partners. These
partners can help to fill out banks’ and billers’ product offerings, help them to
develop and implement new payment-related solutions, and even help to educate
the organization on what products and services have been successfully implemented
in other markets around the globe.
How Americans Pay Their Bills: Sizing Bill Pay Channels and Methods JANUARY 2017
© 2017 Aite Group LLC. All rights reserved. Reproduction of this report by any means is strictly prohibited. 101 Arch Street, Suite 501, Boston, MA 02110 • Tel +1.617.338.6050 • Fax +1.617.338.6078 • [email protected] • www.aitegroup.com
83
RELATED AITE GROUP RESEARCH
Top 10 Trends in Retail Banking & Payments, 2016: The Quest to Reduce Friction, January 2016.
Business-to-Consumer Disbursements: The Check’s … in the Mail?, December 2015.
Sizing Person-to-Person Payments in the United States, November 2015.
Sizing E-Bill Adoption in the United States, April 2014.
How Americans Pay Their Bills: Sizing and Forecasting Bill Pay Channels and Methods, 2013-
2016, September 2013.
How Americans Pay Their Bills: Sizing Bill Pay Channels and Methods JANUARY 2017
© 2017 Aite Group LLC. All rights reserved. Reproduction of this report by any means is strictly prohibited. 101 Arch Street, Suite 501, Boston, MA 02110 • Tel +1.617.338.6050 • Fax +1.617.338.6078 • [email protected] • www.aitegroup.com
84
ABOUT AITE GROUP
Aite Group is a global research and advisory firm delivering comprehensive, actionable advice on
business, technology, and regulatory issues and their impact on the financial services industry.
With expertise in banking, payments, insurance, wealth management, and the capital markets,
we guide financial institutions, technology providers, and consulting firms worldwide. We
partner with our clients, revealing their blind spots and delivering insights to make their
businesses smarter and stronger. Visit us on the web and connect with us on Twitter and
LinkedIn.
AUTHOR INFORMATION
David Albertazzi
+1.617.398.5036
Research design and data:
Judy Fishman +1.617.338.6067
Alina Basu +4.0742.278.879
CONTACT
For more information on research and consulting services, please contact:
Aite Group Sales +1.617.338.6050
For all press and conference inquiries, please contact:
Aite Group PR +1.617.398.5048
For all other inquiries, please contact:

How Americans Pay Their Bills: Sizing Bill Pay Channels and Methods JANUARY 2017
© 2017 Aite Group LLC. All rights reserved. Reproduction of this report by any means is strictly prohibited. 101 Arch Street, Suite 501, Boston, MA 02110 • Tel +1.617.338.6050 • Fax +1.617.338.6078 • [email protected] • www.aitegroup.com
85
ABOUT ACI WORLDWIDE
ACI Worldwide, the Universal Payments (UP) company, powers electronic payments for more
than 5,100 organizations around the world. More than 1,000 of the largest financial institutions
and intermediaries as well as thousands of global merchants rely on ACI to execute US$14 trillion
each day in payments and securities. In addition, myriad organizations utilize our electronic bill
presentment and payment services. Through our comprehensive suite of software and SaaS-
based solutions, we deliver real-time, immediate payments capabilities and enable the industry’s
most complete omnichannel payments experience. To learn more about ACI, please
visit www.aciworldwide.com. You can also find us on Twitter @ACI_Worldwide.