
How Accurate Are Self-Reported High School Courses, Course ...€¦ · course grades that were...
40
Edgar Sanchez, PhD Richard Buddin, PhD How Accurate Are Self-Reported High School Courses, Course Grades, and Grade Point Average? ACT Research Report Series 2016 (3)
Transcript of How Accurate Are Self-Reported High School Courses, Course ...€¦ · course grades that were...

Edgar Sanchez, PhD
Richard Buddin, PhD
How Accurate Are Self-Reported High School Courses, Course Grades, and
Grade Point Average?
ACT Research Report Series 2016 (3)

© 2016 by ACT, Inc. All rights reserved. 5269
Edgar Sanchez, a research scientist in the Statistical and Applied Research
Department at ACT, works on predictive modeling of student educational
outcomes such as enrollment, persistence, and graduation.
Richard Buddin is a principal research economist at ACT. His research
focuses on statistical evaluations of education and workforce programs.
AcknowledgmentsThe authors are grateful to Kurt Burkum, Michelle Croft, Ty Cruce, Joann
Moore, Richard Sawyer, and James Sconing for comments on an earlier draft.

ContentsAbstract . . . . . . . . . . . . . . . . . . . . . . . . . . . . . . . . . . . . . . . . . . . . . . . . . . . . . . . . . . . . . . . . . . . . . . . . . . . . . . . . . . iv
Introduction . . . . . . . . . . . . . . . . . . . . . . . . . . . . . . . . . . . . . . . . . . . . . . . . . . . . . . . . . . . . . . . . . . . . . . . . . . . . . . 1
Literature Review. . . . . . . . . . . . . . . . . . . . . . . . . . . . . . . . . . . . . . . . . . . . . . . . . . . . . . . . . . . . . . . . . . . . . . . 1
Research Approach . . . . . . . . . . . . . . . . . . . . . . . . . . . . . . . . . . . . . . . . . . . . . . . . . . . . . . . . . . . . . . . . . . . . . . 3
Data . . . . . . . . . . . . . . . . . . . . . . . . . . . . . . . . . . . . . . . . . . . . . . . . . . . . . . . . . . . . . . . . . . . . . . . . . . . . . . . . . . . 3
Relationship between Accuracy and Student Characteristics . . . . . . . . . . . . . . . . . . . . . . . . . . . . . 6
Results . . . . . . . . . . . . . . . . . . . . . . . . . . . . . . . . . . . . . . . . . . . . . . . . . . . . . . . . . . . . . . . . . . . . . . . . . . . . . . . . . . . 7
Accuracy of Self-Reported Coursework . . . . . . . . . . . . . . . . . . . . . . . . . . . . . . . . . . . . . . . . . . . . . . . . . 7
Accuracy of Self-Reported Grades . . . . . . . . . . . . . . . . . . . . . . . . . . . . . . . . . . . . . . . . . . . . . . . . . . . . . 11
Accuracy of Self-Reported HSGPA . . . . . . . . . . . . . . . . . . . . . . . . . . . . . . . . . . . . . . . . . . . . . . . . . . . . 16
Discussion . . . . . . . . . . . . . . . . . . . . . . . . . . . . . . . . . . . . . . . . . . . . . . . . . . . . . . . . . . . . . . . . . . . . . . . . . . . . . . 18
How Accurately Do Students Self-Report High School Courses and Grade Information? . 18
Does Accuracy Differ by Student Gender, Race/Ethnicity, or Family Income Level? . . . . . . . 19
Conclusion . . . . . . . . . . . . . . . . . . . . . . . . . . . . . . . . . . . . . . . . . . . . . . . . . . . . . . . . . . . . . . . . . . . . . . . . . . . . . . 19
References . . . . . . . . . . . . . . . . . . . . . . . . . . . . . . . . . . . . . . . . . . . . . . . . . . . . . . . . . . . . . . . . . . . . . . . . . . . . . 20
Appendix . . . . . . . . . . . . . . . . . . . . . . . . . . . . . . . . . . . . . . . . . . . . . . . . . . . . . . . . . . . . . . . . . . . . . . . . . . . . . . . 22

AbstractEducation researchers and college admissions officials often rely on self-reported coursework and
grade information provided by high school students. This study compares the self-reported course
and grade information of ACT®-tested students in a midwestern state with data from their high
school transcripts. The evidence shows that for the most part, students’ self-reported information
accurately represents their high school experience. About 94% of students accurately reported
taking particular courses. The correlation between self-reported and transcript course grades was
0.66, with 96% of self-reported grades within a single letter grade of the transcript grade. High
school grade point average (HSGPA) computed from self-reported course grades was highly
correlated with transcript grade point average (r=0.83). The accuracy of coursework and grades
differed little by gender, race/ethnicity, and low-income status. The results indicate that self-reported
coursework and grade are reasonably accurate measures for use in education research and for
preliminary screening of students by college admissions officials.
Keywords: self-reported student data, high school grades, high school coursework

1
IntroductionEducation researchers often study the relationship between high school coursework, grades, and
admissions test scores on college enrollment and persistence, grade point average (GPA), and on-
time degree completion (Adelman, 2006; Schmitt et al., 2009; Radunzel & Noble, 2012; Sanchez,
2013; Mattern, Patterson, & Wyatt. 2013). However, researchers often do not have access to high
school transcript data; instead, they must rely on student self-reported course and grade information.
One of the assumptions of their research is that the self-reported information adequately reflects
student background and high school preparation.
College recruiters and postsecondary administrators also use student self-reported information to
identify and encourage potential applicants with suitable preparation to apply to their institutions
(Gonyea, 2005).1 Ultimately, colleges obtain high school transcripts for making admission
decisions, but self-reported information provides an efficient preliminary way to identify students
adequately prepared for college. Moreover, course titles vary considerably from district to district,
so postsecondary administrators may have difficulty assessing and categorizing high school
coursework. A concise and comprehensive list of important courses may help postsecondary
administrators efficiently identify qualified applicants.
This study examines two questions related to the accuracy of students’ self-reported information:
• How accurately do students report their coursework and grades?
• Does accuracy vary by gender, race/ethnicity, family income, or ACT test score?
The remainder of the report is divided into four sections. The next section, the literature review,
reviews previous research on the accuracy of high school students’ self-reports of coursework and
grades. This is followed by a section that describes our data and statistical approach. The results
for courses taken, grades in individual courses, and overall high school GPA (HSGPA) are then
presented. Finally, the results are discussed and conclusions are offered.
Literature ReviewValiga (1987) examined the accuracy of self-reported course taking and grades for about 1,000
students from twenty-six Kentucky and Illinois high schools that registered to take the ACT in April
or June of 1983. In that study, the correlations between self-reported and transcript grades ranged
from 0.75 for Computer Science to 0.92 for English 11 with a median correlation of 0.86. Overall,
about 80% of students accurately reported their grades.
Sawyer, Laing, and Houston (1988) assessed the accuracy of self-reported coursework and grades
using data from about 1,000 ACT-tested students in the 1985–1986 academic year from fifty-three
high schools. Across thirty courses, they found that the rate of accurately reporting coursework
taken ranged from 65% for American Government to 97% for English 9 and 10. The median
1 Many large universities rely on student applicants to self-report their high school courses and grades (Postal, 2014; Wurth, 2013). Colleges may rely on the self-reported information for admission decisions and require students to submit official transcripts prior to enrollment. Admission decisions may be revoked if students are inaccurate in their self-reported information (Gordon, 2009).

2
ACT Research Report How Accurate Are Self-Reported High School Courses, Course Grades, and Grade Point Average?
accuracy rate across subjects was 87%. They also found that about 97% of students reported
course grades that were within one letter grade of their transcript grades (e.g., A and B). Moreover,
the correlations between self-reported and transcript reported grades ranged from 0.53 for Drama
to 0.89 for Trigonometry with a median correlation of 0.80. The authors showed that these findings
mostly held across race/ethnicity, gender, and ACT Composite score. The exceptions to this trend
included somewhat greater accuracy of self-reported grades for females and for students with high
ACT Composite scores.
Schiel and Noble (1991) also investigated this topic by looking at almost 2,000 students from
fifty-five high schools. This study used student data taken from the 1990 October and November
administrations of the P-ACT+ in a southern state.2 The percentage of students accurately reporting
having taken a course varied between 83% for General Mathematics and 100% for courses such
as other mathematics, Astronomy, German, and other languages with a median percentage across
courses of 96%. These percentages tended to be consistent across gender, minority, and P-ACT+
score ranges.3 The correlations between transcript and self-reported grades ranged from 0.58 for
Art to 0.85 for Spanish with a median correlation of 0.64. The percentage of students that accurately
reported their high school grades ranged from 51% for General Mathematics to 83% for music.
The percentage of students who reported their HSGPA within one letter grade of their transcript
grades ranged from 89% for General Mathematics to 98% for Chemistry. While the correlations for
males and females were similar across courses, they found that the self-reported grades of African
American students were less accurate than those of White students across the P-ACT+ scale, with
accuracy increasing as achievement increased.
Kuncel, Credé, & Thomas (2005) conducted a meta-analysis of thirty-seven studies that examined
self-reported HSGPA, class rank, and test scores. They found that the correlations between self-
reported and transcript HSGPA in English, mathematics, science, and social studies ranged from
0.80 to 0.85. They also found that the correlation between overall self-reported and actual HSGPA
was 0.82. This study found that about 82% of students tended to accurately report their overall
HSGPA, while about 12% and 4% over- and under-reported their overall HSGPA respectively.4 While
the accuracy of self-reported grades was similar for males and females, White students were found
to be more accurate than nonwhite students. In addition, they found that lower-achieving students
self-reported HSGPA less accurately than did students with a higher HSGPA.
Shaw and Mattern (2009) compared self-reported HSGPA at the time of SAT registration in high
school for over 40,000 students with high school transcript data obtained from thirty-two colleges.
They found that the average difference between students’ self-reported and school-reported
HSGPA was small (-0.04).5 They also found a high correlation between the two HSGPA measures
(r=0.73). This study found that 52% of students accurately reported their HSGPA, and an additional
37% of students self-reported their grades within one letter grade of their school-reported grades.6
These percentages were fairly consistent across gender, race/ethnicity, parental education, parental
2 The P-ACT+ was the early form of the ACT Plan® test.3 This study only compared the difference between African American and White students due to low numbers of other race/ethnicities.4 These percentages, which do not sum to 100%, are based on different studies included in the meta-analysis.5 Most studies have relied on a five-point letter grade system (e.g., A, B, C, D, F), but the data in the Shaw and Mattern (2009) study
included data from a twelve-point grade system with plus and minus grades (e.g., A-, B+). Our data only includes five-point letter grades.
6 The exact match reported in this study was lower than that reported in other studies. One plausible explanation for this is the number of categories of HSGPA in this study. This study examined eleven grade categories (A, A-, B+, B, B-, C+, C, C-, D+, D, and E or F). This gradation of HSGPA makes it more difficult to have an exact match.

3
income, and SAT score. They found higher correlations between self-reported and school-reported
HSGPA for White versus African American students, for high- versus low-income students, and for
students with high versus low SAT test scores. They further found that students were more accurate
in their self-reported grades at the upper end of the HSGPA scale.
ACT (2013) investigated the accuracy of self-reported HSGPA for almost 2,000 ACT-tested high
school students in eleven school districts from the graduating classes of 2010 and 2011. That study
found that 83% of students accurately reported their HSGPA within 0.50 units, and 58% accurately
reported their HSGPA within 0.25 units. Furthermore, this study found that the correlation between
the HSGPA reported by the student’s high school and the student’s self-reported HSGPA was 0.84.7
It also found that overall, students tended to over-report their HSGPA by 0.07 points. Additionally,
this study found that lower-achieving students tended to over-report their HSGPA to a greater
extent than did higher-achieving students.
These studies consistently show high correlations between self-reported and transcript data.
However, some of the studies are over twenty years old and included small numbers of students.
More recent studies have focused on HSGPA but have not examined the accuracy of self-reported
coursework. This study updates the prior research on course taking and grade accuracy, while
providing further information on HSGPA accuracy.
Research Approach
DataThis study relies on ACT test records and high school transcript data for over 15,000 students
from 286 high schools in a midwestern state that were in the 2009 high school graduation class.8
The ACT test record data included the Course/Grade Information Section (CGIS), which requests
self-reported course enrollment and grade information for thirty high school courses in English,
mathematics, science, social studies, foreign languages, and the arts. The transcript data provided
by the state’s department of education included details for a total of 288 high school courses. The
study followed students who took ACT Plan as sophomores in 2006–2007 and had transcript data
for at least four academic years from 2005–2006 through 2008–2009.9 About 70% of high school
students in this state take the ACT and 72% of these students enroll in college.10
In this study, we examined the accuracy of three types of student self-reported information:
coursework, individual course grades, and overall HSGPA. The following paragraphs explain how we
measured the accuracy of these three types of information.
To measure the accuracy of self-reported coursework, we compared the course names appearing in
the students’ transcripts with state sources and then mapped the 288 courses to the thirty courses
listed in the CGIS of the ACT registration form. Most students take the ACT as juniors or seniors in
7 These two HSGPA calculations may not, however, have included the same courses or weighting of each course.8 A limitation of the current study is that the data came from a single state where over 70% of students take the ACT. Prior ACT
research has shown that the demographic composition, as well as the academic performance, of students for a given state will vary as the percentage of the tested high school population increases.
9 If these students also took the ACT as seniors, we used their senior test record.10 States that have such a high testing volume, usually because of statewide testing adoption, tend to include traditional college-bound
students as well as students who do not enroll in college. As such, the data set may be less representative of traditional college-bound students. The data used in this study were not from a state that had statewide testing adoption.

4
ACT Research Report How Accurate Are Self-Reported High School Courses, Course Grades, and Grade Point Average?
high school, so most students have not completed their high school coursework when they complete
the ACT registration form.11 The registration form asks students for courses they “have taken or am
taking” and those they “have not taken but will take” before graduation. We measure the accuracy of
these self-reports by comparing courses taken or planned on the survey with courses recorded on
their high school transcripts.12
In some cases, multiple transcript courses mapped to a single CGIS course (see Table 1). For
example, English 9, English 9 Honors, and a state-approved English 9 course were mapped to the
English 9 CGIS course. Another example would be the eight possible courses that were mapped for
the Trigonometry CGIS course. These courses included Trigonometry, International Baccalaureate
Trigonometry, and Pre-Calculus/Trigonometry courses, as well as the honors courses. The CGIS
collects specific course listings in English, mathematics, science, and social science (i.e. in core
courses), but the CGIS courses in foreign languages and the arts are more generic. For example,
while foreign language and music classes may have been taken for several years of high school,
geometry or chemistry may have only been taken for a semester or a year.
Table 1. Number of Transcript Grades that Mapped to Each CGIS Course
CGIS CourseNumber of
Transcript Courses
English
English 9 3
English 10 3
English 11 3
English 12 3
Other English 15
Mathematics
Algebra 1 8
Geometry 9
Algebra 2 7
Trigonometry 8
Calculus 5
Computer Mathematics 10
Other Mathematics 9
Science
General Science 11
Biology 5
Chemistry 5
Physics 9
Social Studies
Geography 3
Government 8
US History 6
11 About 91% of the student data in our sample was from an ACT registration form completed while the students were seniors.12 Some students self-reported English 11 and English 12, but their transcript showed state-approved advanced courses that were
substitutes for these courses. In these cases, the analysis counted these courses as being consistent with the self-reported information.

5
CGIS CourseNumber of
Transcript Courses
World History 4
Economics 3
Psychology 3
Other Social Science 3
Foreign Languages
French 9
German 7
Spanish 14
Other Foreign Language 33
Art
Art 17
Drama 4
Music 17
If students took any of the possible transcript courses that mapped to a CGIS course, the students
were considered to have reported taking the course correctly. If students reported taking a course
that could not be verified in their transcript, the students were considered to have “over-reported”
their course taking. If students reported not taking a course that was found in their transcript, the
students were considered to have “under-reported” their course taking.
The second type of accuracy examined is that of the self-reported grades earned in individual
courses. When considering grades, a similar limitation in mapping transcript data and self-reported
data arises. For example, a student might take two semesters of Algebra I in high school, and the
self-reported grade could reflect either semester grade or an average of the two semester grades.
In the case of grades for the group of transcript courses, the highest grade reported from any
acceptable course is retained as the grade for that course. Given that we do not know which course
grade is being reported in the CGIS, we give the student the benefit of the highest possible grade.
Transcript course grades were recorded on a continuous scale, but the CGIS uses a discrete
scale to represent grades. We converted both the transcript grades and the CGIS grades to a
5-point numeric scale (F=0, D=1, C=2, B=3, A=4) that we used to calculate agreement rates and
correlations. If students reported grades corresponding to the grades from their transcript, they were
considered to have correctly reported their course grades. If students reported higher grades than
were found in their transcript, they were considered to have “over-reported” their course grades. If
students reported lower grades than were found in their transcript, they were considered to have
“under-reported” their course grades.
The final type of accuracy examined is the accuracy of a HSGPA calculated from self-reported
course grades when compared to a HSGPA calculated from the student’s transcript. The calculated
HSGPAs were based on twenty-three possible courses from English, mathematics, science, and
social studies. Students who had fewer than ten grades reported on their transcripts were not
included in the HSGPA calculation.
In addition to reporting the overall accuracy rates for course taking, course grades, and HSGPA,
we examined the relationship between accuracy rates, various student background characteristics
(gender, race/ethnicity, family income), and ACT Composite score. Students reported their
Table 1. (continued)

6
ACT Research Report How Accurate Are Self-Reported High School Courses, Course Grades, and Grade Point Average?
background characteristics when they registered for the ACT. Information on student gender and
race/ethnicity had virtually no missing information. Family income was not reported by about 15% of
students. Family income was imputed for students with missing family income using multiple chain
methods (Little and Rubin, 2002). The imputation was based on gender, race/ethnicity, coursework
taken, course grades, HSGPA, and ACT Composite and subject test scores. Family income was
divided into three categories: low income (less than $36,000), middle income (between $36,000
and $100,000), and high income (more than $100,000).13
Relationship between Accuracy and Student CharacteristicsWe also investigated how various student characteristics (gender, race/ethnicity, family income,
and ACT Composite test score) are related to the accuracy of self-reported information, using a
multinomial logit model.14 The model estimates the probability of three outcomes for the accuracy of
self-reported coursework and grades:
exp(xi U )
PiU = ———————————————; Student under-reports courses/grades 1 + exp(x
i U ) + exp(xi O)
1 PiC = ———————————————; Student correctly reports courses/grades 1 + exp(x
i U ) + exp(xi O)
exp(xi O )
PiO = ———————————————; Student over-reports courses/grades 1 + exp(x
i U ) + exp(xi O)
where each response was measured relative to the base category of students correctly reporting
courses or grades,
• PiU , PiC , and PiO are the probabilities for individual i of under-reporting, correctly reporting, and
over-reporting, respectively.
• xi is a vector of person-specific characteristics that could be related to the accuracy of self-
reported course or grades.
• U and Oare parameter vectors for under- and over-reported effects, respectively, relative to
correctly or accurately reporting each course or grade.
The parameters can be used for several interpretations. Each parameter indicates how a unit
change in the corresponding variable affects the relative log odds ratio of under- or over-reporting
relative to correct reporting. Alternatively, the exponential of each component of gives the relative
risk ratio (RRR) or odds ratio of being in either the under- or over-reporting group relative to the
correct reporting group. An RRR greater than one means that the individual is more likely to over- or
under-report their outcome, while an RRR less than one means that the individual is less likely to
over- or under-report their outcome. A final approach computes estimated probabilities of over- or
under-reporting coursework or grades for discrete changes in each variable, holding constant the
other variables at their means.
13 Missing values were imputed for all variables using multiple chain techniques using Stata 14.1, but the analysis was conducted on the subset of observations with complete data on the dependent variables in the statistical models. Several studies have argued that the dependent variables should be included as part of the imputation procedure but then excluded from the analysis of particular dependent variables (Little and Rubin, 2002; Allison, 2001; Von Hippel, 2007; and White et al., 2011).
14 In addition to the multivariate results, Appendix Tables A-2 (coursework) and A-3 (grades) describe patterns in over- or under-reporting by gender, race/ethnicity, family income, and ACT Composite test score.

7
The regression analysis focused on four student characteristics that might affect the accuracy of
self-reported outcomes: gender, race/ethnicity, family income, and ACT Composite test score. The
regression analysis was restricted to African American, Hispanic, and White students, because the
sample included few students in other categories.15 Family income was divided into low income (less
than $36,000), middle income (between $36,000 and $100,000), and high income (more than
$100,000). ACT Composite consisted of low test scores (less than 18), middle test scores (18 to
24), and high test scores (greater than 24). These score groups roughly correspond to the lowest
quartile, the middle two quartiles, and the top quartile.
The multinomial logit model was estimated separately for six subject areas: English, mathematics,
science, social science, foreign language, and arts.16 The specification in each area included
indicator variables for different course in the area (e.g., Geometry or Algebra II). In each area,
students have multiple observations depending on the number of subject area courses taken, so the
regression residuals are unlikely to be independent of one another (i.e., students that exaggerate
their grade in one mathematics course might be more likely than the average student to exaggerate
their grades in other mathematics courses). As a result, the traditional assumption of independent
residuals might lead to inappropriately small standard errors. The Huber/White sandwich estimator
was used to obtain a covariance structure that is robust against this type of misspecification and that
accounts for clustering through a statistical correction for correlated residuals for individual students
(Huber, 1967; White, 1980; White, 1984; Froot, 1989; Rogers, 1993; Williams, 2000; Wooldridge,
2002).
A linear regression model was also used to compare the accuracy of self-reported HSGPA relative
to transcript HSGPA. The model estimated transcript HSGPA as a function of self-reported HSGPA
(and its square), gender, race/ethnicity, family income, and ACT Composite score. This model posits
that gender, race/ethnicity, family income, and ACT Composite scores shift the relationship between
self-reported and transcript HSGPA. As with the logit analysis of coursework and grades, the
sample was restricted to students that were African American, Hispanic, or White. The Huber/White
estimator was used to allow for possible correlated residuals within each high school.
Results
Accuracy of Self-Reported CourseworkIn most subjects, students’ self-reported coursework was very consistent with the coursework
recorded on their official transcripts. Table 2 shows that self-reported course information was
generally accurate more than 90% of the time. The median accuracy across all subjects was 94%.
15 For the purposes of this study, African American and White students are those students that self-identify as African American or White and not as Hispanic.
16 The multinomial model was estimated using Stata 14.1.

8
ACT Research Report How Accurate Are Self-Reported High School Courses, Course Grades, and Grade Point Average?
Table 2. Accuracy of Self-Reported High School Course Taking
VariablePercentage
CorrectPercentage Over-Report
Percentage Under-Report
Percentage Taking Course
English
English 9 95 4 1 95
English 10 98 2 0 98
English 11 99 1 0 99
English 12 93 6 1 93
Mathematics
Algebra I 96 3 1 96
Geometry 98 2 0 98
Algebra II 95 5 0 91
Trigonometry 80 12 8 40
Beginning Calculus 82 18 0 11
Other Advanced Mathematics 46 52 2 17
Science
General Science 95 4 1 95
Biology 99 1 0 99
Chemistry 93 6 1 76
Physics 81 18 1 22
Social Studies
US History 99 1 0 99
World History 97 2 1 98
Other History 70 23 7 17
American Government 93 3 4 97
Economics 82 17 1 4
Geography 53 46 1 5
Psychology 75 23 2 16
Foreign Language
Spanish 96 2 2 81
French 96 3 1 11
German 98 2 0 2
Other Language 95 3 2 2
Arts
Art 84 7 9 71
Music 85 12 3 42
Drama 86 11 3 23
Median Values 94 5 1 74
Note: The entries are based on a comparison of individual course taken or planned with high school transcript data.

9
Student reports were especially accurate for basic coursework often taken during the freshman or
sophomore years (courses taken by over 90% of students), but they were less accurate for more
advanced coursework that was taken by a smaller percentage of students. For example, Physics was
taken by 22% of students, and 81% of students correctly self-reported taking the course. Similarly,
only 5% of students took Geography, and self-reported course taking was accurate 53% of the time.
Several reasons could explain the reduced accuracy for advanced coursework. First, students might
be embellishing their accomplishments. Students are much more likely to over-report taking or
planning to take a course (i.e., the student lists the course in CGIS, but it is not on their transcript)
than to under-report taking a course (i.e., the student does not list the course in CGIS, but it is
on their transcript). Second, student plans might change, so students planning to take advanced
coursework during their senior year might enroll in different courses than they anticipated when
they completed the CGIS.17 Third, the course names for advanced classes are sometimes more
complicated than for fundamental coursework, so students might have difficulty mapping their
coursework into CGIS categories. For example, students might not understand whether the CGIS
category “Other Advanced Mathematics” should include courses like Mathematical Applications
and Algorithms or Linear Systems and Statistics. Finally, some coursework might overlap between
classes, so students are uncertain how the work should be classified in the CGIS. For example,
a Trigonometry course might include some calculus, so the student might self-report both
Trigonometry and Beginning Calculus in the CGIS. Unfortunately, we have no basis to sort between
the alternative conjectures for why self-reporting is less accurate for advanced coursework.
Under-reporting of course taking varies little by gender, race/ethnicity, family income, or ACT
test score (see Table 3).18 African American students are more likely to under-report courses in
mathematics and science, but the magnitude of the effects is only about 0.1 percentage points
in mathematics and science. In contrast, African Americans are less likely to under-report foreign
language coursework, but the difference is only 0.4 percentage points. Under-reporting varies little
with family income. Mid- and high-level scoring students are more likely to under-report mathematics
scores than low-scoring students, but they are less likely than low-scoring students to under-report
science and social science coursework. These differences are generally small (i.e., less than 0.1
percentage points). In summary, under-reporting effects are often insignificant, significant effects are
small, and the effect signs vary across subject areas.
17 Appendix Table A-1 shows the median accuracy for courses already taken is 95%, but it is only 43% for courses that are planned. The accuracy for CGIS coursework not taken or planned is 90%. The lower accuracy for planned coursework has a small effect on overall accuracy, because only 3% of courses are planned at the time of the ACT registration survey.
18 The discussion of coursework under- and over-reporting focuses on student characteristics with regression coefficients that are significantly different from zero at the 0.05 level.

10
ACT Research Report How Accurate Are Self-Reported High School Courses, Course Grades, and Grade Point Average?
Table 3. Relative Risk Ratios and Estimated Probabilities of Under-Reporting High School Coursework by Gender, Race/Ethnicity, Family Income, and ACT Composite Range
English Mathematics ScienceSocial
ScienceForeign
Languages Arts
Relative Risk Ratios
Female 1.39 1.10 0.74* 0.93 0.87 0.95
African American 1.45 1.34* 1.79* 1.08 0.45* 1.13
Hispanic 1.80 0.97 1.14 0.93 2.67* 0.85
Income $36,000 to $100,000 1.12 1.10 0.93 0.94 0.75* 1.04
Income > $100,000 1.97 1.09 1.18 1.01 1.05 1.21*
ACT Composite 18 to 24 1.31 1.61* 0.78* 0.79* 0.73* 1.09
ACT Composite > 24 1.25 1.97* 0.61* 0.60* 0.75 1.21*
Estimated Probabilities
Male 0.001 0.016 0.010 0.023 0.007 0.051
Female 0.002 0.018 0.008 0.021 0.006 0.049
White 0.001 0.016 0.008 0.022 0.007 0.049
African American 0.002 0.022 0.014 0.024 0.003 0.056
Hispanic 0.003 0.016 0.009 0.020 0.018 0.042
Income < $36,000 0.001 0.016 0.009 0.023 0.007 0.048
Income $36,000 to $100,000 0.002 0.018 0.008 0.022 0.005 0.050
Income > $100,000 0.003 0.018 0.011 0.023 0.008 0.058
ACT Composite < 18 0.001 0.011 0.011 0.028 0.008 0.046
ACT Composite 18 to 24 0.002 0.018 0.009 0.022 0.006 0.050
ACT Composite > 24 0.002 0.022 0.007 0.017 0.006 0.055
Group Average 0.002 0.017 0.009 0.022 0.006 0.050
Note: Table entries are relative risk ratios and estimated probabilities from the multinomial logit regression in Appendix Table A-4. An asterisk for relative risk ratios indicates that the logit coefficient is significantly different from zero at the 0.05 level. The omitted reference categories are male, White, income < $36,000, and ACT Composite < 18. The regressions also include indicator variables for specific courses within each group, but these values are not shown in the table.
Over-reporting coursework varies more significantly with student characteristics than under-
reporting, but the effects from group to group are often less than 2 percentage points (see Table 4).
African American students over-reported their coursework in all subjects but social science by about
2 to 4 percentage points relative to Whites. Over-reporting rates are about 1 to 2 percentage points
higher for mid- and high-income students than for low-income students. Over-reporting for mid- and
high-scoring students is more common than for low-scoring students in English and mathematics
but less common in the other subject areas. The differences in over-reporting rates are generally
only 1 or 2 percentage points.
These small differences in the accuracy of self-report across groups are probably of little practical
importance given the high overall accuracy in most subjects. For example, a 95% accuracy versus a
93% accuracy may be statistically significant, but this small difference in accuracy is unlikely to have
a substantive effect for education researchers or college administrators.

11
Table 4. Relative Risk Ratios and Estimated Probabilities of Over-Reporting High School Coursework by Gender, Race/Ethnicity, Family Income, and ACT Composite Range
English Mathematics ScienceSocial
ScienceForeign
Languages Arts
Relative Risk Ratios
Female 1.08 0.99 0.86* 0.96 0.85* 1.10*
African American 1.45* 1.30* 1.52* 1.03 1.89* 1.22*
Hispanic 1.50* 1.18* 1.00 0.92 1.90* 0.86
Income $36,000 to $100,000 1.10 1.09* 1.12* 1.08* 0.86 0.98
Income > $100,000 1.23* 1.15* 1.30* 1.26* 0.78 1.03
ACT Composite 18 to 24 1.21* 1.16* 0.83* 1.02 0.66* 0.86*
ACT Composite > 24 1.85* 1.18* 0.81* 0.91* 0.50* 0.67*
Estimated Probabilities
Male 0.037 0.155 0.073 0.165 0.029 0.091
Female 0.040 0.153 0.063 0.158 0.024 0.100
White 0.035 0.146 0.062 0.161 0.022 0.093
African American 0.051 0.189 0.095 0.166 0.042 0.114
Hispanic 0.052 0.171 0.063 0.149 0.043 0.080
Income < $36,000 0.036 0.145 0.062 0.151 0.029 0.097
Income $36,000 to $100,000 0.039 0.158 0.070 0.164 0.025 0.095
Income > $100,000 0.044 0.167 0.081 0.190 0.022 0.100
ACT Composite < 18 0.029 0.136 0.078 0.163 0.037 0.113
ACT Composite 18 to 24 0.036 0.159 0.065 0.167 0.025 0.097
ACT Composite > 24 0.054 0.161 0.063 0.148 0.019 0.076
Group Average 0.038 0.154 0.068 0.161 0.026 0.096
Note: Table entries are relative risk ratios and estimated probabilities from the multinomial logit regression in Appendix Table A-4. An asterisk for relative risk ratios indicates that the logit coefficient is significantly different from zero at the 0.05 level. The omitted reference categories are male, White, income < $36,000, and ACT Composite < 18. The regressions also include indicator variables for specific courses within each group, but these values are not shown in the table.
Accuracy of Self-Reported GradesThe average transcript and self-reported grades for twenty-eight courses along with their
correlations are reported in Table 5.19 Correlations for the courses ranged from 0.36 for music
to 0.78 for Chemistry. The correlations are higher for less advanced coursework than for more
advanced courses taken during the senior year, perhaps an indication that some students are
estimating final grades in some courses that they have not completed. Mathematics courses tended
to have the highest correlations between self-reported and transcript grades, while art courses had
the lowest correlations.
19 Students do not have grades for courses that they plan to take, so the number of students used in the grading analysis is typically smaller than that of the course taking analysis (this is especially true for coursework typically taken in the senior year). For example, an individual student may plan to take or is currently taking Beginning Calculus as a senior but will not have a grade to self-report until the course is completed.

12
ACT Research Report How Accurate Are Self-Reported High School Courses, Course Grades, and Grade Point Average?
Table 5. Descriptive Statistics for Self-Reported and Transcript Grades
CourseTranscript Mean
(Standard Deviation)Self-Reported Mean (Standard Deviation) Correlation N
English
English 9 3.16 (0.85) 3.21 (0.81) 0.67 13,419
English 10 3.08 (0.86) 3.16 (0.80) 0.71 13,370
English 11 3.01 (0.88) 3.15 (0.83) 0.70 9,620
English 12 3.04 (0.89) 3.27 (0.80) 0.60 4,489
Mathematics
Algebra 1 3.03 (0.90) 3.11 (0.90) 0.69 13,025
Geometry 2.91 (0.96) 3.01 (0.91) 0.76 13,013
Algebra 2 2.80 (1.01) 2.94 (0.95) 0.77 11,505
Trigonometry 3.06 (0.99) 3.28 (0.84) 0.76 3,255
Calculus 3.32 (0.91) 3.41 (0.76) 0.63 768
Other Advanced Mathematics 3.05 (0.96) 3.21 (0.83) 0.58 1,283
Science
General Science 3.18 (0.83) 3.28 (0.81) 0.58 12,748
Biology 3.00 (0.90) 3.09 (0.86) 0.72 13,370
Chemistry 2.89 (0.99) 2.99 (0.94) 0.78 9,274
Physics 3.20 (0.94) 3.26 (0.85) 0.66 1,880
Social Studies
US History 3.20 (0.85) 3.31 (0.79) 0.63 12,718
World History 3.13 (0.87) 3.24 (0.82) 0.67 12,284
Other History 3.23 (0.88) 3.48 (0.70) 0.60 966
American Government 3.19 (0.87) 3.36 (0.79) 0.66 11,555
Economics 2.97 (1.10) 3.45 (0.76) 0.60 257
Geography 3.31 (0.92) 3.47 (0.71) 0.40 421
Psychology 3.17 (0.92) 3.41 (0.79) 0.63 1,190
Foreign Language
Spanish 3.35 (0.90) 3.27 (0.90) 0.70 10,783
French 3.37 (0.88) 3.29 (0.88) 0.67 1,462
German 3.39 (0.82) 3.29 (0.87) 0.69 290
Other Language 3.32 (0.84) 3.45 (0.81) 0.73 88
Arts
Art 3.57 (0.74) 3.71 (0.60) 0.51 7,559
Music 3.91 (0.40) 3.90 (0.37) 0.36 5,192
Drama 3.54 (0.81) 3.73 (0.59) 0.52 2,366
Note: All correlations are significant (p < 0.0001).
Table 6 shows the percentage of students who reported the same letter grades as their transcript
grades, reported grades within one letter grade of their transcript grades (i.e., adjacent grades),
under-reported their transcript grades, and over-reported their transcript grades. The percentages
of students who reported the same letter grades as their transcripts tended to be similar across
courses. The exact grade agreement rate ranged from 58% for English 12 to 93% for music with

13
the median agreement rate of 68%.20 The exact/adjacent agreement rates were very high for all
courses examined. The exact/adjacent agreement rate ranged from 91% for economics to 100%
for other foreign languages. In English, mathematics, science, and social studies, more students
tended to under-report their grades than over-report them. For these courses, the percentage of
students who under-reported their transcript grades ranged from 15% for Trigonometry to 30% for
economics with a median under-reporting rate of 20%. Few students over-reported grades for arts
coursework, but a fair number (about one-fifth) of students over-reported their foreign language
grades.
Table 6. Transcript and Self-Reported Coursework Grade Agreement Rates
CourseExact
AgreementExact/Adjacent
AgreementPercent
Under-ReportingPercent
Over-Reporting
English
English 9 66 96 18 16
English 10 68 97 18 14
English 11 66 97 17 17
English 12 58 95 25 17
Mathematics
Algebra 1 64 95 19 17
Geometry 68 97 18 14
Algebra 2 68 96 18 14
Trigonometry 73 97 15 11
Calculus 69 97 21 11
Other Advanced Mathematics 59 94 23 17
Science
General Science 63 94 21 16
Biology 67 97 19 14
Chemistry 70 97 17 13
Physics 67 96 19 14
Social Studies
US History 65 96 21 14
World History 65 96 21 14
Other History 70 95 22 8
American Government 68 96 20 12
Economics 65 91 30 6
Geography 60 93 24 15
Psychology 65 94 28 7
Foreign Language
Spanish 69 96 9 21
French 67 97 10 23
German 69 97 9 22
Other Language 75 100 14 11
20 Music has a high grade match rate (93%) and a relatively low correlation (0.36) between transcript and CGIS grades. These unusual results in music reflect the fact that over 90% of music students received and self-reported an “A” in music. This lack of variability in music grades drives down the estimated correlation.

14
ACT Research Report How Accurate Are Self-Reported High School Courses, Course Grades, and Grade Point Average?
CourseExact
AgreementExact/Adjacent
AgreementPercent
Under-ReportingPercent
Over-Reporting
Arts
Art 76 96 16 8
Music 93 99 3 4
Drama 75 96 18 7
Median 67 96 20 14
The under-reporting of course grades varies somewhat with student characteristics (see Table 7).21
Under-reporting rates are about 5 percentage points lower for females than for comparable males.
African Americans are more likely to under-report grades than Whites in English, social sciences,
foreign languages, and especially in the arts. The magnitude of the difference is about 2 to 3
percentage points, except for a 6 percentage point difference in the arts. Under-reporting rates
were about 2 to 3 percentage points lower for mid- and high-income students than for low-income
students in English, mathematics, and science. Under-reporting rates for mid-scoring students were
about 10 percentage points lower in all subject areas than for low-scoring students. High-scoring
students had under-reporting rates about 17 to 22 percentage points lower than those of low-
scoring students.
Table 7. Relative Risk Ratios and Estimated Probabilities of Under-Reporting High School Grades by Gender, Race/Ethnicity, Family Income, and ACT Composite Range
English Mathematics ScienceSocial
ScienceForeign
Languages Arts
Relative Risk Ratios
Female 0.74* 0.75* 0.73* 0.78* 0.64* 0.55*
African American 1.11* 1.00 1.04 1.13* 1.19* 1.61*
Hispanic 0.90 0.91 0.87 0.93 0.52* 0.98
Income $36,000 to $100,000 0.91* 0.92* 0.85* 0.94 1.06 0.97
Income > $100,000 0.92 0.88* 0.82* 0.98 0.90 1.00
ACT Composite 18 to 24 0.64* 0.63* 0.66* 0.66* 0.45* 0.50*
ACT Composite > 24 0.27* 0.26* 0.25* 0.31* 0.12* 0.18*
Estimated Probabilities
Male 0.208 0.208 0.220 0.237 0.119 0.154
Female 0.154 0.157 0.161 0.185 0.076 0.085
White 0.177 0.180 0.187 0.204 0.094 0.103
African American 0.195 0.180 0.195 0.231 0.112 0.166
Hispanic 0.159 0.165 0.162 0.191 0.049 0.101
Income < $36,000 0.189 0.190 0.206 0.215 0.093 0.115
Income $36,000 to $100,000 0.172 0.174 0.175 0.202 0.098 0.112
Income > $100,000 0.173 0.168 0.169 0.210 0.083 0.116
ACT Composite < 18 0.268 0.299 0.298 0.316 0.195 0.207
ACT Composite 18 to 24 0.173 0.189 0.196 0.209 0.089 0.104
21 The discussion of grade under- and over-reporting focuses on relative risk ratios associated with regression coefficients that are significantly different from zero.
Table 6. (continued)

15
English Mathematics ScienceSocial
ScienceForeign
Languages Arts
ACT Composite > 24 0.073 0.077 0.075 0.100 0.023 0.036
Group Average 0.179 0.180 0.187 0.208 0.095 0.114
Note: Table entries are relative risk ratios and estimated probabilities from the multinomial logit regression in Appendix Table A-5. An asterisk for relative risk ratios indicates that the logit coefficient is significantly different from zero at the 0.05 level. The omitted reference categories are male, White, income < $36,000, and ACT Composite < 18. The regressions also include indicator variables for specific courses within each group, but these values are not shown in the table.
As shown in Table 8, grade over-reporting rates also vary with gender, race/ethnicity, family income,
and test score for most subject areas. Females were less likely to over-report their grades than
males – the gap is 7 percentage points for foreign languages, but about 1 to 2 percentage points
for English, mathematics, science, and social studies. Grade over-reporting varied little with race/
ethnicity. Over-reporting was less common among middle-income students than among low-income
students (about 1 to 2 percentage points). High-income students had over-reporting rates 3 to
4 percentage points lower than those of low-income students. Holding other factors constant,
over-reporting rates were 5 to 8 percentage points lower for mid-scoring students than for low-
scoring students. Over-reporting for high-scoring students is 22 percentage points lower in foreign
languages and 8 percentage points lower in the arts than for low-scoring students.
Table 8. Relative Risk Ratios and Estimated probabilities of Over-Reporting High School Grades by Gender, Race/Ethnicity, Family Income, and ACT Composite Range
English Mathematics ScienceSocial
ScienceForeign
Languages Arts
Relative Risk Ratios
Female 0.89* 0.91* 0.88* 0.86* 0.70* 0.57*
African American 1.06 1.08 1.07 1.33* 0.92 1.40*
Hispanic 1.13 0.99 1.18* 1.17* 0.85 1.33
Income $36,000 to $100,000 0.91* 0.88* 0.83* 0.89* 0.95 0.82*
Income > $100,000 0.79* 0.80* 0.73* 0.78* 0.80* 0.63*
ACT Composite 18 to 24 0.75* 0.75* 0.75* 0.72* 0.73* 0.53*
ACT Composite > 24 0.35* 0.36* 0.38* 0.32* 0.30* 0.25*
Estimated Probabilities
Male 0.159 0.149 0.155 0.134 0.247 0.081
Female 0.142 0.136 0.137 0.116 0.174 0.046
White 0.148 0.140 0.142 0.117 0.209 0.056
African American 0.156 0.151 0.152 0.155 0.194 0.078
Hispanic 0.167 0.139 0.168 0.137 0.177 0.074
Income < $36,000 0.160 0.154 0.163 0.134 0.216 0.069
Income $36,000 to $100,000 0.146 0.136 0.135 0.119 0.205 0.057
Income > $100,000 0.126 0.124 0.119 0.104 0.172 0.043
ACT Composite < 18 0.203 0.206 0.205 0.180 0.306 0.104
ACT Composite 18 to 24 0.153 0.154 0.153 0.129 0.223 0.055
ACT Composite > 24 0.071 0.075 0.077 0.058 0.090 0.026
Group Average 0.150 0.142 0.145 0.124 0.206 0.061
Note: Table entries are relative risk ratios and estimated probabilities from the multinomial logit regression in Appendix Table A-5. An asterisk for relative risk ratios indicates that the logit coefficient is significantly different from zero at the 0.05 level. The omitted reference categories are male, White, income < $36,000, and ACT Composite < 18. The regressions also include indicator variables for specific courses within each group, but these values are not shown in the table.
Table 7. (continued)
16
ACT Research Report How Accurate Are Self-Reported High School Courses, Course Grades, and Grade Point Average?
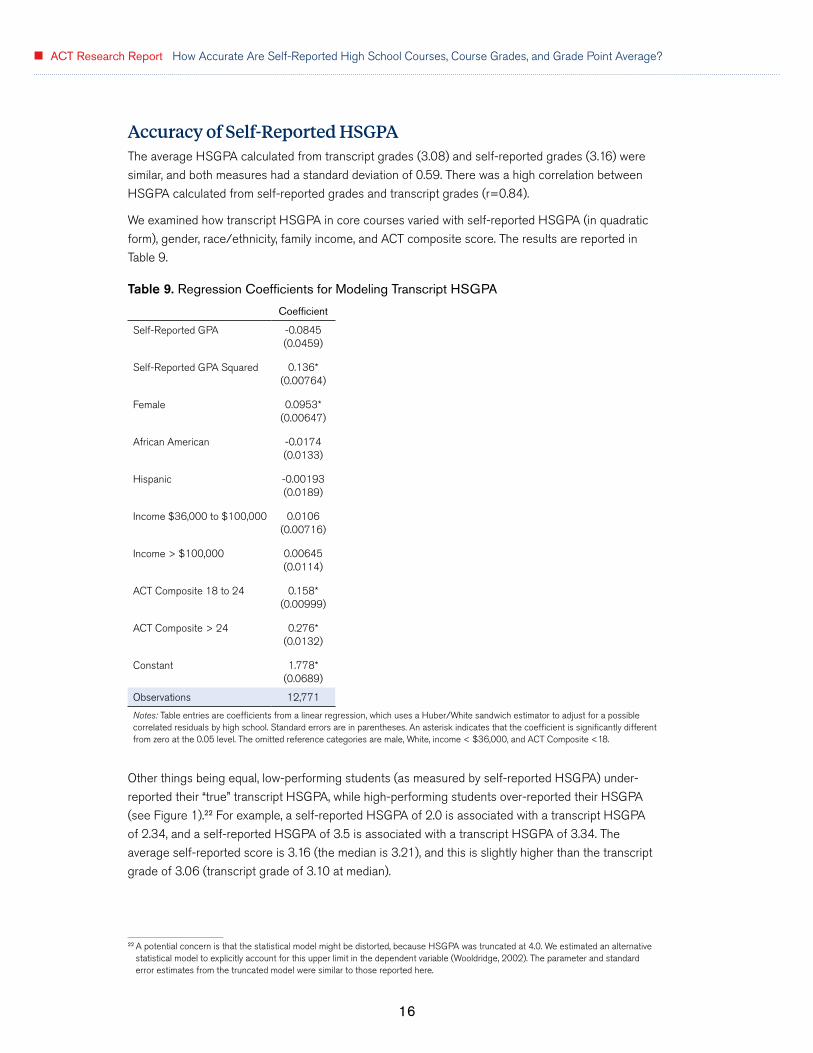
Accuracy of Self-Reported HSGPAThe average HSGPA calculated from transcript grades (3.08) and self-reported grades (3.16) were
similar, and both measures had a standard deviation of 0.59. There was a high correlation between
HSGPA calculated from self-reported grades and transcript grades (r=0.84).
We examined how transcript HSGPA in core courses varied with self-reported HSGPA (in quadratic
form), gender, race/ethnicity, family income, and ACT composite score. The results are reported in
Table 9.
Table 9. Regression Coefficients for Modeling Transcript HSGPA
Coefficient
Self-Reported GPA -0.0845(0.0459)
Self-Reported GPA Squared 0.136*(0.00764)
Female 0.0953*(0.00647)
African American -0.0174(0.0133)
Hispanic -0.00193(0.0189)
Income $36,000 to $100,000 0.0106(0.00716)
Income > $100,000 0.00645(0.0114)
ACT Composite 18 to 24 0.158*(0.00999)
ACT Composite > 24 0.276*(0.0132)
Constant 1.778*(0.0689)
Observations 12,771
Notes: Table entries are coefficients from a linear regression, which uses a Huber/White sandwich estimator to adjust for a possible correlated residuals by high school. Standard errors are in parentheses. An asterisk indicates that the coefficient is significantly different from zero at the 0.05 level. The omitted reference categories are male, White, income < $36,000, and ACT Composite <18.
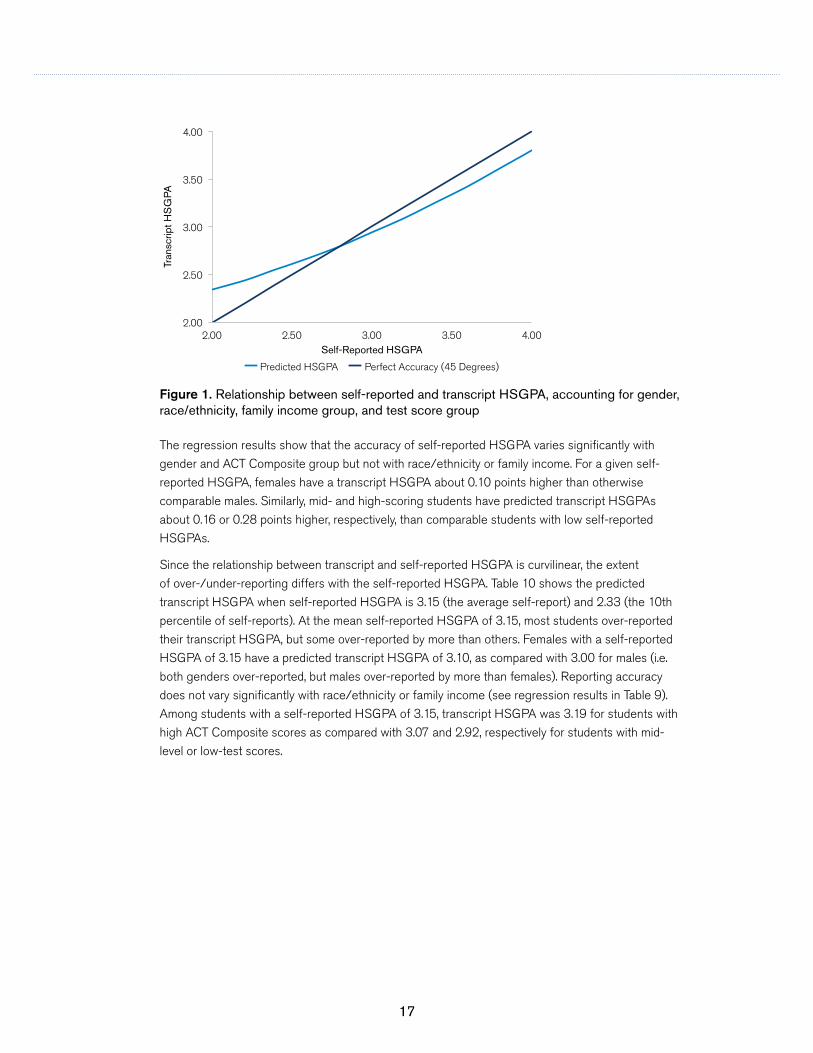
Other things being equal, low-performing students (as measured by self-reported HSGPA) under-
reported their “true” transcript HSGPA, while high-performing students over-reported their HSGPA
(see Figure 1).22 For example, a self-reported HSGPA of 2.0 is associated with a transcript HSGPA
of 2.34, and a self-reported HSGPA of 3.5 is associated with a transcript HSGPA of 3.34. The
average self-reported score is 3.16 (the median is 3.21), and this is slightly higher than the transcript
grade of 3.06 (transcript grade of 3.10 at median).
22 A potential concern is that the statistical model might be distorted, because HSGPA was truncated at 4.0. We estimated an alternative statistical model to explicitly account for this upper limit in the dependent variable (Wooldridge, 2002). The parameter and standard error estimates from the truncated model were similar to those reported here.
17
2.00
2.50
3.00
3.50
4.00
2.00 2.50 3.00 3.50 4.00
Tran
scrip
t HS
GPA
Self-Reported HSGPA
Predicted HSGPA Perfect Accuracy (45 Degrees)
Figure 1. Relationship between self-reported and transcript HSGPA, accounting for gender, race/ethnicity, family income group, and test score group
The regression results show that the accuracy of self-reported HSGPA varies significantly with
gender and ACT Composite group but not with race/ethnicity or family income. For a given self-
reported HSGPA, females have a transcript HSGPA about 0.10 points higher than otherwise
comparable males. Similarly, mid- and high-scoring students have predicted transcript HSGPAs
about 0.16 or 0.28 points higher, respectively, than comparable students with low self-reported
HSGPAs.
Since the relationship between transcript and self-reported HSGPA is curvilinear, the extent
of over-/under-reporting differs with the self-reported HSGPA. Table 10 shows the predicted
transcript HSGPA when self-reported HSGPA is 3.15 (the average self-report) and 2.33 (the 10th
percentile of self-reports). At the mean self-reported HSGPA of 3.15, most students over-reported
their transcript HSGPA, but some over-reported by more than others. Females with a self-reported
HSGPA of 3.15 have a predicted transcript HSGPA of 3.10, as compared with 3.00 for males (i.e.
both genders over-reported, but males over-reported by more than females). Reporting accuracy
does not vary significantly with race/ethnicity or family income (see regression results in Table 9).
Among students with a self-reported HSGPA of 3.15, transcript HSGPA was 3.19 for students with
high ACT Composite scores as compared with 3.07 and 2.92, respectively for students with mid-
level or low-test scores.

18
ACT Research Report How Accurate Are Self-Reported High School Courses, Course Grades, and Grade Point Average?
Table 10. Predicted Transcript HSGPA by Student Characteristics, Holding Constant Self-Reported HSGPA at 3.15 and 2.33
Self-Reported HSGPA
Characteristics 3.15 (Average) 2.33 (10th Percentile)
Male 3.00 2.46
Female 3.10 2.55
White 3.06 2.51
African American 3.04 2.50
Hispanic 3.06 2.51
Income < $36,000 3.05 2.51
Income $36,000 to $100,000 3.06 2.52
Income > $100,000 3.06 2.51
ACT Composite < 18 2.92 2.37
ACT Composite 18 to 24 3.07 2.53
ACT Composite > 24 3.19 2.65
Note: Table entries are predicted transcript HSGPA for each group of students holding other variables (except self-reported HSGPA) constant at their means.
For low levels of self-reported HSGPA, students under-predict their transcript HSGPA. For a self-
reported HSGPA of 2.33, females have a predicted transcript HSGPA of 2.55 as compared with
2.46 for males. The accuracy of self-reported HSGPA does not vary significantly with race/ethnicity
or family income. Higher-scoring students understate their HSGPA more than lower-scoring
students: For a self-reported HSPGA of 2.33, the predicted transcript HSGPA is 2.37 for lower-
scoring students, 2.53 for middle-scoring students, and 2.65 for high-scoring students.
Discussion
How Accurately Do Students Self-Report High School Courses and Grade Information?Overall, students’ self-reported coursework and grades are accurate representations of actual
coursework taken and grades. The median coursework accuracy was 94% across all English,
mathematics, science, social studies, foreign language, and arts classes. Accuracy was highest for
more fundamental coursework such as English 11, Algebra II, Chemistry, and World History.
Compared to prior studies that have examined the accuracy of self-reported coursework taking,
the current study found very similar results. While there are certainly variations among the courses
examined, this study confirms the findings of prior studies that there is substantial accuracy in self-
reported coursework.
While the correlation between self-reported course grades and transcript grades varied considerably
across courses, the median correlation for all courses was moderate (0.66). This suggests fairly
good accuracy across courses. Among courses, the median percentage of students who self-
reported the exact letter grades as their transcripts was also relatively high (67%). If we included
self-reporting within a letter grade that median percentage was 96%. We also saw that students
tended to under-report their grades more than they over-reported their grades.

19
When a HSGPA was calculated based on all self-reported grades, the correlation with transcript
HSGPA was high, r=0.83. This suggests that a HSGPA based on self-reported course-level grades
is a good analog for a HSGPA based on transcript-reported course-level grades. We also found that
students on the lower end of the self-reported HSGPA scale, below about 2.5, tend to under-report
their true HSGPA while students on the upper end of the self-reported HSGPA scale tend to slightly
over-report their true transcript HSGPA.
The median percentage of students across courses in the current study who self-reported their
grades exactly was similar to that found by previous studies. That said, the correlations between self-
reported and transcript grades found in the current study tended to be lower than those found for
similar prior research when course level grades were examined. When overall HSGPA was examined,
the correlation was consistent with prior research, with the exception of Shaw and Mattern (2009),
which found a lower correlation than other studies.23
Does Accuracy Differ by Student Gender, Race/Ethnicity, or Family Income Level?We found that the accuracy of self-reported coursework tended to be fairly similar for the student
subgroups examined. There was little to no difference in the rates of accuracy of self-reported
coursework between males and females. Hispanic students tended to under-report their coursework
slightly (relative to White students) for a handful of the courses examined; African American
students tended to under-report their coursework slightly for most courses.
Larger differences in accuracy were observed in the rates of self-reported grades exactly matching
transcript grades for student subgroups. While female students were more likely to report their exact
course grades, minority (African American and Hispanic) and low-income students were less likely
than White and other income students, respectively, to report their exact course grades.
The accuracy of self-reported HSGPA differed for some groups of students. Females had predicted
transcript HSGPA about 0.10 points higher than those of males with comparable self-reported
HSGPA. Similarly, mid- and high-scoring students had a predicted transcript HSGPA about 0.16
and 0.28 points higher, respectively, than low-scoring students with the same self-reported HSGPA.
Neither race/ethnicity nor family income levels were significantly related to the accuracy of self-
reported HSGPA.
ConclusionBased on our findings, coursework taken and overall HSGPA provided by students can be a
good measure of academic preparation and achievement for researchers and postsecondary
administrators. We find that using self-reported coursework taken is a reliable way to estimate
course-specific student-level experiences. A measure of caution, however, is appropriate for the use
of course-specific student-level grades. For the overall HSGPA of an individual, we have a stronger
basis for trusting self-reported values depending upon the purpose and use of self-reported HSGPA.
Self-reported course-specific grades earned should always be confirmed by transcript grades
for high-stakes student-level decisions. Regardless of these student-level cautions, self-reported
coursework and grades earned appear to be reasonably valid measures for preliminary outreach
decisions and for aggregate research.
23 The lower correlation in Shaw and Mattern (2009) may reflect the finer HSGPA gradations (plus and minus grades) than in the other studies.

20
ACT Research Report How Accurate Are Self-Reported High School Courses, Course Grades, and Grade Point Average?
ReferencesAdelman, C. (2006). The Toolbox Revisited: Paths to Degree Completion From High School Through
College. Washington, DC: US Department of Education.
ACT. (2013). Accuracy of Student-Reported High School GPA (ACT Information Brief 2013-12). Iowa
City, IA: ACT.
Allison, P. D. (2001). Missing data (Vol. 136). Sage publications.
Froot, K. (1989). Consistent covariance matrix estimation with cross-sectional dependence and
heteroskedasticity in financial data. Journal of Financial and Quantitative Analysis, 24(3), 333–
355.
Gonyea, R. M. (2005). Self-reported data in institutional research: Review and recommendations.
New Directions for Institutional Research, 127, 73–89.
Gordon, L. (2009, February 18). UC wants the truth on student applications, Los Angeles Times.
Retrieved from articles.latimes.com/2009/feb/18/local/me-ucfraud18 on June 23, 2015.
Huber, P. (1967). The behavior of maximum likelihood estimates under nonstandard conditions.
Proceedings of the Fifth Berkeley Symposium on Mathematical Statistics and Probability, 1,
221–233. Berkeley, CA: University of California Press.
Kuncel, N. R., Credé, M., & Thomas, L. L. (2005). The validity of self-reported grade point averages,
class ranks, and test scores: A meta-analysis and review of the literature. Review of Educational
Research, 75(1), 63–82.
Little, R. J. A., & Rubin, D. B. (2002). Statistical analysis with missing data. John Wiley & Sons.
Mattern, K. D., Patterson, B. F., & Wyatt, J. N. (2013). How useful are traditional admission measures in
predicting graduation within four years? (College Board Research Report No. 2013-1). New York,
NY: The College Board.
Postal, Leslie (2014, October 29). Want to get into FSU, UF? Get ready to type in grades, Orlando
Sentinel. Retrieved from www.orlandosentinel.com/features/education/os-fsu-uf-new-
admissions-form-20141027-story.html on June 23, 2015.
Radunzel, J., & Noble, J. (2012). Predicting Long-Term College Success through Degree Completion
Using ACT® Composite Score, ACT Benchmarks, and High School Grade Point Average (ACT
Research Report 2012-5). Iowa City, IA: ACT.
Rogers, W. (1993). Regression standard errors in clustered samples. Stata Technical Bulletin, 13,
19–23.
Sanchez, E. I. (2013). Differential Effects of Using ACT® College Readiness Assessment Scores and
High School GPA to Predict First-Year College GPA among Racial/Ethnic, Gender, and Income
Groups (ACT Research Report 2013-4). Iowa City, IA: ACT.
Sawyer, R., Laing J., & Houston, M. (1988). Accuracy of Self-Reported High School Courses and
Grades of College-Bound Students (ACT Research Report 88-1). Iowa City, IA: ACT.
Schiel, J., & Noble, J. (1991). Accuracy of Self-Reported Course Work and Grade Information of High
School Sophomores (ACT Research Report 91-6). Iowa City, IA: ACT.

21
Schmitt, N., Keeney, J., Oswald, F. L., Pleskac, T. J., Billington, A. Q., Sinha, R., & Zorzie, M. (2009).
Prediction of 4-year college student performance using cognitive and noncognitive predictors
and the impact on demographic status of admitted students. Journal of Applied Psychology, 94(6),
1479–1497.
Shaw, E. J., & Mattern, K. D. (2009). Examining the Accuracy of Self-Reported High School Grade
Point Average (College Board Research Report No. 2009-5). New York, NY: The College Board.
Valiga, M. J. (1987). The Accuracy of Self-Reported High School Course and Grade Information (ACT
Research Report 87-1). Iowa City, IA: ACT.
Von Hippel, P. T. (2007). Regression with missing Ys: An improved strategy for analyzing multiply
imputed data. Sociological Methodology, 37(1), 83–117.
White, H. (1980). A heteroskedasticity-consistent covariance matrix estimator and a direct test for
heteroskedasticity. Econometrica, 48(4), 817–838.
White, H. (1984). Asymptotic Theory for Econometricians. San Diego, CA: Academic Press.
White, I. R., Royston, P., & Wood, A. M. (2011). Multiple imputation using chained equations: Issues
and guidance for practice. Statistics in Medicine, 30(4), 377–399.
Williams, R. (2000). A note on robust variance estimation for cluster-correlated data. Biometrics,
56(2): 645–646.
Wooldridge, J. (2002). Econometric Analysis of Cross Section and Panel Data. Cambridge, MA: MIT
Press.
Wurth, J. (2013, September 8). College admission enters digital age with online forms, The News-
Gazette. Retrieved from static.news-gazette.com/news/local/2013-09-08/college-admission-
enters-digital-age-online-forms.html on June 23, 2015.

22
ACT Research Report How Accurate Are Self-Reported High School Courses, Course Grades, and Grade Point Average?
Appendix
Tables A-1 through A-5
Table A-1. Percentage of Student Correctly Identifying Coursework by Whether Course Is Taken or Planned at Time of ACT Test
Taken Planned Not Taken or Planned Overall
Course Prob N Prob N Prob N Prob N
English
English 9 0.954 14,800 1.000 8 0.125 8 0.953 14,816
English 10 0.978 14,792 0.929 14 0.000 8 0.978 14,814
English 11 0.994 14,504 1.000 297 0.000 18 0.993 14,819
English 12 0.941 11,136 0.919 3,509 0.274 117 0.930 14,762
Mathematics
Algebra I 0.966 14,678 0.923 13 0.551 78 0.964 14,769
Geometry 0.985 14,585 0.951 102 0.378 98 0.980 14,785
Algebra II 0.957 13,696 0.708 513 0.893 515 0.946 14,724
Trigonometry 0.893 4,595 0.379 1,911 0.856 7,473 0.803 13,979
Beginning Calculus 0.694 1,805 0.155 2,211 0.996 9,835 0.822 13,851
Other Advanced Mathematics 0.264 7,425 0.160 2,311 0.939 4,447 0.459 14,183
Science
General Science 0.963 14,483 0.760 50 0.504 248 0.954 14,781
Biology 0.990 14,725 0.980 49 0.026 39 0.987 14,813
Chemistry 0.973 11,001 0.488 1,050 0.953 2,440 0.934 14,491
Physics 0.811 3,229 0.180 2,270 0.977 8,509 0.809 14,008
Social Studies
US History 0.987 14,519 0.984 253 0.032 31 0.985 14,803
World History 0.983 14,167 0.940 447 0.325 169 0.974 14,783
Other History 0.356 3,428 0.179 1,256 0.898 9,119 0.698 13803
American Government 0.978 13,409 0.875 648 0.033 609 0.935 14,666
Economics 0.250 1,625 0.089 1,278 0.989 10,862 0.818 13,765
Geography 0.083 6,362 0.072 699 0.979 7,038 0.530 14,099
Psychology 0.511 3,414 0.181 1,822 0.964 8,691 0.751 13,927
Foreign Language
Spanish 0.991 11,835 0.227 321 0.928 2,449 0.964 14,605
French 0.961 1,699 0.039 380 0.996 11,790 0.966 13,869
German 0.927 358 0.010 292 0.999 13,094 0.977 13,744
Other Language 0.538 195 0.005 368 0.986 13,109 0.953 13,672
Arts
Art 0.915 9,573 0.657 682 0.715 4,201 0.845 14,456
Music 0.798 7,120 0.212 349 0.937 6,638 0.849 14,107
Drama 0.755 3,660 0.173 774 0.953 9,467 0.857 13,901
Median Values 0.948 10,287 0.434 480 0.896 3,325 0.940 14,474

23
Table A-2. Accuracy of Self-Reported Coursework by Subject Area and Student Characteristics
Subject Area/Student Characteristic
Percentage Under-Report
Percentage Correct
Percentage Over-Report
English
Male 0.17 96.07 3.76
Female 0.16 95.95 3.89
White Non-Hispanic 0.18 96.14 3.69
African American 0.12 95.00 4.87
Hispanic 0.09 97.75 2.16
Income < $36,000 0.17 96.10 3.73
Income $36,000 to $100,000 0.16 96.05 3.80
Income > $100,000 0.17 95.52 4.31
Composite < 18 0.16 96.44 3.39
Composite 18 to 24 0.18 96.18 3.64
Composite > 24 0.13 95.14 4.73
Mathematics
Male 1.63 83.12 15.25
Female 1.81 82.74 15.45
White Non-Hispanic 1.73 83.10 15.17
African American 1.91 81.90 16.20
Hispanic 0.85 83.43 15.72
Income < $36,000 1.67 83.07 15.26
Income $36,000 to $100,000 1.76 82.87 15.36
Income > $100,000 1.76 82.59 15.65
Composite < 18 1.19 84.13 14.68
Composite 18 to 24 1.77 82.71 15.52
Composite > 24 2.21 82.05 15.74
Science
Male 1.18 91.24 7.58
Female 0.61 93.31 6.07
White Non-Hispanic 0.90 92.60 6.51
African American 0.79 90.90 8.32
Hispanic 0.86 93.36 5.78
Income < $36,000 0.92 92.22 6.86
Income $36,000 to $100,000 0.86 92.46 6.68
Income > $100,000 0.79 92.28 6.93
Composite < 18 1.28 90.70 8.02
Composite 18 to 24 0.86 92.95 6.19
Composite > 24 0.48 92.87 6.65
Social Science
Male 2.34 81.33 16.33
Female 2.11 81.95 15.94
White Non-Hispanic 2.13 81.48 16.38
African American 2.61 82.16 15.23
Hispanic 2.45 83.25 14.30

24
ACT Research Report How Accurate Are Self-Reported High School Courses, Course Grades, and Grade Point Average?
Subject Area/Student Characteristic
Percentage Under-Report
Percentage Correct
Percentage Over-Report
Income < $36,000 2.38 81.87 15.75
Income $36,000 to $100,000 2.13 81.63 16.24
Income > $100,000 2.06 81.03 16.91
Composite < 18 2.64 81.41 15.95
Composite 18 to 24 2.28 81.44 16.28
Composite > 24 1.66 82.34 15.99
Foreign Languages
Male 0.68 96.67 2.66
Female 0.60 96.79 2.60
White Non-Hispanic 0.68 97.56 1.76
African American 0.19 93.18 6.63
Hispanic 1.63 93.75 4.61
Income < $36,000 0.68 95.73 3.59
Income $36,000 to $100,000 0.60 97.32 2.07
Income > $100,000 0.66 97.56 1.78
Composite < 18 0.86 93.56 5.58
Composite 18 to 24 0.59 97.62 1.79
Composite > 24 0.52 98.11 1.37
Arts
Male 5.46 85.17 9.37
Female 4.62 85.58 9.79
White Non-Hispanic 5.22 85.56 9.22
African American 4.27 84.08 11.65
Hispanic 3.76 87.61 8.63
Income < $36,000 4.56 85.29 10.16
Income $36,000 to $100,000 5.22 85.48 9.30
Income > $100,000 5.68 85.26 9.06
Composite < 18 3.58 84.71 11.71
Composite 18 to 24 5.52 84.99 9.48
Composite > 24 5.48 86.90 7.62
Table A-2. (continued)

25
Table A-3. Accuracy of Self-Reported Grades by Student Characteristics in Each Subject Area
Subject Area/Student Characteristic
Percentage Under-Report
Percentage Correct
Percentage Over-Report
English
Male 20.08 64.93 15.00
Female 16.09 68.90 15.01
White Non-Hispanic 16.37 69.42 14.21
African American 23.74 58.70 17.57
Hispanic 22.26 58.87 18.88
Income < $36,000 20.29 62.84 16.87
Income $36,000 to $100,000 16.64 69.26 14.10
Income > $100,000 14.72 73.30 11.98
Composite < 18 24.26 56.55 19.19
Composite 18 to 24 18.29 66.07 15.64
Composite > 24 8.50 83.65 7.85
Mathematics
Male 20.28 65.62 14.10
Female 16.07 69.70 14.23
White Non-Hispanic 16.55 69.91 13.54
African American 24.63 58.58 16.79
Hispanic 22.01 60.57 17.42
Income < $36,000 20.62 63.40 15.98
Income $36,000 to $100,000 16.88 69.75 13.37
Income > $100,000 14.28 73.78 11.95
Composite < 18 26.45 54.85 18.70
Composite 18 to 24 20.19 64.37 15.44
Composite > 24 8.04 83.21 8.75
Science
Male 20.85 64.36 14.79
Female 16.97 68.83 14.20
White Non-Hispanic 17.32 69.25 13.44
African American 25.59 56.34 18.07
Hispanic 19.63 58.82 21.55
Income < $36,000 21.44 61.91 16.65
Income $36,000 to $100,000 17.46 69.06 13.48
Income > $100,000 14.93 73.60 11.47
Composite < 18 28.09 51.81 20.10
Composite 18 to 24 20.22 64.86 14.93
Composite > 24 7.81 83.44 8.75
Social Science
Male 22.60 64.88 12.51
Female 19.39 68.32 12.29
White Non-Hispanic 18.91 69.75 11.34
African American 28.51 54.40 17.09
Hispanic 27.52 58.65 13.83

26
ACT Research Report How Accurate Are Self-Reported High School Courses, Course Grades, and Grade Point Average?
Subject Area/Student Characteristic
Percentage Under-Report
Percentage Correct
Percentage Over-Report
Income < $36,000 23.28 62.37 14.35
Income $36,000 to $100,000 19.57 68.94 11.50
Income > $100,000 17.82 72.67 9.50
Composite < 18 27.75 55.46 16.79
Composite 18 to 24 21.64 64.77 13.60
Composite > 24 12.43 81.86 5.71
Foreign Languages
Male 10.94 66.41 22.65
Female 8.32 72.73 18.95
White Non-Hispanic 8.39 72.11 19.50
African American 15.71 60.11 24.18
Hispanic 7.23 64.92 27.86
Income < $36,000 11.27 65.99 22.74
Income $36,000 to $100,000 8.64 71.58 19.78
Income > $100,000 6.98 76.19 16.82
Composite < 18 18.51 53.46 28.03
Composite 18 to 24 9.14 68.65 22.21
Composite > 24 2.64 85.99 11.36
Arts
Male 15.68 76.91 7.41
Female 8.30 86.64 5.07
White Non-Hispanic 9.28 86.03 4.69
African American 22.14 65.77 12.10
Hispanic 6.63 86.68 6.69
Income < $36,000 14.09 78.13 7.77
Income $36,000 to $100,000 10.01 84.88 5.11
Income > $100,000 7.69 88.33 3.98
Composite < 18 21.97 67.65 10.38
Composite 18 to 24 10.26 84.29 5.45
Composite > 24 2.65 94.62 2.73
Table A-3. (continued)

27
Table A-4. Multinomial Logit Estimates for Modeling Over- and Under-Reporting High School Coursework
English Mathematics ScienceSocial
ScienceForeign
Languages Arts
Under-Report
Female 0.332 0.0973 -0.301* -0.0751 -0.144 -0.0503(0.223) (0.0570) (0.0985) (0.0465) (0.106) (0.0482)
African American 0.372 0.291* 0.583* 0.0725 -0.788* 0.125(0.313) (0.0846) (0.125) (0.0643) (0.199) (0.0703)
Hispanic 0.589 -0.0280 0.129 -0.0742 0.983* -0.165(0.413) (0.152) (0.236) (0.112) (0.169) (0.137)
Income $36,000 to $100,000 0.111 0.0927 -0.0722 -0.0568 -0.290* 0.0439(0.270) (0.0687) (0.122) (0.0554) (0.132) (0.0576)
Income > $100,000 0.680 0.0824 0.168 0.0139 0.0474 0.192*(0.439) (0.108) (0.204) (0.0915) (0.190) (0.0909)
Composite 18 to 24 0.271 0.479* -0.242* -0.234* -0.311* 0.0896(0.277) (0.0797) (0.113) (0.0548) (0.130) (0.0620)
Composite > 24 0.226 0.678* -0.487* -0.509* -0.284 0.191*(0.369) (0.0948) (0.172) (0.0752) (0.167) (0.0755)
English 10 0.127(0.267)
English 11 0.999*(0.384)
English 12 2.620*(0.424)
Geometry -0.0166(0.612)
Algebra II 2.569(0.510)
Trigonometry 5.771(0.501)
Beginning Calculus 2.520*(0.525)
Other Advanced Mathematics 4.933*(0.505)
Biology -1.201*(0.189)
Chemistry 0.0336(0.134)
Physics 0.786*(0.119)
World History 1.334(0.210)
Other History 3.883*(0.193)

28
ACT Research Report How Accurate Are Self-Reported High School Courses, Course Grades, and Grade Point Average?
English Mathematics ScienceSocial
ScienceForeign
Languages Arts
American Government 3.061*(0.193)
Economics 1.608*(0.211)
Geography 2.260*(0.208)
Psychology 2.682*(0.197)
French -1.301*(0.171)
German -3.430*(0.454)
Other Languages 0.146(0.110)
Music -1.028*(0.0595)
Drama -0.951*(0.0582)
Constant -8.328* -8.689* -4.545* -5.929* -3.952* -2.439*(0.592) (0.512) (0.149) (0.197) (0.171) (0.0729)
Over-Report
Female 0.0748 -0.0149 -0.152* -0.0429 -0.166* 0.0940*(0.0574) (0.0254) (0.0375) (0.0243) (0.0776) (0.0357)
African American 0.371* 0.262* 0.420* 0.0324 0.637* 0.202*(0.0949) (0.0400) (0.0541) (0.0367) (0.0974) (0.0495)
Hispanic 0.403* 0.162* 0.00312 -0.0781 0.641* -0.153(0.144) (0.0668) (0.0974) (0.0628) (0.153) (0.0966)
Income $36,000 to $100,000 0.0992 0.0830* 0.116* 0.0780* -0.152 -0.0232(0.0724) (0.0311) (0.0446) (0.0287) (0.0917) (0.0415)
Income > $100,000 0.208* 0.137* 0.259* 0.228* -0.253 0.0295(0.101) (0.0478) (0.0690) (0.0449) (0.164) (0.0676)
Composite 18 to 24 0.194* 0.152* -0.182* 0.0215 -0.420* -0.148*(0.0893) (0.0346) (0.0471) (0.0308) (0.0897) (0.0435)
Composite > 24 0.615* 0.166* -0.209* -0.0965* -0.695* -0.395*(0.102) (0.0409) (0.0583) (0.0388) (0.129) (0.0578)
English 10 -0.833*(0.0584)
English 11 -2.057*(0.109)
English 12 0.356*(0.0505)
Geometry -0.624*(0.0706)
Table A-4. (continued)

29
English Mathematics ScienceSocial
ScienceForeign
Languages Arts
Algebra II 0.417*(0.0576)
Trigonometry 1.448*(0.0540)
Beginning Calculus 1.797*(0.0522)
Other Advanced Mathematics 3.492*(0.0502)
Biology -1.303*(0.0848)
Chemistry 0.482*(0.0583)
Physics 1.759*(0.0519)
World History 0.339*(0.0992)
Other History 3.261*(0.0784)
American Government 0.709*(0.0937)
Economics 2.797*(0.0796)
Geography 4.222*(0.0768)
Psychology 3.153*(0.0788)
French 0.278*(0.0718)
German -0.0434(0.0757)
Other Languages 0.323*(0.0706)
Music 0.532*(0.0430)
Drama 0.411*(0.0425)
Constant -3.472* -3.572* -3.232* -4.389* -3.417* -2.381*(0.111) (0.0591) (0.0624) (0.0830) (0.110) (0.0563)
Observations 55,588 81,031 54,539 93,740 52,480 39,864
Notes: Table entries are coefficients from a multinomial logit regression, where a Huber/White sandwich estimator is used to adjust for common student-level residual variance. Standard errors are in parentheses. An asterisk indicates that the logit coefficient is significantly different from zero at the 0.05 level. The omitted reference categories are male, White non-Hispanic, income < $36,000, ACT composite < 18, English 9 (for English), Algebra I (for Mathematics), General Science (for Science), US History (for Social Sciences), Spanish (for Foreign Languages), and Art (for Arts).
Table A-4. (continued)

30
ACT Research Report How Accurate Are Self-Reported High School Courses, Course Grades, and Grade Point Average?
Table A-5. Multinomial Logit Estimates for Modeling Over- and Under-Reporting High School Course Grades
English Mathematics ScienceSocial
ScienceForeign
Languages Arts
Under-Report
Female -0.301* -0.284* -0.314* -0.245* -0.448* -0.599*(0.0318) (0.0309) (0.0329) (0.0312) (0.0668) (0.0566)
African American 0.101* -0.00279 0.0437 0.121* 0.177* 0.478*(0.0425) (0.0437) (0.0453) (0.0434) (0.0886) (0.0716)
Hispanic -0.108 -0.0896 -0.140 -0.0674 -0.647* -0.0157(0.0808) (0.0765) (0.0850) (0.0802) (0.181) (0.137)
Income $36,000 to $100,000 -0.0909* -0.0885* -0.164* -0.0618 0.0568 -0.0295(0.0367) (0.0366) (0.0389) (0.0368) (0.0791) (0.0669)
Income > $100,000 -0.0877 -0.123* -0.201* -0.0217 -0.108 0.000595(0.0642) (0.0616) (0.0662) (0.0600) (0.137) (0.117)
Composite 18 to 24 -0.441* -0.460* -0.417* -0.413* -0.788* -0.685*(0.0364) (0.0375) (0.0389) (0.0374) (0.0770) (0.0627)
Composite > 24 -1.298* -1.357* -1.381* -1.156* -2.150* -1.738*(0.0579) (0.0532) (0.0576) (0.0525) (0.133) (0.114)
English 10 -0.0282(0.0310)
English 11 -0.155*(0.0362)
English 12 0.353*(0.0437)
Geometry -0.145*(0.0315)
Algebra II -0.0605(0.0331)
Trigonometry -0.0669(0.0573)
Beginning Calculus 0.503*(0.101)
Other Advanced Mathematics 0.341*(0.0774)
Biology -0.186*(0.0305)
Chemistry -0.237*(0.0364)
Physics 0.00754(0.0680)
World History 0.000471(0.0307)
Other History 0.203*(0.0860)

31
English Mathematics ScienceSocial
ScienceForeign
Languages Arts
American Government -0.0505(0.0317)
Economics 0.369*(0.144)
Geography 0.309*(0.127)
Psychology 0.437*(0.0723)
French 0.200(0.104)
German 0.0335(0.242)
Other Languages 0.681(0.400)
Music -1.856*(0.0920)
Drama 0.183*(0.0667)
Constant -0.658* -0.487* -0.373* -0.569* -1.030* -0.747*(0.0458) (0.0457) (0.0468) (0.0461) (0.0903) (0.0732)
Over-Report
Female -0.113* -0.0891* -0.125* -0.146* -0.353* -0.559*(0.0321) (0.0322) (0.0337) (0.0357) (0.0472) (0.0726)
African American 0.0539 0.0781 0.0645 0.285* -0.0783 0.338*(0.0439) (0.0454) (0.0480) (0.0483) (0.0702) (0.0948)
Hispanic 0.119 -0.00689 0.166* 0.159* -0.167 0.284(0.0742) (0.0759) (0.0755) (0.0786) (0.109) (0.158)
Income $36,000 to $100,000 -0.0899* -0.128* -0.185* -0.119* -0.0519 -0.193*(0.0385) (0.0373) (0.0408) (0.0419) (0.0555) (0.0844)
Income > $100,000 -0.240* -0.221* -0.317* -0.251* -0.225* -0.459*(0.0676) (0.0654) (0.0677) (0.0748) (0.0953) (0.178)
Composite 18 to 24 -0.285* -0.293* -0.291* -0.334* -0.313* -0.643*(0.0374) (0.0395) (0.0407) (0.0417) (0.0591) (0.0833)
Composite > 24 -1.048* -1.016* -0.974* -1.134* -1.218* -1.385*(0.0593) (0.0546) (0.0557) (0.0633) (0.0811) (0.135)
English 10 -0.199*(0.0350)
English 11 -0.0506(0.0379)
English 12 0.0409(0.0499)
Geometry -0.259*(0.0359)
Table A-5. (continued)

32
ACT Research Report How Accurate Are Self-Reported High School Courses, Course Grades, and Grade Point Average?
English Mathematics ScienceSocial
ScienceForeign
Languages Arts
Algebra II -0.203*(0.0376)
Trigonometry -0.243*(0.0640)
Beginning Calculus -0.154(0.132)
Other Advanced Mathematics 0.211*(0.0840)
Biology -0.227*(0.0357)
Chemistry -0.242*(0.0403)
Physics -0.0856(0.0760)
World History -0.0222(0.0375)
Other History -0.446*(0.132)
American Government -0.193*(0.0397)
Economics -0.874*(0.279)
Geography 0.348*(0.144)
Psychology -0.565*(0.123)
French 0.157*(0.0725)
German 0.109(0.158)
Other Languages -0.542(0.424)
Music -0.844*(0.0861)
Drama -0.132(0.0983)
Constant -0.952* -0.886* -0.827* -1.066* -0.499* -1.377*(0.0478) (0.0495) (0.0509) (0.0521) (0.0691) (0.0938)
Observations 37,885 39,547 34,432 36,457 11,644 13,940
Notes: Table entries are coefficients from a multinomial logit regression, where a Huber/White sandwich estimator is used to adjust for common student-level residual variance. Standard errors are in parentheses. An asterisk indicates that the logit coefficient is significantly different from zero at the 0.05 level. The omitted reference categories are male, White non-Hispanic, income < $36,000, ACT composite < 18, English 9 (for English), Algebra I (for Mathematics), General Science (for Science), US History (for Social Sciences), Spanish (for Foreign Languages), and Art (for Arts).
Table A-5. (continued)


ACT is an independent, nonprofit organization that provides assessment, research,
information, and program management services in the broad areas of education
and workforce development. Each year, we serve millions of people in high
schools, colleges, professional associations, businesses, and government agencies,
nationally and internationally. Though designed to meet a wide array of needs, all
ACT programs and services have one guiding purpose—helping people achieve
education and workplace success.
For more information, visit www.act.org.
*050210150* Rev 1