HOV USER SURVEY - Washington State Department of ... · Guzman, Cynthia Johnson, Katerena Loven,...
118
HOV U SER S URVEY W ASHINGTON S TATE F REEWAY S YSTEM UPDATED: December 2007
-
Upload
vuongnguyet -
Category
Documents
-
view
215 -
download
1
Transcript of HOV USER SURVEY - Washington State Department of ... · Guzman, Cynthia Johnson, Katerena Loven,...

HOV U S E R S U RV E Y WA S H I N G T O N S TAT E FR E E WAY S Y S T E M
UPDATED: December 2007

Title VI
WSDOT ensures full compliance with Title VI of the Civil Rights
Act of 1964 by prohibiting discrimination against any person on
the basis of race, color, national origin or sex in the provision of
benefits and services resulting from its federally assisted
programs and activities. For questions regarding WSDOT’s Title
VI Program, you may contact the Department’s Title VI
Coordinator at (360) 705-7098.
Americans with Disabilities Act (ADA) Information
If you would like copies of this document in an alternative format
– large print, Braille, cassette tape, or on computer disk, please
call (360) 705-7097. Persons who are deaf or hard of hearing,
please call the Washington State Telecommunications Relay
Service, or Tele-Braille at 7-1-1, Voice 1-800-833-6384, and ask
to be connected to (360) 705-7097.

HOV User Survey, Washington State Freeway System
Acknowledgements
The authors wish to acknowledge the original impetus behind this study: the interest, concern, and foresight of the former WSDOT Strategic Planning and Programming Director, Charlie Howard, as well as the current Director Brian Smith who supported its completion. Funding for the study came from federal funds for state planning and research along with a 20 percent state match from state revenue via the support of Amy Arnis, WSDOT Deputy Director for Strategic Planning and Programming.
A contingent of stalwart colleagues from the WSDOT Urban Planning Office braved the very cold, dark, egregiously early, and on several occasions wet environs of regional park-and-ride lots in early January 2006 to pass out survey questionnaires. Our hearty thanks to Carol Hunter, Laura Johnson, Thomas Noyes, Charles Prestrud, Richard Warren, Tom Washington, Stephanie Weber, and Shuming Yan, with a special nod to the Urban Planning Office Manager Chris Picard who supported the office-wide undertaking and passed out quite a few questionnaires himself. Equally brave and appreciated were the employees of Pacific Market Research who assisted in this task, including Kevin Badger, Amber Bruce, Tim Dario, Sergio Gonzales, Danny Guzman, Cynthia Johnson, Katerena Loven, Eloisa Perez, Yvette Silva, David Stein, Jeremy Webb, and their talented, patient, and flexible Manager, Paulette Badger. A special acknowledgment to David Garner - our thoughts are with you.
PRR analysts, project administrators, researchers, writers, and other assistants included Kirsten Hauge, Alexandra Helling, Doug Honma, Andrea Imler, Ginger Nuss, Joy Radford, Kimbra

Acknowledgements
Wellock, and the members of the focus group. Special kudos to project angels Katherine Schomer, Rachael Darden, and Alex Sobie.
Four WSDOT staff made special contributions to this study: Murshed Delwar handled all the database, mapping, and special confidentiality requirements of this project. Meg Blau was our Area Consultant Liaison Engineer extraordinaire. Thanks for making things easy, keeping track of everything, and keeping us honest. Laura Thompson and Daja Preston-Jackson were our dedicated, tireless, and do-everything admin support staff, who handled phone calls, copying, printing, endless coordination, and the thousands of details that make everyday office life possible. This project, as well as pretty much every project that comes out of this office, could not have happened without you.
Questionnaire and report reviewers included (WSDOT unless otherwise noted): Katherine Boyd, Pete Briglia (PSRC), Mike Cummings (PSRC), Leslie Forbis, Fotini Georgiadou (KCM), Mark Hallenbeck (TRAC), Janice Hamil, Ed Hillsman, Charlie Howard (PSRC), John Ishimaru (TRAC), Sarah Kavage, Jean Mabry, Lee MacClellan, Todd Merkens, Charles Prestrud, Gordon Roycroft, Chris Simmons, Seth Stark, and Vicki Steigner and the WSDOT Olympic Region Planning Office. Many thanks. This report would not be what it is without each of your unique contributions.
Last and most, we wish to give our sincere thanks to Chris Picard, Manager of the WSDOT Urban Planning Office, and to Rita Brogan, CEO of PRR, for supporting and championing the completion of this long-awaited study.
It takes a rather large village. To those villagers we are here forgetting, our apologies and gratitude.
Leah Bolotin, AICP Senior HOV Planner WSDOT [email protected]
Bruce Brown, Ph.D. Director of Research PRR [email protected]

HOV User Survey, Washington State Freeway System i
Table of Contents
List of Acronyms
Executive Summary................................................................................................................ ES-1 What are HOV lanes? ........................................................................................ES-1 What is this study about? ...................................................................................ES-1 How was the study done? ..................................................................................ES-2 Why is this study important? .............................................................................ES-2
Chapter 1 Introduction........................................................................................................ 1-1 The Puget Sound Freeway HOV System............................................................. 1-1 What is this study about? ..................................................................................... 1-2 Why was this study done?.................................................................................... 1-4 How was the study done? .................................................................................... 1-6 Why is this study important? ............................................................................... 1-7
Chapter 2 Project Methodology.......................................................................................... 2-1 How were HOV lane users identified? ................................................................ 2-1 How were the surveys developed?....................................................................... 2-2 How were the surveys distributed and collected?................................................ 2-3
Carpoolers ...................................................................................................... 2-3 Bus Riders...................................................................................................... 2-4 Vanpoolers...................................................................................................... 2-4 Overall Response Rates ................................................................................. 2-5
How were the data intake and analysis performed?............................................. 2-6 What are the limitations to this study?................................................................. 2-7 What were the demographics of those who participated in the study?.............. 2-12
Chapter 3 Findings............................................................................................................... 3-1 What motivates people to use shared rides? ...................................................... 3-1 Who is most likely to drive alone? ...................................................................... 3-3

ii Table of Contents
What impacts do employer incentives have on mode choice? ............................ 3-4 What are people likely to do if HOV lanes are not available? ........................... 3-8
Continue traveling the same way................................................................... 3-9 Switch to solo driving .................................................................................. 3-10 Other responses............................................................................................ 3-11
How many carpools are “fam-pools,” and how would their behavior differ from standard carpools? ..................................................................... 3-12
Could most HOV users choose to drive alone? ................................................. 3-14 How do trip purposes for HOV lane users vary throughout the day?................ 3-15 How do mid-day users differ from peak period users?...................................... 3-16
Chapter 4 Conclusions......................................................................................................... 4-1 Do freeway HOV lanes provide an incentive for people to choose a
shared-ride mode?.......................................................................................... 4-1 Are mid-day HOV lane users different than peak period users? ......................... 4-2 Other key findings................................................................................................ 4-2 How can WSDOT utilize these findings? ............................................................ 4-3
Appendices Appendix A Glossary ............................................................................................................. A-1
Appendix B Literature Review List.......................................................................................B-1
Appendix C Questionnaire Development............................................................................. C-1
Appendix D Finalized Questionnaires .................................................................................. D-1
Appendix E User Identification & Survey Distribution ......................................................E-1 Carpools ...............................................................................................................E-1
Peak Periods...................................................................................................E-1 Mid-Day.........................................................................................................E-3 All Time Periods ............................................................................................E-3
Buses ....................................................................................................................E-4 Vanpools...............................................................................................................E-6
Appendix F Data Intake & Analysis......................................................................................F-1
Appendix G Detailed Output Tables (Questions #1 – 8) ..................................................... G-1 Question 1: Usual Mode of Travel ................................................................. G-2
Travel mode by age....................................................................................... G-3 Question 2: Freeways Used ............................................................................ G-4 Question 3: Number of Days per Week Using HOV Lanes ........................... G-5 Question 4: (Carpool & Vanpool) Who Traveling With................................ G-6 Question 4: (Bus) Travel Mode to Bus Stop ................................................. G-7

HOV User Survey, Washington State Freeway System iii
Question 5: Trip Purpose................................................................................ G-8 Trip purpose by gender ................................................................................. G-9
Question 6: Top Reasons for Mode Choice.................................................. G-11 Question 7: Likely Actions Without an HOV Lane...................................... G-12
Likely actions without an HOV lane: Fam-pools vs. multi- household carpools................................................................................ G-13
Question 8A: Use of Employer Incentives...................................................... G-14 Question 8B: Likely Action Without Incentives ............................................. G-15
Appendix H Respondent Origins (Question #9) .................................................................. H-1
Appendix I Respondent Demographics (Questions #10 – 13) .............................................I-1 Question 10: Number of Drivers in Household..................................................I-2 Question 11: Number of Working Vehicles in Household .................................I-3 Question 12: Respondent Age ............................................................................I-4
Age of mid-day users by mode .......................................................................I-5 Question 13: Respondent Gender.......................................................................I-6
List of Exhibits Exhibit 1-1 Study Location Map............................................................................................. 1-1
Exhibit 1-2 Freeway HOV System Map ................................................................................. 1-3
Exhibit 1-3 Person vs. Vehicle Volumes ................................................................................. 1-5
Exhibit 2-1 Survey Response Rates by Mode......................................................................... 2-5
Exhibit 2-2 Typical Modes of HOV Lane Users..................................................................... 2-6
Exhibit 2-3 HOV Corridors Used by Survey Respondents................................................... 2-13
Exhibit 3-1 Top Reasons for Mode Choice............................................................................. 3-2
Exhibit 3-2 Usual Travel Modes ............................................................................................. 3-4
Exhibit 3-3 Employer Incentives Used ................................................................................... 3-6
Exhibit 3-4 Continue HOV Mode Without Employer Incentives? ......................................... 3-7
Exhibit 3-5 Likely Travel Actions if HOV Lanes Not Available - Chart................................ 3-8
Exhibit 3-6 Likely Travel Actions if HOV Lanes Not Available - Table................................ 3-9
Exhibit 3-7 Those Who Would Continue Current Mode Without HOV Lanes .................... 3-10
Exhibit 3-8 Percent Who Would Switch to Solo Driving ..................................................... 3-11
Exhibit 3-9 Percentage of Fam-Pools vs. Multi-Household Carpools in HOV Lanes ......... 3-13

iv Table of Contents
Exhibit 3-10 Likely Travel Actions without HOV Lanes: Fam-Pools vs. Multi-Household Carpools................................................................................. 3-14
Exhibit 3-11 Number of Working Vehicles in Household by Mode ....................................... 3-15
Exhibit 3-12 Trip Purposes ..................................................................................................... 3-16
Exhibit E-1 License Plate Collection Locations......................................................................E-2
Exhibit E-2 Questionnaire Distribution at Park-and-Ride Lots ..............................................E-5
Exhibit G-1a Usual Mode of Travel (Question 1) .................................................................... G-2
Exhibit G-1b Travel Mode by Age (Cross-Tabulation: Questions 1 & 12) ............................. G-3
Exhibit G-2 Freeways Used (Question 2)............................................................................... G-4
Exhibit G-3 Number of Days per Week Using HOV Lanes (Question 3) .............................. G-5
Exhibit G-4a Who Traveling With (Question 4 – Carpool & Vanpool) ................................... G-6
Exhibit G-4b Travel Mode to Bus Stop (Question 4 – Bus) ..................................................... G-7
Exhibit G-5a Trip Purpose (Question 5)................................................................................... G-8
Exhibit G-5b Trip Purpose by Gender (Cross-Tabulation: Questions 5 & 13)...................... G-10
Exhibit G-6 Top Reasons for Mode Choice (Question 6)..................................................... G-11
Exhibit G-7a Likely Actions Without an HOV Lane (Question 7) ........................................ G-12
Exhibit G-7b Carpool Likely Actions Without an HOV Lane: Fam-Pool vs Multi-Household (Cross-Tabulation: Questions 4 & 7)................................... G-13
Exhibit G-8a Use of Employer Incentives (Question 8A)...................................................... G-14
Exhibit G-8b Likely Action Without Incentives (Question 8B) ............................................. G-15
Exhibit H-1 Respondent Residential Zip Codes - All Modes (Question 9)............................ H-2
Exhibit H-2 Map of Carpool Respondent Residential Locations ........................................... H-4
Exhibit I-1 Number of Drivers in Household (Question 10)...................................................I-2
Exhibit I-2 Number of Working Vehicles in Household (Question 11) ..................................I-3
Exhibit I-3a Respondent Age (Question 12) .............................................................................I-4
Exhibit I-3b Age of Mid-Day Users by Mode (Cross-Tabulation: Questions 1 & 12) ............I-5
Exhibit I-4 Respondent Gender (Question 13)........................................................................I-6

HOV User Survey, Washington State Freeway System
Acronym List
AVO Average vehicle occupancy
CATI Computer-assisted telephone interview
DOL Washington State Department of Licensing
GHG Greenhouse gas
GIS Geographical information system
GP General purpose
HOV High occupancy vehicle
KCM King County Metro
OEO Office of Equal Opportunity
PSRC Puget Sound Regional Council
SPSS Statistical Package for the Social Sciences
TRAC Transportation Center at the University of Washington
WSDOT Washington State Department of Transportation


HOV User Survey, Washington State Freeway System ES-1
Executive Summary
What are HOV lanes? HOV lanes are high occupancy vehicle lanes, also known as carpool or diamond lanes. HOV lanes are reserved for people who share the ride in buses, vanpools, or carpools. They allow people who choose to travel in HOVs to travel faster than those in single occupant vehicles during congestion.
Washington State has freeway HOV lanes in the Puget Sound region only. They are generally inside (left) lanes and are identified by signs along the freeway and diamond symbols painted on the pavement. They are separated from the other lanes on the freeway by a solid white line, except on I-90 between Seattle and Mercer Island, where the reversible HOV lanes are a separate facility.
Freeways
For the purposes of this report, freeway is defined as a limited access highway, either state route or interstate, which is not tolled. This is the most common type of highway on the west coast.
What is this study about? Puget Sound freeway HOV lanes have proven to be highly efficient. They move slightly more than one-third of the people on the freeways in only 18 percent of the vehicles, and carry about 52 percent more people per lane than other freeway lanes during prime commuting hours.1 For this reason, the Washington State Department of Transportation (WSDOT) has invested heavily in the development, maintenance and expansion of HOV freeway lanes.
1 Data in this report is from 2006 unless otherwise noted.

ES-2 Executive Summary
HOV lanes support the use of carpools, buses, and vanpools, and are therefore a crucial component of offering more sustainable transportation alternatives to solo driving under the current freeway system. Because HOV lanes result in fewer vehicle trips being made on the area’s overall transportation system, they help to reduce greenhouse gas emissions, the primary culprit behind climate change.
Despite the system’s success and high level of public support, HOV lanes have always been surrounded with a certain degree of controversy. Do HOV lanes actually encourage people to take the bus, carpool, or vanpool? How many people would switch to solo driving if the HOV lanes were removed? Why do people choose shared-ride options? Who do people carpool with and why? Are most carpools made up of people from the same household who would be driving together anyway? Do people mostly use the HOV lanes to commute back and forth to work, or do other trip purposes form a significant amount of their use? Who is using the HOV lanes during the mid-day and why? This study begins to answer these questions.
Shared-Ride Options: Carpools & Vanpools
A carpool is a group of two or more people who commute to work or other destinations together in a private vehicle. Carpool members work out their own agreements on who drives, schedules, and payments for gas and maintenance.
A vanpool is a pre-arranged group of 5 to 15 people who commute together on a regular basis. The group enjoys a low monthly fare and a comfortable commute in an 8, 12, or 15-passenger van. The van itself is usually provided by a local transit authority, nonprofit group, or employer.
www.wsdot.wa.gov/choices/rideshare
How was the study done? Approximately 30,000 written questionnaires were distributed through the mail and in-person to carpoolers, bus riders, and vanpoolers during the winter of 2005/06.2 Respondents mailed the questionnaires back. Additional phone surveys of carpoolers were also performed to raise their response level. The study achieved an overall response rate of 19.3 percent, with a margin of error of ±1.3 percent. This is considered an acceptable rate of return for this type of a study.
2 Although motorcycles and trucks are also important users of the HOV system,
this study focused on the three main user groups of carpoolers, bus riders, and
vanpoolers.

HOV User Survey, Washington State Freeway System ES-3
Why is this study important? This study showed that:
▪ HOV lanes do provide an inducement to use shared-rides. Fifteen to 18 percent of HOV lane users during the peak commuting periods, and 18 to 23 percent of HOV lane users during the mid-day, reported they would switch to solo driving if the HOV lanes were not available. Due to the wording of the questionnaire, this finding is very conservative and should be considered the minimum number of users likely to switch to solo driving with long-term or permanent closure of the HOV lanes; the actual percentage could be as high as 30 percent.
Peaks
Peak period refers to times during the weekdays when the freeways are most congested. In most areas this time period corresponds to when commuters are traveling to and from work, i.e., “rush hours.” For our overall freeway system, the morning peak period is considered to last from 6-9 AM, and the evening peak period from 3-7 PM. Actual peak periods, however, may vary from corridor to corridor.
Sometimes a peak hour is referred to, rather than a peak period. The peak hour represents the busiest hour and usually (but not always) occurs during a peak period. It can either be computed for the AM and PM separately, or for the day as a whole. When a peak hour is computed for the whole day, it usually occurs during the PM. The peak hour varies widely from location to location, and is therefore not usually computed for the freeway system as a whole.
▪ HOV lane closure would also impact side streets and peak hour spreading. Approximately 26 percent of carpoolers said they would continue carpooling, but switch to driving either on a different route (19%) or on the same route during different hours (7%) if HOV lanes were no longer available.
▪ People chose shared rides for reasons other than time savings and reliability. Saving money, convenience, and stress reduction were of equal or more importance than time savings for many users. Reliability was rated sixth across the board, coming in behind concern for the environment.
▪ Most carpools were composed of household members. Sixty-two percent of AM commute carpools, 71 percent of mid-day carpools, and 71 percent of PM commute carpools were composed of members of the same household (also known as “family-pools” or “fam-pools.”) Fam-pools represent approximately 42 percent of overall HOV system users (carpools, bus riders, and vanpoolers) during the peak periods.
▪ Fam-pools and multi-household carpools would behave very similarly without HOV lanes. Less than half of both

ES-4 Executive Summary
family-pools and standard carpools reported they would continue carpooling without HOV lanes.
▪ Ride-sharing is a choice. Almost 99 percent of HOV lane users have at least one working vehicle in their household, and 80 percent have two or more. Driving alone to work is common one day a week or more for all modes. Mode
Mode means a particular method of doing something. In transportation, mode choice refers to the way a person chooses to travel, i.e., as a solo driver, carpooler, bus rider, vanpooler, on a motorcycle, walking, bicycling, taking the train, or other similar distinctions.
▪ Employer incentives play a large role in the decision to take shared-rides. Eighty-seven percent of bus riders and vanpoolers, and 24 percent of carpoolers, use employer rideshare incentives such as free bus passes, discounted parking, flextime, etc. 40–60 percent (depending on mode) would either discontinue their mode without incentives, or are not sure.
▪ Some important demographic and usage distinctions existed between commuting period and mid-day users. Trip purposes were more varied among all three modes during the mid-day period, and driving alone increased for car and vanpoolers. During the mid-day, non-work activities were cited by about 71 percent of carpoolers, 45 percent of bus riders, and 16 percent of vanpoolers.

HOV User Survey, Washington State Freeway System 1-1
Chapter 1: Introduction
The Puget Sound Freeway HOV System HOV lanes are high occupancy vehicle lanes, also known as carpool or diamond lanes. HOV lanes are reserved for people who share the ride in buses, vanpools, or carpools. They allow people who choose to travel in HOVs to travel faster than those in single occupant vehicles during congestion. They are generally inside (left) lanes and are identified by signs along the freeway and diamond symbols painted on the pavement. In the Puget Sound Region, HOV lanes are separated from the other lanes on the freeway by a solid white line, except on I-90 between Seattle and Mercer Island, where the reversible HOV lanes are a separate facility.
Lane-miles
A lane-mile counts the pavement in each direction. For example, HOV lanes exist on I-5 between Everett and the Northgate neighborhood in Seattle, approximately 16 miles to the south. Since separate HOV lanes exist for both the northbound and southbound directions, 32 lane-miles of HOV lane are said to exist between Everett and Northgate.
Vehicles must carry at least two people in order to use freeway HOV lanes in our area. Two exceptions exist to this rule: on westbound SR 520 between I-405 and the Evergreen Point Floating Bridge where three or more people are required, and on I-90 between Seattle and Mercer Island, where solo drivers are allowed to use the HOV lane (see Exhibit 1-2). Public buses, motorcycles, and emergency vehicles may use the HOV lanes regardless of the number of occupants.
Exhibit 1-1 Study Location Map
Washington
State
The freeway HOV system connects the greater metropolitan areas of Everett, Seattle, and Bellevue, and will soon include Tacoma as well. It is composed of approximately 200 lane-miles of a planned 300 lane-mile system. Exhibit 1-1 shows

1-2 Introduction
the location of the study area. Exhibit 1-2 shows current and planned locations of freeway HOV lanes. The Puget Sound area is the only location in Washington State with freeway HOV lanes.
Although HOV and transit-only lanes exist on city streets as well, this study involved freeway HOV lanes only. The HOV User Survey was distributed to travelers on all freeway HOV lanes during January 2006, as follows: ▪ I-5 ▪ I-90 ▪ I-405 ▪ SR 167 ▪ SR 520
In addition to the above corridors, new HOV lanes opened on SR 16 in 2007. SR 16 was not part of this study.
What is this study about? This study was designed to answer two main questions about people who travel on the freeway HOV lanes in the Puget Sound area:
1. Do freeway HOV lanes provide an incentive for people to share rides or take the bus?
2. Are mid-day HOV lane users substantially different than users during the main commuting periods?
In addition to answering the above two questions, several other points about HOV system users became clear during the course of this study. These include: ▪ likely impacts of HOV lane closure ▪ multiple reasons for taking the bus or sharing a ride ▪ carpool composition and behavior ▪ the discretionary nature of HOV use ▪ impacts of employer incentives on mode choice ▪ trip purposes throughout the day ▪ user demographics

HOV User Survey, Washington State Freeway System 1-3
Exhibit 1-2
Freeway HOV System Map
Puget Sound 3+ HOV
occupancy requirement
Solo drivers allowed between Seattle and Mercer Island.

1-4 Introduction
Why was this study done? Sustainability Goals: Climate Change and Greenhouse Gas Emissions
Greenhouse gas (GHG) emissions are the culprits in global warming. Most urban areas create the bulk of their GHGs in the generation of energy, such as gas or coal plants. Since we get most of our energy from hydro-electric power, almost half of the Puget Sound area’s main contribution to global warming comes from vehicle emissions.
In 2005 and 2006, the Washington State Legislature passed legislation stating that reducing GHGs from transportation sources has become a necessity. It also passed bills aimed at reducing GHGs, including requirements for the use and production of renewable fuels.
--The Washington Transportation Plan 2007 - 2026
http://www.wsdot.wa.gov/planning/wtp/
Traffic congestion remains a major challenge to the quality of life for Puget Sound residents, as well as an impediment to our region’s economic viability. It poses a threat to air quality and exacerbates other environmental concerns. More than 45 percent of our state’s total greenhouse gas emissions, the primary culprit behind climate change, are from motor vehicles.
Various approaches for managing traffic congestion have been developed, implemented, and evaluated throughout the United States. This region has been a leader in such traffic management efforts, having introduced HOV and reversible express lanes over 35 years ago. Our HOV system moves 34 percent of all freeway users in 18 percent of the vehicles during the busiest commuting periods. This makes the freeways more efficient by moving more people in fewer vehicles, helping buses stick to their schedules, reducing competition for a limited amount of space on the freeways during rush hours, and reducing car trips on the overall transportation network.
Because HOV lanes result in fewer trips being made on the area’s overall transportation system, they also help to reduce greenhouse gas emissions. HOV lanes are therefore a crucial component of offering more sustainable transportation alternatives to solo driving under the current freeway system.
The contribution of the HOV system is most easily shown by comparing the number of people moved versus the number of vehicles in both the average HOV and average regular or “general purpose” lane during commuting hours. As shown in Exhibit 1-3, the average HOV lane is carrying more than 1½ times as many people as the average general purpose lane during the peak commute periods, and is doing so in 33 percent fewer vehicles.

HOV User Survey, Washington State Freeway System 1-5
Exhibit 1-3
Person vs. Vehicle Volumes Peak Periods & Directions All Monitoring Locations, 2006
0%
10%
20%
30%
40%
50%
60%
70%
80%
90%
100%
Number of People Number of Vehicles
AverageHOVLane
AverageGeneralPurpose
Lane
AverageGeneralPurpose
Lane
AverageHOVLane
Because of its high level of efficiency, the HOV system is considered an integral part of the overall traffic management strategy in the Puget Sound region, and it has comprised a large part of the Department’s capital improvement projects over the last decade.
The HOV system enjoys tremendous popularity with both users and non-users. An opinion survey in 2004 indicated that 78 percent of freeway users who rarely or never use the HOV lanes nevertheless agree that “HOV lanes are a good idea,” and 66 percent of those non-users felt that HOV lane construction should continue. Only 23 percent felt that HOV lanes should be opened to all traffic all of the time.3 In fact, the HOV lanes have become so successful that most of them are now facing
3 2004 HOV Public Opinion Survey, Washington State Transportation Center,
October 2005. Report available on-l ine at www.wsdot.wa.gov/hov/policy.

1-6 Introduction
congestion problems of their own during the peak periods.4 Even when congested, however, HOV lanes generally average significantly higher speeds and person throughput than an average adjacent lane.
Person Throughput
How many people move past a certain point, or through a transportation corridor.
Despite the system’s success and high level of public support, HOV lanes have always been surrounded with a certain degree of controversy involving the question of whether they actually encourage people to choose shared-ride options such as carpools, vanpools, and taking the bus. How many people would switch to solo driving if the HOV lanes were opened to all traffic? Why do people choose shared-ride options? Who do people carpool with and why? Are most carpools made up of people from the same household who would be driving together anyway?
The HOV lanes on I-405, SR 167, and parts of SR 520 and I-90 were opened at night to general traffic in 2003 (see Exhibit 1-2). Since that time another question raised is whether the HOV lanes should be opened up during the mid-day as well, when they tend to not be as well-utilized. In order to address this issue, we also wished to collect data on some of the demographics and reasons for use by mid-day users.
How was the study done? Approximately 30,000 printed questionnaires were distributed through the mail and in-person to carpoolers, bus riders, and vanpoolers who use the HOV system. Respondents then mailed the questionnaires back to PRR, an independent communications firm which headed up the study. Additional phone surveys of carpoolers were also performed as a follow-up measure to help ensure a sufficient response from that group. The study achieved an overall response rate of 19.3 percent, a statistically valid rate of return for this type of study.
4 WSDOT wil l be addressing this problem with a study in 2007.

HOV User Survey, Washington State Freeway System 1-7
Why is this study important? This study helped to clarify several assumptions about HOV lanes. Why people carpool, who they’re carpooling with, and what they would be likely to do without HOV lanes are important pieces of the puzzle to consider when making operational or policy decisions about the freeway system. Having some quantification allows us to project, estimate, and forecast more accurately. Understanding the primary motivators behind shared-ride usage will also be helpful as WSDOT investigates various traffic management strategies.
This study showed that:
▪ 15 to 18 percent of HOV lane users during the peak commuting periods, and 18 to 23 percent of HOV lane users during the mid-day, reported they would switch to solo driving if the HOV lanes were not available. A certain amount of incentive from HOV lanes to use shared rides has always been assumed but has never been well quantified before. Due to the wording of the questionnaire this finding is considered to be conservative; the actual number of HOV users switching to solo driving in the event of long-term or permanent closure of the HOV lanes could be as high as 30 percent.5 This is important information for analysis and modeling when considering changes to HOV lane policy and operations, and could be used for construction mitigation as well.
▪ HOV lane closure would also impact side streets and peak hour spreading. Approximately 26 percent of carpoolers said they would continue carpooling, but switch to driving either on a different route (19%) or on the same route during different hours (7%) if HOV lanes were no longer available. This would impact congestion on parallel corridors and surface streets. It would also increase the trend towards peak congestion periods becoming longer.
5 Please see discussion of this issue in the “What are the l imitat ions to this study?”
section of the report on page 2-7.

1-8 Introduction
▪ People chose shared rides for reasons other than time savings and reliability. Time savings and travel time reliability have always been assumed to be the prime motivators for HOV use. This study showed that saving money, convenience, and stress reduction were of equal or more importance than time savings for many users. Reliability was rated sixth across the board, coming in behind concern for the environment.6 This is critical information as the WSDOT moves towards various traffic management strategies throughout the region.
▪ Most carpools were composed of household members. Sixty-two percent of AM commute carpools, 71 percent of mid-day carpools, and 71 percent of PM commute carpools were composed of members of the same household. How many carpools are composed of such “fam-pools,” what their contribution to overall traffic reduction is, and whether they constitute “legitimate” carpools are all topics of discussion in the transportation planning field. This finding will provide another piece of data as HOV lane operational policy and traffic management approaches are discussed and analyzed.
Family-Pools
Family-pools, or “fam-pools,” are carpools consisting of two or more people from the same household. Fam-pools can consist of a parent and child, but often consist of two adults commuting together to work.
Fam-pools are an important component of HOV users, carrying approximately 42 percent of all people in the HOV lanes during the peak commuting periods.
▪ Fam-pools and multi-household carpools would behave very similarly without HOV lanes. Fam-pools have always been assumed to be more stable than carpools composed of people from different households. The thinking was that people from the same household would drive together whether there were HOV lanes or not. However, multi-household carpools reported that they would be two percent more likely than fam-pools to continue carpooling together during the peak periods without HOV lanes. Less than half of both family-pools and standard carpools reported they would continue carpooling without HOV lanes. Overall, both types of carpools could be expected to behave very similarly to each
6 Please see discussion of this issue in the “What are the l imitat ions to this study?”
section of the report on page 2-7.

HOV User Survey, Washington State Freeway System 1-9
other without HOV lanes, providing another important consideration for modeling of policy changes.
▪ Ride-sharing is a choice. All three modes reported using other ways of traveling, including solo driving, on an “usual” basis. Almost 99 percent of all HOV lane users, including 98 percent of bus riders, reported having at least one working vehicle in their household, and 80 percent of all HOV lane users reported having two or more working vehicles in their household. This suggests that HOV use is highly discretionary. HOV user groups who are voluntarily utilizing shared-ride modes can be expected to behave differently without HOV lanes than users who have no choice about how they travel.
▪ 87 percent of bus riders and vanpoolers, and 24 percent of carpoolers, utilized employer rideshare incentives. Many employers offer a variety of incentives to their employees to take the bus, vanpool, or carpool. These incentives can include free or reduced-cost bus passes, free or reduced-cost vanpool and carpool parking, ride-matching services, and other such encouragements to rideshare. Although only a quarter of carpoolers participated in employer incentives, 43 percent of those participants said they would stop carpooling if those incentives were removed. Bus riders were significantly more likely to continue riding the bus even if employer incentives were not offered (59%), and vanpoolers were also more likely than carpoolers to continue vanpooling (49%). Almost a third of bus riders and vanpoolers said they did not know what they would do without employer incentives. This information will be useful to commute trip reduction programs, transportation demand management efforts, employee transportation coordinators, and funding mechanisms for rideshare programs.
Commute Trip Reduction
The Washington State Legislature passed the Commute Trip Reduction Law in 1991, incorporating it into the Washington Clean Air Act. The goals of the program are to reduce traffic congestion, reduce air pollution, and reduce petroleum consumption through employer-based programs that decrease the number of commute trips made by people driving alone.
www.wsdot.wa.gov/TDM/CTR

1-10 Introduction
▪ Some important demographic and usage distinctions existed between commuting period and mid-day users. Trip purposes were more varied among all three modes during the mid-day period, and driving alone increased for car and vanpoolers. During the mid-day, non-work activities were cited by about 71 percent of carpoolers, 45 percent of bus riders, and 16 percent of vanpoolers. Seventy percent of mid-day carpoolers were making work-related trips, going to meetings, or running errands. This adds challenge to the assumption that HOV lane users during the middle of the day are largely parents transporting their children between school and after-school activities. This can be used to inform any decisions on changing operational policy during the mid-day.
Chapter 2: Project Methodology
This chapter provides a summary of project methodology. A more detailed discussion is presented in the Appendices.
How were HOV lane users identified? In order to distribute questionnaires to HOV users, it was necessary to identify a pool of potential recipients for each of the three targeted user groups: carpoolers, bus riders, and vanpoolers. Potential recipients for these three groups were identified as follows: Confidentiality
License plate numbers of carpools in the HOV lanes were recorded during surveys performed by WSDOT. The State Department of Licensing provided a list of registered owner addresses based on the license plate numbers. Lists of vanpoolers and vanpool drivers were provided by transit agencies.
This information was collected and provided by State and local agencies under strict confidentiality guidelines. The lists were used solely for research purposes and were destroyed after the study was completed. At no point during the study was it possible to track survey answers back to individual names, addresses, or drivers.
Carpoolers. License plate numbers were collected from vehicles in the HOV lane at different points along the area’s major freeways in 2004 and 2005. These freeways included I-5, I-90, I-405, SR 167, and SR 520. The license plate numbers were submitted to the State Department of Licensing in order to obtain mailing addresses of the registered owners. This was part of a larger license plate collection effort designed to provide potential survey addresses for a number of WSDOT projects. A random sample of about 16,000 addresses was selected from the large database returned by the State Department of Licensing. Approximately 11,200 were from the morning and afternoon peak commuting time periods, and 4800 from the mid-day. A complete list of collection locations is provided in Appendix E.

2-2 Project Methodology
Park-and-ride lots
Park-and-ride lots are agency-sponsored parking areas for people who take the bus, carpool, or vanpool. The Puget Sound area has over 125 park-and-ride lots which provide close to 30,000 spaces for parking. Most lots also have bike racks or bicycle lockers. In addition to agency-sponsored parking areas, many informal park-and-ride lots exist around the area.
www.wsdot.wa.gov/TDM/parkRide
Bus riders. In order to target bus riders who use HOV lanes, express routes to a variety of locations were chosen. Questionnaires were distributed in person to riders of these bus routes at 19 of the area’s largest park-and-ride lots during the morning commute over the course of 1½ weeks in early January 2006. Since we were able to distribute questionnaires in such a manner, it was unnecessary to identify individual bus riders.
Vanpoolers. Community Transit (Snohomish County), King County Metro, and Pierce Transit all operate vanpool programs. These three agencies identified vanpools which normally travel in freeway HOV lanes. Approximately 67 percent of the vanpools identified by King County Metro (randomly chosen), and all of those identified by Community and Pierce Transit, were included in this study.
How were the surveys developed? Three different groups were targeted in this study: carpoolers, bus riders, and vanpoolers. All three form equally important yet distinct user groups of the HOV system. Each group has different interests, perspectives, and user needs.
To help get a clear picture of the usage of these three groups, separate questionnaires were developed for each. Having three separate questionnaires enabled us to develop discrete data sets for the three different groups, and to have more flexibility while performing analysis. The questions in each questionnaire were identical except for references to the travel mode. For example, question #2 read “During a typical Monday to Friday, which freeway HOV lanes do you usually use in a vanpool during the following times of the day?” (or on a bus, or in a carpool). The only exception to question duplication was question #4. For this question, the questionnaire for carpoolers and vanpoolers read “During a typical Monday to Friday, who are the other members of your [carpool/vanpool] during the following times of the day?” For bus riders, this question read “During a typical Monday to

HOV User Survey, Washington State Freeway System 2-3
Local Agencies
The Washington State Transportation Center, or TRAC, is a university-based cooperative transportation research agency which performs the majority of performance monitoring of the HOV System. www.depts.washington.edu/trac
King County Metro is the public transit provider for King County, and operates the oldest and largest publicly-owned vanpool program in the country. http://transit.metrokc.gov
The Puget Sound Regional Council serves as this area’s metropolitan and regional planning organization. www.psrc.org
Friday, how do you usually get to the bus stop for each time of the day?”
Focus Group
A form of qualitative research in which a group of people are asked about their attitude towards a product, service, concept, advertisement, packaging, or, in this case, a questionnaire. Questions are asked by a facilitator in an interactive group setting where participants are free to talk with other group members. Comments and group interaction is often observed behind a one-way mirror. Group members are usually given a financial incentive to participate.
WSDOT and PRR developed draft questionnaires. The questionnaires were reviewed by a focus group. The purpose of the focus group was to remove confusing terminology and simplify sentence structure and instructions. More information on the focus group and resulting questionnaire edits is available in Appendix C. Draft questionnaires were also reviewed by the Washington State Transportation Center (TRAC), King County Metro, and the Puget Sound Regional Council.
The finalized questionnaires for each user group are provided in Appendix D.
How were the surveys distributed and collected? Carpoolers
15,986 questionnaires were mailed during the last week of December 2005. By the third week of January 2006, only 632 had been received back in the mail, 592 of whom reported using HOV lanes.
In order to increase the representation from carpoolers in the overall study, an independent survey firm attempted to complete follow-up phone questionnaires to recipients of the original mailed surveys who had not yet returned their questionnaires. This resulted in another 765 completed surveys. In addition, calls to new households from the original pool of videotaped license plate numbers whose addresses had not been part of the mailing were also attempted. The verbal survey was identical to the written carpool questionnaire, with the exception that questions were reworded as appropriate for use with 76 businesses which were identified. Many of these households or businesses were unavailable, unwilling to perform the survey, or reported that they did not usually use the HOV lanes in a carpool. By the third week in February,

2-4 Project Methodology
enough carpoolers had been contacted to complete a total of 2,005 surveys, 1965 of whom reported using HOV lanes. Out of a final total of 16,594 possible respondents, the 2,005 completed surveys represented a final response rate of 12.1 percent for carpoolers.
Bus Riders
The survey focused on bus routes which use HOV lanes and stop at major park-and-ride lots throughout the three-county area. Buses chosen for questionnaire distribution served a variety of locations throughout the Puget Sound region, including the Seattle and Bellevue central business districts, the University of Washington, Kirkland, Issaquah, Everett, Redmond, and Tacoma. Questionnaires were handed out to bus riders waiting for or boarding buses on targeted routes during the weekday morning commute (approximately 6AM to 9 AM) the first and second weeks of January 2006. Each bus rider was handed a questionnaire along with a pencil and a brief verbal request to fill the questionnaire out on the bus and then drop it in the mail on the way to work. A strictly limited amount of information was provided to bus riders in order to avoid skewing the responses. A complete list of park-and-ride lots, targeted routes, and dates of questionnaire distribution are provided in Exhibit E-2 in Appendix E.
Counties of the Puget Sound
The Puget Sound region is generally considered to be made up of Snohomish, King, Pierce, and Kitsap Counties. Three-county area usually refers to Snohomish, King, and Pierce, as Kitsap is separated from the rest of the area by the waters of Puget Sound. These counties are shown in Exhibit 1-2.
6,365 questionnaires were distributed to bus riders. By the third week in February 2006, 2,424 questionnaires had been received back in the mail, 2,338 of which reported using HOV lanes. This represented a 38.1 percent response rate for bus riders.
Vanpoolers
Community Transit, King County Metro, and Pierce Transit identified vanpools which normally use the freeway HOV lanes. Questionnaires were mailed to addresses of vanpoolers provided by King County Metro. For Community and Pierce Transit, questionnaires were distributed by the transit agencies

HOV User Survey, Washington State Freeway System 2-5
themselves to vanpool drivers who were then asked to give them to their riders.
6,597 questionnaires were distributed or mailed to vanpoolers during the last week of December 2005. By the second week in February 2006, 1,273 questionnaires were received back in the mail, 1,170 of which reported using HOV lanes. This represented a 19.3 percent response rate for vanpoolers.
Overall Response Rates
The total number of questionnaires completed for all three groups in this study was 5,702 (5,473 of which used HOV lanes). This was out of a total of 29,556 distributed questionnaires, including the follow-up calls to carpoolers. The response rate for the study as a whole was 19.3 percent. Response rates by user group are illustrated in Exhibit 2-1.
Exhibit 2-1
Survey Response Rates by Mode
12.1%
38.1%
19.3% 19.3%
0.0%
10.0%
20.0%
30.0%
40.0%
50.0%
Carpoolers Bus Riders Vanpoolers OverallResponse Rate
These response rates stand in contrast to the representation of the three user groups in an average HOV lane. Although mode share varies by location, carpoolers make up approximately 62 percent of HOV system users, followed by bus riders (28%), with vanpoolers making up the smallest segment of HOV users (3%) system-wide during the peak periods. Trucks, motorcycles, and violators make up the remaining seven

2-6 Project Methodology
percent. User groups are shown as a percentage of all HOV lane users during the peak periods in Exhibit 2-2.
Exhibit 2-2
Typical Modes of HOV Lane Users Peak Periods & Directions All Monitoring Locations, 2006
62%
28%
6% 3% 1%0%
20%
40%
60%
80%
Carpoolers Bus Riders Trucks &Motorcycles
Vanpoolers Solo Drivers
Because the representation of user groups in the HOV lanes is very different than their representation as survey respondents, this study has veered away from combining responses from the three user groups. Instead, results are for the most part presented by mode.
How were the data intake and analysis performed? Questionnaires were mailed back to PRR, who turned them over to an automated scanning and data processor.7 A database containing the responses was then returned to PRR for analysis.
Analysis was performed only on data from those respondents who indicated they used HOV lanes. Standard statistical
7 A small number of surveys were performed by patrons wait ing for the bus and
handed back to the distributor at that t ime.

HOV User Survey, Washington State Freeway System 2-7
analysis procedures were performed using the Statistical Package for the Social Sciences (SPSS) program. Data analysis involved the use of “descriptive” statistical techniques (frequencies and percentages, or how often an answer was given) as well as “explanatory” statistical techniques to test for the statistical significance of relationships between variables.
Statistical Significance
A statistically significant difference means there is statistical evidence that a finding or result is accurate and not the result of chance. This is used to help prevent an investigator from inadvertently making false claims. It does not mean the difference is necessarily large, important, or significant in the usual sense of the word. The significance level is usually chosen to be equal to 0.05, thereby reducing the probability of a false claim to five chances out of 100. This keeps the accuracy above 95 percent for any conclusions drawn.
It should be noted that many of the charts and tables presented in the report are for “multiple response variables,” meaning that the survey respondent could select more than one answer. In such charts and tables the percentages will add up to more than 100 percent. Additional information on the statistical analysis performed for this study is available in Appendix F.
What are the limitations to this study? This study followed rigorous scientific methods, but every study has its limitations. The following potential limitations should be kept in mind when interpreting study results:
Since the respondents were all HOV lane users, it is possible they may have attempted to skew their answers to support HOV lanes. We have no way of determining if this occurred, and if so, to what degree. However, the survey questions were worded in such a way that the objectives of the study, and “HOV-supportive” answers, were not readily evident.
For example, some respondents may have thought that saying they would continue to carpool regardless of whether HOV lanes were available was the most “HOV-supportive” answer. Others may have believed that saying they would no longer carpool (if HOV lanes were no longer available) was a more “HOV lane-supportive” answer. Since the introduction to the questionnaires merely stated that the goals of the study were to improve traffic and understand community preferences and patterns, it would have been impossible for respondents as a group to know

2-8 Project Methodology
how to skew their answers in any consistent manner. The introduction printed on the paper questionnaires is presented in Appendix D. The verbal introduction given over the phone on follow-up calls to carpoolers was kept as close to the written introduction as possible. The verbal introduction given by distributors at park-and-ride lots was “to complete a quick survey to help improve the HOV lanes.”
One of the key survey questions asked “If the HOV lanes were not available, what is the ONE thing you would be most likely to do?” It is possible that “unavailability” of the HOV lanes was interpreted by some respondents as a temporary situation and by others as more permanent. Our intent with the question was the latter, i.e., to find out what HOV lane users would do if the HOV lanes were taken away either permanently or for a long period of time. However, the question could be answered differently depending upon the interpretation of the time frame.
For example, for those who interpreted the question as asking what one would do if the HOV lanes were unavailable on one trip due to a collision, or for several weeks or even months during nearby construction, we feel those respondents tended to report an intent to continue traveling in their current mode more often than those who interpreted the closure of the lanes as being more permanent. HOV users who decide to tough it out during a temporary loss of privileges and continue using their bus or carpool - even though they are stuck in traffic along with everyone else - would probably be less likely to do so for the long term.
This assumption is somewhat borne out by national studies which indicate a 20-30 percent shift from solo driving to HOV modes after opening of HOV lanes. The results of one survey in California showed that the availability of carpool lanes played a “significant” role in the formation of almost 80 percent of carpools and vanpools, as well as in the decision to take the bus for 95 percent of bus riders in HOV lanes. Almost 30 percent of single occupant

HOV User Survey, Washington State Freeway System 2-9
commuters on freeways without carpools lanes indicated that they would use shared-ride modes if HOV lanes were installed on their freeways.8 In Vancouver, British Columbia, the opening of HOV lanes on Highway 1 resulted in the formation of approximately 28 percent new carpools.9 Los Angeles and Orange County studies concluded that only freeways which added HOV lanes had a significant increase in the number of carpools; freeways without HOV lanes had a steady or declining number of carpools.10 Surveys have also shown that HOV lanes tend to cause carpools to last longer over time.11
That being said, the above surveys were performed on facilities which were going from having no HOV facilities to having HOV lanes. That is not necessarily directly transferable to what this study was trying to address. That is, what would happen going in the opposite direction, from having HOV lanes to not having HOV lanes? This study’s findings indicated multiple reasons for shared-ride usage, many of which (convenience, stress, money savings) could still provide an incentive even without HOV lanes. Once an HOV user has become accustomed to riding in a carpool, bus, or vanpool and the many advantages thereof, it might make sense that a sizable proportion of those users would choose to continue using their shared-ride mode even without HOV lanes, as indeed this study found.
8 HOV Performance Program Evaluation Report, Los Angeles County Metropolitan
Transportation Authority, Parsons Brinckerhoff Quade & Douglas, et al, November
22, 2002, p 82.
9 HOV Evaluation Summary, Brit ish Columbia Ministry of Transportation website at
http://www.th.gov.bc.ca/Publications/reports_and_studies/hovsummary/summary.htm,
October 18,2006.
10 Statewide High-Occupancy Vehicle (HOV) Issues, Caltrans, District 3, Apri l 13,
2005, p 3. (http://www.dot.ca.gov/dist3/projects/Sac50bus_carpool/pdfs/HOV-
HOT%20Facts%204-05.pdf)
11 Regional High-Occupancy Vehicle Lane System Performance Study, Final
Summary Report, Southern California Associat ion of Governments, November 4,
2004, p 8.

2-10 Project Methodology
TRAC asked somewhat similar questions in a 2007 mail-back survey of freeway users in this area. The first question asked if current carpoolers, bus riders, and vanpoolers from all lanes of the freeway (not just HOV lanes) would continue to use that mode if there were no HOV lanes. Results indicated that 22 percent of carpoolers, 12 percent of bus riders, and 17 percent of vanpoolers said they would be likely to change modes without HOV lanes. The second question asked if current carpoolers, bus riders, and vanpoolers from all lanes of the freeway would continue to use that mode to commute between home and work if there were no HOV lanes. Results to this question indicated that 32 percent of carpoolers, 20 percent of bus riders, and 19 percent of vanpoolers said they would be likely to drive alone without HOV lanes.12 Note that this survey was based on all freeway users; a survey specifically targeting HOV lane users could be expected to return even higher percentages.
We therefore feel that responses to this question most likely provided an overly low estimate of how many users would be likely to shift away from their HOV mode were the HOV lanes removed on a permanent or extended basis. Based on the above studies, a 30 percent switch to solo driving could be possible.
A secondary interpretive issue is that when asked to cite the top three reasons for choosing a shared-ride mode, reliability was listed without the clarification of travel time reliability. It is therefore possible some respondents interpreted this to mean vehicular reliability. This might account for the low rating of reliability as a reason for HOV use, although current congestion problems in the HOV lanes during the peak periods could provide an equally likely explanation for this finding.
12 Communication with TRAC, July 11, 2007. Results to be published soon at
www.depts.washington.edu/trac.

HOV User Survey, Washington State Freeway System 2-11
Many different bus routes originating at a wide array of park-and-ride lots were targeted. However, the study results should be interpreted with the understanding that only a specific sub-set of bus riders were surveyed, those being: - bus patrons boarding at selected lots - bus patrons boarding targeted HOV routes, and - bus patrons boarding during the morning peak period.
Mid-day bus riders were least likely to be sampled.
Due to problems with some of the license plate numbers collected during 2004 and 2005, discrete HOV lane data for carpools were available only from three locations during the peak periods. (Data were successfully collected from around the system for mid-day users.) All of these locations were in the south half of the HOV system. Although the bulk of the carpool respondents were from south King County, these three survey locations nevertheless captured residential origins fairly well spread throughout the three-county region. It is possible that responses to peak period carpool survey questions might be different had data been available from more representative locations around the system, e.g., including more addresses from north King, and Snohomish and Pierce Counties, during the peak periods. Maps showing license plate collection locations and carpool respondent addresses are presented in Appendices E and H, respectively.
Finally, we do not know whether users who responded to the survey were systematically and significantly different from those who received the questionnaire but did not respond. We were able to test this question to some degree by comparing the responses of those who responded to the mailed carpool survey to a small sample of those who did not and were later contacted by phone. Although these non-responders did not significantly differ in gender or age, they were different from those who returned their questionnaire in the mail in the following ways:

2-12 Project Methodology
- Non-responders were more likely to switch to another route if HOV lanes were no longer available, compared to those who completed the mailed survey who were more likely to continue carpooling or to switch to solo driving.
- Non-responders were equally likely to use HOV lanes during the mid-day as they were during commuting periods, whereas those who completed the mailed survey were less likely to use the HOV lanes during the mid-day.
In spite of the above qualifications, study findings are considered to be valid and reliable as a result of the careful sampling procedures employed as well as the pre-testing and adjustment of survey questions which took place.
What were the demographics of those who participated in the study? Overall, respondents to this survey were 55 percent female, 45 percent male. Statistically significant differences in mode by gender include: females were much more likely to use buses and slightly more likely to use carpools, and males were more likely to use vanpools.13 Other respondent demographics include:
55 percent were in the 35-54 year old age range, and 74 percent fell in the 35-64 year old age range.
Eighty percent had two or more motor vehicles in the household.
Respondents were from fairly representative residential areas around the HOV system, despite the carpool data collection problems described in the section above. The
13 Cramer ’s V = .135, p = .000. For a description of Cramer ’s V, see the Glossary
provided in Appendix A.

HOV User Survey, Washington State Freeway System 2-13
three data collection locations which produced usable license plate numbers for this study were on I-5 south of downtown Seattle in Georgetown, and on SR 167 in Renton and in Auburn. Nevertheless, HOV lanes shown to be used most often by the respondents were I-5 north of downtown Seattle. HOV routes used by survey respondents for all three time periods are illustrated in Exhibit 2-3. More details on respondent demographics are available in Appendices H and I.
Exhibit 2-3
HOV Corridors Used by Survey Respondents All Time Periods
0%
10%
20%
30%
40%
I-5North of
Downtown
I-5South of
Downtown
I-405Northof I-90
I-90 I-405Southof I-90
SR 167 SR 520
Note: Multiple responses were allowed for this question so percentages will not add up to 100%.
\

2-14 Project Methodology

HOV User Survey, Washington State Freeway System 3-1
Cross tabulation
A statistical technique showing how answers which fall into one category can also be distributed among other categories. For example, one cross-tabulation performed for this study compared travel modes reported by respondents with their age ranges, resulting in the finding that carpoolers tend to be older than bus riders and vanpoolers.
Chapter 3: Findings
This chapter summarizes the major study findings. Detailed analysis output for each question, along with cross-tabulations that were performed in order to further clarify statistical relationships, can be found in Appendices G – I.
What motivates people to use shared rides? When asked to rank the top three reasons they use an HOV mode, saving money emerged as the biggest motivator for bus riders and vanpoolers. For carpoolers, travel time savings was cited as the major advantage, followed closely by convenience. The top four answers to this question during the peak periods are listed below, summarized in Exhibit 3-1, and presented in detail in Exhibit G-6 in Appendix G.
Carpoolers: Bus Riders: Vanpoolers: 1. Travel time 1. Saving money 1. Saving money 2. Convenience 2. Less stressful 2. Less stressful 3. Saving money 3. Convenience 3. Travel time 4. Less stressful 4. Travel time 4. Convenience

3-2 Findings
This finding was interesting in that travel time savings and travel time reliability have always been assumed to be the prime motivators for HOV use. While time savings ranked highly for carpoolers, it came in third behind saving money and stress for vanpoolers, and for bus riders it came in fourth, behind convenience. Even for carpoolers, travel time savings was ranked only a few percentage points above convenience. Reliability came in 6th, behind environmental concerns, across all three modes. Saving money, stress, and convenience are clearly major factors in deciding to use shared-ride modes for virtually all HOV lane users.
This survey was performed during the first week of 2006, well before gasoline prices reached a high in Washington State in May of 2007.14 The ranking of money savings may therefore be more closely related to downtown parking costs, for which Seattle ranks sixth highest in the nation.15
14 www.fuelgaugereport.com/WAavg.asp, accessed on 7-11-07.
15 http://seatt let imes.nwsource.com/html/businesstechnology/2003810556_sundaybuzz29.html, accessed on 8-13-07.
Exhibit 3-1
Top Reasons for Mode Choice Peak Periods
0%
20%
40%
60%
80%
100%
Carpoolers Bus Riders Vanpoolers
Save money
Travel time sav ings
Less stressful
Convenience
Concern for the env ironment
Reliability
No other transportation
Other

HOV User Survey, Washington State Freeway System 3-3
Who is most likely to drive alone? The motivators for shared-ride use discussed above seemed to be effective for many users only four days a week or less. As can be seen in Exhibit 3-2, most carpoolers, bus riders, and vanpoolers did not use those modes exclusively. A large portion of respondents said they also drove alone during the peak commuting hours on a regular basis, as follows:16
Usual mode:
Driving alone increases even more among carpoolers and vanpoolers during the mid-day period. “Usual” travel modes are shown for the peak periods in Exhibit 3-2, and shown in detail by mode and time period in Exhibit G-1 in Appendix G.
16 Note that mult iple responses were al lowed for this question so percentages wil l not add up to 100%.
- Carpool: 56% - Ride bus: 98% - Vanpool: 93%- Drive alone: 44% - Drive alone: 20% - Drive alone: 15%
- Carpool: 70% - Ride bus: 95% - Vanpool: 88%- Drive alone: 34% - Drive alone: 22% - Drive alone: 20%
AM Peak AM Peak AM Peak
PM Peak PM Peak PM Peak
Carpoolers Bus Riders Vanpoolers

3-4 Findings
Exhibit 3-2
Usual Travel Modes Peak Periods
63%
97%91%
39%
21% 18%
0%
20%
40%
60%
80%
100%
120%
Carpoolers Bus Riders Vanpoolers
Usualshared-ridemode
Drivealone
Note: Multiple responses were allowed for this question so percentages will not add up to 100%.
This finding was interesting in that it points to the apparently discretionary nature of shared-ride use. This seems particularly true for carpoolers, but true also for bus riders and vanpoolers who drove alone to and from work approximately 20 percent of the time on a regular basis.
What impacts do employer incentives have on mode choice? As described above, the nature of HOV usage appears to be highly discretionary. It is therefore helpful to know what outside factors may be encouraging, or discouraging, shared-ride use. One of the largest such factors are incentives provided by employers. These incentives are usually in the form of:
Convenience factors, such as parking stalls located close to the worksite, on-site bus pass or ticket purchasing, rideshare matching services to help users find other carpoolers or vanpoolers, and flexibility at work in the form of movable start and stop times which enable workers to
HOV User Survey, Washington State Freeway System 3-5
Guaranteed Ride Home
Part of a successful commute trip reduction program usually involves a guaranteed ride home in the case of emergencies for employees who have chosen to commute by ride-share and therefore do not have a personal vehicle handy. Guaranteed ride home programs usually involve a contracted taxi service. Users pay with a voucher, or pay out of their pocket and are reimbursed.
adjust their work schedules to bus times or to accommodate their fellow carpoolers or vanpoolers.
Financial incentives, including free or discounted bus passes, free or discounted parking for carpools and vanpools, and commute trip reduction allowances or payments for utilizing shared-ride modes.
Mobility support, in the form of “guaranteed ride home” programs which pay for a taxi in case of emergencies, or use of company cars for running errands or going to medical appointments during the day.
The largest incentives used by bus riders were reduced-fare or free bus passes, and the largest incentives used by vanpoolers were monetary allowances and preferential parking spaces. Although carpoolers make up approximately 62 percent of peak freeway HOV lane users, most employer incentives involved bus and vanpool use only. Carpoolers who do use employer incentives cited free, reduced, or preferential parking most often. Use of employer incentives by mode is presented in Exhibit 3-3, and presented in more detail in Exhibit G-8 in Appendix G.

3-6 Findings
Exhibit 3-3
Employer Incentives Used
0%
20%
40%
60%
80%
100%
Carpoolers Bus Riders Vanpoolers
Free or discountedbus pass
Monetaryallowances/incentives
Flexible workschedule
Free, reduced, orpreferential parking
Rideshare matchingservice
Bus pass sold atwork
Other
None
Note: Multiple responses were allowed for this question so percentages will not add up to 100%.
Respondents were also asked what they would do if their employer incentives were removed. For carpoolers who did receive employer incentives, those incentives played a larger role in mode choice than for bus riders and vanpoolers. While only a quarter of carpoolers utilized (or were offered) employer incentives, 43 percent of this group said they would stop carpooling if those incentives were removed. Bus riders and vanpoolers were more likely than carpoolers to continue using their mode without employer incentives --although almost a third stated that they did not know what they would do.17 The decision to continue using the same HOV mode even without employer incentives is presented by mode in Exhibit 3-4.
17 Cramer ’s V = .280, p = .000

HOV User Survey, Washington State Freeway System 3-7
Exhibit 3-4
Continue HOV Mode Without Employer Incentives?
Note: Multiple responses were allowed for this question so percentages will not add up to 100%.
The intent to continue riding the bus and continue vanpooling even without incentives seems to again underscore the varied reasons for shared-ride use discussed at the beginning of the chapter. Although bus riders and vanpoolers cited saving money as a top reason, the other motivating factors of less stress, convenience, and time savings obviously came into play as they answered this question. Likewise, carpoolers, who cited saving money behind other motivators, nevertheless were most likely to stop carpooling without employer incentives, many of which were financial.
The question of incentives leads naturally to one of the largest assumed incentives for shared-ride use: HOV lanes. Does the existence of the lanes encourage people to car/vanpool or take the bus, or would they most likely be traveling like that anyway?
43% 43%
14%
59%
13%
28%
49%
22%
29%
0%
20%
40%
60%
Yes No Don't know
Car
pool
ers
Bus
Rid
ers
Vanp
oole
rs
Car
pool
ers
Bus
Ri
ders
Vanp
oole
rs
Car-
pool
ers
Bus
Rid
ers
Vanp
oole
rs

3-8 Findings
What are people likely to do if HOV lanes are not available? When asked what is the one thing they would be most likely to do if HOV lanes were not available, between 39 and 70 percent of all respondents said they would continue traveling the same way they are now. The second most popular response was to switch to solo driving, followed by taking a different route, changing HOV mode, and driving at a different time. Responses varied by mode and time of day. Major findings for this question are summarized for the peak periods in Exhibit 3-5 and presented in more detail in Exhibit 3-6. Discussion of different responses follows.
Exhibit 3-5
Likely Travel Actions if HOV Lanes Not Available Peak Periods
0%
20%
40%
60%
80%
100%
Carpool Bus Vanpool
Drive alone
Change route
Change hours of travel
Use same mode
Change HOV mode
Other
f

HOV User Survey, Washington State Freeway System 3-9
Exhibit 3-6
Likely Travel Actions if HOV Lanes Not Available By Mode & Time of Day
5 - 9 AM9 AM to
3 PM 3 - 7 PM 5 - 9 AM9 AM to
3 PM 3 - 7 PM 5 - 9 AM9 AM to
3 PM 3 - 7 PMn=1282 n=834 n=1506 n=2203 n=480 n=2066 n=952 n=250 n=842
Continue to usesame mode 40.0 39.2 41.6 69.8 56.0 69.2 68.4 57.8 64.6
Drive alone 18.3 18.0 17.4 15.9 23.3 16.2 14.9 18.1 15.4
Change route 18.2 19.7 19.2 2.9 2.9 3.0 3.7 5.4 4.9
Switch to anotherHOV mode 7.6 4.1 5.9 3.5 2.9 3.3 4.3 5.3 5.3
Change hoursof travel 6.9 7.7 6.9 2.4 1.5 2.2 3.7 2.4 4.4
Other 9.2 11.4 9.0 5.6 13.4 6.0 4.9 11.0 5.3
TOTAL 100 100 100 100 100 100 100 100 100
Note: "n" is the number of responders for each category.
Carpool % Bus % Vanpool %Likely Actions
Continue traveling the same way
When asked what they would do if HOV lanes were no longer available, most respondents said they would continue traveling the same way they are now. The percentage of those who would continue to use the same mode is shown by user group and time of day in Exhibit 3-7.

3-10 Findings
Exhibit 3-7
Those Who Would Continue Current Mode Without HOV Lanes
40%
70% 68%
39%
56% 58%
42%
69%65%
0%
10%
20%
30%
40%
50%
60%
70%
80%
Carpoolers Bus Riders Vanpoolers
AM Peak
Mid-Day
PM Peak
Carpoolers would continue to stay with their current mode about 25 percent less often than bus riders or vanpoolers, and all three modes would be more likely to switch to another means of travel during the mid-day. These results suggest that carpooling is more discretionary than bus or vanpool use, as might be expected for a mode requiring the least pre-planning and enjoying the most flexibility.
Switch to solo driving
Since saving money was so motivating for bus riders and vanpoolers, it would seem that they would be more likely to continue taking the bus or vanpool without HOV lanes, since those money savings would still apply for the most part. Likewise, carpoolers would seem to be most susceptible to driving alone if HOV lanes were not available since their major motivator, travel time savings, would no longer apply.
Surprisingly, all three modes reported that they would switch to single-occupant freeway driving at very similar rates, ranging only from 15 to 18 percent during the peak periods across all

HOV User Survey, Washington State Freeway System 3-11
three modes. The one response outside of this range for the whole day were bus riders, 23 percent of whom said they would switch to solo driving during the mid-day. The percentages of those who would switch to driving alone are shown by user group and time of day in Exhibit 3-8.
Exhibit 3-8
Percent Who Would Switch to Solo Driving
18% 18% 17% 16%
23%
16% 15%18%
15%
0%
5%
10%
15%
20%
25%
AM Peak Mid-Day PM Peak AM Peak Mid-Day PM Peak AM Peak Mid-Day PM Peak
Carpool Bus Vanpool
Other responses
Other responses to HOV lane unavailability included switching to another HOV mode, taking a different route, traveling at different hours, and “other.”
Switching to a different HOV mode or another route. Between three and five percent of bus riders and vanpoolers said they would switch to a different HOV mode or take a different route. For carpoolers, however, approximately six percent said that they would switch to taking a bus during the peaks, and 19 percent said they would take a different route to work during the peak periods. This could have significant impacts on parallel corridors and surface streets. In addition to this 19 percent, there were several differences noted between responders and non-responders to the mailed carpool survey, as described in more detail in the “What are the limitations to this study?” section of the Methodology Chapter on page 2-7. One of those distinctions was that non-responders were more likely than responders to switch to another route if

3-12 Findings
HOV lanes were no longer available. Since non-responders formed the vast majority of surveyed carpoolers, it would be safe to assume that this effect would be even greater.
Traveling at different times. Approximately seven percent of carpoolers said that they would travel at a different time. Prime commuting hours are generally considered to be from 6 to 9 AM in the morning, and 3 to 7 PM in the evening. Even now it is common for commute-related congestion to occur before or after these time periods. Seven percent of HOV carpoolers changing the time of their prime commute could add to this trend of “peak hour spreading,” i.e., towards longer and longer rush hours. About one to four percent of bus riders and vanpoolers said they would travel at a different time as well.
Other. Responses which fell into the “other” category included protesting, lobbying, and finding another job. These responses ranged from 5 to 13 percent across the three modes.
How many carpools are “fam-pools,” and how would their behavior differ from standard carpools? One of the more interesting findings described above was that carpools would tend to break out into single occupant vehicles on the freeways during the peak commuting periods at about the same rate as bus riders and vanpoolers if the HOV lanes were not available. This finding flies in the face of conventional thinking, which assumes that most carpools are people from the same household who would be driving together whether there were HOV lanes or not.
As shown in Exhibit 3-9, the percentage of carpools from the same household, also known as family-pools or “fam-pools,” was indeed quite high during all three time periods. Close to

HOV User Survey, Washington State Freeway System 3-13
Exhibit 3-9
Percentage of Fam-Pools vs. Multi-Household Carpools in HOV Lanes
Fam-Pools
Multi-HouseholdCarpools
5 - 9 AM 62% 38%
9 AM - 3 PM 71% 29%
3 - 7 PM 71% 29%
three-fourths of all carpools were shown to be composed of household members during the mid-day and PM peak period.18
Would fam-pools drive together whether there were HOV lanes or not, and would multi-household (standard) carpools be more likely than fam-pools to disband if the HOV lanes were no longer there? Surprisingly, no. Multi-household carpools reported they were overall two percent more likely than fam-pools to continue carpooling together without HOV lanes. Although it seems contradictory, multi-household carpools were also about 5½ percent more likely than fam-pools to break out into solo driving. The most pronounced difference between the two groups was that fam-pools would be six percent more likely to switch to a different route than multi-household carpools.
When viewed from the perspective of overall behavior, both types of carpools would be expected to behave very similarly without HOV lanes, that is, less than half of both family-pools and standard carpools reported they would continue carpooling without HOV lanes. Responses of these two groups for the peak periods are presented in Exhibit 3-10. A more detailed breakdown by time of day for both types of carpools is presented in Exhibit G-7b in Appendix G.
18 The questionnaire structure did not al low determination of how many fam-pools
include children. A survey performed by TRAC in 2007 found that approximately
21% of carpools include a child.

3-14 Findings
Exhibit 3-10
Likely Travel Actions without HOV Lanes Fam-Pools vs. Multi-Household Carpools Peak Periods
15%
7%
19%
44%
14%
8%
13%
23%
42%
15%
0% 10% 20% 30% 40% 50%
Other
Change hoursof travel
Drive alone
Change route
Continue to carpool
Fam-Pools
Multi-HouseholdCarpools
Could most HOV users choose to drive alone? Along with household composition of carpools, another frequently made assumption about HOV users is that they are traveling that way largely because they do not have other options. If a carpool is composed of two adults commuting to work, is it safe to assume the household owns only one car? Is it safe to assume that many bus riders are transit-dependent, or that vanpoolers have a car at home that is most likely being used by someone else in the family? In other words, would most HOV users be driving alone in their own car if they could be?
Almost all survey respondents reported having a working car at home, and 80 percent reported having two or more. Even among bus riders, almost three-quarters reported having two or

HOV User Survey, Washington State Freeway System 3-15
more vehicles in their household.19 Although other considerations go into the decision to choose a shared ride mode besides car availability, it can be ventured that the vast majority of individuals in the HOV lanes could be driving their own vehicles more often if they so chose. The number of working vehicles in the household as reported by mode is presented in Exhibit 3-11, and in more detail in Exhibit I-2 in Appendix I.
Exhibit 3-11
Number of Working Vehicles in Household by Mode 100%
87%
74%
99%
80%
98%
0%
20%
40%
60%
80%
100%
At least 1 car 2 or more cars
Car
pool
ers
Bus
Rid
ers
Vanp
oole
rs
Car
pool
ers
Bus
Rid
ers
Vanp
oole
rs
How do trip purposes for HOV lane users vary throughout the day? Although we cannot tell from the study data if respondents were combining their commutes with other trip purposes, we do know that the major trip purpose for bus riders and vanpoolers during the peaks was, not surprisingly, commuting between home and work. Trip purposes for bus riders varied more during the mid-day period than for vanpoolers. About 45 percent of bus riders, and 16 percent of vanpoolers, cited non-work trip purposes during the mid-day on the HOV lanes.
19 Cramer ’s V = .153, p = .000
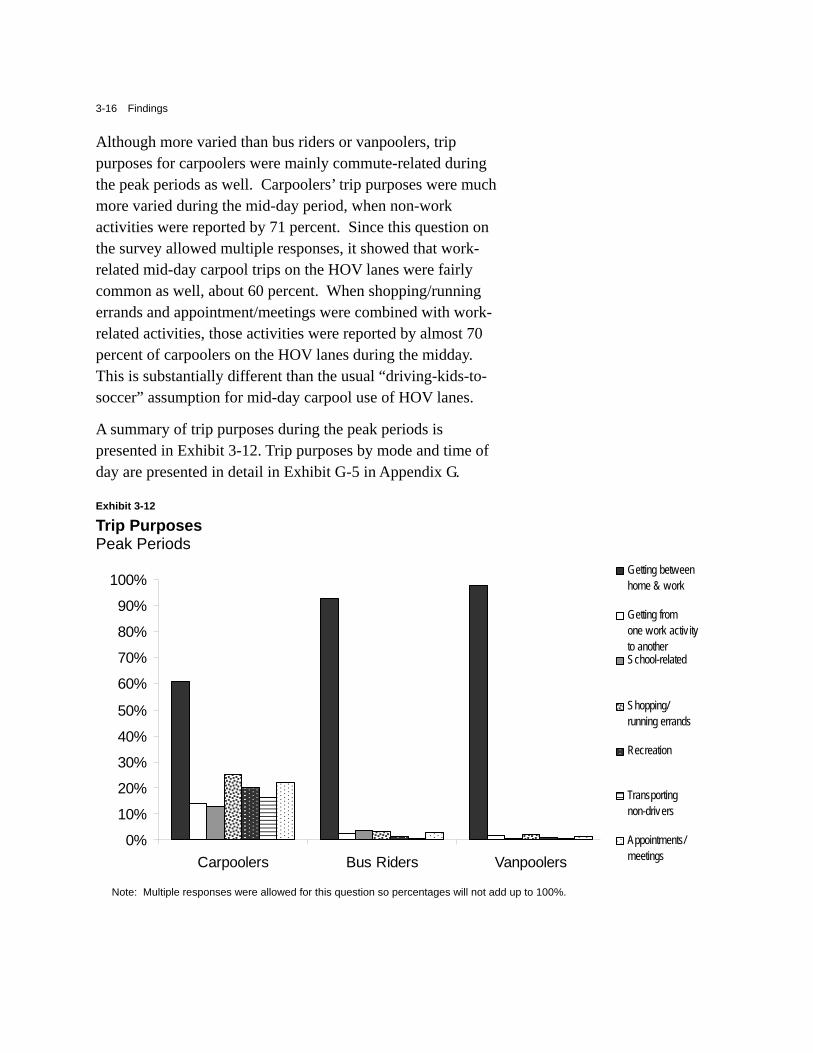
3-16 Findings
Although more varied than bus riders or vanpoolers, trip purposes for carpoolers were mainly commute-related during the peak periods as well. Carpoolers’ trip purposes were much more varied during the mid-day period, when non-work activities were reported by 71 percent. Since this question on the survey allowed multiple responses, it showed that work-related mid-day carpool trips on the HOV lanes were fairly common as well, about 60 percent. When shopping/running errands and appointment/meetings were combined with work-related activities, those activities were reported by almost 70 percent of carpoolers on the HOV lanes during the midday. This is substantially different than the usual “driving-kids-to-soccer” assumption for mid-day carpool use of HOV lanes.
A summary of trip purposes during the peak periods is presented in Exhibit 3-12. Trip purposes by mode and time of day are presented in detail in Exhibit G-5 in Appendix G.
Exhibit 3-12
Trip Purposes Peak Periods
0%
10%
20%
30%
40%
50%
60%
70%
80%
90%
100%
Carpoolers Bus Riders Vanpoolers
Getting betweenhome & work
Getting fromone work activ ityto anotherSchool-related
Shopping/running errands
Recreation
Transportingnon-drivers
Appointments/meetings
Note: Multiple responses were allowed for this question so percentages will not add up to 100%.

HOV User Survey, Washington State Freeway System 3-17
How do mid-day users differ from peak period users? Some of the findings reported in this section were previously discussed. They are repeated in this section in order to summarize all of the findings regarding differences between peak hour and mid-day HOV lane use, which was one of the main study purposes.
One finding of interest came out of the question asked of bus riders “How do you usually get to the bus stop for each time of the day?” While most of the surveyed bus riders got to their bus by driving alone during the peak periods, the percentage who walked or took a bicycle increased from 14 percent during the AM, to 41 percent during the mid-day, and 32 percent during the PM. This makes sense, since a person who takes the bus in to work in the morning would most likely be walking until they returned to the park-and-ride or home where they left their vehicle. It is also reflective of the sampling of bus riders, which was constrained to those who board buses at park-and-ride lots.
Most of the other differences between peak hour and mid-day use of HOV lanes were fairly predictable, including:
▪ HOV system users were more likely to utilize their typical shared-ride mode during the peak periods than during the mid-day. The percentage of people driving alone increased for car and vanpoolers during the mid-day period.
▪ Carpools were more likely to be composed of other household members during the mid-day and evening commute than during the AM commute.
▪ Trip purposes for all three modes varied more during the mid-day period than during the peak periods, when the trip purpose was overwhelmingly work-related. During the mid-day, non-work activities were cited by about 71 percent of carpoolers, 45 percent of bus riders, and 16 percent of vanpoolers.

HOV User Survey, Washington State Freeway System 4-1
Chapter 4: Conclusions
Do freeway HOV lanes provide an incentive for people to choose a shared-ride mode?
Yes 15-18% peak periods 18-23% mid-day Other studies indicate up
to 30% during the peak periods.
Most respondents said they would continue to use their current shared-ride mode even if HOV lanes were not available. However, about 15 to 23 percent of HOV lane users, across all three modes and time periods, would probably switch to driving alone if HOV lanes were “not available.” For the peak periods, this percentage dropped to 15 to 18 percent. Taking into consideration the qualifications to this question discussed in the “What are the limitations to this study?” section of the report on page 2-7, anywhere from 15 up to 30 percent of current HOV users could be expected to switch to solo driving during the peak periods under a long-term or permanent opening of HOV lanes to general traffic.
Approximately 26 percent of carpoolers said they would continue carpooling, but switch to driving either on a different route, or on the same route during different hours, if HOV lanes were no longer available. This would impact congestion on parallel corridors and surface streets, and add to the trend of peak commuting periods spreading out into the rest of the day.
4-2 Conclusions
Key Motivators Carpoolers 1. Travel time 2. Convenience Bus riders 1. Saving money 2. Stress reduction Vanpoolers 1. Saving money 2. Stress reduction/travel time HOV system overall (weighted for representation in the HOV lanes) 1. Travel time 2. Convenience 3. Saving money 4. Stress reduction
Yes More non-work trip
purposes More driving alone More fam-pools More walking and
bicycling to reach bus stops
Are mid-day HOV lane users different than peak period users? Yes, in mostly expected ways. While peak period trips tended to be work-related, trip purposes for bus riders and carpoolers varied more during the mid-day period, with non-work related activities being mentioned by about 45 percent of bus riders, and 71 percent of carpoolers. Only 16 percent of vanpoolers were engaged in non-work activities during the mid-day.
Driving alone increased among car and vanpoolers during the mid-day period.
Carpools were more likely to be fam-pools during the mid-day and evening commute than during the AM commute.
The percentage of bus riders that walked or took a bicycle to get to their bus increased from 14 percent (AM) and 32 percent (PM) to 41 percent during the mid-day.
Other key findings Saving money, convenience, and stress reduction equaled or surpassed time savings as a top reason for shared-ride use. When combining modes during the peak periods and weighting for representation in the HOV lanes, the biggest reasons cited for choosing shared-ride modes were very closely split between saving time, convenience, saving money, and stress reduction. This falls out differently when separated by mode. The major perceived advantage by far for bus riders and vanpoolers during the peak periods was saving money, with stress reduction about six to ten percentage points lower as a secondary reason for these two modes. Travel time savings came in as a very close third for vanpoolers. For carpoolers, travel time savings was the major advantage, followed closely by convenience.

HOV User Survey, Washington State Freeway System 4-3
Most carpools were composed of household members, although both fam-pools and standard (multi-household) carpools said they would behave very similarly without HOV lanes. Fam-pools comprised 62 percent of AM commute carpools, 71 percent of mid-day carpools, and 71 percent of PM commute carpools. Less than half of both family-pools and standard carpools reported that they would continue carpooling without HOV lanes. There is very little difference overall between how these two types of carpools could be expected to behave without HOV lanes.
Importance of Employer Incentives Would continue HOV mode without incentives: Not Yes No Sure Carpoolers: 43% 43% 14% Bus Riders: 59% 13% 28% Vanpoolers: 49% 22% 29%
Discretionary Use 99% have 1 working vehicle 80% have 2+ working vehicles 40% of carpoolers, and 20% of bus
riders and vanpoolers, drive alone on a regular basis during the peaks.
Fam-Pools 62% of AM carpools 71% of mid-day carpools 71% of PM carpools Would behave very similarly to multi-
household carpools if HOV lanes were unavailable.
HOV lane use appears to be highly discretionary. Almost all survey respondents reported having a working car at home, and nearly 80 percent reported two or more working vehicles in their household. Bus riders and vanpoolers were more likely to use those modes exclusively, whereas carpoolers were more likely to also use driving alone as a “usual” commute mode, especially during the AM peak and mid-day. About 40 percent of regular carpoolers, and 20 percent of regular bus riders and vanpoolers, also drove alone during the peaks on a regular basis.
87 percent of bus riders and vanpoolers, and 24 percent of carpoolers, utilized employer rideshare incentives. Bus riders and vanpoolers were more likely than carpoolers to continue using their mode even if employer incentives were not available, although almost a third said that they did not know what they would do. Although only a quarter of carpoolers participated in employer incentives, a full 43 percent of those participants said they would stop carpooling were those incentives removed.
How can WSDOT utilize these findings? Population in the Puget Sound area is expected to increase by about 2 million, and the number of jobs by about 1½ million, over the next 35 years. Our freeway general purpose lanes, and
4-4 Conclusions
most of our HOV lanes, are congested during the peak periods and those peak periods are becoming longer all the time.
Study Uses Improve HOV system
Traffic modeling & forecasting
System analysis
Commute trip reduction
Transportation demand management
Construction traffic mitigation
Greenhouse gas reduction
WSDOT initiated a study in 2007 to specifically look at ways to help over-utilized HOV lanes. Along with a number of other studies underway, methods of increasing freeway capacity and efficiency are expected to be identified. Some of these may result in adjustments to HOV operating policy and changes to HOV, as well as general purpose, facilities. The findings in this report can be used as input to those efforts, as well as for traffic and modeling forecasts, policy analysis, transportation demand management, commute trip reduction, construction traffic mitigation, and greenhouse gas reduction goals in the Puget Sound region.

HOV User Survey, Washington State Freeway System
Appendices
A. Glossary
B. Literature Review List
C. Questionnaire Development
D. Finalized Questionnaires
E. User Identification & Distribution
F. Data Intake & Analysis
G. Detailed Output Tables (Questions #1-8)
H. Respondent Origins (Question #9)
I. Respondent Demographics (Questions #10-13)


HOV User Survey, Washington State Freeway System A-1
Appendix A: Glossary
AM peak period: A time period during weekday mornings when the transportation network is most congested. This usually corresponds to commuters traveling from home to work, i.e., “rush hours.” In this area the freeway AM peak period is generally considered to be from 6 to 9 AM.
Carpool: A group of people who commute to work or other destinations together in a private vehicle. Carpools have varying occupancy requirements, depending upon their location. In the Puget Sound area, most HOV lanes are open to carpools of two or more people. Carpool members work out their own agreements on driving responsibilities, schedules, and payments for gas and maintenance.
Commute trip reduction: Incentives or programs which result in a higher proportion of shared-ride or non-motorized trips to and from work, i.e., riding in HOVs, walking, bicycling, or trips avoided altogether as with telecommuting.
Cramer’s V: A measure of the relationship between two variables in statistics. Cramer’s V ranges from 0 to +1 and indicates the strength of a relationship. The closer the number is to +1, the stronger the relationship between the two variables. Cramer’s V is appropriate to use when one or both of the variables are at a nominal level of measurement. The accompanying “p” scores presented in this report for Cramer’s V indicate the level of statistical significance.
Employer incentives: Incentives designed to encourage employees to use shared-ride travel modes (carpool, bus, vanpool) such as low cost or free bus passes and tickets, lower cost or free on-site parking, etc.
Family-pools or Fam-pools: Carpools comprised solely of household members. This can refer to either all-adult carpools or a mixture of adults and children. Stands in distinction to multi-household or “standard” carpools.
Focus group: A form of qualitative research in which a group of people are asked about their attitude towards a product, service, concept, advertisement, packaging, or, in this case, a questionnaire. Questions are asked by a facilitator in an interactive group setting where

A-2 Glossary
participants are free to talk with other group members. Comments and group interaction is often observed behind a one-way mirror. Group members are usually given a financial incentive to participate.
Freeway: A limited access highway, either state route or interstate, which is not tolled. This is the most common type of highway on the west coast.
General purpose lanes: The usual or “regular” lanes on the freeway, open to all vehicles.
Greenhouse gas: Emissions from vehicles and other human-made and natural sources which trap solar rays in the Earth’s atmosphere and contribute to climate change and global warming.
HOV lanes: Lanes for the sole use of high occupancy vehicles, usually defined in the Puget Sound area as two or more people. HOV lanes are also known as carpool or diamond lanes.
Lane-mile: The distance of pavement when counted in both directions, i.e., if an HOV lane exists for ten miles along a freeway in a northbound direction and also for the same ten miles in a southbound direction, 20 “lane-miles” of HOV are said to exist on that freeway, even though the northbound and southbound HOV lanes cover the same area.
Logic check: A technique used to ensure that statistical data is “clean” by virtue of checking logical relationships among variables. The absence of a logical relationship where one should exist indicates data requiring further attention.
Mid-day period: A time period during weekdays between the morning and afternoon rush hours, when the transportation network is usually less congested than during the peak periods. In this area the freeway mid-day period is generally considered to be from 9 AM to 3 PM.
Mode: The way a person travels, e.g., walking, taking the bus, riding in a carpool, etc.
Multi-household carpools: Carpools comprised solely of people from different households, i.e., “standard” carpools. Stands in distinction to fam-pools.
Multiple response variables: Questions that are asked in a way that allow more than one response, i.e., asking a respondent to “check all that apply” on a questionnaire. When answers to questions with multiple response variables are given in a percent format, the total will add up to more than 100 percent.
n=: The number of items in a statistical inquiry.
p=: The level of statistical significance when used in combination with Cramer’s V.
Park-and-ride lots: Agency-sponsored parking areas for people who take the bus, carpool, or vanpool. Most park-and-ride lots also have bike racks or bicycle lockers.
HOV User Survey, Washington State Freeway System A-3
Person throughput: How many people move through a transportation corridor during a specified period of time.
PM peak period: A time period during weekday afternoon/evenings when the transportation network is most congested. This usually corresponds to commuters traveling from work to home, i.e., “rush hours.” In this area the freeway PM peak period is generally considered to be from 3 to 7 PM.
Random sample: Random sampling is a technique where a group of subjects (a “sample”) is selected for study from a larger group (a “population”). Each individual is chosen entirely by chance and each member of the population has a chance of being included in the sample.
Response range check: A method of spot-checking to ensure that statistical data is “clean” prior to analysis. Only legitimate response ranges should appear in the data for each specific variable.
Reversible express lanes: These are lanes with only a few points of entry and exit that flow in the main direction of travel during the peak commuting periods. On I-5 reversible lanes exist between Northgate and downtown Seattle, and on I-90 between Seattle and Bellevue. The reversible express lanes operate towards downtown Seattle in the morning, and away from downtown Seattle in the afternoon and evening.
Sampling frame: A description of the entire group from which a statistical sample is drawn.
Shared-ride travel modes: Travel modes other than single-occupancy vehicles, such as carpools, buses, and vanpools.
Statistical significance: A statistically significant difference means there is statistical evidence that a finding or result is accurate and not the result of chance. It is used to help prevent an investigator from inadvertently making false claims. It does not mean the difference is necessarily large, important, or significant in the usual sense of the word. The significance level is usually chosen to be = 0.05, thereby reducing the probability of a false claim to five chances out of 100. This keeps the accuracy above 95 percent for any conclusions drawn.
Telecommuting: An arrangement whereby an employee is allowed to work from home, often with the use of file-sharing over the internet.
Transit-only lanes: Lanes reserved exclusively for buses.
Transportation demand management: Programs which reduce the need, or “demand,” for peak period solo driving. This can include a variety of strategies for commute options, including the use of HOVs, bicycling, walking, compressed work hours, working from home, or staggered work hours so that commuting happens outside of the peaks.

A-4 Glossary
Vanpool: A pre-arranged group of five to 15 people who commute together on a regular basis. The group enjoys a low monthly fare and a comfortable commute in an 8, 12, or 15-passenger van. The van itself is usually provided by a local transit authority, nonprofit group, or employer.
Weighted data: Data that has been adjusted to compensate for receiving too many answers from one group and not enough answers from another. Data will be “weighted” to make it more representative of conditions in the real world, so that conclusions drawn from the data are more applicable to local conditions. An example in this study would be adjusting the responses from vanpoolers from each of the three vanpool agencies (vis-à-vis each other) to more closely reflect their actual use of the HOV lanes. More vanpoolers from Community and Pierce Transit responded to the survey than from King County Metro, but there are more King County Metro vanpools using the HOV system than from the other two agencies. Answers from Community and Pierce Transit vanpoolers were therefore multiplied by 0.82, and answers from King County Metro were multiplied by 1.13, before being combined into a vanpool group answer for each question.

HOV User Survey, Washington State Freeway System B-1
Appendix B: Literature Review List
Abdelf Aty Mohamed, A. 1994. “Understanding commuters’ attitudes, uncertainties, and decision making and their implications for route choice.” 1994 Research Reports. Davis: University of California at Davis, Institute of Transportation Studies.
Austroads. 1997. “Value of Travel Time Savings.”
Billheimer, J.W. 1990. San Francisco Bay Area HOV Lane User Summary: Final Report. Los Altos: Systan, Inc.
British Columbia Ministry of Transportation. 2004. HOV Evaluation Summary. Victoria: British Columbia Ministry of Transportation. (http://www.th.gov.bc.ca/publications/reports_and_studies/ hovsummary/summary.htm)
Brown, W.W., J. Nee, J. Ishimaru and M.E. Hallenbeck. HOV Lane Performance Monitoring: 1998 Annual Report. Seattle: Washington State Transportation Center, University of Washington; Olympia: Washington State Department of Transportation; Washington: Federal Highway Administration, United States Department of Transportation.
Bullard, D.L. 1991. An Assessment of Carpool Utilization of the Katy High-Occupancy Vehicle Lane and the Characteristics of Houston’s HOV Lane Users and Nonusers: Final Report. College Station: Texas Transportation Institute, Texas A&M University; Austin: Transportation Planning Division, Texas Department of Transportation; Washington: Federal Highway Administration, United States Department of Transportation.
Bullard, Diane L. 1989. A Summary of Carpool Survey Data from the Katy, Northwest, and Gulf Transitways. College Station: Texas Transportation Institute, Texas A&M University.
CalTrans, District 3, Statewide High-Occupancy Vehicle (HOV) Issues, April 13, 2005. http://www.dot.ca.gov/dist3/projects/Sac50bus_carpool/pdfs/HOV-HOT%20Facts%204-05.pdf.

B-2 Literature Review List
Casey, J. and K.F. Turnbull. 2001. “HOV performance monitoring: two reports, multiple conclusions.” 10th Annual Conference on High-Occupancy Vehicle Systems. College Station: Texas Transportation Institute, Texas A&M University; Washington: Operations Office of Travel Management, Federal Highway Administration, United States Department of Transportation.
Christiansen, D.L. 1990. “Implications of increasing carpool occupancy requirements on the Katy freeway high-occupancy-vehicle lane in Houston, Texas.” Transportation Research Record n. 1280.
Eisele, W.L., A.H. Parham and A.S. Cothron. 2001. Guidance for Planning, Operating, and Designing Managed Lane Facilities in Texas. College Station: Texas Transportation Institute, Texas A&M University; Austin: Office of Research and Technology Transfer, Texas Department of Transportation; Washington: Federal Highway Administration, United States Department of Transportation.
Erhardt, G.D., F.S. Koppelman, J. Freedman, W.A. Davidson and A. Mullins. 2003. “Modeling the choice to use toll and high-occupancy vehicle facilities.” Transportation Research Record n. 1854.
Farnsworth, G. and C.G. Ulberg. 1993. “Evaluation of Seattle’s south I-5 interim high-occupancy vehicle lanes.” Transportation Research Record n. 1394.
Fitzpatrick, K., M.A. Brewer and S. Venglar. Managed Lane Ramp and Roadway Design Issues. College Station: Texas Transportation Institute, Texas A&M University; Austin: Research and Technology Implementation, Texas Department of Transportation; Washington: Federal Highway Administration, United States Department of Transportation.
Fontaine, M.D. 2003. Factors Affecting Traveler Mode Choice: A Synthesis of the Literature. Charlottesville: Virginia Transportation Research Council; Richmond: Virginia Department of Transportation.
Fowkes, A.S. 2001. Principles of Valuing Business Travel Time Savings. Leeds: Institute for Transport Studies, University of Leeds.
Gaul, T. and D. Henderson. 2003. “The Los Angeles County HOV performance program study.” Institute of Transportation Engineers 2003 Annual Meeting and Exhibit. Washington: Institute of Transportation Engineers.
Giuliano, G., D.W. Levine and R.F. Teal. 1990. “Impact of high occupancy vehicle lanes on carpooling behaviour.” Transportation Vol. 17 n. 2.
Goodin, G. 2003. “Taking managed lanes national: TTI assisting FHWA in managed lanes initiative.” Texas Transportation Researcher Vol. 39 n. 4.

HOV User Survey, Washington State Freeway System B-3
Gunn, Hugh F. 1996. Research into the Value of Travel Time Savings and Losses: The Netherlands, 1985 to 1996. Den Haag: Hague Consulting Group.
Hensher, David A. 1995. Value of Travel Time Savings in Personal and Commercial Automobile Travel. Sydney: Institute of Transport Studies, Graduate School of Business, University of Sydney.
Hensher, David A. 1997. “Behavioural and resource values of travel time savings: a bicentennial update.” Transport Economics: Selected Readings. Amsterdam: Harwood Academic Publishers.
Hensher, David A. 1997. “Behavioral value of travel time savings in personal and commercial automobile travel.” The Full Costs and Benefits of Transportation: Contributions to Theory, Method and Measurement. Berlin: Springer.
Hensher, David A. 2000. Measurement of Valuation of Travel Time Savings. Sydney: Institute of Transport Studies, Australian Key Centre in Transport Management, the University of Sydney and Monash University.
Hensher, David A. 2000. The Sensitivity of the Valuation of Travel Time Savings to the Specifications of Unobserved Effects. Sydney: Institute of Transport Studies, Australian Key Centre in Transport Management, the University of Sydney and Monash University.
Hensher, David A. 2000. The Valuation of Travel Time Savings for Urban Car Drivers: Evaluating Alternative Model Specifications. Sydney: Institute of Transport Studies, Australian Key Centre in Transport Management, the University of Sydney and Monash University.
Hensher, David A. 2001. “Measurement of the valuation of travel time savings.” Journal of Transport Economics and Policy Vol. 35 n. 1.
Hensher, David A. 2001. “The sensitivity of the validation of travel time savings to the specification of unobserved effects.” Transportation Research, Part E – Logistics and Transportation Review Vol. 37E n. 2-3.
Hensher, David A. 2001. “The valuation of commuter travel time savings for car drivers: evaluating alternative model specifications.” Transportation. Vol. 28 n. 2.
Hensher, David A. 2001. The Valuation of Non-commuting Travel Time Savings for Urban Car Drivers. Sydney: Institute of Transport Studies, Australian Key Centre in Transport Management, the University of Sydney and Monash University.
Hickman, M, Q. Brown and A. Miranda. 2000. “Katy freeway high-occupancy vehicle lane value pricing project, Houston, Texas: evaluation of usage.” Transportation Research Record n. 1732.

B-4 Literature Review List
Hoffman, M.D. and K.F. Turnbull. 2001. “Maryland’s high occupancy vehicle (HOV) lanes: who is using them and why?” 10th International Conference on High-Occupancy Vehicle Systems. College Station: Texas Transportation Institute, Texas A&M University; Washington: Operations Office of Travel Management, Federal Highway Administration, United States Department of Transportation.
Jacobsen, E.L. and K.F. Turnbull. 2001. “HOV lane evaluation and the political process in Washington state.” 10th International Conference on High-Occupancy Vehicle Systems. College Station: Texas Transportation Institute, Texas A&M University; Washington: Operations Office of Travel Management, Federal Highway Administration, United States Department of Transportation.
Jara-Diaz, Sergio R. and Cristian A. Guevara. 1999. “On the subjective valuation of travel time savings.” Transportation Planning Methods: Proceedings of Seminar F Held at the European Transport Conference. London: PTRC Education and Research Services Ltd.
Jara-Diaz, Sergio R. and Cristian A. Guevara. 2000. “The contribution of work, leisure and travel to the subjective value of travel time savings.” Behavioural Modeling: Proceedings of Seminar F Held at the European Transport Conference. London: PTRC Education and Research Services Ltd.
Jara-Diaz, Sergio R. and Cristian A. Guevara. 2001. Behind the Subjective Value of Travel Time Savings: The Perception of Work, Leisure and Travel. Sydney: Institute of Transport Studies, Australian Key Centre in Transport Management, the University of Sydney and Monash University.
Jara-Diaz, Sergio R. and Cristian A. Guevara. 2003. “Behind the subjective value of travel time savings: the perception of work, leisure, and travel from a joint mode choice activity model.” Journal of Transport Economics and Policy. Vol. 37 n. 1.
Kuhn, B. and D. Jasek. 2003. State and Federal Legislative Issues for Managed Lanes. College Station: Texas Transportation Institute, Texas A&M University; Austin: Research and Technology Implementation, Texas Department of Transportation; Washington: Federal Highway Administration, United States Department of Transportation.
Kuhn, B. and G. Daniels. 2001. “Managed lanes: the future of freeway travel.” Texas Transportation Researcher Vol. 37 n. 2.
Kuhn, B. and G. Goodin. 2003. “The future of freeways: research identifies strategies for developing managed lanes.” Texas Transportation Researcher Vol. 39 n. 2.

HOV User Survey, Washington State Freeway System B-5
Kuhn B., G.D. Goodin and D. Jasek. 2002. Year 1 Annual Report of Progress: Operating Freeways with Managed Lanes. College Station: Texas Transportation Institute, Texas A&M University; Austin: Office of Research and Technology Transfer, Texas Department of Transportation; Washington: Federal Highway Administration, United States Department of Transportation.
Kuhn, B., G.D. Goodin and D. Jasek. 2003. “Evaluation of Seattle’s south I-5 interim high-occupancy vehicle lanes.” Transportation Research Record n. 1394.
Kuhn, B.T., G.D. Goodin, M. Brewer, T. Collier, A.S. Cothron, D. Fenno, K. Fitzpatrick, D. Skowronek, and S. Venglar. 2003. “Managed lanes research in Texas.” Institute of Transportation Engineers 2003 Annual Meeting and Exhibit. Washington: Institute of Transportation Engineers.
Kuhn, B., G.D. Goodin, M. Brewer, T. Collier, K. Fitzpatrick, D. Jasek, and S. Venglar. 2003. Interim Manual for Managed Lanes. College Station: Texas Transportation Institute, Texas A&M University; Austin: Research and Technology Implementation, Texas Department of Transportation; Washington: Federal Highway Administration, United States Department of Transportation.
Kuhn B., G.D. Goodin, S. Chrysler, T. Collier, S. Cothron, W. Eisele, D. Fenno, K. Fitzpatrick, G. Ullman and S. Venglar. 2003. Year 3 Annual Report of Progress: Operating Freeways with Managed Lanes. College Station: Texas Transportation Institute, Texas A&M University; Austin: Research and Technology Implementation, Texas Department of Transportation; Washington: Federal Highway Administration, United States Department of Transportation.
Kuhn B., G.D. Goodin, T. Collier, S. Cothron, W. Eisele, K. Fitzpatrick and S. Venglar. 2002. Year 2 Annual Report of Progress: Operating Freeways with Managed Lanes. College Station: Texas Transportation Institute, Texas A&M University; Austin: Research and Technology Implementation, Texas Department of Transportation; Washington: Federal Highway Administration, United States Department of Transportation.
Kuhne, Reinhart D. and Karin Langbein-Euchner. 1995. “Calculation of travel time savings by dual mode route guidance for the south corridor in the Stuttgart test field.” 1995 Vehicle Navigation & Information Systems Conference Proceedings. Piscataway: IEEE Service Center.
Li, Jianling, Shekhar Govind, James C. Williams, Siamak Ardekani and Richard Cole. 2002. Assessing Pricing Strategies and Users’ Attitudes Towards Managed Lanes. Arlington: School of Urban and Public Affairs, University of Texas; Austin: Research and Technology Implementation Office, Texas Department of Transportation.

B-6 Literature Review List
Mackies, P.J., S. Jara-Diaz, and A.S. Fowkes. 2001. “The value of travel time savings in evaluation.” Transportation Research, Part E – Logistics and Transportation Review. Vol. 37E n. 2-3.
Murray, P.M., H.S. Mahmassani and K.F. Abdelghany. 2001. “Methodology for assessing high-occupancy toll-lane usage and network performance.” Transportation Research Record n. 1765.
Nee, J., J. Ishimaru and M.E. Hallenbeck. Evaluation Tools for HOV Lane Performance Monitoring. Seattle: Washington State Transportation Center, University of Washington; Olympia: Washington State Department of Transportation; Washington: Federal Highway Administration, United States Department of Transportation.
Nihan, N.L. and L.O. Rubstello. 1993. “HOV improvements on signalized arterials in the Seattle area: final report.” Volume III in N.E. 85th HOV Study. Seattle: Washington State Transportation Center, University of Washington; Olympia: Washington State Department of Transportation; Washington: Federal Highway Administration, United States Department of Transportation; Seattle: TransNow, Transportation Northwest, Department of Civil Engineering, University of Washington.
Parkany, E. 1998. Can HOT Lanes Encourage Carpooling? A Case Study of Carpooling Behavior on the 91 Express Lanes. Irvine: Institute of Transportation Studies, University of California.
Parsons Brinckerhoff Quade & Douglas, et al, HOV Performance Program Evaluation Report, Los Angeles County Metropolitan Transportation Authority, November 22, 2002.
Recker, Wilfred W., C. Chen, and M.G. McNally. 2001. “Measuring the impact of efficient household travel decisions on potential travel time savings and accessibility gains.” Transportation Research. Vol. 35A n. 4.
Recker, Wilfred W., Chienho Chen, and Michael G. McNally. 2001. Measuring the Impact of Efficient Household Travel Decisions on Potential Travel Time Savings and Accessibility Gains. Berkeley: University of California Transportation Center, University of California.
Skowronek, D.A., S.E. Ranft, and A.S. Cothron. 2002. An Evaluation of Dallas Area HOV Lanes, Year 2000. College Station: Texas Transportation Institute, Texas A&M University; Austin: Research and Technology Implementation, Texas Department of Transportation.
Skowronek, D.A., S.E. Ranft, and A.S. Cothron. 2002. An Evaluation of Dallas Area HOV Lanes, Year 2001. College Station: Texas Transportation Institute, Texas A&M University; Austin: Research and Technology Implementation, Texas Department of Transportation.

HOV User Survey, Washington State Freeway System B-7
Skowronek, D.A., S.E. Ranft, and A.S. Cothron. 2002. An Evaluation of Dallas Area HOV Lanes, Year 2002. College Station: Texas Transportation Institute, Texas A&M University; Austin: Research and Technology Implementation, Texas Department of Transportation.
Small, Kenneth A. 1999. “Valuation of travel-time savings and predictability in congested conditions for highway user-cost estimation.” NCHRP Report 431.
Smith, Brett. 1999. “The goods/leisure tradeoff and the value of travel time savings.” Road and Transport Research Vol. 8 n. 3.
Southern California Association of Governments, Regional High-Occupancy Vehicle Lane System Performance Study, Final Summary Report, November 4, 2004.
Swisher, M. W.L. Eisele, D. Ungemah, and G.D. Goodin. 2003. “Life-cycle graphical representation of managed high-occupancy vehicle lane evolution.” Transportation Research Record n. 1856.
Travel Model Improvement Program. 1997. “Mode choice/auto occupancy.” Chapter 5 in Model Validation and Reasonableness Checking Manual. Washington: Travel Model Improvement Program, Federal Highway Administration, United States Department of Transportation. (http://tmip.fhwa.dot.gov/clearinghouse/docs/mvrcm/ch5.stm)
Turnbull, K.F. 2003. 11th International Conference on High-Occupancy Vehicle Systems Conference Proceedings. College Station: Texas Transportation Institute, Texas A&M University; Washington: Federal Highway Administration, United States Department of Transportation.
Turnbull, K.F. 2003. Houston Managed Lanes Case Study: The Evolution of the Houston HOV System. College Station: Texas Transportation Institute, Texas A&M University; Washington: Operations Office of Transportation Management, Federal Highway Administration, United States Department of Transportation.
Ulberg, C. 1990. Perceptions of Travel Modes and Measured Travel Behavior: Initial Findings from the Puget Sound Transportation Panel. Seattle: Washington State Transportation Center.
Understanding HOV Usage: Qualitative Research. 1994. Minneapolis: C.J. Olson Market Research.
Valdez, R. and C. Arce. 1990. “Comparison of travel behavior and attitudes of ridesharers, solo drivers, and the general commuter population.” Transportation Research Record n. 1285.

B-8 Literature Review List
Venglar, S., D. Fenno, S. Goel, and P. Schrader. 2002. Managed Lanes – Traffic Modeling. College Station: Texas Transportation Institute, Texas A&M University; Austin: Research and Technology Implementation, Texas Department of Transportation; Washington: Federal Highway Administration, United States Department of Transportation.
Victoria Transport Policy Institute. 2006. “HOV priority: strategies to improve transit and ridesharing speed and convenience.” Transportation Demand Management Encyclopedia. Victoria: Victoria Transport Policy Institute. (http://www.vtpi.org/tdm/tdm19.htm)
Wardman, M. and Waters, W.G. 2001. “Advances in the valuation of travel time savings.” Pergamon.
Washington State Transportation Center 2005. “2004 Public Opinion Survey.” http://www.wsdot.wa.gov/NR/rdonlyres/312F81C0-A914-46DE-8941-0E41C9F6FD75/0/ 2004HOVsurveyfinalresults.pdf.
Waters, W.G. 1993. The Value of Travel Time Savings and the Link with Income: Implications for Public Project Evaluation. Sydney: Institute of Transport Studies, Graduate School of Business, University of Sydney.
Waters, W.G. 1993. Variations in the Value of Travel Time Savings: Empirical Studies and the Values for Road Project Evaluations. Vancouver: Faculty of Commerce & Business Administration, University of British Columbia.
Waters, W.G., James Evans, Connie Leung, et al. 1992. The Value of Time Savings for the Economic Evaluation of Highway Investments in British Columbia: Prepared for the Planning Services Branch, Ministry of Transportation and Highways, Victoria, B.C., Canada. Vancouver: Centre for Transportation Studies, University of British Columbia.
Waters, William G. 1996. “Values of travel time savings in road transport project evaluation.” World Transport Research. Vol. 3.
Welch, Michael, Huw Williams. 1997. “The sensitivity of transport investment benefits to the evaluation of small travel-time savings.” Journal of Transport Economics and Policy Vol. 31 n. 3.
Wellander, C. and K. Leotta. 2000. “Are high-occupancy vehicle lanes effective? Overview of high-occupancy vehicle facilities across North America.” Transportation Research Record n. 1711.
Wesemann, L., P. Duve and N. Roach. 1989. “Comparison of travel behavior before and after the opening of HOV lanes in a suburban travel corridor.” Transportation Research Record n. 1212.

HOV User Survey, Washington State Freeway System B-9
Zuelsdorf, R.J., E.J. Regan, S.A. Allaire, J.H. Neal, D. Redman and K. Kawada. 2002. I-15 Managed Lanes Project: San Diego, California, USA. Sydney: IRF and ARF Asia Pacific Roads Conference and Exhibition.


HOV User Survey, Washington State Freeway System C-1
Appendix C: Questionnaire Development
One of the first steps in the questionnaire development process was for PRR to review results of a literature search performed by WSDOT on questions relating to what people would do if HOV lanes were no longer available. PRR also performed their own literature search on this topic, and additionally searched for surveys that asked questions regarding mid-day HOV lane users. No such surveys were found in the literature review. A list of articles and websites reviewed is provided in Appendix B.
WSDOT developed the first draft of the questionnaire. The questionnaire was edited and refined by PRR in collaboration with WSDOT and TRAC. The questionnaire was then pre-tested on a focus group. Due to time constraints, PRR staff were used for the focus group rather than choosing participants from the population at large. PRR staff were chosen from non-research departments who 1) had no particular knowledge of survey design, and 2) commuted by bus or carpool (no staff were available that use vanpools). Based on the findings from the focus group, minor but important changes were made to several survey questions to enhance clarity, as follows:
Language was changed in all the questions to make it clear that respondents were only to report about their travel during the weekday, not the weekend. Directions in the introduction were also added to reinforce this distinction.
Respondents were first asked if they used any specific HOV freeway lanes. If their answer to this question was no, they were directed to stop taking the survey by an alert message which was re-formatted to be more visible.
The word “usual” was re-defined as “typical,” i.e., “During a typical Monday to Friday…”
For the trip purpose question, more trip purpose choices were added such as doctor’s appointments and civic activities. Some of the response choices were also changed for clarity such as changing “work-related” to “getting between work and home,” and the term “recreation” was described as “visiting friends, sports, movies, etc.”

C-2 Questionnaire Development
The question which asks why people chose shared-ride modes was simplified. Originally, respondents were asked to rank all possible reasons in order of importance. This was changed so that respondents only needed to rank the top three reasons. Instructions for filling out the ranking were also clarified.
The question regarding incentives provided by employers was changed to clarify that respondents should check only items that they actually use, not just incentives which are provided by employers. Flexible work schedule was added to the list of employer incentives.
The demographic section originally had been labeled “optional.” This was changed to “If you feel comfortable, we have a few questions about you and your household,” and a few bulleted items were provided explaining the use and confidentiality of the information.
Throughout the questionnaire the directions for each question such as “check only one” or “check all that apply” were added at the end of each question and formatted to be more visible.
The requested response date was put on the outside of the folded questionnaire.
Plain English was substituted for a number of terminologies.
A suggestion was followed to give a brief verbal explanation of the purpose of the survey, along with instructions to “fill out and drop in the mail this morning,” when handing the questionnaires out in person at park-and-ride lots.
Finalized survey questions were also reviewed by King County Metro and the Puget Sound Regional Council.

HOV User Survey, Washington State Freeway System D-1
Appendix D Finalized Questionnaires

D-2 Finalized Questionnaires
Carpool Questionnaire Cover

HOV User Survey, Washington State Freeway System D-3
Carpool Questionnaire
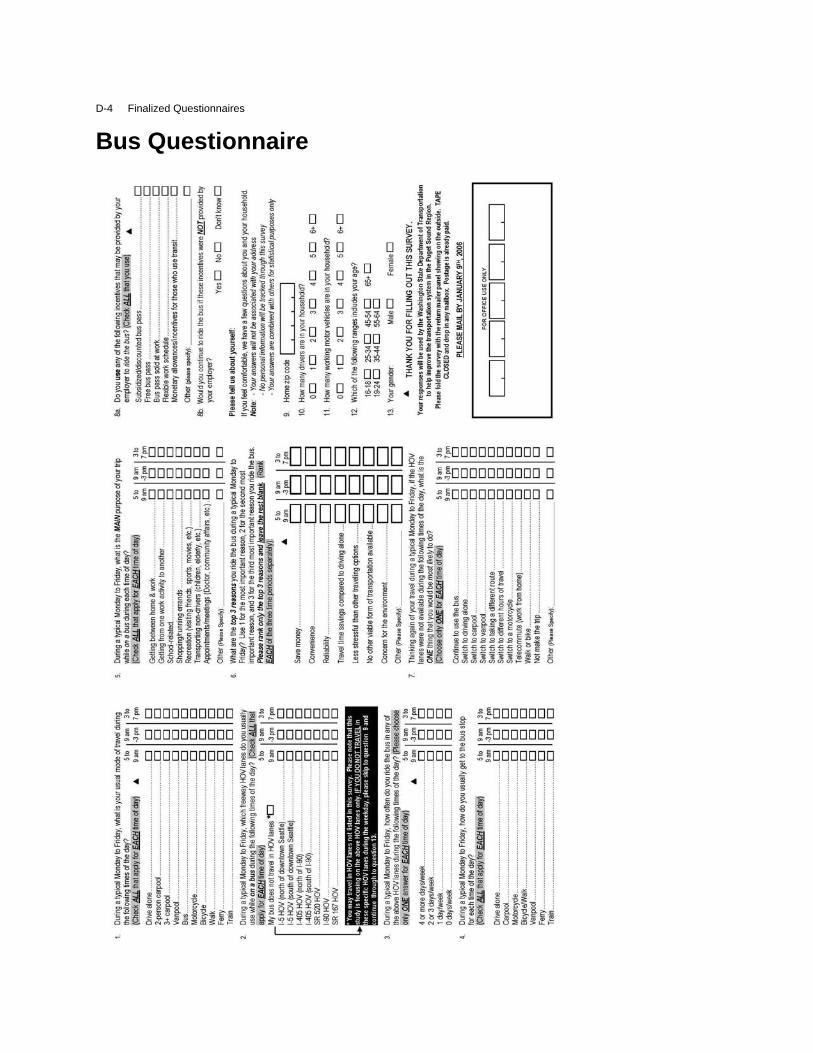
D-4 Finalized Questionnaires
Bus Questionnaire

HOV User Survey, Washington State Freeway System D-5
Vanpool Questionnaire


HOV User Survey, Washington State Freeway System E-1
Appendix E: User Identification & Survey Distribution
Carpools Peak Periods
WSDOT took videotape of license plates on area freeways during the spring of 2004 and 2005. These videotapes went through an automated transcription process which produced a large database of license plate numbers.
The license plate database was submitted to the Washington State Department of Licensing. After WSDOT signed a confidentiality agreement, the Department of Licensing released addresses of registered owners corresponding to the license plate numbers. This list was utilized for mail-out surveys on a number of different WSDOT projects.
In order to protect the anonymity of survey respondents, a procedural “firewall” was utilized for handling data. This involved giving each address a numerical identifier, so that data processing and analysis could be performed without the use the address itself.
Although there were originally several locations around the HOV system which were videotaped, problems with the procedure resulted in data useful for this study from only three locations during the peak commuting periods: I-5 in Georgetown at S Albro Place, SR 167 in Kent at S 208th Street, and SR 167 in Auburn at S 277th Street. These locations are shown in Exhibit E-1.
WSDOT supplied PRR with a random sample of 13,133 addresses for use on this study. PRR then selected a random sample of 11,166 addresses from this list for mailing.
67 business-owned carpools were identified out of this group.

E-2 User Identification & Survey Distribution
Exhibit E-1
License Plate Collection Locations
Peak period
Mid-Day

HOV User Survey, Washington State Freeway System E-3
Mid-Day
Since the multi-project license plate capture effort described above produced useable data for this project during the peak periods only, another source was used for mid-day user identification. TRAC performed a series of manual license plate surveys around the region during the spring, summer, and fall of 2005 for use in their own surveys. Mid-day license plates numbers were captured at the following locations:
I-5: Everett, Shoreline, Georgetown, and Midway: - 112th Street SE - NE 145th Street - S Albro Place - S 216th Street I-405: Kirkland and Newcastle: - NE 85th Street - 112th Avenue SE I-90: Issaquah at Newport Way NW SR 520: Medina at 92nd Avenue NE SR 167: Kent at S 208th Street
TRAC submitted their license plate database to the Department of Licensing, and provided PRR with a list of 4,820 usable addresses of registered owners. All 4,820 of these addresses were used to ensure that the final sample had an adequate number of mid-day carpoolers for statistical analysis.
All Time Periods
An initial decision was made to not offer respondents a monetary incentive for completing the survey. This decision was based on both budgetary and methodological grounds. Aside from prohibitively impacting the study budget, research literature indicates that such incentives for mail surveys can contribute to somewhat higher response rates but can do so at the expense of valid data, as respondents may be more motivated by receiving the incentive than in providing accurate information. For these reasons we determined that a follow-up phone survey would provide more reliable information and make better use of limited study resources, should more responses be needed.
Surveys were mailed to all 15,986 (11,166 peak period and 4820 mid-day) carpoolers on December 30, 2005. By the third week in January, this initial mailing had resulted in only 632 returned surveys. We feel the low response to mailed surveys was due largely to the survey being mailed during the holidays. This timing was a result of funding for the study not being secured until the fall of 2005, combined with WSDOT’s desire to have preliminary results ready in time for use during the January 2006 Legislative session. The low response

E-4 User Identification & Survey Distribution
rate was probably also related to the time lapse between the dates of the videotaping (spring 04 and 05) and the mailing of the questionnaires (Dec 05), during which time many addressees could have moved.
PRR therefore implemented its follow-up plan. This plan involved using a reverse directory on the addresses of those households who had been mailed a carpool survey but had not yet returned it. These phone numbers were called several times in order to attempt completion of a phone survey.
When this effort did not result in sufficient additional responses, WSDOT supplied PRR with an additional 3454 randomly-selected addressees from the original video database. These addresses were also matched to phone numbers through reverse directories and phone surveys were attempted. Many of these households or businesses were unavailable, unwilling to perform the survey, or reported that they did not usually use the HOV lanes in a carpool. Due to the time requirements of this study, the survey attempt was then aborted in the above cases. These attempts were therefore not counted as part of the total number of “distributed” surveys.
Eventually an additional 1,373 carpool surveys were completed (including 14 businesses) by telephone for a final sample of 2,005 (1,965 whom used HOV lanes). Out of 16,594 mailed and phone surveys, the 2,005 completed surveys represented a final response rate of 12.1 percent for carpoolers.
Buses King County Metro, WSDOT, and PRR identified 19 park-and-ride lots throughout
Snohomish, King, and Pierce counties with the highest ridership on express routes. PRR then identified which of the routes served by these park-and-ride lots utilized the HOV lanes. A complete list of the park-and-ride lots, the dates surveyed, and the routes targeted for survey distribution are presented in Exhibit E-2.
A combination of WSDOT staff and contractors distributed the bus surveys during the morning commute, approximately 6 – 9 AM, over seven consecutive weekdays during the first and second weeks of 2006. Staff were trained in what to say and what not to say in order to avoid skewing results in any manner. They were asked to introduce themselves as DOT employees, say that we were performing a survey to “help improve the HOV lanes,” and then request that the bus rider fill out the questionnaire on the bus and drop it in the mail when they got off. The distributor was to then hand a questionnaire to the bus rider along with a pencil. A sheet with basic

HOV User Survey, Washington State Freeway System E-5
Exhibit E-2
Questionnaire Distribution at Park-and-Ride Lots
Date of Initial Survey P & R Route1/4/2006 Ash Way Cmty. Transit: 413, 414, 415, 810, 860, 880, 885
Sound Transit: 511, 530, 532
1/6/2006 Canyon Park Cmty. Transit: 105, 106, 435, 441
Sound Transit: 530, 532, 535
1/4/2006 Eastgate KC Metro: 212, 217, 225, 229, 247, 271, 272, 942
Sound Transit: 554, 555, 556
1/3/2006 Eastmont Sound Transit: 510, 513, 530, 532, 535
1/4/2006 Federal Way* KC Metro: 173, 177, 194, 197
Sound Transit: 565, 574
1/5/2006 Greenlake Ravenna KC Metro: 64, 76, 79, 242
1/3/2006 Issaquah KC Metro: 209, 210, 214, 269
Sound Transit: 554, 555, 556
1/3/2006 Kenmore KC Metro: 306, 312, 342
Sound Transit: 522
1/5/2006 Lynnwood* Cmty. Transit: 401, 402, 441, 810, 855, 885
Sound Transit: 511, 535
1/6/2006 Mariner Cmty. Transit: 105, 106, 410, 411, 414, 810, 860
1/5/2006 McCollum Park Cmty. Transit: 105, 106, 412, 414, 810, 812
1/6/2006 Mountlake Terrace Cmty. Transit: 408, 414, 810, 851, 871
1/3/2006 Northgate TC Extension* KC Metro: 41, 303
Sound Transit: 555, 556
1/3/2006 Redmond KC Metro: 232, 250, 253, 265, 266
Sound Transit: 540, 545
1/5/2006 South Bellevue Sound Transit: 550, 560
1/5/2006 South Kirkland Sound Transit: 540
1/3/2006 SR 512 Sound Transit: 574, 585, 591, 592, 594
1/5/2006 Star Lake KC Metro: 152, 190, 192, 194, 197, 941
Sound Transit: 574
1/6/2006 Tacoma Dome Station Sound Transit: 574, 582, 590, 591, 594
*These park-and-ride lots were re-surveyed the following week due to insufficient staffing, supplies, or timing which did not sufficiently cover peak commuters during the initial distribution.

E-6 User Identification & Survey Distribution
information about the study and further contact information was prepared in case anyone had questions, but none of these sheets were utilized.
The morning commute was chosen because of a more discrete commute period, and because riders tend to queue up before their bus arrives. Many did form easily-identifiable groups and we were able to pass out surveys to people waiting for the bus routes we wished to target. Mid-day users tend to be much more dispersed over the six-hour (9 AM to 3 PM) period, would have been harder to capture, and would have required a significantly larger effort. During the afternoon commute, riders disembark their bus and head directly to their car. They disperse quickly and are often rushed, making them more difficult to approach, and making the completion of the survey less likely. By targeting morning commuters, we were able to encourage bus riders to complete the survey while on the bus with the provided pencil, and to drop the survey into a mailbox once they disembarked.
A total of 6,365 surveys were distributed and 2,424 were returned, 2,338 of whom reported using HOV lanes. This resulted in a response rate of 38.1 percent.
Vanpools King County Metro provided PRR with a list of the approximately 6,000 vanpoolers who
travel on freeway HOV lanes. PRR mailed questionnaires to 3,997 addresses randomly selected from this list during the last week of December 2005. This mailing was followed up with an email reminder from King County Metro to their vanpoolers.
In order to protect the anonymity of King County vanpool survey respondents, a procedural “firewall” was utilized for handling data. This involved giving these names and addresses numerical identifiers, so that data processing and analysis could be performed without the use of personal information.
Community Transit and Pierce Transit preferred to distribute surveys to vanpoolers themselves. Coincidentally, each agency identified approximately 1,300 vanpoolers who travel on freeway HOV lanes. PRR delivered 2,600 surveys to the two agencies, who in turn distributed them to their vanpool drivers with instructions to give them to their passengers. This also took place during the last week of December 2005.
This effort resulted in a final sample of 1,273 completed surveys out of 6,597, of whom 1,170 reported using HOV lanes. This resulted in a response rate of 19.3 percent.

HOV User Survey, Washington State Freeway System F-1
Cramer’s V
A measure of the relationship between two variables which is used in statistical analysis. See glossary in Appendix A for a more detailed description.
Response range and logic checks
Response range and logic checks are methods of spot-checking to ensure that data is “clean”. Only legitimate response categories should appear in the data for each specific variable. The absence of a logical relationship where one should exist indicates data requiring further attention.
Appendix F: Data Intake and Analysis
Data processing consisted of coding and entering quantitative and qualitative responses via electronic scanning of paper surveys. A computer-assisted telephone interview (CATI) system was used for the telephone surveys, so that these surveys could be scanned in as well. The data file was then “cleaned” by performing response range and logic checks on quantitative answers in order to check for miscoded variables.
Vanpool response data was weighted to account for the over-sampling of Community Transit (weight = .8281) and Pierce Transit (weight = .8238) vanpoolers compared to the number of King County Metro vanpoolers (weight =1.1343). This produced a more realistic picture of vanpool users.
Data analysis was conducted with SPSS software. Analysis involved the use of appropriate descriptive statistical techniques (frequencies and percentages, or how often an answer was given) and explanatory statistical techniques (in this case Cramer’s V) to test for the statistical significance of relationships between variables. Throughout this report relationships between variables that are statistically significant at the .05 level or better, or are meaningful to an understanding of the data relative to the study purposes, are reported in footnotes.
Many of the variables in this survey were multiple response variables, where respondents could choose more than one answer. Since tests of statistical significance cannot be

F-2 Data Intake & Analysis
conducted on multiple response variables, analysis was limited to developing cross-tabulation tables and then looking at the data for meaningful findings. Tables presenting the findings for multiple response questions will add up to more than 100 percent.

HOV User Survey, Washington State Freeway System G-1
Appendix G – Detailed Output Tables: Survey Questions #1 - 8

G-2 Detailed Output Tables (Questions #1 – 8)
Exhibit G-1a
Question 1: Usual Mode of Travel During a typical Monday to Friday, what is your usual mode of travel during the following times of the day? (Check ALL that apply for EACH time of day)
5 - 9 AM9 AM to
3 PM 3 - 7 PM 5 - 9 AM9 AM to
3 PM 3 - 7 PM 5 - 9 AM9 AM to
3 PM 3 - 7 PM
n=1873 n=1616 n=1869 n=2311 n=738 n=2166 n=1101 n=334 n=996
Drive alone 43.7 49.1 34.2 19.9 20.6 21.5 15.2 22.4 20.2
2-person carpool 42.5 33.7 52.0 5.2 3.7 7.0 4.2 5.9 6.0
3-person carpool 13.9 10.0 18.1 0.6 0.5 1.1 2.9 3.4 3.0
Vanpool 2.8 1.1 2.3 0.6 0.7 0.8 93.2 64.9 87.8
Bus 7.8 4.1 6.7 98.0 55.7 95.2 4.5 6.2 5.9
Motorcycle 1.8 1.0 1.8 0.9 0.8 0.8 0.6 1.2 0.9
Bicycle 1.0 0.6 0.8 1.1 0.9 1.4 1.6 2.3 2.2
Walk 4.1 14.0 3.3 3.9 36.9 4.3 1.7 11.7 2.6
Ferry 0.8 0.6 0.9 0.2 0.1 0.2 4.5 0.7 4.8
Train 1.7 0.5 1.9 1.0 0.5 1.5 0.3 0.7 0.6
Note: "n" is the number of responders for each category.Multiple responses were allowed for this question so percentages will not add up to 100%.
Carpool % Bus % Vanpool %Usual Travel Mode

HOV User Survey, Washington State Freeway System G-3
Travel mode by age
Statistically significant differences in mode by age include:
Carpoolers and bus riders are somewhat more likely to be in the 16-24 year age range compared to vanpoolers.
Carpoolers are somewhat more likely to be 65 and older compared to bus riders and vanpoolers.
Bus riders are somewhat more likely to be in the 25-34 year age range compared to carpoolers and vanpoolers.
Vanpoolers are somewhat more likely to be in the 45-54 age range than carpoolers and bus riders.
Travel mode by age is presented in Exhibit G-1b.
Exhibit G-1b
Cross-Tabulation (questions 1 & 12): Travel Mode by Age
Carpool % Bus % Vanpool %n=1914 n=2293 n=1136
16 - 18 1.5 0.8 0.8
19 - 24 3.0 4.4 1.2
25 - 34 14.9 20.5 14.0
35 - 44 27.4 23.8 22.8
45 - 54 27.0 28.8 37.6
55 - 64 17.2 19.5 22.1
65+ 9.0 2.3 1.5
Total 100 100 100
Note: "n" is the number of responders for each category.
Respondent Age

G-4 Detailed Output Tables (Questions #1 – 8)
Exhibit G-2:
Question 2: Freeways Used During a typical Monday to Friday, which freeway HOV lanes do you usually use in a [carpool/bus/vanpool] during the following times of the day? (Check ALL that apply for EACH time of day)
5 - 9 AM9 AM to
3 PM 3 - 7 PM 5 - 9 AM9 AM to
3 PM 3 - 7 PM 5 - 9 AM9 AM to
3 PM 3 - 7 PM
n=1270 n=819 n=1501 n=2173 n=298 n=2028 n=929 n=198 n=828I-5North of Downtown 32.4 36.4 28.3 50.3 52.3 48.5 32.8 24.7 32.6
I-5South of Downtown 36.5 45.7 41.8 20.9 14.4 21.4 24.2 33.5 23.2
I-405North of I-90 23.1 29.7 24.1 3.7 5.4 3.6 32.8 27.1 32.2
I-405South of I-90 23.6 32.7 27.8 1.0 3.0 0.9 20.0 25.5 21.1
SR 520 7.2 10.0 7.9 11.5 13.4 12.1 12.0 6.6 14.4
I-90 9.4 15.0 11.0 19.7 20.5 20.2 9.4 5.3 11.6
SR 167 31.1 28.2 31.0 0.2 0.7 0.4 14.5 22.2 13.4
Note: "n" is the number of responders for each category.Multiple responses were allowed for this question so percentages will not add up to 100%.
Carpool % Bus % Vanpool %HOVRoutesUsed

HOV User Survey, Washington State Freeway System G-5
Exhibit G-3:
Question 3: Number of Days per Week Using HOV Lanes During a typical Monday to Friday, how often do you [carpool/ride the bus/vanpool] in any of the above HOV lanes during the following times of the day? (Please choose only ONE for EACH time of day)
5 - 9 AM9 AM to
3 PM 3 - 7 PM 5 - 9 AM9 AM to
3 PM 3 - 7 PM 5 - 9 AM9 AM to
3 PM 3 - 7 PM
n=1318 n=876 n=1540 n=2107 n=258 n=2012 n=952 n=253 n=859
0 days a week 14.9 22.8 12.1 0.0 0.0 0.0 3.6 25.0 4.4
1 day a week 10.3 20.9 17.5 0.7 25.6 1.2 1.3 1.8 1.8
2-3 days a week 20.6 30.3 26.4 6.7 12.8 7.1 10.7 7.3 12.4
4+ days a week 54.2 26.0 44.0 92.6 61.6 91.7 84.4 65.9 81.4
TOTAL 100 100 100 100 100 100 100 100 100
Note: "n" is the number of responders for each category.
Carpool % Bus % Vanpool %Number of Days usingShared-Ride Mode

G-6 Detailed Output Tables (Questions #1 – 8)
Exhibit G-4a
Question 4 – Carpool and Vanpool: Who Traveling With During a typical Monday to Friday, who are the other members of your [carpool/vanpool] during the following times of the day? (Check ALL that apply for EACH time of day)
5 - 9 AM9 AM to
3 PM 3 - 7 PM 5 - 9 AM9 AM to
3 PM 3 - 7 PM
n=1131 n=664 n=1363 n=971 n=206 n=866
Household members 62.2 71.1 71.4 3.1 7.5 4.2
Co-Workers 34.1 25.6 26.9 79.0 85.5 77.6
Neighbors/friends/acquaintances 11.1 14.9 13.1 5.6 6.3 5.8
People I did not know before 8.7 5.3 6.2 42.7 27.3 44.1
Note: "n" is the number of responders for each category.Multiple responses were allowed for this question so percentages will not add up to 100%.
Carpool % Vanpool %Who Traveling With

HOV User Survey, Washington State Freeway System G-7
Exhibit G-4b:
Question 4 – Bus: Travel Mode to Bus Stop During a typical Monday to Friday, how do you usually get to the bus stop for each time of the day? (Check ALL that apply for EACH time of day)
5 - 9 AM9 AM to
3 PM 3 - 7 PMn=2225 n=315 n=1881
Drive alone 82.1 59.4 65.9
Carpool 8.7 2.9 7.7
Motorcycle 0.2 0.0 0.6
Bicycle/Walk 13.9 40.6 32.3
Vanpool 0.1 1.0 0.3
Ferry 0.1 0.3 0.3
Train 0.0 0.3 0.3
Note: "n" is the number of responders for each category.
Bus %
Multiple responses were allowed for this question so percentages will not add up to 100%.
Mode toBus Stop

G-8 Detailed Output Tables (Questions #1 – 8)
Exhibit G-5a:
Question 5: Trip Purpose During a typical Monday to Friday, what is the MAIN purpose of your trip [in a carpool/on a bus/in a vanpool] during each time of day? (Check ALL that apply for EACH time of day)
5 - 9 AM9 AM to
3 PM 3 - 7 PM 5 - 9 AM9 AM to
3 PM 3 - 7 PM 5 - 9 AM9 AM to
3 PM 3 - 7 PM
n=1148 n=686 n=1381 n=2234 n=466 n=2108 n=973 n=226 n=870Between home and work 77.4 34.8 60.2 97.2 51.3 97.1 100.0 85.0 98.0
Between work activities 11.5 23.0 10.8 0.7 16.5 1.1 0.7 5.2 1.1
School-related 13.2 15.3 11.2 2.8 7.9 2.8 0.1 0.9 0.9
Shopping/running errands 13.4 42.4 25.9 0.6 20.0 1.5 0.1 10.6 1.8
Recreation 9.8 25.4 25.9 0.2 6.4 1.1 0.2 0.5 1.1
Transporting non-drivers 12.1 20.8 17.1 0.2 0.9 0.5 0.3 0.5 0.8
Appointments/meetings 14.8 37.9 19.6 0.8 21.5 0.9 0.2 5.1 1.4
Other 0.1 0.4 0.4 0.3 1.3 0.3 0.1 1.5 0.1
Note: "n" is the number of responders for each category.Multiple responses were allowed for this question so percentages will not add up to 100%.
Carpool % Bus % Vanpool %Trip Purpose

HOV User Survey, Washington State Freeway System G-9
Trip purpose by gender
There are some predictable yet illustrative differences in trip purpose by gender:
Carpoolers
Males are more likely than females to be commuting to/from work during all three time periods.
Females are more likely than males to be engaged in school-related trips, shopping/errands, or transporting non-drivers during all three time periods, especially during the mid-day period.
Bus Riders
Females are more likely than males to be commuting to/from work during all three time periods.
Females are more likely than males to be engaged in shopping/errands, or appointments/meetings.
Vanpoolers
Males are more likely than females to be commuting to/from work during all three time periods.
Trip purpose by gender is presented in Exhibit G-5b.

G-10 Detailed Output Tables (Questions #1 – 8)
Exhibit G-5b
Cross-Tabulation (questions 5 & 13): Trip Purpose by Gender
Male Female Male Female Male Female
Between home and work 25.8 18.1 22.3 15.0 22.8 17.9
Between work activities 3.9 2.8 16.2 8.8 4.0 3.5
School-related 2.5 4.7 3.7 11.1 2.3 4.9
Shopping/running errands 3.1 4.5 15.8 27.3 7.2 10.1
Recreation 2.6 2.9 9.9 16.0 7.4 9.9
Transporting non-drivers 2.6 4.0 6.8 14.1 3.9 7.3
Appointments/meetings 3.7 4.7 16.9 22.4 5.2 7.8
Other 0.1 0.0 0.2 0.3 0.0 0.2
Between home and work 40.7 55.4 14.1 17.3 39.7 50.3
Between work activities 0.2 0.5 5.7 5.4 0.5 0.5
School-related 1.1 1.5 2.1 3.2 1.1 1.4
Shopping/running errands 0.1 0.5 4.0 8.8 0.3 1.0
Recreation 0.2 0.1 1.6 2.4 0.2 0.7
Transporting non-drivers 0.0 0.2 0.0 0.6 0.1 0.4
Appointments/meetings 0.2 0.5 3.5 10.2 0.2 0.5
Other 0.2 0.1 0.5 0.4 0.2 0.1
Between home and work 26.8 17.9 17.2 10.4 23.9 15.2
Between work activities 0.2 0.2 1.3 0.3 0.4 0.2
School-related 0.0 0.1 0.1 0.2 0.2 0.2
Shopping/running errands 0.0 0.1 1.2 2.0 0.3 0.4
Recreation 0.0 0.1 0.0 0.2 0.1 0.3
Transporting non-drivers 0.1 0.1 0.0 0.2 0.1 0.2
Appointments/meetings 0.0 0.1 0.2 1.0 0.2 0.4
Other 0.0 0.1 0.2 0.3 0.0 0.1
Note: "n" is the number of responders for each category.
Multiple responses were allowed for this question so percentages will not add up to 100%.
Carpool %
Vanpool %
Bus %
Trip Purpose
5 - 9 AM 9 AM to 3 PM 3 - 7 PM
n=1148 n=1381 n=466

HOV User Survey, Washington State Freeway System G-11
Exhibit G-6
Question 6: Top Reasons for Mode Choice What are the top 3 reasons you [carpool/take a bus/vanpool] during a typical Monday to Friday? Use 1 for the most important reason, 2 for the second most important reason, and 3 for the third most important reason you [carpool/take the bus/vanpool]. Please rank only the top 3 reasons and leave the rest blank. (Rank EACH of the three time periods separately)
5 - 9 AM9 AM to
3 PM 3 - 7 PM 5 - 9 AM9 AM to
3 PM 3 - 7 PM 5 - 9 AM9 AM to
3 PM 3 - 7 PMn=1058 n=639 n=1277 n=1947 n=360 n=1763 n=817 n=166 n=714
Save money 49.1 34.3 42.1 83.3 67.8 81.8 85.3 80.9 83.6
Convenience 65.3 72.5 70.8 49.7 61.1 50.3 40.2 44.9 37.9
Reliability 16.1 19.9 17.9 14.0 16.1 13.6 16.3 22.5 14.6
Travel time savings 79.9 19.9 79.0 37.7 16.1 38.4 51.7 22.5 55.5
Less stressful 42.8 42.4 45.9 63.6 50.3 64.4 56.0 43.7 57.9
No other transportation 10.1 9.9 8.1 6.7 21.4 6.9 3.0 4.7 3.5
Concern for the environment 18.6 20.2 17.9 26.9 28.3 26.7 29.7 26.9 28.7
Other 4.0 5.3 3.5 4.8 2.8 4.6 6.3 11.0 5.6
Note: "n" is the number of responders for each category.Multiple responses were allowed for this question so percentages will not add up to 100%.
Most of those who indicated “other reasons” did not specify what the other reasons were. Among those who did, the following were mentioned by small percents: wear and tear on car, no free parking, company/camaraderie, and reduce congestion.
Carpool % Bus % Vanpool %Top Reasons

G-12 Detailed Output Tables (Questions #1 – 8)
Exhibit G-7a
Question 7: Likely Actions Without an HOV Lane Thinking again of your travel during a typical Monday to Friday, if the HOV lanes were not available during the following times of the day, what is the ONE thing that you would be most likely to do? (Choose only ONE for EACH time of day)
5 - 9 AM9 AM to
3 PM 3 - 7 PM 5 - 9 AM9 AM to
3 PM 3 - 7 PM 5 - 9 AM9 AM to
3 PM 3 - 7 PMn=1282 n=834 n=1506 n=2203 n=480 n=2066 n=952 n=250 n=842
Continue to carpool 40.0 39.2 41.6 0.0 0.0 0.0 0.0 0.0 0.0
Continue to ride the bus 0.0 0.0 0.0 69.8 56.0 69.2 0.0 0.0 0.0
Continue to vanpool 0.0 0.0 0.0 0.0 0.0 0.0 68.4 57.8 64.6
Drive alone 18.3 18.0 17.4 15.9 23.3 16.2 14.9 18.1 15.4
Change route 18.2 19.7 19.2 2.9 2.9 3.0 3.7 5.4 4.9
Switch to carpool 0.0 0.0 0.0 2.3 2.5 2.2 2.7 2.1 3.1
Switch to bus 6.5 3.5 5.2 0.0 0.0 0.0 1.6 3.2 2.2
Switch to vanpool 1.1 0.6 0.7 1.2 0.4 1.1 0.0 0.0 0.0
Switch to motorcycle 0.5 0.5 0.5 0.2 0.6 0.2 0.4 1.8 0.6
Change hoursof travel 6.9 7.7 6.9 2.4 1.5 2.2 3.7 2.4 4.4
Walk or bike 0.9 0.6 0.6 0.3 4.6 0.3 0.1 1.6 0.0
Telecommute 1.4 1.4 1.1 1.0 2.1 1.2 1.8 3.5 1.6
Not make the trip 5.1 7.8 5.4 0.9 3.8 0.9 1.0 1.8 1.5
Find a closer job 0.1 0.1 0.1 0.0 0.0 0.0 0.0 0.0 0.0
Protest/lobby 0.2 0.4 0.3 0.0 0.0 0.0 0.0 0.0 0.0
Don't know 0.5 0.5 0.3 0.0 0.0 0.0 0.0 0.0 0.0
Other 0.5 0.1 0.7 3.2 2.3 3.4 1.6 2.3 1.6
Total 100 100 100 100 100 100 100 100 100
Note: "n" is the number of responders for each category.
Carpool % Bus % Vanpool %LikelyAction without HOV Lanes

HOV User Survey, Washington State Freeway System G-13
Likely actions without an HOV lane: Fam-pools vs multi-household carpools
The likely actions without an HOV lane of fam-pools are compared to multi-household carpools in Exhibit G-7b.
Exhibit G-7b
Cross-Tabulation (questions 4 & 7): Carpool Likely Actions Without an HOV Lane: Fam-Pool vs Multi-Household
Fam-Pool Multi-HH Fam-Pool Multi-HH Fam-Pool Multi-HHn=689 n=596 n=463 n=296 n=957 n=617
Continue to carpool 40.9 45.0 42.3 40.5 42.6 42.9
Drive alone 13.6 18.6 13.4 17.6 13.3 19.4
Change route 22.5 13.3 23.1 16.6 23.7 15.7
Switch to bus 6.5 6.0 2.6 3.7 4.4 5.7
Switch to vanpool 0.3 2.7 0.0 2.4 0.2 1.8
Switch to motorcycle 0.4 0.3 0.4 1.4 0.3 0.5
Change hoursof travel 8.0 7.2 8.9 9.5 7.4 7.1
Walk or bike 0.9 0.8 0.9 0.3 0.6 0.6
Telecommute 1.6 1.0 1.3 1.0 1.1 0.5
Not make the trip 4.4 4.4 6.7 6.1 5.3 5.2
Find a closer job 0.1 0.0 0.2 0.0 0.1 0.0
Protest/lobby 0.3 0.2 0.0 0.7 0.3 0.2
Other 0.4 0.5 0.2 0.3 0.5 0.3
Total 100 100 100 100 100 100
Note: "n" is the number of responders for each category.
5 - 9 AM 9 AM to 3 PM 3 - 7 PMCarpool %Likely
Actionwithout HOV Lanes

G-14 Detailed Output Tables (Questions #1 – 8)
Exhibit G-8a
Question 8A: Use of Employer Incentives Do you use any of the following incentives that may be provided by your employer to [carpool/take the bus/vanpool]? (Check ALL that you use)
Carpool % Bus % Vanpool %n=2024 n=2338 n=1170
Free bus pass 0.0 26.6 0.0
Discounted buss pass 0.0 55.2 0.0
Monetary allowances/incentives 8.2 6.0 68.2
Flexible work schedule 8.9 18.3 24.0
Free or discounted parking 6.7 0.0 24.5
Preferential parking 5.7 0.0 42.8
Rideshare matching service 2.6 0.0 21.9
Bus pass sold at work 0.0 14.7 0.0
Use of company car for errands 0.1 0.0 0.0
Guaranteed ride home 0.0 0.0 1.5
Flex pass* 1.7 0.2 0.5
Other 1.0 2.1 1.9
None 76.1 13.2 12.9
Note: "n" is the number of responders for each category.Multiple responses were allowed for this question so percentages will not add up to 100%.*Although duplicative, "Flex pass" was written in by several respondents.
Incentive Use

HOV User Survey, Washington State Freeway System G-15
Exhibit G-8b
Question 8B: Likely Action Without Incentives Would you continue to [carpool/take the bus/vanpool] if these incentives were NOT provided by your employer?
Carpool % Bus % Vanpool %n=606 n=2124 n=1031
Yes 42.6 59.1 49.2
No 43.4 12.7 21.9
Don't know 14.0 28.2 28.9
Total 100 100 100
Note: "n" is the number of responders for each category.
Continue without Incentives


HOV User Survey, Washington State Freeway System H-1
Appendix H: Survey Question #9: Respondent Origins
Respondents were informed of anonymity on the surveys as follows:
Your answers will not be associated with your address No personal information will be tracked through this survey Your answers are combined with others for statistical purposes only
In order to protect the anonymity of survey respondents, data handling procedures were developed to enable separation of responses from names or addresses to the extent possible. This procedural “firewall” was utilized for handling data whenever possible. The firewall consisted of a set of numerical identifiers which were applied to the DOL and King County address lists for carpoolers and vanpoolers, respectively. Neither names nor addresses were entered into the survey question database. Data intake, processing, and analysis of questionnaire responses were performed utilizing the numerical identifiers only.
Responses were connected to specific addresses at two points during the study. The first resulted from the decision to call carpoolers who had received questionnaires in the mail but had not returned them. Addresses that had not returned questionnaires were input into reverse directories in order to obtain phone numbers to enable follow-up phone surveys. Names were not included. The second exception was the inputting of carpool respondent addresses into a geographical information system (GIS) mapping program to enable creation of the table of respondent zip codes and the map of respondent origins presented in Exhibits H-1 and H-2. Neither of these efforts involved the correlation of survey answers back to individual addresses. Databases containing names, addresses, and phone numbers related to this project were destroyed once the study analysis was complete.
The number of responses received from each zip code are shown in Exhibit H-1. The residential location of carpool respondents is shown in Exhibit H-2.
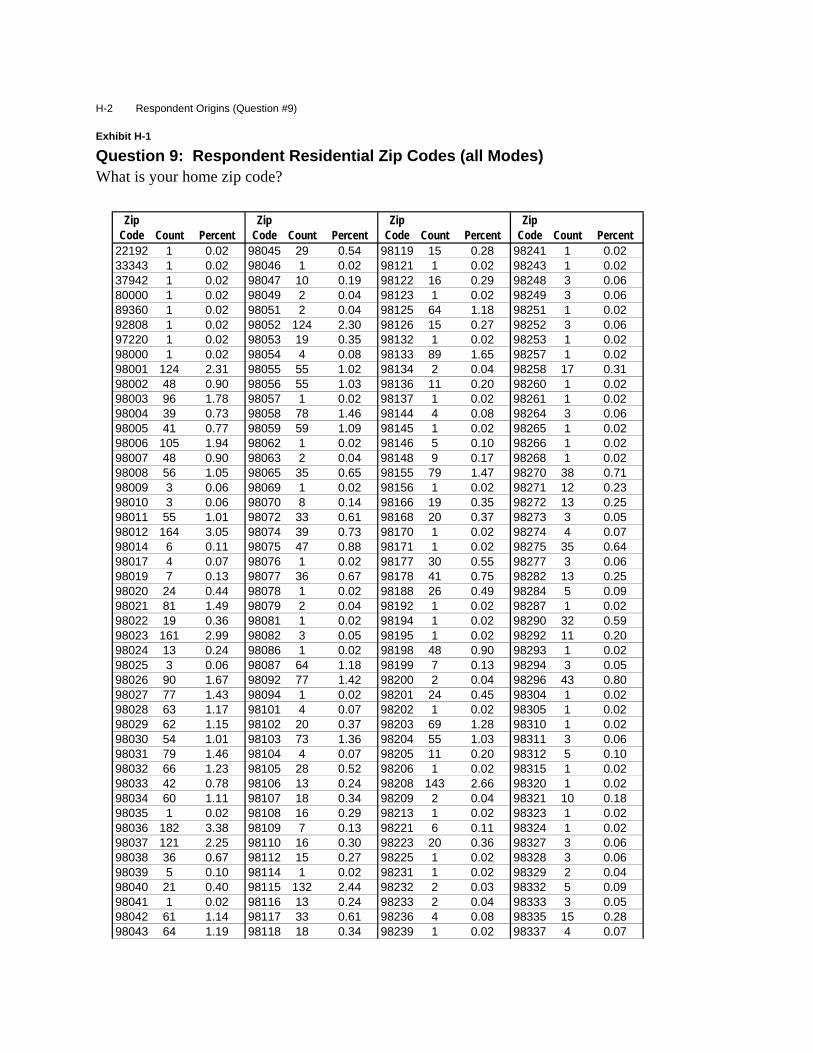
H-2 Respondent Origins (Question #9)
Exhibit H-1
Question 9: Respondent Residential Zip Codes (all Modes) What is your home zip code?
ZipCode Count Percent
ZipCode Count Percent
ZipCode Count Percent
ZipCode Count Percent
22192 1 0.02 98045 29 0.54 98119 15 0.28 98241 1 0.0233343 1 0.02 98046 1 0.02 98121 1 0.02 98243 1 0.0237942 1 0.02 98047 10 0.19 98122 16 0.29 98248 3 0.0680000 1 0.02 98049 2 0.04 98123 1 0.02 98249 3 0.0689360 1 0.02 98051 2 0.04 98125 64 1.18 98251 1 0.0292808 1 0.02 98052 124 2.30 98126 15 0.27 98252 3 0.0697220 1 0.02 98053 19 0.35 98132 1 0.02 98253 1 0.0298000 1 0.02 98054 4 0.08 98133 89 1.65 98257 1 0.0298001 124 2.31 98055 55 1.02 98134 2 0.04 98258 17 0.3198002 48 0.90 98056 55 1.03 98136 11 0.20 98260 1 0.0298003 96 1.78 98057 1 0.02 98137 1 0.02 98261 1 0.0298004 39 0.73 98058 78 1.46 98144 4 0.08 98264 3 0.0698005 41 0.77 98059 59 1.09 98145 1 0.02 98265 1 0.0298006 105 1.94 98062 1 0.02 98146 5 0.10 98266 1 0.0298007 48 0.90 98063 2 0.04 98148 9 0.17 98268 1 0.0298008 56 1.05 98065 35 0.65 98155 79 1.47 98270 38 0.7198009 3 0.06 98069 1 0.02 98156 1 0.02 98271 12 0.2398010 3 0.06 98070 8 0.14 98166 19 0.35 98272 13 0.2598011 55 1.01 98072 33 0.61 98168 20 0.37 98273 3 0.0598012 164 3.05 98074 39 0.73 98170 1 0.02 98274 4 0.0798014 6 0.11 98075 47 0.88 98171 1 0.02 98275 35 0.6498017 4 0.07 98076 1 0.02 98177 30 0.55 98277 3 0.0698019 7 0.13 98077 36 0.67 98178 41 0.75 98282 13 0.2598020 24 0.44 98078 1 0.02 98188 26 0.49 98284 5 0.0998021 81 1.49 98079 2 0.04 98192 1 0.02 98287 1 0.0298022 19 0.36 98081 1 0.02 98194 1 0.02 98290 32 0.5998023 161 2.99 98082 3 0.05 98195 1 0.02 98292 11 0.2098024 13 0.24 98086 1 0.02 98198 48 0.90 98293 1 0.0298025 3 0.06 98087 64 1.18 98199 7 0.13 98294 3 0.0598026 90 1.67 98092 77 1.42 98200 2 0.04 98296 43 0.8098027 77 1.43 98094 1 0.02 98201 24 0.45 98304 1 0.0298028 63 1.17 98101 4 0.07 98202 1 0.02 98305 1 0.0298029 62 1.15 98102 20 0.37 98203 69 1.28 98310 1 0.0298030 54 1.01 98103 73 1.36 98204 55 1.03 98311 3 0.0698031 79 1.46 98104 4 0.07 98205 11 0.20 98312 5 0.1098032 66 1.23 98105 28 0.52 98206 1 0.02 98315 1 0.0298033 42 0.78 98106 13 0.24 98208 143 2.66 98320 1 0.0298034 60 1.11 98107 18 0.34 98209 2 0.04 98321 10 0.1898035 1 0.02 98108 16 0.29 98213 1 0.02 98323 1 0.0298036 182 3.38 98109 7 0.13 98221 6 0.11 98324 1 0.0298037 121 2.25 98110 16 0.30 98223 20 0.36 98327 3 0.0698038 36 0.67 98112 15 0.27 98225 1 0.02 98328 3 0.0698039 5 0.10 98114 1 0.02 98231 1 0.02 98329 2 0.0498040 21 0.40 98115 132 2.44 98232 2 0.03 98332 5 0.0998041 1 0.02 98116 13 0.24 98233 2 0.04 98333 3 0.0598042 61 1.14 98117 33 0.61 98236 4 0.08 98335 15 0.2898043 64 1.19 98118 18 0.34 98239 1 0.02 98337 4 0.07

HOV User Survey, Washington State Freeway System H-3
Exhibit H-1 (cont.)
Question 9: Respondent Residential Zip Codes (all Modes) What is your home zip code?
ZipCode Count Percent
ZipCode Count Percent
ZipCode Count Percent
98338 18 0.33 98465 1 0.02 98674 1 0.0298340 2 0.04 98466 16 0.30 98683 1 0.0298342 2 0.03 98467 10 0.19 98684 2 0.0498346 5 0.10 98469 1 0.02 98685 1 0.0298350 1 0.02 98491 1 0.02 98686 1 0.0298351 1 0.02 98492 1 0.02 98703 1 0.0298353 1 0.02 98498 17 0.32 98708 2 0.0498354 18 0.34 98499 11 0.21 98742 1 0.0298355 1 0.02 98501 7 0.13 98771 1 0.0298359 5 0.08 98502 10 0.19 98782 1 0.0298360 19 0.36 98503 4 0.07 98790 1 0.0298365 1 0.02 98506 2 0.04 98801 1 0.0298366 18 0.33 98512 4 0.07 98802 1 0.0298367 15 0.28 98513 6 0.11 98815 1 0.0298368 1 0.02 98516 5 0.09 98828 1 0.0298370 14 0.25 98520 1 0.02 98836 1 0.0298371 22 0.41 98528 1 0.02 98874 1 0.0298372 31 0.58 98531 2 0.04 98875 1 0.0298373 28 0.51 98548 1 0.02 98891 1 0.0298374 57 1.06 98550 1 0.02 98902 1 0.0298375 27 0.51 98563 1 0.02 98908 1 0.0298377 1 0.02 98572 1 0.02 98922 1 0.0298383 2 0.04 98574 1 0.02 98926 3 0.0698384 1 0.02 98579 1 0.02 98936 1 0.0298387 17 0.31 98580 7 0.13 98941 1 0.0298389 1 0.02 98584 3 0.06 98942 2 0.0498390 18 0.34 98587 1 0.02 98960 1 0.0298391 43 0.79 98589 1 0.02 98974 1 0.0298401 1 0.02 98596 2 0.04 99005 1 0.0298402 1 0.02 98597 3 0.06 99163 1 0.0298403 10 0.18 98604 5 0.09 99201 1 0.0298404 26 0.48 98605 1 0.02 99202 1 0.0298405 12 0.22 98611 1 0.02 99203 1 0.0298406 32 0.60 98619 1 0.02 99212 1 0.0298407 29 0.53 98628 1 0.02 99223 1 0.0298408 15 0.28 98631 1 0.02 99345 1 0.0298409 13 0.23 98632 6 0.11 99350 1 0.0298418 8 0.15 98636 1 0.02 99352 1 0.0298421 1 0.02 98642 1 0.02 99361 1 0.0298422 36 0.66 98645 1 0.02 TOTAL 5389 100.0098424 8 0.15 98660 1 0.0298426 1 0.02 98661 1 0.0298443 7 0.13 98664 1 0.0298444 19 0.36 98665 1 0.0298445 23 0.42 98666 1 0.0298446 11 0.21 98671 1 0.0298461 1 0.02 98672 1 0.02

H-4 Respondent Origins (Question #9)
Exhibit H-2
Map of Carpool Respondent Residential Locations

Appendix I: Respondent Demographics - Questions #10 - 13
Questions 10 through 13 concerned respondent demographics. Respondents were informed of anonymity on the surveys as follows:
Your answers will not be associated with your address
No personal information will be tracked through this survey
Your answers are combined with others for statistical purposes only
Please see page H-1 for a description of procedures used to maintain respondent anonymity.

I-2 Respondent Demographics (Questions #10 – 13)
Exhibit I-1
Question 10: Number of Drivers in Household How many drivers are in your household?
Carpool % Bus % Vanpool %n=1936 n=2303 n=1143
None 0.2 1.1 0.4
1 9.8 21.0 17.8
2 64.0 59.5 61.7
3 16.1 13.5 13.4
4 7.0 4.2 5.5
5 1.3 0.0 0.0
6+ 1.5 0.8 1.1
Total 100 100 100
Note: "n" is the number of responders for each category.
Number of Drivers

HOV User Survey, Washington State Freeway System I-3
Exhibit I-2
Question 11: Number of Working Vehicles in Household How many working motor vehicles are in your household?
Carpool % Bus % Vanpool %n=1935 n=2292 n=1142
None 0.4 2.2 0.8
1 12.6 24.1 19.4
2 47.0 48.3 47.2
3 24.6 18.3 21.5
4 8.9 5.5 8.0
5 2.5 0.0 0.0
6+ 4.1 1.6 3.2
Total 100 100 100
Note: "n" is the number of responders for each category.
Number of Vehicles

I-4 Respondent Demographics (Questions #10 – 13)
Exhibit I-3a
Question 12: Respondent Age Which of the following ranges includes your age?
Carpool % Bus % Vanpool %n=1914 n=2293 n=1136
16 – 18 1.5 0.8 0.8
19 – 24 3.0 4.4 1.2
25 – 34 14.9 20.5 14.0
35 – 44 27.4 23.8 22.8
45 – 54 27.0 28.8 37.6
55 – 64 17.2 19.5 22.1
65+ 9.0 2.3 1.5
Total 100 100 100
Note: "n" is the number of responders for each category.
Age Range

HOV User Survey, Washington State Freeway System I-5
Age of mid-day users by mode
Significant differences in mid-day vs. peak period travelers include:
Mid-day carpoolers are more likely to be 65+ than bus riders or vanpoolers.
Mid-day bus riders are more likely to be 25-34 than car and vanpoolers.
Mid-day vanpoolers are generally older than carpoolers and bus riders.
Exhibit I-3b
Cross-Tabulation (questions 1 & 12): Age of Mid-Day Users by Mode
Carpool % Bus % Vanpool %n=1914 n=2293 n=1136
16 – 18 1.5 0.8 0.8
19 – 24 3.0 4.4 1.2
25 – 34 14.9 20.5 14.0
35 – 44 27.4 23.8 22.8
45 – 54 27.0 28.8 37.6
55 – 64 17.2 19.5 22.1
65+ 9.0 2.3 1.5
Total 100 100 100
Note: "n" is the number of responders for each category.
Mid-Day Age Range

I-6 Respondent Demographics (Questions #10 – 13)
Exhibit I-4
Question 13: Respondent Gender What is your gender?
Carpool % Bus % Vanpool %n=1898 n=2084 n=1052
Male 47.8 38.1 55.3
Female 52.2 61.9 44.7
Total 100 100 100
Note: "n" is the number of responders for each category.
Gender