USA and Houston’s Hispanic Market “An Invaluable Marketing Opportunity”

S T R U C T U R E ■ F U N C T I O N S ■ VA L U E S
SEPTEMBER 2005
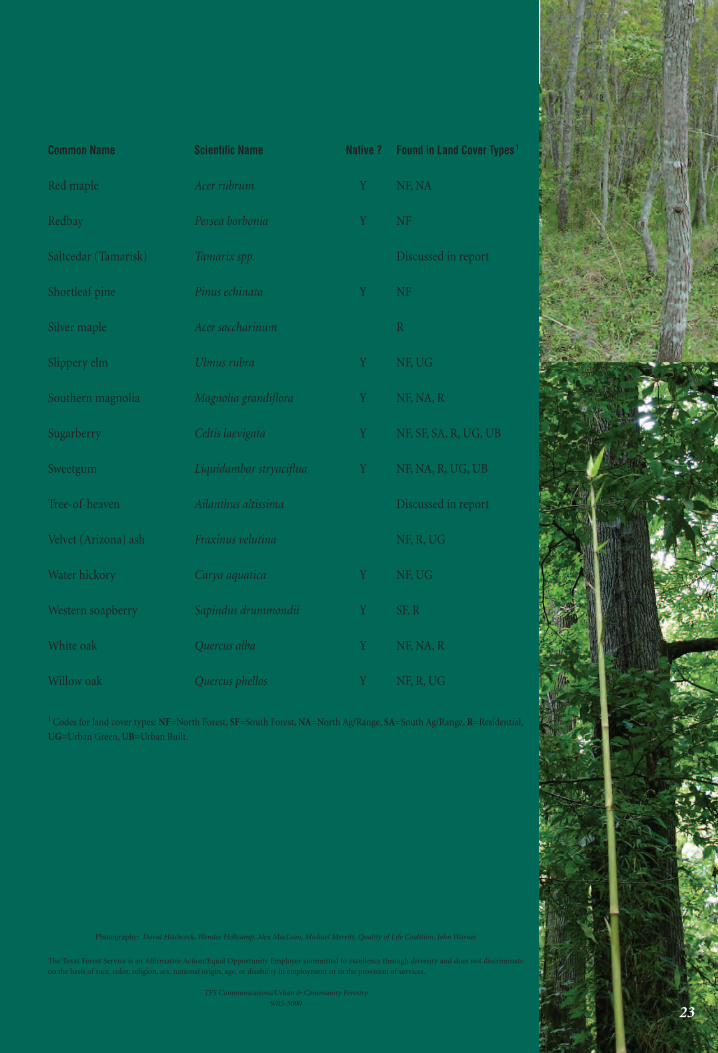
HOUSTON’S REGIONAL FOREST

For more information on this project,please contact:
PETER D. SMITHTexas Forest [email protected]
MICHAEL MERRITTTexas Forest [email protected]
DAVID NOWAK, Ph.D.U.S. Forest [email protected]
DAVID HITCHCOCKHouston Advanced Research [email protected]

S T R U C T U R E ■ F U N C T I O N S ■ V A L U E S
HOUSTON’S REGIONAL FOREST
TThe population in and around Houston has grown rapidly over the past twenty years, now exceeding five million people. Studies of the area have noted that the loss of trees and changes to the forest makeup have gener-ally accompanied this growth. Trees and urban forestry practices can be used effectively to reduce many of the negative effects of urban growth and other changes occurring in the region. These include reducing urban heat island effects, mitigating negative health and environmental impacts, and improving the overall quality of life.
In 2001, the USDA Forest Service approved funding for a special project to build the tools and systems that will help state and local groups monitor and guide the development of the area’s green infrastructure. Houston’s Regional Forest project brought federal and state government researchers together with local planners, policy makers, and managers to analyze the region’s tree cover using field research and computer modeling. This report is one of the major outcomes of this project. It provides detailed informa-tion on the structure, functions, and values of Houston’s regional forest.
ACKNOWLEDGEMENTSContributors to this project include:
David J. Nowak, PRINCIPAL INVESTIGATOR, USDA FOREST SERVICE, NORTHEASTERN RESEARCH STATION (NERS)
Peter D. Smith, TEXAS FOREST SERVICE
Michael Merritt, TEXAS FOREST SERVICE
John Giedraitis, TEXAS FOREST SERVICE
Jeffrey T. Walton, USDA FOREST SERVICE, NERSRobert E. Hoehn, USDA FOREST SERVICE, NERSJack C. Stevens, USDA FOREST SERVICE, NERSDaniel E. Crane, USDA FOREST SERVICE, NERS
Mark Estes, TEXAS COMMISSION ON ENVIRONMENTAL QUALITY
Stephen Stetson, GLOBAL ENVIRONMENTAL MANAGEMENT, INC.Charles Burditt, BURDITT NATURAL RESOURCE CONSULTING
David Hitchcock, HOUSTON ADVANCED RESEARCH CENTER
Wendee Holtcamp, HOUSTON ADVANCED RESEARCH CENTER

2
MAJOR FINDINGS & CONCLUSIONS Houston’s regional forest provides impressive value to its citizens. The replacement cost alone of the 663 million trees found in the region is valued at over $205 billion. The value of the environmental benefits generated by trees each year is esti-mated at $456 million and forests also store $721 million worth of
of the 663
million
trees found
in the
region is
valued
at over
The replacement cost alone
$205 billion.
WWExecutive SummaryWhether viewed from the pine for-ests to the northeast, the bottom-land hardwoods that line bayous and streams, or the trees that dot the prairie land to the west, tree cover is one of the defining features of the eight-county region surrounding the city of Houston. Houston’s Re-gional Forest: Structure • Functions • Values examines in detail some of the crucial characteristics of this green infrastructure.
This new understanding of Hous-ton’s regional forest is based on satel-lite imagery, field data, and comput-er modeling using the Urban Forest Effects Model (UFORE), which ana-lyzes the structure, environmental effects, and values of urban forests.1
Field surveys completed in 2001 and 2002 provided input into this model and included data from 332 field plots throughout the region located within residential, commercial, for-ested, and agricultural areas.
A forest’s structure consists of vari-ous tree species, density, health, leaf area, biomass, species diversity, and other elements that make up the forest. This report summarizes the structure of Houston’s regional forest, providing a snapshot of the forest resources as well as a detailed examination of where trees are lo-cated by species. Using extensive field surveys and satellite data, this analysis provides the most complete understanding of Houston’s forest structure to date.
Forest functions include a wide range of environmental, ecosystem, and related services that trees and forests perform, some of which are highly valued by those living in the region.
This analysis quantifies some of these functions including air pollu-tion removal, carbon storage, and energy savings. The report does not include other important for-est functions such as quality of life services to humans, habitat for wild-life, storm water management, and flood prevention.
Forest values are the quantified eco-nomic values of the forest functions mentioned above—air pollution re-moval, carbon storage, energy sav-ings—plus the replacement value of the forest. Other studies have mea-sured values such as health benefits, property value increases, and flood-water retention.

a All data is year 2001 and 2002, unless indicated otherwise.bForest land cover type = tree canopies plus unforested areas in the immediate vicinity
Table 1Summary of Findingsa
F E A T U R E M E A S U R E
Number of trees 663 million
Trees under five inches in diameter 472 million (71% of trees)
Trees in non-urban land cover classes 579 million (87% of trees)
Most common native tree loblolly pine (19% of trees)
Most common non-native tree chinese tallow (23% of trees)
Oak species 15% of trees
Replacement value $205.8 billion
Carbon storage value $721 million
Annual environmental value $456 million
Forest land cover b 28.4% of total land area
Forest land cover change: 1992-2000 -486 square miles (-17%)
Primary forest threat land use change
The Houston metropolitan region includesthe City of Houston—the nation’s fourth largest city—and the
eight surrounding counties: Brazoria Chambers Fort Bend Galveston Harris Liberty Montgomery Waller
total carbon. These benefits are dif-ferent for rural and urban areas: re-placement and carbon storage values are greater in rural areas due to the large number of trees, while energy savings and environmental benefits are greater where the human popula-tion is concentrated.
The forests of the Houston area are diverse, but also very different in the northern and southern parts of the region. Area forests contain 67 different tree species. The highly di-verse North Forest covers a greater area and has larger trees, with lob-lolly pine the single most common species. The South Forest includes forests dominated by cedar elm, sugarberry, and hawthorn as well as remnant tracts of Columbia bottom-land hardwood forests. Common to all land cover types, Chinese tallow represents the single most common species, amounting to almost 23 percent of the region’s trees.
Large trees are disproportionately important in terms of forest ben-efits. The majority of the region’s 663 million trees are small: over 70 percent are less than five inches in diameter. Although trees five inch-es and greater in diameter make up less than 30 percent of the region’s trees, they provide over 60 per- 3
cent of the environmental benefits. Therefore, protecting the region’s large trees is essential for producing future benefits.
Land use change, non-native tree species, and insect pests pose sig-nificant threats to the future of the regional forest. Actions that sig-nificantly alter land surfaces have reduced the number and density of trees while providing opportunities
for invasive species and pest out-breaks. Land use change continues to pose the biggest threat: between 1992 and 2000, forest land cover types in the region declined by an estimated 17 percent—a decrease of 486 square miles, resulting in a net loss of over 78 million trees. Out-breaks of insect pests represent a potential threat to forests that would cause significant economic and en-vironmental losses.

TThe Urban Forest Effects Model (UFORE) is a computer model that calculates the structure, envi-ronmental effects and values of ur-ban forests. It was developed in the 1990s by researchers at the United States Department of Agriculture (USDA) Forest Service, Northeast-ern Research Station in Syracuse, New York, and has been used exten-sively in various places in the U.S. and abroad. Using land cover maps and field survey inputs, the model
provides accurate estimates of ur-ban forest effects based on credible scientific research and analysis.
A central computing engine houses an integrated suite of computer pro-grams that make scientifically sound estimates of urban forest effects. These programs are based on peer-reviewed scientific equations to ac-curately predict environmental and economic benefits.
Urban Forest Effects Model
4
The UFORE model is currently designed to provide estimates of:
■ Urban forest structure by land cover type. Forest structure data in-cludes such variables as species composition, number of trees, diameter, tree density, tree health, leaf area, and biomass of leaves and trees.
■ Hourly amount of pollution removed by the urban forest and associ-ated percent air quality improvement throughout the year. Pollution removal is calculated for ozone, sulfur dioxide, nitrogen dioxide, carbon monoxide and particulate matter 10 microns or less in size.
■ Hourly urban forest volatile organic compound (VOC) emissions and the relative impact of tree species on net ozone and carbon monoxide formation throughout the year.
■ Total carbon stored and net carbon annually sequestered.
■ Effects on building energy use and consequent effects on carbon diox-ide emissions from power plants.
■ Replacement value of the forest, as well as the dollar value of air pol-lution removal and carbon storage and sequestration.
�
�
�
�
�
�

AAn objective view of trees and forests across a region as large as the eight-county Houston region necessitates the use of aerial photography, satel-lite imagery, or other remote sens-ing data. But satellites and airborne sensors only see the surface of the region’s tree canopy. Field measure-ments are needed to provide details that satellites miss—for example, the size and species of individual trees or the location of trees with respect to buildings. This detailed informa-tion is also essential for the UFORE modeling analysis.
To collect the data, researchers se-lected sites throughout the region using a sampling pattern similar to one used in the Forest Inventory and Analysis (FIA) program of the USDA Forest Service. This grid pattern di-vides the region into 6,000-acre cells from which field measurement plots were selected. To get a manageable sample size from the over 800 pos-sible plot locations, two out of every three plots in urban areas were cho-sen for study, one out of three plots in forested areas, and one out of four
Figure 1Sample Field Plot Dimensions
Field Plot48.1' radius
1/6 acre
Microplot13.6' radius
1/75 acre
PLOT LOCATIONPlot NumberDate Crew ID Slope/Aspect
PLOT COVER / LAND USE Number of actual land usesActual land use Percent of plot in each usePlot tree cover Plot shrub cover Percent plantable space Ground cover percent (each cover type)Number of shrub-genus typesShrub layer height (each genus) Shrub layer percent of area (each genus) Shrub layer percent leaves (each genus)
••••
•••••••
•••
•
TREE DATA VARIABLESTree directionTree distance Species or genus DiameterTotal height Height to crown basePercent impervious surface under treePercent shrub cover under treeStreet tree (Y/N)Crown width (two measurements) Foliage absent Dieback Transparency Crown light exposure Building direction Building distance Condition (roots, trunk, branches, twigs, leaves)Utility conflictLeaves condition Utility conflict
•••••••
•••
•••••••
•••
Field Survey Data Items
Field Measurementsplots in agriculture/rangeland areas. This selection process yielded a total of 332 plots.
In 2001 and 2002, field crews visited each of these selected grid points and recorded a series of measure-ments within a one-sixth acre plot (7,260 square feet—similar in size to a typical residential lot) (Figure 1). Plot measurements included tree species, diameter, height, crown width, foliage parameters, ground cover, and shrub cover.2 Crews also identified a 1/75th acre microplot (approximately 581 square feet) for measurements of trees between one and five inches in diameter. Unlike trees, data collected on shrubs em-phasized the leaf density and crown volume that shrub layers occupied within the plot rather than the di-mensions of individual plants.
5
Building

AA
As part of the Houston’s Regional Forest project, Global Environmen-tal Management Inc. developed a comprehensive map of the region using 2000 LANDSAT satellite data, images of field plots, and other re-motely-sensed data. The map iden-tified five major categories of land cover, including water bodies, forests and urban greenspace, agriculture/range lands, residential areas, and intensely urbanized areas (Figure 2). The Forest and Agriculture/Range categories were further subdivided into two geographic zones to bet-ter understand any differences in species composition across the re-gion. These two zones are separated by Galveston Bay, Buffalo Bayou through Houston, and U.S. Highway
Figure 2Houston Regional
Land Cover
Ag/Range
Forest
Residential
Urban – Built
Water
UFORE Land Cover
TheRegion’s Land and VegetationA thorough understanding of the region’s trees begins with an analysis of surface features that can be identi-fied using satellite imagery and then separating the region into broad categories of vegetation, roads, and zones of urban development. The Houston region has grown at a rela-tively fast pace and the accompany-ing development has altered land surfaces dramatically by clearing vegetation, constructing buildings,
6
290 in Harris and Waller Counties. Excluding water bodies, the total land area studied was 7,581 square miles, divided into seven land cover classes (Table 2).
Dividing line between Northern and Southern portions of the region
and paving roads. Shifts in manage-ment intensity in agriculture and forestry also affect the region’s sur-face characteristics.

Overall the region is roughly one-fourth urban and three-fourths agri-culture/rangeland and forests. While this non-urban land cover domi-nates the Houston region today, urban development will play an in-creasing role in changing these land cover percentages as the population of the region continues to grow.
FORESTSThe North Forest cover type occu-pies roughly 1,653 square miles and is located mostly in Montgomery, Waller, and Liberty Counties. It con-tains 45 tree species, the greatest spe-cies diversity of any land cover type. Loblolly pine is most abundant, comprising 24 percent of the tree population. Chinese tallow, the sec-ond most common tree, makes up almost 15 percent of the tree popu-lation. Combined as a genus, the ten oak species found here represent 16 percent of trees. The next one-fifth of trees is fairly evenly split between sweetgum, baldcypress, green ash, and red maple. With a total of 382 million trees and nearly 231,000 trees
per square mile, the North For-est has the highest tree density of any of the land cover types, almost three times the regional average.
The South Forest contrasts with the heavier forest cov-er to the north by having fewer trees overall, lower spe-cies diversity, and different species. The South Forest
is 499 square miles in size and ex-tends from Houston to the Gulf of Mexico, increasing in coverage to-ward the southwest. With 89 million trees (178,000 trees per square mile) and 19 species total, roughly three-quarters are represented by only four species—cedar elm, sugarber-ry, hawthorn, and Chinese tallow. Other important species found here include pecan, eastern redcedar, and American elm.
AGRICULTURE AND RANGELANDSSouth Agriculture/Range is by far the largest land cover type, occupying fully one-third of the region—2,643 square miles. This cover type extends as far north as Waller County and south to the Gulf of Mexico. Its 72 million trees are spread throughout this large area, making tree densities among the lowest of the cover types at 27,000 trees per square mile. This area also possesses the fewest num-ber of species (11) with Chinese tal-low comprising nearly 80 percent of all trees. Because of the inherent dis-turbances and abandonment of ag-ricultural fields and rangeland, the
7
AREA AREA TREES DENSITYa SPECIESLAND COVER TYPE Sq. Miles % Millions Trees/Sq Mi Number
North Forest 1,653 21.8 382.3 231,000 45
South Forest 499 6.6 88.8 178,000 19
Forest subtotal: 2,152 28.4 471.1 219,000 51b
North Agriculture/Range 984 13.0 36.6 37,000 14
South Agriculture/Range 2,643 34.9 71.8 27,000 11
Agriculture/Range subtotal: 3,627 47.9 108.4 30,000 22
Residential 987 13.0 43.9 44,000 34
Urban Built 402 5.3 5.9 15,000 14
Urban Green 413 5.4 33.9 82,000 26
Urban subtotal: 1,802 23.7 83.7 46,000 46
Total (excluding Water) 7,581 100.0 663.10 87,000 67c
Table 2Regional Land Cover Categories
aAverage density, rounded to the nearest thousand.bSubtotals for species in major cover classes represent species found in any one of the subcategoriescTotal tree species identified in analysis

South Agriculture/Range area pro-vides ample opportunities for the expansion of this invasive species.
The North Agriculture/Range cov-er type is intermixed with the North Forest and occupies roughly 984 square miles. It contains 37 million trees (37,000 trees per square mile), made up of 14 species. Loblolly pine is the most prevalent, at 62 percent of all trees, followed by sweetgum, which makes up about 12 percent of trees. Here, Chinese tallow repre-sents only five percent of the total, distinguishing this area from the South Agriculture/Range.
URBAN LANDSUrban land cover types include Ur-ban Built, Residential, and Urban Green. The Urban Built cover type consists of areas dominated by im-pervious surfaces, such as high-den-sity residential, commercial, and in-dustrial buildings, major roadways, and similar land uses. Only six mil-lion total trees are found across the 402 square miles of Urban Built land (15,000 trees per square mile). Of these, almost two-thirds are lob-lolly pine and the next most com-mon is American elm, which makes up 11 percent of trees in this cover type. Fourteen tree species were rep-resented in the sample.
Residential land cover includes low-density development and its asso-ciated tree cover. It dominates the central part of the Houston region, emanating out from the central ur-ban core and covering 987 square miles. Tree densities in Residential areas vary widely, but on average there are 44,000 trees per square mile (44 million total trees). Residential areas contain the second-highest number of tree species (34) of any cover type, many of which have been
While many people consider live oak to be one of the most common trees in the Houston region,
two percent of residential trees.
it actually
accounts for
only
added over time by homeowners and developers. While the most com-mon tree is again Chinese tallow (30 percent of Residential trees), there is a wide diversity of other species. Common trees within Residential areas include crape myrtle, loblolly pine, and several species of oak.
Urban Green is a cover type associ-ated with major parks, open space, and undeveloped tracts surrounded by or in close proximity to urban development, totaling 413 square miles. It includes large open space areas such as Memorial Park, flood-water retention basins such as Ad-dicks Reservoir, and the vegetated corridors along bayous and streams. Of the three urban land cover types, Urban Green areas contain the high-est density of trees, at over 82,000 trees per square mile (34 million
8

T
TreePopulation CharacteristicsThe total population of trees in the Houston area in 2002 is estimated to be 663 million trees. This aver-ages roughly 87,000 trees per square mile, or about 135 trees per person. As might be expected, the majority (71 percent) of trees are located in areas classified as forests. However, urban land cover types also contrib-ute 84 million trees to the region’s total, amounting to 13 percent of all trees.
Chinese tallow (23 percent of all trees) and loblolly pine (19 percent) represent the two most common tree species in this study (Table 3). When all oak species are combined, this genus accounts for 15 percent of the trees in the region, and taken together these three tree species/genera account for fully 56 percent of the region’s trees. For a complete list of common and scientific names for tree species either found on field plots or discussed in this report, see the Index of Trees on page 22.
TREE SIZEThe relative size of trees provides important information on the struc-ture, functions and values of the region’s forest. Tree size is assessed using trunk diameter and its cor-responding cross-section. Diameter
9
is measured at “breast height”—or DBH, a point 4.5 feet from the ground—and can then be used to calculate the cross-sectional area of a tree trunk. Called basal area, this provides a better measure of total tree volume than tree num-bers alone.
Houston’s tree population con-sists of an estimated 191 million trees five inches in diameter or greater, while trees between one and five inches DBH make up 71 percent of the population (472 million trees). Figure 3 shows that although most of the region’s trees are less than five inches DBH, the majority of the basal area of Houston’s regional forest is found in larger trees (five inches DBH and greater). This 29 percent of trees actually makes up 85 percent of the regional forest’s volume.
Leaf area and leaf biomass are other measures used to calculate a tree’s functions and values. Leaf surfaces slow rainwater runoff, remove pol-lutants from the air, and provide shade and cooling effects. Large trees
trees total). Again the most common species is Chinese tallow (43 percent of trees), with hawthorn, water oak, black willow, and green ash making up an additional 40 percent of trees. A total of 26 tree species were found
Table 3Most Common Tree Species(10 Million or More Trees)
Chinese tallow 152,498,000 23.0
Loblolly pine 123,974,000 18.7
Cedar elm 45,546,000 6.9
Water oak 35,608,000 5.4
Hawthorn 31,771,000 4.8
Sweetgum 30,699,000 4.6
Sugarberry 26,788,000 4.0
Green ash 24,388,000 3.7
Baldcypress 21,628,000 3.3
Willow oak 20,993,000 3.2
Red maple 17,162,000 2.6
American hornbeam 11,809,000 1.8
Southern red oak 11,322,000 1.7
Black tupelo 10,436,000 1.6
Tree Species Number % of AllTrees

have more leaves, higher leaf surface areas, and greater leaf biomass than small trees, thus providing substan-tially greater benefits. On average, a large tree (five inches DBH or greater) removes more pollutants, provides more shade, and has much greater value than a small tree. A single large tree may therefore be the equivalent of hundreds of seedlings or saplings. For instance, urban ar-eas contain 28 million Chinese tal-low trees compared to just two mil-lion live oaks, yet these oaks possess 16 percent more leaf biomass, thus contributing greater total benefits.
NATIVE AND NON-NATIVE TREESSpecies native to the Houston re-gion make up the majority of trees (76 percent) found in the study. Be-sides the oaks and pines mentioned previously, other common native trees include cedar elm, sweetgum, sugarberry, American elm, baldcy-press, and green ash. Native trees are adapted to the region’s climate, geog-raphy and ecosystems and generally require less maintenance, water, and artificial fertilizers than non-native species in landscape settings. They are also critical components of na-
tive ecosystems that provide habitat and food for birds, butterflies, and mammals.
However, non-native species repre-sent a significant component of the region’s trees (24 percent), domi-nated by a single species—Chinese tallow (23 percent). Other common trees that have been introduced to the region include Chinese elm, camphor-tree, crape myrtle, chi-naberry, and silver maple. Most of these species remain where they are planted, but certain non-native species become invasive, overtaking disturbed areas such as abandoned agricultural and urban lands, coastal prairies, and forests, crowding out native plants in areas where they were not intended. The South Ag-riculture/Range cover type pres-ents a good example of this ten-dency, with Chinese tallow now accounting for nearly 80 percent of the tree population.
URBAN AND RURAL TREESDifferent land cover types contain different tree populations. This study found that urban land cover types contained 84 million trees (13 percent), compared to 579 mil-lion trees in rural cover types (87
10
Figure 3Number of Trees and Basal Area by Diameter
250,000,000
200,000,000
150,000,000
100,000,000
50,000,000
0
No. o
f Tre
es
12,000,000
10,000,000
8,000,000
6,000,000
4,000,000
2,000,000
0
Tota
l Bas
al A
rea (
squa
re fe
et)
Diameter at Breast Height (DBH) in Inches 1 2 3 4 5 6 7 8 9 10 11 12 13 14 15 16 17 18 19 20 21 22 23 24 25 26 27 28 29 30 31 32

to meet federal air quality standards. Houston’s regional forest helps im-prove air quality by reducing air temperatures, directly removing pollutants from the air, and reducing building energy use and consequent pollutants from power plants.
The UFORE model calculated pol-lution removal by Houston’s re-gional forest using hourly pollution data and weather data (George Bush Intercontinental Airport weather station) collected in 2000. The year 2000 was used because the study re-sults needed to match Texas Com-mission on Environmental Quality (TCEQ) air quality modeling proto-cols for that time period.
Model results reveal that Houston’s regional forest removes 60,575 tons of criteria air pollutants (substances designated in the Clean Air Act) per year, which has an annual economic
T
percent) (Table 4). However, urban trees provide a greater contribution to key benefits such as carbon stor-age (20 percent) and replacement value (20 percent).
In urban and urbanizing areas, trees are often cleared from devel-opment sites to provide easier ac-cess and space for buildings and paved surfaces. Trees and other veg-etation that are planted following construction are usually fewer in number and smaller than the trees they replace. Non-native and exotic
Trees and forests provide commu-nity, economic, and ecosystem val-ues that have been well documented in research literature. The UFORE analysis in this study calculated the extent and value of three major benefits of trees and forests in the Houston region: pollution removal, carbon storage and sequestration, and energy savings. The study also calculated the value of trees for what they are, not just what they do. This replacement value corresponds to the estimated worth of each tree as it exists in the landscape.
POLLUTION REMOVALPoor air quality can impair human health, damage crops and other veg-etation, and reduce visibility. Under the Clean Air Act, the eight-county Houston region is legally mandated
11
Table 4Comparison of Urban and Rural Trees
Number of Trees (millions) 83.7 579.4 663.1
% of Trees 12.6% 87.4% 100.0%
Carbon Storage (in million tons) 7.9 31.3 39.2
% of Carbon 20.1% 79.9% 100.0%
Replacement Value ($ billions) $41.8 $164.0 $205.8
% of Replacement Value 20.3% 79.7% 100.0%
Replacement Value ($ billions)
Carbon Storage (in million tons)
Number of Trees (millions)
% of Replacement Value
% of Trees
% of Carbon
F E A T U R E U R B A N R U R A L T O T A L species may also be introduced as new landscape features.
Urbanization has had different effects on the tree popula-tion across the re-
gion. For example, urban develop-ment in what was previously South Agriculture/Range has added some Texas native trees (live oak, loblolly pine) to these landscapes, thus re-ducing the extent of non-native spe-cies such as Chinese tallow. Urban development in North Forest areas has altered or replaced the mixed pine/hardwood forests and bot-tomland forests, in many places providing opportunities for non-native trees and invasive plants to become established.
Forest Functions and Values

value to the region of nearly $300 million dollars (Figure 4). These estimates are based on the national median externality costs associated with air pollution.3
However, the overall effect of trees on air quality involves complex rela-tionships between the pollution trees remove, biogenic emissions, and air temperature and moisture regimes. While trees do emit volatile organic compounds (VOCs) that contribute to ground-level ozone formation, many studies have shown that in-creasing tree cover over an area can actually reduce these ozone levels.4 Sophisticated modeling is required to calculate the net effects of trees, which will be documented as a com-panion report on Air Quality and Houston’s Regional Forest.
12
CARBON STORAGEAND SEQUESTRATIONTrees play an important role with re-gard to the carbon cycle and associ-ated climate variability. Trees mod-erate the amount of carbon dioxide in the atmosphere through the pro-cess of photosynthesis. Carbon that remains locked up in trees from year to year is referred to as carbon stor-age. As trees grow larger each year, they sequester additional carbon and add it to the carbon already stored in trunks, branches, and leaves. Unlike deciduous trees, evergreens retain their leaves for more than one season, thus adding to their stored carbon.
$350
$300
$250
$200
$150
$100
$ 50
$ 0
Mill
ions
of D
olla
rs
Carbon Monoxide Nitrous Dioxide Ozone Particulate Matter Sulphur Dioxide TOTAL (10 microns or less)
$1.1
$42.9
$146.4
$99.0
$6.3
$295.7
Figure 4Value of Air Pollution Removed
Figure 5Value of Carbon Storage—Top Ten Species
Loblolly pine Chinese Water oak Live oak Shurnard oak Pecan White oak Sweetgum Willow oak Southern tallowtree red oak
$120
$100
$ 80
$ 60
$ 40
$ 20
$ 0
Mill
ions
of D
olla
rs
$295.7

Based on the UFORE model analy-sis, trees in Houston’s regional for-est store 39.2 million tons of car-bon, valued at $721 million.5 Of this amount, 15 percent is stored by one species alone—loblolly pine (Figure 5). In addition, the regional forest sequesters 1.6 million tons of carbon each year, at a value of $29 million.
Trees vary significantly in their car-bon storage and sequestration rates based on species, size, health, and site conditions. Young, healthy trees in the prime of life have higher se-questration rates than older trees, but due to their stature large trees store more carbon. For example, live oak represents less than 0.5 percent of the region’s tree population but accounts for over nine percent of the total carbon stored.
ENERGY SAVINGSTrees affect the amount of energy that homes and buildings use by providing shade, by the evaporative cooling effect of their leaves, and by blocking winter winds. Trees are particularly beneficial in areas like Houston that rely on air condition-ing in summer months. In this anal-ysis, trees located within sixty feet of one- or two-story residential build-ings were evaluated to calculate their effect on energy usage.
The UFORE model calculated en-ergy savings from trees using tree size, distance and direction from buildings, leaf type (deciduous or evergreen), and the percent cover of buildings and trees as recorded on field survey plots. Values are derived from the average regional costs for electricity and fuel.
Results show that the regional for-est saves energy in both the heating and cooling seasons, with the largest
savings in summer when trees shade buildings and reduce the need for air conditioning. During the win-ter, trees protect buildings from cold north winds, reducing the need for heating. By reducing energy con-sumption, trees also reduce carbon emissions from power plants that would have occurred had the trees not been present.6 The estimated total value of energy savings and avoided carbon emissions for the Houston region amounts to $131 million annually (Figure 6).
13
Figure 6Value of Energy Savings
Milli
ons o
f Doll
ars
$120
$100
$180
$160
$140
$120
$100 Cooling in Summer Heating in Winter Avoided Carbon Emissions
$111.8
$13.9
$5.4

REPLACEMENT VALUETrees have an intrinsic value based on their presence and contribution to the landscape setting that can be measured in dollars. This replace-ment value is calculated using pro-cedures set forth by the Council of Tree and Landscape Appraisers7 and can be used to determine monetary settlements for damage or death of plants through litigation, insur-ance claims, loss of property value for income tax deductions, and real estate assessments. Values derived
Houston’s regional forest has a total
estimated structural value of $206.5
billion. Structural value combines
replacement values of trees and
carbon storage values, and repre-
sents the total value of the trees as
they stand. But because trees live
and grow each year, the regional
forest provides annual functional
values (air pollution removal, car-
bon sequestration, and energy sav-
ings) that total an additional $456
million. These values are summa-
rized in Table 5.
Summary of Values
Carbon Sequestration $ 29.0 million
Air Pollution Removal $295.7 million
Energy Savings $131.1 million
Total AnnualFunctional Value $455.8 million
AnnualFunctional Value Annual Amount
TotalStructural Value $206.5 billion
Replacement Value $205.8 billion
Carbon storage $ 0.7 billion
Structural Value Amount
Table 5
from these procedures estimate the amount of money a tree owner should be compensated for the loss of a particular tree. The value is based on the market cost of planting a replacement tree and four char-acteristics of the original tree: size, species, condition, and location.
The UFORE model estimated a total replacement value of $205.8 billion for Houston’s regional forest.
14

Figure 7Percentage and Value of Trees Susceptible to Insect Pests
$90
$80
$70
$60
$50
$40
$30
$20
$10
$ 0 Southern Pine Beetle Gypsy moth Asian Longhorned Beetle Emerald Ash Borer
18.8%
$50.5
24.7%
$80.4
15.7%
$24.2
3.75% $5.1
FThreats to the Region’s ForestForests and trees are faced with many factors that can adversely affect tree populations and their associated values to people, the economy, and ecosystems. These threats include extreme weather events, wildfire, in-sect pests, and land cover changes. This report provides an analysis of several of these factors.
PESTSBecause the region’s forests are dom-inated by certain tree species—Chi-nese tallow, pine, oak, maple and ash—the structural and functional values of the forest as a whole are at risk from pests that target these potential hosts. The UFORE model estimated the effects of four insect pests of particular concern to the forests of the Houston area: gypsy moth, southern pine beetle, Asian longhorned beetle, and emerald ash borer. The total value of losses sustained during a serious outbreak of any one of these pests could be in the billions of dollars (Figure 7). These losses do not include costs that would be incurred to control such pests.
15
Billi
ons
of D
olla
rs

ana, Ohio) and southern Ontario, Canada. All ash species are suscepti-ble to attack and multi-county quar-antine zones within affected states have been established to limit the
movement of ash logs and firewood. Control measures currently involve eliminating infected and potential host ash trees within three miles of an outbreak, meaning that the dis-covery of even one infested tree can impact a much greater area of the region’s forest. Currently, 3.8 per-cent of Houston’s tree population is made up of ash trees.
INVASIVE TREE SPECIESThe movement of trees and plants across the globe for horticultural and agricultural purposes has dra-matically affected ecosystems in the southern U.S. Some plants were cho-sen for their aesthetic qualities or to perform some particular function, while others are simply “stowaways” that arrived in shipments of other plants or animals. A small number of species introduced to the U.S. escape cultivation and become es-tablished in a variety of unplanned settings. With few natural pests or diseases in their new home, these escaped plants can become invasive
Gypsy moth8 represents the single greatest pest threat to Houston’s re-gional forest due to the large range of suitable host species found here. This non-native insect has become established in other parts of the U.S., notably the northeast and the south-ern Appalachians. It defoliates many species—particularly oaks—during the growing season, causing wide-spread tree mortality if the outbreak is repeated several years in succes-sion. Should it become established in the Houston region, losses of ten percent of susceptible trees would amount to approximately $8.0 bil-lion.
Southern pine beetle9 is a native in-sect pest that has destroyed thou-sands of acres of pine forests in the southern U.S. in recent years. In 1995 alone, timber losses were estimated at over $300 million. Infestations are cyclic, with outbreaks reaching epi-demic proportions about every six to ten years. Though the Houston area has been spared such an outbreak over the past decade, an infestation affecting ten percent of the region’s pine trees would cause more than $5 billion in structural value losses.
Asian longhorned beetle10 is another pest from Southeast Asia that could have serious impact on the region’s forest cover, since it bores into and kills a wide range of hardwood spe-cies. Although not yet established in the region, it has been recorded at the Port of Houston on shipping crates. If an outbreak of this insect were to occur, the loss of just ten percent of susceptible host trees would total $2.4 billion.
Emerald ash borer11 is a recently in-troduced pest that currently affects several U.S. states (Michigan, Indi-
areas
disturbed
by
human activity.
Chinese talloweasily invades
16

over the course of a few decades and begin to alter native ecosystems.
Such is the case of Chinese tallow in the Houston region. Originally es-tablished in Texas in the early 1900s as a potential agricultural source of seed oil to make soap, it quickly escaped cultivation. It grows rap-idly and matures at an early age; birds spread its seeds widely; and it favors the climate and soil condi-tions over a vast portion of the lower Texas coastal plain. It appears highly adapted to areas disturbed by hu-man activity, including agriculture, forestry, and land development. And once established, Chinese tal-low tends to dominate areas by out-competing native plants.
This single species now accounts for over 152 million trees, almost one-fourth of all trees in the region. It is considered common in all of the cover types sampled in this study, but the highest concentration occurs in the South Agriculture/Range cover type where the species repre-sents nearly 80 percent of all trees. Some of these lands may ultimately represent new forests in areas where trees historically did not dominate the landscape, meaning that Chi-nese tallow is providing benefits in terms of new tree cover. However, it now makes up from 13 to 19 percent of trees in the Forest cover types, which hints at the effect on native plant populations (Figure 8).
17
80%
70%
60%
50%
40%
30%
20%
10%
0%
Figure 8Chinese Tallow as Percentage of All Trees by Cover Type
South Urban - Built Urban - Green Residential Regional North Forest South Forest North Agriculture/Range Average Agriculture/Range
HHHorticulturists, urban foresters, and nursery and landscape professionals
all share a responsibility to consider the potential negative effects of introducing new species to the region.
Future surveys of the regional forest will help monitor the populations of exotic species and their impact
on the environment.

Several other non-native tree or shrub species warrant careful con-sideration, either because they have already escaped cultivation in the Houston region, are being promoted as landscape plants, or because their effects elsewhere have been highly negative. This first group includes tree-of-heaven, chinaberry, Chinese privet, and mimosa. All of these spe-cies can be found occasionally in na-tive or disturbed areas throughout the region, though not in numbers comparable to Chinese tallow.
The second group includes Chi-nese pistache, Chinese elm, Mexican white oak, and sawtooth oak. These species are now commonly found in nurseries throughout the region and have been promoted as landscape trees highly adapted to Houston’s climate and soils. It is this very ad-aptation, however, that presents the potential for escaping cultivation and becoming an invasive species.
The third group is the most prob-lematic because it is impossible to completely predict how a species will adapt to a new environment simply based on its habits elsewhere. However, some species have caused
such environmental degradation in other parts of the U.S. that any proposed or accidental introduc-tion in the Houston region should be viewed with extreme caution. Though not discovered on field plots in this study, experiences with trees such as Brazilian pepper in Florida, saltcedar in the desert southwest, or eucalyptus in California offer cau-tionary tales of allowing these plants to become established here—either through accident or some well-meaning landscape design.
Horticulturists, urban foresters, and nursery and landscape professionals all share a responsibility to consider the potential negative effects of in-troducing new species to the region. Future surveys of the regional forest will help monitor the populations of exotic species and their impact on the environment.
LAND COVER CHANGES—1992 TO 2000Urban development and other hu-man activities in the Houston re-gion have had significant effects on the regional forest’s extent and composition. Previous studies have
1992 2000 CHANGE % CHANGELAND COVER TYPE Sq. Miles Sq. Miles Sq. Miles
Forest 2,798 2,312 -485.6 -17.4%
Agriculture/Rangeland 3,840 3,846 6.0 0.2%
Residential 659 989 329.5 50.0%
Urban Built 275 425 149.8 54.5%
Total Land Cover 7,572 7,572 -00.3a 0.0%
Table 6Land Cover Change 1992-2000a
a Changes in land cover should be considered approximate due to differences in methodologies used for the two study periods. Urban Green areas for 2000 redistributed across cover types to match 1992 cover classification system. Water areas not included.
18

19
indicated that urban expansion over the past thirty years has resulted in forest cover losses of approximately six percent per decade.12 The current study compared LANDSAT satellite data for 2000 and U.S. Geological Survey land cover data for 1992 to estimate land cover changes that oc-curred over this more recent eight-year period (Table 6).
The Forest land cover types declined by a total of 17.4 percent over this eight-year period, an annual loss of 2.2 percent. Since the area occupied by Agriculture/Range lands stayed roughly the same, the primary source of change in land cover was the expansion of Residential areas by 330 square miles, a growth rate of 6.3 percent per year. The associ-ated Urban Built land cover type
increased by 55 percent during this time period, occupying an addition-al 150 square miles.
These land cover changes had a dra-matic effect on the total number of trees in the region. Assuming that the density of trees within a cover type would be similar from 1992 to 2000, the net effect of land cover change was a loss of over 78 million trees (al-most 10 million trees per year), with a structural value of approximately $24 billion ($310 per tree). The en-vironmental benefits from trees de-clined by an average of $56 million per year, or $448 million. Unmitigat-ed losses at this rate will continue to erode the benefits that trees provide to citizens in the region.

HHH
conservation subdivision design, tree preservation ordinances, and a variety of educational opportunities for developers.
Mortality of existing trees is not generated by development pres-sures alone. Natural mortality rates of forests have been studied exten-sively, but only limited urban for-est mortality rates exist.13 A study of Baltimore’s trees estimated that net losses averaged 4.2 percent an-
nually, which included the effects of land use change. Using a compa-rable rate for the Houston region, net tree losses could total as many as 28 million trees per year. Besides
20
local and
regional
leaders of
today must
begin to
develop
To ensure that the benefits of trees will be experienced by future genera-tions,
long-range poli-cies for main-taining and expanding tree cover.
TheFutureofHouston’sRegionalForestHouston’s regional forest represents a vital part of the region’s identity and provides many benefits to Houston’s people, environment, and economy. This project has quantified and il-lustrated some of these features. But these trees and forests don’t exist in a vacuum; they are affected by the cu-mulative daily activity of the region’s five million people. To ensure that the benefits of trees will be experi-enced by future generations, local and regional leaders of today must begin to develop long-range poli-cies for maintaining and expanding tree cover.
The greatest threat to the overall tree population remains the land devel-opment process. Based on current practices, forest changes that are likely to occur include: decreased numbers, densities, and varieties of native trees, combined with a poten-tial for an increased presence of pests and non-native trees. This report also demonstrates the dominant contribution larger trees make to the overall value of the regional for-est, making it important for regional leaders to consider policies that ad-equately protect this key portion of the resource. Examples of strategies to preserve trees currently in use in the region include: conservation easements, parkland dedication, land purchases for parks or flood control,

21
affecting the rate or impact of land use change in the region, one way to minimize these annual losses is to reduce tree mortality rates, which could be accomplished through im-proved landscape care and mainte-nance programs. Matching species to suitable locations is also critical to survival of trees in planting pro-grams.
But ultimately, large scale tree plant-ing and other programs are needed if any increase in tree cover is to be realized. And it will be important to match these programs with the benefits expected from trees, since different species provide different
values to the region. For air quality improvement it may be important to consider species that generate lower emissions of volatile organic com-pounds (VOCs) as a key factor, while planting programs for energy con-servation or heat island mitigation might favor species that generate maximum shade over a longer lifes-pan. Other factors include whether trees are to be planted on public or private property; whether the area is urban or rural; whether a species is native or non-native; what the main-tenance requirements are; availabil-ity for planting; and cost.
Houston neighborhood with mature tree canopy coverage.
Index of Treesin UFORE Analysis
Common Name Scientific Name Native ? Found in Land Cover Types 1
American elm Ulmus americana Y NF, SF, SA, NA, R, UG, UB
American holly Ilex opaca Y NF, R
American hornbeam Carpinus caroliniana Y NF
American sycamore Platanus occidentalis Y NF
Baldcypress Taxodium distichum Y NF
Black cherry Prunus serotina Y NF
Black hickory Carya texana Y NF
Black tupelo Nyssa sylvatica Y NF, NA
Black walnut Juglans nigra Y NF
Black willow Salix nigra Y NF, NA, UG, UB
Boxelder Acer negundo Y UG
Brazilian pepper Schinus terebinthifolius Discussed in report
Bur oak Quercus macrocarpa Y R
California palm Washingtonia filifera R
Camphor-tree Cinnamomum camphora R
Cedar elm Ulmus crassifolia Y NF, SF, SA, R, UG, UB
Cherrybark oak Quercus falcata Y NF, UG var. pagodifolia
Chinaberry Melia azedarach SF
Chinese elm Ulmus parvifolia R
Chinese pistache Pistacia chinensis Discussed in report
Chinese privet Ligustrum sinense Discussed in report
Chinese tallow Sapium sebiferum NF, SF, SA, NA, R, UG, UB
Chittamwood Bumelia lanuginosa Y SF, SA, UG(Gum bumelia)
Common fig Ficus carica UG
Common persimmon Diospyros virginiana Y NF
Crape myrtle Lagerstroemia indica R
Eastern cottonwood Populus deltoides YR, UG
Eastern hophornbeam Ostrya virginiana Y NF, R
Eastern redcedar Juniperus virginiana Y NF, SF, R, UB
Eucalyptus Eucalyptus spp. Discussed in report
Flowering dogwood Cornus florida Y NF
Green ash Fraxinus pennsylvanica Y NF, SF, SA, UG
Hawthorn Crataegus spp. Y NF, SF, SA, R, UG
Hercules-club Zanthoxylum clava-herculis Y NA
Hickory Carya spp. Y NF
Huisache Acacia farnesiana Y R, SA
Laurel oak Quercus laurifolia Y NF, SF
Live oak Quercus virginiana Y SF, SA, R, UG, UB
Loblolly pine Pinus taeda Y NF, SA, NA, R, UG, UB
Mexican white oak Quercus polymorpha Discussed in report
Mimosa Albizia julibrissin Discussed in report
Oriental arborvitae Thuja orientalis UB
Osage-orange Maclura pomifera Y SF, R(Bois-d’Arc)
Overcup oak Quercus lyrata Y NF
Pecan Carya illinoensis Y NF, SF, SA, R, UG, UB
22
The Texas Forest Service is an Affirmative Action/Equal Opportunity Employer committed to excellence through diversity and does not discriminate
on the basis of race, color, religion, sex, national origin, age, or disability in employment or in the provision of services.
TFS Communications/Urban & Community Forestry
9/05-5000
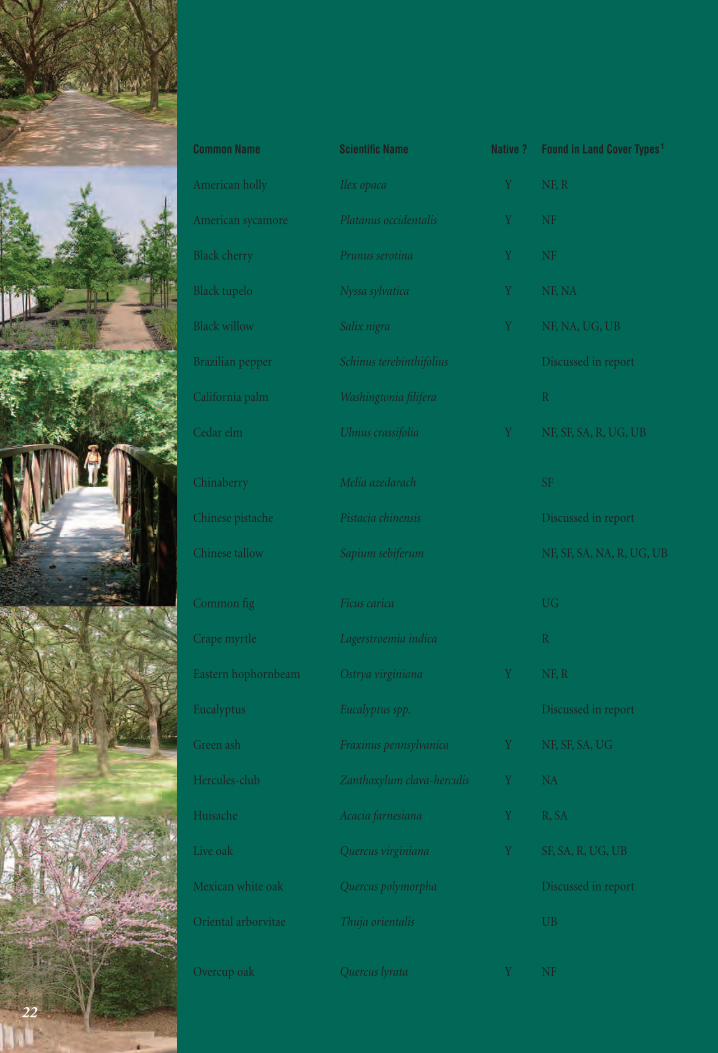
Common Name Scientific Name Native ? Found in Land Cover Types 1
Post oak Quercus stellata Y NF, SF, NA, R, UG
Red maple Acer rubrum Y NF, NA
Red mulberry Morus rubra Y NF, R, UG
Redbay Persea borbonia Y NF
Rusty blackhaw Viburnum rufidulum Y R
Saltcedar (Tamarisk) Tamarix spp. Discussed in report
Sawtooth oak Quercus accutissima Discussed in report
Shortleaf pine Pinus echinata Y NF
Shumard oak Quercus shumardii Y NF, R
Silver maple Acer saccharinum R
Slash pine Pinus elliottii R, UB
Slippery elm Ulmus rubra Y NF, UG
Southern catalpa Catalpa bignonioides R
Southern magnolia Magnolia grandiflora Y NF, NA, R
Southern red oak Quercus falcata Y NF, SF, NA, R, UG
Sugarberry Celtis laevigata Y NF, SF, SA, R, UG, UB
Swamp chestnut oak Quercus michauxii Y NF
Sweetgum Liquidambar stryaciflua Y NF, NA, R, UG, UB
Texas hawthorn Crataegus texana Y SF
Tree-of-heaven Ailanthus altissima Discussed in report
Unknown Spp. NF, UG
Velvet (Arizona) ash Fraxinus velutina NF, R, UG
Water-elm Planera aquatica Y NF
Water hickory Carya aquatica Y NF, UG
Water oak Quercus nigra Y NF, SF, NA, R, UG, UB
Western soapberry Sapindus drummondii Y SF, R
White ash Fraxinus americana Y NF
White oak Quercus alba Y NF, NA, R
Willow Salix spp. UB
Willow oak Quercus phellos Y NF, R, UG
Winged elm Ulmus alata Y NF, SF, NA, UG
1 Codes for land cover types: NF=North Forest, SF=South Forest, NA=North Ag/Range, SA=South Ag/Range, R=Residential,
UG=Urban Green, UB=Urban Built.
Photography: David Hitchcock, Wendee Holtcamp, Alex MacLean, Michael Merritt, Quality of Life Coalition, John Warner
23

1 Nowak, D.J., and D.E. Crane. 2000. “The Urban For-est Effects (UFORE) Model: quantifying urban forests structure and functions” in: Hansen, M. and T. Burk (Eds) Integrated Tools for Natural Resources Inventories in the 21st Century. Proceedings of the IUFRO Confer-ence. USDA Forest Service General Technical Report NC-212. North Central Research Station, St. Paul, MN. Pp. 714 - 720.
2 For detailed methods, see: Nowak, D. J., D. E. Crane, J. C. Stevens, and M. Ibarra. 2002. Brooklyn’s Urban For-est. USDA Forest Service Gen. Tech. Rep. NE-290; and Urban Forest Health Monitoring Manual at: http://www.fs.fed.us/ne/syracuse/Tools/UFORE.htm
3 F. J. Murray, L. March, P.A. Bradford, New York State Energy Plan (New York State energy Office, Albany, NY, 1994. Economic values to society are based on median monetized dollars per ton externality values used in energy decision making from various studies. Values per ton in this study include: NO2 = $6,752, PM10 = $4,508, SO2 = $1,653, and CO = $959.
4 For more information, visit: http://www.fs.fed.us/ne/syracuse/TREE%20Air%20Qual.pdf
5 Carbon values are multiplied by $20.3 per metric ton, which is based on the estimated marginal social costs of CO2 emission. Fanhauser, A., 1994. The social costs of greenhouse gas emissions: an expected value ap-proach. The Energy Journal 15(2), 157-184.
6 For more information, see: Abdollahi, K. K., Z. H. Ning, and A. Appeaning (Eds.) 2000. Global climate change and the urban forest. GCRCC and Franklin Press, Baton Rouge, LA.
7 Based on Council of Tree and Landscape Appraisers guidelines. For more information, see Nowak, D. J., D. E. Crane, and J. F. Dwyer. 2002. Compensatory value of urban trees in the United States. J. Arboric. 28 (4): 194-199.
8 For more information, visit: http://na.fs.fed.us/spfo/pubs/fidls/gypsymoth/gypsy.htm
9 For more information, visit: http://www.barkbeetles.org/spb/Index.HTML
10 For more information, visit: http://na.fs.fed.us/fhp/alb/index.shtm
11 For more information, visit: http://na.fs.fed.us/fhp/eab/index.shtm or http://www.emeraldashborer.info/
12 American Forests’ Urban Ecosystem Analysis For the Houston Gulf Coast Region. For more information, visit: http://americanforests.org/downloads/rea/AF_Houston.pdf
13 Nowak, D.J., M. Kuroda, and D.E. Crane. 2004. Tree mortality rates and tree population projections in Bal-timore, Maryland, USA. Urban Forestry and Urban Greening, 2:139-147. http://www.elsevier-deutschland.de/artikel/649602#
For further information on Urban Forest Health Moni-toring, UFORE, or urban forest effects, please visit:http://fhm.fs.fed.us/; http://www.fs.fed.us/ne/syracuse; or http://www.ufore.org
Footnotes/References

S T R U C T U R E ■ F U N C T I O N S ■ V A L U E S
HOUSTON’S REGIONAL FOREST
U.S. FOREST SERVICE ■ TEXAS FOREST SERVICE
SEPTEMBER 2005
S T R U C T U R E ■ F U N C T I O N S ■ V A L U E S
HOUSTON’S REGIONAL FOREST