
Housing shortages and the new downturn of residential ...
23
Full Terms & Conditions of access and use can be found at https://www.tandfonline.com/action/journalInformation?journalCode=chos20 Housing Studies ISSN: (Print) (Online) Journal homepage: https://www.tandfonline.com/loi/chos20 Housing shortages and the new downturn of residential mobility in the US Dowell Myers, JungHo Park & Seongmoon Cho To cite this article: Dowell Myers, JungHo Park & Seongmoon Cho (2021): Housing shortages and the new downturn of residential mobility in the US, Housing Studies, DOI: 10.1080/02673037.2021.1929860 To link to this article: https://doi.org/10.1080/02673037.2021.1929860 Published online: 15 Jun 2021. Submit your article to this journal Article views: 30 View related articles View Crossmark data
Transcript of Housing shortages and the new downturn of residential ...

Full Terms & Conditions of access and use can be found athttps://www.tandfonline.com/action/journalInformation?journalCode=chos20
Housing Studies
ISSN: (Print) (Online) Journal homepage: https://www.tandfonline.com/loi/chos20
Housing shortages and the new downturn ofresidential mobility in the US
Dowell Myers, JungHo Park & Seongmoon Cho
To cite this article: Dowell Myers, JungHo Park & Seongmoon Cho (2021): Housingshortages and the new downturn of residential mobility in the US, Housing Studies, DOI:10.1080/02673037.2021.1929860
To link to this article: https://doi.org/10.1080/02673037.2021.1929860
Published online: 15 Jun 2021.
Submit your article to this journal
Article views: 30
View related articles
View Crossmark data

Housing shortages and the new downturn of residentialmobility in the US
Dowell Myersa, JungHo Parkb and Seongmoon Choc
a Director of the Population Dynamics Research Group, Sol Price School of Public Policy, Universityof Southern California, Los Angeles, CA, USA; bSURE Education Research Group, Department ofSmart City, Chung-Ang University, Seoul, South Korea; cDepartment of Urban Planning and SpatialAnalysis, Sol Price School of Public Policy, University of Southern California, Los Angeles, CA, USA
ABSTRACTHousing shortages following the global financial crisis have beenaccompanied by a new, sharp downturn in rates of residentialmobility, largely among renters. The Great Recession precipitatedmajor, lingering housing disruptions, with local mobility decliningby one-third in the US from 2010 to 2019. Slow construction des-pite employment recovery and burgeoning numbers of youngMillennials led to intensified competition for vacancies. That‘friction of competition’ is posited to delay moves and reduceoverall mobility rates. Questions investigated are how urban areadeclines in renter mobility are related to slower housing construc-tion than job growth, fewer rental vacancy chains released byhome buyers, concentrations of young adults, and affordability.Analysis is with the American Community Survey for the 100 larg-est metropolitan areas in the US Mobility constriction is a newindicator of declining housing opportunity. Similar outcomes bearinvestigation in other cities and nations impacted by housingshortages and the shift to renting.
ARTICLE HISTORYReceived 11 September 2020Accepted 7 May 2021
KEYWORDSResidential mobility;housing shortage; vacancychains; Millennials
In the recovery after the Great Recession, a new era of declining residential mobilitybegan in the United States. Although the pace of total geographic mobility had beendeclining steadily since 1985, most of that reduction was among long-distance mov-ers. After 2010, an accelerated downturn in mobility commenced when the pace oflocal relocations, within the same county, sharply contracted (Frost, 2020). Given thathousing motivations account for two-thirds of reported reasons for local moves, thedownturn in residential mobility likely may be linked to one or more aspects of thecontinuing housing crisis in the post-recession decade.
How residential mobility has fared in the context of sustained housing challengeshas not been assessed and is both neglected and under-theorized relative to longer-distance migration (Coulter et al., 2016). In part, the challenge is that multiple
CONTACT Dowell Myers [email protected] Sol Price School of Public Policy, University of Southern California,650 Childs Way, Los Angeles, CA 90089-0626, USA.
Supplemental data for this article is available online at https://doi.org/10.1080/02673037.2021.1929860.
� 2021 Informa UK Limited, trading as Taylor & Francis Group
HOUSING STUDIEShttps://doi.org/10.1080/02673037.2021.1929860

housing problems are interacting, beginning well before the recession, and effects arenot easily separable. Housing shortages have accrued over many years of underpro-duction, which leads to rising prices and growing affordability problems. These prob-lems have interacted also with demographic changes, especially the large, risinggeneration of Millennials contesting for homes in urban areas (Moos et al., 2018).The sluggish response of the construction industry has various reputed causes, but itremains unable to meet growing housing demands despite rising prices. Productionhas never caught up on the backlog of housing needs, whether in the US (HarvardJCHS, 2019; Dietz, 2020), the UK (Scottish Government, 2011, Wilson & Barton,2020), Canada and Australia (Palm & Whitzman, 2020), or the EU (Pittiniet al., 2019).
Emphasis in this paper is on the city-wide (metro-level) opportunities for movingthat have been constricted in the housing crisis after the Great Recession, and howclosely tied those opportunity changes are with downturns in mobility. New con-struction by itself supplies only a fraction of the vacancies occupied by movers eachyear, but it plays an essential multiplier role in generating additional vacancies.This process eludes measurement by traditional vacancy rates that measure unitslying empty at a spot in time. To capture better the dynamic process, in this paperwe construct a vacancy generation and turnover model to link housing supply tothe flow of movers finding housing opportunities, summing these in the aggregatemobility trend.
From a housing supply perspective, the central dynamic in mobility is creationof vacancies when people move out and make units available for others to movein. This endogeneity poses analytical challenges and calls to mind Mulder’s (2006)observation that housing and population have a ‘two-sided relationship’ thatmakes cause and effect difficult to assess. In our metro-level analysis of movers,and in the physical world of housing, every newly occupied housing unit repre-sents both supply (unit previously vacant and available) and demand (unit filledby a moving household). New construction initiates vacancy chains, as the newunits draw households out of their former units, creating turnover and vacancyopportunities in additional housing units. Also to be considered are the rentalvacancy chains that are triggered by home buyers who release their former ren-tal homes.
The question for study is how much the pace of residential mobility may havebeen depressed by the competition for an undersupply of housing, relative to the bur-geoning pace of economic growth in the recovery decade following the GreatRecession. The paper first compares the mobility trends of the last three decades,showing how different is the change following the Great Recession. We then reviewfeatures of the housing crisis that restricted housing opportunities and might limitmobility, developing hypotheses for key links in the process. Combining the large-scale American Community Survey with records of new housing construction andemployment growth, we build statistical models to estimate associations betweenmobility changes and contributing factors. In concluding sections we discuss implica-tions, alternative interpretations, and questions for further research about the mobilitydownturn.
2 D. MYERS ET AL.

1. Background
1.1. A diverging downtrend in mobility
The downturn of local-level, residential mobility in the US in the last decade isunprecedented, and yet largely unrecognized, perhaps because the local trend is cam-ouflaged by the well-known historical decline in overall geographic mobility.Beginning after 1985, the annual rate of moving of all distances fell continuouslyfrom 20.2% to 9.8% in 2019.1 However, closer examination reveals major differencesby decade and distance of move (Figure 1).
We find these differences demarcate distinct eras of mobility decline. The totalmobility rate (top line) is the sum of the local (within county) mobility rate and lon-ger distance movers (non-local).2 Within each decade, the pace of change in mobility
Figure 1. Downward trend in geographic mobility by distance and decade, United States, 1990 to2019. Sources: US Census Bureau, CPS Historical Migration/Geographic Mobility Table A-1, titledAnnual Geographic Mobility Rates, By Type of Movement: 1948–2019, publicly accessible at https://www2.census.gov/programs-surveys/demo/tables/geographic-mobility/time-series/historic/tab-a-1.xls.Notes: Geographic population mobility rate (%) ¼ total movers/total population 1 year old andover; local mobility rate (%) ¼ same county movers/total population 1 year old and over. Thetrend lines are calculated uniquely for each 10-year period and distance of move, and the regres-sions slopes (b) indicate the annual percentage point rate of decline.
HOUSING STUDIES 3

is indicated by the slope of the 10-year trendlines. In the 1990s, the total change was�0.184 percentage point per year. Both local and non-local components of geo-graphic mobility declined slowly and total mobility slipped gradually below the 20%norm of the early postwar period.
In the 2000s, virtually all of an accelerated decline was registered among the longerdistance movers (–0.310), while the local mobility rate declined very little (–0.035).Roughly half of non-local mobility consists of interstate moves (other categories being‘same state but different county’ and a very small share from abroad). This acceler-ated long-distance decline drew deep concern, spurring a search for underlyingcauses, focusing especially on employment-driven opportunities (Cooke, 2013; Molloyet al., 2017; Johnson & Schulhofer-Wohl, 2019).
After the Great Recession, we find a striking reversal of mobility trends. Decline oflonger distance mobility almost completely abated (–0.008). Instead, local mobilityturned sharply downward, from virtually zero change in the 2000s to �0.247 per yearafter 2010, a decline of 2.5 percentage points or approximately one-third of the priorresidential mobility rate (Figure 1).
To date, no research literature on the shrinking local movers has developed com-parable to the hunt for causes of declining migration a decade earlier. The most dir-ect study is a research brief that identifies slowing local mobility as the keycomponent in recent declines of geographic mobility, but without substantial explan-ation (Frost, 2020). There is a dearth of studies on this new downturn.
1.2. Housing crisis after the Great Recession
Housing motivations are the dominant reason given for local-level geographic movesin the US, amounting to 66.5% of reasons for moves in 2018.3 (Economic motivationsare most common among long-distance movers, as compared in Figure A, supple-mentary material.) Accordingly, it is reasonable to suspect the abrupt plunge in localmobility might be related in some fashion to the restricted housing opportunities thatfollowed the Great Recession.
The burgeoning housing problems have many dimensions, including the downturnin homeownership, heightened competition for rental housing, and persistently lowconstruction. The latter led to shortages and rising prices, making ‘affordability’ acatchall term for the crisis. However, the impacts on residential mobility have yet tobe studied.4
1.2.1. Homeownership decline and the shift to rentingWhen the US housing bubble of the mid-2000s began to collapse in 2007, it triggereda global financial crisis and sustained a 12-year decline in homeownership that didnot bottom in the US until 2016.5 Impacts were most concentrated among youngerhouseholds, with losses of 10 to 12 percentage points in age groups between 25 and44 (Haurin, 2016). The foreclosure crisis dissolved 4 million homeowners, with a net2 million single-family homes switched from owned to rental status between 2006and 2015 (Immergluck, 2018). While debates continue over how much of the down-turn was a permanent change of preferences regarding homeownership and how
4 D. MYERS ET AL.

likely it is to rebound to prior levels (Acolin et al., 2016; Myers et al., 2020 ), the ren-tal housing sector had to absorb a shock of added demand. Other countries known asstrong ‘homeowner societies’, such as Ireland, UK, and Spain, also experienced thissizable ‘decanting’ of would-be homeowners into the private rental sector, forging anew, young ‘generation rent’ (Byrne, 2020). Growth in housing demand has shiftedfocus to the rental sector after decades of rising ownership.
1.2.2. A chronic lag of constructionThe most lasting impact of the financial crisis in the US was on housing construction,as found in a bleak assessment of the decade: ‘Just as the recent housing downturnwas longer and deeper than any other since the Great Depression, the residential con-struction rebound has also been slower’ (Harvard JCHS, 2019: 1). Even after newconstruction had reached 1.2 million units in 2018, that level was still lower than anypre-crisis year back to 1982. Household formations had steadily grown each yearsince 2011, but construction failed to stay ahead: ‘Housing construction has barelykept pace with household growth for an unprecedented eight years [since 2010]’(Harvard JCHS, 2019: Figure 1).
Normally, growing demand would call for more construction, with rising prices asan incentive, unless there were an excess of vacancies already existing. However, des-pite continued tight supplies and rising prices, construction has not responded as vig-orously as in previous decades for reasons not fully understood.6 In fact, many EUcountries also face supply shortage and under-investment (Pittini et al., 2019), and arecent assessment documents under-supply especially in the London region and thesoutheast of England (Wilson & Barton, 2020).
Consequences of low construction for mobility are not favorable. Turnover isknown to be greater when there is more construction (Dieleman et al., 2000; Rosen& Smith, 1983), and it is noteworthy that a comparison of OECD nations found thatresponsiveness of supply to increases in demand was the strongest policy-relateddeterminant of differences in residential mobility rates (Caldera S�anchez & Andrews,2011). The strong implication is that the pace of new construction increases turnoverin existing housing, but this relationship has not been directly estimated. A closerconsideration is given the mechanisms next.
1.2.3. Turnover, vacancies and mobilityVacancies are generated when new units are created or when the occupants move outof an existing unit. Economists have paid the most attention to vacancies and supplyof housing, often relying on an abstract, theoretical concept of a ‘natural’ vacancyrate that exists in equilibrium, due to normal frictions of turnover (Gabriel &Nothaft, 2001). They find this natural vacancy rate is not constant and varies acrosscities, with a higher rate occurring in areas of rapid growth where there is relativelymore building ahead of demand and also in areas of higher turnover in the existinghousing stock (Rosen & Smith, 1983).
The complement to vacancy generation is the residential mobility process of peoplefilling vacant housing opportunities. In this broader view, vacancies are required forhouseholds to move into a unit, and yet at the same time mobility generates new
HOUSING STUDIES 5

vacancies when households move out of a unit. This turnover of the existing housingstock supplies many more times the vacancy opportunities than derived from newconstruction. For example, in years from 2012 to 2015, an average of roughly1,050,000 housing units per year in the United States were newly built and occupied(39.5% renters), but in 2015 and 2016 an average of 15.2 million households per year(71.5% renters) moved into a vacant residence, thus supporting 14.5 times as manymoves as the newly-built units alone.7
Vacancy chains are a key concept that links new construction and larger turnoverin the existing stock. First studied in the 1960s and 1970s (Kristof, 1965; Sands &Bower, 1976), the general finding was that each newly-built unit supports three ormore mover households on average—the mover into the new unit, a mover into theirformer unit that was vacated, and a third (or more) mover into that person’s vacatedformer unit. Vacancy chains may be shorter or longer in different contexts, but theirlength is limited because they are terminated by migrants from out of town, by newhousehold formations, or by any new occupants who do not vacate another local unitthat would continue the chain of occupancies. However they are initiated, vacancychains stimulate turnover and multiply the housing opportunities triggered by newevents (Marullo, 1985).
An extension proposed here of the vacancy chain method is the transition fromrenting to homeownership. First-time homeowners who have newly moved andvacated a former rental unit within the same local area have not only exited fromrental competition but also triggered a chain of rental turnovers. From AmericanHousing Survey data, we learn that the majority of recent buyers in 2017 have leftbehind a rental unit (54.3% of all ages and 69.1% of buyers ages 25–34). 8
Accordingly, a rising number of owner movers would indicate a greater number ofvacancies made available in their former home for other local movers who remainrenters. Important for establishing this relationship, this benefit to local renters is notexpected to pertain if the home buyers came from outside the metropolitan region.In total, we could expect that new construction and homebuying will both createadded rental vacancies and facilitate a higher local rate of renter mobility.
1.2.4. Crisis of affordabilityRents have been escalating in the U.S, with little increase in incomes. Median grossrents in the US rose by 20.6% in real dollars from 2000 to 2018, but median incomeof renters rose only 0.8%, indicating it was shortage, not a surge of spending capabil-ity, that created excess demand driving up rents. As a result, the number of rentals inthe former top quartile of prices swelled from 25% to 42% of all rentals, while thenumber in the bottom quartile was cut in half ( Myers and Park, 2019).
Growing affordability problems are commonly named as the crux of the housingcrisis in urban areas, but they can be seen as mainly a consequence of inadequatesupply. Reduced housing construction not only reduces the supply of new vacancyopportunities, but it produces fewer vacancy chains and leads to housing shortagesthat cause rents to escalate. With fewer openings available, and greater numbers ofcompeting home seekers, one can imagine how existing tenants are discouraged frommoving out of their current units and making them available for potential in-movers.
6 D. MYERS ET AL.

Real estate economists find that a shortened supply shrinks the time before eachvacant unit is rented (Novy-Marx, 2009), and that rapid absorption and shortage ofvacancies is what allows landlords to raise rents for any units coming vacant. In thismanner, growing shortages allow affordability pressures to intensify city-wide.
In addition, it must be recognized that a small fraction of renters each year areforced, against their choice, to move by eviction or displacement, with greater likeli-hood among renters of color (Desmond & Shollenberger, 2015). Renters with verylow income also face greater precarity in general, and the pressures of high rent bur-den on individual renters might cause them to completely dissolve their householdand move out.
1.2.5. The struggle of young MillennialsYoung adults in their 20 s and early 30 s in the last decade, members of theMillennial generation, encountered much more difficult housing opportunities thandid their parents, the Baby Boomers, when they were the same age in the 1970s,clearly demonstrated on multiple dimensions by Mawhorter (2018). Perhaps as aresult, the Millennials have been moving much less than earlier generations and aresaid to account for a substantial portion of the overall decline in moving (Fry, 2017).The great majority are renters and, by their newness in the housing market, theystruggle to gain an entry foothold. While the middle-aged have settled into long-termlodging, young adults have much higher rates of annual residential mobility, espe-cially when they are renters.9 This high mobility puts young people continuously incompetition for vacancies. If construction or turnover generation do not stay aheadof growing demand, the friction of competition could slow the actual paceof mobility.
This friction of competition amid housing shortages could lead to lengthier searchtimes, which delays moves, and resulting discouragement over finding suitablereplacement housing. That is the key mechanism by which excess competition couldconstrict mobility. Delayed moves likely spill over from one year to the next, addingto the pentup demand in the next year. Gradually, a portion of postponed movesbecome simply foregone and the mobility rate cumulatively declines.
The large Millennial generation of young adults (born 1982 to 1998) are centralactors in this housing competition because of their historical positioning. This groupis substantially larger than the smaller Generation X (born 1965 to 1981) that pre-ceded them into the housing market. Yet most of the Millennials reached independ-ent adulthood only after the 2007 financial crisis, when housing constructioncollapsed. Although these young adults are typically high propensity movers to rentalhousing, such a greater concentration of young people also indicates greater aggregatedemand for any vacancies. Thus, during the crisis of slow housing production follow-ing the Great Recession, many metros came under more intense competition, notonly from the supply side (low construction) but also from the demand side, becausethe large Millennial generation entered the apartment market, many moving to thecore areas of large metros in a ‘youthification’ effect (Moos, 2016). The combinedshock of employment and construction downturn in the Great Recession stalled nor-mal housing career advancement, including turnover of apartments, early in the
HOUSING STUDIES 7

decade (Myers, 2016). A seeming paradox to be addressed is that metros with a heav-ier concentration of young adults—typically people with higher propensity for mobil-ity to rentals—instead could experience greater slowing of mobility if the friction ofcompetition is great enough.
2. Local mobility and housing data
2.1. The American Community Survey for mobility research
We adopt the American Community Survey (ACS) to measure mobility for the rea-son that it includes a broad swath of housing variables and because its 20-times largersample size permits detailed analysis of many large cities.10 The ACS follows thesame retrospective mobility definition as the Current Population Survey (CPS) byasking residence of respondents a year earlier. This retrospective perspective can dis-tinguish movers from nonmovers and local movers from longer-distance in-migrants.However, characteristics such as tenure, housing type, and marital status are onlyobservable after the move.
Findings from the two surveys, both conducted by the US Census Bureau, are gen-erally very similar, with the main exception that the ACS consistently reports aslightly higher annual rate of residential relocation. A careful comparison found theACS tracked closer with trends from IRS migration records and the AmericanHousing Survey, while the CPS was lower (Masnick, 2013).
2.2. Definition of local mobility of renter households in metro areas
For closer linkage with the housing data we adopt a household base for reportingtrends in mobility. Households are numerically equivalent to occupied housing units.Graphic comparison between the national ACS and CPS annual trends in local mobil-ity by renters and owners is supplied in Figure B, supplementary material. Weobserve that the great decline among renters is what accounts for all of the localmobility decline in either the CPS or ACS. That makes renters’ mobility the mostimportant topic to understand in regard to the decline of local level mobility.
In this analysis of mobility in the context of housing supply and demand, wedefine local moves as those occurring within the boundaries of the same metropolitanarea rather than within counties, because the metro area better defines the housingmarket served by workers in the local economy. We identify local household moversin each metropolitan area based on the question asked in the ACS on place of resi-dence one year ago.
2.3. Data, variable definitions and model specification
Research is designed as an aggregated metropolitan-level analysis, estimating the asso-ciation of changes in mobility rates with changing contextual factors that may restricthousing availability. Although our models are observational and cannot test causality,we conceptualize variables by their temporal sequence: (1) legacy conditions prior tothe observation period; (2) employment growth that is the key driver; (3) housing
8 D. MYERS ET AL.

construction that serves growing demand; (4) new homebuyers that trigger rentalvacancy chains; and (5) renters moving locally. Control variables are demographiccompositional measures in 2012.
Units of observation are the 100 most populous metropolitan areas in the US,which are specified according to the geographic definitions used in the 2010 census(Table E, supplementary material). Data are drawn from the 1-year ACS data, organ-ized in the Integrated Public Use Microdata Samples (IPUMS) (Ruggles et al., 2020).Additional data for the same metro definitions are drawn from employment growthestimates by the Bureau of Labor Statistics and from housing building permit recordscollected by the Census Bureau’s Survey of Construction (Table 1).
Analysis centers on the local renter mobility rate within the metro, defined aswithin-metro renter movers as a proportion of the renter segment of these residenthouseholds (excluding in-migrants). Secondarily, we also estimate total local mobilityas all mover households in proportion to all resident households (excluding in-migrants). Exact denominators for independent and dependent variables are specifiedin Table 1.
The dependent variable to be estimated is the net change in the local renter orhousehold mobility rate between 2012 and 2018, selecting this time frame to beginafter the initial rebound from the deep impacts of the Great Recession. Emphasis onthe difference over time has the advantage of implicitly controlling for other unob-served features of metro areas and their populations. The differential model to beestimated is expressed as:
DYm, 2012�2018 ¼ Ym, 2018 � Ym, 2012ð Þ¼ a0 þ bVm þ cBm þ dTm þ hLm þ lDm þ em
where DYm, 2012�2018 is the net change in renter (or household) mobility rate,expressed as the percentage point change between 2012 and 2018 in metropolitanarea m; Vm is a set of renter and owner vacancy rates in 2012 and 2018, offered asalternative descriptors of vacancy conditions; Bm is a vector of covariates that repre-sent relative balance of new housing and job growth; Tm is a set of turnover andvacancy chains; Lm is a vector of legacy conditions in 2012, measured prior to thebeginning of our estimation period; Dm is a set of demographic compositional factors,serving as controls for concentrations with differential moving propensities; em is anerror term.
Definition of variables used in the model and their descriptive statistics are pro-vided in Table 1. Our focus is on what metropolitan factors shape the change in theaggregate pace of mobility in an area, rather than a focus on individual characteristicsshaping who moves or how they choose among housing types. A deliberate feature ofthe model is to not explain differences in behaviors and outcomes based on the priceof housing (which itself is a product of the housing shortages we aim to measure).Nor do we seek to introduce income of individual housing consumers, because that isa sorting mechanism that informs who gets what housing. We are examining howchanges in the relative supply and demand may depress overall mobility rates inmetro areas.
HOUSING STUDIES 9

Table 1. Definition and descriptive statistics of variables.Variable Definition Mean SD Median Min. Max.
Dependent
Change in localrenterhouseholdmobility rate
Percentage point changefrom 2012 to 2018 inlocal renter householdmobility rate as % oflocally-resident renterhouseholds in ametro area
�4.910 3.893 �4.573 �19.769 5.140
Independent
2012vacancy status
Rentalvacancy 2012
For–rent vacant units as% of the sum offor–rent vacant unitsand renter–occupiedunits in a metro areain 2012
6.944 2.291 6.784 2.243 15.179
Homeownervacancy 2012
For–sale vacant units as %of the sum of for–salevacant units andowner–occupied unitsin a metro area in 2012
1.922 0.670 1.806 0.588 3.876
2012 to 2018 vacancy changeRental vacancy
change 2012to 2018
Percentage point changefrom 2012 to 2018 inrental vacancy rate
�0.759 1.978 �0.843 �6.578 4.667
Homeownervacancychange 2012to 2018
Percentage point changefrom 2012 to 2018 inhomeownervacancy rate
�0.439 0.591 �0.446 �1.701 0.857
Relative balance of new housing and job growthJob growth Growth rate of number of
jobs between 2012 and2018 in a metro areaas % of number in2012 (not annualized)
10.418 6.557 9.461 �4.863 28.070
SF permit growth Summed annualsingle–family (SF)building permits from2010 through 2015(2–year lag applied) ina metro area as % ofbase year 2012households(not annualized)
3.382 2.103 2.873 0.729 9.471
MFpermit growth
Summed annualmultifamily (MF)building permits from2010 through 2015(2–year lag applied) ina metro area as % ofbase year 2012households(not annualized)
1.625 1.233 1.356 0.034 7.170
(continued)
10 D. MYERS ET AL.

Table 1. Continued.Variable Definition Mean SD Median Min. Max.
Turnover and vacancy chainsLocal
homebuyingchange
Percentage point changefrom 2012 to 2018 inlocal owner householdmobility rate as % ofall households in ametro area
0.722 0.661 0.780 �1.043 2.646
Non-localhomebuyingchange
Same for non–local (fromoutside metro area)owner mover
0.353 0.321 0.305 �0.304 1.595
Non-localrentingchange
Same for non–local (fromoutside metro area)renter mover
�0.001 0.603 �0.007 �1.465 1.434
Legacy conditions in 2012Total population
2012 (Millions)Count of total population
in 2012 (in millions)2.067 2.689 1.122 0.444 19.778
Age 20–24 shareofpopulation20þ 2012
Age 20–24 population as% of the age 20þpopulation in a metroarea in 2012
9.782 1.595 9.608 6.411 19.866
Age 25–39 shareofpopulation20þ 2012
Age 25–39 population as% of the age 20þpopulation in a metroarea in 2012
27.093 3.508 27.689 16.934 37.135
Age 40–59 shareofpopulation20þ 2012
Age 40–59 population as% of the age 20þpopulation in a metroarea in 2012
37.211 2.030 37.634 27.634 41.648
Married share ofage 25–39population2012
Married population as %of the age 25–39population in a metroarea in 2012
47.994 5.616 47.433 37.464 72.641
People of colorshare of age25–39population2012
Population other thannon-Hispanic white as% of the age 25–39population in a metroarea in 2012
40.591 17.818 37.320 7.390 94.940
Median HHincome 2012(thousanddollarsin 2018$)
Median household incomein 2012 (in thousanddollars inflation-adjusted to 2018$)
57.670 10.717 54.696 36.967 98.433
30%þ rentburden 2012
Renter households whopay more than 30percent of income forrent as % of the totalrenter households in ametro area in 2012
49.819 4.258 49.118 41.795 60.182
2012 to 2018 demographic andsocioeconomic changesChange in age
25–39 shareof population
Percentage point changefrom 2012 to 2018 inage 25–39 share of theage 20þ population
0.630 1.077 0.748 �3.632 2.918
Change inmarried shareof age25–39population
Percentage point changefrom 2012 to 2018 inmarried share of theage 25–39 population
�2.306 2.840 �2.783 �11.319 4.808
(continued)
HOUSING STUDIES 11

2.4. Hypotheses to be tested
The overarching thesis is that the housing crisis during the recovery decade followingthe Great Recession has restricted opportunities for residential mobility relative togrowing demand, and the resulting friction of competition delays moves or discour-ages searching for replacement housing, with the end result that aggregate mobilitytrends downward. These aggregate consequences of the housing crisis for local mobil-ity have not been tested and require specific hypotheses for multiple aspects .
2.4.1. Vacancies, job growth and housing constructionA common presumption is that the level of housing vacancies prevailing in 2012indicates a reservoir of available housing that can support subsequent housing mobil-ity. The initial vacancy rate and its changes through 2018 also should indicate the‘tightness’ of local housing markets and how easily households can relocate. The fol-lowing hypotheses are offered:
H1(a): The vacancy rate in 2012 is expected to have a positive association with thesubsequent trend in local residential mobility.
H1(b): Metro areas where rental and homeowner vacancy rates have declined by greaterdegree from 2012 to 2018 (grown “tighter”) are expected to have greater declinesin mobility.
H1(c): The expected effect for renter mobility should be more strongly linked to therental vacancy rate than the homeowner rate.
Main factors in balancing supply and demand we have posited are the rates of jobgrowth and new construction. This pairing is our primary measure to reflect housingshortages, with job growth indicating potential increase in overall demand, whilegreater permitting of new construction indicates the offsetting effect of supplyresponse. We posit a stronger association with mobility coming through apartment
Table 1. Continued.Variable Definition Mean SD Median Min. Max.
Change inpeople ofcolor share ofage25–39Population
Percentage point changefrom 2012 to 2018 inpeople of color shareof the age25–39 population
2.092 1.769 1.979 �2.751 6.338
Growth rate ofmedian HHincome(2018$)
Growth rate of medianhousehold income(inflation-adjusted to2018$) between 2012and 2018 in ametro area
10.575 6.433 10.041 �2.315 33.241
30%þ rentburden 2018
Renter households whopay more than 30percent of income forrent as % of the totalrenter households in ametro area in 2018
47.720 4.439 46.767 37.209 61.239
Notes: Job growth is based on Bureau of Labor Statistics (BLS)’s employment data while permit growth is based onCensus Bureau’s Building Permits Survey (BPS). Other variables are based on ACS IPUMS microdata.
12 D. MYERS ET AL.

construction, which serves renters who have much higher propensity to move, thanthrough single-family home construction, which serves mainly homeowners.
H2(a): Greater job growth indicates housing markets are increasing the competition forhomes, thus associated negatively with metro average mobility.
H2(b): Greater permitting of units in apartment construction indicates greater supplyfor renters relative to the growing competition, thus associated positively with aggregaterenter or household mobility.
H2(c): A similar, but much weaker effect is expected from the permitting of single-family units.
2.4.2. Turnover and vacancy chainsAdditional supply effects on household mobility are created through turnover in theexisting stock that generates opportunities for movers. The transition by some home-buyers from renting initiates a rental vacancy chain, depending on the local/nonlocalorigins of the buyer, as explained earlier.
H3(a): A growing number of mover owners who originated locally indicates a greatersupply of local rental vacancies through chains of turnover in the existing stock, whichsuggests a positive association with the trend of renters’ mobility.
H3(b): Local movers who originate from outside the metro area (whether owners orrenters) will create no vacancy chains to benefit local renters and therefore theirgrowing number is expected to have no effect on the rate of local renters’ mobility.
2.4.3. Demographic factors in growing demandMore than just job growth can build demand. The force of the Millennial generationgrowing into early adulthood11 is especially important, as discussed earlier. For thisanalysis we compare a fixed age group that has high propensity for both mobility andrenting. By 2018 the age group of 25 to 39 accounted for 47.0% of all renter movers,even though its share of adult population was only 28.6%. (Graphic comparison ofage group shares is supplied in Figure C, supplementary material, for US and sum ofthe 100 metros.) Rental demand would be intensified, all other things equal, in met-ros with a greater share of population in the 25–39 age group, and each metro’syoung adult concentration visible in 2012 is very persistent through the decade.12
Holding supply constant, the result of the greater friction of competition would be todepress the future trend in mobility in a metro.
H4: Given that higher concentration of young adults in a metro intensifies rentalcompetition, metros with a higher share of population ages 25–39 in 2012 are expectedto experience greater reduction in mobility trend from 2012 to 2018. In contrast,concentrations in other ages are not expected to raise competition and depress mobility.
2.4.4. AffordabilityA prominent feature of the housing crisis is high cost-burden relative to incomes, theproblem of affordability. Some individuals might wish to move to lower-cost accom-modations, or be forced out by inability to pay the rent, but in the aggregate, metroswith greater prevalence of high cost-burdens would offer fewer opportunities for
HOUSING STUDIES 13

escaping high burdens. In such high-burden metros households could be discouragedfrom risking a move from their current shelter, and this could depress the aggregatemobility rate.
H5: Controlling for factors of supply and demand that undergird affordability problems,we expect that residence in metros with greater prevalence of high cost-burden shouldcarry negative association with the aggregate rental mobility trend.
3. Findings
The downturn in the renter mobility rate is represented by percentage-point changesestimated between 2012 and 2018 in the mobility rate of locally-originated movers inthe 100 largest metros in the US. Regression estimates using OLS techniques are pre-sented in five models of the observed associations with the dependent variable, firstfor renter mobility, our primary focus (Table 2), and also for total household movers(Table A, supplementary material).
3.1. Vacancy rates as sole predictor
Vacancy rates are commonly used indicators of supply conditions and we addressthem first. Model 1 estimates the mobility trend solely by use of vacancy rates forrenters and owners in 2012 and the changes to 2018. Overall, Model 1 affords a verypoor fit with the mobility trend and has little explanatory power, as indicated by theR-square of 0.03. Once supply and demand factors are included in the additionalmodels, the vacancy rates and their changes fail to exhibit any significant associationwith the renter mobility trend. A similar poor fit for vacancy rates is obtained whenthe overall household mobility trend is estimated (Table A, supplementary material).Hypothesis 1 is rejected.
3.2. Employment and housing growth
Our preferred alternative to measuring housing shortage impacts on mobility trendsis by introducing employment and housing construction, measured as the percentageincrease over the period 2012 to 2018. Construction is indicated by building permitsrecorded two years prior, entered separately for units in multifamily structures (apart-ments) and single-family units (Model 2). Greater job growth carries negative associ-ation, as expected (Hypothesis 2a), because it signifies growing demand and morecompetition for housing. Conversely, greater construction of apartments bears astrongly positive association with renter mobility, as expected (H2b). No significantassociation is found with single-family construction, as expected (H2c). These effectsof new construction and job growth are shown in the standardized estimates to beamong the strongest predictors of mobility trend (Table B, supplementary material).Overall, Model 2, with R-square 0.171, adds 13.9% explanation of variation in mobil-ity decline, five times as much as the simple vacancy rate model. Very similar find-ings obtain for the all-households mobility model (Model 2 of Table A,supplementary material). Because they include homeowners, mobility rates are much
14 D. MYERS ET AL.
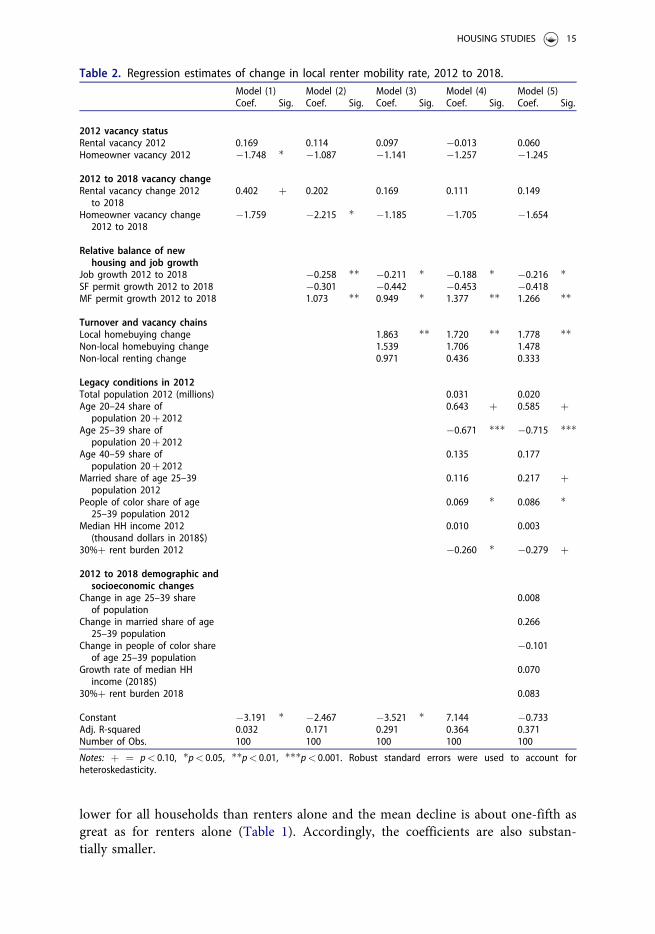
lower for all households than renters alone and the mean decline is about one-fifth asgreat as for renters alone (Table 1). Accordingly, the coefficients are also substan-tially smaller.
Table 2. Regression estimates of change in local renter mobility rate, 2012 to 2018.Model (1) Model (2) Model (3) Model (4) Model (5)Coef. Sig. Coef. Sig. Coef. Sig. Coef. Sig. Coef. Sig.
2012 vacancy statusRental vacancy 2012 0.169 0.114 0.097 �0.013 0.060Homeowner vacancy 2012 �1.748 � �1.087 �1.141 �1.257 �1.245
2012 to 2018 vacancy changeRental vacancy change 2012
to 20180.402 þ 0.202 0.169 0.111 0.149
Homeowner vacancy change2012 to 2018
�1.759 �2.215 � �1.185 �1.705 �1.654
Relative balance of newhousing and job growth
Job growth 2012 to 2018 �0.258 �� �0.211 � �0.188 � �0.216 �SF permit growth 2012 to 2018 �0.301 �0.442 �0.453 �0.418MF permit growth 2012 to 2018 1.073 �� 0.949 � 1.377 �� 1.266 ��
Turnover and vacancy chainsLocal homebuying change 1.863 �� 1.720 �� 1.778 ��Non-local homebuying change 1.539 1.706 1.478Non-local renting change 0.971 0.436 0.333
Legacy conditions in 2012Total population 2012 (millions) 0.031 0.020Age 20–24 share of
population 20þ 20120.643 þ 0.585 þ
Age 25–39 share ofpopulation 20þ 2012
�0.671 ��� �0.715 ���
Age 40–59 share ofpopulation 20þ 2012
0.135 0.177
Married share of age 25–39population 2012
0.116 0.217 þ
People of color share of age25–39 population 2012
0.069 � 0.086 �
Median HH income 2012(thousand dollars in 2018$)
0.010 0.003
30%þ rent burden 2012 �0.260 � �0.279 þ
2012 to 2018 demographic andsocioeconomic changes
Change in age 25–39 shareof population
0.008
Change in married share of age25–39 population
0.266
Change in people of color shareof age 25–39 population
�0.101
Growth rate of median HHincome (2018$)
0.070
30%þ rent burden 2018 0.083
Constant �3.191 � �2.467 �3.521 � 7.144 �0.733Adj. R-squared 0.032 0.171 0.291 0.364 0.371Number of Obs. 100 100 100 100 100
Notes: þ ¼ p< 0.10, �p< 0.05, ��p< 0.01, ���p< 0.001. Robust standard errors were used to account forheteroskedasticity.
HOUSING STUDIES 15

3.3. Home buyers and rental vacancy chains
Mobility is also enhanced by opportunities opened in existing housing. Homebuyersfrequently leave behind rental units when they move, which can trigger rentalvacancy chains. Estimates in Model 3 find increases in the locally initiated ownermovers carry a significant association (positive) with changes in the renter mobilitytrend, as expected (H3a). Homebuyers from out of metro bear no significant associ-ation, also as expected (H3b). The model R-square is increased to 0.291, adding12.0% more explanation of the variation in the renter mobility trend. All hypothesesare strongly supported.
Note: the all-households mobility model (comprising both renter and owner mov-ers) is over-identified when home buying is included as an explanatory variable inModels 3, 4 and 5, and thus those are not reported in Table A, supplemen-tary material.
3.4. Demographic factors increasing competition
Young-adult ages swelled by the Millennial generation were identified above as poten-tial contributors to increased competition and downturn in renter mobility (H4).Model 4 introduces a set of measures for demographic composition, including keyage groups, the share married, and the share comprised of people of color,13 as wellas the total population size of the metro. These measures describe legacy conditionsin metros observed in 2012 at the beginning of the study interval, and they are sup-plemented in Model 5 with a set of corresponding changes over the interval (none ofwhich are significant). As a whole, Model 4 adds appreciably to the explanation ofthe rental mobility trend, increasing the R-square to 0.364.
The demographic factor with the most prominent impact is the young adult con-centration, as expected (H4). A population share ages 25 to 39 that is 1.0 percentagepoint larger is associated with a more negative rental mobility trend, specifically,�0.671 greater decline in the rental mobility rate. Net of all other factors, the share ofadult population concentrated in ages 25 to 39 contributes 10.3% to the explanationof variation in mobility decline.14 The aggregate depressant effect on mobility of theyoung adult concentration is very substantial, given that one standard deviation ofthat concentration is 3.51 (Table 1), suggesting young adult metros could have mobil-ity declines over two percentage points greater than the average decline of �4.91.
This seeming paradox that more young adults, typically high-propensity rentermovers, could lead to lower aggregate mobility was noted earlier and deservesunpacking. Metros’ rental mobility rate was positively correlated (r¼ 0.439, panel a ofFigure D, supplementary material) with their young adult population share in 2012,but that correlation began to break down by 2018 (r¼ 0.220, panel b). It is not thelevel of renter mobility that is negatively related to the young adult share, rather themetros’ trend in mobility from 2012 to 2018 (r¼ –0.237, panel c). The metros withthe highest young adult share declined the most in their renter mobility. For example,the youth magnet of Austin, Texas, has a 2012 young adult share of 34.5% and rentermobility decline of �7.85, while an older metro, Pittsburgh, Pennsylvania, has a shareof 23.4% and mobility decline of �2.26.15
16 D. MYERS ET AL.

3.5. Affordability
A final hypothesis is that lack of affordability in metros, indicated by prevailing highcost-burdens, could depress local mobility rates. Models 4 and 5 introduce the stand-ard rent burden indicator, the share of renters in a metro paying more than 30% ofincome on housing. The significant negative coefficient for 2012 cost burden inModel 4 (�0.260) is consistent with our expectations (H5) that affordability con-straints in metro areas could discourage turnover by out-movers. Net of all other fac-tors, prevailing affordability contributes 3.9% to the explanation of variation inmobility decline.16
4. Discussion
Deeper consideration is needed about the procedures used for discovery, as well asinferences and key assumptions. Fruitful directions for further research arealso discussed.
4.1. Mobility as a vacancy process
Residential mobility connects people and housing in a circular process, with house-holds acting interdependently within the same year as both producers and consumersof vacancies, all of which makes it challenging to determine causation. However, thesharp downturn in local mobility, combined with the rapid post-2010 changes inhousing, economy, and population, provide unique opportunity for investigating thelinkages. Strategy adopted here is guided by a logical conceptual model (if not for-mally causal) of sequential actions of vacancy creation and occupancy, and throughthat interpreting estimated associations between factors. The base of the model isemployment growth and permits for new construction during the 6-year study inter-val, while most other variables are set at their initial year conditions. The majorexception is layering on the growth in homebuying over the interval, which subtractssome potential renter movers but stimulates even more vacancies to support otherrental moves.
We have theorized that residential mobility is centered in a temporal process ofturnover. The failure of standard vacancy rates to correlate with the mobility trend(H1 rejected) reflects a temporal mismatch in units of observation: vacancy rates aremeasured at a spot in time, while aggregate mobility rates capture moves (and vacan-cies filled) over the past year, and the mobility trend reflects changes in the flow ofvacancies filled over time. The relations are also reciprocal: If fewer vacancies areavailable for movers to occupy, fewer households will turnover their current homesfor others to move into. Establishing a logical order is essential for interpretation:units must be built before they can be occupied for the first time, which enablesvacancy chains to start. However, the vast majority of moves occur in the existingstock and in that sector out-moves must occur before in-moves. Any shortfall of sup-ply to meet growing needs could disrupt expected turnover in existing units.
HOUSING STUDIES 17

4.2. Supply as vacancy generation
The concept of ‘housing shortage’ is difficult to define or measure, because itdepends on both supply and demand, requiring two blades of the scissors. Therecent decade has witnessed both abnormally slow increases in supply and swellingincreases in demand focused on rental housing. But new ‘supply’ extends to morethan just construction. Observed in the middle of the last decade, 14 out of 15movers in the US landed in existing units that had been turned over by previousoccupants, as we noted earlier, yet the 1 out of 15 moves landing in newly-builtunits were essential for facilitating at least a portion of the other moves throughvacancy chains of turnover (H2). The estimations found that new construction,and offsetting employment growth, together accounted for 13.9% of variation inthe renter mobility trend.
Turnover can be increased by more than just new construction. In the case ofrenters’ mobility, the estimations showed that the rate of newly moved homeownersalso was important (adding another 12.0% to explanation of variance). We presumethat roughly half left behind a vacant rental unit17 and, if the homebuyers originatedin the local metro, they launched a new, local rental vacancy chain. Underscoringexpectations from theory (H3), homebuyers or renters from out of town did not evi-dence this supply benefit.
Affordability problems create an opposite force in metros, suppressing mobilityby reducing vacancy generation through slower turnover of units. Evidence is theexpected (H5) finding of a negative association between the mobility trend andprevalence of higher rent-burdens in metros. This negative effect, surviving con-trols for supply shortages and demographic changes, suggests that renters may bediscouraged by the market outlook from giving up their current unit and seekingdifferent shelter. A possible countervailing effect is that renters with higher rentburdens have occupancies that are more precarious, thus increasing their odds ofmoving out. However, that threat to individual tenants (increasing mobility)appears to be swamped by the broader negative effects of affordability on out-mov-ers who see only higher costs in alternatives available in the market at large. Thisreluctance to risk turnover not only directly curtails mobility by the outmovingtenant but also indirectly blocks inmovers by discouraging turnover to createvacancies for would-be replacements to follow.
Still an alternative view might be that it is the in-mover who is blocked initially bythe affordability hurdle, and it might be said that this negated mobility is what createsthe negative association with prevailing rent burden. Although that might be true ofan individual mover, another mover with higher payment capability simply willoccupy instead or the landlord will lower the asking rent. In the aggregate, what isblocked is creation of the vacancy in the first place, invoking our principle above:out-movers must occur before in-movers. Two or more moves may be lost as a result:the first tenant who does not move out, the replacement in-mover, and possiblyothers. In essence, metros with higher incidence of excessive rent burden suffer fromforegone vacancy chains.
18 D. MYERS ET AL.

4.3. Mobility impeded by friction of competition
The second blade of the scissors for housing shortage is provided by growth indemand, indicated in our analysis by the rate of employment growth and also bydemographic change. When growth of demand approaches the volume of availablevacancies, there is surely increasing competition among prospective movers. Wehave posited that the resulting ‘friction of competition’ leads to delay and discour-agement among prospective movers. As excess demand spills over one year to thenext, the cumulative result is foregone moves and a downward trending mobil-ity rate.
In this paper we have only the first clues of evidence in support of these supposi-tions. We see the negative effect of employment growth on the mobility trend, thenegative effect of affordability (high rent burden), and the positive effect of homebuy-ing (loosening rental competition). The negative effect of a high share of young adultsis especially revealing, because this would ordinarily signal higher potential mobility,but it also signals greater competition for rentals in a city, hence greater delay unlesssupply increases commensurately.
4.4. Questions deserving further research
The foregoing conclusions are based largely on inference. Key assumptions are madeabout movers’ desires and viewpoints. The foremost need is for direct investigationabout people’s aspirations to move, their feelings of delay or postponement, and theirdiscouragement. How conscious are urban actors of these sentiments and what causesdo they blame? And what harms do they fear as a result of the friction of competi-tion? For lack of interview or survey data we cannot know how renter householdsactually feel about this mobility constriction and slowing of their mobil-ity adjustment.
Continued research is also needed about the downturn in mobility and housingachievements among the Millennials (Moos et al., 2018; Myers, 2016). Is this a newlifestyle preference (Moos, 2016), a generational inequity (Mawhorter, 2018), or atemporary spatial pause (Lee, 2020)? What of the role of evictions or displacement inforcing higher than expected mobility rates? How has the trend of mobility by youngadults fared in particular cities of inquiry, or in different nations?
More generally, the method framing of the present study with the AmericanCommunity Survey has opened a new window on dynamics of residential mobility,emphasizing the competitive supply and demand context in which individuals seeknew residences. Multi-level models could well incorporate these macro conditionswhile investigating individual housing choices. Specific improvements and extensionsare needed in the metro-level model as well. Can suitable instruments be devised totest for causality underlying the estimated associations? Further inquiry is especiallyneeded with regard to the homeownership transition that is so poorly understood inthe recovery period following the Great Recession.
The process of turnover and vacancy chains knits together the housing market anddeserves more scrutiny, including the rental chains stemming from new homebuyers.
HOUSING STUDIES 19

If ‘vacancy shortage’ is the problem, what are the ways more can be stimulated? Howunequally is the mobility slowdown distributed across race or income groups, andhow might vacancy opportunities be shared more fairly?
5. Conclusion
This study finds a new era of residential mobility in the US began in the wake of theGreat Recession. The unexpected, sharp mobility decline at the local level underscoresthe call for renewed research attention to local mobility, as opposed to migration,and need for retheorizing (Coulter et al., 2016). Unlike longer distance movers, whoare predominantly employment driven, local movers express housing motivations.The natural question is how might the new downturn in mobility be entwined in thepost-recession housing crisis?
Analysis has not unraveled specific causal threads in the circular process, but the-ory and logic guide interpretation. Our findings underscore, not surprisingly, a strongrole of diminished housing construction, but also a strong role of reduced homeown-ership transition for triggering fewer rental vacancy chains. These two supply factorsappear to constrict the flow of vacancies available to support renters’ local mobility.In essence, the interpretation is this was a crisis of ‘vacancy shortage’ that sup-pressed mobility.
Mobility decline also was associated with demographic shifts caused by the largeMillennial generation in prime ages for moving. Our inference is that this magni-fied rental demand and combined with supply limitations to increase the ‘frictionof competition’. We surmise that this friction prolonged the search process and ledto delays, discouragement and foregone moves. Metros with a heavier concentra-tion of young adults in their late 20 s and 30 s ended up with greater mobilitydeclines.
A declining number of vacancy chains amid growing demand further reducesincentives for turnover in the existing stock. Once commenced, the cumulative effectis for local housing markets to spiral toward ‘gridlock’ where many fewer people canfind an opening to move. Mobility constriction deserves new recognition as anotherfacet of the broad housing crisis that has diminished housing well-being.
Acknowledgment
The support of the Randall W. Lewis Foundation is gratefully acknowledged.
Disclosure statement
No potential conflict of interest was reported by the authors.
Funding
Randall Lewis Foundation.
20 D. MYERS ET AL.

ORCID
JungHo Park http://orcid.org/0000-0002-0726-5699Seongmoon Cho http://orcid.org/0000-0001-6354-0934
References
Acolin, A., Goodman, L. S. & Wachter, S. M. (2016) A renter or homeowner nation?,Cityscape, 18, pp. 145–158.
Been, V., Ellen, I. G. & O’Regan, K. (2019) Supply skepticism: Housing supply and affordabil-ity, Housing Policy Debate, 29, pp. 25–40.
Byrne, M. (2020) Generation rent and the financialization of housing: A comparative explor-ation of the growth of the private rental sector in Ireland, the UK and Spain, HousingStudies, 35, pp. 743–765.
Caldera S�anchez, A. & Andrews, D. (2011) Residential mobility and public policy in OECDcountries, OECD Journal: Economic Studies, 2011, pp. 1–22.
Cooke, T. J. (2013) Internal migration in decline, The Professional Geographer, 65, pp.664–675.
Coulter, R., Ham, M. V. & Findlay, A. M. (2016) Re-thinking residential mobility: Linkinglives through time and space, Progress in Human Geography, 40, pp. 352–374.
Desmond, M. & Shollenberger, T. (2015) Forced displacement from rental housing: Prevalenceand neighborhood consequences, Demography, 52, pp. 1751–1772.
Dieleman, F. M., Clark, W. A. V. & Deurloo, M. C. (2000) The geography of residential turnover intwenty-seven large US metropolitan housing markets, 1985–95, Urban Studies, 37, pp. 223–245.
Dietz, R. (2020) A Decade of Home Building: The Long Recovery of the 2010s. Eye on Housing,National Association of Home Builders.
Frost, R. (2020) Are Americans Stuck in Place? Declining Residential Mobility in the US.Research Brief. (Cambridge, MA: Joint Center for Housing Studies, Harvard University)
Fry, R. (2017) Americans Are Moving at Historically Low Rates, in Part Because MillennialsAre Staying Put, Factank Brief. Pew Research Center.
Gabriel, S. A. & Nothaft, F. E. (2001) Rental housing markets, the incidence and duration ofvacancy, and the natural vacancy rate, Journal of Urban Economics, 49, pp. 121–149.
Haurin, D. R. (2016) The future course of U.S. homeownership rates, Cityscape, 18, pp.159–162.
Immergluck, D. (2018) Renting the dream: The rise of single-family rentership in the sunbeltmetropolis, Housing Policy Debate, 28, pp. 1–16.
Johnson, J. E. & Schulhofer-Wohl, S. (2019) Changing patterns of geographic mobility and thelabor market for young adults, Journal of Labor Economics, 37, pp. S199–S241.
Joint Center for Housing Studies of Harvard University. (2019). The state of the nation’s hous-ing. (Cambridge, MA: JCHS).
Kristof, F. (1965) Housing policy goals and the turnover of housing, Journal of the AmericanInstitute of Planners, 31, pp. 232–245.
Landis, J. D. (2021) Fifty years of local growth management in America, Progress in Planning,145, p. 100435.
Lee, H. (2020) Are Millennials coming to town? Residential location choice of young adults,Urban Affairs Review, 56, pp. 565–604.
Marullo, S. (1985) Housing opportunities and vacancy chains, Urban Affairs Quarterly, 20, pp.364–388.
Masnick, G. (2013) Different data sources tell different stories about declining geographic mobil-ity. Housing Perspectives, Joint Center for Housing Studies, Harvard University.
Mawhorter, S. L. (2018) Boomers and their boomerang kids: Comparing housing opportunitiesfor Baby Boomers and Millennials in the United States, in M. Moos, D. Pfeiffer, & T.Vinodrai (Eds) The Millennial City, pp. 143–152 (New York, NY: Routledge).
HOUSING STUDIES 21

Molloy, R., Smith, C. L. & Wozniak, A. (2017) Job changing and the decline in long-distancemigration in the United States, Demography, 54, pp. 631–653.
Moos, M. (2016) From gentrification to youthification? The increasing importance of youngage in delineating high-density living, Urban Studies, 53, pp. 2903–2920.
Moos, M., Pfeiffer, D. & Vinodrai, T. (2018) The Millennial city, shaped by contradictions, inM. Moos, D. Pfeiffer, & T. Vinodrai (Eds) The Millennial City, pp. 3–11 (New York, NY:Routledge).
Mulder, C. H. (2006) Population and housing: A two-sided relationship, DemographicResearch, 15, pp. 401–412.
Myers, D. & Park, J. (2019) A Constant Quartile Mismatch Indicator of Changing RentalAffordability in U.S. Metropolitan Areas, 2000 to 2016, Cityscape: A Journal of Policy andDevelopment, 21, pp. 163–200.
Myers, D., Lee, H. & Simmons, P. (2020) Cohort Insights into Recovery of MillennialHomeownership after the Great Recession, Journal of Housing Economics, 47, pp. 1–17.
Myers, D. (2016) Peak Millennials: Three reinforcing cycles that amplify the rise and fall ofurban concentration by Millennials, Housing Policy Debate, 26, pp. 928–947.
Novy-Marx, R. (2009) Hot and cold markets, Real Estate Economics, 37, pp. 1–22.Palm, M. & Whitzman, C. (2020) Housing need assessments in San Francisco, Vancouver, and
Melbourne: Normative science or neoliberal alchemy?, Housing Studies, 35, pp. 771–794.Payne, S. (2020) Advancing understandings of housing supply constraints: Housing market
recovery and institutional transitions in British speculative housebuilding, Housing Studies,35, pp. 266–289.
Pittini, A., Dijol, J., Tumbull, D. & Whelan, M. (2019) The state of housing in the EU 2019.Housing Europe, the European Federation of Public.
Rosen, K. T. & Smith, L. B. (1983) The price-adjustment process for rental housing and thenatural vacancy rate, American Economic Review, 63, pp. 779–786.
Ruggles, S., Flood, S., Goeken, R., Grover, J., Meyer, E., Pacas, J. & Sobek, M. (2020) IPUMSUSA: Version 10.0 [Dataset] (Minneapolis, MN: IPUMS).
Sands, G. & Bower, L. L. (1976) Housing Turnover and Housing Policy: Case Studies ofVacancy Chains in New York State (New York: Praeger).
Scottish Government. (2011). Homes Fit for the 21st Century: The Scottish Government’sStrategy and Action Plan for Housing in the Next Decade: 2011–2020. (Edinburgh, Scotland:Scottish Government).
Wilson, W. & Barton, C. (2020) Tackling the under-supply of housing in England. CommonsLibrary Briefing (London: House of Commons of the UK).
22 D. MYERS ET AL.