HOUSING PROFILE
242
GHANA HOUSING PROFILE
Transcript of HOUSING PROFILE
GHANAH O U S I N G P R O F I L E
Copyright © United Nations Human Settlements Programme (UN-HABITAT), 2011
An electronic version of this publication is available for download from the UN-HABITAT web-site at http://www.unhabitat.org
All rights reserved
United Nations Human Settlements Programme (UN-HABITAT) P.O. Box 30030, GPO Nairobi 0010, KenyaTel: +254 20 762 3120Fax: +254 20 762 3477Web: www.unhabitat.org
DISCLAIMER
The designations employed and the presentation of the material in this report do not imply the expression of any opinion whatsoever on the part of the United Nations Secretariat concerning the legal status of any country, territory, city or area or of its authorities, or concerning the delimitation of its frontiers or boundaries.
Reference to names of firms and commercial products and processes does not imply their endorsement by the United Nations, and a failure to mention a particular firm, commercial product or process is not a sign of disapproval.
Excerpts from the text may be reproduced without authorization, on condition that the source is indicated.
HS Number: HS/131/11E
ISBN Number (Volume): 978-92-1-132416-7
ISBN Number (Series): 978-92-1-131927-9
Layout: Gideon Mureithi/UNON
Cover photos: Graham Tipple
Printing: UNON, Publishing Services Section, Nairobi, ISO 14001:2004-certified.
GHANA H O U S I N G P R O F I L E
ii
GHANA HOUSING PROFILE
ACKNOWLEDGMENTS
HOUSING PROFILE CORE TEAM
Supervisor: Claudio Acioly Jr.
Task Manager: Christophe Lalande, Channe Oguzhan
Habitat Programme Officers in Ghana: Victoria Abankwa and Abena Ntori
Principal Author: Graham Tipple
National Profile Team: Oteng Ababio, Emmanuel Abeka, Irene Addo, Samuel Biitir, Ohene Sarfoh.
Contributors: Yahaya Yakubu, Director of Housing, Ministry of Water Resources, Works and Housing and Theresa Tuffour, Deputy Director of Housing, Ministry of Water Resources, Works and Housing. UN-HABITAT also acknowledges the contribution of all the individuals and organisations whose names are listed in the annex section and who contributed to the consultative workshops and interviews.
Programme Management and Assistance: Christina Power and Helen Musoke
Financial Support: The Participatory Slum Upgrading Programme (PSUP), a joint initiative by the European Commission and the African, Caribbean and Pacific (ACP) Secretariat and implemented by UN-HABITAT. Sponsorship by International Development Research Centre (IDRC) and SIDA-Swedish International Development Agency.
Research Support: Nigel Browne, Institute of Housing and Urban Development Studies (IHS).
iiiFOREWORD
FOREWORD
FOREWORD
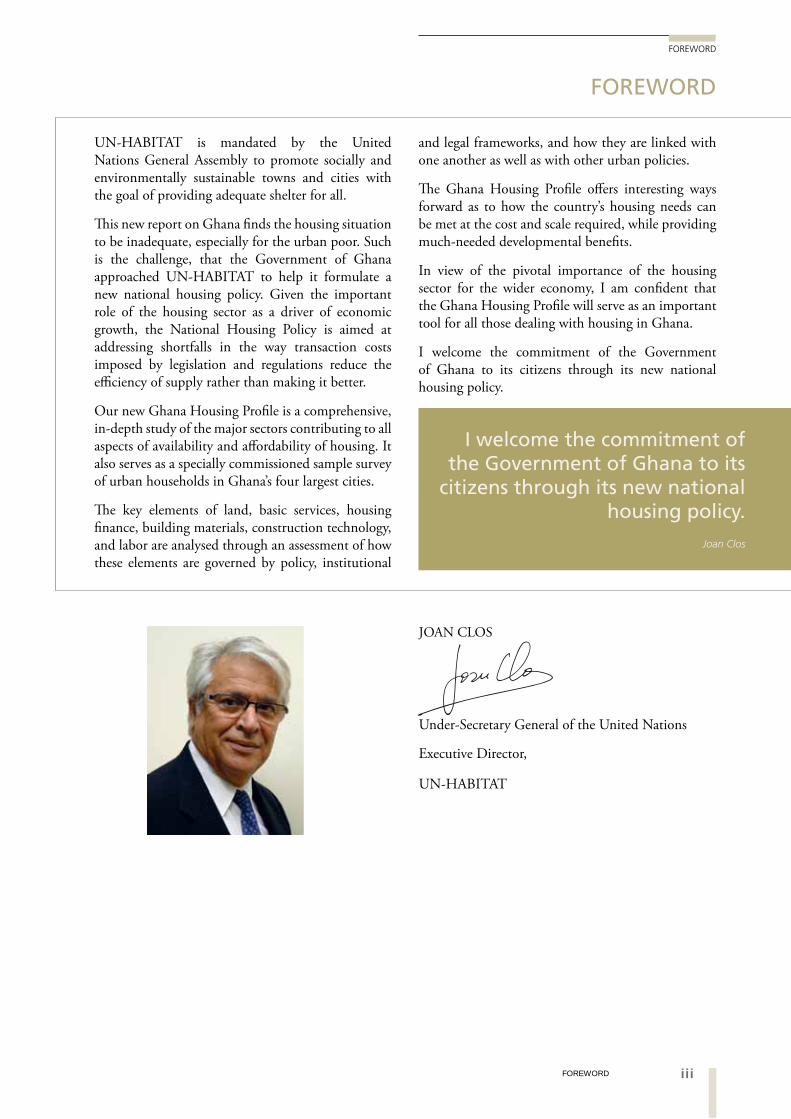
JOAN CLOS
Under-Secretary General of the United Nations
Executive Director,
UN-HABITAT
Joan Clos
I welcome the commitment of the Government of Ghana to its
citizens through its new national housing policy.
UN-HABITAT is mandated by the United Nations General Assembly to promote socially and environmentally sustainable towns and cities with the goal of providing adequate shelter for all.
This new report on Ghana finds the housing situation to be inadequate, especially for the urban poor. Such is the challenge, that the Government of Ghana approached UN-HABITAT to help it formulate a new national housing policy. Given the important role of the housing sector as a driver of economic growth, the National Housing Policy is aimed at addressing shortfalls in the way transaction costs imposed by legislation and regulations reduce the efficiency of supply rather than making it better.
Our new Ghana Housing Profile is a comprehensive, in-depth study of the major sectors contributing to all aspects of availability and affordability of housing. It also serves as a specially commissioned sample survey of urban households in Ghana’s four largest cities.
The key elements of land, basic services, housing finance, building materials, construction technology, and labor are analysed through an assessment of how these elements are governed by policy, institutional
and legal frameworks, and how they are linked with one another as well as with other urban policies.
The Ghana Housing Profile offers interesting ways forward as to how the country’s housing needs can be met at the cost and scale required, while providing much-needed developmental benefits.
In view of the pivotal importance of the housing sector for the wider economy, I am confident that the Ghana Housing Profile will serve as an important tool for all those dealing with housing in Ghana.
I welcome the commitment of the Government of Ghana to its citizens through its new national housing policy.
iv
GHANA HOUSING PROFILE
1
TABLE OF CONTENTS
ACKNOWLEDGEMENTS II
FOREWORD III
LIST OF TABLES XI
LIST OF FIGURES XV
LIST OF BOXES XVIII
LIST OF ACRONYMS XIX
EXECUTIVE SUMMARY XXII
INTRODUCTION XXII
THE POLICY AND INSTITUTIONAL FRAMEWORK XXII
THE KEY PLAYERS IN HOUSING XXII
THE CURRENT HOUSING STOCK XXII
NEED FOR HOUSING IN URBAN GHANA XXII
LAND XXIII
FINANCE XXIII
INFRASTRUCTURE XXIV
CONSTRUCTION AND BUILDING MATERIALS XXV
THE HOUSING MARKET XXVI
THE WAY FORWARD XXVI
1. INTRODUCTION 2
1.1 THE ECONOMY 3
1.2 STRUCTURAL ADJUSTMENT AND HOUSING 5
1.3 HOUSING CONDITIONS 5
1.4 POVERTY IN GHANA 6
1.5 HOMELESSNESS 7
1.6 POPULATION GROWTH AND DISTRIBUTION 8
THE URBAN POPULATION DISTRIBUTION 11
THE URBAN HOUSING SECTOR PROFILE INTRODUCED 12
1.7 METHODOLOGY 13
THE SAMPLE SURVEY 14
1.8 BASIC DATA FOR GHANA 15
2. THE POLICY AND INSTITUTIONAL FRAMEWORKS 17
2.1 THE POLICY ENVIRONMENT 17
HOUSING POLICY WITHIN THE NATIONAL DEVELOPMENT AGENDA 17
BUDGETS AS POLICY STATEMENTS IN HOUSING 19
2.2 THE LEGAL AND REGULATORY FRAMEWORKS RELATED TO HOUSING 19
LAND OWNERSHIP 19
2
vTABLE OF CONTENTS
TABLE OF CONTENTS
3
4
LAND MANAGEMENT 20
LAND USE PLANNING 20
DEVELOPMENT CONTROL 20
HOUSING FINANCE / FORECLOSURE/ MORTGAGE 20
CAPITAL GAINS 21
PROPERTY RIGHTS / INHERITANCE 21
PROMOTION OF (RESIDENTIAL) REAL ESTATE DEVELOPMENT 21
RENT 22
CONSTRUCTION 22
2.3 EFFECTS OF GOVERNMENT INITIATIVES AND INCENTIVES TO BUILD HOUSING 22
2.4 A BRIEF HISTORY OF HOUSING POLICY IN GHANA 23
2.5 CROSS-CUTTING ISSUES 25
3. KEY PLAYERS IN HOUSING 30
3.1 INTRODUCTION 30
3.2 TRADITIONAL SECTOR PLAYERS 30
INDIVIDUAL HOUSEHOLDS AND SMALL-SCALE CONTRACTORS 30
TRADITIONAL LEADERS & CUSTOMARY LANDOWNERS 30
3.3 FORMAL SECTOR PLAYERS 31
THE INSTITUTIONAL GAP BETWEEN POLICY-MAKING AND IMPLEMENTATION 31
PUBLIC SECTOR PLAYERS 32
THE PUBLIC SECTOR DELIVERY SYSTEM 33
OTHER PUBLIC SECTOR HOUSING PLAYERS 33
3.4 NON-GOVERNMENT ORGANIZATIONS 35
THE FACILITATORS 36
THE BENEFICIARY–PARTICIPANT NGOS AND CBOs 38
3.5 PRIVATE SECTOR 39
SMALL DEVELOPERS AND HOUSEHOLDERS 39
BROKERAGE/ ESTATE AGENTS 39
GREDA/ PROPERTY DEVELOPERS 40
PUBLIC-PRIVATE PARTNERSHIPS 41
3.6 INTERNATIONAL DEVELOPMENT ORGANIZATIONS 41
3.7 SWOT ANALYSIS OF THE INSTITUTIONAL FRAMEWORK AND ACTORS IN THE HOUSING PROCESS 42
4. CURRENT HOUSING STOCK IN GHANA 45
4.1 INTRODUCTION TO HOUSING CONDITIONS IN URBAN GHANA 45
vi
GHANA HOUSING PROFILE
6
5
4.2 HOUSING TYPOLOGY AND MATERIALS 45
TYPOLOGY BY BUILDING MATERIALS 48
4.3 TRADITIONAL AND INFORMAL HOUSING STOCK 48
4.4 OCCUPANCY AND TENURE FORMS 49
OCCUPANCY RATES 49
ROOMS OCCUPIED 51
TENURE 52
4.5 HOUSING COSTS AND AFFORDABILITY 52
4.6 CURRENT AFFORDABILITY OF OWNER-OCCUPIED AND RENTED HOUSING 55
4.7 CROSS-CUTTING ISSUES: CAPACITY BUILDING, GENDER, HIV-AIDS, YOUTH 55
5. NEED FOR HOUSING IN URBAN GHANA 58
5.1 HOUSING NEED ESTIMATES RECENTLY USED IN GHANA 58
5.2 HOUSEHOLD CHARACTERISTICS 59
5.3 INCOME AND ABILITY TO PAY 60
WORKING OUT AFFORDABILITY 62
5.4 HOUSING DEMAND OF RENTERS BY OCCUPANCY RATES 63
5.5 SPECIAL GROUPS DEMAND: GENDER,HIV- AIDS, YOUTH 63
5.6 ESTIMATING HOUSING NEED 64
5.7 HOUSING NEED ACCORDING TO HOUSEHOLD SIZES 65
NEED AND THE SHORTFALL IN 2000 65
ESTIMATING NUMBER OF ROOMS PRESENT IN 2010 65
5.8 NEEDS OF NEW URBAN HOUSEHOLDS 66
HOUSING NEED BASED ON ONE DWELLING PER HOUSEHOLD 68
5.9 COMPARING GHANA WITH MALAWI 68
6. URBAN LAND SUPPLY 70
6.1 LAND TENURE SYSTEMS AND THEIR IMPACTS ON THE URBAN LAND MARKETS 70
6.2 INTERESTS IN LAND 70
6.3 FORMAL LAND SYSTEMS 71
FORMAL/OFFICIAL LAND SUPPLY 71
THE LAND REGISTRATION PROCESSES AND PROCEDURES 71
LAND TITLE REGISTRATION 72
LAND DISPUTES AND LITIGATION 73
viiTABLE OF CONTENTS
TABLE OF CONTENTS
7
6.4 CUSTOMARY LAND SYSTEMS 73
CUSTOMARY LAND HOLDINGS AND SUPPLY 73
6.5 INFORMAL LAND SYSTEMS 77
SQUATTING 77
6.6 LAND PRICES 77
DRINK MONEY 77
PLOT SIZES 78
TRANSACTION COSTS AND THEIR IMPACT ON LAND DOCUMENTATION 78
PROPORTION OF LAND COST TO EVENTUAL HOUSING DEVELOPMENT COSTS 78
6.7 KEY PLAYERS IN THE LAND SECTOR 78
CHIEFS AND CUSTOMARY LAND HOLDERS 78
CUSTOMARY LANDS SECRETARIATS (CLS) 79
OFFICE OF THE ADMINISTRATOR OF STOOL LANDS 79
THE LANDS COMMISSION 79
MINISTRY OF LANDS AND FORESTRY 80
METROPOLITAN, MUNICIPAL AND DISTRICT ASSEMBLIES (MMDAS) 81
TOWN AND COUNTRY PLANNING DEPARTMENT 81
NON-GOVERNMENTAL ORGANIZATIONS (NGOS) 81
6.8 LEGAL AND REGULATORY FRAMEWORKS GOVERNING LAND SUPPLY 81
NATIONAL LAND AND DECENTRALIZATION POLICIES AND STATE LAND MANAGEMENT 84
LAND USE PLANNING PROCESS AND MECHANISMS FOR ALLOCATING LAND FOR RESIDENTIAL USE 85
MECHANISMS FOR ALLOCATING LAND FOR RESIDENTIAL USE 86
6.9 CAPACITY NEEDS ASSESSMENT 86
LAND REQUIRED TO ACCOMMODATE NEW HOUSING 86
6.10 CROSS-CUTTING ISSUES: GENDER, HIV-AIDS, YOUTH 87
6.11 BRIEF CONCLUSION 87
6.12 ANNEX TO CHAPTER 6. PROCESSES IN LAND ADMINISTRATION IN URBAN GHANA 88
6.13 SWOT ANALYSIS OF THE LAND SECTOR 89
LAND DOCUMENTATION 88
DEEDS REGISTRATION 89
CUSTOMARY PROCEDURES FOR ACCESSING LAND IN FOUR CITIES 94
7. HOUSING FINANCE 98
7.1 INTRODUCTION 98
viii
GHANA HOUSING PROFILE
7.2 THE FINANCIAL SECTOR 99
7.3 INSTITUTIONAL, LEGAL AND REGULATORY FRAMEWORKS GOVERNING HOUSING FINANCE 99
7.4 FINANCING PRIVATELY SUPPLIED HOUSING 101
SELF-FINANCING 101
MORTGAGES 102
GHANA HOUSING FINANCE ASSOCIATION (GHFA) 104
RENTS AS HOUSING FINANCE 105
7.5 HOUSING FUNDS AND GOVERNMENT SUBSIDIES 106
SUBSIDIES TO GREDA 106
BUDGETARY ALLOCATIONS FOR HOUSING 106
7.6 RESOURCE MOBILISATION AND SAVINGS SYSTEMS 106
MICROFINANCE INSTITUTIONS 106
NGOS AND COMMUNITY BASED ORGANISATIONS’ HOUSING INITIATIVES FOR THE URBAN POOR 108
7.7 CAPACITY NEEDS ASSESSMENT 111
7.8 CROSS-CUTTING ISSUES: GENDER, HIV-AIDS, YOUTH 112
7.9 SWOT ANALYSIS OF THE HOUSING FINANCE SECTOR 113
7.10 BRIEF CONCLUSION 114
8. INFRASTRUCTURE FOR URBAN HOUSING 116
8.1 BASIC URBAN INFRASTRUCTURE 116
8.2 INSTITUTIONAL, LEGAL AND REGULATORY FRAMEWORKS GOVERNING INFRASTRUCTURE PROVISION: ACTORS AND SERVICES PROVIDED 116
WATER 116
SANITATION AND WASTE DISPOSAL 116
POWER SUPPLY 118
ROADS AND ACCESS 118
8.3 INFRASTRUCTURE FINANCE 119
8.4 SUPPLY AND COVERAGE OF INFRASTRUCTURE NETWORKS 120
8.5 WATER SUPPLY 120
8.6 SANITATION 123
8.7 REFUSE DISPOSAL 126
8.8 STORM AND WASTE WATER DRAINAGE 127
8.9 ELECTRICITY 128
8.10 ROADS AND STREET LIGHTING 129
8
ixTABLE OF CONTENTS
TABLE OF CONTENTS
8.11 CROSS-CUTTING ISSUES: GENDER, HIV-AIDS, YOUTH 129
8.12 CAPACITY NEEDS ASSESSMENT 131
8.13 BRIEF CONCLUSION 133
8.14 SWOT ANALYSIS OF INFRASTRUCTURE FOR HOUSING 134
9. CONSTRUCTION AND BUILDING MATERIALS 137
9.1 THE CONSTRUCTION SECTOR IN A NUTSHELL 137
9.2 INSTITUTIONAL, LEGAL AND REGULATORY FRAMEWORKS GOVERNING THE CONSTRUCTION SECTOR 138
KEY PLAYERS IN THE CONSTRUCTION SECTOR 138
CONTROL OF DEVELOPMENT 139
9.3 ORGANISATION: ACTORS, SUPPLIERS, CONTRACTORS AND SERVICE PROVIDERS 141
THE GHANA REAL ESTATE DEVELOPERS ASSOCIATION (GREDA) 141
SUPPLIERS AND MANUFACTURERS 141
LABOUR 142
TRAINING 142
9.4 BUILDING MATERIALS: TRADITIONAL AND INDUSTRIALISED PRODUCTION 143
COMPACTED LATERITE, ATAKPAMÉ OR SWISH 144
HOW APPROPRIATE ARE TRADITIONAL BUILDING MATERIALS? 148
ENVIRONMENTAL SUSTAINABILITY OF TRADITIONAL BUILDING MATERIALS AND CONSTRUCTION TECHNOLOGY 150
9.5 BUILDING MATERIAL COSTS 150
9.6 COSTS OF BUILDING IN GHANA 150
9.7 CAPACITY NEEDS ASSESSMENT 152
9.8 CROSS-CUTTING ISSUES: GENDER, HIV-AIDS, YOUTH 155
9.9 BRIEF CONCLUSION 155
9.10 SWOT ANALYSIS OF THE CONSTRUCTION INDUSTRY 157
10. DYNAMICS OF THE HOUSING MARKET 160
10.1 THE STRUCTURE AND FUNCTIONING OF THE MARKET 160
THE TRADITIONAL NON-MARKETABILITY OF HOUSING 160
10.2 FORMAL AND INFORMAL HOUSING MARKETS 161
PROPORTION OF FORMAL VERSUS INFORMAL MARKETS 162
10
9
x
GHANA HOUSING PROFILE
HOUSE COST TO INCOME RATIO 163
HOUSE PRICES 164
OTHER FORMS OF HOUSING PROVISION 164
10.3 HOUSING MARKET REGULATION 166
10.4 MARKET ISSUES 168
INVESTMENT BY EXPATRIATE GHANAIANS 168
FRONT-END FINANCE FOR BUILDERS 169
TRANSACTION COSTS 169
LIKELY DEVELOPMENTS IN THE MARKE 170
10.5 CAPACITY NEEDS ASSESSMENT 170
10.6 BRIEF CONCLUSION 171
11. THE WAY FORWARD IN HOUSING PROVISION 174
11.1 ENABLING THE SUPPLY OF ENOUGH HOUSING 174
INSTITUTIONAL FRAMEWORK 174
LAND DELIVERY FOR HOUSING 175
HOUSING FINANCE 176
INFRASTRUCTURE PROVISION FOR HOUSING 177
THE RESIDENTIAL CONSTRUCTION INDUSTRY AND BUILDING MATERIALS, LABOUR AND EMPLOYMENT 178
THE HOUSING MARKET 180
11.2 INCREASING INCOMES FOR IMPROVED AFFORDABILITY 180
11.3 REDUCING THE COST OF BUILDING 181
11.4 CONCLUSIONS 181
APPENDIX 183
1. HOUSING SECTOR PERFORMANCE CONSTRAINTS MATRIX FOR GHANA 183
2. HOUSING SECTOR PERFORMANCE PRIORITY ACTION PLAN 189
BIBLIOGRAPHY 195
ANNEX 205
11
xiTABLES
TABLES
TABLES
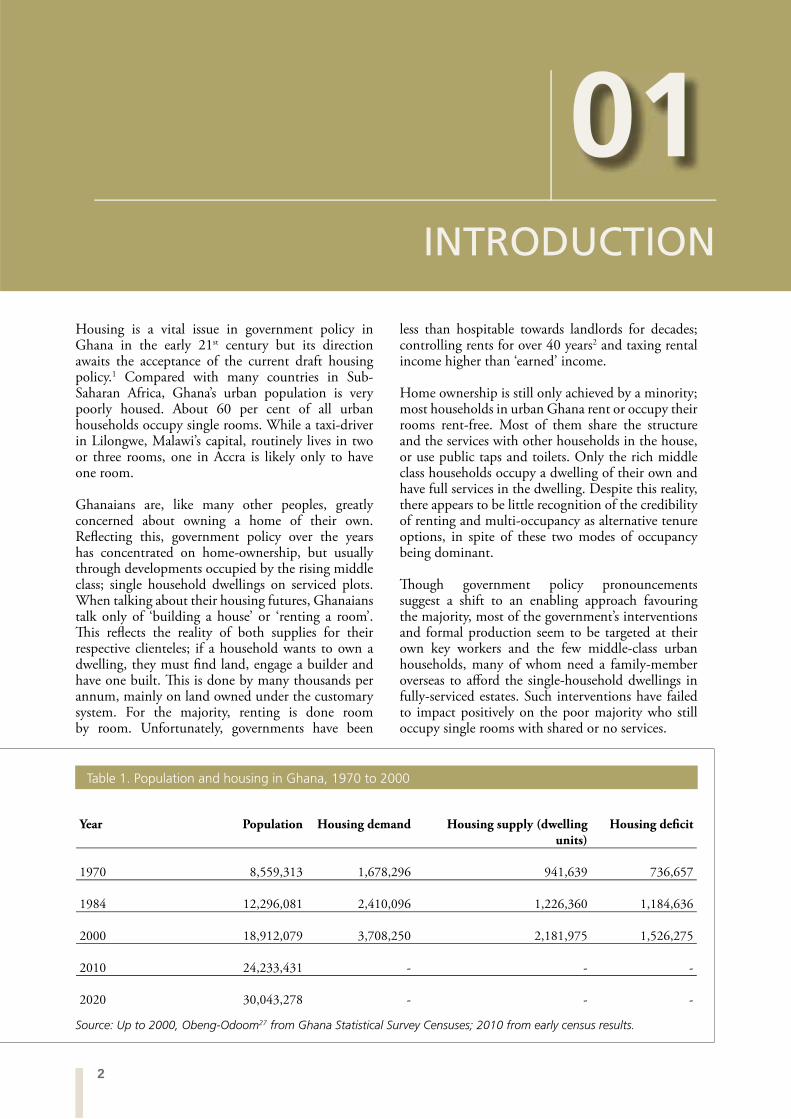
TABLE 1. POPULATION AND HOUSING IN GHANA, 1970 TO 2000 2
TABLE 2. GHANA STATISTICS FROM THE GLOBAL REPORT ON HUMAN SETTLEMENTS, 2009 3
TABLE 3. THE TEN LARGEST CENTRES OF URBAN POPULATION 3
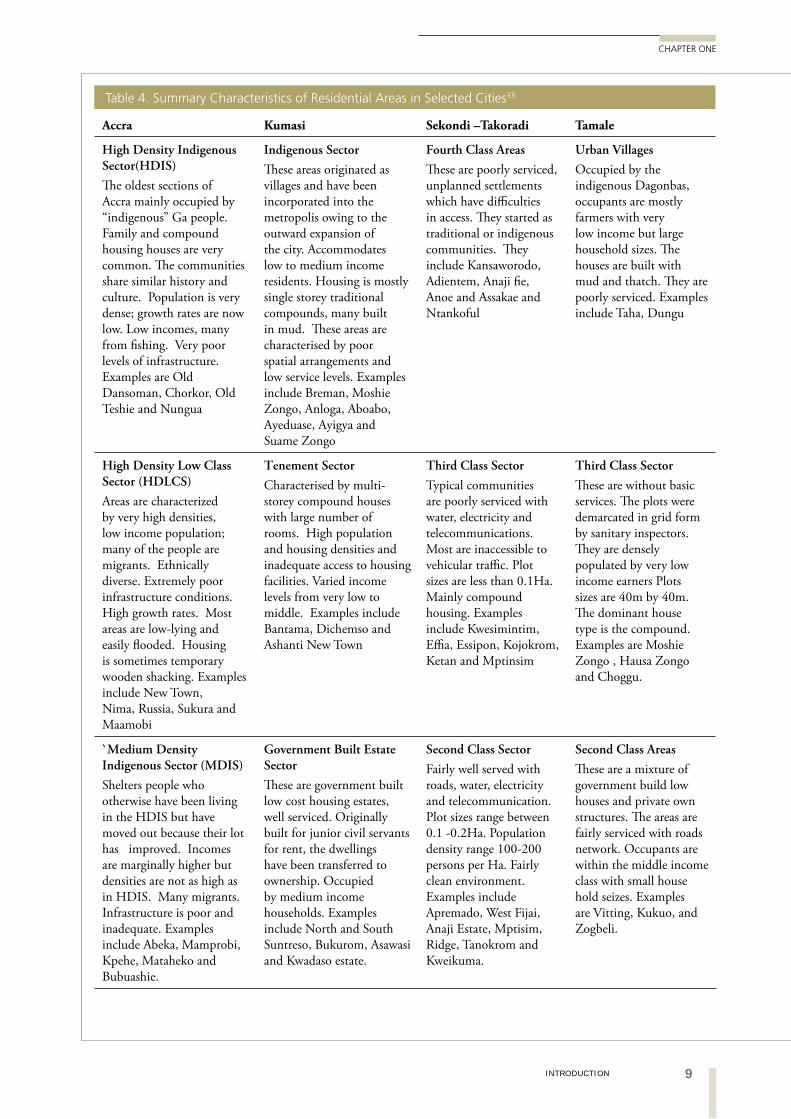
TABLE 4. SUMMARY CHARACTERISTICS OF RESIDENTIAL AREAS IN SELECTED CITIES 9
TABLE 5. SAMPLING DISTRIBUTION 11
TABLE 6. BASIC FACTS AND FIGURES ON GHANA 12
TABLE 7. CONSUMER PRICE INDEX FOR ALL ITEMS AND HOUSING RELATED ITEMS, 2000-2010 14
TABLE 8. TIMELINE OF GHANA’S POST-COLONIAL URBAN DEVELOPMENT AND HOUSING POLICIES, PROGRAMMES AND PROJECTS 26
TABLE 9. PUBLIC SECTOR HOUSING PROJECT DELIVERY CIRCUITS 34
TABLE 10. PRIME BUILDING COSTS AND THE GROWTH 36 OF SHC HOUSE PRICE,1980-1998
TABLE 11. REAL ESTATE DEVELOPERS WITH INTERNATIONAL OWNERSHIP 40
TABLE 12. TYPES OF HOUSING IN URBAN GHANA 45 (PERCENTAGES OF HOUSEHOLDS OCCUPYING)
TABLE 13. CHARACTERISTICS OF COMPOUND LIVING IN 47 FOUR CITIES (PERCENTAGES OF HOUSEHOLDS)
TABLE 14. ADVANTAGES AND DISADVANTAGES 48 OF COMPOUND LIVING IN FOUR CITIES
TABLE 15. HOUSEHOLD BY OUTSIDE WALL MATERIAL USED IN 48 THE DWELLING IN URBAN GHANA (PERCENTAGES)
TABLE 16. HOUSEHOLDS BY MAIN FLOOR MATERIAL USED IN 49 THE DWELLING IN URBAN GHANA (PERCENTAGES)
TABLE 17. HOUSEHOLD BY MAIN ROOF MATERIAL USED IN 50 THE DWELLING IN URBAN GHANA (PERCENTAGES)
TABLE 18. INDICATORS OF ROOM AND HOUSING 51 OCCUPANCY (SQUARE METRES)
TABLE 19. MEAN AREAS PER PERSON CALCULATED 51 IN DIFFERENT WAYS IN GLSS
TABLE 20. MEAN NUMBER OF ROOMS OCCUPIED BY HOUSEHOLDS 52 IN THE 2010 SMALL SURVEY OF CITIES
TABLE 21. ROOMS OCCUPIED BY HOUSEHOLDS, URBAN 52 GHANA FROM GLSS 5 (PERCENTAGES)
TABLE 22. HOUSEHOLDS BY TENURE (PERCENTAGES) 53
TABLE 23. TENURE IN THE 2010 SMALL SURVEY OF CITIES (PERCENTAGES) 53
TABLE 24. OWNER OF THE RENTED OR RENT-FREE DWELLING (PERCENTAGES) 53
TABLE 25. CHARACTERISTICS OF RENTERS IN FOUR CITIES, 2010 (PERCENTAGES) 54
TABLE 26. MONTHLY EXPENDITURE ON HOUSING AND 55 MAINTENANCE IN THE 2010 SAMPLE SURVEY OF CITIES (HIGHEST RENT AND LOWEST RENT SECTORS)
TABLE 27. RECENT ESTIMATES OF HOUSING STOCK AND NEED, ALL OF GHANA 59
TABLE 28. HOUSEHOLD SIZES IN 2000, URBAN GHANA (THOUSANDS) 59
xii
GHANA HOUSING PROFILE
xii TABLES
TABLE 29. MEAN HOUSEHOLD SIZES IN THE 2010 SMALL SURVEY OF CITIES 60
TABLE 30. HOUSEHOLD AND PER CAPITA ANNUAL INCOME AND EXPENDITURE 60 (2005-06) INDEXED TO 2010 BY CPI FOR ALL ITEMS (GHC)
TABLE 31. MEAN ANNUAL EXPENDITURE OF HOUSEHOLDS 60 BY TENURE, INDEXED TO 2010 (GHC)
TABLE 32. MEAN ANNUAL HOUSEHOLD EXPENDITURE IN THE 2010 SMALL 61 SURVEY OF CITIES (GHC)
TABLE 33. TYPES OF HOUSING IN URBAN GHANA BY ANNUAL HOUSEHOLD 61 EXPENDITURE OF OCCUPANTS, INDEXED FOR 2010 (GHC)
TABLE 34. MEAN ANNUAL HOUSEHOLD EXPENDITURES IN FOUR CITIES; 62 RENTERS AND HOUSEHOLDS LIVING IN COMPOUNDS (GHC)
TABLE 35. AFFORDABILITY USING MEAN RENTERS’ INCOME 63 FROM GLSS 5, INDEXED TO 2010 (US$)
TABLE 36. MEAN AFFORDABILITY FOR RENTERS FROM THE 63 HOUSING SECTOR PROFILE’S SAMPLE SURVEY (US$)
TABLE 37. MEAN AFFORDABILITY USING THE LOWEST EXPENDITURE 63 AREAS FROM THE HOUSING SECTOR PROFILE’S SAMPLE SURVEY (US$)
TABLE 38. HOW CROWDED WOULD HOUSEHOLDS BE IN THEIR 64 DEMAND LEVEL OF ROOMS (RENTER HOUSEHOLDS)?
TABLE 39. ESTIMATED POPULATION AND HOUSEHOLDS 65 IN URBAN GHANA, 2000 TO 2020
TABLE 40. NUMBER OF ROOMS PER HOUSEHOLD REQUIRED 70 AT THREE OVERCROWDING THRESHOLDS (2, 2.5 AND 3 PERSONS PER ROOM), URBAN GHANA IN 2000 (PERCENTAGES)
TABLE 41. ESTIMATED NUMBER OF ROOMS AVAILABLE 67 IN URBAN GHANA IN 2010 (‘000S)
TABLE 42. NUMBER OF ROOMS REQUIRED BY EXTRA HOUSEHOLDS 67 FROM 2000 IN URBAN GHANA, 2010 TO 2020
TABLE 43. NUMBER OF ROOMS REQUIRED OVERALL 67 (SHORTFALL AT 2000 PLUS NEW HOUSEHOLDS) IN URBAN GHANA, 2000 TO 2020 (MILLIONS)
TABLE 44. NUMBER OF ROOMS REQUIRED OVERALL BY 2020 IN URBAN 68 GHANA LESS THE ESTIMATED SUPPLY 2000-2010 (MILLIONS)
TABLE 45. RATE OF PROVISION NEEDED TO CLEAR THE 68
BACKLOG OF ROOMS IN TEN YEARS AND PROVIDE ROOMS FOR NEW URBAN HOUSEHOLDS
TABLE 46. POLICIES GOVERNING THE STATE (FORMAL) SYSTEM 71
TABLE 47. SUMMARY OF DEED REGISTRATION PROCESS 72
TABLE 48. FUNCTIONING OF THE CUSTOMARY LAND MARKET 75
TABLE 49. DRINK MONEY IN VARIOUS CITIES FOR PERI-URBAN 79 100’ X 100’ PLOTS (30M X 30M), 2010
TABLE 50. OPEN MARKET LAND VALUES, ACCRA (2008) 80
TABLE 51. PRICES OF LAND PER ACRE IN ACCRA BY LOCATION, 1995-2005 80
TABLE 52. PRICES OF LAND PER ACRE IN ACCRA AND KUMASI, 1995-2005 81
TABLE 53. TRANSACTION FEES ASSOCIATED WITH LAND DOCUMENTATION 82 HANDLED BY PUBLIC & VESTED LANDS MANAGEMENT DIVISION
TABLES
xiiiTABLES
TABLES
TABLES
TABLES
TABLE 54. TRANSACTION FEES ASSOCIATED WITH LAND 83 DOCUMENTATION HANDLED BY SURVEYING AND MAPPING DIVISION – LANDS COMMISSION
TABLE 55. PROPORTION OF LAND COST TO HOUSING UNIT COST 83
TABLE 56. PERCEIVED SECURITY OF TENURE IN THE LOWEST STANDARD NEIGHBOURHOODS* IN THE 2010 SMALL SURVEY OF CITIES 84
TABLE 57. AMOUNT OF LAND NEEDED AT CURRENT PLOT SIZES WITH BUNGALOWS OR COMPOUNDS (THOUSANDS) 85
TABLE 58. CAPACITY GAPS IN THE LAND SECTOR (STAFF AND COMPUTER COUNT) 88
TABLE 59. PROCEDURES FOR ACCESSING LAND FROM CUSTOMARY OWNER 94
TABLE 60. INTEREST RATES: ACTUAL PERCENTAGE RATES (APR)* AND 99 AVERAGE INTEREST (AI) ON DIFFERENT LOANS IN SELECTED BANKS
TABLE 61. SOURCES OF HOUSING FINANCE IN SOME SELECTED LOW 100 INCOME URBAN COMMUNITIES IN GHANA (PERCENTAGES)
TABLE 62. SOURCES OF FINANCE USED BY HOUSING ESTATE DEVELOPERS 101
TABLE 63. COSTS OF OBTAINING A MORTGAGE IN GHANA 102
TABLE 64. HFC BANK LOANS, 2006 AND 2007 (GHC) 103
TABLE 65. NUMBER AND LOAN PORTFOLIOS OF 107 MFIS IN GHANA (GHC THOUSANDS)
TABLE 66. THE INSTITUTIONAL CHARACTERISTICS OF HMF IN GHANA 108
TABLE 67. HFC BOAFO SUSU SAVINGS AND LOANS 110
TABLE 68. DISBURSEMENT AND PURPOSES OF LOANS FROM 112 THE GHAFUP FUND, APRIL 2005 – JULY 2010 (GH¢)
TABLE 69. THE PERFORMANCE OF THE GHAFUP FUND APRIL 2005 – JULY 2010 112
TABLE 70. THE KEY PLAYERS IN URBAN WATER REGULATION, 117 POLICY FORMULATION AND IMPLEMENTATION
TABLE 71. THE MAIN INSTITUTIONS RESPONSIBLE 118 FOR IMPLEMENTING ENVIRONMENTAL POLICY
TABLE 72. FINANCING WATER AND SANITATION IN GHANA. 120
TABLE 73. SOURCES OF URBAN WATER SUPPLY AND SERVICE COVERAGE 121 IN ACCRA, KUMASI, TAMALE, BOLGATANGA AND WA
TABLE 74. COST OF WATER SUPPLY BY THE REGISTERED WATER TANKERS (GHC). 124
TABLE 75. HOUSEHOLDS BY MAIN SOURCE OF DRINKING 125 WATER (PERCENTAGE FREQUENCIES)
TABLE 76. HOUSEHOLDS BY TYPE OF TOILET USED (PERCENTAGE FREQUENCIES) 126
TABLE 77. USER FEES PER TOILET VISIT IN ACCRA, KUMASI AND TAMALE (GHC) 127
TABLE 78. HOUSEHOLDS BY TYPE OF REFUSE DISPOSAL USED 128 (PERCENTAGE FREQUENCIES)
TABLE 79. WASTE GENERATION AND SERVICE COVERAGE IN 129 THE 5 LARGE CITIES IN GHANA.
TABLE 80. THE CHARACTERISTICS AND TYPES OF 132 URBAN ROADS IN ACCRA, KUMASI AND TAMALE.
TABLE 81. DOCUMENTATION POSSESSED BY HOUSE 139 OWNERS IN FOUR CITIES, 2010
xiv
GHANA HOUSING PROFILE
TABLE 82. DWELLINGS BUILT BY SELECTED 141 REAL ESTATE DEVELOPERS (2000-2006)
TABLE 83. SKILLED LABOUR CHARGE-OUT RATES, URBAN GHANA, JUNE 2010 143
TABLE 84. TYPES OF WALL MATERIALS USED IN 146 CONSTRUCTION IN THE VARIOUS URBAN CENTRES
TABLE 85. WALL IMPROVEMENTS USING LOCAL MATERIALS 149
TABLE 86. RENDERING METHOD AND LOCALLY AVAILABLE 150 MATERIALS AVAILABLE FOR WALL FINISHING
TABLE 87. COST OF SELECTED BUILDING MATERIALS IN GHANA 150
TABLE 88. CONSTRUCTION MATERIALS AND COSTS OF 153 YEBOAH’S THREE HOUSE TYPES
TABLE 89. APPROXIMATE CONSTRUCTION COSTS PER 154 SQUARE METRE IN URBAN GHANA, 2010 (GHC)
TABLE 90. COSTS OF CONSTRUCTING DWELLINGS BY 154 AREA IN THE AVAILABLE MATERIALS, IN 2010, ALL WITH SCREED FLOORS, AND INCLUDING 40 PER CENT ADDITIONAL FOR LAND AND INFRASTRUCTURE (US$)
TABLE 91. SQUARE METRES OF HOUSING AFFORDABLE AT 155 HC:Y=3 TO HOUSEHOLDS IN THE SAMPLE SURVEY OF 2010
TABLE 92. NUMBER OF WORK-MONTHS EMPLOYMENT 156 AND JOBS CREATED FROM FORMAL AND INFORMAL BUILDING TO CREATE 211,111 NEW DWELLINGS PER ANNUM
TABLE 93. INVESTMENT PERFORMANCE BY SUBMARKET 1992- 162 2007, PER CENT PER ANNUM
TABLE 94. CONTRIBUTION OF FORMAL SECTOR PLAYERS IN HOUSING SUPPLY 163
TABLE 95. NUMBER OF RECORDED MORTGAGE TRANSACTIONS, 2001 – 2009. 163
TABLE 96. ANNUAL RENTS FOR HOUSING ALLOCATED BY PARASTATAL ORGANIZATIONS (GHC) 165
TABLE 97. SELECTED HOUSE PRICES IN ACCRA IN 2007 165
TABLE 98. AFFORDABILITY ANALYSIS FROM KARLEY 166 ADJUSTED TO 2010 PRICES (GHC)
TABLE 99. RENT VALUE RANGES (GH¢) PER MONTH (2010) 167
TABLE 100. EMPLOYMENT STATUS OF OCCUPANTS OF HIGH- 168 INCOME HOUSING IN ACCRA (PERCENTAGES)
TABLES
xvFIGURES
FIGURES
xv
FIGURES
FIGURE 1 MAP OF GHANA 4
FIGURE 2. MAP OF ACCRA 5
FIGURE 3. MAP OF KUMASI 6
FIGURE 4. MAP OF SEKONDI-TAKORADI 7
FIGURE 5. MAP OF TAMALE 8
FIGURE 6. CONSUMER PRICE INDEX FOR ALL ITEMS AND 14 HOUSING RELATED ITEMS, 2000-2010 (2000=100)
FIGURE 7. THE PROCESS OF MAKING NATIONAL HOUSING POLICY 18
FIGURE 8. THE PROCESS OF ACHIEVING A BUILDING ERMIT 23
FIGURE 9. TRADITIONAL COMPOUND HOUSING 46 IN ABOABO, KUMASI (G TIPPLE)
FIGURE 10. PLAN OF A COMPOUND HOUSE (ROYAL 46 DANISH ACADEMY OF FINE ARTS)
FIGURE 11. TRADITIONAL MULTI-STOREY COMPOUNDS IN KUMASI, 46 WITH A NEW HIGH-RISE BEING ERECTED BEYOND (G TIPPLE)
FIGURE 12. BUNGALOW/ VILLA HOUSING, TUC ESTATE, KUMASI (G TIPPLE) 46
FIGURE 13. FLATS FROM THE 1960S IN TEMA (G TIPPLE) 47
FIGURE 14. LIFE IN THE COURTYARD OF A COMPOUND HOUSE 49 IN KUMASI (ROYAL DANISH ACADEMY OF FINE ARTS)
FIGURE 15. EXTENDED SHC BUNGALOWS IN SUNTRESO, KUMASI (G TIPPLE) 50
FIGURE 16. EXTENDING INTO THE STREET, ABOABO, KUMASI (G TIPPLE) 50
FIGURE 17. ROOMS OCCUPIED BY HOUSEHOLDS 52 IN URBAN GHANA (PERCENTAGES)
FIGURE 18. HOUSING AFFORDABILITY PYRAMID 56
FIGURE 19. AFFORDABILITY AT HC:YS OF 3 TO 5 FOR 64 DIFFERENT SAMPLES IN TABLES 35 AND 36 (IN US$)
FIGURE 20. NUMBER OF ROOMS PER HOUSEHOLD 66 REQUIRED, URBAN GHANA (PERCENTAGES)
FIGURE 21. SAMPLE OF PARCEL PLAN (S BIITIR) 72
FIGURE 22. SAMPLE OF A CADASTRAL PLAN (S BIITIR) 72
FIGURE 23. SAMPLE OF A SECTIONAL MAP (S BIITIR) 73
FIGURE 24. SQUATTERS ALONG THE RAILWAY LINE IN KUMASI (2008) (ROYAL DANISH ACADEMY OF FINE ARTS) 77
FIGURE 25. RESIDENTIAL LAND REQUIRED AT VARIOUS DENSITIES, 2000-2020 86 FIGURE 26. FLOW CHART OF THE GENERAL PROCESSES 88 IN LAND DOCUMENTATION AT THE LANDS COMMISSION
FIGURE 27. FLOW CHART OF THE PROCESSES OF REGISTERING 90 STATE LAND AT THE DEED REGISTRY
FIGURE 28. FLOW CHART OF THE PROCESSES OF REGISTRY STOOL/ 91 SKIN AND FAMILY LAND AT THE DEEDS REGISTRY
FIGURE 29. PROCESSES AND PROCEDURES FOR CONSENT 93 TO ASSIGNMENT, SUBLEASES AND MORTGAGES
FIGURE 30. STEPS FOR ACQUIRING LAND TITLE CERTIFICATE 94 (INDIVIDUAL AND CORPORATE BODIES/COMPANIES)
FIGURE 31. BLOCK SAVING (G TIPPLE) 101
xvi
GHANA HOUSING PROFILE
FIGURES
FIGURE 32. UNFINISHED HOUSING WITH ALL THE WALLS 105 ERECTED, PERIPHERAL ACCRA (G TIPPLE)
FIGURE 33. GREDA HOUSING (G TIPPLE) 105
FIGURE 34 THE CHF/ BOAFO LANDLORD FINANCE 111
FIGURE 35. INTERIOR OF A ONE ROOM DWELLING IN THE 113 SUF AMUI DJOR PROJECT (G TIPPLE)
FIGURE 36. INTERIOR OF A TWO ROOM DWELLING IN THE 113 SUF AMUI DJOR PROJECT (G TIPPLE)
FIGURE 37. PUBLIC STANDPIPE ON THE OUTSKIRTS OF ACCRA. (G TIPPLE) 122
FIGURE 38. A SHALLOW HAND DUG WELL IN DOME, ACCRA 123
FIGURE 39. A SMALL RIVER WHICH SERVES AS THE SOURCE OF WATER 123 FOR RESIDENTS OF OBLOGO, ACCRA (M. OTENG-ABABIO)
FIGURE 40. SUCH ‘CAT’S CRADLES’ OF PIPES MAKE POTABLE WATER 125 VULNERABLE TO CONTAMINATION AND INCREASE WATER AND REVENUE GENERATION LOSSES. (M. OTENG-ABABIO)
FIGURE 41. THE ADENTAN MUNICIPAL SECURITY COUNCIL UNCOVER 125 ILLEGAL WATER CONNECTION. (M. OTENG-ABABIO)
FIGURE 42. THE SMALL DOOR THROUGH WHICH THE BUCKET LATRINE 127 IS EMPTIED BY A CONSERVANCY WORKER (M. OTENG-ABABIO)
FIGURE 43. OPEN DEFECATION IN ACCRA (M. OTENG-ABABIO) 127
FIGURE 44. DUMPING IN PUBLIC PLACES IS COMMON 129 IN THE CITIES, ESPECIALLY AROUND DRAINAGE CHANNELS (BOTTOM RIGHT) (M OTENG-ABABIO)
FIGURE 45. FLOODING IN ACCRA (M OTENG-ABABIO) 130
FIGURE 46. A DRAIN FITTED IN THE NIMA UPGRADING 130 PROGRAMME (M OTENG-ABABIO)
FIGURE 47. FLOW DIAGRAM INDICATING HOW AN APPLICANT 131 IS CONNECTED TO ELECTRICITY SUPPLY
FIGURE 48. IMPROVISED BRIDGE CONNECTING CHEMUENA AND 131 SAIPA NEAR CHORKOR IN ACCRA (M OTENG-ABABIO)
FIGURE 49. SAMPLES OF AVAILABLE ROADS IN SOME 133 OF THE SUBURBS OF TAMALE (M OTENG-ABABIO)
FIGURE 50. ROADS LAID AHEAD OF DEVELOPMENT ARE 133 UNDER-USED FOR YEARS (G TIPPLE)
FIGURE 51. ANNUAL GROWTH RATES FOR THE CONSTRUCTION INDUSTRY 138
FIGURE 52. THE INFORMAL HOUSE BUILDING PROCESS (I APPEANNING ADDO) 140
FIGURE 53. CONSTRUCTION IN PERI-URBAN ACCRA (G TIPPLE) 142
FIGURE 54. TYPICAL GREDA HOUSING (G TIPPLE) 142
FIGURE 55. LATERITE BUILT AS ATAKPAMÉ (ROYAL 144 DANISH ACADEMY OF FINE ART)
FIGURE 56. HYDRAFORM BLOCKS (I APPEANING ADDO) 144
FIGURE 57. IN-SITU CONCRETE BEING CAST USING 145 WAWA FORMWORK (G TIPPLE)
FIGURE 58. BRICKS USED AS INFILL IN CONCRETE FRAMING (G TIPPLE) 145
FIGURE 59. MANUFACTURING SANDCRETE BLOCKS (G TIPPLE) 146
FIGURE 60. TIMBER MARKET, KUMASI (G TIPPLE) 147
xviiFIGURES
FIGURES
FIGURE 61. STEEL RODS FOR SALE (ROYAL DANISH ACADEMY OF FINE ARTS) 148
FIGURE 62. LAND DEGRADATION FROM STONE MINING 152 AT OYIBI (I APPEANING ADDO)
FIGURE 63. AFFORDABLE AREAS FOR HOUSEHOLDS IN THE FOUR SAMPLED CITIES AT HC:Y = 3 (2010) 154
FIGURE 64. ‘FOR SALE’ ADVERT OUTSIDE A HIGH-INCOME DWELLING (S BIITIR) 169
FIGURE 65. PRIVATE ESTATE AGENT ADVERTISING RENTAL UNITS (S BIITIR) 169
FIGURE 66. ADVERTISEMENT FOR A PRIVATE ESTATE AGENT 170 AND MEMBER OF GREMA (S BIITIR)
FIGURE 67. ‘OTUMFUO’ MANSION FOR SALE ON THE INTERNET 170
FIGURE 68. HOUSING AFFORDABILITY IN SUB-SAHARAN AFRICA 177
FIGURES
xviii
GHANA HOUSING PROFILE
BOX 1. DIFFICULTIES IN USING HOUSING DATA FOR URBAN GHANA 31
BOX 2. CUSTOMARY LAND ALLOCATION PROCESS 78
BOX 3. PROCESSES OF ACQUIRING A LEASE AND REGISTERING DEEDS
ON STATE AND STOOL VESTED LAND 90
BOX 4. PROCEDURES FOR REGISTERING STOOL, FAMILY AND INDIVIDUALS 91
LAND UNDER THE DEED REGISTRY
BOX 5. APPLICATION FOR CONSENT FOR ASSIGNMENTS/ 92 MORTGAGES/SUBLET
BOX 6. STEPS FOR ACQUIRING LAND TITLE CERTIFICATE 92
BOX 7. REGISTRATION OF TRANSFERS OF WHOLE OR PART OF LAND 93
BOX 8. REGISTRATION OF MORTGAGES, DISCHARGE AND 93 POWER OF ATTORNEY
BOX 9. STRUCTURE AND KEY STAKEHOLDERS OF MICROFINANCE IN GHANA 109
BOX 10 THE AMUI DJOR CO-OPERATIVE FLATS AT TALAKU, ASHAIMAN 110
BOX 11. ACHIEVEMENTS OF THE ROAD SECTOR 119 DEVELOPMENT PROGRAMME (RSDP)
BOX 12. SOME PROBLEMS FACING GWCL 121
BOX 13. PURC RECOMMENDED STANDARDS ON 122 ACCESSIBILITY OF WATER IN GHANA
BOX 14. THE PROCESS FOR CONNECTING TO A MAIN ELECTRICITY FACILITY 130
BOXES
xixACRONYMS
ACRONYMS
ACRONYMS
ACP AFRICAN CONCRETE PRODUCTSADMA ADENTA MUNICIPAL ASSEMBLY ADR ALTERNATIVE DISPUTE RESOLUTIONAESL ARCHITECTURAL AND ENGINEERING SERVICES LIMITEDAFD AGENCE FRANCAIS DE DEVELOPPMENTALUWORKS ALUWORKS GHANA LIMITEDAMA ACCRA METROPOLITAN ASSEMBLYAPR ANNUAL PERCENTAGE RATESASMA ASHIAMAN MUNICIPAL ASSEMBLY ATMA ACCRA-TEMA METROPOLITAN AREA AV AVERAGE INTERESTAVRL AQUA VITENS RAND LIMITEDBHC BANK FOR HOUSING AND CONSTRUCTIONBHOME BUY, OWN AND BUILD A HOMEBOG BANK OF GHANABRRI BUILDING AND ROADS RESEARCH INSTITUTEBSCP BRITISH STANDARD CODE OF PRACTICECBD CENTRAL BUSINESS DISTRICTCBOS COMMUNITY BASED ORGANISATIONSCCC COMMUNAL CONTAINER COLLECTIONCEB COMPRESSED EARTH BLOCKSCEPIL CENTRE FOR PEOPLE INTEREST LAWCHF COOPERATIVE HOUSING FOUNDATIONCLS CUSTOMARY LANDS SECRETARIATCOHRE CENTRE FOR HOUSING RIGHTS AND EVICTIONSCOLANDEF COMMUNITY LAND DEVELOPMENT FOUNDATIONCORS CONTINUOUS OPERATING REFERENCE SYSTEMCPP CONVENTIONAL PEOPLES PARTYCSIR COUNCIL FOR SCIENTIFIC AND INDUSTRIAL RESEARCH CUA CREDIT UNION ASSOCIATIONDFID DEPARTMENT FOR INTERNATIONAL DEVELOPMENTDUR DEPARTMENTS OF URBAN ROADS DVLA DRIVERS AND VEHICLES LICENSE AUTHORITY EC ENERGY COMMISSIONECG ELECTRICITY COMPANY OF GHANA EHD ENVIRONMENTAL HEALTH DEPARTMENT EPA ENVIRONMENTAL PROTECTION AGENCYFED-UP FEDERATION OF THE URBAN POORFGBS/FGBCL FIRST GHANA BUILDING SOCIETY / COMPANY LIMITEDFINSAP FINANCIAL SECTOR ADJUSTMENT PROGRAMMEFMO FINANCE FOR DEVELOPMENTFSAP FINANCIAL SECTOR ADJUSTMENT PROGRAMMEGDP GROSS DOMESTIC PRODUCTGEMA GA EAST MUNICIPAL ASSEMBLYGHACEM GHANA CEMENT MANUFACTURING COMPANYGHAMFIN GHANA MICROFINANCE INSTITUTIONS NETWORKGHAWLAT GHANA WOMEN LAND TRUSTGHC GHANA CEDISGIHOC GHANA INDUSTRIAL HOLDING COMPANYGIPC GHANA INVESTMENT PROMOTION COUNCILGLSS GHANA LIVING STANDARDS SURVEY GMA GHANA MEDICAL ASSOCIATIONGNA GHANA NEWS AGENCYGNAT GHANA NATIONAL ASSOCIATION OF TEACHERS GOG GOVERNMENT OF GHANAGPRS 1 GHANA POVERTY REDUCTION STRATEGY 1
xx
GHANA HOUSING PROFILE
ACRONYMS
GPRS 2 GROWTH AND POVERTY REDUCTION STRATEGY 2GREDA GHANA REAL ESTATE DEVELOPERS ASSOCIATIONGREMA GHANA REAL ESTATE MARKETERS ASSOCIATIONGRF GHANA ROAD FUNDGRIDCO GHANA GRID COMPANY LIMITEDGRNA GHANA REGISTERED NURSES ASSOCIATION GSB GHANA STANDARDS BOARDGSCP GHANA STANDARD CODE OF PRACTICE GSS GHANA STATISTICAL SERVICEGTZ GERMAN DEVELOPMENT SERVICEGWCL GHANA WATER COMPANY LIMITEDGWSA COMMUNITY WATER & SANITATION AGENCYHCM HOME COMPLETION MORTGAGEHEM HOME EQUITY MORTGAGEHFC HOME FINANCE COMPANYHFHG HABITAT FOR HUMANITYHH HOUSE-TO-HOUSEHIM HOME IMPROVEMENT MORTGAGEHM HOUSING THE MASSESHPM HOME PURCHASE MORTGAGEIDA INTERNATIONAL DEVELOPMENT AGENCYILO INTERNATIONAL LABOUR ORGANISATIONIMF INTERNATIONAL MONETARY FUNDIRS INTERNAL REVENUE SERVICEISSER INSTITUTE OF STATISTICAL AND SOCIAL ECONOMIC RESEARCHKFW GERMAN DEVELOPMENT BANKKMA KUMASI METROPOLITAN ASSEMBLY KNUST KWAME NKRUMAH UNIVERSITY OF SCIENCE AND TECHNOLOGYKVIP KUMASI VENTILATED IMPROVED PITLAP(U) LAND ADMINISTRATION PROJECT (UNIT)LGPCU LOCAL GOVERNMENT PROJECT COORDINATING UNITLI LEGISLATIVE INSTRUMENTLRD LAND REGISTRATION DIVISIONLVB LAND VALUATION BOARDMDAS MINISTRIES, DEPARTMENTS, AND AGENCIES MDBS MULTI-DONOR BUDGET SUPPORT MDG MILLENNIUM DEVELOPMENT GOALSMFEP MINISTRY OF FINANCE AND ECONOMIC PLANNINGMLGRD MINISTRY OF LOCAL GOVERNMENT AND RURAL DEVELOPMENTMMDAS METROPOLITAN, MUNICIPAL AND DISTRICT ASSEMBLIESMOE MINISTRY OF ENVIRONMENTMOFEP MINISTRY OF FINANCE AND ECONOMIC PLANNINGMOT MINISTRY OF TRANSPORTMOTI MINISTRY OF TRADE AND INDUSTRYMRH MINISTRY OF ROADS AND HIGHWAYS MTDP MEDIUM TERM DEVELOPMENT PLANMTEF MEDIUM TERM EXPENDITURE FRAMEWORKMTTU MOTOR TRAFFIC AND TRANSPORT UNITMWRWH MINISTRY OF WATER RESOURCES, WORKS AND HOUSINGNCA NATIONAL COMMUNICATIONS AUTHORITYNDC NATIONAL DEMOCRATIC CONGRESSNDF NETHERLAND DEVELOPMENT FOUNDATIONNDP NATIONAL DEVELOPMENT PLANNING SYSTEMNDPC NATIONAL DEVELOPMENT PLANNING COMMISSIONNESP NATIONAL ENVIRONMENTAL AND SANITATION POLICY
xxiACRONYMS
ACRONYMS
ACRONYMS
NESPCC NATIONAL ENVIRONMENTAL AND SANITATION POLICY COORDINATION COUNCIL
NGO NON-GOVERNMENTAL ORGANISATIONNLCD NATIONAL LIBERATION COUNCIL DECREENORRIP NORTHERN REGION RURAL INTEGRATED PROGRAMMENPP NEW PATRIOTIC PARTYNRCD NATIONAL REDEMPTION COUNCIL DECREENRSC NATIONAL ROAD SAFETY COMMISSION NSS NATIONAL SHELTER STRATEGYNVTI NATIONAL VOCATIONAL TRAINING INSTITUTEOASL OFFICE OF THE ADMINISTRATOR OF STOOL LANDSOPIC OVERSEAS PRIVATE INVESTMENTOTD ORDINARY TECHNICIAN DIPLOMAPAMSCAD PROGRAMME OF ACTION TO MITIGATE THE SOCIAL COST OF
ADJUSTMENTPAYD PAY-AS-YOU-DUMP PD PEOPLE’S DIALOGUE ON HUMAN SETTLEMENTSPNDC PROVISIONAL NATIONAL DEFENCE COUNCILPNDCL PROVISIONAL NATIONAL DEFENCE COUNCIL LAWPOP PLASTER OF PARIS PRSP POVERTY REDUCTION STRATEGY PAPERPURC PUBLIC UTILITY REGULATORY COMMISSION PVLMD PUBLIC AND VESTED LANDS MANAGEMENT DIVISIONPWD PUBLIC WORKS DEPARTMENTRCC REGIONAL COORDINATING COUNCILREDCO REAL ESTATE DEVELOPMENT COMPANYRSDP ROAD SECTOR DEVELOPMENT PROGRAMME SAP STRUCTURAL ADJUSTMENT PROGRAMME SCALE-UP SLUM COMMUNITIES ACHIEVING LIVEABLE ENVIRONMENTS WITH URBAN
PARTNERSSCC STATE CONSTRUCTION CORPORATIONSDI SLUM DWELLERS INTERNATIONALSEC SECURITIES AND EXCHANGE COMMISSION SHAPIC STATE HOUSING ALLOCATION POLICY IMPLEMENTATION COMMITTEESHC STATE HOUSING COMPANYSMC SUPREME MILITARY COUNCIL SMD SURVEY AND MAPPING DIVISIONSMM SECONDARY MORTGAGE MECHANISMSSNIT SOCIAL SECURITY AND NATIONAL INSURANCE TRUSTSUF SLUM UPGRADING FACILITYSWM SOLID WASTE MANAGEMENTSWOT STRENGTH-WEAKNESS-OPPORTUNITIES-THREAT FRAMEWORKT & G TONGUED AND GROOVEDTCPD TOWN AND COUNTRY PLANNING DEPARTMENTTDC TEMA DEVELOPMENT COOPERATIONTMA TEMA METROPOLITAN ASSEMBLYUESP URBAN ENVIRONMENTAL SANITATION PROJECTUS UNITED STATESVAT VALUE ADDED TAXVRA VOLTA RIVER AUTHORITY WACEM WEST AFRICA CEMENT MANUFACTURING COMPANYWASH-UP WATER ACCESS, SANITATION AND HYGIENE FOR THE URBAN POORWHO WORLD HEALTH ORGANISATIONWMD WASTE MANAGEMENT DEPARTMENTWRC WATER RESOURCES COMMISSION
xxii
GHANA HOUSING PROFILE
EXECUTIVE SUMMARY
INTRODUCTION
Ghana has a population of 24.2 million of whom just over half live in urban areas. After a long period of post-independence political uncertainty, Ghana has settled down into a long period of steady growth. Its GDP per capita in 2009 was US$716, with a real GDP growth per annum of 4.7 per cent in 2010. Even while it was a “Highly Indebted Poor Country”, economic growth and inward remittances continued to rise. It is now classed as middle income. Its cities are growing rapidly; at 1.6 million and 1.2 million respectively, the cities of Accra and Kumasi are dominant, being five and four times as large as the next largest, Sekondi-Takoradi. In the latter, oil exploration and exploitation are likely to impose growth drivers which will affect housing very considerably in the near future.
This profile is based on detailed reports of the major sectors contributing to housing and a specially commissioned sample survey of urban households in the four largest cities.
THE POLICY AND INSTITUTIONAL FRAMEWORK
Ghana has a history of national economic planning but housing has never been a large component, usually being seen as part of the welfare sector. Interventions have tended to be piecemeal and part of internationally funded programmes. Within a current recognition of housing’s place as a driver of economic growth, a National Housing Policy is under preparation.
Ghana has bodies of legislation and regulations covering all the main sectors involved in housing provision and control but many of them impose significant transaction costs and, thus, reduce the efficiency of supply rather than helping it. Long standing but now defunct rent controls, for example, still apply their limiting influence on the supply of rental housing and the ability of tenants to feel secure in their rooms. Processes to develop housing are very long-winded and time consuming.
THE KEY PLAYERS IN HOUSING
There are many public and formal sector players in housing provision but no dedicated ministry of housing. Most of the institutions set up for the supply of housing to the majority are no longer operating or have switched to dealing with a few middle- and high-income clients. Some NGOs are becoming involved in housing supply but on a small scale. Co-operatives have had only minor success; such players as SDI
affiliates are becoming important minor players in supply at the bottom of the market.
The formal sector actors provide only a few thousand dwellings a year targeted at the small but growing middle classes. The majority of all housing in urban Ghana, for all income groups, is provided by individuals in collaboration with small-scale, local contractors. They obtain their land from traditional community leaders (mainly chiefs). There are very few squatters in Ghana although their numbers have been growing recently, from a very low base.
THE CURRENT HOUSING STOCK
Though the traditional compound house is now hardly being built, the majority of households in urban Ghana occupy rooms in compounds (55 per cent) or other forms of multi-occupied residential buildings (24 per cent). Most housing is built in cement/sand (sandcrete) blocks with corrugated metal or asbestos sheet roofing. About 90 per cent of housing in urban Ghana can be classified as informal in that it is built without local authority control. As cities grow, there is considerable extension activity in the central areas, adding new rooms to existing houses.
Housing in Ghana is very crowded. Almost 60 per cent of households in urban Ghana occupy single rooms. Only one in four households own, the remainder are either renters or live rent-free in a family house. Urban housing is said to be very expensive but cannot be when households spend less than ten per cent of their household expenditure on housing. Indeed, when compared with the cost of building a room, the rent for it is usually very low; probably a legacy of the decades of rent control last century. Even so, government figures show that 35 per cent of the households can only afford housing costing GHC12,000 or less (a single room) and 85 per cent of all households can afford less than GHC72,000.
NEED FOR HOUSING IN URBAN GHANA
The housing stock in urban Ghana was 2.2 million dwelling units according to the 2000 census but the number dwelling units was not consistent with the number of households. Because of the confusion likely in this usage, previous methods of calculating need by dwelling units have been augmented with calculations of need for rooms. Rooms are clearly defined and that is what Ghanaians tend to occupy. The housing sector profile uses renter household
xxiiiEXECUTIVE SUMMARY
EXECUTIVE SUMMARYEXECUTIVE SUMMARY
expenditure as a means of calculating how much housing should cost to be affordable to households who need it. To calculate affordability, the housing sector profile uses
GLSS 5 data, indexed for 2010,
data from the housing sector profile’s small survey of four cities, and
a house cost to income (expenditure) (HC:Y) ratio of 1:3.
It shows that households can afford between US$10,000 and $18,000 (GHC14-25,000) as a capital cost for their housing, either to own or to rent for market rents. This translates, at 2.7 rooms per household and an overcrowding threshold of 2ppr., to rooms costing between US$2,200 and US$4000 (GHC3,100 – GHC5,500) each. Those in Accra and Kumasi would be at, or even slightly above, the upper end of the range while those in the smaller cities are likely to be at the lower end or below.
The number of rooms required is worked out from the supply in 2000, the likely supply between 2000 and 2010, the household size distribution from GLSS 5, the number of new urban households between 2010 and 2020, and a maximum room occupancy of two persons per room (ppr) proposed in the new Planning Guidelines. The housing sector profile also provides figures for occupancy maxima of 2.5 ppr and 3 ppr. Calculating that 1.5 million new rooms have probably been added to the urban areas since 2000, the housing sector profile calculates that 5.7 million new rooms are required by 2020. If these are to be successfully supplied, 3.8 new rooms must be completed in every minute of the working day for ten years. If built as self-contained dwellings, one per household, about two million would be required by 2020.
LAND
In Ghanaian urban areas, customary systems are overlain by ‘modern’, individualistic systems of tenure but there are almost no squatter or informal settlements as are common elsewhere in Sub-Saharan Africa. Customary systems still dominate (80 per cent of the land area). Customary land tenure, operated through chiefs and family heads is dominated by long leases which operate as if they were freehold but are not secure enough to attract bank lending. The ‘owner’ only has rights of surface user for which he/she pays drink money to the ancestors who guard the land on behalf of those of the owning community who are yet to be born. Drink money now represents market prices which, alongside housing costs, are perceived to be high.
The modern land registration system is cumbersome and expensive and a majority of urban Ghanaians avoid using it. Onto the costs of cadastral survey, registration, etc., are added significant transaction costs imposed by the time it takes to ‘buy’ and register the land, and the clouded titles and boundary disputes which bedevil Ghanaian land systems and clog up the courts. The recent land registration programme is having only limited effects as yet.
Though land is perceived to be expensive, if compared to the cost of the whole development, the land cost is very low. This is in spite of plots being huge by international standards (currently about 30m x 30m – 900 square metres).
Current plot sizes generate gross densities of about 8.6 plots per Ha. The housing sector profile estimates that, if a new dwelling was to be provided for each of the 2.011,711 urban households requiring housing by 2020, the amount of land needed would be 234,000 Ha. (equivalent to 344,000 football pitches).
If the new rooms were to be provided in compounds (or their modern equivalents) on the same sized plots, with a mean of ten rooms, they would require 574,000 houses covering 67,000 Ha (96,000 football pitches), less than one third of the land required for the self-contained bungalow option and a considerable saving. If the population densities were adopted from the new planning standards for high density areas, the amount of land needed would be 104,000Ha (150,000 football pitches) at the minimum of 176 persons per hectare net and 55,000Ha (79,000 football pitches) at the maximum of 330 persons per hectare net.
If the planned 10 plots per hectare from the National Shelter Strategy were achieved, at 2 ppr maximum occupancy, the land needed would be 191,000 hectares (273,000 football pitches) for bungalows and 57,000 hectares (82,000 football pitches) for compounds.
FINANCE
Credit is used by about one quarter of Ghanaians but most households in Ghana do not borrow money to build housing; they borrow for business and use profits to build. Of successful house-building householders, the majority use personal savings or family loans. Micro-finance is just beginning and may help the low-income majority.
There is a conventional formal sector finance system, notably through Housing Finance Company, which was set up ostensibly to serve ordinary Ghanaian households. Currently, however, it and the banks only deal with the very richest few and impose very high
xxiv
GHANA HOUSING PROFILE
threshold for borrowing, high down-payment and high interest rates. Current mortgages outstanding are valued at less than three per cent of GDP. In April 2010, the lending rate was around 30 per cent per annum.
The main financing mechanism for house-building is to save up from earnings and windfall gains and to buy building materials in advance. This is followed by a very long construction period as money must be raised to fund each stage. Some landlords have their renters build new rooms, covering the cost with a rent holiday. Microfinance is small but growing but is largely directed towards business. Some use is made of it for providing or improving toilets and kitchens. NGO innovations, including GHAFUP’s G-Fund, have potential but tend to be very complex to operate.
Land in Ghana is not useable as collateral. Even estate developers find funding difficult and there is no funding for the informal house-builders who supply most of the stock. Thanks to rent advances, typically of three years duration, even renters must now raise capital.
In the face of the need to build millions of rooms at a rate of 3.8 rooms per minute, or separate dwellings at 1.4 per minute, for the next ten years, the demand for housing finance will be unprecedented and far beyond that which the existing financial institutions are capable of meeting.
The cost of building all the houses containing the 570,000 new rooms required for 201,000 households per annum is likely to be between US$2 billion and $3.6 billion (GHC2.8-5 billion) annually. The current total value of home mortgages outstanding is only ten per cent of the lowest end of the likely annual need.
INFRASTRUCTURE
As with most Sub-Saharan African countries, Ghana has urban services of very varying levels. There are areas in which full servicing and even sewerage are fitted while many neighbourhoods are almost completely devoid of services. The latter are mainly informal settlements within the cities and the rapidly expanding peri-urban neighbourhoods.
About 70 per cent of households in urban Ghana have access to pipe-borne water, with about one third of these using public standpipes. Those without pipe-borne water mainly rely on tankers or other vendors. The urban water companies have marginally sufficient supply for current needs but need to improve their resources and supply capabilities to cope with likely increases in urban population.
Sanitation is quite poor in Ghana’s cities. About 40 per cent of the urban population rely on public latrines at a distance from their home and about 36 per cent have an improved toilet (flush or KVIP). Even in formally planned neighbourhoods, and in contrast with many Sub-Saharan African countries, Ghanaian cities still rely on public toilets for low-income households. The erstwhile reliance on bucket (pan) latrines has been broken recently and only one per cent of all urban households use them. The local variant of the KVIP provides a practical alternative sanitation; sewered WC provision is too expensive and demands too much water to be considered as a standard sanitation option in Ghanaian cities.
Solid waste (refuse) disposal tends to be by dumping with periodic collection. The system is generally inadequately handled leaving large quantities of garbage around the environment to encourage disease carriers. Only 16 per cent of households have their garbage collected (41 per cent in GAMA). When solid waste is dumped in drains, it exacerbates an already severe problem of surface-water drainage and sometimes leads to localized flooding.
Electricity is the most frequently provided service to urban households with most houses having a supply. The power is generated by hydro-electric plants, mainly at Akosombo so Ghana is very vulnerable to the changes in rainfall likely with climate change. About one quarter of all power is lost in the system.
The institutions providing infrastructure are under-performing in comparison to demand. They have no capital to extend their networks, relying on full advance payment by customers wanting a service and bi-lateral or multi-lateral aid programmes. Maintenance is also under-funded. Where on-plot services are provided, they are often shared by many households and may only be available to some households in the house, at the owner’s discretion.
Although Ghana spent around half that, equivalent to about 10 percent of GDP between 2000 and 2010, the World Bank estimates that addressing Ghana’s infrastructure challenges will require sustained expenditure of almost US$2.2 billion per year over the next decade. At the same time, about US$1 billion per year is lost through under-pricing of utilities, especially power, and wastage, especially water. There is a large annual funding gap, most of it associated with power and water.
The poor service delivery results in high health and coping costs as well as environmental degradation. It also causes drudgery and inconvenience for a large section of the urban population, especially women and children. The cost that the consumers and government pay (health and coping costs) may well be higher than the costs of providing safe and
xxvEXECUTIVE SUMMARY
EXECUTIVE SUMMARY
There are few shortages of construction materials in Ghana at present, though this has not always been the case in recent history. Sandcrete blocks with in-situ cast concrete framing is the technology of choice for most jobs. There is growing use of local pozzolana to substitute for some cement in the mix. Many imported materials in common use could be substituted with a local equivalent. The Ghanaian market is flooded with cheap imported building materials which may not be as durable as home-produced equivalents and which weaken the market share of local manufacturing industries. There is a long history of high-quality building-materials research, mainly from BRRI in Kumasi, but little has passed into common use in the construction industry.
Traditional earth-based technologies are little used in the urban areas now, partly for reasons of social acceptability. While their use is being encouraged, the building regulations, materials standards and availability of knowledgeable artisans seem to militate against them. Furthermore, the institutional procedures and processes to encourage the mass use of such materials are minimal.
The construction industry of Ghana has experienced a steady growth. Over the last decade, it has grown at an annual rate of 8.6% in 2008 and 9.3% in 2009. The national GDP of Ghana experienced a steady growth while the share of GDP contributed by construction has fluctuated by only a percentage point or two around 25 per cent each year. This is far lower, however, than the average Sub-Saharan African share of 34%. It employs about 2.5 per cent of the economically active population.
The formal sector is regulated by the building regulations which demand high quality but allow local earth-based materials under special circumstances. The formal sector is dominated by the privatized scions of former quasi-government corporations and the group of private developers who belong to GREDA. All operate under favourable conditions, with banks of subsidized land for the former and tax breaks for the latter. Thus, only the top of the house construction industry receives government help.
Currently, the split between informal and formal is 90:10. If this continues, the number of work months employment required to build 201,711 dwellings per annum would be 869,000 (or 72,500 work years or jobs). If the formal sector is increased to 20 per cent of the new stock, then 1,153,000 work-months would be generated, equivalent to 96,000 jobs. Thus, there are likely to be somewhere between 72,500 and 96,000 new jobs in construction as a result of the supply of housing required. In these scenarios, the number of work months in the informal sector reduces from 530,000 to 470,000 while formal sector work months would double from 343,000 to
continuous improved services especially of water and sanitation.
Improving service delivery would require easing the financial constraints facing the sector, reducing unaccounted waste and addressing the institutional and managerial issues.
Choices of technology should not necessarily reflect consumer choice but may need to be in the broader interest of Ghana. To overcome the institutional and managerial deficiencies, the sector needs to be restructured in a manner that managers have the autonomy to operate in a commercial environment on a sustained basis.
If new housing is to be provided through self-contained dwellings, they will require just over 200,000 new connections every year (645 every working day). The need to provide 570,000 new rooms per annum generates two very different servicing requirements depending on how they are configured. If they are provided as three-roomed self-contained bungalows, there would be a need for 190,000 new connections every year (600 per working day). If they were provided as shared services in ten-roomed multi-occupied housing equivalent to compounds, there would be a need for 57,000 connections (180 per working day).
It may well be that the existing institutions cannot meet these challenges as they are currently structured. There is an urgent need to rethink provision systems and determine the capacity required to fulfil them in the most effective way. This is likely to include community participation in planning, installation and management of supply.
CONSTRUCTION AND BUILDING MATERIALS
Most housing in Ghana is built at the instigation of an individual who, or household which, finds and buys the land, negotiates designs, permissions, builders and infrastructure, and occupies it at the end of the process. This process is very inefficient but does involve large numbers of people in housing supply at any one time. In Ghana, the building of unauthorized (squatter) settlements, on land for which the occupants do not have title, hardly happens. Instead, the informal building sector operates mainly on legitimately-owned land often building dwellings for which planning and building regulations permissions may have been (or could be) granted. Most workers train through informal apprenticeships and then operate individually or in small teams formed round a mason. They charge GHC13 to GHC20 per day depending on skills level or the perceived wealth of the client.
xxvi
GHANA HOUSING PROFILE
infrastructure for adequate housing, between 2010 and 2020. The affordability calculations point to a need to concentrate on the price range US$10,000 and $18,000 (GHC14-25,000) as a capital cost for their housing, either to own or to rent for market rents. This translates, at 2.7 rooms per household at an overcrowding threshold of 2ppr, to rooms costing between US$2,200 and US$4000 (GHC3,100 – GHC5,500) each. Those in Accra and Kumasi would be at, or even slightly above, the upper end of the range while those in the smaller cities are likely to be at the lower end or below.
A total of 574,000 rooms must be provided every year, 1,840 per working day, about four every minute. This is a significant challenge and one unlikely to be met by formal sector contractors building two- to three-bedroom villas, even if many of the households could afford them. In the event of building separate dwellings for each household, and assuming that the supply since 2000 has been equal to the backlog at 2000, 1.4 dwellings would be needed every minute of the working day (probably equivalent to 4.2 rooms per minute at three rooms per dwelling). Even adopting higher thresholds of overcrowding, the task is still very large indeed.
Business as usual, through the current formal housing, land and finance institutions, will not meet the serious shortage of rooms and services in urban Ghana in the next decade. The way forward involves major changes in the way housing is provided; a paradigm shift from ensuring that a few very well-constructed and serviced dwellings are provided to ensuring that enough housing is built for everyone at a price that they can afford. This certainly means shifting the emphasis from finding a future for current housing supply institutions to installing processes that ensure large quantities of housing at appropriate prices and sustainable densities, chiefly to the benefit of the majority of households who live in poverty.
The main characteristics of the current housing stock include shortage and crowding. Both of these are only capable of remedy if adequate housing becomes the main emphasis, especially adequate in numbers. Housing plans should begin here and adapt the institutional framework to enable adequate provision for the ordinary Ghanaian household.
Increasing the bankability of land and property while retaining Ghanaian traditional attitudes on property is probably the greatest challenge to the housing supply in Ghana. Great benefits will arise from solving the conundrum of how to improve the accountability and performance of traditional landowners and introduce a new regulatory framework to enable alternative forms of collateral, decrease risks, and give more reliability to whatever market grows.
686,000 (table 94.). The backward linkages of jobs in other sectors generated by the construction activity are likely to be twice the direct labour – somewhere between 150,000 and 200,000 jobs.
THE HOUSING MARKET
Traditionally, used housing is not sold in Ghana. New dwellings are bought and some households, especially in Accra and in the higher income groups, are willing to sell. The market in used housing is, however, very small indeed. Commentators in Accra write about the changes that are happening in this but, outside the capital, people are more traditionally minded.
The formal home-owner market is almost only in the top echelons of society by income and mainly for those who are or have been overseas. GREDA members build high-quality dwellings, often in gated estates, but in relatively small quantities – a total of 2100 between 2000 and 2007.
There is a small public rental market (2 per cent of renters) with rent levels much lower than the private rental market for similar accommodation. The large private rental market accommodates the majority of urban households. At the top end of the market, villas are rented for large sums paid in US dollars. In the majority of the market, however, rents are very low following decades of rent control; they are so low that landlords routinely demand three years’ rent in advance to increase their net present value. Most renters occupy rooms in multi-occupied housing, sharing services or using public taps and toilets. Rent-free living in family-houses provides an important social safety net. Low-income households in Accra tend to pay between GHC4 and GHC20.
House cost to income ratios are lower when using the expenditure of the occupant of the house rather than typical incomes and typical house costs. Three or four to one are typical. Costs of typical house types show how much cheaper traditional types are than imported modern types. Compounds cost upwards of US$18,000 while villas start at around US$56,700 at 2010 prices. Only about three per cent of households can afford the cheapest formal sector dwelling on the market. At the other end of the market, high-income gated estates are providing costly housing for a rich few and expatriate Ghanaians.
THE WAY FORWARD
It is clear that, if urban housing supply follows the proposed planning standards for occupancy of a maximum of two persons per room, there is a need for about 5.7 million rooms, or 2 million dwellings, together with all the accompanying land and
1EXECUTIVE SUMMARY
EXECUTIVE SUMMARY
Most urban land, building materials, labour rates and construction tasks are relatively cheap in international terms, so the potential for reducing costs is very small. The main problem is that wages and incomes from business are very low and, even by having multiple income streams, the majority of urban Ghanaians struggle to make ends meet let alone live in adequate housing.
The employment generated by the new housing supply will put large amounts of money into the local economy in a way which is very enriching for the poor and for the country’s development. The supply of urban housing needed to fulfil the large numbers of new rooms required, and all the accompanying infrastructure, thus represents both a major challenge and a great development opportunity for Ghana. Increasing employment through housing supply could be a pivotal development strategy, particularly as housing affordability in Ghana is largely an issue of low incomes.
The Urban Housing Sector Profile shows that formal housing supply institutions and mechanisms in Ghana are currently not capable of providing more than a tiny portion of the needed increases in stock. The informal sector copes better, and is more appropriate for the majority, but it does not provide housing at the pace required both to catch-up with the backlog and provide the unprecedented amounts of urban housing likely to be required in the next ten years. The Profile provides some ways forward that would impose a reality check on the systems and point them in the right direction to increase the supply at the cost and scale required while providing much-needed developmental benefits.
Land must be made available in suitable quantities and costs, infrastructure provided at suitable cost and, therefore, probably low standard at first with incremental improvement possible later on. Finance through mortgages is likely to be unsuitable for almost all households so other forms of finance, especially microfinance are required. Government incentives should only be available to those supplying housing for households below the median in income (using expenditure as a proxy). The informal construction industry is the key supply line and must be assisted with access to finance, improved training, openings to tender for government contracts, etc. Currently available research into building materials should be more widely disseminated and tested to achieve greater efficiency in price-sensitive supply.
Few urban households can afford a self-contained dwelling on a fully serviced plot. Large numbers rely on public facilities and this is inappropriate in the twenty-first century. Infrastructure provision should aim, therefore, for a minimum of shared taps, bathrooms and toilets within houses rather than public sanitation and water supply.
Because ownership will be out of many households’ affordability, renting is likely to continue to be the majority tenure and must not be regarded in policy as failed ownership. House-owners should be encouraged to provide rooms for rent in their homes, with rents fairly representing the cost of providing or replacing the rooms occupied. That, and a realistic increase in accommodation, should remove the need for landlords to maximize the net present value of rents by demanding advance payments.
2
GHANA HOUSING PROFILE
Housing is a vital issue in government policy in Ghana in the early 21st century but its direction awaits the acceptance of the current draft housing policy.1 Compared with many countries in Sub-Saharan Africa, Ghana’s urban population is very poorly housed. About 60 per cent of all urban households occupy single rooms. While a taxi-driver in Lilongwe, Malawi’s capital, routinely lives in two or three rooms, one in Accra is likely only to have one room.
Ghanaians are, like many other peoples, greatly concerned about owning a home of their own. Reflecting this, government policy over the years has concentrated on home-ownership, but usually through developments occupied by the rising middle class; single household dwellings on serviced plots. When talking about their housing futures, Ghanaians talk only of ‘building a house’ or ‘renting a room’. This reflects the reality of both supplies for their respective clienteles; if a household wants to own a dwelling, they must find land, engage a builder and have one built. This is done by many thousands per annum, mainly on land owned under the customary system. For the majority, renting is done room by room. Unfortunately, governments have been
01INTRODUCTION
less than hospitable towards landlords for decades; controlling rents for over 40 years2 and taxing rental income higher than ‘earned’ income.
Home ownership is still only achieved by a minority; most households in urban Ghana rent or occupy their rooms rent-free. Most of them share the structure and the services with other households in the house, or use public taps and toilets. Only the rich middle class households occupy a dwelling of their own and have full services in the dwelling. Despite this reality, there appears to be little recognition of the credibility of renting and multi-occupancy as alternative tenure options, in spite of these two modes of occupancy being dominant.
Though government policy pronouncements suggest a shift to an enabling approach favouring the majority, most of the government’s interventions and formal production seem to be targeted at their own key workers and the few middle-class urban households, many of whom need a family-member overseas to afford the single-household dwellings in fully-serviced estates. Such interventions have failed to impact positively on the poor majority who still occupy single rooms with shared or no services.
Year Population Housing demand Housing supply (dwelling units)
Housing deficit
1970 8,559,313 1,678,296 941,639 736,657
1984 12,296,081 2,410,096 1,226,360 1,184,636
2000 18,912,079 3,708,250 2,181,975 1,526,275
2010 24,233,431 - - -
2020 30,043,278 - - -
Table 1. Population and housing in Ghana, 1970 to 2000
Source: Up to 2000, Obeng-Odoom27 from Ghana Statistical Survey Censuses; 2010 from early census results.
3INTRODUCTION
CHAPTER ONE
Ghana is now listed as a middle-income economy under the World Bank system of classification.5 Since 2003, the annual inflation rate has varied between a high of 26.7 in 2004 and a low of 10.7 in 2008 (Index Mundi). This contrasts markedly with the 1980s when the average rate of inflation was estimated at over 40 per cent by the World Bank, with a peak rate of 142% for late 1983.6
After a long period of military rule, in which the ‘black market (kalabule) seemed to become the only functioning part of the economy, followed by the chaotic days of the AFRC, brief democratic government and PNDC political roller-coaster (1979 to 1982), Ghana instituted a Structural Adjustment
1.1 THE ECONOMY
During the later decades of the twentieth century, Ghana suffered an extended period of political instability and economic decline. Recently, however, there has been stability and growth that many neighbouring countries can envy. Very recently, oil has been found in commercial quantities off-shore, so the economic future looks better than it has for many a decade. In 2008, the GDP stood at $16.124 billion, a considerable growth from $4.977 billion in 2000 and $8.872 billion in 2004, showing a growth rate of 7.2 per cent per annum. Per capita GDP stands at $716.3 Industry, including mining, manufacturing, construction and electricity, account for about 30% of the GDP.4
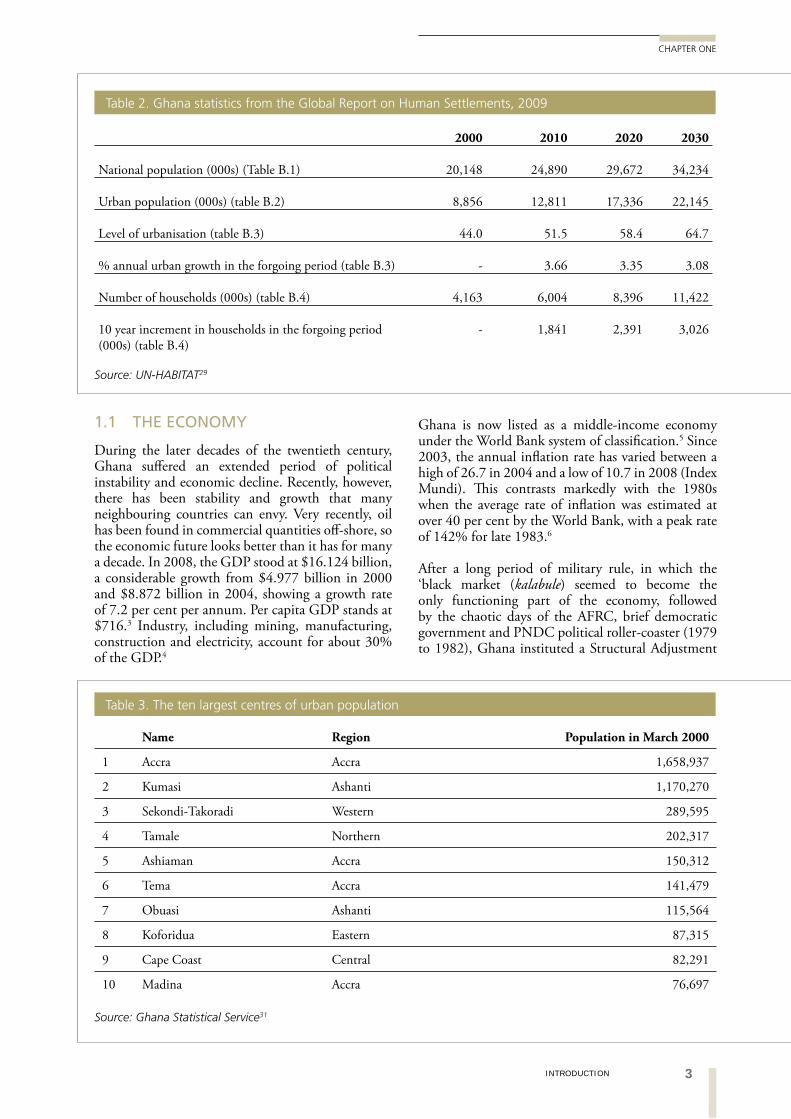
Table 2. Ghana statistics from the Global Report on Human Settlements, 2009
2000 2010 2020 2030
National population (000s) (Table B.1) 20,148 24,890 29,672 34,234
Urban population (000s) (table B.2) 8,856 12,811 17,336 22,145
Level of urbanisation (table B.3) 44.0 51.5 58.4 64.7
% annual urban growth in the forgoing period (table B.3) - 3.66 3.35 3.08
Number of households (000s) (table B.4) 4,163 6,004 8,396 11,422
10 year increment in households in the forgoing period (000s) (table B.4)
- 1,841 2,391 3,026
Source: UN-HABITAT29
Table 3. The ten largest centres of urban population
Name Region Population in March 2000
1 Accra Accra 1,658,937
2 Kumasi Ashanti 1,170,270
3 Sekondi-Takoradi Western 289,595
4 Tamale Northern 202,317
5 Ashiaman Accra 150,312
6 Tema Accra 141,479
7 Obuasi Ashanti 115,564
8 Koforidua Eastern 87,315
9 Cape Coast Central 82,291
10 Madina Accra 76,697
Source: Ghana Statistical Service31
4
GHANA HOUSING PROFILE
Programme (SAP) in 1983. Under it, the civil service and government functions were trimmed hard back, the cedi was allowed to find its (very low) market level, and a series of mitigating measures were carried out to help the poor weather the times. The PNDC government, led by J.J. Rawlings, made great economic strides giving Ghana average growth rates of GDP of 5.2 per cent per annum between 1983-
1990 (from a very low base) and an annual growth of government revenue as a proportion of GDP from 5.3 per cent in 1983 to 14.5 per cent between 1986 to 1991.7 The 1990s, under Rawlings’ NDC democratic government, saw less growth and a general stagnation in the economy until, in 2001, Ghana gained ‘Highly Indebted Poor Country’ status8 but has now graduated to middle income status.
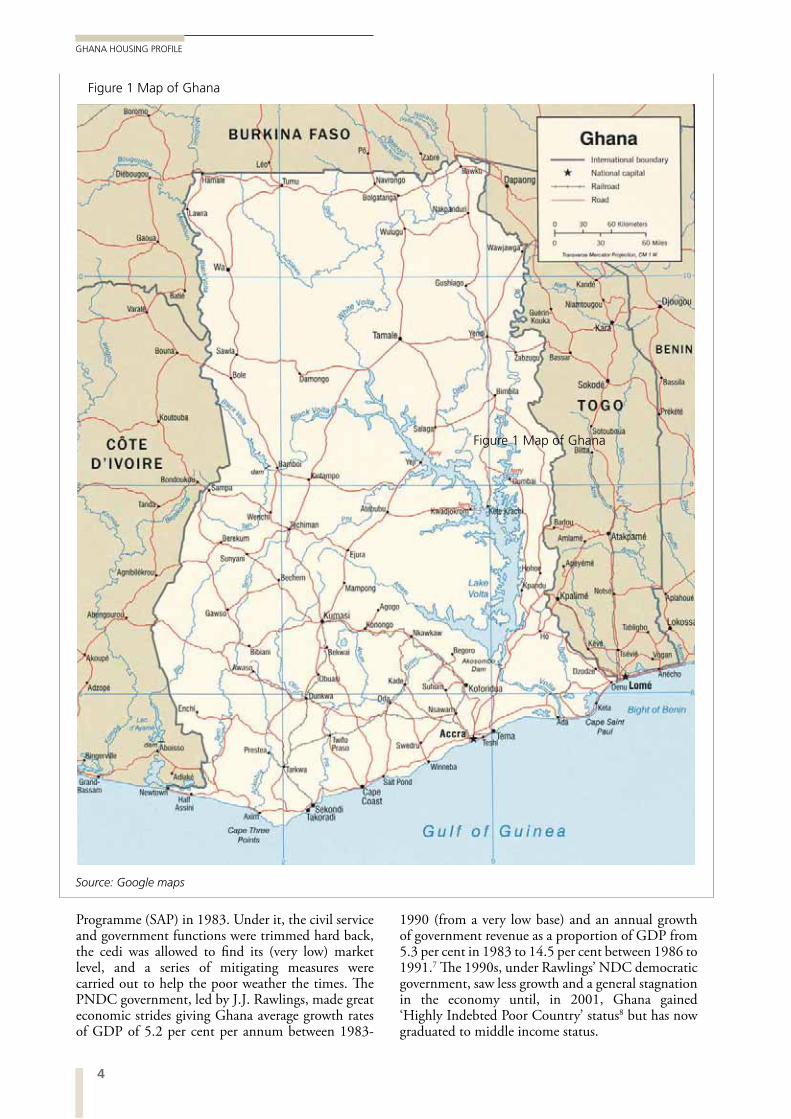
Figure 1 Map of Ghana
Figure 1 Map of Ghana
Source: Google maps
5INTRODUCTION
CHAPTER ONE
Lagoon.13 The need to operate business from home increased after SAP but many landlords did not allow their tenants to work from home and planners were vigilant for such non-conforming uses.14 Thus, less-formal settlements, where home-based enterprises were allowed by landlords and planners, became more attractive and increased in size and population.
1.3 HOUSING CONDITIONS
Weeks et al,15 working from a ten per cent sample of the 2000 Census data, report that households in Accra endure a mean of 2.3 of the five characteristics of slum housing. The main shortfalls are in access to water, access to sanitation and lack of space per person. The other two characteristics, of durable structures and secure tenure, do not feature as such
In line with other sectors of the economy in which governments have helped their supporters (clients) and punished those who oppose them,9 governments’ interventions in housing have largely been to support their own officers and supporters.
In the government’s National Poverty Alleviation Strategy,10 development of property and infrastructure are taken to be important for the regeneration of the economy.11 Its interventions, however, have concentrated on the very upper end of the market through giving GREDA members tax breaks.
1.2 STRUCTURAL ADJUSTMENT AND HOUSING
As COHRE12 points out, the retrenchment following on from SAP affected Accra particularly with 35-50 per cent of all retrenchments there. This, linked with the generally higher income profile of migrants to Accra, has led to a very wide income range in the city with many middle class and many poor. SAP led to a need for lower rents, as many households saw their income disappear and had to establish a new, and usually less well-paid income stream. This increased the demand for low-rent accommodation but there was no increase in formal sector supply. In turn, this led to hardening rent levels and a growth in unauthorised settlements along railway lines, on road reserves, etc. One well-known settlement that grew up in this way is Agbogbloshie by Korle
5
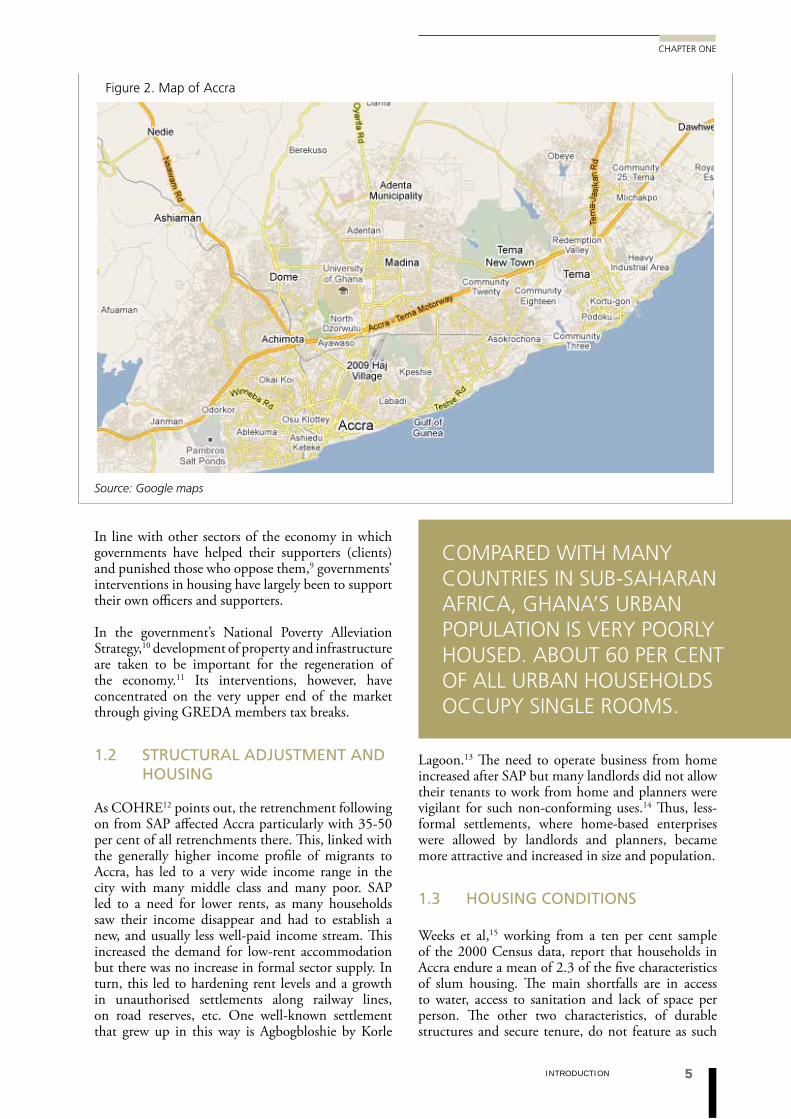
Figure 2. Map of Accra
COMPARED WITH MANY COUNTRIES IN SUB-SAHARAN AFRICA, GHANA’S URBAN POPULATION IS VERY POORLY HOUSED. ABOUT 60 PER CENT OF ALL URBAN HOUSEHOLDS OCCUPY SINGLE ROOMS.
Source: Google maps
6
GHANA HOUSING PROFILE
problems. This assessment seems to reflect housing in urban Ghana in general; it is reasonably well built and secure, but it is badly serviced and overcrowded.
High occupancy rates within dwellings in Ghanaian cities are accompanied by relatively low population densities because most development is single storey. This is an important current issue because Angel16 has shown that as cities double in population they triple in area. Unless significant intensification of land use accompanies urban growth, Ghana’s cities may become unmanageably extensive.
The typical high occupancy rates in rooms with little ventilation and poor drainage and sanitation in urban Ghana result in high incidences of diseases such as malaria, gastro-enteritis, upper respiratory tract diseases, STDs and skin diseases. The effects
of poor housing conditions are mitigated by two characteristics:
the high value that Ghanaians place on personal hygiene and cleanliness;
the common practice of cooking outdoors.17
Current Ghanaian cities are very unequal places. The rich few enjoy large portions of land and high standards of servicing while the poor majority huddle into ever more crowded central areas.
1.4 POVERTY IN GHANA
Ghana ranks 111 in the Human Development Index for 2010.18 The most recent poverty data, used for the PRSP II, 2006-2009, dates from 1998. At that time,
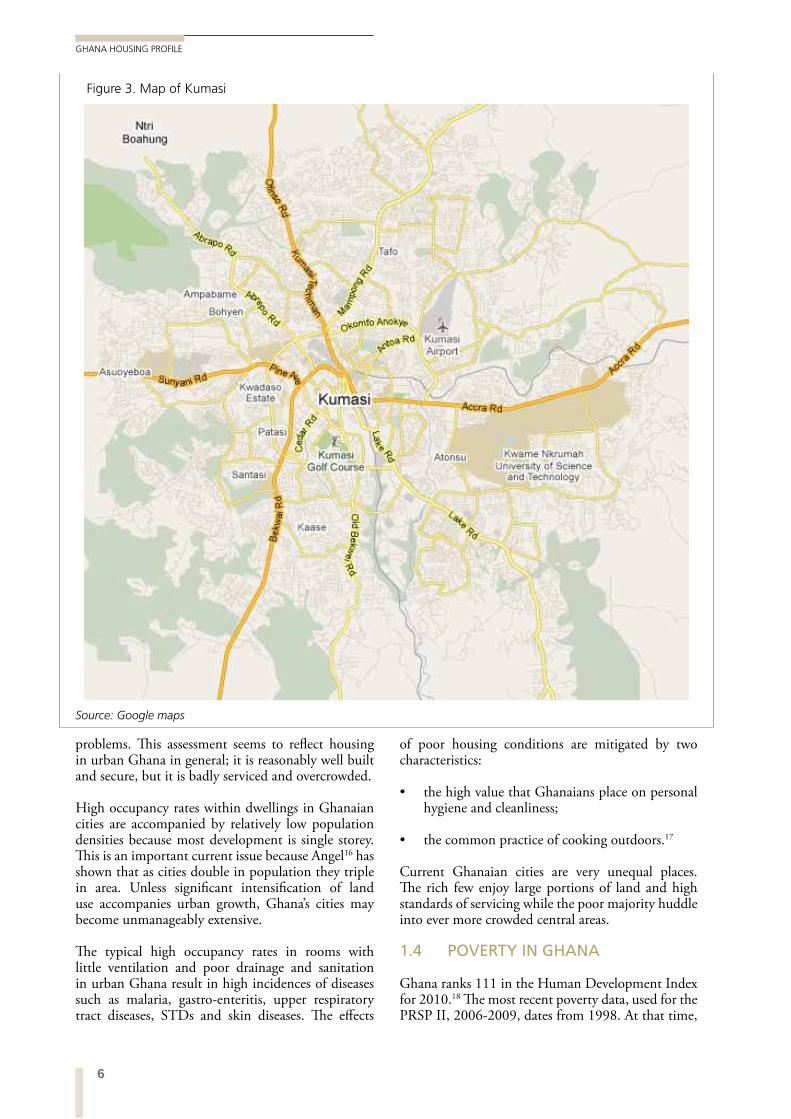
Figure 3. Map of Kumasi
Source: Google maps
7INTRODUCTION
CHAPTER ONE
urban household expenditure. The higher expenditure on housing in Greater Accra Region (4.5 per cent) is twice the other urban areas average. It is still low, however.22
Only a third of households in Ghana have savings accounts; 40 per cent of urban households have savings accounts compared with only 22 percent of rural households.23
1.5 HOMELESSNESS
Until recently, it could be said that homelessness was an unknown concept in Ghana as everyone has somewhere, a family house in a city or village, which, if they have to go there, people have to take them in.24 With the civil unrest in the Tamale area during the 1980s and 1990s, there has grown a small group of people who now have no homes. They have
45 per cent of the population lived on less than US$1 per day and 79 per cent on less than US$2 per day. Adult life expectancy in 1998 was 58 years.19
GLSS 520 shows illiteracy rates of 16 per cent in Greater Accra, and 22 per cent in other urban areas. Nationally, school attendance is high but there are still approximately 26 per cent of males and 37 per cent of females who never attended school. About 2.6 percent of children under six have never been vaccinated against the six childhood killer diseases. Only 22.2 percent of households in urban areas, and 1.1 per cent in rural, have access to flush toilet.21
Household food consumption, including the imputed value of own-produced food, accounts for half of total household expenditure. Expenditure on housing (included the imputed value of housing owned outright) averages only 3.2 percent of total
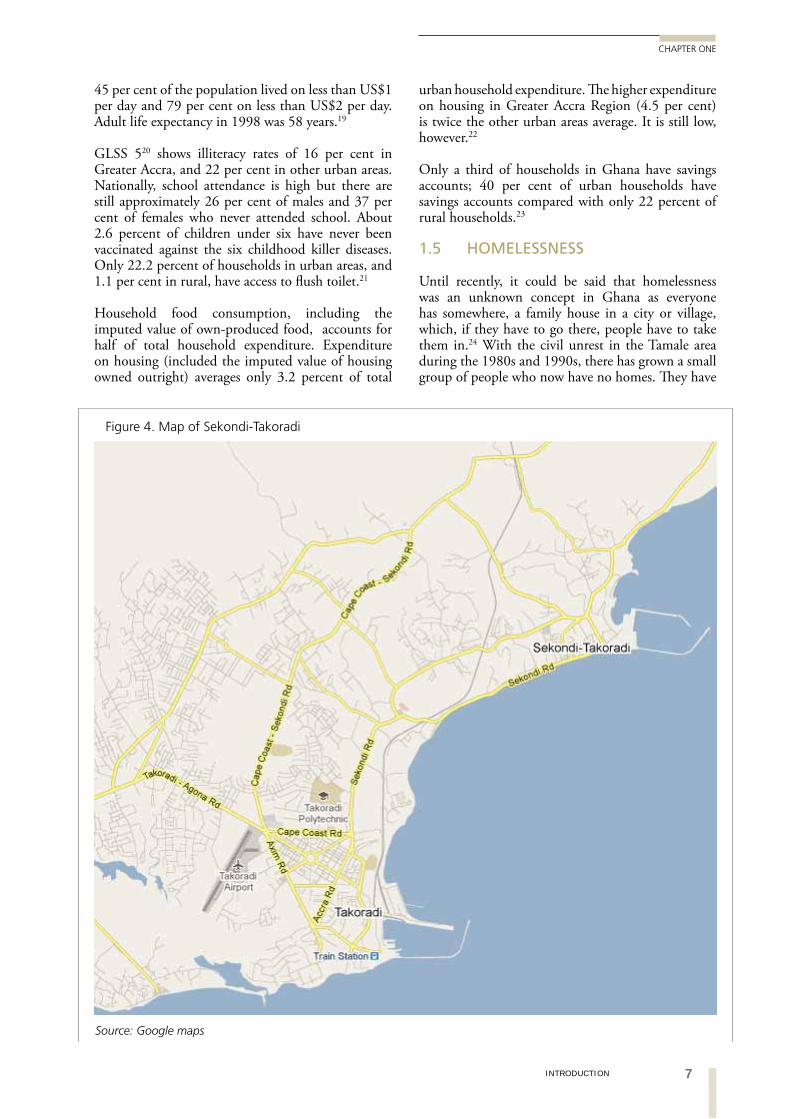
Figure 4. Map of Sekondi-Takoradi
Source: Google maps
8
GHANA HOUSING PROFILE
gravitated to the cities where they live a hand-to-mouth existence, often renting a part of a courtyard to sleep in. There are also migrant workers, mostly working as porters (kaya) in the markets, many of whom are women, who live wherever they can close to their workplace. Together, they probably amount to a few thousand people.
The family house system in urban Ghana is the social safety net that prevents homelessness from being much of a problem in Ghana.25 These structures, often of some age and dilapidation, provide safety-net accommodation for the old or infirm, and the young adults not yet established in a household of their own. While there are problems in the upkeep of these structures, their presence is a major benefit of urban Ghana and should be treated with great respect by policy-makers.26
1.6 POPULATION GROWTH AND DISTRIBUTION
Currently, Ghana is ten years from an analysed census as it conducted the most recent one during the writing of this report (September, 2010). The 2010 results are only slowly being released. It shows the 2010 population as 24.2 million. Table 2. shows the estimates for population, urbanization and households from the international dataset at the end of the 2009 Global Report of Human Settlements.28 They differ slightly from the official Ghana figures for 2000 and 2010, but are reasonably close and give useful growth rates.
Urban housing constitutes one third of the total housing stock while urban population is more than half the national total.30 This is taken as prima facie
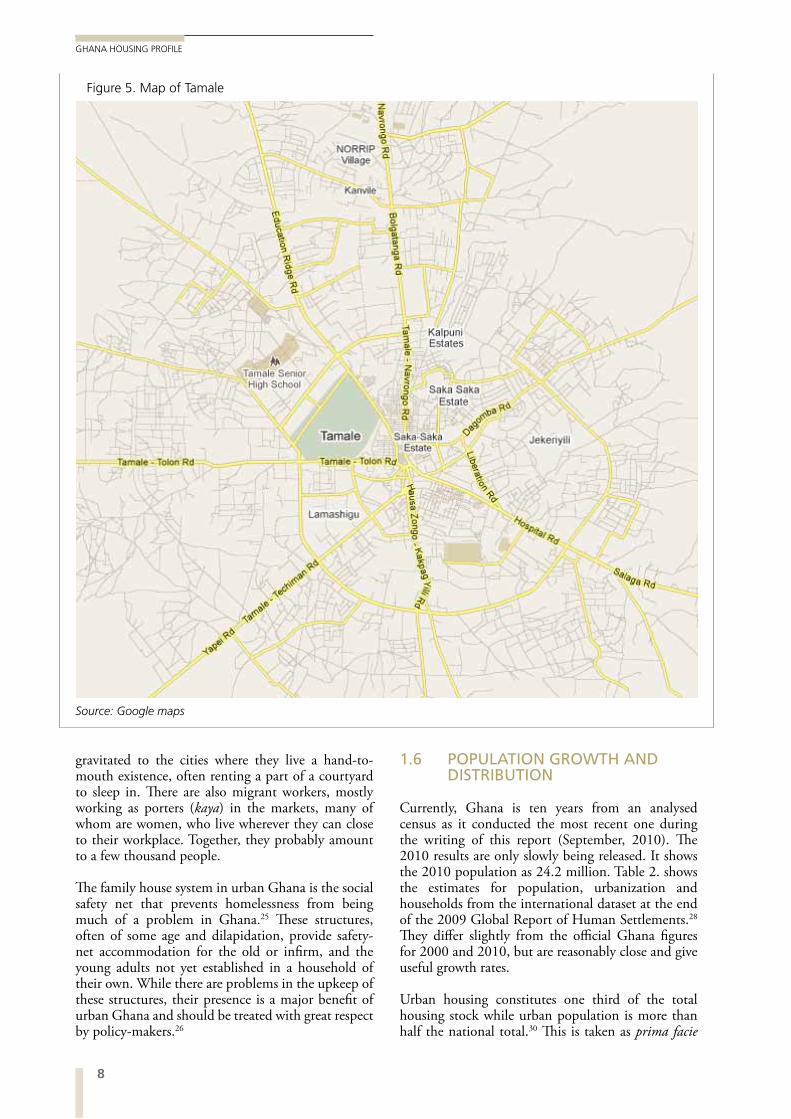
Figure 5. Map of Tamale
Source: Google maps
9INTRODUCTION
CHAPTER ONE
Accra Kumasi Sekondi –Takoradi Tamale
High Density Indigenous Sector(HDIS) The oldest sections of Accra mainly occupied by “indigenous” Ga people. Family and compound housing houses are very common. The communities share similar history and culture. Population is very dense; growth rates are now low. Low incomes, many from fishing. Very poor levels of infrastructure. Examples are Old Dansoman, Chorkor, Old Teshie and Nungua
Indigenous Sector
These areas originated as villages and have been incorporated into the metropolis owing to the outward expansion of the city. Accommodates low to medium income residents. Housing is mostly single storey traditional compounds, many built in mud. These areas are characterised by poor spatial arrangements and low service levels. Examples include Breman, Moshie Zongo, Anloga, Aboabo, Ayeduase, Ayigya and Suame Zongo
Fourth Class Areas These are poorly serviced, unplanned settlements which have difficulties in access. They started as traditional or indigenous communities. They include Kansaworodo, Adientem, Anaji fie, Anoe and Assakae and Ntankoful
Urban Villages
Occupied by the indigenous Dagonbas, occupants are mostly farmers with very low income but large household sizes. The houses are built with mud and thatch. They are poorly serviced. Examples include Taha, Dungu
High Density Low Class Sector (HDLCS)
Areas are characterized by very high densities, low income population; many of the people are migrants. Ethnically diverse. Extremely poor infrastructure conditions. High growth rates. Most areas are low-lying and easily flooded. Housing is sometimes temporary wooden shacking. Examples include New Town, Nima, Russia, Sukura and Maamobi
Tenement Sector Characterised by multi-storey compound houses with large number of rooms. High population and housing densities and inadequate access to housing facilities. Varied income levels from very low to middle. Examples include Bantama, Dichemso and Ashanti New Town
Third Class Sector
Typical communities are poorly serviced with water, electricity and telecommunications. Most are inaccessible to vehicular traffic. Plot sizes are less than 0.1Ha. Mainly compound housing. Examples include Kwesimintim, Effia, Essipon, Kojokrom, Ketan and Mptinsim
Third Class Sector
These are without basic services. The plots were demarcated in grid form by sanitary inspectors. They are densely populated by very low income earners Plots sizes are 40m by 40m. The dominant house type is the compound. Examples are Moshie Zongo , Hausa Zongo and Choggu.
`Medium Density Indigenous Sector (MDIS) Shelters people who otherwise have been living in the HDIS but have moved out because their lot has improved. Incomes are marginally higher but densities are not as high as in HDIS. Many migrants. Infrastructure is poor and inadequate. Examples include Abeka, Mamprobi, Kpehe, Mataheko and Bubuashie.
Government Built Estate Sector
These are government built low cost housing estates, well serviced. Originally built for junior civil servants for rent, the dwellings have been transferred to ownership. Occupied by medium income households. Examples include North and South Suntreso, Bukurom, Asawasi and Kwadaso estate.
Second Class Sector
Fairly well served with roads, water, electricity and telecommunication. Plot sizes range between 0.1 -0.2Ha. Population density range 100-200 persons per Ha. Fairly clean environment. Examples include Apremado, West Fijai, Anaji Estate, Mptisim, Ridge, Tanokrom and Kweikuma.
Second Class Areas
These are a mixture of government build low houses and private own structures. The areas are fairly serviced with roads network. Occupants are within the middle income class with small house hold seizes. Examples are Vitting, Kukuo, and Zogbeli.
Table 4. Summary Characteristics of Residential Areas in Selected Cities33
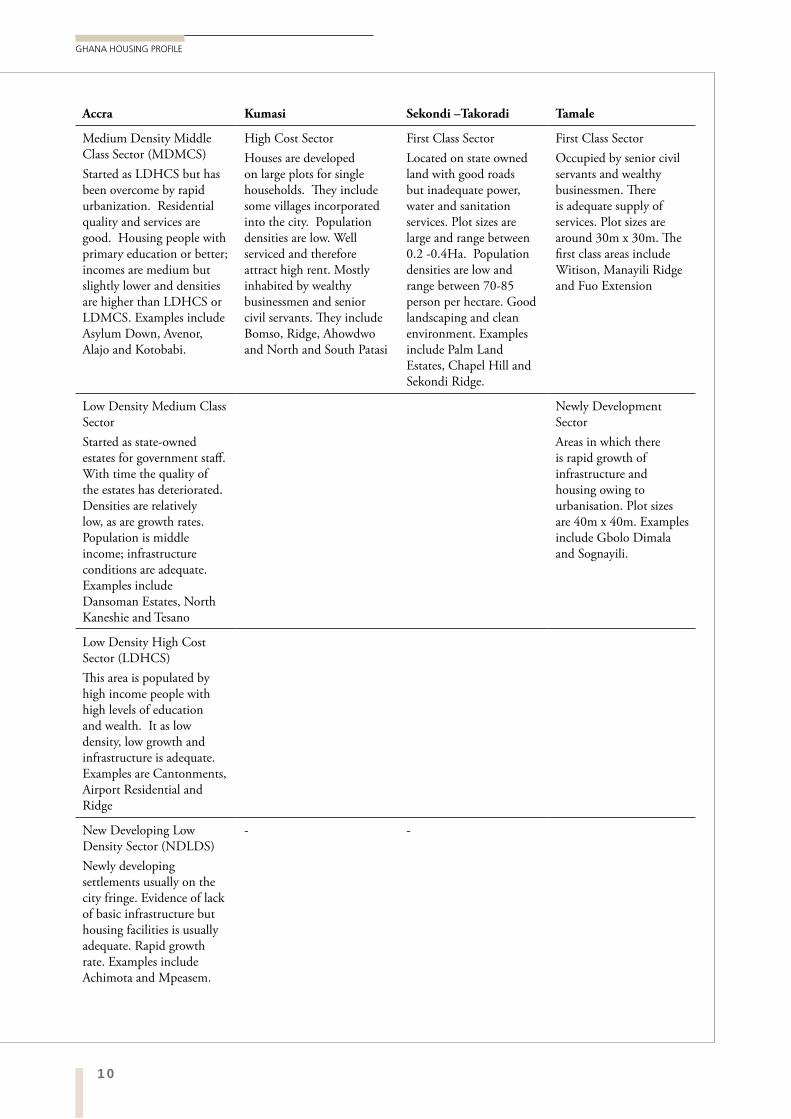
10
GHANA HOUSING PROFILE
Accra Kumasi Sekondi –Takoradi Tamale
Medium Density Middle Class Sector (MDMCS)Started as LDHCS but has been overcome by rapid urbanization. Residential quality and services are good. Housing people with primary education or better; incomes are medium but slightly lower and densities are higher than LDHCS or LDMCS. Examples include Asylum Down, Avenor, Alajo and Kotobabi.
High Cost SectorHouses are developed on large plots for single households. They include some villages incorporated into the city. Population densities are low. Well serviced and therefore attract high rent. Mostly inhabited by wealthy businessmen and senior civil servants. They include Bomso, Ridge, Ahowdwo and North and South Patasi
First Class Sector Located on state owned land with good roads but inadequate power, water and sanitation services. Plot sizes are large and range between 0.2 -0.4Ha. Population densities are low and range between 70-85 person per hectare. Good landscaping and clean environment. Examples include Palm Land Estates, Chapel Hill and Sekondi Ridge.
First Class SectorOccupied by senior civil servants and wealthy businessmen. There is adequate supply of services. Plot sizes are around 30m x 30m. The first class areas include Witison, Manayili Ridge and Fuo Extension
Low Density Medium Class Sector Started as state-owned estates for government staff. With time the quality of the estates has deteriorated. Densities are relatively low, as are growth rates. Population is middle income; infrastructure conditions are adequate. Examples include Dansoman Estates, North Kaneshie and Tesano
Newly Development SectorAreas in which there is rapid growth of infrastructure and housing owing to urbanisation. Plot sizes are 40m x 40m. Examples include Gbolo Dimala and Sognayili.
Low Density High Cost Sector (LDHCS) This area is populated by high income people with high levels of education and wealth. It as low density, low growth and infrastructure is adequate. Examples are Cantonments, Airport Residential and Ridge
New Developing Low Density Sector (NDLDS)Newly developing settlements usually on the city fringe. Evidence of lack of basic infrastructure but housing facilities is usually adequate. Rapid growth rate. Examples include Achimota and Mpeasem.
- -
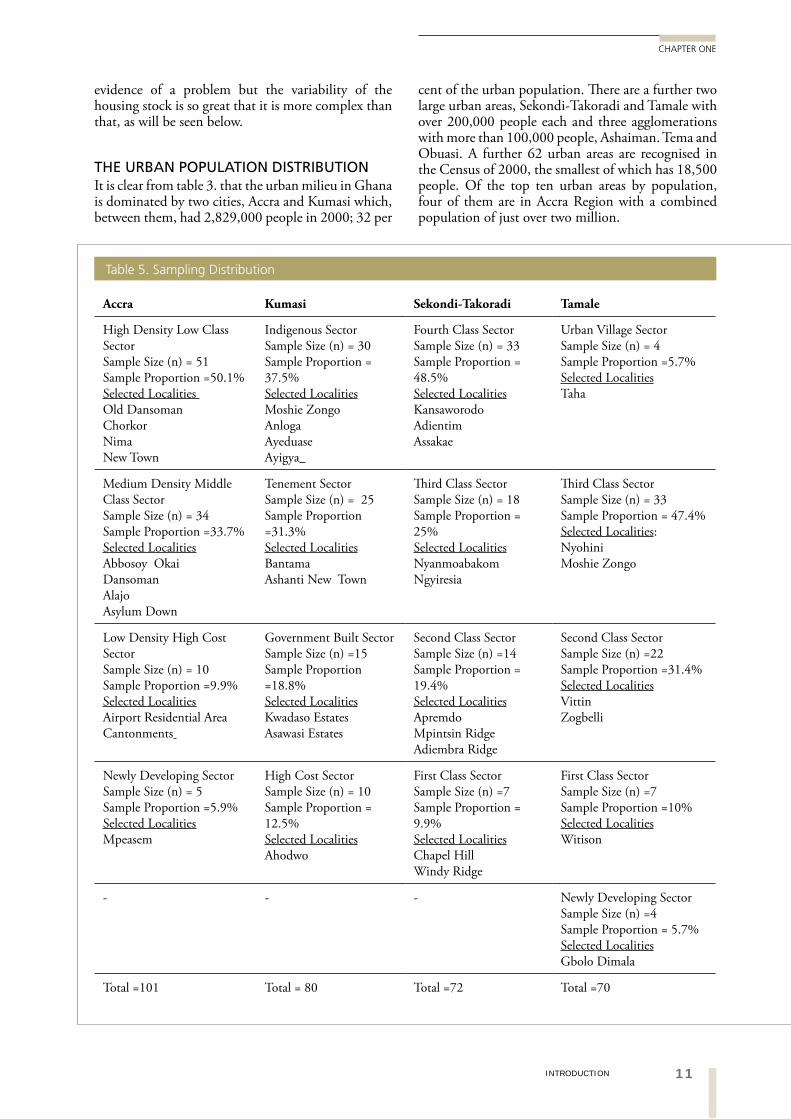
11INTRODUCTION
CHAPTER ONE
cent of the urban population. There are a further two large urban areas, Sekondi-Takoradi and Tamale with over 200,000 people each and three agglomerations with more than 100,000 people, Ashaiman. Tema and Obuasi. A further 62 urban areas are recognised in the Census of 2000, the smallest of which has 18,500 people. Of the top ten urban areas by population, four of them are in Accra Region with a combined population of just over two million.
evidence of a problem but the variability of the housing stock is so great that it is more complex than that, as will be seen below.
THE URBAN POPULATION DISTRIBUTIONIt is clear from table 3. that the urban milieu in Ghana is dominated by two cities, Accra and Kumasi which, between them, had 2,829,000 people in 2000; 32 per
Accra Kumasi Sekondi-Takoradi Tamale
High Density Low Class SectorSample Size (n) = 51Sample Proportion =50.1%Selected Localities Old DansomanChorkorNima New Town
Indigenous SectorSample Size (n) = 30Sample Proportion = 37.5%Selected LocalitiesMoshie ZongoAnlogaAyeduase Ayigya
Fourth Class SectorSample Size (n) = 33Sample Proportion = 48.5%Selected LocalitiesKansaworodoAdientimAssakae
Urban Village SectorSample Size (n) = 4Sample Proportion =5.7%Selected LocalitiesTaha
Medium Density Middle Class Sector Sample Size (n) = 34Sample Proportion =33.7%Selected LocalitiesAbbosoy Okai Dansoman Alajo Asylum Down
Tenement Sector Sample Size (n) = 25Sample Proportion =31.3%Selected LocalitiesBantamaAshanti New Town
Third Class SectorSample Size (n) = 18Sample Proportion = 25%Selected LocalitiesNyanmoabakomNgyiresia
Third Class SectorSample Size (n) = 33Sample Proportion = 47.4%Selected Localities: NyohiniMoshie Zongo
Low Density High Cost Sector Sample Size (n) = 10Sample Proportion =9.9%Selected LocalitiesAirport Residential AreaCantonments
Government Built SectorSample Size (n) =15Sample Proportion =18.8%Selected LocalitiesKwadaso EstatesAsawasi Estates
Second Class SectorSample Size (n) =14Sample Proportion = 19.4%Selected LocalitiesApremdoMpintsin RidgeAdiembra Ridge
Second Class SectorSample Size (n) =22Sample Proportion =31.4%Selected LocalitiesVittinZogbelli
Newly Developing SectorSample Size (n) = 5Sample Proportion =5.9%Selected LocalitiesMpeasem
High Cost SectorSample Size (n) = 10Sample Proportion = 12.5%Selected LocalitiesAhodwo
First Class SectorSample Size (n) =7Sample Proportion = 9.9%Selected LocalitiesChapel HillWindy Ridge
First Class SectorSample Size (n) =7Sample Proportion =10%Selected LocalitiesWitison
- - - Newly Developing SectorSample Size (n) =4Sample Proportion = 5.7%Selected LocalitiesGbolo Dimala
Total =101 Total = 80 Total =72 Total =70
Table 5. Sampling Distribution
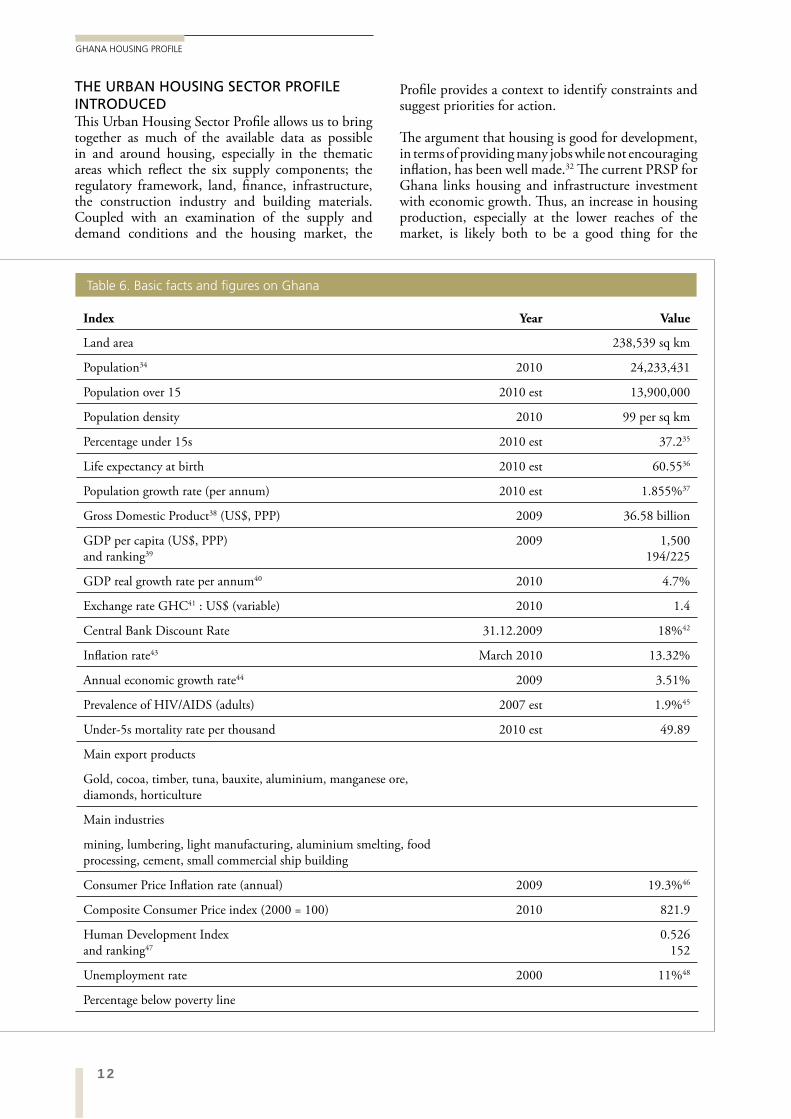
12
GHANA HOUSING PROFILE
THE URBAN HOUSING SECTOR PROFILE INTRODUCEDThis Urban Housing Sector Profile allows us to bring together as much of the available data as possible in and around housing, especially in the thematic areas which reflect the six supply components; the regulatory framework, land, finance, infrastructure, the construction industry and building materials. Coupled with an examination of the supply and demand conditions and the housing market, the
Profile provides a context to identify constraints and suggest priorities for action.
The argument that housing is good for development, in terms of providing many jobs while not encouraging inflation, has been well made.32 The current PRSP for Ghana links housing and infrastructure investment with economic growth. Thus, an increase in housing production, especially at the lower reaches of the market, is likely both to be a good thing for the
Index Year Value
Land area 238,539 sq km
Population34 2010 24,233,431
Population over 15 2010 est 13,900,000
Population density 2010 99 per sq km
Percentage under 15s 2010 est 37.235
Life expectancy at birth 2010 est 60.5536
Population growth rate (per annum) 2010 est 1.855%37
Gross Domestic Product38 (US$, PPP) 2009 36.58 billion
GDP per capita (US$, PPP) and ranking39
2009 1,500 194/225
GDP real growth rate per annum40 2010 4.7%
Exchange rate GHC41 : US$ (variable) 2010 1.4
Central Bank Discount Rate 31.12.2009 18%42
Inflation rate43 March 2010 13.32%
Annual economic growth rate44 2009 3.51%
Prevalence of HIV/AIDS (adults) 2007 est 1.9%45
Under-5s mortality rate per thousand 2010 est 49.89
Main export products
Gold, cocoa, timber, tuna, bauxite, aluminium, manganese ore, diamonds, horticulture
Main industries
mining, lumbering, light manufacturing, aluminium smelting, food processing, cement, small commercial ship building
Consumer Price Inflation rate (annual) 2009 19.3%46
Composite Consumer Price index (2000 = 100) 2010 821.9
Human Development Index and ranking47
0.526 152
Unemployment rate 2000 11%48
Percentage below poverty line
Table 6. Basic facts and figures on Ghana
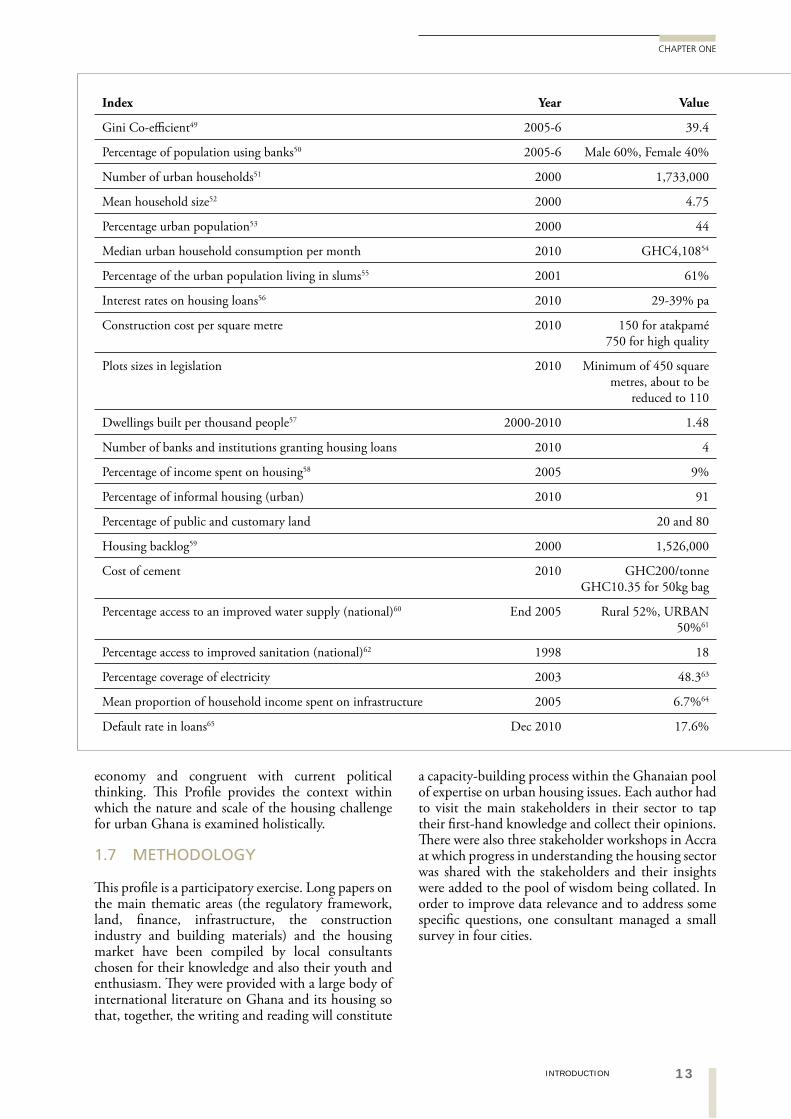
13INTRODUCTION
CHAPTER ONE
a capacity-building process within the Ghanaian pool of expertise on urban housing issues. Each author had to visit the main stakeholders in their sector to tap their first-hand knowledge and collect their opinions. There were also three stakeholder workshops in Accra at which progress in understanding the housing sector was shared with the stakeholders and their insights were added to the pool of wisdom being collated. In order to improve data relevance and to address some specific questions, one consultant managed a small survey in four cities.
economy and congruent with current political thinking. This Profile provides the context within which the nature and scale of the housing challenge for urban Ghana is examined holistically.
1.7 METHODOLOGY
This profile is a participatory exercise. Long papers on the main thematic areas (the regulatory framework, land, finance, infrastructure, the construction industry and building materials) and the housing market have been compiled by local consultants chosen for their knowledge and also their youth and enthusiasm. They were provided with a large body of international literature on Ghana and its housing so that, together, the writing and reading will constitute
Index Year Value
Gini Co-efficient49 2005-6 39.4
Percentage of population using banks50 2005-6 Male 60%, Female 40%
Number of urban households51 2000 1,733,000
Mean household size52 2000 4.75
Percentage urban population53 2000 44
Median urban household consumption per month 2010 GHC4,10854
Percentage of the urban population living in slums55 2001 61%
Interest rates on housing loans56 2010 29-39% pa
Construction cost per square metre 2010 150 for atakpamé 750 for high quality
Plots sizes in legislation 2010 Minimum of 450 square metres, about to be
reduced to 110
Dwellings built per thousand people57 2000-2010 1.48
Number of banks and institutions granting housing loans 2010 4
Percentage of income spent on housing58 2005 9%
Percentage of informal housing (urban) 2010 91
Percentage of public and customary land 20 and 80
Housing backlog59 2000 1,526,000
Cost of cement 2010 GHC200/tonne GHC10.35 for 50kg bag
Percentage access to an improved water supply (national)60 End 2005 Rural 52%, URBAN 50%61
Percentage access to improved sanitation (national)62 1998 18
Percentage coverage of electricity 2003 48.363
Mean proportion of household income spent on infrastructure 2005 6.7%64
Default rate in loans65 Dec 2010 17.6%
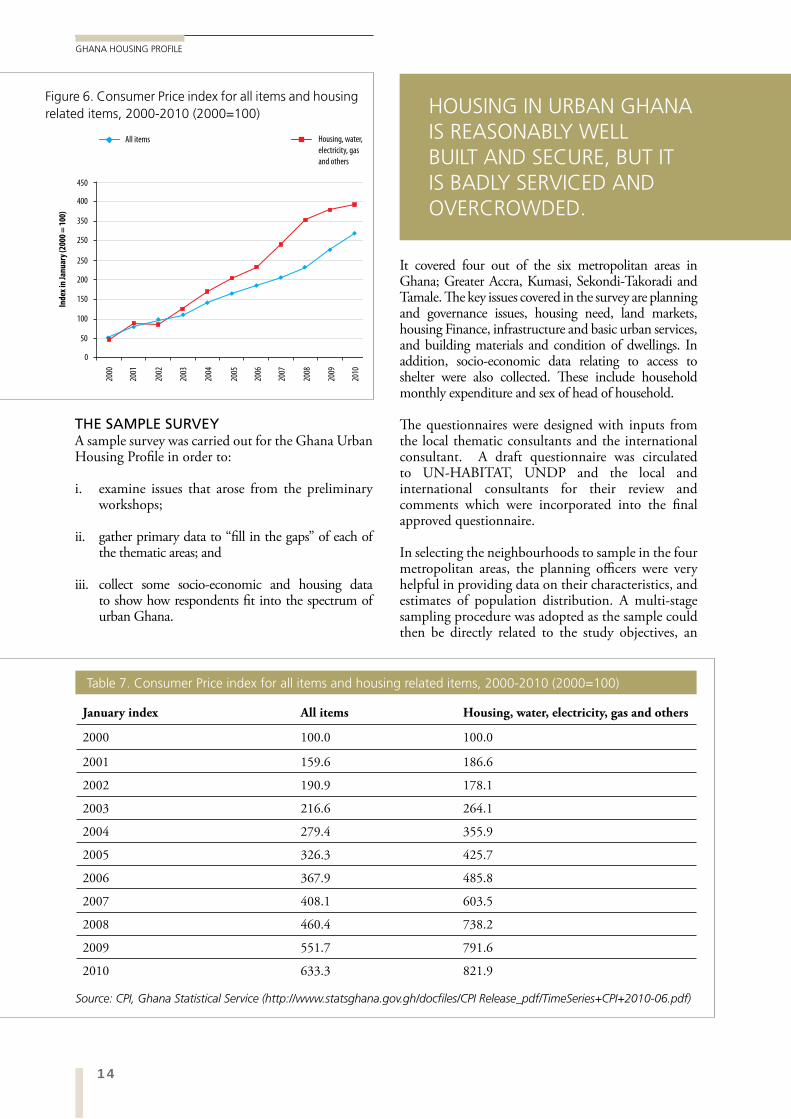
14
GHANA HOUSING PROFILE
THE SAMPLE SURVEYA sample survey was carried out for the Ghana Urban Housing Profile in order to:
i. examine issues that arose from the preliminary workshops;
ii. gather primary data to “fill in the gaps” of each of the thematic areas; and
iii. collect some socio-economic and housing data to show how respondents fit into the spectrum of urban Ghana.
It covered four out of the six metropolitan areas in Ghana; Greater Accra, Kumasi, Sekondi-Takoradi and Tamale. The key issues covered in the survey are planning and governance issues, housing need, land markets, housing Finance, infrastructure and basic urban services, and building materials and condition of dwellings. In addition, socio-economic data relating to access to shelter were also collected. These include household monthly expenditure and sex of head of household.
The questionnaires were designed with inputs from the local thematic consultants and the international consultant. A draft questionnaire was circulated to UN-HABITAT, UNDP and the local and international consultants for their review and comments which were incorporated into the final approved questionnaire.
In selecting the neighbourhoods to sample in the four metropolitan areas, the planning officers were very helpful in providing data on their characteristics, and estimates of population distribution. A multi-stage sampling procedure was adopted as the sample could then be directly related to the study objectives, an
2000
2001
2002
2003
2004
2005
2006
2007
2008
2009
2010
0
50
100
150
200
250
250
350
400
450
Inde
x in
Janu
ary (
2000
= 10
0)
All items Housing, water,
electricity, gas
and others
Figure 6. Consumer Price index for all items and housing related items, 2000-2010 (2000=100)
January index All items Housing, water, electricity, gas and others
2000 100.0 100.0
2001 159.6 186.6
2002 190.9 178.1
2003 216.6 264.1
2004 279.4 355.9
2005 326.3 425.7
2006 367.9 485.8
2007 408.1 603.5
2008 460.4 738.2
2009 551.7 791.6
2010 633.3 821.9
Table 7. Consumer Price index for all items and housing related items, 2000-2010 (2000=100)
Source: CPI, Ghana Statistical Service (http://www.statsghana.gov.gh/docfiles/CPI Release_pdf/TimeSeries+CPI+2010-06.pdf)
HOUSING IN URBAN GHANA IS REASONABLY WELL BUILT AND SECURE, BUT IT IS BADLY SERVICED AND OVERCROWDED.
15INTRODUCTION
CHAPTER ONE
1.8 BASIC DATA FOR GHANA
In the data on costs and values, the housing sector profile uses the consumer prices index (CPI) to determine 2010 values of earlier figures. Table 7. and Figure 6 show the annual CPI for 2000 to 2010, with 2000 = 100. It is evident that inflation is fairly steady but has affected housing and service payments more than ‘all items’. The former is 29 per cent higher than the latter in 2010. However, considering the rise in prices of services, the figures do not give much support to the commonly-held perception that housing is increasingly expensive. This follows on from the work of Tipple et al.66 who showed the error of a similar perception of increases in the cost of housing compared with other commodities in the 1990s.
approach that has been used in the Ghana Living Standard Survey (GLSS) and the Ghana Demographic Health Survey (GDHS).
The first stage of sampling involved the selection of four out of the six metropolitan areas in Ghana. The housing sector profile selected the first four cities in Ghana by population as they best represented the urban housing challenge. Within them, localities were selected from the residential sectors identified locally in each, mindful of the social dynamics and characteristics within each city. Table 4. shows the identified residential sectors in each metropolitan area.
SECTION ENDNOTES
1 Government of Ghana (1992b).2 Starting in 1943 as a wartime measure.3 Institute of Statistical Social and Economic Research (ISSER) (2010); US Department of State4 US Department of State (2010).5 World Bank (2009a).6 Roe (1991).7 However, private investment failed to grow to more than 9 per cent of GDP despite SAP reforms
intended to stimulate the private sector.8 Opoku (2010).9 Opoku (2010).10 Government of Ghana (2000).11 Karley and Akomea (2007).12 COHRE (2004 citing Songsore and McGranahan, 2000).13 COHRE (2004).14 Tipple (2005b) shows that planners fears over home-based enterprises are largely unfounded.15 Weeks et al.(2007).16 Angel, Sheppard et al.(2005).17 COHRE (2004).18 http://hdr.undp.org/en/data/trends/.19 http://earthtrends.wri.org/povlinks/country/ghana.php accessed 10.10.10.20 Ghana Statistical Service (2008).21 Ghana Statistical Service (2008).22 Ghana Statistical Service (2008).23 Ghana Statistical Service (2008).24 “Home is the place where, when you have to go there, they have to take you in.” Robert Frost, North
of Boston 1915, The Death of the Hired Man25 Tipple and Speak (2009).26 Amole et al. (1993); Korboe (1992a).27 Obeng-Odoom (2010).28 UN-HABITAT (UN-HABITAT, 2009).29 UN-HABITAT (2009).30 Obeng-Odoom (2010).
16
GHANA HOUSING PROFILE
31 Ghana Statistical Service (2002a).32 Tipple (1995); UNCHS/ILO (1995).33 Sources- Accra: UNDP (1992), Kumasi: Tipple (1996), Sekondi-Takoradi: Shama Ahanta East Metropolitan
Assembly (2006), Tamale: Consultations with Metropolitan Planning Officer34 Early census 2010 output.35 www.cia.gov.36 www.cia.gov.37 www.cia.gov.38 IndexMundi39 IndexMundi40 IndexMundi41 The Ghanaian cedi was redenominated on July 1st, 2007, so that one new cedi was worth 10,000 old
cedis. 42 www.cia.gov.43 Bank of Ghana44 GDP Growth (Constant Prices, National Currency) http://www.economywatch.com/economic-statistics/
country/Ghana/45 www.cia.gov.46 www.cia.gov.47 “The HDI provides a composite measure of three dimensions of human development: living a long
and healthy life (measured by life expectancy), being educated (measured by adult literacy and enrolment at the primary, secondary and tertiary level) and having a decent standard of living (measured by purchasing power parity, PPP, income)” (UNDP, 2008)
48 www.cia.gov.49 www.cia.gov.50 Those having savings accounts according to GLSS5 table 10.8.51 Ghana Census 2000.52 Ghana Census 2000.53 Ghana Census 2000.54 Calculated from the urban means to reflect the same relationship between the means and medians as in
the Ghana figures in GLSS 5 (Ghana Statistical Service, 2008).55 Government of Ghana (2002).56 Bank of Ghana website.57 Accepting the commonly mentioned 35,000 dwellings a year production estimate.58 GLSS 5 (Ghana Statistical Service, 2008), Expenditure as a proxy for income. Spending on housing, water
electricity and gas.59 Obeng-Odoom (2010).60 http://earthtrends.wri.org/povlinks/country/ghana.php accessed 10.10.10.61 See chapter 8.62 http://earthtrends.wri.org/povlinks/country/ghana.php accessed 10.10.10.63 Government of Ghana (2002: table 1).64 GLSS 5 (Ghana Statistical Service, 2008).65 Bank of Ghana reported in http://news.myjoyonline.com/business/201102/61645.asp accessed 7th
March, 2011.66 Tipple et al. (1999).
17POLICY, INSTITUTIONAL AND LEGAL FRAMEWORKS
CHAPTER TWO
02POLICY, INSTITUTIONAL AND
LEGAL FRAMEWORKS1
2.1 THE POLICY ENVIRONMENT
In Ghana, the majority of housing is provided by the people for themselves through local contractors on land alienated to them by local land-holding chiefs under customary ownership. By contrast, official housing policy and its formal implementation are very centralised functions of the state which pay little regard to local needs. Before the 2000 Housing and Population Census established the scale and nature of the housing stock in Ghana, housing policy formulation depended on very crude and highly variable estimates based on a link between households and houses within a context of reducing crowding (see chapter 5). There has also been little regard for effective demand which takes into account the capacity of potential beneficiaries to afford housing. In addition, only housing conditions in Accra and, to some extent, Kumasi have dominated the concerns of policy makers.
Policies affecting housing are made by many ministries to fit into their own view of the world and seem to lack co-ordination among them. For example, for many years rental housing was recognised as the most important supply mechanism for low-income households but the tax laws, which taxed ‘unearned’ rental income higher than ‘earned’ salaries, and the rent control laws, which sought to keep households’ costs down, severely limited incomes from rent.2 In addition, building regulations prevented the use of local earth-based materials and planning regulations virtually outlawed compound houses. All of these reduced the supply of cheap rental housing when it was sorely needed.
There have been three National Housing Policies but they have not had easy paths to implementation. The 1986 National Housing Policy and Action Plan (1987 – 1990) stalled partly because of a proposal to establish a national housing fund with mandatory contributions from the state and, another, imposing taxes on building materials imports.3 The 1992
National Shelter Strategy, developed with the assistance of UN-HABITAT, stalled after it had been submitted to Cabinet for approval, partly because the impetus for a housing policy had weakened substantially. A review of it was commissioned using a consulting team in 1999 and completed in 2000. Again this stalled after its submission to Cabinet, partly owing to the lack of political commitment to the finalisation of the policy document in the light of other political realities.
Five years later, the government4 initiated another round of reviews with the support of UN-HABITAT5 using the task team approach. This review is still on-going, having largely completed all the processes required before being submitted to Cabinet for approval. In this respect, the Ministry of Water Resources, Works and Housing deems the Housing Sector Profile to be important in establishing the baseline conditions of the housing sector.
The rather complex structure for developing housing policy is shown in figure 7.
HOUSING POLICY WITHIN THE NATIONAL DEVELOPMENT AGENDA Overlaying the specific housing policy statement is the long-term national development agenda. In early national development plans, housing tended to be grouped within social welfare. Urban housing did not feature in the various phases of the Structural Adjustment Programme from the mid-1980s to 2000s6 in which there was a rural housing improvement component in the mitigating actions under PAMSCAD.7 In 2003, the government adopted the Ghana Poverty Reduction Strategy (2003 – 2005) as a national development framework. In it, housing interventions were prescribed implicitly within the context of social development objectives;
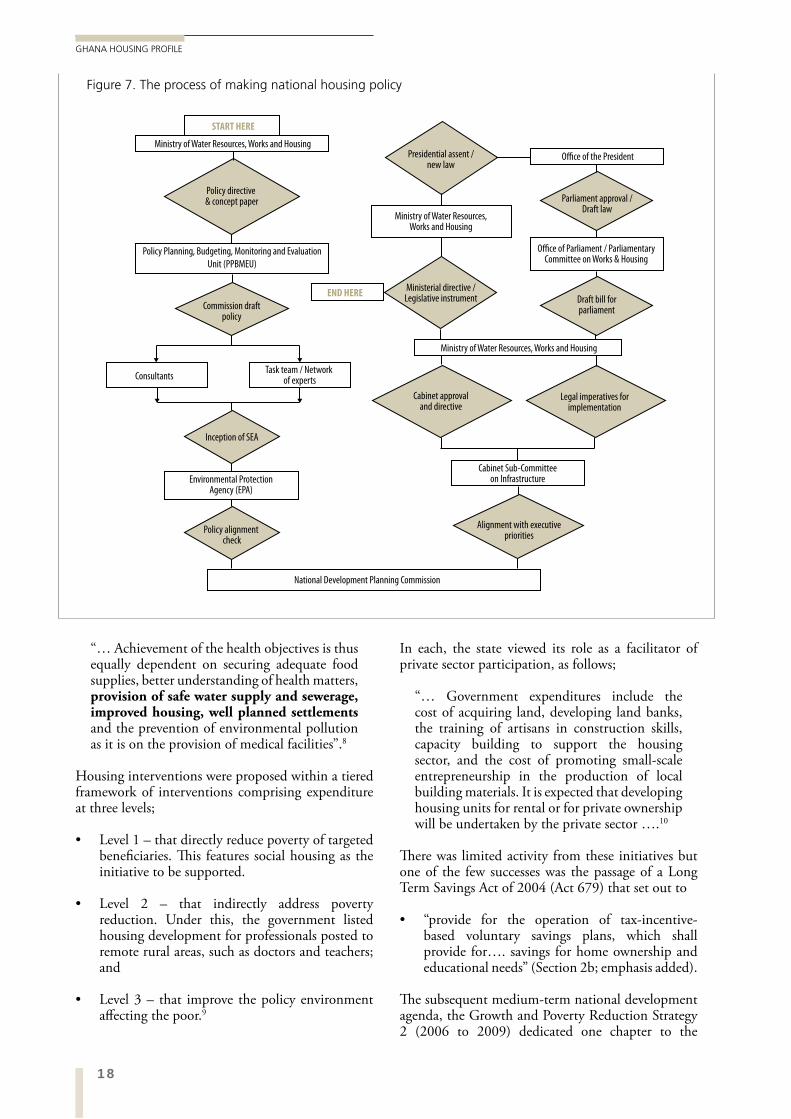
18
GHANA HOUSING PROFILE
“… Achievement of the health objectives is thus equally dependent on securing adequate food supplies, better understanding of health matters, provision of safe water supply and sewerage, improved housing, well planned settlements and the prevention of environmental pollution as it is on the provision of medical facilities”.8
Housing interventions were proposed within a tiered framework of interventions comprising expenditure at three levels;
Level 1 – that directly reduce poverty of targeted beneficiaries. This features social housing as the initiative to be supported.
Level 2 – that indirectly address poverty reduction. Under this, the government listed housing development for professionals posted to remote rural areas, such as doctors and teachers; and
Level 3 – that improve the policy environment affecting the poor.9
In each, the state viewed its role as a facilitator of private sector participation, as follows;
“… Government expenditures include the cost of acquiring land, developing land banks, the training of artisans in construction skills, capacity building to support the housing sector, and the cost of promoting small-scale entrepreneurship in the production of local building materials. It is expected that developing housing units for rental or for private ownership will be undertaken by the private sector ….10
There was limited activity from these initiatives but one of the few successes was the passage of a Long Term Savings Act of 2004 (Act 679) that set out to
“provide for the operation of tax-incentive-based voluntary savings plans, which shall provide for…. savings for home ownership and educational needs” (Section 2b; emphasis added).
The subsequent medium-term national development agenda, the Growth and Poverty Reduction Strategy 2 (2006 to 2009) dedicated one chapter to the
START HERE
END HERE
Ministry of Water Resources, Works and Housing
Consultants
Inception of SEA
Task team / Network of experts
Environmental Protection Agency (EPA)
Policy alignment check
National Development Planning Commission
Policy directive & concept paper
Policy Planning, Budgeting, Monitoring and Evaluation
Unit (PPBMEU)
Presidential assent / new law
Office of the President
Ministry of Water Resources, Works and Housing
Parliament approval / Draft law
Office of Parliament / Parliamentary Committee on Works & Housing
Draft bill for parliament
Legal imperatives for implementation
Ministerial directive / Legislative instrument
Cabinet approval and directive
Cabinet Sub-Committee on Infrastructure
Alignment with executive priorities
Ministry of Water Resources, Works and Housing
Commission draft policy
Figure 7. The process of making national housing policy
19POLICY, INSTITUTIONAL AND LEGAL FRAMEWORKS
CHAPTER TWO
for the production of “safe and sanitary shelter”.11 However, land banks are not featured in the Growth and Poverty Reduction Strategy 2 (2006 – 2009) but re-appear in the draft (2010 – 2013) National Development Framework.12 Currently, the government has signed an agreement with STX Engineering and Construction of South Korea for a US$10 billion facility aimed at developing a 200,000 public housing programme to take advantage of these land banks. The first tranche are to be built for police and military personnel.
2.2 THE LEGAL AND REGULATORY FRAMEWORKS RELATED TO HOUSING
LAND OWNERSHIP
Constitution of Ghana Chapter 20 Clause 257 (1 – 5) – Vestment of public lands in President
All public land in Ghana is vested in the President on behalf of, and in trust for, the people of Ghana. Public land includes any land which has been vested in the Government of Ghana for the public service of Ghana, and any other land acquired in the public interest. All vested lands in the Northern, Upper East and Upper West Regions revert to the original owners.
Constitution of Ghana Chapter 20 Clause 266 (1 – 5) – Exclusion of foreigners from freehold leasesNon-Ghanaians are excluded from freehold interest in land in Ghana and any existing freehold held by non-Ghanaians is deemed to be a leasehold for fifty years from 1969 reverting to the state upon the expiry of the lease. Non-Ghanaians cannot hold leases of land beyond fifty years.
Constitution of Ghana Chapter 20 Clause 267 (1 – 9) – Stool and Skin Lands and PropertyAll land belongs to the indigenous settlers and is vested in the appropriate stool or skin on behalf of, and in trust for the subjects of the stool in accordance with customary law and usage. No stool or skin land can be disposed off unless the intended development is in compliance with the development plan of the area. No person(s) shall hold a freehold interest in, or right over, any stool land in Ghana.
The Office of the Administrator of Stool Lands shall be responsible for safe administration of rents, dues, and royalties. revenues or other payments and their disbursement as follows; 10 per cent to the office of the Administrator of Stool Lands to cover administrative expenses, and of the remaining amount, 25 per cent to the stool, 20 per cent to the traditional authority; and 55 per cent to the District Assembly.
housing and urban development sector which remains the current policy statement on housing within the framework of the national development agenda. Recognising that housing supply is good for economic development, its thrust is using slum upgrading and urban regeneration to resolving the challenges in the sector. In addition two principal strategies are proposed, namely to promote urban infrastructure development and provision of basic services and increase access to safe and affordable shelter.
The NPP administration (2000–2008) initiated new national development priorities for the period 2010 to 2013 to succeed the GPRS2 of 2006-09, but they lost the election of December 2008 and the NDC has yet to continue or replace the work in progress. The proposed housing interventions are more detailed in the draft 2010 – 2013 Medium Term National Development Policy Framework than those of the preceding development policy framework representing an increase in the profile of housing in the national development priorities.
BUDGETS AS POLICY STATEMENTS IN HOUSINGThere have been several initiatives to promote direct and indirect housing interventions announced through provisions within annual budgets. They include;
Rent control and regulations which have tended to discourage landlords from investing in housing supply.
Expropriation of land on behalf of the public housing agencies, currently as an incentive for private sector investments in high quality housing through;
Publicly-held land being sold to the private sector for redevelopment of high-income communities, both on virgin land and in currently very low-density neighbourhoods such as Cantonments in Accra;
Other public land being handed back to indigenous ownership, especially in Accra; and
The creation of new land banks either through expropriation or collaborations with owners who are willing to participate in partnerships or outright sale of their land.
In the Ghana Poverty Reduction Strategy 1 (2003 – 2005), government-acquired land banks (see chapter 6) are listed as part of the state’s contribution in partnership arrangements with the private sector
20
GHANA HOUSING PROFILE
Stamp Duty Act, 2005 (Act 689)
This Act provides regulations on the setting of values for the applicable ad valorem duty to be charged for stamping documents pertaining the ownership or transaction of land or built property and the associated administrative processes required.
LAND USE PLANNING
CAP 84 Town and Country Planning Ordinance
This set up a framework for spatial planning that originated from the colonial era and emphasised master planning. It regulates the use of land and also provides for the orderly and progressive development of land, towns and cities, in a manner that preserves and improves amenities. It gives authority to the Town and Country Department, as the government’s statutory agency in the declaration of planning areas in any part of the country. It has been distorted by the passage of the Local Government Law (1993, Act 462) which over-emphasises development planning and limits more strategic spatial planning.
DEVELOPMENT CONTROL
Local Government Law 1993 - Act 462 Sections 49 to 57These sections detail MMDAs’ right to grant permits for development of land and to demolish properties constructed without building permit.
HOUSING FINANCE / FORECLOSURE/ MORTGAGE
Building Society Ordinance 1955 (No.30)This regulates the establishment of building societies to assist members to acquire housing by savings and loans. Building Societies must be registered. Their income is tax-exempt except that derived from a business carried on by the society
Co-operative Societies Act, 1968 (NLCD252)
This requires all cooperatives to be registered with the Registrar of Co-operative Societies. The law permits variation in the extent of the liabilities assumed by members.
PNDCL 329 Home Mortgage Finance Law 1993
This law was established solely for HFC and the listed participating banks in the pilot secondary mortgage mechanism. The law requires HFC to provide funds to finance mortgage loans originated by selected banks and, thereby, ensure liquidity to the identified participating banks listed in the law. It initiated the Secondary Mortgage Market (SMM) as a means of creating a sustained housing finance market in the country. It gave HFC the right to foreclose without
State Lands Act, 1962 (Act 125) – Compulsory acquisition of land by the state
The President (acting on behalf of the state) has the power to acquire the absolute interest in any land for use in the “public interest”. However, the Act did not define the definition of “public interest”. Provision is made for payment of compensation, estimated at the open market value, or land of equivalent value may be offered as compensation.
LAND MANAGEMENTThe following introduces the legislation which affects housing in any way.
Lands Registry Act, 1962 (Act 122)
Introduced to repeal earlier colonial registration, the Land Registry Act provided for the registration of all instruments affecting land together with a plan or map with the description of the land. The purpose of the Act is to record the evidence of which instrument was registered first, it does not confer title. The system has not ensured security of title to avoid litigation as registration does not confer title on the person in whose name the deed is registered.13
The Act allows for some instruments to be registered without survey plans and does not provide for any systematic adjudication process. It excludes oral transactions that might have been validly conducted in the customary system.
Conveyancing Decree of 1973 (NRCD 175)
All conveyances are required to be in writing but oral grants under customary law are exempted although they must be recorded by the court registrar. The incentive for recording such customary land transfers is that they are of no legal effect unless recorded.
Land Title Registration Act, 1986 (PNDCL 152)
This introduced land title registration, albeit to a limited section of the country (mainly Accra, Tema and Kumasi), with the intention of scaling up to all other parts of the country. The registration must be preceded by a preliminary investigation on any underlying rights.
The Land Title Registration Law provides for the registration of all interests held under customary and common law. The interests to be registered include allodial title, usufruct/ customary law freehold, freehold, leasehold, customary tenancies and mineral licences.
Land Title Regulation, 1986 L.I. 1241
This is a mechanism for the registration of title to, and interests in, land. Title Registration has two purposes, first to give certainty and facilitate proof of title; second, to render dealings in land safe, simple and cheap as well as prevent fraud on purchasers and mortgagees14)
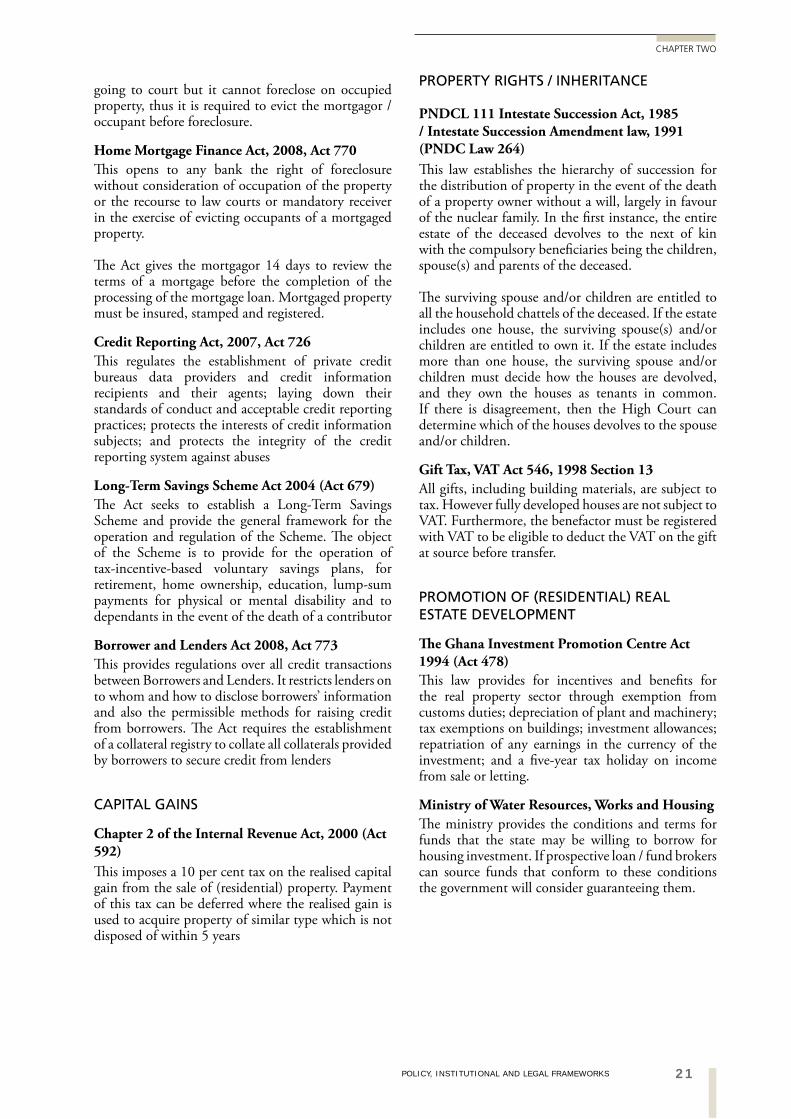
21POLICY, INSTITUTIONAL AND LEGAL FRAMEWORKS
CHAPTER TWO
going to court but it cannot foreclose on occupied property, thus it is required to evict the mortgagor / occupant before foreclosure.
Home Mortgage Finance Act, 2008, Act 770
This opens to any bank the right of foreclosure without consideration of occupation of the property or the recourse to law courts or mandatory receiver in the exercise of evicting occupants of a mortgaged property.
The Act gives the mortgagor 14 days to review the terms of a mortgage before the completion of the processing of the mortgage loan. Mortgaged property must be insured, stamped and registered.
Credit Reporting Act, 2007, Act 726
This regulates the establishment of private credit bureaus data providers and credit information recipients and their agents; laying down their standards of conduct and acceptable credit reporting practices; protects the interests of credit information subjects; and protects the integrity of the credit reporting system against abuses
Long-Term Savings Scheme Act 2004 (Act 679)
The Act seeks to establish a Long-Term Savings Scheme and provide the general framework for the operation and regulation of the Scheme. The object of the Scheme is to provide for the operation of tax-incentive-based voluntary savings plans, for retirement, home ownership, education, lump-sum payments for physical or mental disability and to dependants in the event of the death of a contributor
Borrower and Lenders Act 2008, Act 773
This provides regulations over all credit transactions between Borrowers and Lenders. It restricts lenders on to whom and how to disclose borrowers’ information and also the permissible methods for raising credit from borrowers. The Act requires the establishment of a collateral registry to collate all collaterals provided by borrowers to secure credit from lenders
CAPITAL GAINS
Chapter 2 of the Internal Revenue Act, 2000 (Act 592)
This imposes a 10 per cent tax on the realised capital gain from the sale of (residential) property. Payment of this tax can be deferred where the realised gain is used to acquire property of similar type which is not disposed of within 5 years
PROPERTY RIGHTS / INHERITANCE
PNDCL 111 Intestate Succession Act, 1985 / Intestate Succession Amendment law, 1991 (PNDC Law 264)
This law establishes the hierarchy of succession for the distribution of property in the event of the death of a property owner without a will, largely in favour of the nuclear family. In the first instance, the entire estate of the deceased devolves to the next of kin with the compulsory beneficiaries being the children, spouse(s) and parents of the deceased.
The surviving spouse and/or children are entitled to all the household chattels of the deceased. If the estate includes one house, the surviving spouse(s) and/or children are entitled to own it. If the estate includes more than one house, the surviving spouse and/or children must decide how the houses are devolved, and they own the houses as tenants in common. If there is disagreement, then the High Court can determine which of the houses devolves to the spouse and/or children.
Gift Tax, VAT Act 546, 1998 Section 13
All gifts, including building materials, are subject to tax. However fully developed houses are not subject to VAT. Furthermore, the benefactor must be registered with VAT to be eligible to deduct the VAT on the gift at source before transfer.
PROMOTION OF (RESIDENTIAL) REAL ESTATE DEVELOPMENT
The Ghana Investment Promotion Centre Act 1994 (Act 478)
This law provides for incentives and benefits for the real property sector through exemption from customs duties; depreciation of plant and machinery; tax exemptions on buildings; investment allowances; repatriation of any earnings in the currency of the investment; and a five-year tax holiday on income from sale or letting.
Ministry of Water Resources, Works and Housing
The ministry provides the conditions and terms for funds that the state may be willing to borrow for housing investment. If prospective loan / fund brokers can source funds that conform to these conditions the government will consider guaranteeing them.
22
GHANA HOUSING PROFILE
Interest Rate - 1.5 per cent (Maximum 3.5 per cent per annum)
Grace Period - 8 years
Loan Repayment Period - 15-25 years
Commitment Fees - 0.25 per cent
Grant Element - At least 35 per cent
RENT
Rent Act, 1963, Act 220Important measures include that landlords can charge rent in advance of not more than 6 months and succeeding rents are due every six months. In relation to recovery of possession and ejection, the provisions require that a tenant can be ejected for non-payment of rent within one month. All landlords must use rent cards to help to prevent disputes over rent payments. Section 19 states that rents should not increase just because property rates have without prior notice to the tenant in writing and unless the increase has been approved by the appropriate Rent Officer.
Landlords can evict tenants if their rooms are needed for members of the landlord’s family. The implementation of the Rent Act has also divergd from the expectation. In reality, it applies only for a segment of the society and, even then, not in its full form. The conditions for charging rent advance are ignored, with for two or three years being demanded up-front as a norm, and the conditions for eviction are not consistently applied. This has inevitably created a sub-culture of antagonism between tenants and owners in the low-income rental market. It is arguable that this situation contributes substantially to the lack of growth in new investments in low-income rentals (Andreasen et al., 2005). This also explains why some house owners’ requiring prospective tenants to invest directly in the construction of “chamber and hall” units in compound houses in developing areas and converting the investment into a rental period.15
Rent Tax – Act 592 Internal Revenue Act, 2000
The Internal Revenue Service is empowered to impose tax on income derived from rent revenue accruing from properties let for the purpose of renting or leasing. The withholding tax on rent income is 8 per cent.
CONSTRUCTION
LI 1630 National Building Regulations 1996
These regulations apply to the erection, alteration or extension of buildings in the country and grant the right of approval over all construction activities to
local authorities and impose compliance requirements on all prospective developers.
In the event that the local authority fails to respond to an application for a building permit for 3 months, prospective developers gain the automatic right to initiate or continue with the construction activities without the official approval granted to the assembly.
Building materials standards
Standards of building materials and construction practices were developed by the Ghana Standards Board in 1988 and feature in the Ghana Building Code. There are no codes for local building materials and they have not been revised since they were passed (see chapter 9).
A number of key instruments are currently under review. The laws affecting land ownership, use, management and planning are all under review as part of the Land Administration Project (LAP). Under LAP, laws and guidelines related to land ownership and management are being collated, reviewed and revised to simplify them and impose coherence and consistency. Similar revisions are also being undertaken on laws related to planning and land use, particularly the primary law, the Town and Country Planning Ordinance (CAP 84), which has not been revised since 1954 and has not been integrated into the current decentralisd planning framework.
2.3 EFFECTS OF GOVERNMENT INITIATIVES AND INCENTIVES TO BUILD HOUSING
There are some incentives for housing offered by the Ghana Investment Promotion Centre and the Ministry of Water Resources, Works and Housing but they have not yielded any benefits for the urban poor or the informal sector.
As part of the package of interventions to induce private sector investments in the housing sector, the
THE RENTING OF ROOMS HAS BEEN IGNORED IN POLICY EXCEPT TO MAKE IT MORE DIFFICULT FOR LANDLORDS TO PROVIDE THEM. RENT CONTROL LED TO MUCH POORER QUALITY OF HOUSING THAN MIGHT HAVE BEEN.
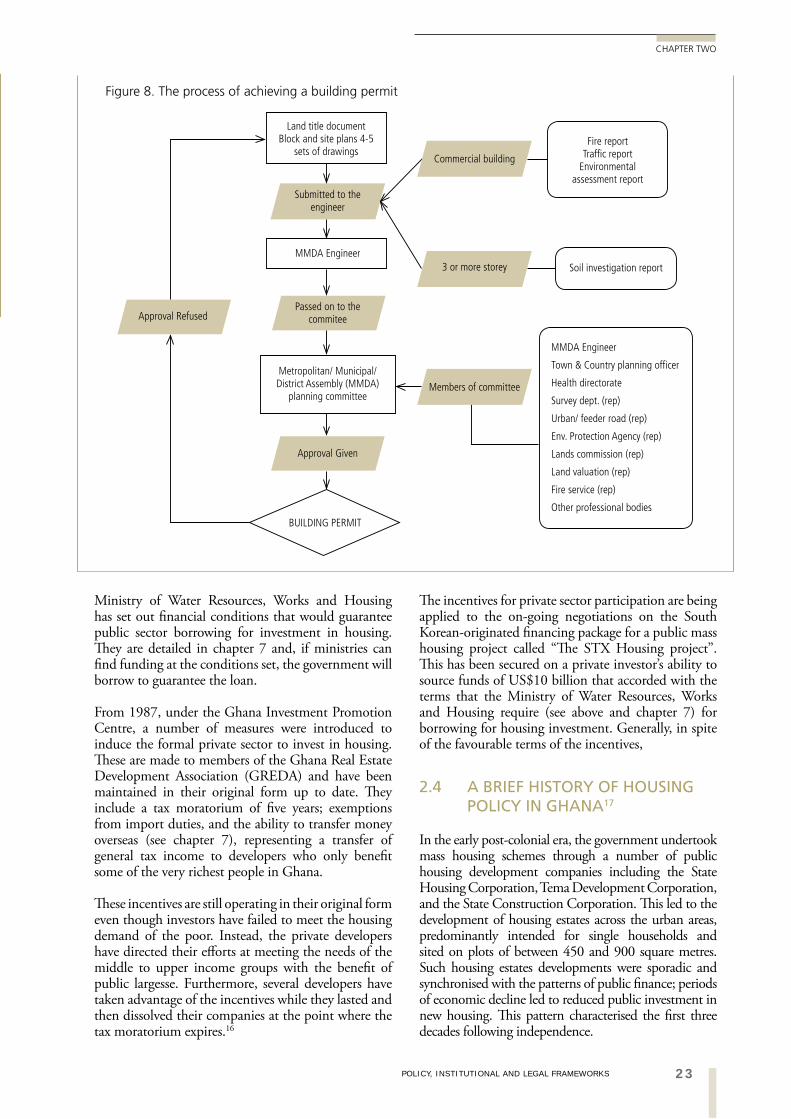
23POLICY, INSTITUTIONAL AND LEGAL FRAMEWORKS
CHAPTER TWO
Ministry of Water Resources, Works and Housing has set out financial conditions that would guarantee public sector borrowing for investment in housing. They are detailed in chapter 7 and, if ministries can find funding at the conditions set, the government will borrow to guarantee the loan.
From 1987, under the Ghana Investment Promotion Centre, a number of measures were introduced to induce the formal private sector to invest in housing. These are made to members of the Ghana Real Estate Development Association (GREDA) and have been maintained in their original form up to date. They include a tax moratorium of five years; exemptions from import duties, and the ability to transfer money overseas (see chapter 7), representing a transfer of general tax income to developers who only benefit some of the very richest people in Ghana.
These incentives are still operating in their original form even though investors have failed to meet the housing demand of the poor. Instead, the private developers have directed their efforts at meeting the needs of the middle to upper income groups with the benefit of public largesse. Furthermore, several developers have taken advantage of the incentives while they lasted and then dissolved their companies at the point where the tax moratorium expires.16
The incentives for private sector participation are being applied to the on-going negotiations on the South Korean-originated financing package for a public mass housing project called “The STX Housing project”. This has been secured on a private investor’s ability to source funds of US$10 billion that accorded with the terms that the Ministry of Water Resources, Works and Housing require (see above and chapter 7) for borrowing for housing investment. Generally, in spite of the favourable terms of the incentives,
2.4 A BRIEF HISTORY OF HOUSING POLICY IN GHANA17
In the early post-colonial era, the government undertook mass housing schemes through a number of public housing development companies including the State Housing Corporation, Tema Development Corporation, and the State Construction Corporation. This led to the development of housing estates across the urban areas, predominantly intended for single households and sited on plots of between 450 and 900 square metres. Such housing estates developments were sporadic and synchronised with the patterns of public finance; periods of economic decline led to reduced public investment in new housing. This pattern characterised the first three decades following independence.
Land title documentBlock and site plans 4-5
sets of drawings
Metropolitan/ Municipal/ District Assembly (MMDA)
planning committee
Submitted to the engineer
Passed on to the commitee
Approval Given
Approval Refused
BUILDING PERMIT
MMDA Engineer
Members of committee
3 or more storey
Commercial building
Fire reportTraffic report
Environmental assessment report
MMDA Engineer
Town & Country planning officer
Health directorate
Survey dept. (rep)
Urban/ feeder road (rep)
Env. Protection Agency (rep)
Lands commission (rep)
Land valuation (rep)
Fire service (rep)
Other professional bodies
Soil investigation report
Figure 8. The process of achieving a building permit
24
GHANA HOUSING PROFILE
The Nkrumah government (1951 to 1966) also dabbled in a prefabricated concrete framed housing scheme and established the First Ghana Building Society in June 1956. The Roof Loan Scheme, initiated by the Abrams–Bodiansky–Koenisberger UN mission to Ghana in 1954 and 1955, granted loans of £56018 for participants to construct roofs and standardised doors and windows of their dwellings provided they had strong walls and would participate in a cooperative arrangement. It operated from 1956, but only in rural areas instead of in urban areas as recommended, and was eventually curtailed in the 1980s after many thousands of rural households had been assisted.
The 1961 Doxiadis plan for the new Tema Township, to house the industries located there because of the new Tema Harbour, called for the development of 24 “communities” to house a total population of 250,000 by 1985. It was implemented with no changes.
By repudiating international debts, coupled with the high cocoa export prices in the aftermath of the military coup, the National Redemption Council (NRC) regime generated substantial finance for a development agenda that included public housing. The Low Cost Housing Programme in 1972 was granted substantial funding for three additional TDC communities in Tema and State Housing Company and State Construction Corporation development of several housing estates in Accra (Dansoman Estates), Tema (Ashaiman, Sakumono and Manhean) and Kumasi (Chirapatre).19 It only achieved 6,092 dwellings out of the target of 23,000 but this period represented the highest level of public housing delivery up to that time.20
The NRC government established the Bank for Housing and Construction (BHC) in 1973, to support housing and construction in general. However, as it was not allowed to operate commercially, it proved unsustainable in the long run. In 1975, the government established the Public Servants Housing Loans Scheme and the Armed Forces Mortgage Loans Scheme to support these two favoured groups. Funds came from the budget for lending to beneficiaries at 10 per cent below the market rates that hovered around 30 per cent per annum. The schemes had processed only 435 loans by 1988 (33 per annum).
The Bank for Housing and Construction (BHC) set up a subsidiary, the Real Estate Development Company (REDCO), to develop the REDCO Estates in Accra from 1977. The project took so long to complete that it suffered land encroachment by private developers benefiting from illegal land resale by the original owners, and by dwindling funds as a result of high interest rates and depleting foreign reserves. The project only completed 236 dwellings.21
From the mid-1970s to the mid-1980s, Ghana was dogged by rising inflation, shortage of building materials and the decline of the public housing developers. In order to mitigate these difficulties, BHC and TDC tried to reduce the cost of their operations through investing in brick and tile factories across the country. However none of these bore any lasting results. By the start of the Structural Adjustment Programme (SAP) in 1984-5, virtually all of these factories were listed for divestiture of state ownership.
In 1985, the government invited the World Bank to assist in the upgrading of the urban centres in the country leading to the resuscitation of the earlier cancelled Ghana Urban Development Project of 1972. It was renamed the Accra District Rehabilitation Project and initiated the re-involvement of international agencies in Ghana’s housing sector. Some local initiatives also emerged. A task team developed a draft housing policy that was published by the Housing Ministry in November 1986. It was not adopted, however, because of the mandatory financial contribution of the state and the levying of taxes on imported building materials to finance a National Housing Fund.
By this time, SSNIT had accrued funds following the deregulation of its investment portfolios22 and it was guided by the government back into constructing over 7,000 dwellings between 1988 and 2000 across the major cities and towns. These were mostly allocated to civil servants and managed as rental units. However by 1997, SSNIT recognised that the maintenance of these dwellings was not covered by the rents and decided to sell them off, first to sitting tenants and then to other prospective clients. Even though the price was very low, the sale of the rental units became subject to speculation.23
From 2000 to the present day, there has not been a ratified housing policy document. The draft National Shelter Strategy has been reviewed twice, in 1999-2000 and from 2005 onwards. None of these reviews have yielded housing initiatives at any appreciable level.
THE CURRENT BUILDING REGULATIONS INSIST ON STANDARDS AND MATERIALS BEYOND THE REACH OF POOR HOUSEHOLDS.
25POLICY, INSTITUTIONAL AND LEGAL FRAMEWORKS
CHAPTER TWO
Currently, the housing supply institutional framework is focusing on improving materials and encouraging private developers in the hope that they will lead to high-quality housing for workers in secure employment. Apart from some upgrading of poor neighbourhoods, little in policy addresses the needs of the majority of urban dwellers; to obtain a foothold in the city at a price affordable on low incomes.
2.5 CROSS-CUTTING ISSUES
There has been little in the regulatory framework to privilege the poor, people with disabilities or women in the housing process. It might be expected, however, that the poor would have at least some housing regulations or laws that worked in their favour in the supply or distribution of housing. When the Roof Loans Scheme was formulated in the 1950s, it was a good opportunity for pro-poor housing interventions. In one respect, by promulgating it for the rural areas, the poor were reached in unprecedented numbers and, in that, it was a success. It was intended, however, for urban implementation where it could have been very important in the improvement of traditional compound houses at prices almost all owners could afford. This was not to be.
Since then, and in common with much Sub-Saharan African practice, whenever governments have used rhetoric to target low-income household or ‘workers’,
it has been the middle classes that have benefited. Even the very low quality dwellings from pre-independence projects were targeted civil servants and other formal sector workers. Currently, whenever the poor try to improve their housing conditions, especially if it means owning a dwelling, they come up against high interest rates, high loan ceilings both in amount and qualification incomes, and high standards of building required.
The renting of rooms, which is the poor’s main housing strategy, has also been ignored in policy except to make it more difficult for landlords to provide them. While interventions such as Rent Control and the Rent Control Office meant well, the former led to much poorer quality of housing than might have been and the latter only intervenes after trouble has started.
The current building regulations insist on standards and materials beyond the reach of poor households. While local earth-based materials are technically allowed if a good scientific case can be made for their durability, but this disqualifies them to all intents and purposes. At the same time, plots are very large and tend to be alienated to people whose status increases that of the land-holding community. Thus, the poor are being increasingly confined to the dense inner-city neighbourhoods where they increase occupancy rates by crowding into existing rooms and densities by extending existing housing.
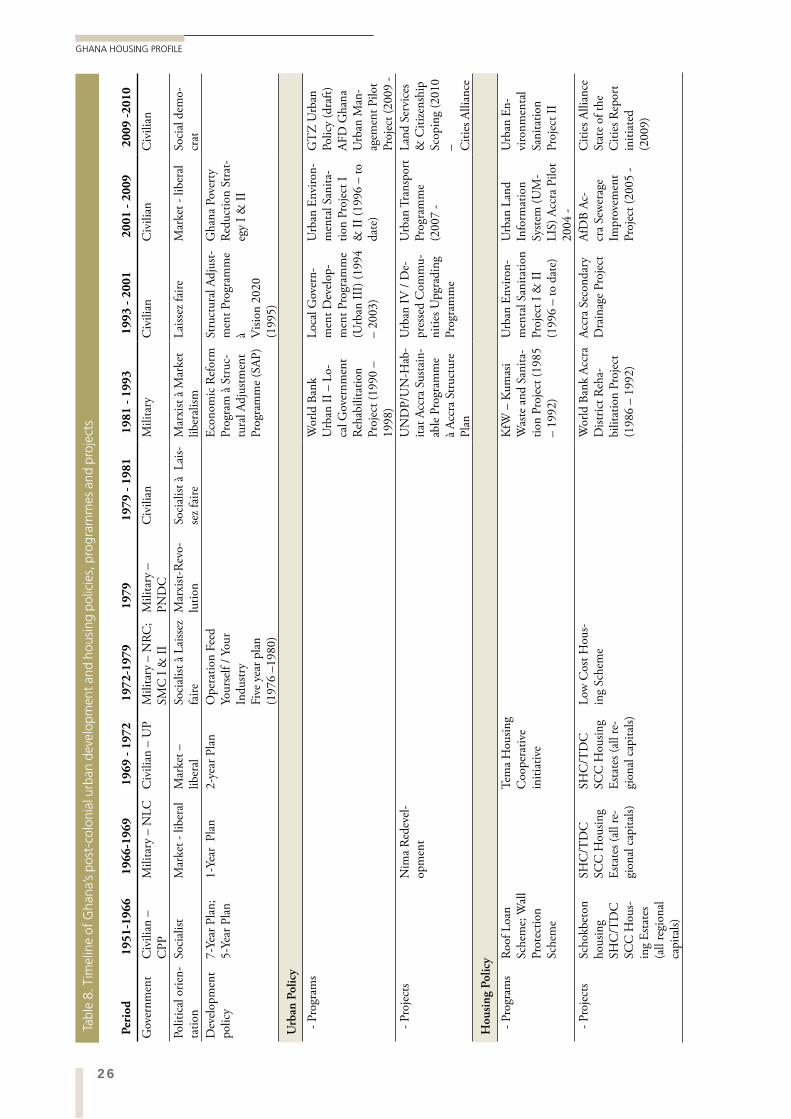
26
GHANA HOUSING PROFILE
Per
iod
19
51
-19
66
19
66
-19
69
19
69
- 1
97
21
97
2-1
97
91
97
91
97
9 -
19
81
19
81
- 1
99
31
99
3 -
20
01
20
01
- 2
00
92
00
9 -
20
10
Gov
ernm
ent
Civ
ilian
–
CPP
Mili
tary
– N
LC
Civ
ilian
– U
PM
ilita
ry –
NRC
; SM
C I
& II
Mili
tary
–
PND
CC
ivili
anM
ilita
ryC
ivili
anC
ivili
anC
ivili
an
Polit
ical
orie
n-ta
tion
Soci
alist
M
arke
t - li
bera
l M
arke
t –
liber
alSo
cial
ist à
Lai
ssez
fa
ireM
arxi
st-Re
vo-
lutio
nSo
cial
ist à
Lai
s-se
z fai
reM
arxi
st à
Mar
ket
liber
alism
Laiss
ez fa
ireM
arke
t - li
bera
lSo
cial
dem
o-cr
atD
evel
opm
ent
polic
y7-
Year
Pla
n;
5-Ye
ar P
lan
1-Ye
ar P
lan
2-ye
ar P
lan
Ope
ratio
n Fe
ed
Your
self
/ You
r In
dustr
yFi
ve y
ear p
lan
(197
6 –1
980)
Econ
omic
Ref
orm
Pr
ogra
m à
Str
uc-
tura
l Adj
ustm
ent
Prog
ram
me
(SAP
)
Stru
ctur
al A
djus
t-m
ent P
rogr
amm
e à V
ision
202
0 (1
995)
Gha
na P
over
ty
Redu
ctio
n St
rat-
egy
I & II
Urb
an P
oli
cy
- P
rogr
ams
Wor
ld B
ank
Urb
an II
– L
o-ca
l Gov
ernm
ent
Reha
bilit
atio
n Pr
ojec
t (19
90 –
19
98)
Loca
l Gov
ern-
men
t Dev
elop
-m
ent P
rogr
amm
e (U
rban
III)
(199
4 –
2003
)
Urb
an E
nviro
n-m
enta
l San
ita-
tion
Proj
ect I
&
II (1
996
– to
da
te)
GT
Z U
rban
Po
licy
(dra
ft)AF
D G
hana
U
rban
Man
-ag
emen
t Pilo
t Pr
ojec
t (20
09 -
- P
roje
cts
Nim
a Re
deve
l-op
men
tU
ND
P/U
N-H
ab-
itat A
ccra
Sus
tain
-ab
le P
rogr
amm
e à
Accr
a St
ruct
ure
Plan
Urb
an IV
/ D
e-pr
esse
d C
omm
u-ni
ties U
pgra
ding
Pr
ogra
mm
e
Urb
an T
rans
port
Pr
ogra
mm
e (2
007
-
Land
Ser
vice
s &
Citi
zens
hip
Scop
ing
(201
0 – C
ities
Alli
ance
Ho
usi
ng
Po
licy
- P
rogr
ams
Roof
Loa
n Sc
hem
e; W
all
Prot
ectio
n Sc
hem
e
Tem
a H
ousin
g C
oope
rativ
e in
itiat
ive
KfW
– K
umas
i W
aste
and
San
ita-
tion
Proj
ect (
1985
–
1992
)
Urb
an E
nviro
n-m
enta
l San
itatio
n Pr
ojec
t I &
II
(199
6 –
to d
ate)
Urb
an L
and
Info
rmat
ion
Syste
m (U
M-
LIS)
Acc
ra P
ilot
2004
-
Urb
an E
n-vi
ronm
enta
l Sa
nita
tion
Proj
ect I
I
- P
roje
cts
Scho
kbet
on
hous
ing
SHC
/TD
C
SCC
Hou
s-in
g Es
tate
s (a
ll re
gion
al
capi
tals)
SHC
/TD
C
SCC
Hou
sing
Esta
tes (
all r
e-gi
onal
cap
itals)
SHC
/TD
C
SCC
Hou
sing
Esta
tes (
all r
e-gi
onal
cap
itals)
Low
Cos
t Hou
s-in
g Sc
hem
eW
orld
Ban
k Ac
cra
Dist
rict R
eha-
bilit
atio
n Pr
ojec
t (1
986
– 19
92)
Accr
a Se
cond
ary
Dra
inag
e Pr
ojec
tAf
DB
Ac-
cra
Sew
erag
e Im
prov
emen
t Pr
ojec
t (20
05 -
Citi
es A
llian
ce
Stat
e of
the
Citi
es R
epor
t in
itiat
ed
(200
9)
Tabl
e 8.
Tim
elin
e of
Gha
na’s
post
-col
onia
l urb
an d
evel
opm
ent a
nd h
ousi
ng p
olic
ies,
pro
gram
mes
and
pro
ject
s
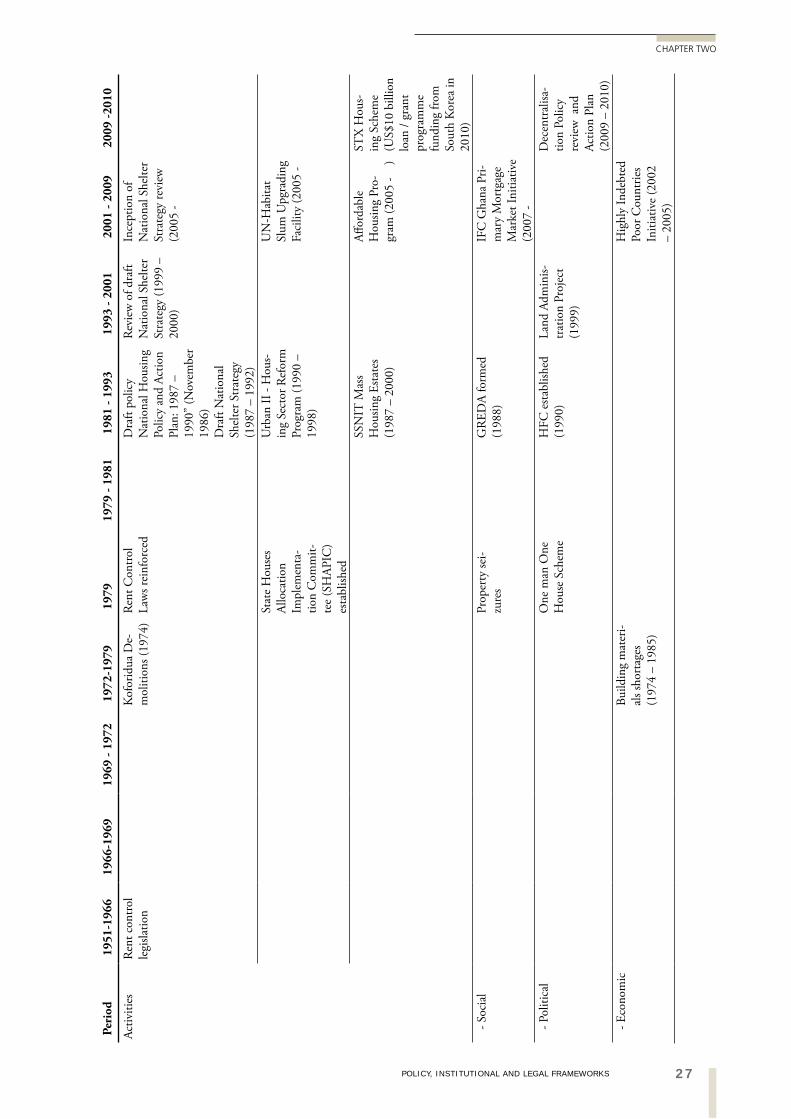
27POLICY, INSTITUTIONAL AND LEGAL FRAMEWORKS
CHAPTER TWO
Per
iod
19
51
-19
66
19
66
-19
69
19
69
- 1
97
21
97
2-1
97
91
97
91
97
9 -
19
81
19
81
- 1
99
31
99
3 -
20
01
20
01
- 2
00
92
00
9 -
20
10
Activ
ities
Rent
con
trol
legi
slatio
n K
ofor
idua
De-
mol
ition
s (19
74)
Rent
Con
trol
Law
s rei
nfor
ced
Dra
ft po
licy
Nat
iona
l Hou
sing
Polic
y an
d Ac
tion
Plan
: 198
7 –
1990
” (N
ovem
ber
1986
) D
raft
Nat
iona
l Sh
elte
r Str
ateg
y
(198
7 –
1992
)
Revi
ew o
f dra
ft N
atio
nal S
helte
r St
rate
gy (1
999
– 20
00)
Ince
ptio
n of
N
atio
nal S
helte
r St
rate
gy re
view
(2
005
-
Stat
e H
ouse
s Al
loca
tion
Impl
emen
ta-
tion
Com
mit-
tee
(SH
APIC
) es
tabl
ished
Urb
an II
- H
ous-
ing
Sect
or R
efor
m
Prog
ram
(199
0 –
1998
)
UN
-Hab
itat
Slum
Upg
radi
ng
Faci
lity
(200
5 -
SSN
IT M
ass
Hou
sing
Esta
tes
(198
7 –
2000
)
Affor
dabl
e H
ousin
g Pr
o-gr
am (2
005
- )
STX
Hou
s-in
g Sc
hem
e (U
S$10
bill
ion
loan
/ gr
ant
prog
ram
me
fund
ing
from
So
uth
Kor
ea in
20
10)
- S
ocia
lPr
oper
ty se
i-zu
res
GR
EDA
form
ed
(198
8)IF
C G
hana
Pri-
mar
y M
ortg
age
Mar
ket I
nitia
tive
(200
7 -
- P
oliti
cal
One
man
One
H
ouse
Sch
eme
HFC
esta
blish
ed
(199
0)La
nd A
dmin
is-tr
atio
n Pr
ojec
t (1
999)
Dec
entr
alisa
-tio
n Po
licy
revi
ew a
nd
Actio
n Pl
an
(200
9 –
2010
)
- Eco
nom
icBu
ildin
g m
ater
i-al
s sho
rtag
es
(197
4 –
1985
)
Hig
hly
Inde
bted
Po
or C
ount
ries
Initi
ativ
e (2
002
– 20
05)
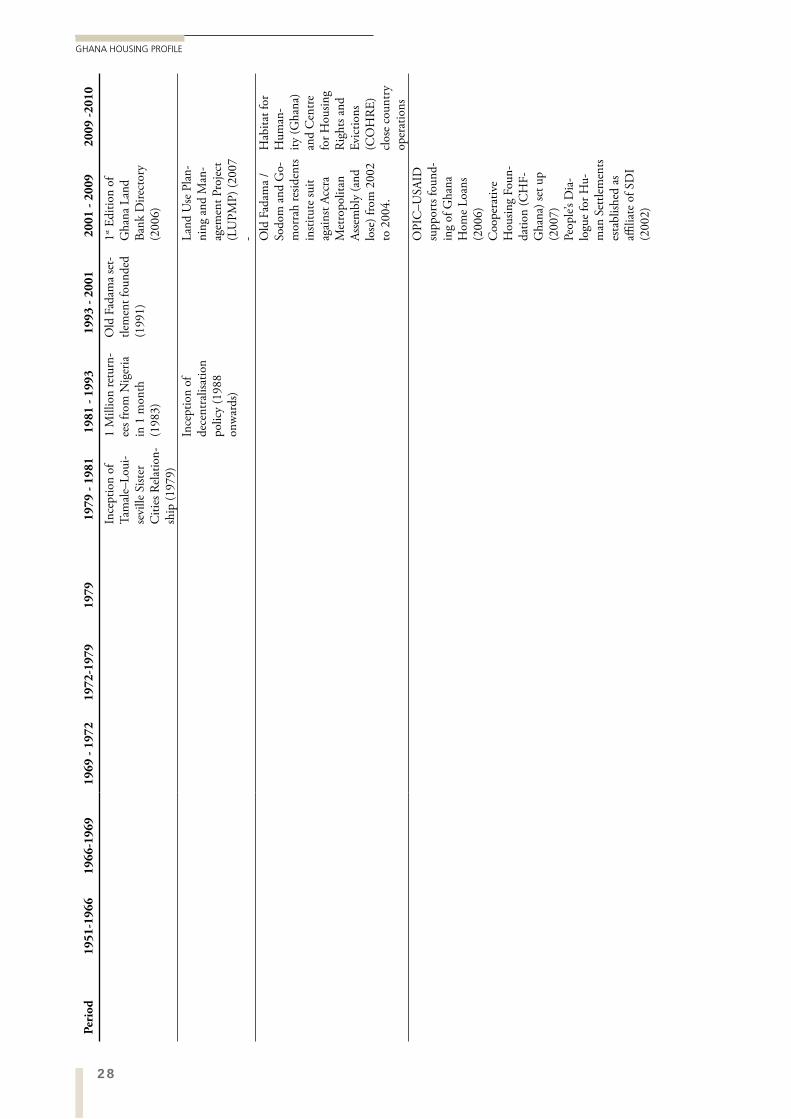
28
GHANA HOUSING PROFILE
Per
iod
19
51
-19
66
19
66
-19
69
19
69
- 1
97
21
97
2-1
97
91
97
91
97
9 -
19
81
19
81
- 1
99
31
99
3 -
20
01
20
01
- 2
00
92
00
9 -
20
10
Ince
ptio
n of
Ta
mal
e–Lo
ui-
sevi
lle S
ister
C
ities
Rel
atio
n-sh
ip (1
979)
1 M
illio
n re
turn
-ee
s fro
m N
iger
ia
in 1
mon
th
(198
3)
Old
Fad
ama
set-
tlem
ent f
ound
ed
(199
1)
1st Edi
tion
of
Gha
na L
and
Bank
Dire
ctor
y (2
006)
Ince
ptio
n of
de
cent
ralis
atio
n po
licy
(198
8 on
war
ds)
Land
Use
Pla
n-ni
ng a
nd M
an-
agem
ent P
roje
ct
(LU
PMP)
(200
7 - O
ld F
adam
a /
Sodo
m a
nd G
o-m
orra
h re
siden
ts in
stitu
te su
it ag
ains
t Acc
ra
Met
ropo
litan
As
sem
bly
(and
lo
se) f
rom
200
2 to
200
4.
Hab
itat f
or
Hum
an-
ity (G
hana
) an
d C
entre
fo
r Hou
sing
Rig
hts a
nd
Evic
tions
(C
OH
RE)
cl
ose
coun
try
oper
atio
nsO
PIC
–USA
ID
supp
orts
foun
d-in
g of
Gha
na
Hom
e Lo
ans
(200
6)C
oope
rativ
e H
ousin
g Fo
un-
datio
n (C
HF-
Gha
na) s
et u
p (2
007)
Peop
le’s D
ia-
logu
e fo
r Hu-
man
Set
tlem
ents
esta
blish
ed a
s affi
liate
of S
DI
(200
2)
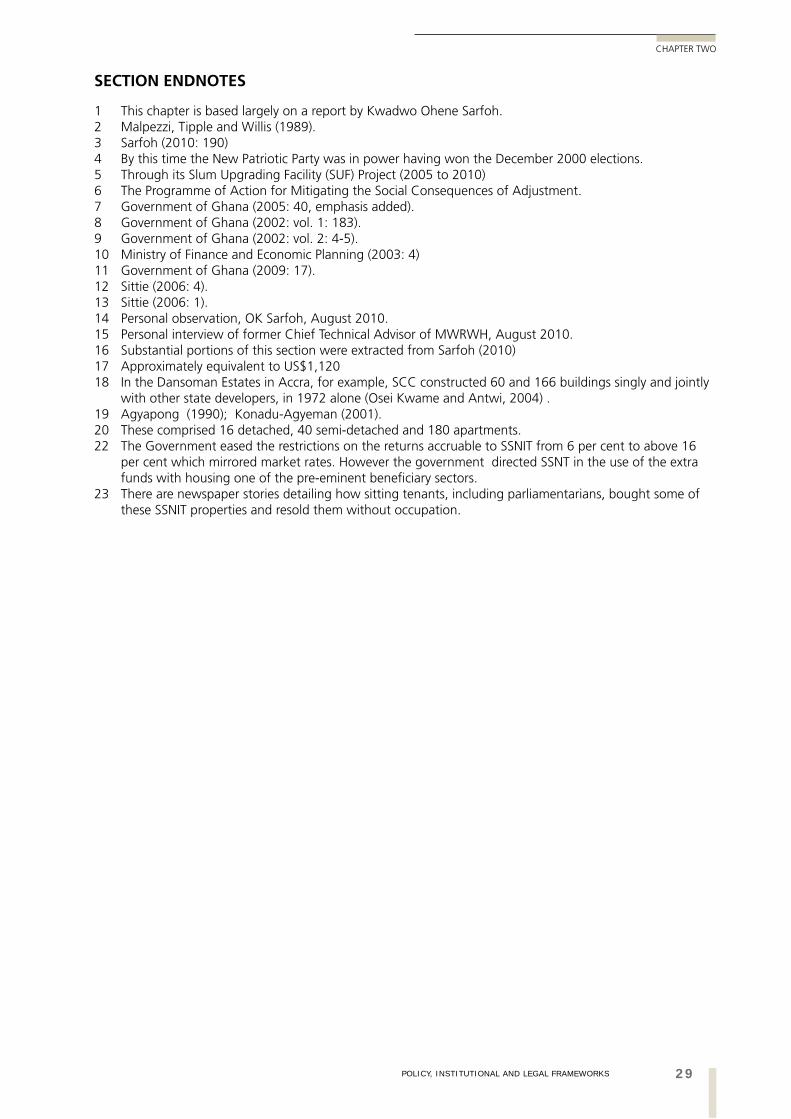
29POLICY, INSTITUTIONAL AND LEGAL FRAMEWORKS
CHAPTER TWO
SECTION ENDNOTES
1 This chapter is based largely on a report by Kwadwo Ohene Sarfoh.2 Malpezzi, Tipple and Willis (1989).3 Sarfoh (2010: 190)4 By this time the New Patriotic Party was in power having won the December 2000 elections.5 Through its Slum Upgrading Facility (SUF) Project (2005 to 2010)6 The Programme of Action for Mitigating the Social Consequences of Adjustment.7 Government of Ghana (2005: 40, emphasis added).8 Government of Ghana (2002: vol. 1: 183).9 Government of Ghana (2002: vol. 2: 4-5).10 Ministry of Finance and Economic Planning (2003: 4)11 Government of Ghana (2009: 17).12 Sittie (2006: 4).13 Sittie (2006: 1).14 Personal observation, OK Sarfoh, August 2010.15 Personal interview of former Chief Technical Advisor of MWRWH, August 2010.16 Substantial portions of this section were extracted from Sarfoh (2010)17 Approximately equivalent to US$1,12018 In the Dansoman Estates in Accra, for example, SCC constructed 60 and 166 buildings singly and jointly
with other state developers, in 1972 alone (Osei Kwame and Antwi, 2004) .19 Agyapong (1990); Konadu-Agyeman (2001).20 These comprised 16 detached, 40 semi-detached and 180 apartments.22 The Government eased the restrictions on the returns accruable to SSNIT from 6 per cent to above 16
per cent which mirrored market rates. However the government directed SSNT in the use of the extra funds with housing one of the pre-eminent beneficiary sectors.
23 There are newspaper stories detailing how sitting tenants, including parliamentarians, bought some of these SSNIT properties and resold them without occupation.
30
GHANA HOUSING PROFILE
3.1 INTRODUCTION
Housing in urban Ghana is mainly supplied by individual householders rather than any institutional players.
3.2 TRADITIONAL SECTOR PLAYERS
INDIVIDUAL HOUSEHOLDS AND SMALL-SCALE CONTRACTORSAbout 90 per cent of all housing is provided by a mixture of individual households who decide to become owners and the contractors whom they engage to do the building. Households, usually led by someone in their later working life, will decide that they have saved enough to start to develop a dwelling. They will obtain land from customary land holders and engage a contractor whom they find through personal recommendation. In the informal sector, they may not have drawings but, instead, ask for a house like one they already know well. The contractor works with other tradesmen and labourers to build with the materials the householder provides. The latter may have to pay the workers directly each day or week. When money or materials run out, the job is delayed until they are available again. In this way, the dwelling is built over many years. When infrastructure is required, the owner negotiates with the providers directly.
This system is efficient in that it occurs on many sites across the country at any one time. However, it is inefficient in that delays in starting and completing occur because of a lack of finance, both for the owner and for the contractor.
TRADITIONAL LEADERS & CUSTOMARY LANDOWNERSMost land in Ghana is communally owned by the indigenous tribal groups which operate through their traditional social structures, which can be matrilineal
or patrilineal, and their customary hierarchies of governance. These systems affect who can own land and how customary land transactions are conducted. By extension, they affect who is building and where housing will be located. Although the land is communally owned by entire indigenous groups, the management of the land is customarily vested in the traditional chiefs and elders of the principal families of these indigenous groups. The underlying philosophy of communal land management compels chiefs and elders to adopt an inter-generational land conservation and social equity perspective, withholding absolute ownership of land from non-indigenes and assigning rights of use to indigenes.
Selling land is traditionally not acceptable but contemporary urbanisation has generated high commercial values for urban land and changed the token “drink money”2 payment into a market price. Currently “drink money” is paid for urban land at a level equivalent to open market commercial values. In spite of the increased commercial values of land and the prospects of relatively large income streams accruing from the drink money, it still remains a “closed” transaction to the chief ’s subjects. This lack of transparency and accountability for the “drink money” is generating the rapidly growing incidence of fraudulent land transactions by competing interests surrounding chieftaincy and leadership of the indigenous groups.
Some traditional groups, such as the Ga-Dangme groups and their respective Traditional Council, operate a federal system of governance by which sub-groups are equal with no absolute monarchy presiding. Among such groups the structure is further delineated along clans, quarters and families all of whom have powers of land allocation and transaction without recourse to a central authority. On the other hand, Akan tribal groups – Ashanti, Akwapim, Fanti, Akyem and Kwahu – operate centralised systems with ultimate authority vested in one chieftain (the Asantehene) who directly controls
03KEY PLAYERS IN HOUSING1
31KEY PLAYERS IN HOUSING
CHAPTER THREE
systems in place, furthermore, to determine significant qualitative issues, such as user satisfaction, locational preferences etc. This is in spite of the existence of public agencies with the mandate to provide such information, such as the BRRI.
There are also discontinuities of policy and organisation between macroeconomic strategy and housing policy; relationships between them are obscure at best with no evidence of trying to make the relationship work. The national economic development framework set out in multi-year plans and annual budget statements indicate policy priorities. But no strategies within them have demonstrated any link between the housing sector and the economy as a whole. Thus, potential benefits to be gained from shared policy with industrialisation and employment are lost. This weakness has led to the housing sector being described as an “orphan” sector4.
Horizontally, there are very weak links between the central government policy and the local government level where housing development actually takes place. Central government periodically engages directly in housing development and allocation with little recourse to local government planning and needs. Indeed, central government housing development has significantly distorted the spatial growth of many cities in Ghana through the sprawl effects when public estates have been developed at the urban periphery. This constitutes passive local governments being affected by a sporadically activist central government
all land sales by proxy but has the right to conduct specific negotiations on any parcel of land or to interfere with any land transactions undertaken by any of the proxies. Another dimension of customary land holding and its effect on housing is the influence of the type of lineage system practiced. Matrilineal property rights favour descendants from the female siblings of the male property owner. On this basis spouses and children cannot directly inherit property of deceased property owners and this is the system in use in the majority of Akan groups. On the other hand patrilineal groups, such as the Ga-Adangme, decide property rights through a direct relationship to the father or male property owner. Currently, customary land ownership accounts for 80 per cent of all land in Ghana.3
3.3 FORMAL SECTOR PLAYERS
Though the formal system is so complex that it will need many pages to review it, the reader must note that its contribution is probably no more than 10 per cent of all dwellings and an even smaller percentage of rooms. Furthermore, it only supplies to the middle class and high income households so has almost no positive role for the majority of the people except for employing some of them in the construction process.
Many of the key formal sector players are currently having very small roles in housing supply. Their presence in the profile, and the importance attached to them in government planning for housing, is mainly owing to their past performance and the purposes for which they were set up. These must be understood in any analysis of the housing system in Ghana.
THE INSTITUTIONAL GAP BETWEEN POLICY-MAKING AND IMPLEMENTATIONHousing policy in Ghana occurs predominantly in the public realm but delivery and market relations occur in the private realm and there is very little synchronisation or shared aspirations between the two. This mismatch has persisted since colonial times and is responsible for much of the spatial disharmony of the cities of Ghana.
Within the public and private realms, further discontinuities exist that complicate the local housing context. These function ‘vertically’, between the hierarchies of the state, and ‘horizontally’ across related sectors. Within the public realm, the written public housing policy and programmes appear not to have much of an evidence base.
Accounts of the existing and projected levels of housing needs, demand and supply are ambiguous and have generated unreliable statistics. There are no
Box 1. Difficulties in using housing data for urban Ghana
Data for housing are difficult to access and use.
Until 2000, the national population census did not include data on the conditions of housing or on its distribution across the country. The housing conditions data collected in the 2000 Census, however, provides no indication of the effective demand of households.
The indices for determining inflation do not include housing costs on their own, but bind them in with services.
Since 1997, the Building and Roads Research Institute (BRRI) in Kumasi has been publishing basic price lists for key building materials. Such evidence of changes in construction sector prices, however, has mainly been used by construction cost estimators for public agencies and building contractors and has barely registered in the policy discussions.
The consequent effects of these price changes on key policy indicators, such as rent price levels, numbers of housing starts and completions, etc., have not been charted.
32
GHANA HOUSING PROFILE
not concerned with the existing and projected local housing needs and demands or housing supply frameworks.
In turn, or as a consequence, local governments seem to have no sense of the particular needs of the urban poor and other vulnerable groups in their locality, treating all of their residents the same. This feeds into an intolerance with the poor quality of housing for low-income households and promotes the pro-eviction stance of most urban local governments.
Arising from all this, there is a substantial gap between the development, management and improvement of urban infrastructure on one hand and the housing development choices and systems of individuals on the other. Consequently, when areas are improved through donor-funded projects, richer people displace poorer. Indeed market-led displacement is far more common than politically-determined eviction.
The disconnection between central government policy and housing supply is a challenge of vertical coherence. In the current institutional framework of housing supply, the role of MMDAs is confined to development control; they do not undertake assessments of local effects of housing supply policies.
In addition to the discontinuities within the public realm, there is a critical lack of cohesion between the public and private roles in the supply of housing. Decision-making about housing involves the choice of location and the land acquisition. The prospective developer must ensure that the proposed development conforms to the planned land use for that location. This puts the individual developer into the gap between land allocators (customary owner groups) and land use planners (within the MMDA). Because there are too few development control staff, haphazard layouts and abuse of the planning process arise across all urban centres in Ghana, despite the presence of formal approval procedures.
PUBLIC SECTOR PLAYERS
Ministry of Water Resources, Works and Housing
There is no dedicated Ministry of Housing in Ghana. Instead, the Ministry of Water Resources, Works and Housing is in charge of housing policy. Its Housing Policy Directorate,5 headed by the Director of Housing, leads the government’s policy design and housing initiatives. At the moment, the Housing Policy Directorate is short on technical capacity having just three technical officers, including the Director, who are expected to develop and implement the national housing policy.6
Historically, the Housing Policy Directorate has been assisted by the Architect’s Registration Council,
the Architectural and Engineering Services Limited (AESL), the Department of Rural Housing, and the Building and Roads Research Institute (BRRI).
The Ministry of Local Government and Rural Development (MLGRD)The Ministry is in charge of the administration of local governance in the country including related infrastructure issues. Although its name suggests a bias towards rural regions, it gives as much attention to urban issues as it does to rural. The primary role of the Ministry in relation to housing is in the provision of neighbourhood infrastructure through projects financed by grants and loans provided by multi-lateral and bilateral arrangements. Very often, these projects are procured through donor-sponsored project units. Currently, the World Bank, AFD and the Nordic Fund are supporting the Ministry’s Local Government Project Coordinating Unit (LGPCU) in the implementation of the Urban Environmental Sanitation Project (UESP) which is supporting the development of environmental sanitation infrastructure in most cities.
The Ministry of Finance and the Bank of Ghana
The Ministry of Finance and the Bank of Ghana are jointly responsible for regulating the finance sector including housing finance. Under the guidance of the International Monetary Fund (IMF) and the World Bank, the Ministry of Finance has led the reforms in the finance sector, culminating in the Financial Sector Adjustment Programme (FINSAP). The implementation of FINSAP has led to significant liberalisation permitting mortgage banks, such as HFC, to evolve into universal banks providing a broad range of commercial and investment services. Currently, Ghana Home Loans remains the sole mortgage-only bank in the country.
The Ministry of Finance is the government’s focal agency for contracting all loans and grants and has been the primary agent of the state in the procurement of all facilities to support housing finance. It is the Ministry of Finance that signed on behalf of the government of Ghana to contract funds in support of housing finance interventions from
ABOUT 90 PER CENT OF ALL HOUSING IS PROVIDED BY A MIXTURE OF INDIVIDUAL HOUSEHOLDS WHO DECIDE TO BECOME OWNERS AND THE CONTRACTORS WHOM THEY ENGAGE TO DO THE BUILDING.
33KEY PLAYERS IN HOUSING
CHAPTER THREE
In the light of this, the Department has collaborated with the Ghana Law Reform Commission to develop a draft rent law that is currently under review by the Cabinet. Among the key provisions of the draft law is the raising of the minimum rent advance to one year. The Department remains excluded from the renting and management of public residential buildings.9
Ghana Standards Board
The Ghana Standards Board (GSB) ensures that building materials conform to safety and durability standards to protect lives. Samples of a material must be submitted for testing before a certificate is issued to an importer or manufacturer.
In the case of local manufacture, samples out of a batch are tested to certify the whole batch. A whole company can be certified so that it can produce for one year, renewable after a spot inspection.
THE PUBLIC SECTOR DELIVERY SYSTEMIn public sector projects, in which housing does not feature greatly, the delivery system involves the following actors (table 9).
OTHER PUBLIC SECTOR HOUSING PLAYERS
Local government – Metropolitan, Municipal and District Assemblies (MMDAs)
Local authorities – MMDAs – are primarily responsible for a limited set of housing functions. Generally, proactively meeting the residential needs of their people is overlooked by them; those responsibilities are assumed by central government and national-level agencies such as SHC. As a result, local governments do not have housing departments with oversight of, or the development capacities needed for, meeting these needs. Currently, although the local government framework (Act 462) requires all local authorities to plan and develop their jurisdictions, it does not directly mandate them to address the issue of housing needs. Rather Act 462, coupled with the LI 1630, empowers local governments to regulate the activities of individual and corporate developers engaged in housing construction. The land use planning mandate of the local governments is executed by the Town and Country Planning Department (TCPD), decentralised to the local government level, which acts as an advisory service to the local governments not as an integral part of the local government administration.
Land use plans developed by the TCPD are adopted by the assemblies and used by the Statutory Planning Committees to regulate applications for development. Their land use planning activities are severely constrained by shortfalls in manpower and logistics as well as by institutional co-ordination challenges.
international agencies. These included The World Bank (US$8 million in 1990), the Overseas Private Investment Corporation (US$30 million in 2006), and the International Finance Corporation (US$27 million in 2007) to HFC, Ghana Home Loans and the Ghana Primary Mortgage Market Initiative respectively.
The Lands Commission
The state currently owns about 20 per cent of all land in the country; its activities are handled by the Lands Commission as the sole agency for administering public land, including expropriation and assignment on behalf of the state. Chapter 21 of the Constitution sets out its mandate. It manages public and vested land, advises the Government, local authorities and traditional authorities on policy to ensure that the development of individual pieces of land is co-ordinated with the development plan for the area, advises the government on national policy on land use and capability, and advises on, and assists in the execution of, comprehensive registration of title to land throughout Ghana.7
The Lands Commission Act (Act 767, 2008) brings together all the land agencies; the Lands Commission, the Lands Valuation Board, the Land Title Registry and the Survey Department.
The Rent Control Department
The Rent Control Department of the Ministry of Water Resources, Works and Housing is charged with the administration of the rental sector. It was established through Act 220 of 1963 with powers to arbitrate rent issues between landlords and tenants.
The Department is overwhelmed with cases; from January to September, 2010, the Rent Control Department received a total of 28,219 complaints of which only 7,073 have been settled. This shows the importance of the Department but also that it is operating far below its capacity, with only 23 District and Regional offices across the country and 21 professional staff. There should be staff for 170 district offices and 10 regional offices, in addition to the three principal rent officers required to support the chief rent officer. There is a need to provide capacity building for the entire department, especially in the fields of law and management through both short refresher courses and longer term academic programmes up to Masters level8. Furthermore, there are no computers in the department; even the chief rent officer has no email facilities!
Most of the provisions of the law have been ignored by landlords, partly because they are irrelevant to the housing market. Virtually all landlords are demanding rent advances ranging between two and three years and rent increases by 55 per cent to 75 per cent at the end of each advance rent contract without recourse to the Act.
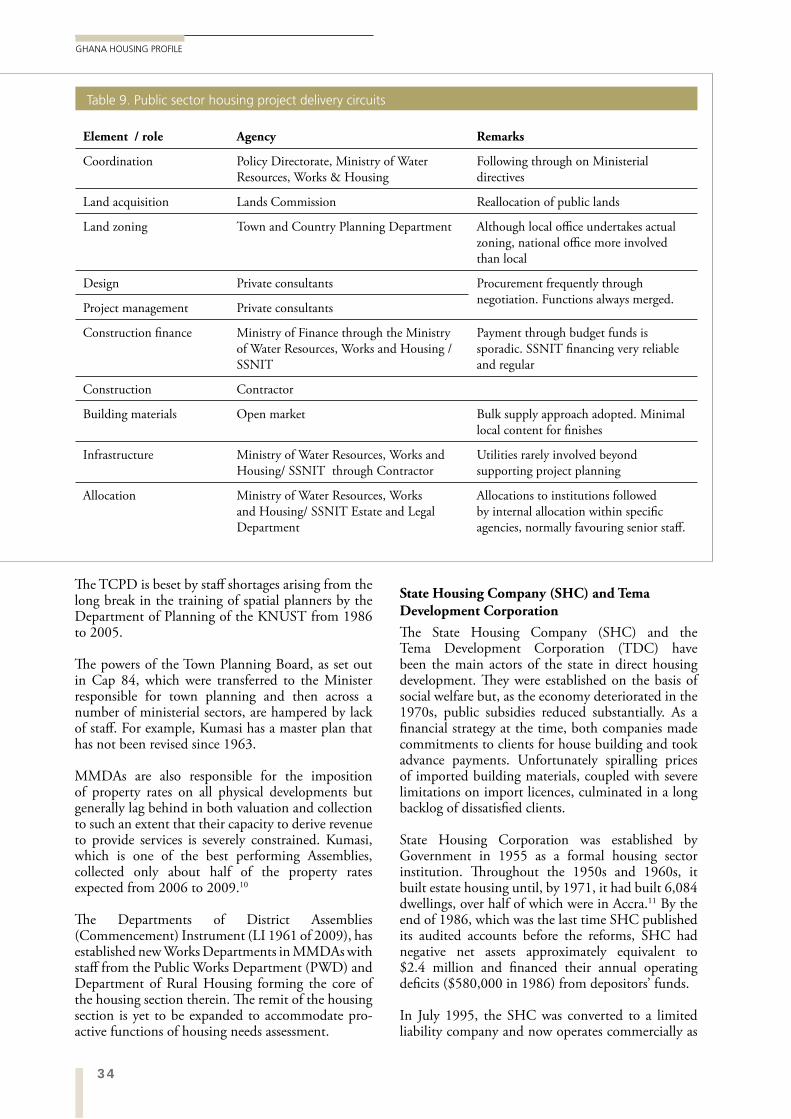
34
GHANA HOUSING PROFILE
The TCPD is beset by staff shortages arising from the long break in the training of spatial planners by the Department of Planning of the KNUST from 1986 to 2005.
The powers of the Town Planning Board, as set out in Cap 84, which were transferred to the Minister responsible for town planning and then across a number of ministerial sectors, are hampered by lack of staff. For example, Kumasi has a master plan that has not been revised since 1963.
MMDAs are also responsible for the imposition of property rates on all physical developments but generally lag behind in both valuation and collection to such an extent that their capacity to derive revenue to provide services is severely constrained. Kumasi, which is one of the best performing Assemblies, collected only about half of the property rates expected from 2006 to 2009.10
The Departments of District Assemblies (Commencement) Instrument (LI 1961 of 2009), has established new Works Departments in MMDAs with staff from the Public Works Department (PWD) and Department of Rural Housing forming the core of the housing section therein. The remit of the housing section is yet to be expanded to accommodate pro-active functions of housing needs assessment.
State Housing Company (SHC) and Tema Development Corporation
The State Housing Company (SHC) and the Tema Development Corporation (TDC) have been the main actors of the state in direct housing development. They were established on the basis of social welfare but, as the economy deteriorated in the 1970s, public subsidies reduced substantially. As a financial strategy at the time, both companies made commitments to clients for house building and took advance payments. Unfortunately spiralling prices of imported building materials, coupled with severe limitations on import licences, culminated in a long backlog of dissatisfied clients.
State Housing Corporation was established by Government in 1955 as a formal housing sector institution. Throughout the 1950s and 1960s, it built estate housing until, by 1971, it had built 6,084 dwellings, over half of which were in Accra.11 By the end of 1986, which was the last time SHC published its audited accounts before the reforms, SHC had negative net assets approximately equivalent to $2.4 million and financed their annual operating deficits ($580,000 in 1986) from depositors’ funds.
In July 1995, the SHC was converted to a limited liability company and now operates commercially as
Element / role Agency Remarks
Coordination Policy Directorate, Ministry of Water Resources, Works & Housing
Following through on Ministerial directives
Land acquisition Lands Commission Reallocation of public lands
Land zoning Town and Country Planning Department Although local office undertakes actual zoning, national office more involved than local
Design Private consultants Procurement frequently through negotiation. Functions always merged.
Project management Private consultants
Construction finance Ministry of Finance through the Ministry of Water Resources, Works and Housing / SSNIT
Payment through budget funds is sporadic. SSNIT financing very reliable and regular
Construction Contractor
Building materials Open market Bulk supply approach adopted. Minimal local content for finishes
Infrastructure Ministry of Water Resources, Works and Housing/ SSNIT through Contractor
Utilities rarely involved beyond supporting project planning
Allocation Ministry of Water Resources, Works and Housing/ SSNIT Estate and Legal Department
Allocations to institutions followed by internal allocation within specific agencies, normally favouring senior staff.
Table 9. Public sector housing project delivery circuits
35KEY PLAYERS IN HOUSING
CHAPTER THREE
the only real estate developer that works all over the country. It has constructed over 31,358 housing units (an average of 570 per year) in 94 estates country-wide since its inception.
According to the Public Relations Manager, SHC Ltd is committed to being profitable while making housing easily accessible to institutions and individual Ghanaians at home and abroad. It has sold over 90 per cent of its housing stock to individuals and institutions and now only has a small rental stock remaining. SHC Ltd now builds for outright sales on its own and clients’ land, no longer providing new rental units. Its dwellings range from a bed-sitter flat to five-bedroom dwellings, in detached and semi detached units.
Though SHC was intended to be providing as good value dwellings as it could, it did not keep its prices in line with inflation during the latter part of last century. Table 10 shows how prices for SHC’s standard one-, two-, and three-bedroom dwellings rose by more than twice as much as any of the major constituents of construction between 1980 and 1998 when a 1980=100 index is applied to both sets of data.
Tema Development Corporation (TDC) was established by the Tema Town and Port (Acquisition of Land) Ordinance (Gold Coast Ordinance No. 35 of 1952) and tasked with constructing and managing the new Tema Township associated with the construction of the Tema harbour. It owns the Tema Acquisition Area, comprising a total of 63 square miles, and constructed 10,700 housing units in five residential communities, between 1952 and 1966, from budget allocation equivalent to GHC32 million.13 After the overthrow of the Nkrumah administration, TDC was required to convert from a direct provider to a developer of serviced plots. Declining grants from the government, especially in the 1970s, forced it to depend on advance payments to finance its development activities.14 Currently, it manages its remaining stock and develops high-cost plots and housing for profit but only in small numbers.
Social Security and National Insurance Trust (SSNIT)SSNIT was established in 1972 under National Redemption Council Decree (NRCD) 127 to administer the National Social Security Scheme. This law has been amended and the Trust now operates under the new Pension Act 2008 (Act 766).
Since 1974, according to the Investment Manager, it has constructed 7,168 flats. It has developed estates in Dansoman and Sakumono suburbs of Accra, Asuoyebua in Kumasi, and in Takoradi, Sunyuni, and all the regional capitals. The main aims of its housing programme were two; to provide a safe investment
portfolio for workers’ pensions and to provide rental accommodation to civil servants and other public sector workers at affordable rates. However, rental prices were very high from the beginning and much more than doctors, nurses, lecturers, etc., could afford without subsidy. SSNIT housing policy has gradually shifted from providing rental accommodation to that of providing flats for outright sale. Following this policy shift, SSNIT has sold 6,386 of its flats to the public and is now left with about 782 rental flats. Recently, SSNIT has invested with the HFC Bank to build high-cost housing for rent in the Accra Cantonments and elsewhere.
HFC Bank
Formerly the Home Finance Company Limited, HFC was set up under PNDC Law 329, and incorporated in 1990 as a secondary housing finance company and the major provider of mortgage funds for ‘workers’; even though international experience shows that mortgages are unsuited to the housing needs of most of the population in developing countries. It was conceived as a private sector initiative with Government playing the facilitating role. It started operations in 1991 with initial funding of US$23.6 million from the Government of Ghana through the World Bank’s International Development Agency (IDA) and US$7.2 million from SSNIT.
Though the original rhetoric focused on low- to medium income ‘workers’, its loans to house-owners were unpopular owing to high transaction costs and it had problems when mortgages were indexed. Its target beneficiaries now only include mid to high net worth customers who are formally employed, employers, or Ghanaian expatriates investing at home. Though it is the major housing finance institutions in the country, HFC Bank tends to grant only about 200 mortgages a year, a tiny drop in the ocean of housing need.
First Ghana Building Society (FGBS)/ First Ghana Building Company Ltd (FGBCL)Established in 1956 under the Building Societies Ordinance of 1955, FGBS operated as a conventional mutual building society receiving savings and lending to members for housing. As with most of its peers in Sub-Saharan Africa, it fell on hard times and converted to a limited liability company under the Mortgage Decree (NRCD 96) and now operates under the Mortgage Act 2008 (Act 770) as the First Ghana Building Company Ltd (FGBCL) offering mortgages to the general public currently in a very limited way.
3.4 NON-GOVERNMENT ORGANIZATIONS
There are a variety of actors in the non-governmental sector with activities within housing. These can be categorised as housing facilitators, beneficiary-
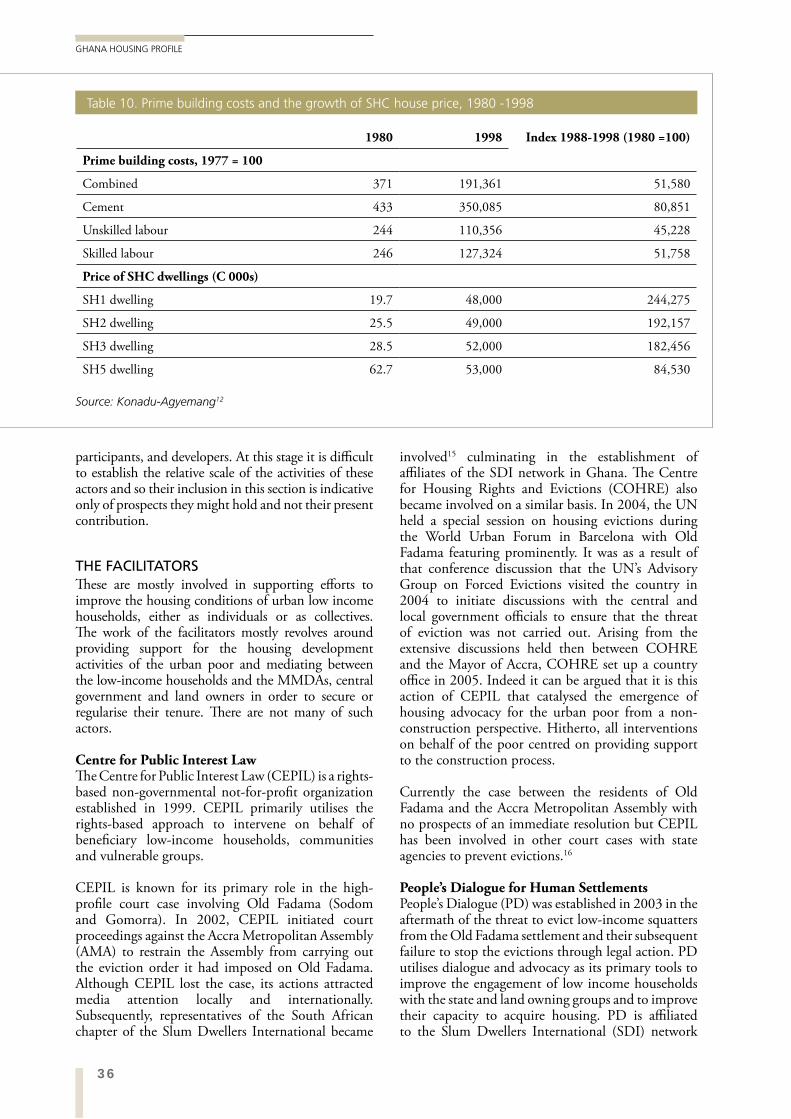
36
GHANA HOUSING PROFILE
participants, and developers. At this stage it is difficult to establish the relative scale of the activities of these actors and so their inclusion in this section is indicative only of prospects they might hold and not their present contribution.
THE FACILITATORSThese are mostly involved in supporting efforts to improve the housing conditions of urban low income households, either as individuals or as collectives. The work of the facilitators mostly revolves around providing support for the housing development activities of the urban poor and mediating between the low-income households and the MMDAs, central government and land owners in order to secure or regularise their tenure. There are not many of such actors.
Centre for Public Interest LawThe Centre for Public Interest Law (CEPIL) is a rights-based non-governmental not-for-profit organization established in 1999. CEPIL primarily utilises the rights-based approach to intervene on behalf of beneficiary low-income households, communities and vulnerable groups.
CEPIL is known for its primary role in the high-profile court case involving Old Fadama (Sodom and Gomorra). In 2002, CEPIL initiated court proceedings against the Accra Metropolitan Assembly (AMA) to restrain the Assembly from carrying out the eviction order it had imposed on Old Fadama. Although CEPIL lost the case, its actions attracted media attention locally and internationally. Subsequently, representatives of the South African chapter of the Slum Dwellers International became
involved15 culminating in the establishment of affiliates of the SDI network in Ghana. The Centre for Housing Rights and Evictions (COHRE) also became involved on a similar basis. In 2004, the UN held a special session on housing evictions during the World Urban Forum in Barcelona with Old Fadama featuring prominently. It was as a result of that conference discussion that the UN’s Advisory Group on Forced Evictions visited the country in 2004 to initiate discussions with the central and local government officials to ensure that the threat of eviction was not carried out. Arising from the extensive discussions held then between COHRE and the Mayor of Accra, COHRE set up a country office in 2005. Indeed it can be argued that it is this action of CEPIL that catalysed the emergence of housing advocacy for the urban poor from a non-construction perspective. Hitherto, all interventions on behalf of the poor centred on providing support to the construction process.
Currently the case between the residents of Old Fadama and the Accra Metropolitan Assembly with no prospects of an immediate resolution but CEPIL has been involved in other court cases with state agencies to prevent evictions.16
People’s Dialogue for Human SettlementsPeople’s Dialogue (PD) was established in 2003 in the aftermath of the threat to evict low-income squatters from the Old Fadama settlement and their subsequent failure to stop the evictions through legal action. PD utilises dialogue and advocacy as its primary tools to improve the engagement of low income households with the state and land owning groups and to improve their capacity to acquire housing. PD is affiliated to the Slum Dwellers International (SDI) network
1980 1998 Index 1988-1998 (1980 =100)
Prime building costs, 1977 = 100
Combined 371 191,361 51,580
Cement 433 350,085 80,851
Unskilled labour 244 110,356 45,228
Skilled labour 246 127,324 51,758
Price of SHC dwellings (C 000s)
SH1 dwelling 19.7 48,000 244,275
SH2 dwelling 25.5 49,000 192,157
SH3 dwelling 28.5 52,000 182,456
SH5 dwelling 62.7 53,000 84,530
Table 10. Prime building costs and the growth of SHC house price, 1980 -1998
Source: Konadu-Agyemang12
37KEY PLAYERS IN HOUSING
CHAPTER THREE
and works as the partner-facilitator of the Ghana Homeless People’s Federation, otherwise called the Ghana Federation of the Urban Poor (FED-UP). PD focuses its work on slums, informal settlements and low-income communities throughout Ghana. Since its establishment, PD has been working in seven out of the ten regions of the country.
Centre for Housing Rights and Evictions (COHRE)COHRE is an international not-for-profit agency based in Geneva and, until 2009, registered in Ghana as an NGO. In Ghana, COHRE worked to promote and protect housing and water rights, including work to prevent, halt or remedy forced evictions in both urban and rural regions. In 2005, it was engaged by the government to support efforts to reform the rent control regulatory framework. Its work fed into efforts of the Rent Control Department and the Law Reform Commission that ultimately has resulted in the draft rent control law being considered by cabinet. In addition, a representative from COHRE was a member of the task team that initiated the review of the national shelter strategy in 2005. As a result of its overlapping focus, COHRE’s work generally coincided with that of PD and occurred in the same communities across the country.
CHF GhanaThe Co-operative Housing Foundation (now referred to as CHF International) has operated in Ghana since October 2006. Currently, CHF Ghana has four programmes, three of which are concerned with improvements in the housing conditions of the urban poor. Three of these are the establishment of Boafo Microfinance Services Limited, the Slum Communities Achieving Liveable Environments with Urban Partners (SCALE-UP) programme, and the Water Access, Sanitation and Hygiene for the Urban Poor (WASH-UP) programmes.
Boafo Microfinance Services is a partnership between CHF International and HFC Bank17 for the provision of housing microfinance loans for urban low-income households in addition to micro-enterprise loans. Its activities are detailed in chapter 7. In 2009, CHF Ghana arranged for a landlords’ association based in Avenor, a low-income community in Accra, to take loan facilities from Boafo for the construction of sanitation blocks for their houses under the SCALE-UP programme.
SCALE – UP is intended to provide technical support for low-income households and communities to improve their housing conditions with support from the Bill and Melinda Gates Foundation. The SCALE-UP Program has four principal objectives:
Strengthening the capacity of slum residents and local intermediaries to realize pro-poor projects;
Regularising MMDAs’ enagagement of the urban poor in inclusive planning and implementation of pro-poor urban initiatives;
Increasing income and asset generation opportunities for slum residents; and
Improving the living environment for slum residents18
The programme uses local NGOs and CBOs to implement upgrading interventions and is being implemented in Accra and Sekondi-Takoradi, bridging the prevailing gap between the local communities and the local authorities to promote engagement and exchange of ideas for neighbourhood improvement.
Housing the MassesHousing the Masses (HM) was created to fill the gap of professional technical assistance provision to slum and low-income communities in Ghana, especially in urban areas. It works with national and local governments, communities, other NGOs and international organizations on policy reforms, project development and implementation and community facilities, and research work. Its significance lies in its providing dedicated technical support for low-income clients using only local expertise in inclusive urban development, low-income housing, slum upgrading and prevention, and citizen participation.
Community Land Development Foundation (COLANDEF)COLANDEF was established in 2004 to provide capacity building support to organizations and actors in the land sector with the aim of protecting land rights for all, especially the vulnerable, and improving security of tenure and gender concerns in development. It is currently the only NGO involved in pro-poor tenure security activities in Sekondi-Takoradi. Given the recent oil discovery in the Western Region, COLANDEF could be a strategic partner for other civil society organisations with similar aspirations. COLANDEF has worked with a number of partners including the Land Administration Project, Millennium Development Authority and CHF Ghana in piloting land titling arrangements, and providing technical assistance in tenure regularisation and community mobilisation.
Habitat for HumanityThe Habitat for Humanity Ghana (HFHG) is a Christian charity focusing on building simple affordable homes with (and not for) poor people in need. It depends extensively on charitable donations from around the world to finance its activities. HFHG works through community-managed affiliates, made up of local volunteers.19 The operations of HFHG are limited to rural and peri-urban settlements. In that respect, it has not been a significant player in
38
GHANA HOUSING PROFILE
the urban housing market. Nonetheless its operations produce reductions in housing cost through the use of sweat equity, prior land ownership and small sizes. On this basis HFHG delivers a one-bedroom dwelling for GHC 1,500 and for two-bedroom dwellings for GHC 4,000. The repayment of the loans is made through beneficiaries providing two bags of cement (or their equivalent in cash at current prices) per month over 20 years. HFHG has an unsustainably high level of defaults and is having to restructure.20
In August 2010, the principals of HFHG announced their suspension of the Ghana programme for 3 years in order to recover significant outstanding money owed by its participants. It had become clear that the operations were no longer sustainable owing to the high level of default in spite of the charitable terms. Among the reasons attributed for the high rate of default are poverty and the free-riding arising from excessive benevolence.21
Church of Pentecost and Assemblies of God Important actors emerging in the sector are the church agencies involved in co-operative land acquisition on behalf of their members. Currently the Church of Pentecost has set up a centralised land acquisition and holding agency, McKeown Investment Ltd,22 primarily to benefit their members, but also open to non-members. This is made possible by the nature of the centralised administrative structure of the church. On the other hand, as a result of a decentralised administrative structure, land acquisition by the Assemblies of God Church has been on the basis of individual assemblies. Currently land being acquired by these churches is mostly in the peripheral zones around Accra23 but it is expected that these activities will expand to other cities and will involve other churches. The significance these actors is that they mobilise a wide range of adherents across a broad spectrum of income in the urban milieu.
THE BENEFICIARY–PARTICIPANT NGOS AND CBOSThere are a variety of actors in the non-governmental and community-based organisations who are beneficiary-participants in housing improvement for the poor. Some of these are site-specific, i.e., tied to specific neighbourhoods, whereas others emerge from the basis of common vocation, i.e., tied to specific employment. Even though there may be many site-specific co-operatives, they are not very visible. The next section presents the oldest housing cooperative in Ghana, the Tema Housing Cooperative Society, as well as the most visible one, the Ghana Federation of the Urban Poor.
Tema Housing Cooperative24
The Tema Housing Cooperative Society Limited is the oldest housing co-operative in Ghana. It
originated in 1969 with 22-household members with the objective of providing low-cost housing for low-income households. A loan was obtained, from a bank in Germany, that was guaranteed by the Department of Co-operatives and the housing project was placed under the technical supervision of the Planning, Architecture and Building Technology Departments of the Kwame Nkrumah University of Science and Technology (KNUST) in Kumasi. The land was leased from the owners, the Tema Development Corporation (TDC), for one hundred years with annual ground rent assessed collectively to the society.
Over many years and three phases, 105 dwellings were built partly by self help and partly by contractors. The Society now runs a voluntary savings and loans scheme for members and is expected to help members with low-interest loans; not above 5 per cent, despite prevailing market interests of about 30 per cent. As a result of the success of the collective savings, the society has stimulated a second generation co-operative comprising the children of the first generation cooperative. It has acquired land at Katamanso for the purpose of developing new houses for its members. Cooperative housing did not catch on elsewhere despite the best efforts of KNUST staff.
Ghana Federation of the Urban Poor (Ghana FED-UP)Ghana FED-UP, formed in the September 2003 by People’s Dialogue for Human Settlements (PD), has grown rapidly with a current membership in excess of 134 groups in 64 neighbourhoods totalling over 12,000 members. The Federation is affiliated with the Slum Dwellers International (SDI) and utilises the rituals of SDI including daily savings; community exchanges for knowledge sharing; women’s empowering; internalising information generation and localising solutions; and the engagement of local, national and international development partners.
Since its formation, the coalition of PD and the Federation has achieved varied success in meeting their primary goals. Currently, the Federation has saved US$107,000 and acquired approximately five acres of land in two locations in Accra for housing development. In addition, the Federation is the beneficiary-participant in the Slum Upgrading Facility’s Tulaku Mixed Use Development project in Ashaiman that is intended to house 31 households. Currently the construction of the building is completed but it is yet to be occupied as a result of unfinished negotiations with HFC on the terms of the mortgage.25
Employer-based groups
Employment-based housing cooperatives are arising from the desire to minimise individual risk associated
39KEY PLAYERS IN HOUSING
CHAPTER THREE
3.5 PRIVATE SECTOR
SMALL DEVELOPERS AND HOUSEHOLDERSThe urban landscape is dominated by individual households having new housing built by small-scale contractors. In the currently built-up areas, many extensions are being carried out by the same combination of owner and contractor. These are the main actors in the housing supply system in urban Ghana, outnumbering the production of all the formal means many-fold.
BROKERAGE/ ESTATE AGENTS Real estate brokerage is carried out by a number of different actors including international companies, private agencies and individual operators. A few international property management agencies, such as BROLL of South Africa, have entered the local market in the last two years but are not subject to the rules of the Ghana Institute of Surveyors. The formal sector property management agencies cater to the high-cost private sector mostly in Accra, Kumasi and Sekondi-Takoradi. The discovery of oil in the Western Region has created an increase in property management there. The private agencies include local property management consultancies with the principals predominantly trained in Land Economy by KNUST and members of the Valuation and Estate Surveying Division of the Ghana Institute of Surveyors. The professional body regulates the technical practice of these consultancies only and not all practitioners in the field. The activities of the formal property management services outside of the largest cities are restricted to the management (and maintenance) of public facilities and banks.
For several years, the informal sector of the housing market, catering mostly to the urban poor in the rental sub-markets, utilised individual (and mostly untrained) housing agents to find accommodation. These agents rely extensively on word of mouth and very basic advertising to conduct their business. Even though they cater to the informal sector, their activities are widespread across all urban centres of the country. The scope of their activities includes the rental sub-markets in compound houses, family houses and the uncompleted houses. However, since 2003, these individual housing agents have been organised into the Ghana Real Estate Marketers Association (GREMA), launched in September 2003. Since GREMA’s formation, charges for their services are being streamlined by the association with the regulation of the proportion of rent (10 per cent) to be paid as a service fee and the payment of membership fees, as well as token deductions for income tax. There are also regulations dealing with infractions of client relations and unethical behaviour. Expulsion of some members of GREMA was not unusual at the beginning but has declined
with land acquisition and the prospect of paying in stages for land instead of the lump sum payments demanded from individual buyers by land owners. It is difficult to determine the scale of this actor group because the land is not always acquired in the name of the entire group but in the name of a representative. There are, however, a few identifiable employment-based housing cooperatives which are currently undertaking housing-related initiatives. These include the Ghana Standards Board Staff Association, the Ghana National Association of Teachers (GNAT), Ghana Registered Nurses Association (GRNA), Ghana Medical Association (GMA) and the Internal Revenue Service Staff Association.
The primary function of these co-operatives in housing development is in the joint land acquisition. The contributions of the respective memberships are mostly deducted from their salaries. Once savings are built up to an appreciable level, land is acquired, with the negotiations for the completion of the outstanding payments in stages, and held jointly by the cooperative. Land acquired by these groups can be found in Kasoa, Oyibi, Dawhenya and Afienya, all adjoining Accra. The Ghana National Association of Teachers has also acquired land in Takoradi for their members with plans to extend into other urban areas.
A common feature of these cooperatives is that they have all experienced (real or attempted) fraud from land speculators and brokers, investors, fund managers and estate developers. The common thread is that they have all received unsolicited proposals by these actors to assist in land acquisition, up-front financing or property development. Inevitably the cooperatives have lost some of their funds to them.
In spite of such experiences, the employment-based cooperatives could be a good target for policy intervention aimed at assisting middle- and low-income households. They have social controls such as peer pressure to mediate the actions of individual members. Cooperative members can generate sufficient capital through their pooled savings to assure land owners of the good standing of the group. Furthermore, there is the prospect of better land use planning than if the land was acquired by individuals.
THERE IS NO DEDICATED MINISTRY OF HOUSING IN GHANA. INSTEAD, THE MINISTRY OF WATER RESOURCES, WORKS AND HOUSING IS IN CHARGE OF HOUSING POLICY.
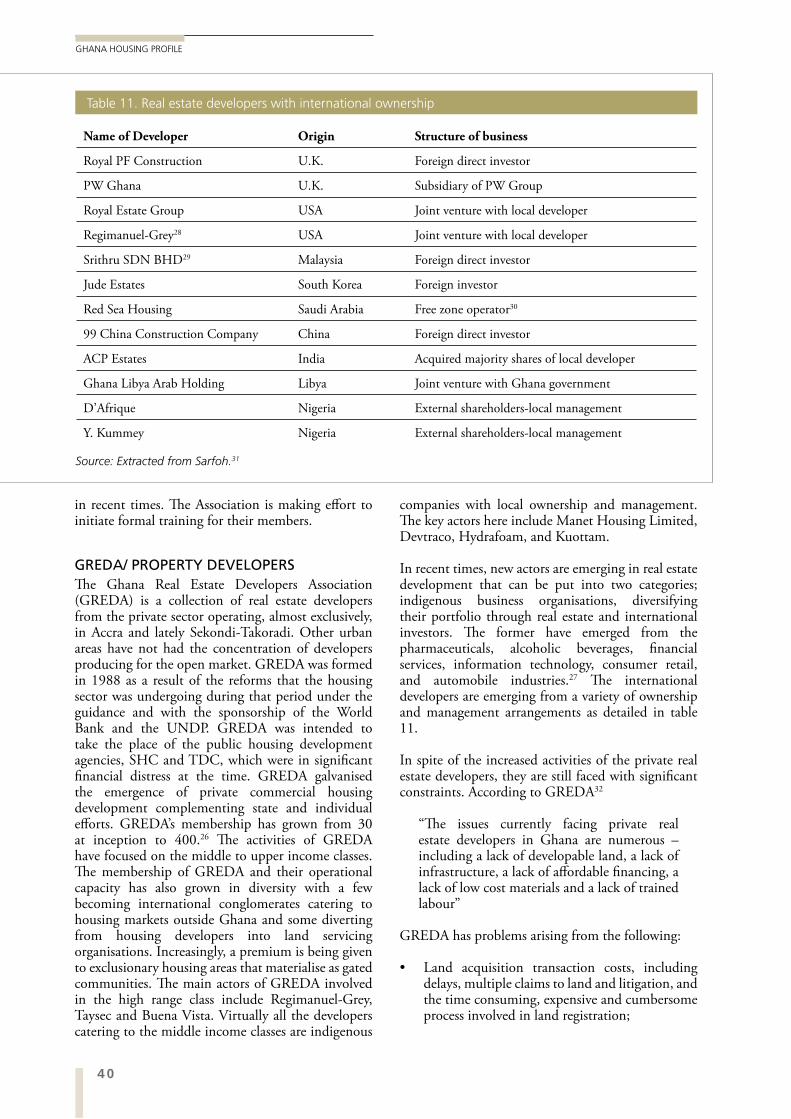
40
GHANA HOUSING PROFILE
in recent times. The Association is making effort to initiate formal training for their members.
GREDA/ PROPERTY DEVELOPERSThe Ghana Real Estate Developers Association (GREDA) is a collection of real estate developers from the private sector operating, almost exclusively, in Accra and lately Sekondi-Takoradi. Other urban areas have not had the concentration of developers producing for the open market. GREDA was formed in 1988 as a result of the reforms that the housing sector was undergoing during that period under the guidance and with the sponsorship of the World Bank and the UNDP. GREDA was intended to take the place of the public housing development agencies, SHC and TDC, which were in significant financial distress at the time. GREDA galvanised the emergence of private commercial housing development complementing state and individual efforts. GREDA’s membership has grown from 30 at inception to 400.26 The activities of GREDA have focused on the middle to upper income classes. The membership of GREDA and their operational capacity has also grown in diversity with a few becoming international conglomerates catering to housing markets outside Ghana and some diverting from housing developers into land servicing organisations. Increasingly, a premium is being given to exclusionary housing areas that materialise as gated communities. The main actors of GREDA involved in the high range class include Regimanuel-Grey, Taysec and Buena Vista. Virtually all the developers catering to the middle income classes are indigenous
companies with local ownership and management. The key actors here include Manet Housing Limited, Devtraco, Hydrafoam, and Kuottam.
In recent times, new actors are emerging in real estate development that can be put into two categories; indigenous business organisations, diversifying their portfolio through real estate and international investors. The former have emerged from the pharmaceuticals, alcoholic beverages, financial services, information technology, consumer retail, and automobile industries.27 The international developers are emerging from a variety of ownership and management arrangements as detailed in table 11.
In spite of the increased activities of the private real estate developers, they are still faced with significant constraints. According to GREDA32
“The issues currently facing private real estate developers in Ghana are numerous – including a lack of developable land, a lack of infrastructure, a lack of affordable financing, a lack of low cost materials and a lack of trained labour”
GREDA has problems arising from the following:
Land acquisition transaction costs, including delays, multiple claims to land and litigation, and the time consuming, expensive and cumbersome process involved in land registration;
Name of Developer Origin Structure of business
Royal PF Construction U.K. Foreign direct investor
PW Ghana U.K. Subsidiary of PW Group
Royal Estate Group USA Joint venture with local developer
Regimanuel-Grey28 USA Joint venture with local developer
Srithru SDN BHD29 Malaysia Foreign direct investor
Jude Estates South Korea Foreign investor
Red Sea Housing Saudi Arabia Free zone operator30
99 China Construction Company China Foreign direct investor
ACP Estates India Acquired majority shares of local developer
Ghana Libya Arab Holding Libya Joint venture with Ghana government
D’Afrique Nigeria External shareholders-local management
Y. Kummey Nigeria External shareholders-local management
Source: Extracted from Sarfoh.31
Table 11. Real estate developers with international ownership
41KEY PLAYERS IN HOUSING
CHAPTER THREE
and Sukura, especially along new arterial roads in Accra which increased commercial opportunities.
The first reform in housing finance was implemented in 1990 under the World Bank’s Housing Sector Reform Programme, a component of the Urban II project. This resulted in the establishment of the Home Finance Company as a secondary mortgage facility.
The International Finance Corporation (IFC) in conjunction with the State Secretariat for Economic Affairs of Switzerland (SECO)34 launched the three-year ‘Ghana Primary Mortgage Market Initiative’ in 2007 to support the government’s efforts in resource mobilisation for housing finance. It is intended to support five participating banks35 to provide cheaper mortgages backed by partial guarantees of US$25 million offered by IFC on behalf of approximately 500 beneficiary families. Prior to this, the Overseas Private Investment Corporation, an agency of the US government, collaborated with Standard Bank of South Africa and the FMO of Netherlands, to provide a US$30 million for the establishment of the Ghana Home Loans, in 2006, to provide long term (15-year) finance for mortgages. However, the 25 per cent down payment and loans in hard currency militates against the majority benefiting from the loans. Thus, none of these financial initiatives had any bearing on the needs of the poor. One which does, however, is the establishment of Boafo Microfinance Services. Chapter 7 provides discussion on the current status of this and other housing finance.
The United Nations36 has been involved in a variety of projects, mostly focused on the Accra-Tema conurbation. The key interventions were the Accra Planning Development Programme (1987), the Accra Structure Plan (1990) and the Slum Upgrading Facility (2005 to date). The Accra Structure Plan introduced opportunities for increasing housing densities in the former colonial neighbourhoods of Accra37 and is the context in which government has been selling public land hitherto occupied at only one dwelling per acre (2.4 per Ha.). The existing properties are demolished and apartments developed on the land. Significant public housing developments, albeit for Ministers of state and senior bureaucrats, have occurred in these areas.
UN Habitat’s other interventions of note are the development of a Rapid Urban Sector Profile of Ghana in 2006 and the Slum Upgrading Facility (SUF). The former catalogued the existing conditions of the urban sector nationally and also within three cities, Accra, Tamale and Ho. The Slum Upgrading Facility was launched in Ghana in 2005 as part of a pilot programme jointly run by the housing and local
The costs of land at about 15 per cent of total development cost including the transaction costs above;
Difficulties raising construction finance. Banks only lend to a few real estate companies and then finance constitutes 20 per cent of the cost of a dwelling;
The lag in infrastructure provision by MMDAs and service providers, and the full up-front costs payable by developers. They estimate that infrastructure varies from 10 per cent to 30 per cent of the price of a dwelling, depending on the location of the site in relation to the existing infrastructure;
The over-dependence on external markets, particularly for building materials. The price increase for cement between 2005 and 2007 was almost 100 per cent.33
PUBLIC-PRIVATE PARTNERSHIPSThese are non-existent in Ghana.
3.6 INTERNATIONAL DEVELOPMENT ORGANIZATIONS
Mirroring the housing policies, internationally-funded programmes with housing outcomes over the same period have been sporadic and un-coordinated. In the 1980s, the World Bank was influential in financing urban regeneration projects that improved neighbourhood infrastructure with limited housing interventions. The World Bank supported the following: the Accra District Rehabilitation Programme (1985), the Priority Works Programme (1988), Urban II (1990), the Local Government Development Programme (also known as Urban III) (1994), the Community Infrastructure Upgrading and Depressed Communities Project (under Urban IV) (1999), Urban V (2001) and the Urban Environmental Sanitation Programme (Phase I and II) (from 1997). The majority of these were implemented in the five primary cities of Accra, Kumasi, Sekondi-Takoradi, Tema and Tamale. The key areas of intervention were in construction of new roads and improvements to degraded ones, sanitation infrastructure including communal and household toilets, and a limited number of serviced plots for housing.
The limitation of these interventions was that they did not address the issue of tenure – be it land or housing – as part of the package of interventions. As a result, there were some market-induced evictions in some of the upgraded areas, such as Nima-Maamobi
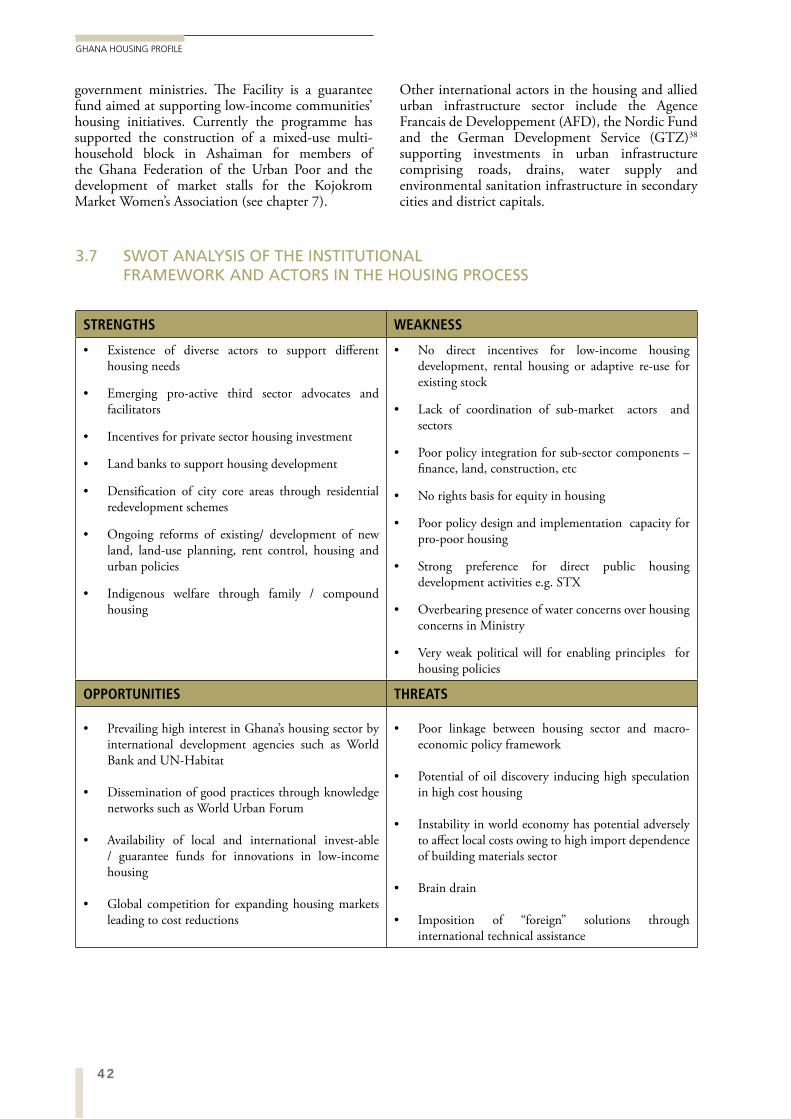
42
GHANA HOUSING PROFILE
government ministries. The Facility is a guarantee fund aimed at supporting low-income communities’ housing initiatives. Currently the programme has supported the construction of a mixed-use multi-household block in Ashaiman for members of the Ghana Federation of the Urban Poor and the development of market stalls for the Kojokrom Market Women’s Association (see chapter 7).
Other international actors in the housing and allied urban infrastructure sector include the Agence Francais de Developpement (AFD), the Nordic Fund and the German Development Service (GTZ)38 supporting investments in urban infrastructure comprising roads, drains, water supply and environmental sanitation infrastructure in secondary cities and district capitals.
STRENGTHS WEAKNESS
Existence of diverse actors to support different housing needs
Emerging pro-active third sector advocates and facilitators
Incentives for private sector housing investment
Land banks to support housing development
Densification of city core areas through residential redevelopment schemes
Ongoing reforms of existing/ development of new land, land-use planning, rent control, housing and urban policies
Indigenous welfare through family / compound housing
No direct incentives for low-income housing development, rental housing or adaptive re-use for existing stock
Lack of coordination of sub-market actors and sectors
Poor policy integration for sub-sector components – finance, land, construction, etc
No rights basis for equity in housing
Poor policy design and implementation capacity for pro-poor housing
Strong preference for direct public housing development activities e.g. STX
Overbearing presence of water concerns over housing concerns in Ministry
Very weak political will for enabling principles for housing policies
OPPORTUNITIES THREATS
Prevailing high interest in Ghana’s housing sector by international development agencies such as World Bank and UN-Habitat
Dissemination of good practices through knowledge networks such as World Urban Forum
Availability of local and international invest-able / guarantee funds for innovations in low-income housing
Global competition for expanding housing markets leading to cost reductions
Poor linkage between housing sector and macro-economic policy framework
Potential of oil discovery inducing high speculation in high cost housing
Instability in world economy has potential adversely to affect local costs owing to high import dependence of building materials sector
Brain drain
Imposition of “foreign” solutions through international technical assistance
3.7 SWOT ANALYSIS OF THE INSTITUTIONAL FRAMEWORK AND ACTORS IN THE HOUSING PROCESS
43KEY PLAYERS IN HOUSING
CHAPTER THREE
SECTION ENDNOTES
1 This chapter is based largely on a report by Kwadwo Ohene Sarfoh.2 Drink money is the customary tribute paid to the ancestors of the land-holding community when land is
leased to strangers. See chapter 6 for more detailed 3 Odame Larbi (2006).4 Personal interview with a former Deputy Minister for Works and Housing.5 There are eight directorates namely Finance; Audit; General Administration; Water; Human Resource;
Housing; Policy Planning, Budgeting Monitoring and Evaluation; and Resource Statistics Information Management (RSIM).
6 There are two permanent staff of the Housing Directorate and one junior staff member whose permanent appointment is yet to be finalised, as this is written, subject to the waiver of Government’s embargo on public sector recruitment. The Ministry has just secured the secondment of an additional three staff from the Architectural and Engineering Services Limited (AESL) comprising an Architect, Quantity Surveyor and Civil Engineer respectively. The choice of these core professions is indicative of the disposition of the state towards housing, in the sense that housing is perceived to be about design and construction.
7 Government of Ghana (1992a).8 It is a prerequisite for the Chief Rent Officer to have a Masters degree in law or related subjects.9 Personal interview of Chief Rent Officer, September 2010.10 JEAVCO Associates (2010).11 Tipple (1987)12 Konadu-Agyemang (2001: tables 1 and 5).13 £16 million at the time with an exchange rate of £1.00 = C2.00.14 By 1989, TDC had completed a total of 16,000 housing units and held 7,520 housing units as rentals,
“making it the largest single landlord in Ghana” (Sarfoh, 2010: 155). In 1990, TDC had a waiting list of 1,370 depositors who had paid money and received no dwellings.
15 CEPIL’s legal case coincided with a visit of two representatives of SDI to Ghana to participate in a UN-Habitat and SIDA jointly sponsored conference on Housing and Urban Development in August 2002. The two SDI participants mobilised support that culminated in the establishment of People’s Dialogue for Human Settlements in 2003.
16 These include planned forced eviction of 7000 settlers in Digya National Park, suspended; Nii Abbey and others v Ga District Assembly and Attorney General, Emmanual K. Oduro & ors v Attorney General and Ghana Railway Corporation, and Emmanuel Victor Asare & 3 ors. v Ga West District Assembly and Attorney General.
17 CHF International’s equity was partly raised through funds secured from the UN-Habitat’s support intended for the Ghana Slum Upgrading Facility project as well as from the USAID’s Global Development Alliance.
18 http://www.chfinternational.org/ghana date sourced: 30th September 2010.19 Habitat for Humanity Ghana (2008).20 Habitat for Humanity Ghana (2010).21 http://www.bizghana.com/viewnews.asp?id=3779&page=news date sourced September 30th 2010.22 Named after the Ghana church’s founder, James McKeown from Northern Ireland.23 The lands that have been acquired by the churches can be found beyond Kasoa towards the West,
Amasaman towards the North and Dawenya towards to East of Accra.24 This section has been adapted from Sarfoh (2002) with updates from personal interviews. 25 It should be noted that the Federation has already paid GHC 90,000 to the SUF as its contribution for
the development which amounts to approximately 25 per cent of the actual construction costs. The SUF intends to provide a guarantee to HFC on behalf of the Federation for the provision of the mortgage loan. See chapter 6 for more details.
26 GREDA (2009)27 These include KINAPHARMA, NDK Financial Services, UT Bank and Financial Services, SOFT, Oman Forfor,
KASAPREKO and Melcom (personal interview of GREDA President, 2010) 28 Started out as a local developer, called Regimanuel at the inception of the reforms and changed to
Regimanuel–Grey after going into partnership with a US investor.29 This company originally ventured into the Ghanaian market as part of a consortium of Malaysian firms,
Metro Ikram SDN BHD, entering into a joint venture partnership with SSNIT for the development of a housing estate – Meridian Housing Project. Even though the joint venture deal fell through Srithru SDN BHD remained and has completed a 30 flat apartment block.
44
GHANA HOUSING PROFILE
30 Began operations manufacturing demountable housing components from shipping containers for export but is gradually turning to the local market as well.
31 Sarfoh (2010: 218).32 GREDA (2009: 3)33 GREDA (2009).34 SECO is the bi-lateral development assistance agency of Switzerland.35 These are HFC Bank, Fidelity Bank, Ghana Home Loans, Ecobank, and Merchant Bank.36 United Nations Development Programme (UNDP) and UN-HABITAT.37 These cover neighbourhoods of Cantonments, Airport Residential Area, Ridge, Osu and Roman Ridge.38 The three agencies are the international development cooperation agencies of the French, Norwegian
and German states respectively, AFD and the Nordic Fund initially participated in co-sponsoring drainage projects in Accra whereas GTZ supported the development of infrastructure in secondary towns and cities that included the provision of communal and household toilets. GTZ became GIZ in January 2011.
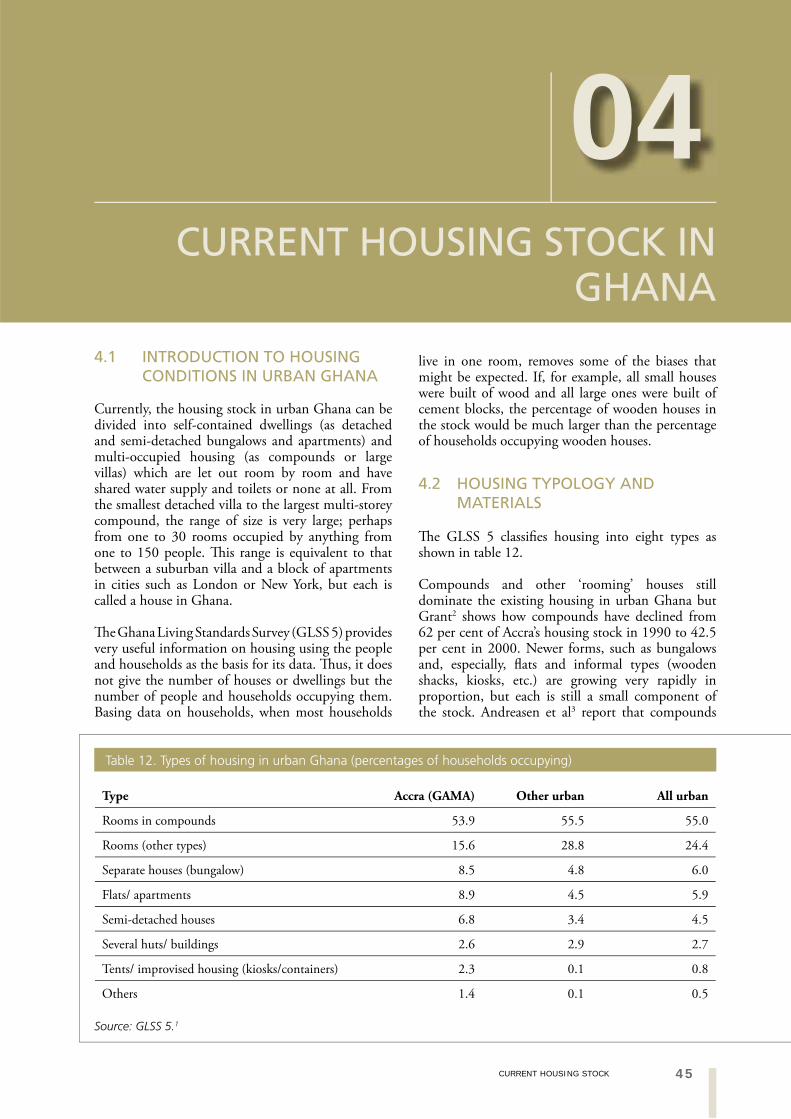
45CURRENT HOUSING STOCK
CHAPTER FOUR
04CURRENT HOUSING STOCK IN
GHANA
4.1 INTRODUCTION TO HOUSING CONDITIONS IN URBAN GHANA
Currently, the housing stock in urban Ghana can be divided into self-contained dwellings (as detached and semi-detached bungalows and apartments) and multi-occupied housing (as compounds or large villas) which are let out room by room and have shared water supply and toilets or none at all. From the smallest detached villa to the largest multi-storey compound, the range of size is very large; perhaps from one to 30 rooms occupied by anything from one to 150 people. This range is equivalent to that between a suburban villa and a block of apartments in cities such as London or New York, but each is called a house in Ghana.
The Ghana Living Standards Survey (GLSS 5) provides very useful information on housing using the people and households as the basis for its data. Thus, it does not give the number of houses or dwellings but the number of people and households occupying them. Basing data on households, when most households
live in one room, removes some of the biases that might be expected. If, for example, all small houses were built of wood and all large ones were built of cement blocks, the percentage of wooden houses in the stock would be much larger than the percentage of households occupying wooden houses.
4.2 HOUSING TYPOLOGY AND MATERIALS
The GLSS 5 classifies housing into eight types as shown in table 12.
Compounds and other ‘rooming’ houses still dominate the existing housing in urban Ghana but Grant2 shows how compounds have declined from 62 per cent of Accra’s housing stock in 1990 to 42.5 per cent in 2000. Newer forms, such as bungalows and, especially, flats and informal types (wooden shacks, kiosks, etc.) are growing very rapidly in proportion, but each is still a small component of the stock. Andreasen et al3 report that compounds
Type Accra (GAMA) Other urban All urban
Rooms in compounds 53.9 55.5 55.0
Rooms (other types) 15.6 28.8 24.4
Separate houses (bungalow) 8.5 4.8 6.0
Flats/ apartments 8.9 4.5 5.9
Semi-detached houses 6.8 3.4 4.5
Several huts/ buildings 2.6 2.9 2.7
Tents/ improvised housing (kiosks/containers) 2.3 0.1 0.8
Others 1.4 0.1 0.5
Source: GLSS 5.1
Table 12. Types of housing in urban Ghana (percentages of households occupying)
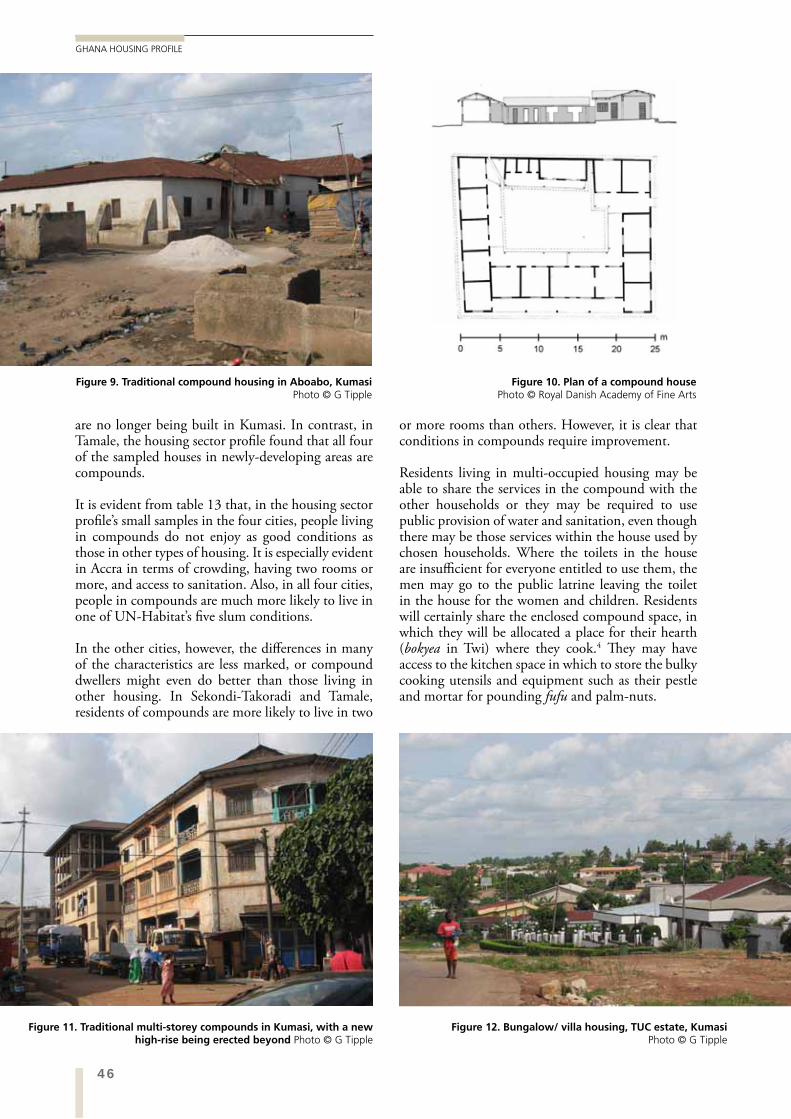
46
GHANA HOUSING PROFILE
are no longer being built in Kumasi. In contrast, in Tamale, the housing sector profile found that all four of the sampled houses in newly-developing areas are compounds.
It is evident from table 13 that, in the housing sector profile’s small samples in the four cities, people living in compounds do not enjoy as good conditions as those in other types of housing. It is especially evident in Accra in terms of crowding, having two rooms or more, and access to sanitation. Also, in all four cities, people in compounds are much more likely to live in one of UN-Habitat’s five slum conditions.
In the other cities, however, the differences in many of the characteristics are less marked, or compound dwellers might even do better than those living in other housing. In Sekondi-Takoradi and Tamale, residents of compounds are more likely to live in two
or more rooms than others. However, it is clear that conditions in compounds require improvement.
Residents living in multi-occupied housing may be able to share the services in the compound with the other households or they may be required to use public provision of water and sanitation, even though there may be those services within the house used by chosen households. Where the toilets in the house are insufficient for everyone entitled to use them, the men may go to the public latrine leaving the toilet in the house for the women and children. Residents will certainly share the enclosed compound space, in which they will be allocated a place for their hearth (bokyea in Twi) where they cook.4 They may have access to the kitchen space in which to store the bulky cooking utensils and equipment such as their pestle and mortar for pounding fufu and palm-nuts.
Figure 9. Traditional compound housing in Aboabo, Kumasi Photo © G Tipple
Figure 10. Plan of a compound house Photo © Royal Danish Academy of Fine Arts
Figure 11. Traditional multi-storey compounds in Kumasi, with a new high-rise being erected beyond Photo © G Tipple
Figure 12. Bungalow/ villa housing, TUC estate, Kumasi Photo © G Tipple
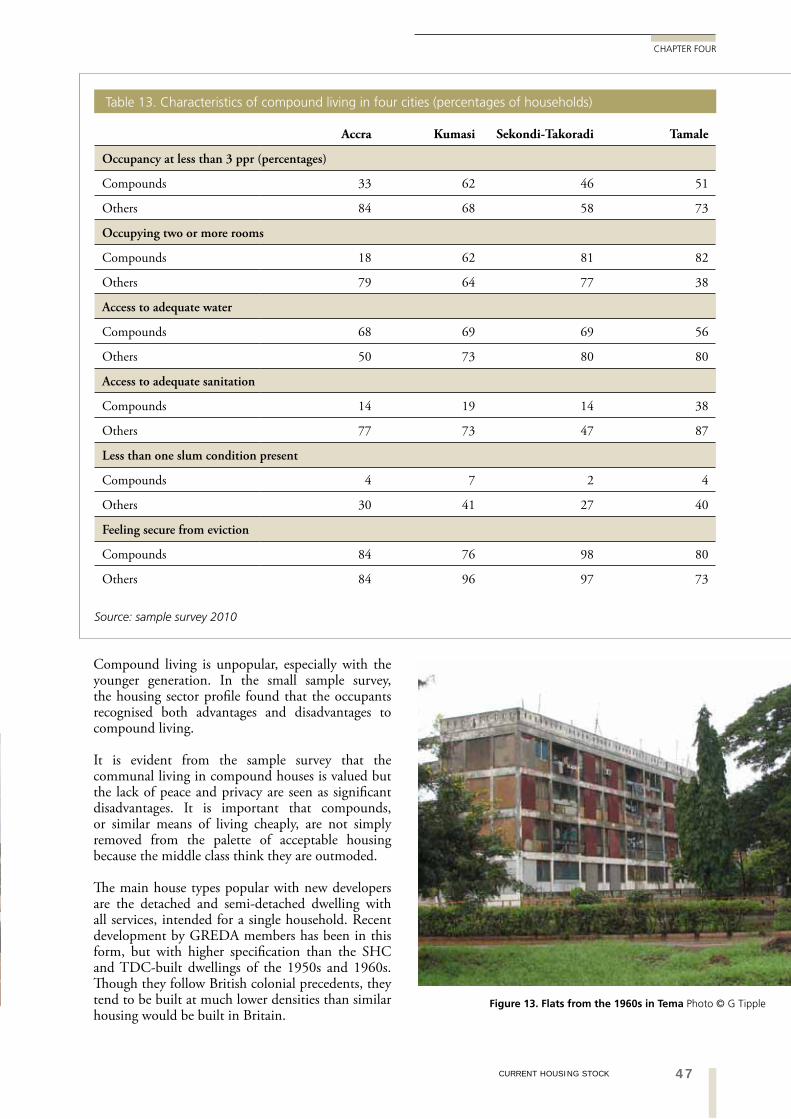
47CURRENT HOUSING STOCK
CHAPTER FOUR
Compound living is unpopular, especially with the younger generation. In the small sample survey, the housing sector profile found that the occupants recognised both advantages and disadvantages to compound living.
It is evident from the sample survey that the communal living in compound houses is valued but the lack of peace and privacy are seen as significant disadvantages. It is important that compounds, or similar means of living cheaply, are not simply removed from the palette of acceptable housing because the middle class think they are outmoded.
The main house types popular with new developers are the detached and semi-detached dwelling with all services, intended for a single household. Recent development by GREDA members has been in this form, but with higher specification than the SHC and TDC-built dwellings of the 1950s and 1960s. Though they follow British colonial precedents, they tend to be built at much lower densities than similar housing would be built in Britain.
Accra Kumasi Sekondi-Takoradi Tamale
Occupancy at less than 3 ppr (percentages)
Compounds 33 62 46 51
Others 84 68 58 73
Occupying two or more rooms
Compounds 18 62 81 82
Others 79 64 77 38
Access to adequate water
Compounds 68 69 69 56
Others 50 73 80 80
Access to adequate sanitation
Compounds 14 19 14 38
Others 77 73 47 87
Less than one slum condition present
Compounds 4 7 2 4
Others 30 41 27 40
Feeling secure from eviction
Compounds 84 76 98 80
Others 84 96 97 73
Source: sample survey 2010
Table 13. Characteristics of compound living in four cities (percentages of households)
Figure 13. Flats from the 1960s in Tema Photo © G Tipple
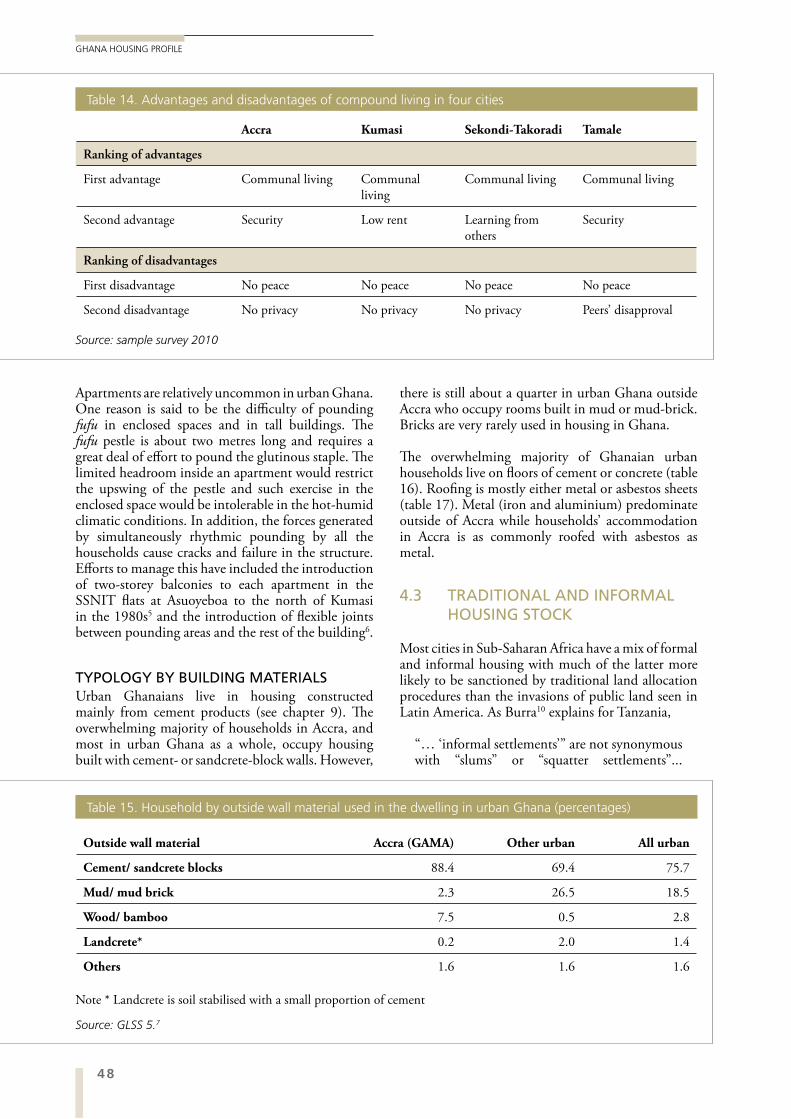
48
GHANA HOUSING PROFILE
Apartments are relatively uncommon in urban Ghana. One reason is said to be the difficulty of pounding fufu in enclosed spaces and in tall buildings. The fufu pestle is about two metres long and requires a great deal of effort to pound the glutinous staple. The limited headroom inside an apartment would restrict the upswing of the pestle and such exercise in the enclosed space would be intolerable in the hot-humid climatic conditions. In addition, the forces generated by simultaneously rhythmic pounding by all the households cause cracks and failure in the structure. Efforts to manage this have included the introduction of two-storey balconies to each apartment in the SSNIT flats at Asuoyeboa to the north of Kumasi in the 1980s5 and the introduction of flexible joints between pounding areas and the rest of the building6.
TYPOLOGY BY BUILDING MATERIALSUrban Ghanaians live in housing constructed mainly from cement products (see chapter 9). The overwhelming majority of households in Accra, and most in urban Ghana as a whole, occupy housing built with cement- or sandcrete-block walls. However,
there is still about a quarter in urban Ghana outside Accra who occupy rooms built in mud or mud-brick. Bricks are very rarely used in housing in Ghana.
The overwhelming majority of Ghanaian urban households live on floors of cement or concrete (table 16). Roofing is mostly either metal or asbestos sheets (table 17). Metal (iron and aluminium) predominate outside of Accra while households’ accommodation in Accra is as commonly roofed with asbestos as metal.
4.3 TRADITIONAL AND INFORMAL HOUSING STOCK
Most cities in Sub-Saharan Africa have a mix of formal and informal housing with much of the latter more likely to be sanctioned by traditional land allocation procedures than the invasions of public land seen in Latin America. As Burra10 explains for Tanzania,
“… ‘informal settlements’” are not synonymous with “slums” or “squatter settlements”...
Table 14. Advantages and disadvantages of compound living in four cities
Table 15. Household by outside wall material used in the dwelling in urban Ghana (percentages)
Accra Kumasi Sekondi-Takoradi Tamale
Ranking of advantages
First advantage Communal living Communal living
Communal living Communal living
Second advantage Security Low rent Learning from others
Security
Ranking of disadvantages
First disadvantage No peace No peace No peace No peace
Second disadvantage No privacy No privacy No privacy Peers’ disapproval
Source: sample survey 2010
Source: GLSS 5.7
Outside wall material Accra (GAMA) Other urban All urban
Cement/ sandcrete blocks 88.4 69.4 75.7
Mud/ mud brick 2.3 26.5 18.5
Wood/ bamboo 7.5 0.5 2.8
Landcrete* 0.2 2.0 1.4
Others 1.6 1.6 1.6
Note * Landcrete is soil stabilised with a small proportion of cement
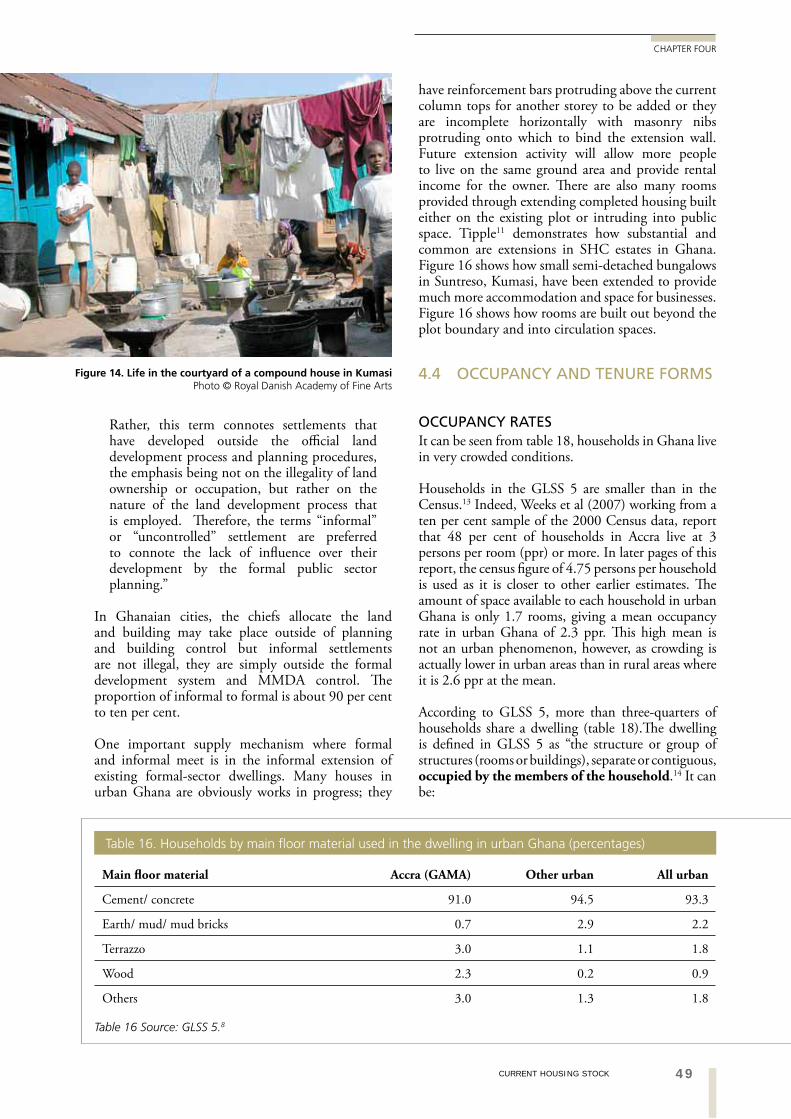
49CURRENT HOUSING STOCK
CHAPTER FOUR
Rather, this term connotes settlements that have developed outside the official land development process and planning procedures, the emphasis being not on the illegality of land ownership or occupation, but rather on the nature of the land development process that is employed. Therefore, the terms “informal” or “uncontrolled” settlement are preferred to connote the lack of influence over their development by the formal public sector planning.”
In Ghanaian cities, the chiefs allocate the land and building may take place outside of planning and building control but informal settlements are not illegal, they are simply outside the formal development system and MMDA control. The proportion of informal to formal is about 90 per cent to ten per cent.
One important supply mechanism where formal and informal meet is in the informal extension of existing formal-sector dwellings. Many houses in urban Ghana are obviously works in progress; they
have reinforcement bars protruding above the current column tops for another storey to be added or they are incomplete horizontally with masonry nibs protruding onto which to bind the extension wall. Future extension activity will allow more people to live on the same ground area and provide rental income for the owner. There are also many rooms provided through extending completed housing built either on the existing plot or intruding into public space. Tipple11 demonstrates how substantial and common are extensions in SHC estates in Ghana. Figure 16 shows how small semi-detached bungalows in Suntreso, Kumasi, have been extended to provide much more accommodation and space for businesses. Figure 16 shows how rooms are built out beyond the plot boundary and into circulation spaces.
4.4 OCCUPANCY AND TENURE FORMS
OCCUPANCY RATESIt can be seen from table 18, households in Ghana live in very crowded conditions.
Households in the GLSS 5 are smaller than in the Census.13 Indeed, Weeks et al (2007) working from a ten per cent sample of the 2000 Census data, report that 48 per cent of households in Accra live at 3 persons per room (ppr) or more. In later pages of this report, the census figure of 4.75 persons per household is used as it is closer to other earlier estimates. The amount of space available to each household in urban Ghana is only 1.7 rooms, giving a mean occupancy rate in urban Ghana of 2.3 ppr. This high mean is not an urban phenomenon, however, as crowding is actually lower in urban areas than in rural areas where it is 2.6 ppr at the mean.
According to GLSS 5, more than three-quarters of households share a dwelling (table 18).The dwelling is defined in GLSS 5 as “the structure or group of structures (rooms or buildings), separate or contiguous, occupied by the members of the household.14 It can be:
Figure 14. Life in the courtyard of a compound house in Kumasi Photo © Royal Danish Academy of Fine Arts
Main floor material Accra (GAMA) Other urban All urban
Cement/ concrete 91.0 94.5 93.3
Earth/ mud/ mud bricks 0.7 2.9 2.2
Terrazzo 3.0 1.1 1.8
Wood 2.3 0.2 0.9
Others 3.0 1.3 1.8
Table 16. Households by main floor material used in the dwelling in urban Ghana (percentages)
Table 16 Source: GLSS 5.8
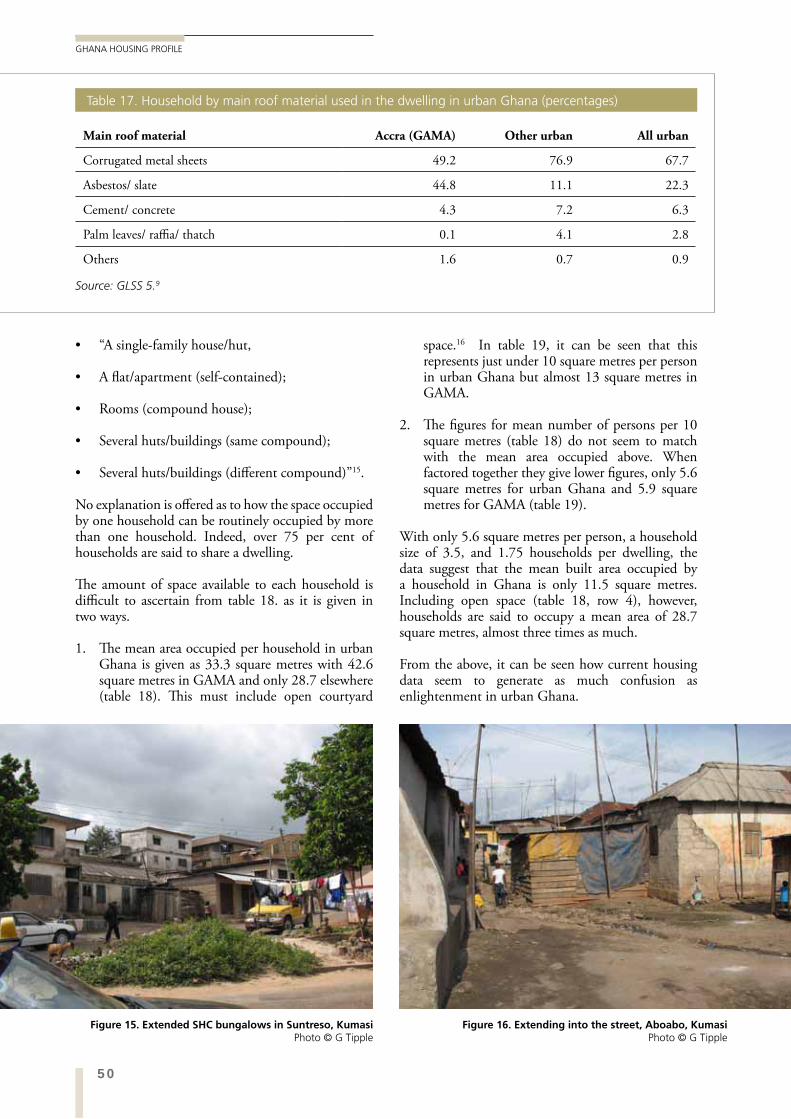
50
GHANA HOUSING PROFILE
“A single-family house/hut,
A flat/apartment (self-contained);
Rooms (compound house);
Several huts/buildings (same compound);
Several huts/buildings (different compound)”15.
No explanation is offered as to how the space occupied by one household can be routinely occupied by more than one household. Indeed, over 75 per cent of households are said to share a dwelling.
The amount of space available to each household is difficult to ascertain from table 18. as it is given in two ways.
1. The mean area occupied per household in urban Ghana is given as 33.3 square metres with 42.6 square metres in GAMA and only 28.7 elsewhere (table 18). This must include open courtyard
space.16 In table 19, it can be seen that this represents just under 10 square metres per person in urban Ghana but almost 13 square metres in GAMA.
2. The figures for mean number of persons per 10 square metres (table 18) do not seem to match with the mean area occupied above. When factored together they give lower figures, only 5.6 square metres for urban Ghana and 5.9 square metres for GAMA (table 19).
With only 5.6 square metres per person, a household size of 3.5, and 1.75 households per dwelling, the data suggest that the mean built area occupied by a household in Ghana is only 11.5 square metres. Including open space (table 18, row 4), however, households are said to occupy a mean area of 28.7 square metres, almost three times as much.
From the above, it can be seen how current housing data seem to generate as much confusion as enlightenment in urban Ghana.
Main roof material Accra (GAMA) Other urban All urban
Corrugated metal sheets 49.2 76.9 67.7
Asbestos/ slate 44.8 11.1 22.3
Cement/ concrete 4.3 7.2 6.3
Palm leaves/ raffia/ thatch 0.1 4.1 2.8
Others 1.6 0.7 0.9
Source: GLSS 5.9
Table 17. Household by main roof material used in the dwelling in urban Ghana (percentages)
Figure 15. Extended SHC bungalows in Suntreso, Kumasi Photo © G Tipple
Figure 16. Extending into the street, Aboabo, Kumasi Photo © G Tipple
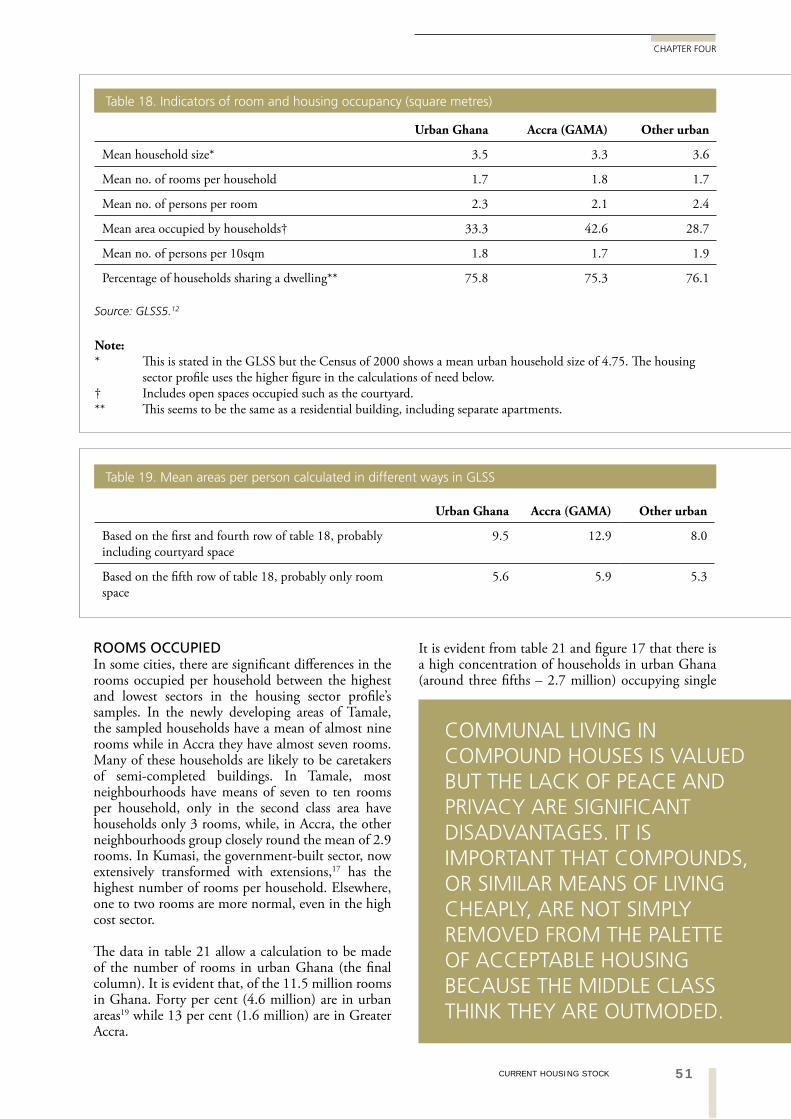
51CURRENT HOUSING STOCK
CHAPTER FOUR
ROOMS OCCUPIED In some cities, there are significant differences in the rooms occupied per household between the highest and lowest sectors in the housing sector profile’s samples. In the newly developing areas of Tamale, the sampled households have a mean of almost nine rooms while in Accra they have almost seven rooms. Many of these households are likely to be caretakers of semi-completed buildings. In Tamale, most neighbourhoods have means of seven to ten rooms per household, only in the second class area have households only 3 rooms, while, in Accra, the other neighbourhoods group closely round the mean of 2.9 rooms. In Kumasi, the government-built sector, now extensively transformed with extensions,17 has the highest number of rooms per household. Elsewhere, one to two rooms are more normal, even in the high cost sector.
The data in table 21 allow a calculation to be made of the number of rooms in urban Ghana (the final column). It is evident that, of the 11.5 million rooms in Ghana. Forty per cent (4.6 million) are in urban areas19 while 13 per cent (1.6 million) are in Greater Accra.
It is evident from table 21 and figure 17 that there is a high concentration of households in urban Ghana (around three fifths – 2.7 million) occupying single
Urban Ghana Accra (GAMA) Other urban
Mean household size* 3.5 3.3 3.6
Mean no. of rooms per household 1.7 1.8 1.7
Mean no. of persons per room 2.3 2.1 2.4
Mean area occupied by households† 33.3 42.6 28.7
Mean no. of persons per 10sqm 1.8 1.7 1.9
Percentage of households sharing a dwelling** 75.8 75.3 76.1
Source: GLSS5.12
Table 18. Indicators of room and housing occupancy (square metres)
Note: * This is stated in the GLSS but the Census of 2000 shows a mean urban household size of 4.75. The housing sector profile uses the higher figure in the calculations of need below.† Includes open spaces occupied such as the courtyard.** This seems to be the same as a residential building, including separate apartments.
Urban Ghana Accra (GAMA) Other urban
Based on the first and fourth row of table 18, probably including courtyard space
9.5 12.9 8.0
Based on the fifth row of table 18, probably only room space
5.6 5.9 5.3
Table 19. Mean areas per person calculated in different ways in GLSS
COMMUNAL LIVING IN COMPOUND HOUSES IS VALUED BUT THE LACK OF PEACE AND PRIVACY ARE SIGNIFICANT DISADVANTAGES. IT IS IMPORTANT THAT COMPOUNDS, OR SIMILAR MEANS OF LIVING CHEAPLY, ARE NOT SIMPLY REMOVED FROM THE PALETTE OF ACCEPTABLE HOUSING BECAUSE THE MIDDLE CLASS THINK THEY ARE OUTMODED.
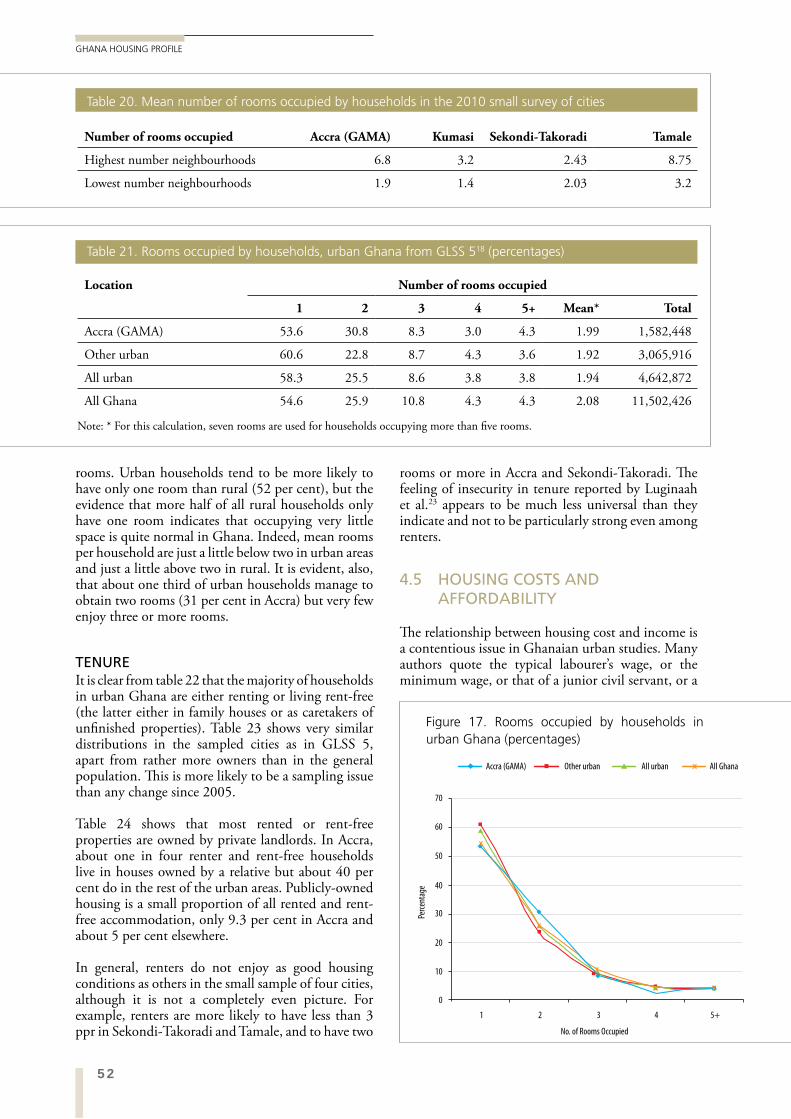
52
GHANA HOUSING PROFILE
rooms. Urban households tend to be more likely to have only one room than rural (52 per cent), but the evidence that more half of all rural households only have one room indicates that occupying very little space is quite normal in Ghana. Indeed, mean rooms per household are just a little below two in urban areas and just a little above two in rural. It is evident, also, that about one third of urban households manage to obtain two rooms (31 per cent in Accra) but very few enjoy three or more rooms.
TENUREIt is clear from table 22 that the majority of households in urban Ghana are either renting or living rent-free (the latter either in family houses or as caretakers of unfinished properties). Table 23 shows very similar distributions in the sampled cities as in GLSS 5, apart from rather more owners than in the general population. This is more likely to be a sampling issue than any change since 2005.
Table 24 shows that most rented or rent-free properties are owned by private landlords. In Accra, about one in four renter and rent-free households live in houses owned by a relative but about 40 per cent do in the rest of the urban areas. Publicly-owned housing is a small proportion of all rented and rent-free accommodation, only 9.3 per cent in Accra and about 5 per cent elsewhere.
In general, renters do not enjoy as good housing conditions as others in the small sample of four cities, although it is not a completely even picture. For example, renters are more likely to have less than 3 ppr in Sekondi-Takoradi and Tamale, and to have two
rooms or more in Accra and Sekondi-Takoradi. The feeling of insecurity in tenure reported by Luginaah et al.23 appears to be much less universal than they indicate and not to be particularly strong even among renters.
4.5 HOUSING COSTS AND AFFORDABILITY
The relationship between housing cost and income is a contentious issue in Ghanaian urban studies. Many authors quote the typical labourer’s wage, or the minimum wage, or that of a junior civil servant, or a
Number of rooms occupied Accra (GAMA) Kumasi Sekondi-Takoradi Tamale
Highest number neighbourhoods 6.8 3.2 2.43 8.75
Lowest number neighbourhoods 1.9 1.4 2.03 3.2
Table 20. Mean number of rooms occupied by households in the 2010 small survey of cities
Table 21. Rooms occupied by households, urban Ghana from GLSS 518 (percentages)
Location Number of rooms occupied
1 2 3 4 5+ Mean* Total
Accra (GAMA) 53.6 30.8 8.3 3.0 4.3 1.99 1,582,448
Other urban 60.6 22.8 8.7 4.3 3.6 1.92 3,065,916
All urban 58.3 25.5 8.6 3.8 3.8 1.94 4,642,872
All Ghana 54.6 25.9 10.8 4.3 4.3 2.08 11,502,426
Note: * For this calculation, seven rooms are used for households occupying more than five rooms.Pe
rcen
tage
No. of Rooms Occupied
Accra (GAMA) Other urban All urban All Ghana
0
1 2 3 4 5+
10
20
30
40
50
60
70
x
x
x
x
x x
Figure 17. Rooms occupied by households in urban Ghana (percentages)
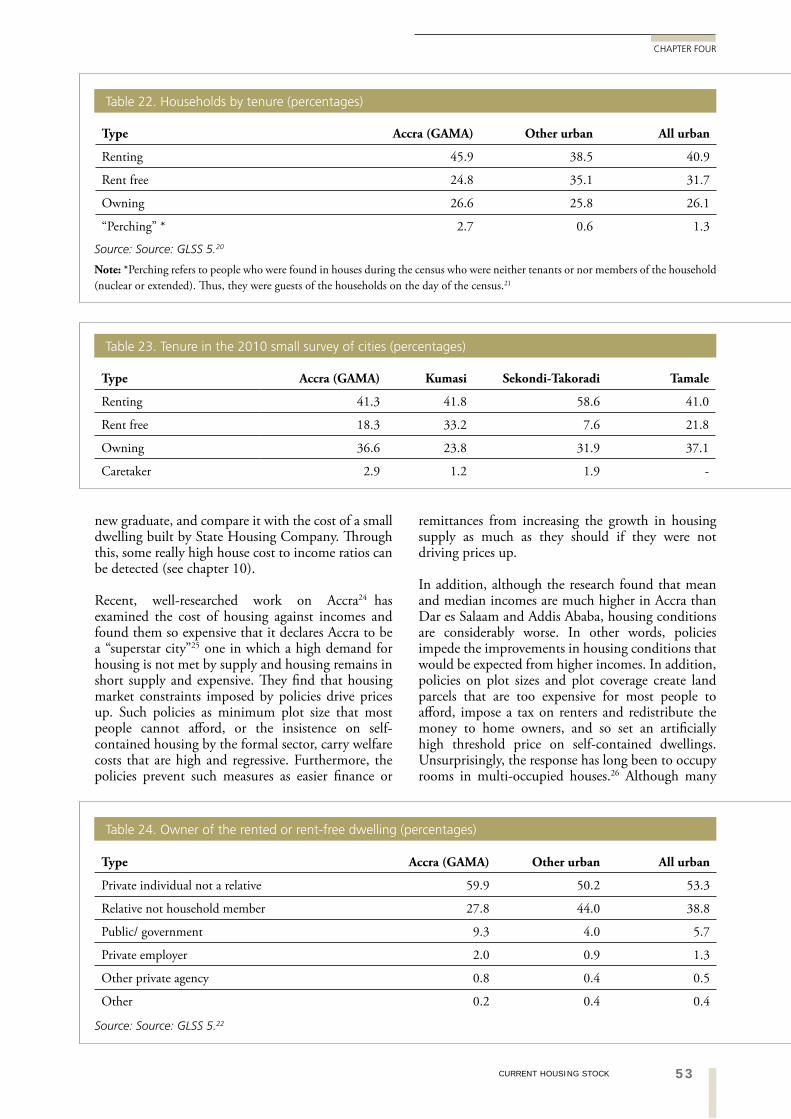
53CURRENT HOUSING STOCK
CHAPTER FOUR
new graduate, and compare it with the cost of a small dwelling built by State Housing Company. Through this, some really high house cost to income ratios can be detected (see chapter 10).
Recent, well-researched work on Accra24 has examined the cost of housing against incomes and found them so expensive that it declares Accra to be a “superstar city”25 one in which a high demand for housing is not met by supply and housing remains in short supply and expensive. They find that housing market constraints imposed by policies drive prices up. Such policies as minimum plot size that most people cannot afford, or the insistence on self-contained housing by the formal sector, carry welfare costs that are high and regressive. Furthermore, the policies prevent such measures as easier finance or
remittances from increasing the growth in housing supply as much as they should if they were not driving prices up.
In addition, although the research found that mean and median incomes are much higher in Accra than Dar es Salaam and Addis Ababa, housing conditions are considerably worse. In other words, policies impede the improvements in housing conditions that would be expected from higher incomes. In addition, policies on plot sizes and plot coverage create land parcels that are too expensive for most people to afford, impose a tax on renters and redistribute the money to home owners, and so set an artificially high threshold price on self-contained dwellings. Unsurprisingly, the response has long been to occupy rooms in multi-occupied houses.26 Although many
Type Accra (GAMA) Other urban All urban
Renting 45.9 38.5 40.9
Rent free 24.8 35.1 31.7
Owning 26.6 25.8 26.1
“Perching” * 2.7 0.6 1.3
Table 22. Households by tenure (percentages)
Source: Source: GLSS 5.20
Note: *Perching refers to people who were found in houses during the census who were neither tenants or nor members of the household (nuclear or extended). Thus, they were guests of the households on the day of the census.21
Type Accra (GAMA) Kumasi Sekondi-Takoradi Tamale
Renting 41.3 41.8 58.6 41.0
Rent free 18.3 33.2 7.6 21.8
Owning 36.6 23.8 31.9 37.1
Caretaker 2.9 1.2 1.9 -
Table 23. Tenure in the 2010 small survey of cities (percentages)
Type Accra (GAMA) Other urban All urban
Private individual not a relative 59.9 50.2 53.3
Relative not household member 27.8 44.0 38.8
Public/ government 9.3 4.0 5.7
Private employer 2.0 0.9 1.3
Other private agency 0.8 0.4 0.5
Other 0.2 0.4 0.4
Source: Source: GLSS 5.22
Table 24. Owner of the rented or rent-free dwelling (percentages)
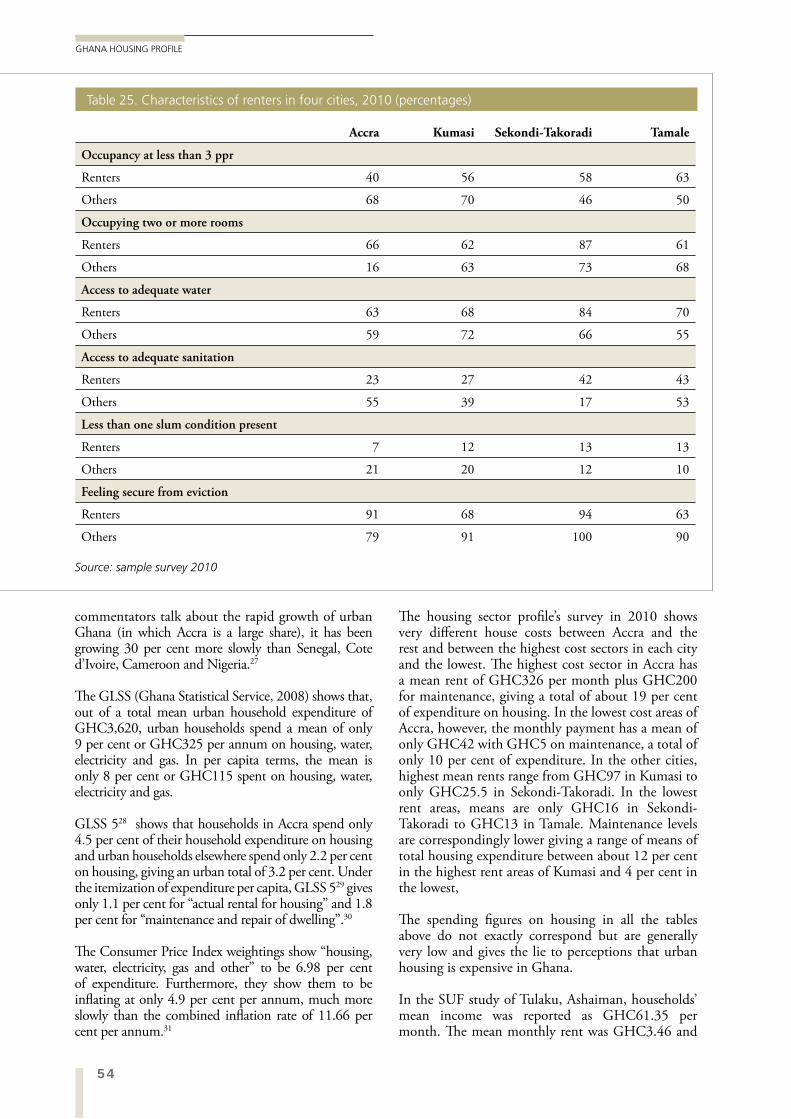
54
GHANA HOUSING PROFILE
The housing sector profile’s survey in 2010 shows very different house costs between Accra and the rest and between the highest cost sectors in each city and the lowest. The highest cost sector in Accra has a mean rent of GHC326 per month plus GHC200 for maintenance, giving a total of about 19 per cent of expenditure on housing. In the lowest cost areas of Accra, however, the monthly payment has a mean of only GHC42 with GHC5 on maintenance, a total of only 10 per cent of expenditure. In the other cities, highest mean rents range from GHC97 in Kumasi to only GHC25.5 in Sekondi-Takoradi. In the lowest rent areas, means are only GHC16 in Sekondi-Takoradi to GHC13 in Tamale. Maintenance levels are correspondingly lower giving a range of means of total housing expenditure between about 12 per cent in the highest rent areas of Kumasi and 4 per cent in the lowest,
The spending figures on housing in all the tables above do not exactly correspond but are generally very low and gives the lie to perceptions that urban housing is expensive in Ghana.
In the SUF study of Tulaku, Ashaiman, households’ mean income was reported as GHC61.35 per month. The mean monthly rent was GHC3.46 and
commentators talk about the rapid growth of urban Ghana (in which Accra is a large share), it has been growing 30 per cent more slowly than Senegal, Cote d’Ivoire, Cameroon and Nigeria.27
The GLSS (Ghana Statistical Service, 2008) shows that, out of a total mean urban household expenditure of GHC3,620, urban households spend a mean of only 9 per cent or GHC325 per annum on housing, water, electricity and gas. In per capita terms, the mean is only 8 per cent or GHC115 spent on housing, water, electricity and gas.
GLSS 528 shows that households in Accra spend only 4.5 per cent of their household expenditure on housing and urban households elsewhere spend only 2.2 per cent on housing, giving an urban total of 3.2 per cent. Under the itemization of expenditure per capita, GLSS 529 gives only 1.1 per cent for “actual rental for housing” and 1.8 per cent for “maintenance and repair of dwelling”.30
The Consumer Price Index weightings show “housing, water, electricity, gas and other” to be 6.98 per cent of expenditure. Furthermore, they show them to be inflating at only 4.9 per cent per annum, much more slowly than the combined inflation rate of 11.66 per cent per annum.31
Accra Kumasi Sekondi-Takoradi Tamale
Occupancy at less than 3 ppr
Renters 40 56 58 63
Others 68 70 46 50
Occupying two or more rooms
Renters 66 62 87 61
Others 16 63 73 68
Access to adequate water
Renters 63 68 84 70
Others 59 72 66 55
Access to adequate sanitation
Renters 23 27 42 43
Others 55 39 17 53
Less than one slum condition present
Renters 7 12 13 13
Others 21 20 12 10
Feeling secure from eviction
Renters 91 68 94 63
Others 79 91 100 90
Table 25. Characteristics of renters in four cities, 2010 (percentages)
Source: sample survey 2010
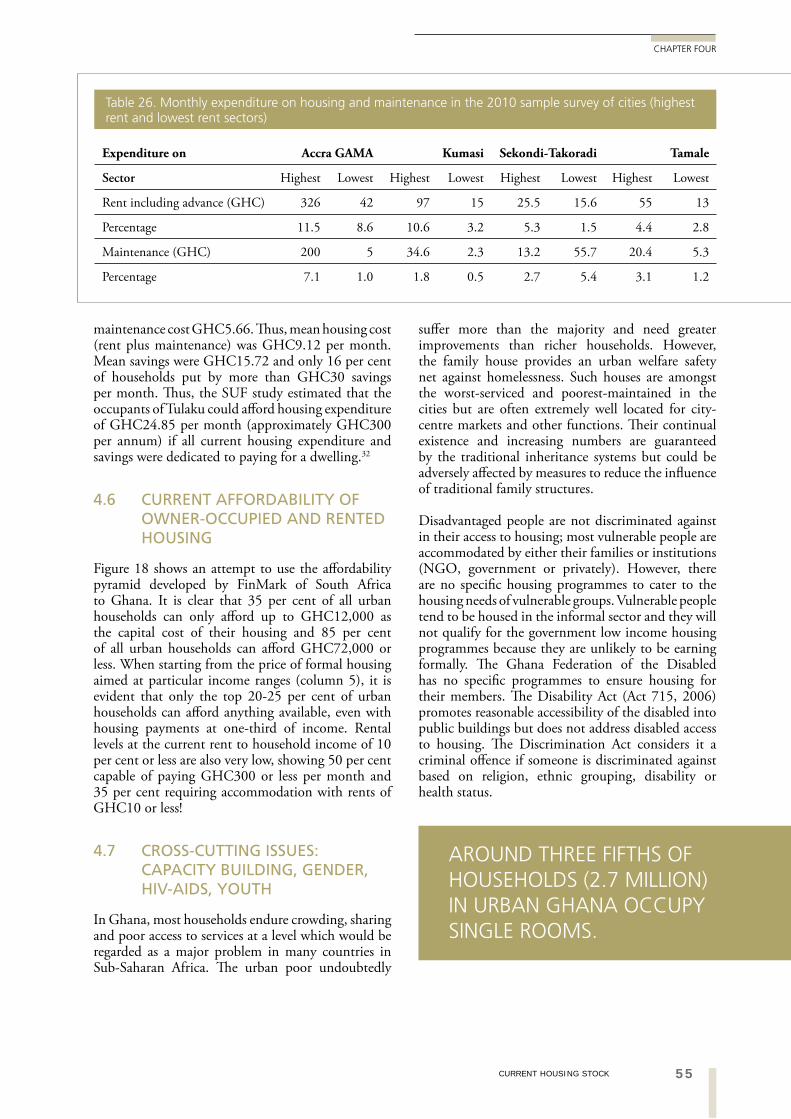
55CURRENT HOUSING STOCK
CHAPTER FOUR
maintenance cost GHC5.66. Thus, mean housing cost (rent plus maintenance) was GHC9.12 per month. Mean savings were GHC15.72 and only 16 per cent of households put by more than GHC30 savings per month. Thus, the SUF study estimated that the occupants of Tulaku could afford housing expenditure of GHC24.85 per month (approximately GHC300 per annum) if all current housing expenditure and savings were dedicated to paying for a dwelling.32
4.6 CURRENT AFFORDABILITY OF OWNER-OCCUPIED AND RENTED HOUSING
Figure 18 shows an attempt to use the affordability pyramid developed by FinMark of South Africa to Ghana. It is clear that 35 per cent of all urban households can only afford up to GHC12,000 as the capital cost of their housing and 85 per cent of all urban households can afford GHC72,000 or less. When starting from the price of formal housing aimed at particular income ranges (column 5), it is evident that only the top 20-25 per cent of urban households can afford anything available, even with housing payments at one-third of income. Rental levels at the current rent to household income of 10 per cent or less are also very low, showing 50 per cent capable of paying GHC300 or less per month and 35 per cent requiring accommodation with rents of GHC10 or less!
4.7 CROSS-CUTTING ISSUES: CAPACITY BUILDING, GENDER, HIV-AIDS, YOUTH
In Ghana, most households endure crowding, sharing and poor access to services at a level which would be regarded as a major problem in many countries in Sub-Saharan Africa. The urban poor undoubtedly
suffer more than the majority and need greater improvements than richer households. However, the family house provides an urban welfare safety net against homelessness. Such houses are amongst the worst-serviced and poorest-maintained in the cities but are often extremely well located for city-centre markets and other functions. Their continual existence and increasing numbers are guaranteed by the traditional inheritance systems but could be adversely affected by measures to reduce the influence of traditional family structures.
Disadvantaged people are not discriminated against in their access to housing; most vulnerable people are accommodated by either their families or institutions (NGO, government or privately). However, there are no specific housing programmes to cater to the housing needs of vulnerable groups. Vulnerable people tend to be housed in the informal sector and they will not qualify for the government low income housing programmes because they are unlikely to be earning formally. The Ghana Federation of the Disabled has no specific programmes to ensure housing for their members. The Disability Act (Act 715, 2006) promotes reasonable accessibility of the disabled into public buildings but does not address disabled access to housing. The Discrimination Act considers it a criminal offence if someone is discriminated against based on religion, ethnic grouping, disability or health status.
Expenditure on Accra GAMA Kumasi Sekondi-Takoradi Tamale
Sector Highest Lowest Highest Lowest Highest Lowest Highest Lowest
Rent including advance (GHC) 326 42 97 15 25.5 15.6 55 13
Percentage 11.5 8.6 10.6 3.2 5.3 1.5 4.4 2.8
Maintenance (GHC) 200 5 34.6 2.3 13.2 55.7 20.4 5.3
Percentage 7.1 1.0 1.8 0.5 2.7 5.4 3.1 1.2
Table 26. Monthly expenditure on housing and maintenance in the 2010 sample survey of cities (highest rent and lowest rent sectors)
AROUND THREE FIFTHS OF HOUSEHOLDS (2.7 MILLION) IN URBAN GHANA OCCUPY SINGLE ROOMS.
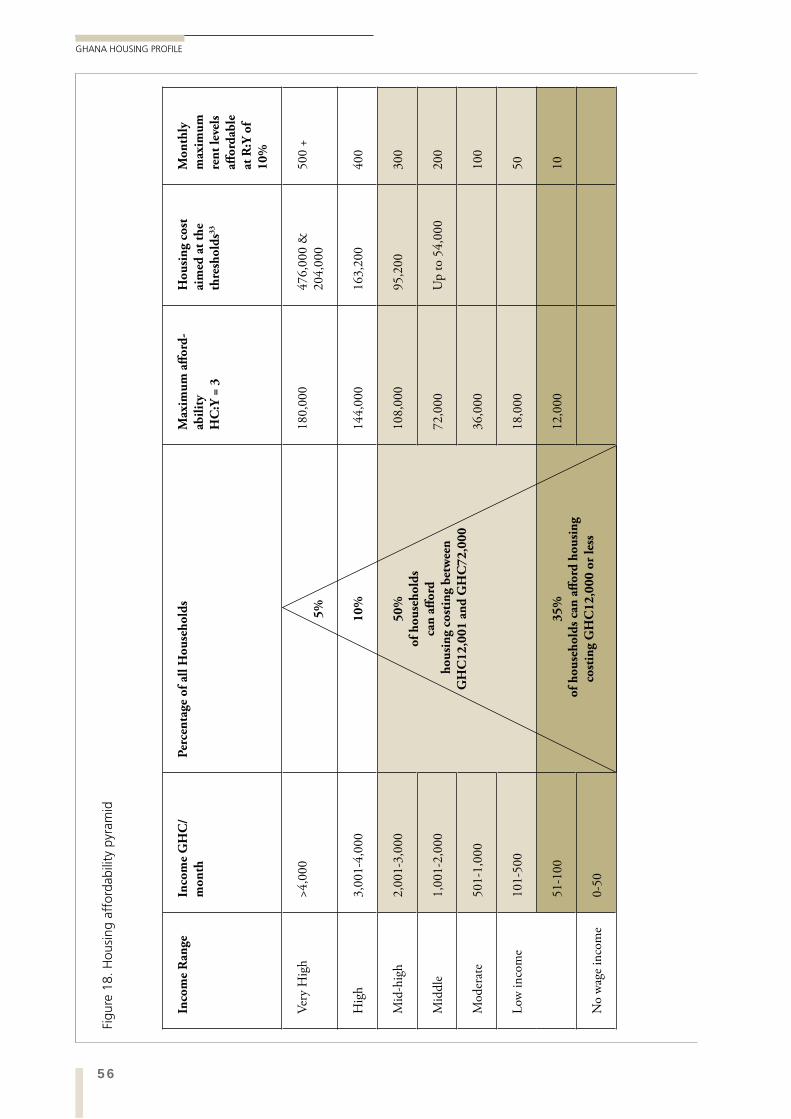
56
GHANA HOUSING PROFILE
Inco
me
Ran
geIn
com
e G
HC
/m
on
thP
erce
nta
ge o
f al
l H
ou
seh
old
sM
axim
um
aff
ord
-ab
ilit
y H
C:Y
= 3
Ho
usi
ng
cost
ai
med
at
the
thre
sho
lds3
3
Mo
nth
ly
max
imu
m
ren
t le
vels
aff
ord
able
at
R:Y
of
10
%
Very
Hig
h>4
,000
5%
180,
000
476,
000
&
204,
000
500
+
Hig
h3,
001-
4,00
01
0%
144,
000
163,
200
400
Mid
-hig
h2,
001-
3,00
05
0%
o
f h
ou
seh
old
s ca
n a
ffo
rd
ho
usi
ng
cost
ing
bet
wee
n
GH
C1
2,0
01
an
d G
HC
72
,00
0
108,
000
95,2
0030
0
Mid
dle
1,00
1-2,
000
72,0
00U
p to
54,
000
200
Mod
erat
e50
1-1,
000
36,0
0010
0
Low
inco
me
101-
500
18,0
0050
51-1
003
5%
o
f h
ou
seh
old
s ca
n a
ffo
rd h
ou
sin
gco
stin
g G
HC
12
,00
0 o
r le
ss
12,0
0010
No
wag
e in
com
e0-
50
Figu
re 1
8. H
ousi
ng a
ffor
dabi
lity
pyra
mid
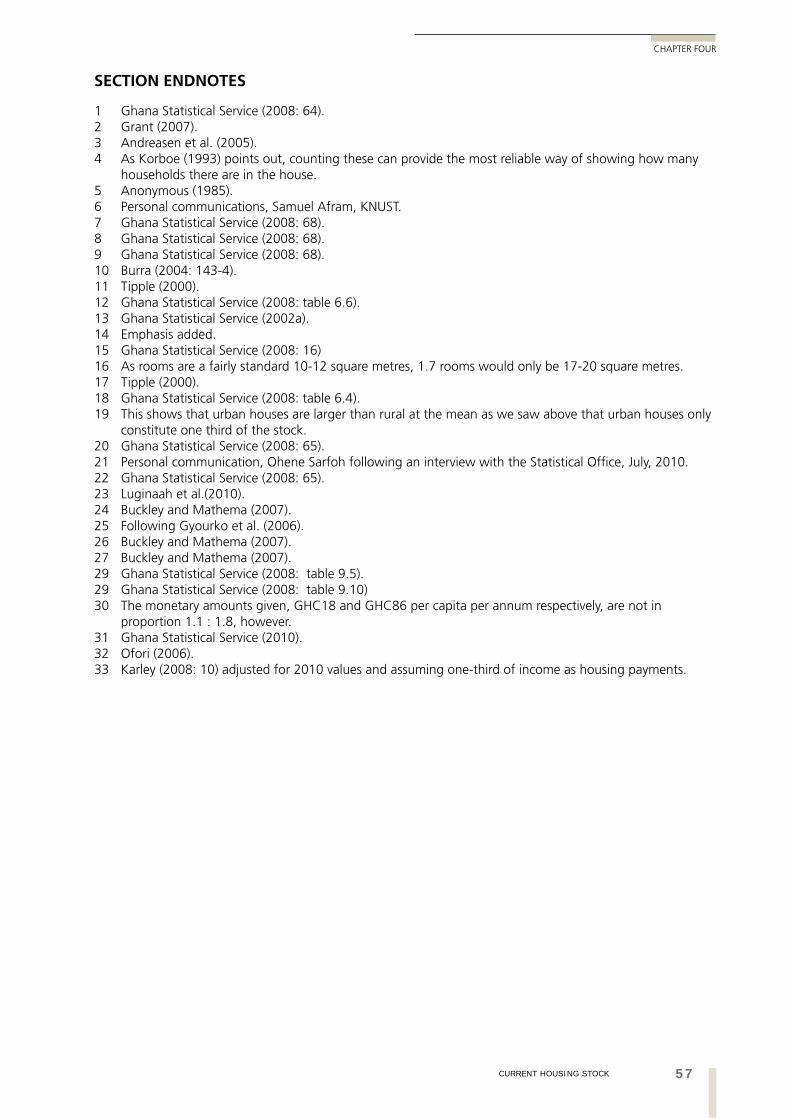
57CURRENT HOUSING STOCK
CHAPTER FOUR
SECTION ENDNOTES
1 Ghana Statistical Service (2008: 64).2 Grant (2007).3 Andreasen et al. (2005).4 As Korboe (1993) points out, counting these can provide the most reliable way of showing how many
households there are in the house.5 Anonymous (1985).6 Personal communications, Samuel Afram, KNUST.7 Ghana Statistical Service (2008: 68).8 Ghana Statistical Service (2008: 68).9 Ghana Statistical Service (2008: 68).10 Burra (2004: 143-4).11 Tipple (2000).12 Ghana Statistical Service (2008: table 6.6).13 Ghana Statistical Service (2002a).14 Emphasis added.15 Ghana Statistical Service (2008: 16)16 As rooms are a fairly standard 10-12 square metres, 1.7 rooms would only be 17-20 square metres. 17 Tipple (2000).18 Ghana Statistical Service (2008: table 6.4).19 This shows that urban houses are larger than rural at the mean as we saw above that urban houses only
constitute one third of the stock.20 Ghana Statistical Service (2008: 65).21 Personal communication, Ohene Sarfoh following an interview with the Statistical Office, July, 2010.22 Ghana Statistical Service (2008: 65).23 Luginaah et al.(2010).24 Buckley and Mathema (2007).25 Following Gyourko et al. (2006).26 Buckley and Mathema (2007).27 Buckley and Mathema (2007).29 Ghana Statistical Service (2008: table 9.5).29 Ghana Statistical Service (2008: table 9.10)30 The monetary amounts given, GHC18 and GHC86 per capita per annum respectively, are not in
proportion 1.1 : 1.8, however.31 Ghana Statistical Service (2010).32 Ofori (2006).33 Karley (2008: 10) adjusted for 2010 values and assuming one-third of income as housing payments.
58
GHANA HOUSING PROFILE
5.1 HOUSING NEED ESTIMATES RECENTLY USED IN GHANA
The link between households and housing units used officially in Ghana is a nebulous one and the argument below calls for a better one. A “dwelling unit” is defined in the Population and Housing Census, 2000, as:
“a specific area or space occupied by a particular household and therefore need not necessarily be the same as a house of which the dwelling unit may be a part”.1
A house is defined as:
“… a structurally separate and independent place of abode such that a person or group of persons can isolate themselves from the hazards of climate such as storms and the sun”.2
The problems in the calculations of housing need stem from the following:
The term ‘dwelling unit’ is not always clear or used appropriately. Buildings used for residential purposes are extremely varied in size (from one to several dozen rooms). Rooms occupied by a single household tend to be part of a larger building and are not separated in any of the conventional ways that a dwelling would be from other households’ accommodation.
To add to the confusion, there is no word for ‘dwelling’ or ‘household’ in several of the major Ghanaian languages3 so the understanding of them by ordinary households answering census questions is likely to be ambiguous at best.
Despite the definition of dwelling specifying that it is the space occupied by one household, all statistics state that there is a mean of much more than one household per dwelling.
The housing need calculations currently used by government and academics are based, variously, on housing units,4 houses or dwellings, often using the terms interchangeably.
The 1987 National Housing Policy5 adopts needs estimates based on reducing the number of people per house to seven by 2010. It estimates a need for 4.1 million houses by 2010 in the whole of Ghana, 1.65 million in urban areas. This gives a need for 101,800 dwelling units per annum in urban areas by 2006-10.
Mahama and Antwi6 quote official estimates of a deficit of 300,000 housing units and a need for 1.2 million by 2005, needing about 130,000 new housing units per annum against a supply of 25,000.7
UN-HABITAT8 uses the 2000 Census figures of current housing stock (2,181,975) and the intercensal growth to 2010 of 5,106,261, to estimate a need for 1,001,228 houses for the additional population. This seems to have been calculated by dividing the population growth by 5.1, the mean household size.
05NEED FOR HOUSING IN URBAN
GHANA
AT A HOUSE COST TO INCOME RATIO OF THREE, HOUSEHOLDS CAN AFFORD BETWEEN US$10,000 AND $18,000 (GHC14-25,000) FOR THEIR HOUSING, EITHER TO OWN OR TO RENT FOR MARKET RENTS. THIS TRANSLATES TO ROOMS COSTING BETWEEN US$2,200 AND US$4000 (GHC3,100 – GHC5,500) EACH.
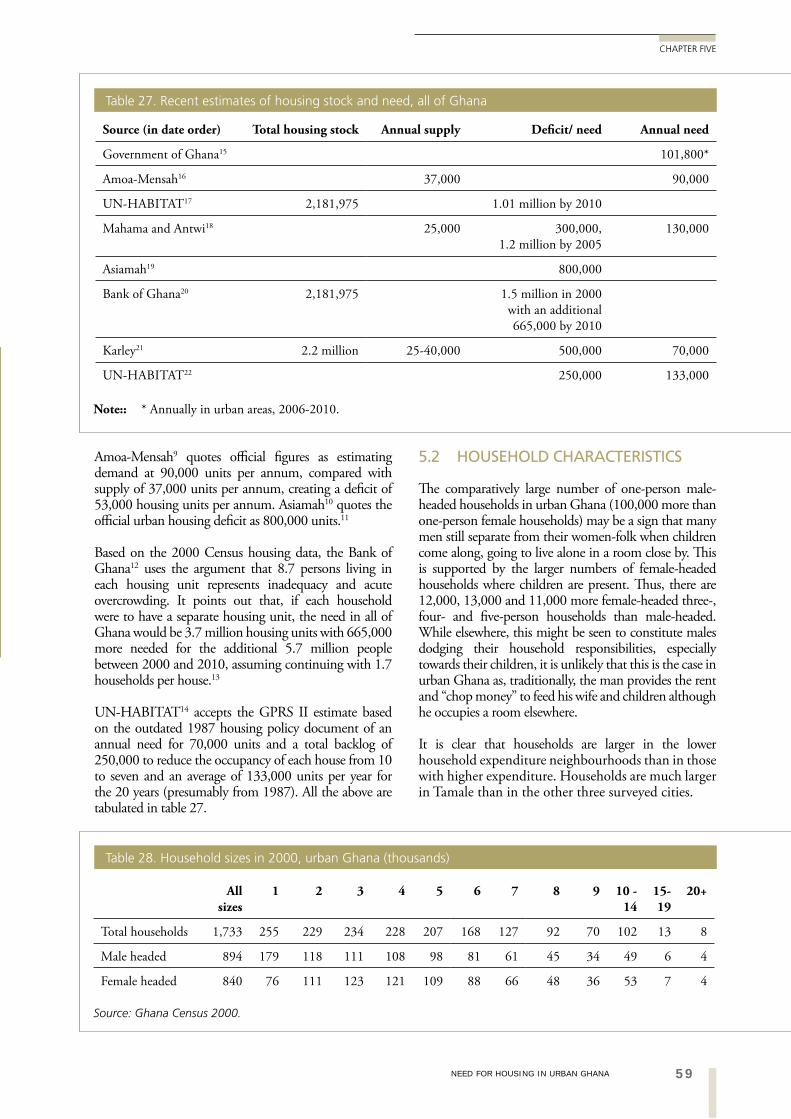
59NEED FOR HOUSING IN URBAN GHANA
CHAPTER FIVE
Amoa-Mensah9 quotes official figures as estimating demand at 90,000 units per annum, compared with supply of 37,000 units per annum, creating a deficit of 53,000 housing units per annum. Asiamah10 quotes the official urban housing deficit as 800,000 units.11
Based on the 2000 Census housing data, the Bank of Ghana12 uses the argument that 8.7 persons living in each housing unit represents inadequacy and acute overcrowding. It points out that, if each household were to have a separate housing unit, the need in all of Ghana would be 3.7 million housing units with 665,000 more needed for the additional 5.7 million people between 2000 and 2010, assuming continuing with 1.7 households per house.13
UN-HABITAT14 accepts the GPRS II estimate based on the outdated 1987 housing policy document of an annual need for 70,000 units and a total backlog of 250,000 to reduce the occupancy of each house from 10 to seven and an average of 133,000 units per year for the 20 years (presumably from 1987). All the above are tabulated in table 27.
5.2 HOUSEHOLD CHARACTERISTICS
The comparatively large number of one-person male-headed households in urban Ghana (100,000 more than one-person female households) may be a sign that many men still separate from their women-folk when children come along, going to live alone in a room close by. This is supported by the larger numbers of female-headed households where children are present. Thus, there are 12,000, 13,000 and 11,000 more female-headed three-, four- and five-person households than male-headed. While elsewhere, this might be seen to constitute males dodging their household responsibilities, especially towards their children, it is unlikely that this is the case in urban Ghana as, traditionally, the man provides the rent and “chop money” to feed his wife and children although he occupies a room elsewhere.
It is clear that households are larger in the lower household expenditure neighbourhoods than in those with higher expenditure. Households are much larger in Tamale than in the other three surveyed cities.
Source (in date order) Total housing stock Annual supply Deficit/ need Annual need
Government of Ghana15 101,800*
Amoa-Mensah16 37,000 90,000
UN-HABITAT17 2,181,975 1.01 million by 2010
Mahama and Antwi18 25,000 300,000, 1.2 million by 2005
130,000
Asiamah19 800,000
Bank of Ghana20 2,181,975 1.5 million in 2000 with an additional 665,000 by 2010
Karley21 2.2 million 25-40,000 500,000 70,000
UN-HABITAT22 250,000 133,000
Note:: * Annually in urban areas, 2006-2010.
Table 27. Recent estimates of housing stock and need, all of Ghana
All sizes
1 2 3 4 5 6 7 8 9 10 - 14
15-19
20+
Total households 1,733 255 229 234 228 207 168 127 92 70 102 13 8
Male headed 894 179 118 111 108 98 81 61 45 34 49 6 4
Female headed 840 76 111 123 121 109 88 66 48 36 53 7 4
Table 28. Household sizes in 2000, urban Ghana (thousands)
Source: Ghana Census 2000.
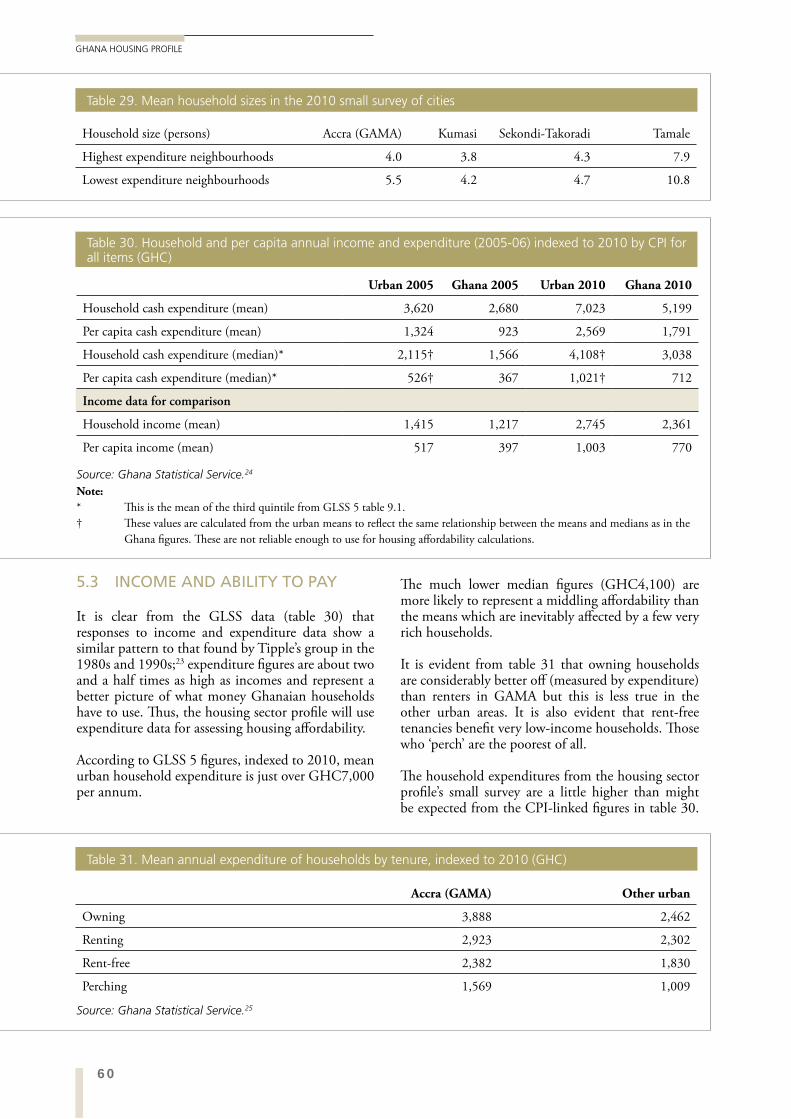
60
GHANA HOUSING PROFILE
The much lower median figures (GHC4,100) are more likely to represent a middling affordability than the means which are inevitably affected by a few very rich households.
It is evident from table 31 that owning households are considerably better off (measured by expenditure) than renters in GAMA but this is less true in the other urban areas. It is also evident that rent-free tenancies benefit very low-income households. Those who ‘perch’ are the poorest of all.
The household expenditures from the housing sector profile’s small survey are a little higher than might be expected from the CPI-linked figures in table 30.
5.3 INCOME AND ABILITY TO PAY
It is clear from the GLSS data (table 30) that responses to income and expenditure data show a similar pattern to that found by Tipple’s group in the 1980s and 1990s;23 expenditure figures are about two and a half times as high as incomes and represent a better picture of what money Ghanaian households have to use. Thus, the housing sector profile will use expenditure data for assessing housing affordability.
According to GLSS 5 figures, indexed to 2010, mean urban household expenditure is just over GHC7,000 per annum.
Household size (persons) Accra (GAMA) Kumasi Sekondi-Takoradi Tamale
Highest expenditure neighbourhoods 4.0 3.8 4.3 7.9
Lowest expenditure neighbourhoods 5.5 4.2 4.7 10.8
Table 29. Mean household sizes in the 2010 small survey of cities
Urban 2005 Ghana 2005 Urban 2010 Ghana 2010
Household cash expenditure (mean) 3,620 2,680 7,023 5,199
Per capita cash expenditure (mean) 1,324 923 2,569 1,791
Household cash expenditure (median)* 2,115† 1,566 4,108† 3,038
Per capita cash expenditure (median)* 526† 367 1,021† 712
Income data for comparison
Household income (mean) 1,415 1,217 2,745 2,361
Per capita income (mean) 517 397 1,003 770
Table 30. Household and per capita annual income and expenditure (2005-06) indexed to 2010 by CPI for all items (GHC)
Source: Ghana Statistical Service.24
Note: * This is the mean of the third quintile from GLSS 5 table 9.1. † These values are calculated from the urban means to reflect the same relationship between the means and medians as in the Ghana figures. These are not reliable enough to use for housing affordability calculations.
Accra (GAMA) Other urban
Owning 3,888 2,462
Renting 2,923 2,302
Rent-free 2,382 1,830
Perching 1,569 1,009
Source: Ghana Statistical Service.25
Table 31. Mean annual expenditure of households by tenure, indexed to 2010 (GHC)
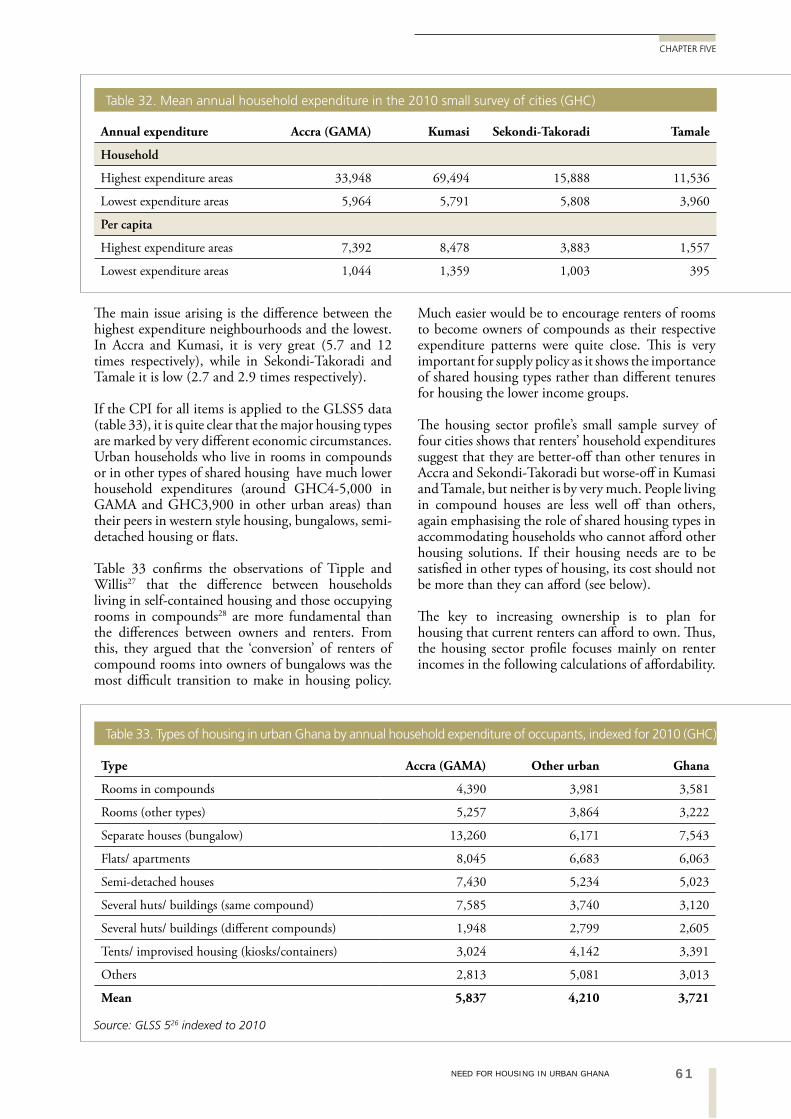
61NEED FOR HOUSING IN URBAN GHANA
CHAPTER FIVE
The main issue arising is the difference between the highest expenditure neighbourhoods and the lowest. In Accra and Kumasi, it is very great (5.7 and 12 times respectively), while in Sekondi-Takoradi and Tamale it is low (2.7 and 2.9 times respectively).
If the CPI for all items is applied to the GLSS5 data (table 33), it is quite clear that the major housing types are marked by very different economic circumstances. Urban households who live in rooms in compounds or in other types of shared housing have much lower household expenditures (around GHC4-5,000 in GAMA and GHC3,900 in other urban areas) than their peers in western style housing, bungalows, semi-detached housing or flats.
Table 33 confirms the observations of Tipple and Willis27 that the difference between households living in self-contained housing and those occupying rooms in compounds28 are more fundamental than the differences between owners and renters. From this, they argued that the ‘conversion’ of renters of compound rooms into owners of bungalows was the most difficult transition to make in housing policy.
Much easier would be to encourage renters of rooms to become owners of compounds as their respective expenditure patterns were quite close. This is very important for supply policy as it shows the importance of shared housing types rather than different tenures for housing the lower income groups.
The housing sector profile’s small sample survey of four cities shows that renters’ household expenditures suggest that they are better-off than other tenures in Accra and Sekondi-Takoradi but worse-off in Kumasi and Tamale, but neither is by very much. People living in compound houses are less well off than others, again emphasising the role of shared housing types in accommodating households who cannot afford other housing solutions. If their housing needs are to be satisfied in other types of housing, its cost should not be more than they can afford (see below).
The key to increasing ownership is to plan for housing that current renters can afford to own. Thus, the housing sector profile focuses mainly on renter incomes in the following calculations of affordability.
Annual expenditure Accra (GAMA) Kumasi Sekondi-Takoradi Tamale
Household
Highest expenditure areas 33,948 69,494 15,888 11,536
Lowest expenditure areas 5,964 5,791 5,808 3,960
Per capita
Highest expenditure areas 7,392 8,478 3,883 1,557
Lowest expenditure areas 1,044 1,359 1,003 395
Table 32. Mean annual household expenditure in the 2010 small survey of cities (GHC)
Source: GLSS 526 indexed to 2010
Type Accra (GAMA) Other urban Ghana
Rooms in compounds 4,390 3,981 3,581
Rooms (other types) 5,257 3,864 3,222
Separate houses (bungalow) 13,260 6,171 7,543
Flats/ apartments 8,045 6,683 6,063
Semi-detached houses 7,430 5,234 5,023
Several huts/ buildings (same compound) 7,585 3,740 3,120
Several huts/ buildings (different compounds) 1,948 2,799 2,605
Tents/ improvised housing (kiosks/containers) 3,024 4,142 3,391
Others 2,813 5,081 3,013
Mean 5,837 4,210 3,721
Table 33. Types of housing in urban Ghana by annual household expenditure of occupants, indexed for 2010 (GHC)
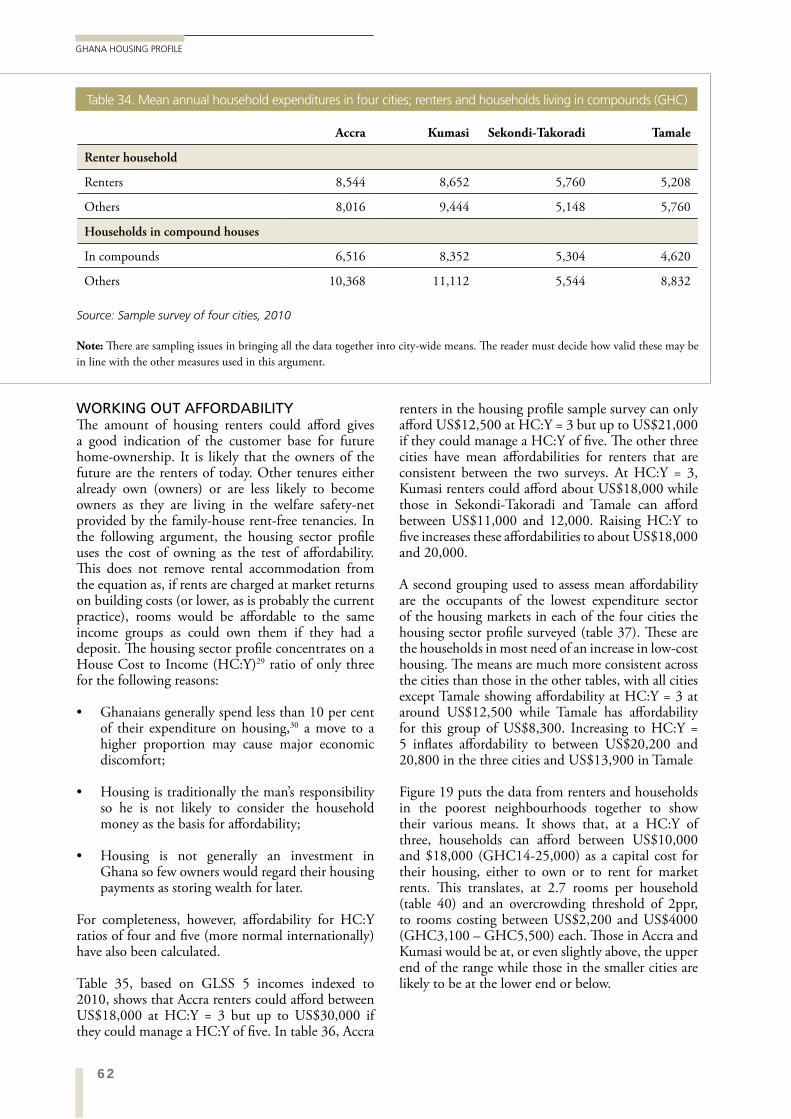
62
GHANA HOUSING PROFILE
renters in the housing profile sample survey can only afford US$12,500 at HC:Y = 3 but up to US$21,000 if they could manage a HC:Y of five. The other three cities have mean affordabilities for renters that are consistent between the two surveys. At HC:Y = 3, Kumasi renters could afford about US$18,000 while those in Sekondi-Takoradi and Tamale can afford between US$11,000 and 12,000. Raising HC:Y to five increases these affordabilities to about US$18,000 and 20,000.
A second grouping used to assess mean affordability are the occupants of the lowest expenditure sector of the housing markets in each of the four cities the housing sector profile surveyed (table 37). These are the households in most need of an increase in low-cost housing. The means are much more consistent across the cities than those in the other tables, with all cities except Tamale showing affordability at HC:Y = 3 at around US$12,500 while Tamale has affordability for this group of US$8,300. Increasing to HC:Y = 5 inflates affordability to between US$20,200 and 20,800 in the three cities and US$13,900 in Tamale
Figure 19 puts the data from renters and households in the poorest neighbourhoods together to show their various means. It shows that, at a HC:Y of three, households can afford between US$10,000 and $18,000 (GHC14-25,000) as a capital cost for their housing, either to own or to rent for market rents. This translates, at 2.7 rooms per household (table 40) and an overcrowding threshold of 2ppr, to rooms costing between US$2,200 and US$4000 (GHC3,100 – GHC5,500) each. Those in Accra and Kumasi would be at, or even slightly above, the upper end of the range while those in the smaller cities are likely to be at the lower end or below.
WORKING OUT AFFORDABILITYThe amount of housing renters could afford gives a good indication of the customer base for future home-ownership. It is likely that the owners of the future are the renters of today. Other tenures either already own (owners) or are less likely to become owners as they are living in the welfare safety-net provided by the family-house rent-free tenancies. In the following argument, the housing sector profile uses the cost of owning as the test of affordability. This does not remove rental accommodation from the equation as, if rents are charged at market returns on building costs (or lower, as is probably the current practice), rooms would be affordable to the same income groups as could own them if they had a deposit. The housing sector profile concentrates on a House Cost to Income (HC:Y)29 ratio of only three for the following reasons:
Ghanaians generally spend less than 10 per cent of their expenditure on housing,30 a move to a higher proportion may cause major economic discomfort;
Housing is traditionally the man’s responsibility so he is not likely to consider the household money as the basis for affordability;
Housing is not generally an investment in Ghana so few owners would regard their housing payments as storing wealth for later.
For completeness, however, affordability for HC:Y ratios of four and five (more normal internationally) have also been calculated.
Table 35, based on GLSS 5 incomes indexed to 2010, shows that Accra renters could afford between US$18,000 at HC:Y = 3 but up to US$30,000 if they could manage a HC:Y of five. In table 36, Accra
Accra Kumasi Sekondi-Takoradi Tamale
Renter household
Renters 8,544 8,652 5,760 5,208
Others 8,016 9,444 5,148 5,760
Households in compound houses
In compounds 6,516 8,352 5,304 4,620
Others 10,368 11,112 5,544 8,832
Table 34. Mean annual household expenditures in four cities; renters and households living in compounds (GHC)
Source: Sample survey of four cities, 2010
Note: There are sampling issues in bringing all the data together into city-wide means. The reader must decide how valid these may be in line with the other measures used in this argument.
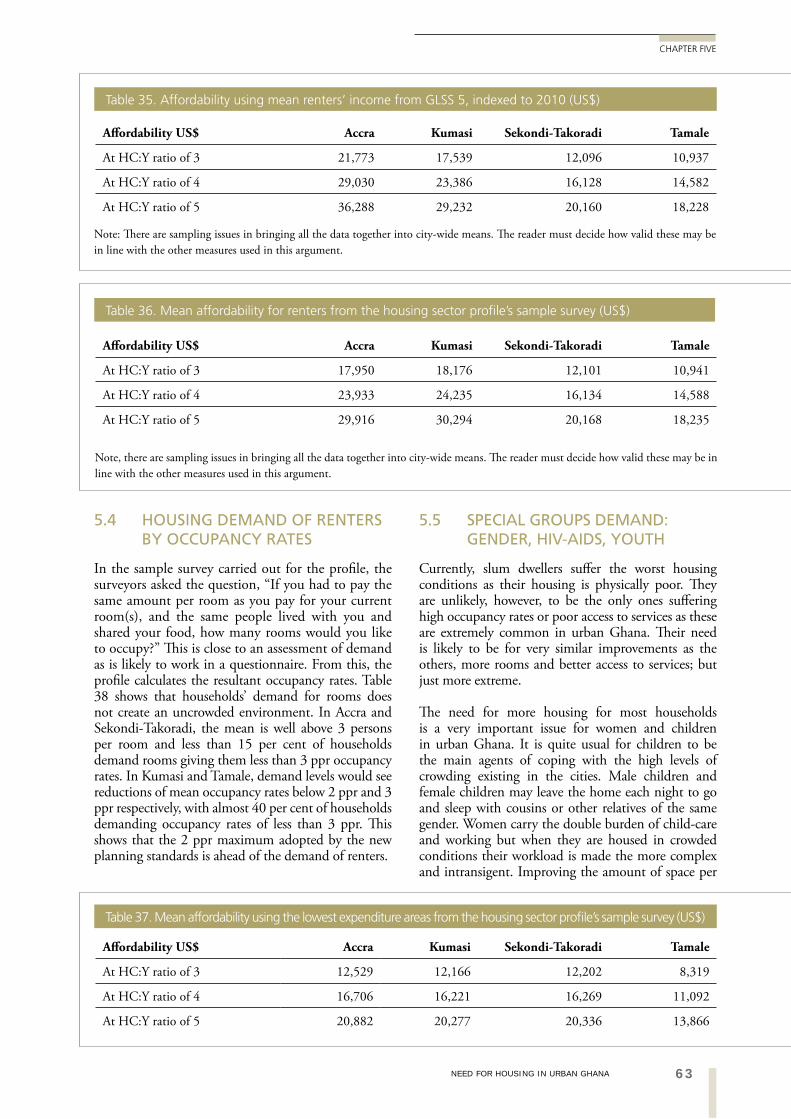
63NEED FOR HOUSING IN URBAN GHANA
CHAPTER FIVE
5.4 HOUSING DEMAND OF RENTERS BY OCCUPANCY RATES
In the sample survey carried out for the profile, the surveyors asked the question, “If you had to pay the same amount per room as you pay for your current room(s), and the same people lived with you and shared your food, how many rooms would you like to occupy?” This is close to an assessment of demand as is likely to work in a questionnaire. From this, the profile calculates the resultant occupancy rates. Table 38 shows that households’ demand for rooms does not create an uncrowded environment. In Accra and Sekondi-Takoradi, the mean is well above 3 persons per room and less than 15 per cent of households demand rooms giving them less than 3 ppr occupancy rates. In Kumasi and Tamale, demand levels would see reductions of mean occupancy rates below 2 ppr and 3 ppr respectively, with almost 40 per cent of households demanding occupancy rates of less than 3 ppr. This shows that the 2 ppr maximum adopted by the new planning standards is ahead of the demand of renters.
5.5 SPECIAL GROUPS DEMAND: GENDER, HIV-AIDS, YOUTH
Currently, slum dwellers suffer the worst housing conditions as their housing is physically poor. They are unlikely, however, to be the only ones suffering high occupancy rates or poor access to services as these are extremely common in urban Ghana. Their need is likely to be for very similar improvements as the others, more rooms and better access to services; but just more extreme.
The need for more housing for most households is a very important issue for women and children in urban Ghana. It is quite usual for children to be the main agents of coping with the high levels of crowding existing in the cities. Male children and female children may leave the home each night to go and sleep with cousins or other relatives of the same gender. Women carry the double burden of child-care and working but when they are housed in crowded conditions their workload is made the more complex and intransigent. Improving the amount of space per
Affordability US$ Accra Kumasi Sekondi-Takoradi Tamale
At HC:Y ratio of 3 21,773 17,539 12,096 10,937
At HC:Y ratio of 4 29,030 23,386 16,128 14,582
At HC:Y ratio of 5 36,288 29,232 20,160 18,228
Table 35. Affordability using mean renters’ income from GLSS 5, indexed to 2010 (US$)
Note: There are sampling issues in bringing all the data together into city-wide means. The reader must decide how valid these may be in line with the other measures used in this argument.
Affordability US$ Accra Kumasi Sekondi-Takoradi Tamale
At HC:Y ratio of 3 17,950 18,176 12,101 10,941
At HC:Y ratio of 4 23,933 24,235 16,134 14,588
At HC:Y ratio of 5 29,916 30,294 20,168 18,235
Table 36. Mean affordability for renters from the housing sector profile’s sample survey (US$)
Note, there are sampling issues in bringing all the data together into city-wide means. The reader must decide how valid these may be in line with the other measures used in this argument.
Affordability US$ Accra Kumasi Sekondi-Takoradi Tamale
At HC:Y ratio of 3 12,529 12,166 12,202 8,319
At HC:Y ratio of 4 16,706 16,221 16,269 11,092
At HC:Y ratio of 5 20,882 20,277 20,336 13,866
Table 37. Mean affordability using the lowest expenditure areas from the housing sector profile’s sample survey (US$)
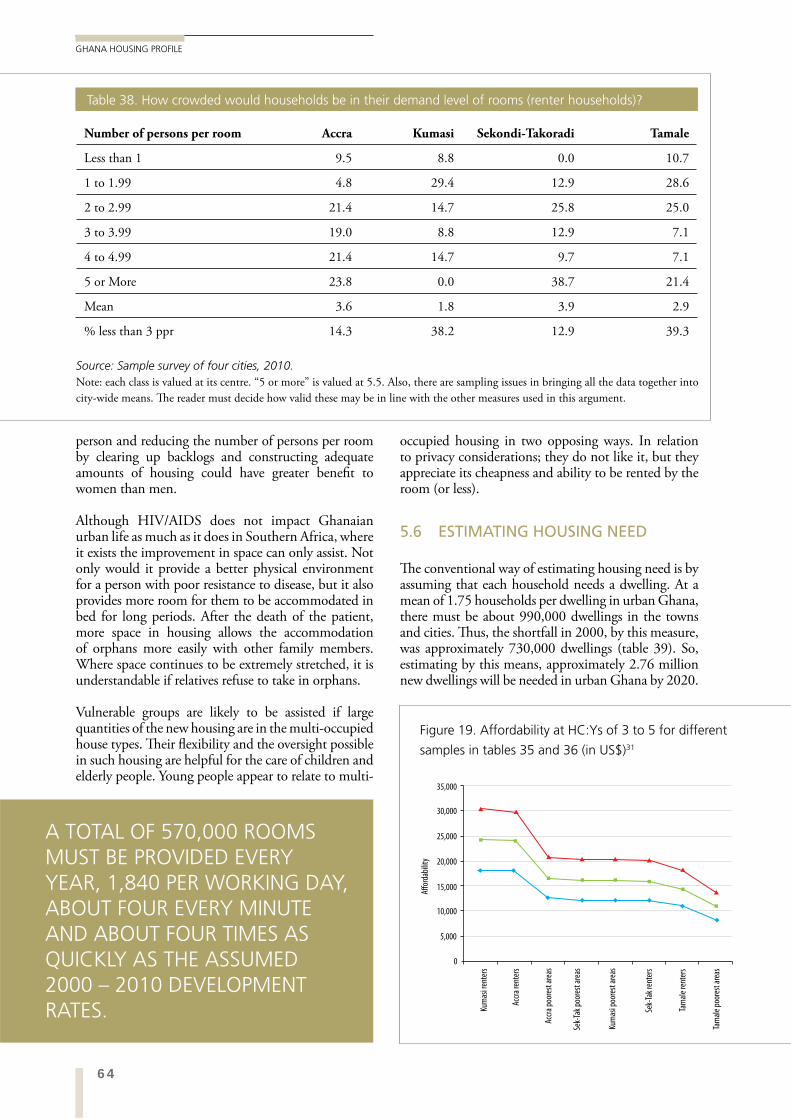
64
GHANA HOUSING PROFILE
occupied housing in two opposing ways. In relation to privacy considerations; they do not like it, but they appreciate its cheapness and ability to be rented by the room (or less).
5.6 ESTIMATING HOUSING NEED
The conventional way of estimating housing need is by assuming that each household needs a dwelling. At a mean of 1.75 households per dwelling in urban Ghana, there must be about 990,000 dwellings in the towns and cities. Thus, the shortfall in 2000, by this measure, was approximately 730,000 dwellings (table 39). So, estimating by this means, approximately 2.76 million new dwellings will be needed in urban Ghana by 2020.
person and reducing the number of persons per room by clearing up backlogs and constructing adequate amounts of housing could have greater benefit to women than men.
Although HIV/AIDS does not impact Ghanaian urban life as much as it does in Southern Africa, where it exists the improvement in space can only assist. Not only would it provide a better physical environment for a person with poor resistance to disease, but it also provides more room for them to be accommodated in bed for long periods. After the death of the patient, more space in housing allows the accommodation of orphans more easily with other family members. Where space continues to be extremely stretched, it is understandable if relatives refuse to take in orphans.
Vulnerable groups are likely to be assisted if large quantities of the new housing are in the multi-occupied house types. Their flexibility and the oversight possible in such housing are helpful for the care of children and elderly people. Young people appear to relate to multi-
Affor
dabi
lity
Kum
asi r
ente
rs
Accr
a re
nter
s
Accr
a po
ores
t are
as
Sek-
Tak
poor
est a
reas
Kum
asi p
oore
st a
reas
Sek-
Tak
rent
ers
Tam
ale
rent
ers
Tam
ale
poor
est a
reas
35,000
30,000
25,000
20,000
15,000
10,000
5,000
0
Figure 19. Affordability at HC:Ys of 3 to 5 for different
samples in tables 35 and 36 (in US$)31
Number of persons per room Accra Kumasi Sekondi-Takoradi Tamale
Less than 1 9.5 8.8 0.0 10.7
1 to 1.99 4.8 29.4 12.9 28.6
2 to 2.99 21.4 14.7 25.8 25.0
3 to 3.99 19.0 8.8 12.9 7.1
4 to 4.99 21.4 14.7 9.7 7.1
5 or More 23.8 0.0 38.7 21.4
Mean 3.6 1.8 3.9 2.9
% less than 3 ppr 14.3 38.2 12.9 39.3
Table 38. How crowded would households be in their demand level of rooms (renter households)?
Source: Sample survey of four cities, 2010.Note: each class is valued at its centre. “5 or more” is valued at 5.5. Also, there are sampling issues in bringing all the data together into city-wide means. The reader must decide how valid these may be in line with the other measures used in this argument.
A TOTAL OF 570,000 ROOMS MUST BE PROVIDED EVERY YEAR, 1,840 PER WORKING DAY, ABOUT FOUR EVERY MINUTE AND ABOUT FOUR TIMES AS QUICKLY AS THE ASSUMED 2000 – 2010 DEVELOPMENT RATES.
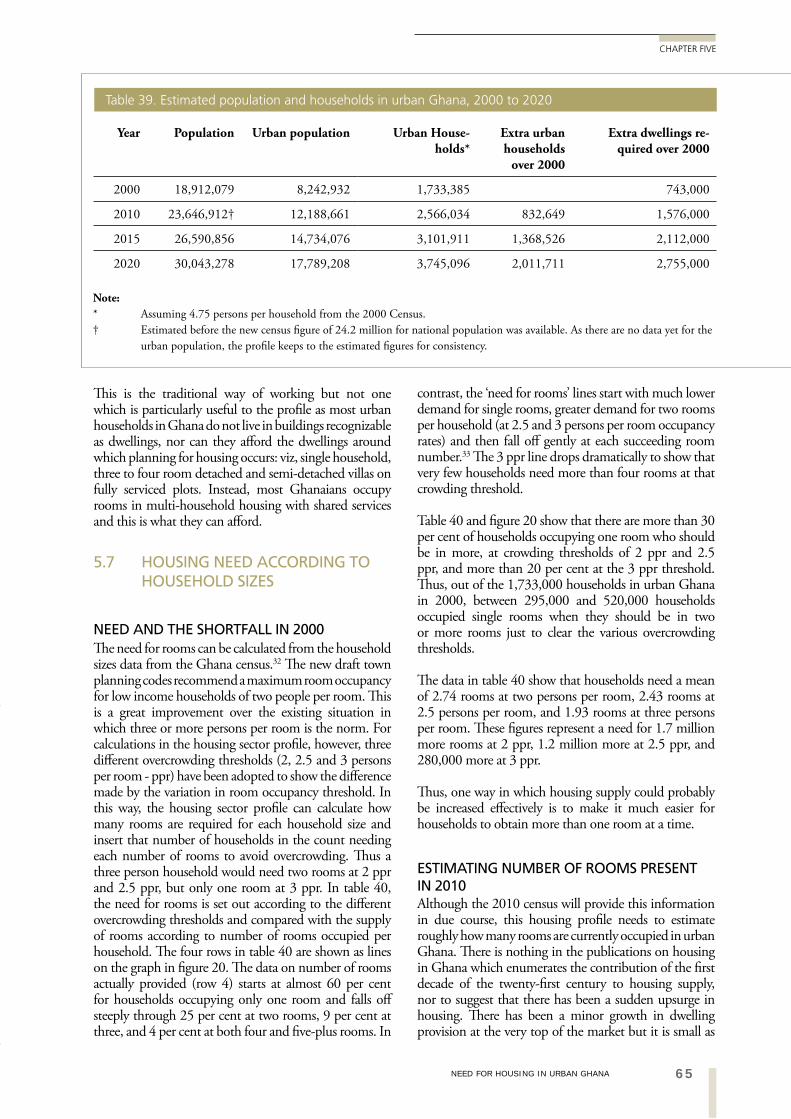
65NEED FOR HOUSING IN URBAN GHANA
CHAPTER FIVE
This is the traditional way of working but not one which is particularly useful to the profile as most urban households in Ghana do not live in buildings recognizable as dwellings, nor can they afford the dwellings around which planning for housing occurs: viz, single household, three to four room detached and semi-detached villas on fully serviced plots. Instead, most Ghanaians occupy rooms in multi-household housing with shared services and this is what they can afford.
5.7 HOUSING NEED ACCORDING TO HOUSEHOLD SIZES
NEED AND THE SHORTFALL IN 2000The need for rooms can be calculated from the household sizes data from the Ghana census.32 The new draft town planning codes recommend a maximum room occupancy for low income households of two people per room. This is a great improvement over the existing situation in which three or more persons per room is the norm. For calculations in the housing sector profile, however, three different overcrowding thresholds (2, 2.5 and 3 persons per room - ppr) have been adopted to show the difference made by the variation in room occupancy threshold. In this way, the housing sector profile can calculate how many rooms are required for each household size and insert that number of households in the count needing each number of rooms to avoid overcrowding. Thus a three person household would need two rooms at 2 ppr and 2.5 ppr, but only one room at 3 ppr. In table 40, the need for rooms is set out according to the different overcrowding thresholds and compared with the supply of rooms according to number of rooms occupied per household. The four rows in table 40 are shown as lines on the graph in figure 20. The data on number of rooms actually provided (row 4) starts at almost 60 per cent for households occupying only one room and falls off steeply through 25 per cent at two rooms, 9 per cent at three, and 4 per cent at both four and five-plus rooms. In
contrast, the ‘need for rooms’ lines start with much lower demand for single rooms, greater demand for two rooms per household (at 2.5 and 3 persons per room occupancy rates) and then fall off gently at each succeeding room number.33 The 3 ppr line drops dramatically to show that very few households need more than four rooms at that crowding threshold.
Table 40 and figure 20 show that there are more than 30 per cent of households occupying one room who should be in more, at crowding thresholds of 2 ppr and 2.5 ppr, and more than 20 per cent at the 3 ppr threshold. Thus, out of the 1,733,000 households in urban Ghana in 2000, between 295,000 and 520,000 households occupied single rooms when they should be in two or more rooms just to clear the various overcrowding thresholds.
The data in table 40 show that households need a mean of 2.74 rooms at two persons per room, 2.43 rooms at 2.5 persons per room, and 1.93 rooms at three persons per room. These figures represent a need for 1.7 million more rooms at 2 ppr, 1.2 million more at 2.5 ppr, and 280,000 more at 3 ppr.
Thus, one way in which housing supply could probably be increased effectively is to make it much easier for households to obtain more than one room at a time.
ESTIMATING NUMBER OF ROOMS PRESENT IN 2010Although the 2010 census will provide this information in due course, this housing profile needs to estimate roughly how many rooms are currently occupied in urban Ghana. There is nothing in the publications on housing in Ghana which enumerates the contribution of the first decade of the twenty-first century to housing supply, nor to suggest that there has been a sudden upsurge in housing. There has been a minor growth in dwelling provision at the very top of the market but it is small as
Year Population Urban population Urban House-holds*
Extra urban households
over 2000
Extra dwellings re-quired over 2000
2000 18,912,079 8,242,932 1,733,385 743,000
2010 23,646,912† 12,188,661 2,566,034 832,649 1,576,000
2015 26,590,856 14,734,076 3,101,911 1,368,526 2,112,000
2020 30,043,278 17,789,208 3,745,096 2,011,711 2,755,000
Table 39. Estimated population and households in urban Ghana, 2000 to 2020
Note:
* Assuming 4.75 persons per household from the 2000 Census.† Estimated before the new census figure of 24.2 million for national population was available. As there are no data yet for the urban population, the profile keeps to the estimated figures for consistency.
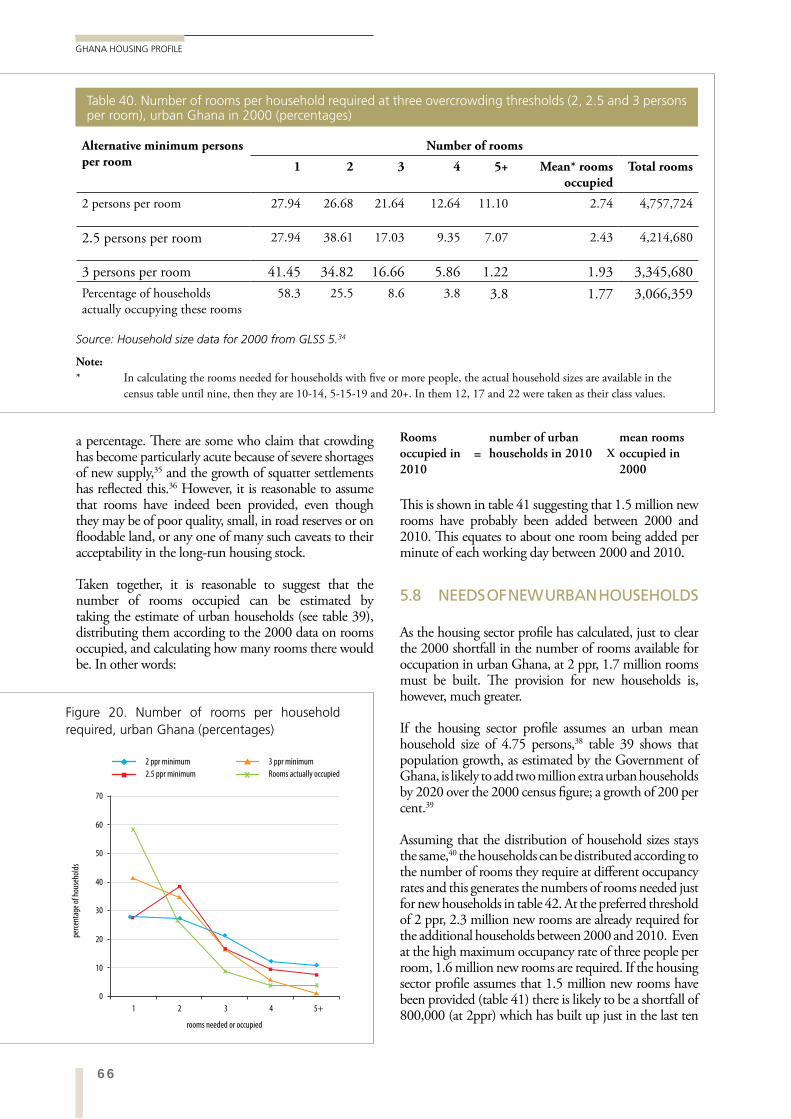
66
GHANA HOUSING PROFILE
Rooms occupied in 2010
=number of urban households in 2010 X
mean rooms occupied in 2000
This is shown in table 41 suggesting that 1.5 million new rooms have probably been added between 2000 and 2010. This equates to about one room being added per minute of each working day between 2000 and 2010.
5.8 NEEDS OF NEW URBAN HOUSEHOLDS
As the housing sector profile has calculated, just to clear the 2000 shortfall in the number of rooms available for occupation in urban Ghana, at 2 ppr, 1.7 million rooms must be built. The provision for new households is, however, much greater.
If the housing sector profile assumes an urban mean household size of 4.75 persons,38 table 39 shows that population growth, as estimated by the Government of Ghana, is likely to add two million extra urban households by 2020 over the 2000 census figure; a growth of 200 per cent.39
Assuming that the distribution of household sizes stays the same,40 the households can be distributed according to the number of rooms they require at different occupancy rates and this generates the numbers of rooms needed just for new households in table 42. At the preferred threshold of 2 ppr, 2.3 million new rooms are already required for the additional households between 2000 and 2010. Even at the high maximum occupancy rate of three people per room, 1.6 million new rooms are required. If the housing sector profile assumes that 1.5 million new rooms have been provided (table 41) there is likely to be a shortfall of 800,000 (at 2ppr) which has built up just in the last ten
a percentage. There are some who claim that crowding has become particularly acute because of severe shortages of new supply,35 and the growth of squatter settlements has reflected this.36 However, it is reasonable to assume that rooms have indeed been provided, even though they may be of poor quality, small, in road reserves or on floodable land, or any one of many such caveats to their acceptability in the long-run housing stock.
Taken together, it is reasonable to suggest that the number of rooms occupied can be estimated by taking the estimate of urban households (see table 39), distributing them according to the 2000 data on rooms occupied, and calculating how many rooms there would be. In other words:
perc
enta
ge o
f hou
seho
lds
rooms needed or occupied
2 ppr minimum
2.5 ppr minimum
3 ppr minimum
Rooms actually occupied
0
1 2 3 4 5+
10
20
30
40
50
60
70
x
Figure 20. Number of rooms per household required, urban Ghana (percentages)
Alternative minimum persons per room
Number of rooms
1 2 3 4 5+ Mean* rooms occupied
Total rooms
2 persons per room 27.94 26.68 21.64 12.64 11.10 2.74 4,757,724
2.5 persons per room 27.94 38.61 17.03 9.35 7.07 2.43 4,214,680
3 persons per room 41.45 34.82 16.66 5.86 1.22 1.93 3,345,680Percentage of households actually occupying these rooms
58.3 25.5 8.6 3.8 3.8 1.77 3,066,359
Table 40. Number of rooms per household required at three overcrowding thresholds (2, 2.5 and 3 persons per room), urban Ghana in 2000 (percentages)
Source: Household size data for 2000 from GLSS 5.34
Note:
* In calculating the rooms needed for households with five or more people, the actual household sizes are available in the census table until nine, then they are 10-14, 5-15-19 and 20+. In them 12, 17 and 22 were taken as their class values.
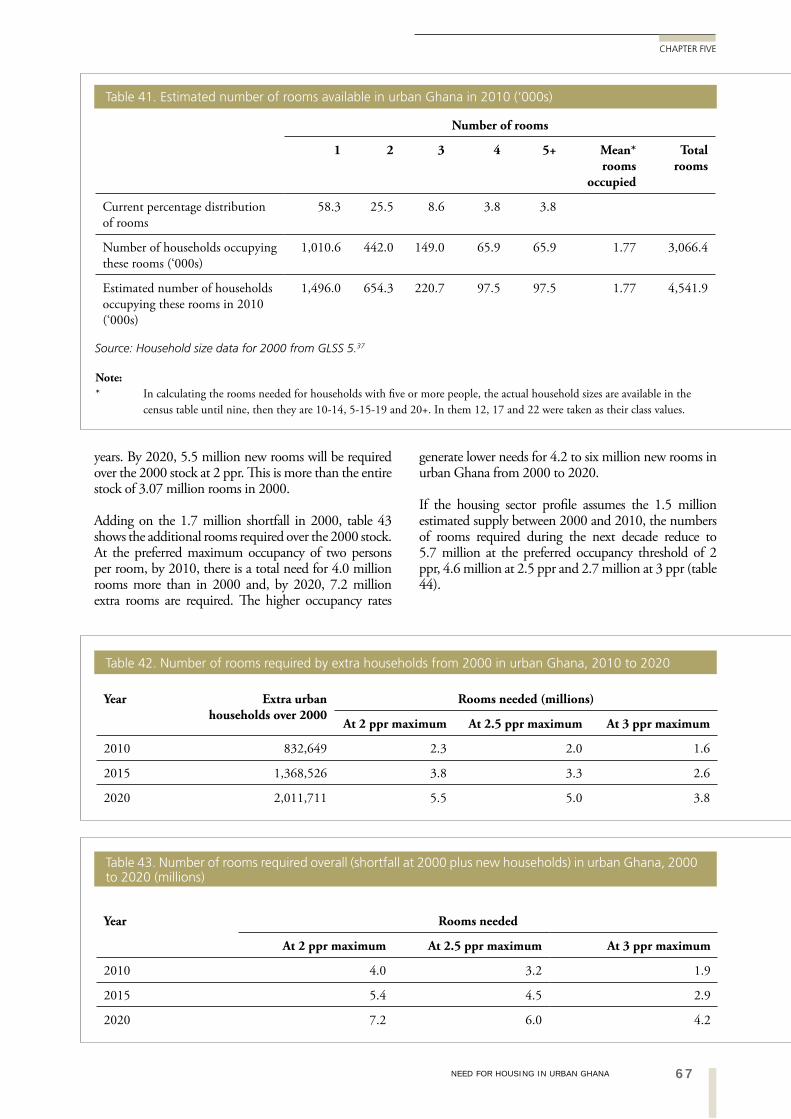
67NEED FOR HOUSING IN URBAN GHANA
CHAPTER FIVE
years. By 2020, 5.5 million new rooms will be required over the 2000 stock at 2 ppr. This is more than the entire stock of 3.07 million rooms in 2000.
Adding on the 1.7 million shortfall in 2000, table 43 shows the additional rooms required over the 2000 stock. At the preferred maximum occupancy of two persons per room, by 2010, there is a total need for 4.0 million rooms more than in 2000 and, by 2020, 7.2 million extra rooms are required. The higher occupancy rates
generate lower needs for 4.2 to six million new rooms in urban Ghana from 2000 to 2020.
If the housing sector profile assumes the 1.5 million estimated supply between 2000 and 2010, the numbers of rooms required during the next decade reduce to 5.7 million at the preferred occupancy threshold of 2 ppr, 4.6 million at 2.5 ppr and 2.7 million at 3 ppr (table 44).
Source: Household size data for 2000 from GLSS 5.37
Number of rooms
1 2 3 4 5+ Mean* rooms
occupied
Total rooms
Current percentage distribution of rooms
58.3 25.5 8.6 3.8 3.8
Number of households occupying these rooms (‘000s)
1,010.6 442.0 149.0 65.9 65.9 1.77 3,066.4
Estimated number of households occupying these rooms in 2010 (‘000s)
1,496.0 654.3 220.7 97.5 97.5 1.77 4,541.9
Note: * In calculating the rooms needed for households with five or more people, the actual household sizes are available in the census table until nine, then they are 10-14, 5-15-19 and 20+. In them 12, 17 and 22 were taken as their class values.
Table 41. Estimated number of rooms available in urban Ghana in 2010 (‘000s)
Year Extra urban households over 2000
Rooms needed (millions)
At 2 ppr maximum At 2.5 ppr maximum At 3 ppr maximum
2010 832,649 2.3 2.0 1.6
2015 1,368,526 3.8 3.3 2.6
2020 2,011,711 5.5 5.0 3.8
Table 42. Number of rooms required by extra households from 2000 in urban Ghana, 2010 to 2020
Year Rooms needed
At 2 ppr maximum At 2.5 ppr maximum At 3 ppr maximum
2010 4.0 3.2 1.9
2015 5.4 4.5 2.9
2020 7.2 6.0 4.2
Table 43. Number of rooms required overall (shortfall at 2000 plus new households) in urban Ghana, 2000 to 2020 (millions)
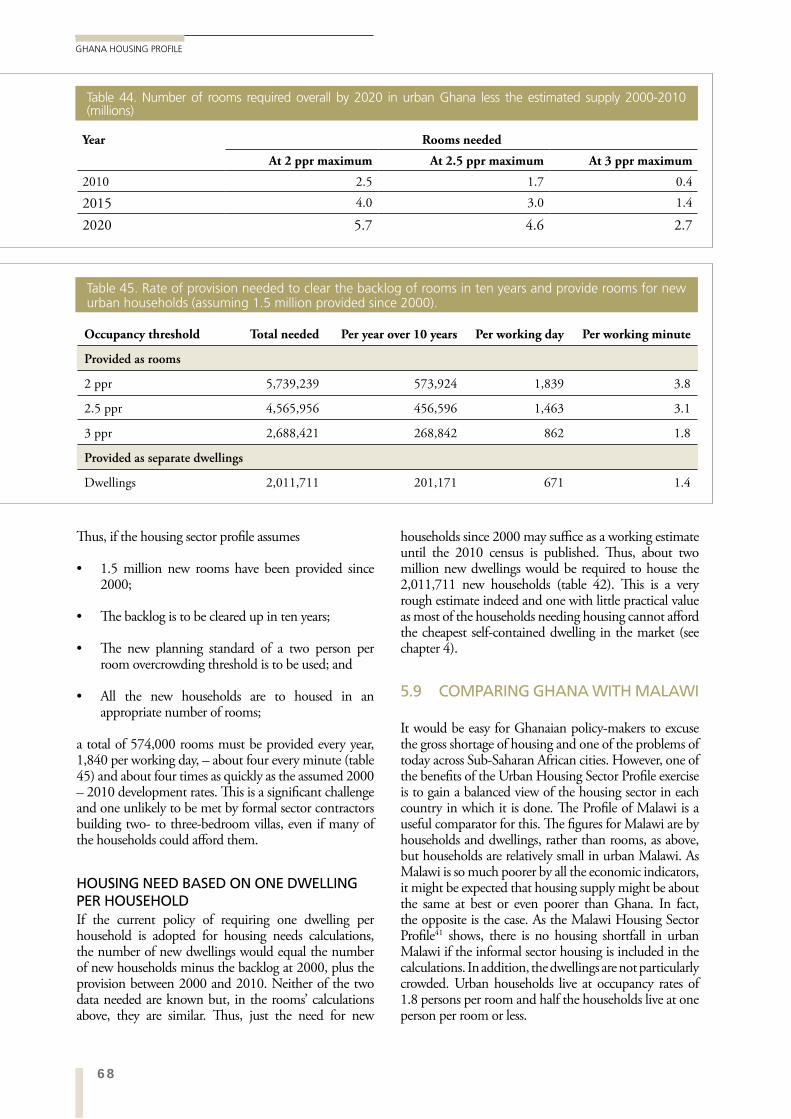
68
GHANA HOUSING PROFILE
households since 2000 may suffice as a working estimate until the 2010 census is published. Thus, about two million new dwellings would be required to house the 2,011,711 new households (table 42). This is a very rough estimate indeed and one with little practical value as most of the households needing housing cannot afford the cheapest self-contained dwelling in the market (see chapter 4).
5.9 COMPARING GHANA WITH MALAWI
It would be easy for Ghanaian policy-makers to excuse the gross shortage of housing and one of the problems of today across Sub-Saharan African cities. However, one of the benefits of the Urban Housing Sector Profile exercise is to gain a balanced view of the housing sector in each country in which it is done. The Profile of Malawi is a useful comparator for this. The figures for Malawi are by households and dwellings, rather than rooms, as above, but households are relatively small in urban Malawi. As Malawi is so much poorer by all the economic indicators, it might be expected that housing supply might be about the same at best or even poorer than Ghana. In fact, the opposite is the case. As the Malawi Housing Sector Profile41 shows, there is no housing shortfall in urban Malawi if the informal sector housing is included in the calculations. In addition, the dwellings are not particularly crowded. Urban households live at occupancy rates of 1.8 persons per room and half the households live at one person per room or less.
Thus, if the housing sector profile assumes
1.5 million new rooms have been provided since 2000;
The backlog is to be cleared up in ten years;
The new planning standard of a two person per room overcrowding threshold is to be used; and
All the new households are to housed in an appropriate number of rooms;
a total of 574,000 rooms must be provided every year, 1,840 per working day, – about four every minute (table 45) and about four times as quickly as the assumed 2000 – 2010 development rates. This is a significant challenge and one unlikely to be met by formal sector contractors building two- to three-bedroom villas, even if many of the households could afford them.
HOUSING NEED BASED ON ONE DWELLING PER HOUSEHOLDIf the current policy of requiring one dwelling per household is adopted for housing needs calculations, the number of new dwellings would equal the number of new households minus the backlog at 2000, plus the provision between 2000 and 2010. Neither of the two data needed are known but, in the rooms’ calculations above, they are similar. Thus, just the need for new
Year Rooms needed
At 2 ppr maximum At 2.5 ppr maximum At 3 ppr maximum
2010 2.5 1.7 0.4
2015 4.0 3.0 1.4
2020 5.7 4.6 2.7
Table 44. Number of rooms required overall by 2020 in urban Ghana less the estimated supply 2000-2010 (millions)
Occupancy threshold Total needed Per year over 10 years Per working day Per working minute
Provided as rooms
2 ppr 5,739,239 573,924 1,839 3.8
2.5 ppr 4,565,956 456,596 1,463 3.1
3 ppr 2,688,421 268,842 862 1.8
Provided as separate dwellings
Dwellings 2,011,711 201,171 671 1.4
Table 45. Rate of provision needed to clear the backlog of rooms in ten years and provide rooms for new urban households (assuming 1.5 million provided since 2000).
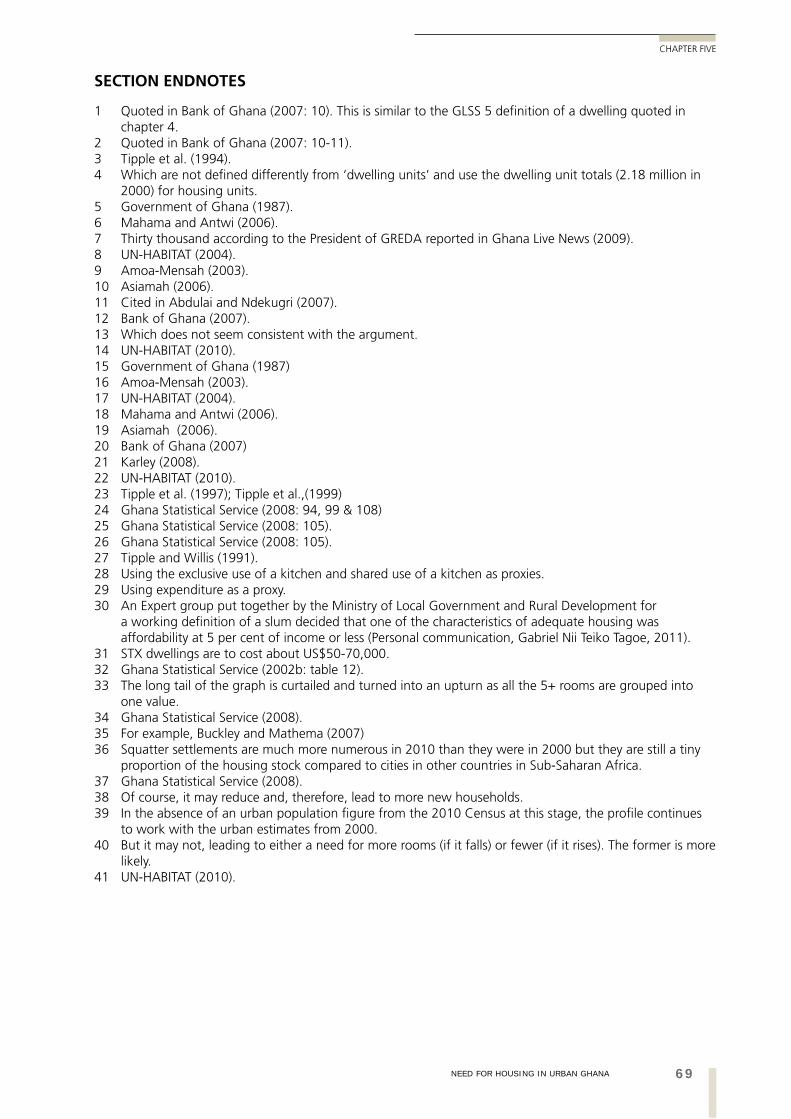
69NEED FOR HOUSING IN URBAN GHANA
CHAPTER FIVE
SECTION ENDNOTES
1 Quoted in Bank of Ghana (2007: 10). This is similar to the GLSS 5 definition of a dwelling quoted in chapter 4.
2 Quoted in Bank of Ghana (2007: 10-11).3 Tipple et al. (1994).4 Which are not defined differently from ‘dwelling units’ and use the dwelling unit totals (2.18 million in
2000) for housing units.5 Government of Ghana (1987).6 Mahama and Antwi (2006).7 Thirty thousand according to the President of GREDA reported in Ghana Live News (2009).8 UN-HABITAT (2004).9 Amoa-Mensah (2003).10 Asiamah (2006).11 Cited in Abdulai and Ndekugri (2007).12 Bank of Ghana (2007).13 Which does not seem consistent with the argument.14 UN-HABITAT (2010).15 Government of Ghana (1987)16 Amoa-Mensah (2003).17 UN-HABITAT (2004).18 Mahama and Antwi (2006).19 Asiamah (2006).20 Bank of Ghana (2007)21 Karley (2008).22 UN-HABITAT (2010).23 Tipple et al. (1997); Tipple et al.,(1999)24 Ghana Statistical Service (2008: 94, 99 & 108)25 Ghana Statistical Service (2008: 105).26 Ghana Statistical Service (2008: 105).27 Tipple and Willis (1991).28 Using the exclusive use of a kitchen and shared use of a kitchen as proxies.29 Using expenditure as a proxy.30 An Expert group put together by the Ministry of Local Government and Rural Development for
a working definition of a slum decided that one of the characteristics of adequate housing was affordability at 5 per cent of income or less (Personal communication, Gabriel Nii Teiko Tagoe, 2011).
31 STX dwellings are to cost about US$50-70,000.32 Ghana Statistical Service (2002b: table 12).33 The long tail of the graph is curtailed and turned into an upturn as all the 5+ rooms are grouped into
one value.34 Ghana Statistical Service (2008).35 For example, Buckley and Mathema (2007)36 Squatter settlements are much more numerous in 2010 than they were in 2000 but they are still a tiny
proportion of the housing stock compared to cities in other countries in Sub-Saharan Africa.37 Ghana Statistical Service (2008).38 Of course, it may reduce and, therefore, lead to more new households. 39 In the absence of an urban population figure from the 2010 Census at this stage, the profile continues
to work with the urban estimates from 2000.40 But it may not, leading to either a need for more rooms (if it falls) or fewer (if it rises). The former is more
likely.41 UN-HABITAT (2010).
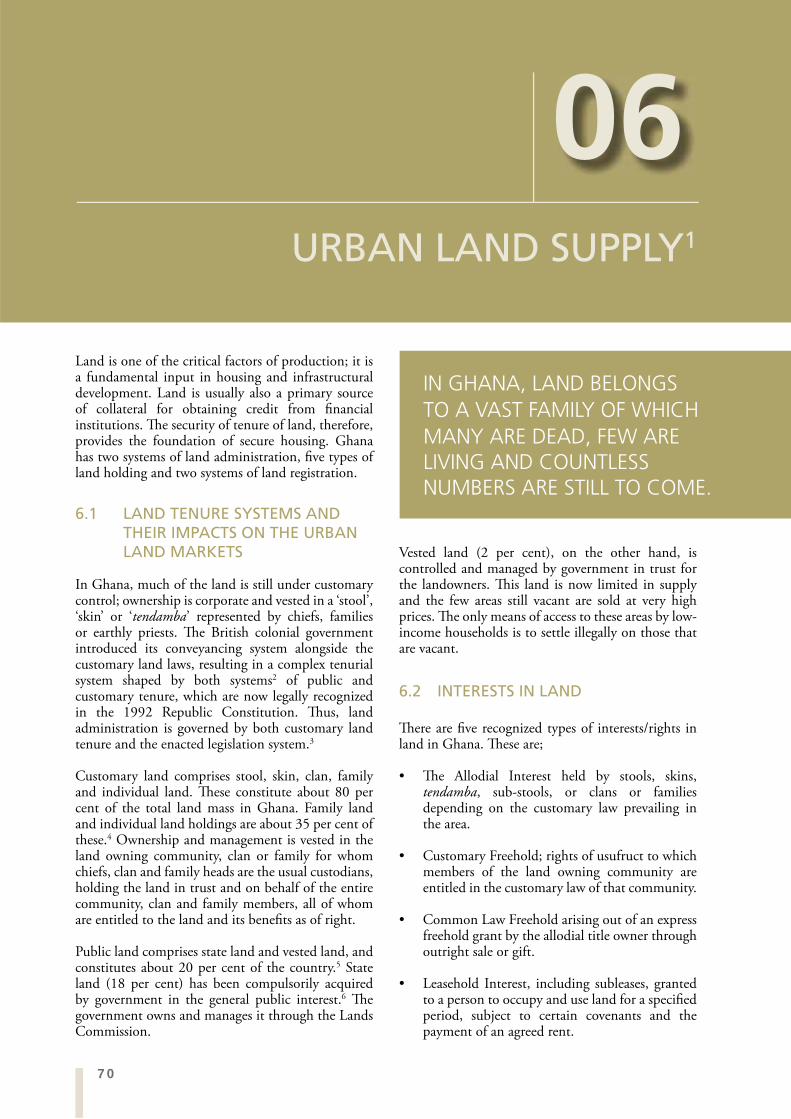
70
GHANA HOUSING PROFILE
06URBAN LAND SUPPLY1
Land is one of the critical factors of production; it is a fundamental input in housing and infrastructural development. Land is usually also a primary source of collateral for obtaining credit from financial institutions. The security of tenure of land, therefore, provides the foundation of secure housing. Ghana has two systems of land administration, five types of land holding and two systems of land registration.
6.1 LAND TENURE SYSTEMS AND THEIR IMPACTS ON THE URBAN LAND MARKETS
In Ghana, much of the land is still under customary control; ownership is corporate and vested in a ‘stool’, ‘skin’ or ‘tendamba’ represented by chiefs, families or earthly priests. The British colonial government introduced its conveyancing system alongside the customary land laws, resulting in a complex tenurial system shaped by both systems2 of public and customary tenure, which are now legally recognized in the 1992 Republic Constitution. Thus, land administration is governed by both customary land tenure and the enacted legislation system.3
Customary land comprises stool, skin, clan, family and individual land. These constitute about 80 per cent of the total land mass in Ghana. Family land and individual land holdings are about 35 per cent of these.4 Ownership and management is vested in the land owning community, clan or family for whom chiefs, clan and family heads are the usual custodians, holding the land in trust and on behalf of the entire community, clan and family members, all of whom are entitled to the land and its benefits as of right.
Public land comprises state land and vested land, and constitutes about 20 per cent of the country.5 State land (18 per cent) has been compulsorily acquired by government in the general public interest.6 The government owns and manages it through the Lands Commission.
Vested land (2 per cent), on the other hand, is controlled and managed by government in trust for the landowners. This land is now limited in supply and the few areas still vacant are sold at very high prices. The only means of access to these areas by low-income households is to settle illegally on those that are vacant.
6.2 INTERESTS IN LAND
There are five recognized types of interests/rights in land in Ghana. These are;
The Allodial Interest held by stools, skins, tendamba, sub-stools, or clans or families depending on the customary law prevailing in the area.
Customary Freehold; rights of usufruct to which members of the land owning community are entitled in the customary law of that community.
Common Law Freehold arising out of an express freehold grant by the allodial title owner through outright sale or gift.
Leasehold Interest, including subleases, granted to a person to occupy and use land for a specified period, subject to certain covenants and the payment of an agreed rent.
IN GHANA, LAND BELONGS TO A VAST FAMILY OF WHICH MANY ARE DEAD, FEW ARE LIVING AND COUNTLESS NUMBERS ARE STILL TO COME.
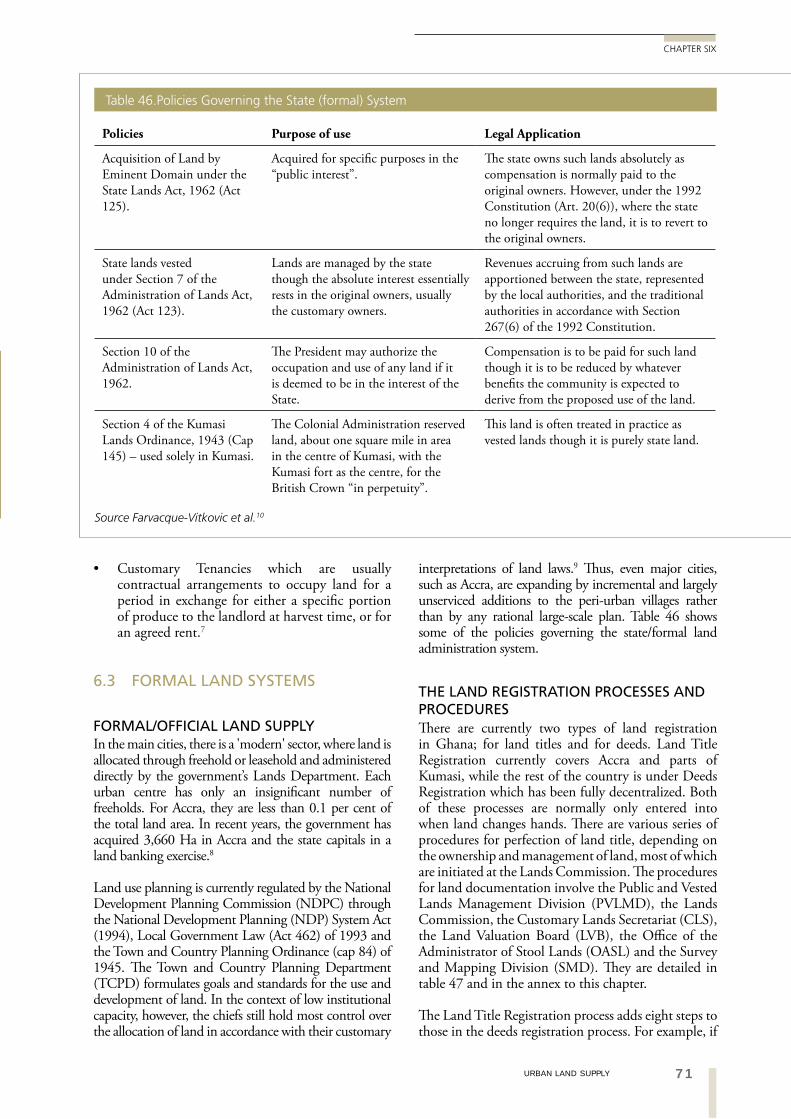
71URBAN LAND SUPPLY
CHAPTER SIX
interpretations of land laws.9 Thus, even major cities, such as Accra, are expanding by incremental and largely unserviced additions to the peri-urban villages rather than by any rational large-scale plan. Table 46 shows some of the policies governing the state/formal land administration system.
THE LAND REGISTRATION PROCESSES AND PROCEDURES There are currently two types of land registration in Ghana; for land titles and for deeds. Land Title Registration currently covers Accra and parts of Kumasi, while the rest of the country is under Deeds Registration which has been fully decentralized. Both of these processes are normally only entered into when land changes hands. There are various series of procedures for perfection of land title, depending on the ownership and management of land, most of which are initiated at the Lands Commission. The procedures for land documentation involve the Public and Vested Lands Management Division (PVLMD), the Lands Commission, the Customary Lands Secretariat (CLS), the Land Valuation Board (LVB), the Office of the Administrator of Stool Lands (OASL) and the Survey and Mapping Division (SMD). They are detailed in table 47 and in the annex to this chapter.
The Land Title Registration process adds eight steps to those in the deeds registration process. For example, if
Customary Tenancies which are usually contractual arrangements to occupy land for a period in exchange for either a specific portion of produce to the landlord at harvest time, or for an agreed rent.7
6.3 FORMAL LAND SYSTEMS
FORMAL/OFFICIAL LAND SUPPLYIn the main cities, there is a 'modern' sector, where land is allocated through freehold or leasehold and administered directly by the government’s Lands Department. Each urban centre has only an insignificant number of freeholds. For Accra, they are less than 0.1 per cent of the total land area. In recent years, the government has acquired 3,660 Ha in Accra and the state capitals in a land banking exercise.8
Land use planning is currently regulated by the National Development Planning Commission (NDPC) through the National Development Planning (NDP) System Act (1994), Local Government Law (Act 462) of 1993 and the Town and Country Planning Ordinance (cap 84) of 1945. The Town and Country Planning Department (TCPD) formulates goals and standards for the use and development of land. In the context of low institutional capacity, however, the chiefs still hold most control over the allocation of land in accordance with their customary
Policies Purpose of use Legal Application
Acquisition of Land by Eminent Domain under the State Lands Act, 1962 (Act 125).
Acquired for specific purposes in the “public interest”.
The state owns such lands absolutely as compensation is normally paid to the original owners. However, under the 1992 Constitution (Art. 20(6)), where the state no longer requires the land, it is to revert to the original owners.
State lands vested under Section 7 of the Administration of Lands Act, 1962 (Act 123).
Lands are managed by the state though the absolute interest essentially rests in the original owners, usually the customary owners.
Revenues accruing from such lands are apportioned between the state, represented by the local authorities, and the traditional authorities in accordance with Section 267(6) of the 1992 Constitution.
Section 10 of the Administration of Lands Act, 1962.
The President may authorize the occupation and use of any land if it is deemed to be in the interest of the State.
Compensation is to be paid for such land though it is to be reduced by whatever benefits the community is expected to derive from the proposed use of the land.
Section 4 of the Kumasi Lands Ordinance, 1943 (Cap 145) – used solely in Kumasi.
The Colonial Administration reserved land, about one square mile in area in the centre of Kumasi, with the Kumasi fort as the centre, for the British Crown “in perpetuity”.
This land is often treated in practice as vested lands though it is purely state land.
Table 46.Policies Governing the State (formal) System
Source Farvacque-Vitkovic et al.10
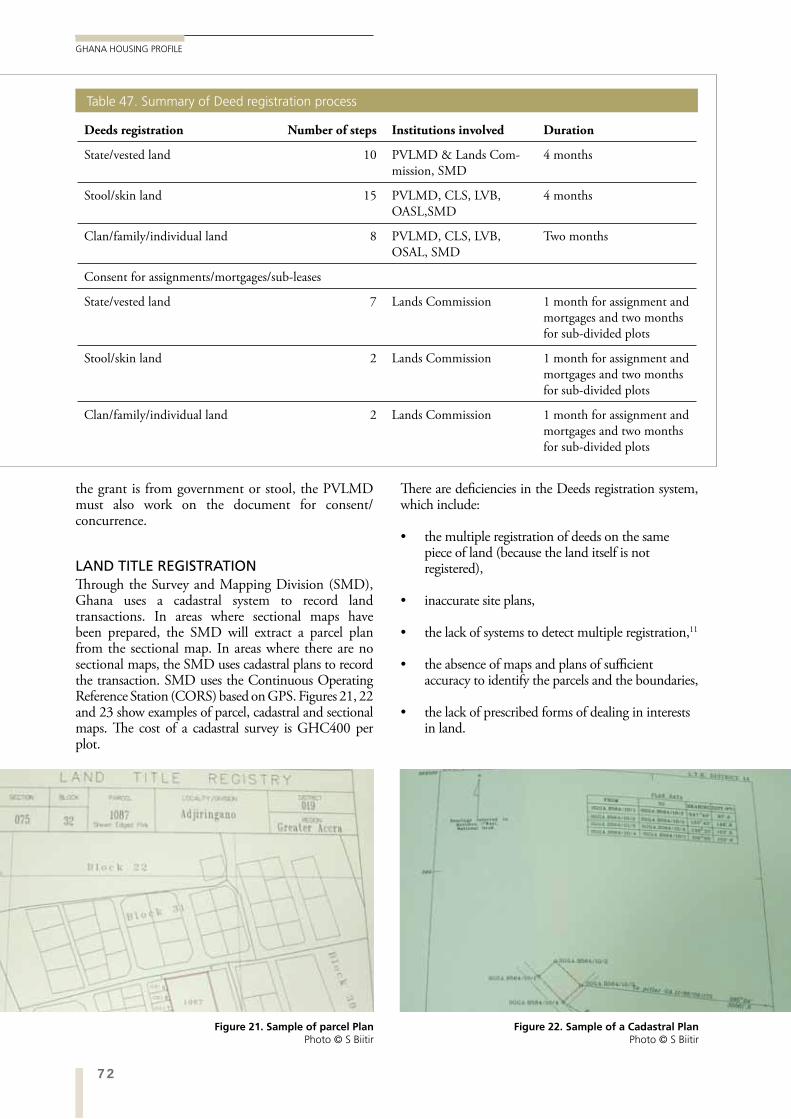
72
GHANA HOUSING PROFILE
Deeds registration Number of steps Institutions involved Duration
State/vested land 10 PVLMD & Lands Com-mission, SMD
4 months
Stool/skin land 15 PVLMD, CLS, LVB, OASL,SMD
4 months
Clan/family/individual land 8 PVLMD, CLS, LVB, OSAL, SMD
Two months
Consent for assignments/mortgages/sub-leases
State/vested land 7 Lands Commission 1 month for assignment and mortgages and two months for sub-divided plots
Stool/skin land 2 Lands Commission 1 month for assignment and mortgages and two months for sub-divided plots
Clan/family/individual land 2 Lands Commission 1 month for assignment and mortgages and two months for sub-divided plots
Table 47. Summary of Deed registration process
the grant is from government or stool, the PVLMD must also work on the document for consent/ concurrence.
LAND TITLE REGISTRATIONThrough the Survey and Mapping Division (SMD), Ghana uses a cadastral system to record land transactions. In areas where sectional maps have been prepared, the SMD will extract a parcel plan from the sectional map. In areas where there are no sectional maps, the SMD uses cadastral plans to record the transaction. SMD uses the Continuous Operating Reference Station (CORS) based on GPS. Figures 21, 22 and 23 show examples of parcel, cadastral and sectional maps. The cost of a cadastral survey is GHC400 per plot.
There are deficiencies in the Deeds registration system, which include:
the multiple registration of deeds on the same piece of land (because the land itself is not registered),
inaccurate site plans,
the lack of systems to detect multiple registration,11
the absence of maps and plans of sufficient accuracy to identify the parcels and the boundaries,
the lack of prescribed forms of dealing in interests in land.
Figure 22. Sample of a Cadastral Plan Photo © S Biitir
Figure 21. Sample of parcel Plan Photo © S Biitir
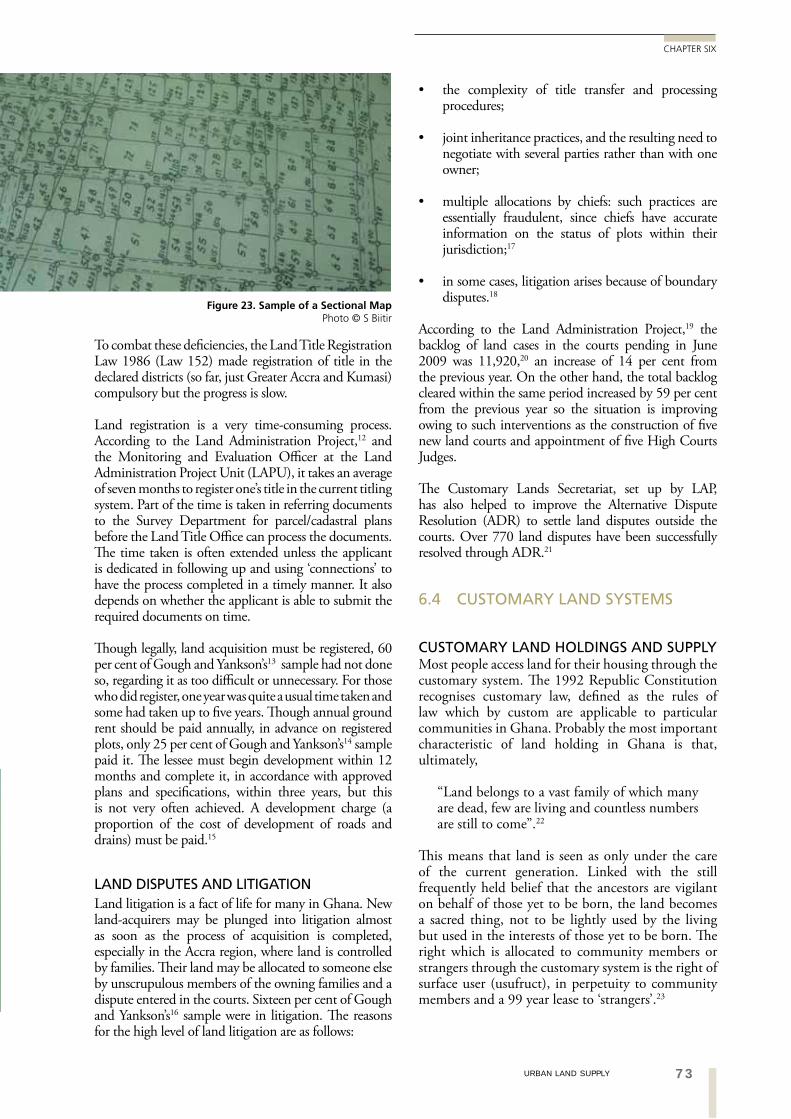
73URBAN LAND SUPPLY
CHAPTER SIX
the complexity of title transfer and processing procedures;
joint inheritance practices, and the resulting need to negotiate with several parties rather than with one owner;
multiple allocations by chiefs: such practices are essentially fraudulent, since chiefs have accurate information on the status of plots within their jurisdiction;17
in some cases, litigation arises because of boundary disputes.18
According to the Land Administration Project,19 the backlog of land cases in the courts pending in June 2009 was 11,920,20 an increase of 14 per cent from the previous year. On the other hand, the total backlog cleared within the same period increased by 59 per cent from the previous year so the situation is improving owing to such interventions as the construction of five new land courts and appointment of five High Courts Judges.
The Customary Lands Secretariat, set up by LAP, has also helped to improve the Alternative Dispute Resolution (ADR) to settle land disputes outside the courts. Over 770 land disputes have been successfully resolved through ADR.21
6.4 CUSTOMARY LAND SYSTEMS
CUSTOMARY LAND HOLDINGS AND SUPPLYMost people access land for their housing through the customary system. The 1992 Republic Constitution recognises customary law, defined as the rules of law which by custom are applicable to particular communities in Ghana. Probably the most important characteristic of land holding in Ghana is that, ultimately,
“Land belongs to a vast family of which many are dead, few are living and countless numbers are still to come”.22
This means that land is seen as only under the care of the current generation. Linked with the still frequently held belief that the ancestors are vigilant on behalf of those yet to be born, the land becomes a sacred thing, not to be lightly used by the living but used in the interests of those yet to be born. The right which is allocated to community members or strangers through the customary system is the right of surface user (usufruct), in perpetuity to community members and a 99 year lease to ‘strangers’.23
To combat these deficiencies, the Land Title Registration Law 1986 (Law 152) made registration of title in the declared districts (so far, just Greater Accra and Kumasi) compulsory but the progress is slow.
Land registration is a very time-consuming process. According to the Land Administration Project,12 and the Monitoring and Evaluation Officer at the Land Administration Project Unit (LAPU), it takes an average of seven months to register one’s title in the current titling system. Part of the time is taken in referring documents to the Survey Department for parcel/cadastral plans before the Land Title Office can process the documents. The time taken is often extended unless the applicant is dedicated in following up and using ‘connections’ to have the process completed in a timely manner. It also depends on whether the applicant is able to submit the required documents on time.
Though legally, land acquisition must be registered, 60 per cent of Gough and Yankson’s13 sample had not done so, regarding it as too difficult or unnecessary. For those who did register, one year was quite a usual time taken and some had taken up to five years. Though annual ground rent should be paid annually, in advance on registered plots, only 25 per cent of Gough and Yankson’s14 sample paid it. The lessee must begin development within 12 months and complete it, in accordance with approved plans and specifications, within three years, but this is not very often achieved. A development charge (a proportion of the cost of development of roads and drains) must be paid.15
LAND DISPUTES AND LITIGATIONLand litigation is a fact of life for many in Ghana. New land-acquirers may be plunged into litigation almost as soon as the process of acquisition is completed, especially in the Accra region, where land is controlled by families. Their land may be allocated to someone else by unscrupulous members of the owning families and a dispute entered in the courts. Sixteen per cent of Gough and Yankson’s16 sample were in litigation. The reasons for the high level of land litigation are as follows:
Figure 23. Sample of a Sectional Map Photo © S Biitir
74
GHANA HOUSING PROFILE
In addition, the community whose representatives make the decisions about the alienation of land is the same one to which local people feel loyalty and which mediates their behaviour. Thus, the land system is directly tied in with the systems of social rights and duties which make Ghanaian cities the safe and supportive places they are. The right to allocate most land in Ghana is owned by stools or skins,24 the symbols of authority of land-holding kin-groups, under the allodial right of the paramount chieftaincy, the most celebrated and powerful of which is the Golden Stool of Asante, centred on Kumasi and its incumbent, the Asantehene. At the local level, the allocation of land for lease is in the hands of chiefs who can alienate land to members of the stool (as of right) or to strangers in exchange for a tribute, known as drink money (biri nsa in Twi) which tends now to represents a market value.25 People who have acquired plots in this way have considerable security and will not be evicted by the grantors or chiefs, clan and family heads of such land.
For land in Accra, the owning bodies are represented by chiefs (Mantsemei), fetish priests (wulomei), quarter heads (akutseiatsemei) and family heads (HUDA, 1990). While there are some areas where stools gained the rights to allocate land (particularly in Labadi), most quarter heads have remained in control of their land. There are also some land-owning families. This rather complicated set of, often overlapping, land allocating entities has led to many very clouded titles with the subsequent delays in development, legal costs, and multiple payment for the right of use of the land.26 Recently, a national land registry has been introduced.
In the north western town of Wa, land is vested in five families or tindamba.27
In Berekum, the allocation system appears to be particularly equitable. A written application, together with a passport-sized photograph, must be submitted to the Traditional Council. The potential lessee is then required to attend an interview to justify his application. Only if an application is approved is the applicant made to pay the (token) fee (this is very unlike the system in Ashanti and most other Ghanaian stool land areas). The fee for a 99-year lease is fixed, irrespective of the applicant’s place of origin, or the location or size of the plot (averaging 26 x 33 m, 958 square metres). Out of the standard fee, about one sixth goes to the surveyor as remuneration, two sixths is paid to the District assembly for development purposes and half is paid into the Traditional Council account to pay expenses and tributes to the paramount chief (omanhene), the queen mother and divisional chiefs.28
Customary land has had major impacts on urban settlements patterns. Individual members of the
community, clan or family have inherent rights there. Many low-income households who are members of the land owning communities, clans and families in peri-urban and rural areas possess rights to such land for housing. By custom, rights to such land are not normally granted in writing so the customary title holder cannot access mortgage finance.
The means of land allocation and leasing conditions in Ghana are well documented.29 The customary land system is still very important in cities. Indeed, it is held to be both progressive and egalitarian with built in checks and balances in contrast to overly bureaucratic and corrupt ‘modern’ systems30. Indeed, Acquaye et al31 argue that
“by simplifying procedures, improving documentation and imposing requirements for infrastructure installation, the operation of the indigenous tenure system can be the basis of a functioning land tenure system “.32
With rapid urbanization and its commoditization of land, especially in peri-urban areas, the customary landownership is under pressure to accommodate the formal legal system of land title registration. This has become necessary because of the many land disputes and litigations, and multiple sales of the same plot of land.
The customary land supply systems differ slightly among the various stools, skins, clans and families, and around geographical locations and regions, as they have different customary norms and principles regarding ownership and management. The land allocation processes, however, generally follow similar patterns from the initiation of planning layouts to the final allocation of land to individuals and institutions.
The customary practices and their relationships with the formal systems in Accra, Kumasi, Sekondi-Takoradi and Tamale are described in table 48.
From the acquirer’s perspective, the procedures include four main processes – obtaining information on land availability, negotiating the land transaction, plot adjudication and demarcation, and providing evidence of land rights transfer. Table 61. in the Annex to this chapter summarises the procedures of accessing land in various cities.
The decision to bring customary land onto the market lies with the sub-chiefs, division chiefs and paramount chiefs of the land owning communities. When one realizes that urbanization is catching up with his area of jurisdiction and there is increasing demand for land, he approaches the divisional or paramount chief, as the case may be, about his intention to zone village farmlands for residential and commercials uses. The sub-chief liaises with the divisional/paramount chief to
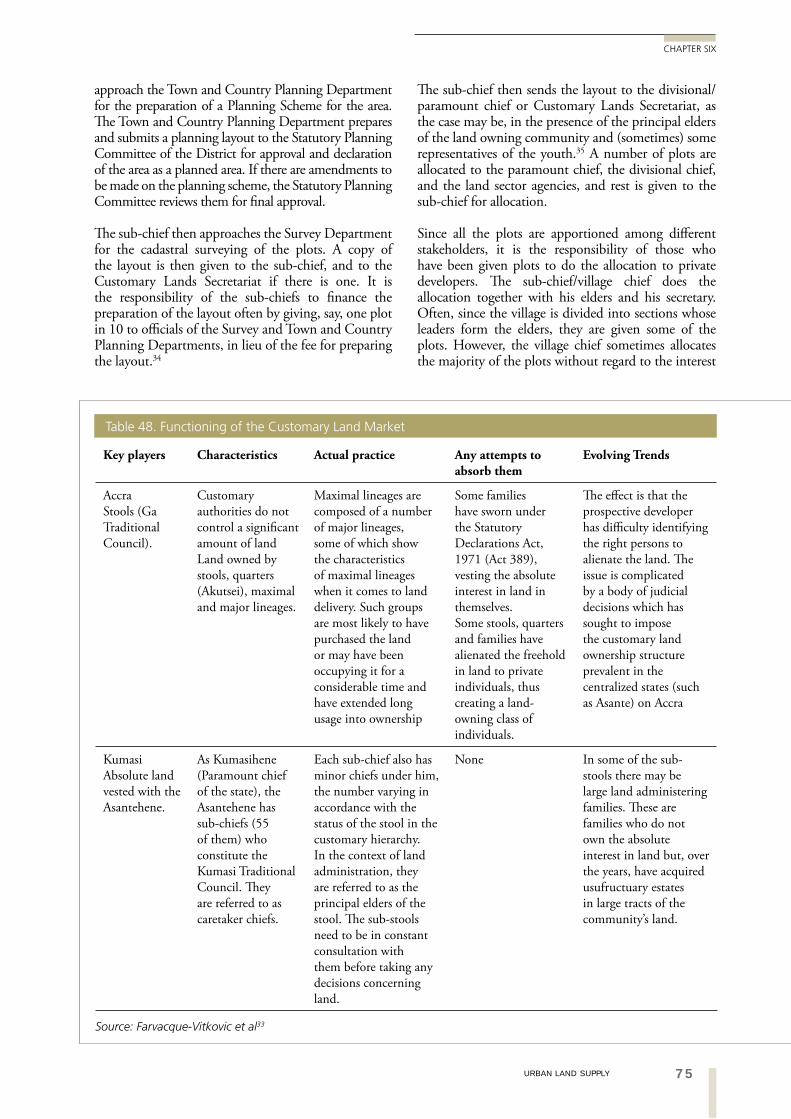
75URBAN LAND SUPPLY
CHAPTER SIX
The sub-chief then sends the layout to the divisional/paramount chief or Customary Lands Secretariat, as the case may be, in the presence of the principal elders of the land owning community and (sometimes) some representatives of the youth.35 A number of plots are allocated to the paramount chief, the divisional chief, and the land sector agencies, and rest is given to the sub-chief for allocation.
Since all the plots are apportioned among different stakeholders, it is the responsibility of those who have been given plots to do the allocation to private developers. The sub-chief/village chief does the allocation together with his elders and his secretary. Often, since the village is divided into sections whose leaders form the elders, they are given some of the plots. However, the village chief sometimes allocates the majority of the plots without regard to the interest
approach the Town and Country Planning Department for the preparation of a Planning Scheme for the area. The Town and Country Planning Department prepares and submits a planning layout to the Statutory Planning Committee of the District for approval and declaration of the area as a planned area. If there are amendments to be made on the planning scheme, the Statutory Planning Committee reviews them for final approval.
The sub-chief then approaches the Survey Department for the cadastral surveying of the plots. A copy of the layout is then given to the sub-chief, and to the Customary Lands Secretariat if there is one. It is the responsibility of the sub-chiefs to finance the preparation of the layout often by giving, say, one plot in 10 to officials of the Survey and Town and Country Planning Departments, in lieu of the fee for preparing the layout.34
Key players Characteristics Actual practice Any attempts to absorb them
Evolving Trends
AccraStools (Ga Traditional Council).
Customary authorities do not control a significant amount of land Land owned by stools, quarters (Akutsei), maximal and major lineages.
Maximal lineages are composed of a number of major lineages, some of which show the characteristics of maximal lineages when it comes to land delivery. Such groups are most likely to have purchased the land or may have been occupying it for a considerable time and have extended long usage into ownership
Some families have sworn under the Statutory Declarations Act, 1971 (Act 389), vesting the absolute interest in land in themselves.Some stools, quarters and families have alienated the freehold in land to private individuals, thus creating a land-owning class of individuals.
The effect is that the prospective developer has difficulty identifying the right persons to alienate the land. The issue is complicated by a body of judicial decisions which has sought to impose the customary land ownership structure prevalent in the centralized states (such as Asante) on Accra
KumasiAbsolute land vested with the Asantehene.
As Kumasihene (Paramount chief of the state), the Asantehene has sub-chiefs (55 of them) who constitute the Kumasi Traditional Council. They are referred to as caretaker chiefs.
Each sub-chief also has minor chiefs under him, the number varying in accordance with the status of the stool in the customary hierarchy. In the context of land administration, they are referred to as the principal elders of the stool. The sub-stools need to be in constant consultation with them before taking any decisions concerning land.
None In some of the sub-stools there may be large land administering families. These are families who do not own the absolute interest in land but, over the years, have acquired usufructuary estates in large tracts of the community’s land.
Table 48. Functioning of the Customary Land Market
Source: Farvacque-Vitkovic et al33
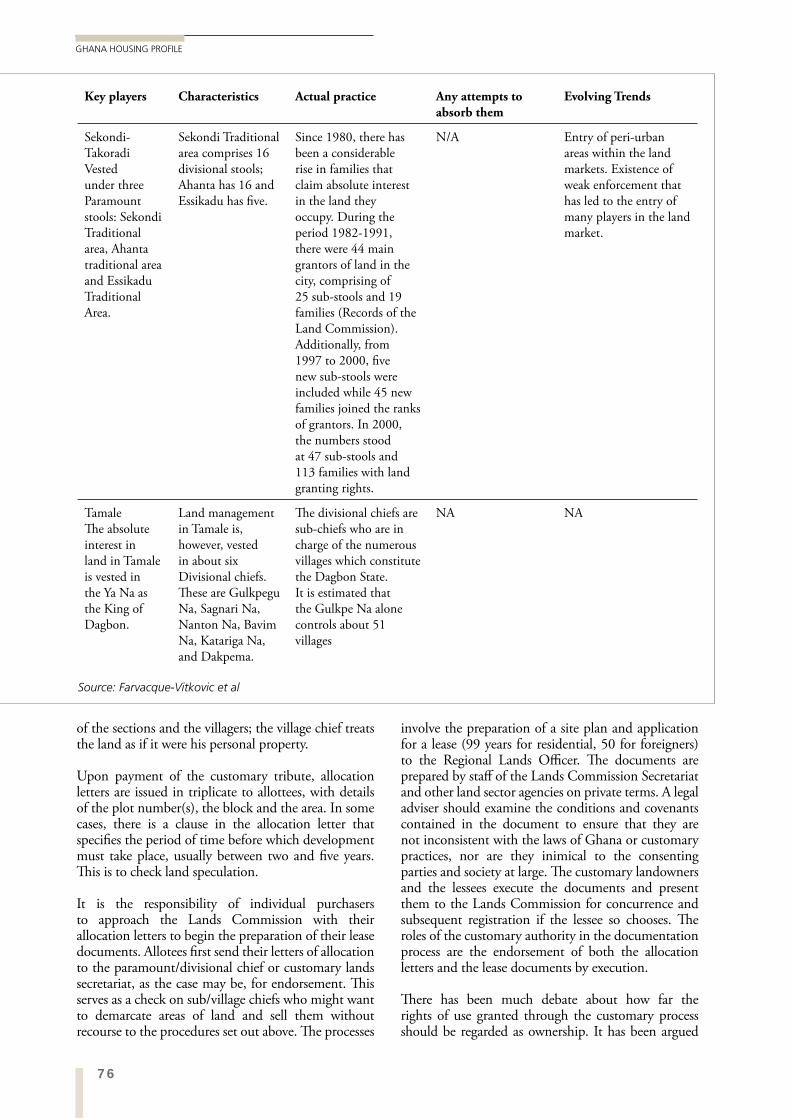
76
GHANA HOUSING PROFILE
of the sections and the villagers; the village chief treats the land as if it were his personal property.
Upon payment of the customary tribute, allocation letters are issued in triplicate to allottees, with details of the plot number(s), the block and the area. In some cases, there is a clause in the allocation letter that specifies the period of time before which development must take place, usually between two and five years. This is to check land speculation.
It is the responsibility of individual purchasers to approach the Lands Commission with their allocation letters to begin the preparation of their lease documents. Allotees first send their letters of allocation to the paramount/divisional chief or customary lands secretariat, as the case may be, for endorsement. This serves as a check on sub/village chiefs who might want to demarcate areas of land and sell them without recourse to the procedures set out above. The processes
involve the preparation of a site plan and application for a lease (99 years for residential, 50 for foreigners) to the Regional Lands Officer. The documents are prepared by staff of the Lands Commission Secretariat and other land sector agencies on private terms. A legal adviser should examine the conditions and covenants contained in the document to ensure that they are not inconsistent with the laws of Ghana or customary practices, nor are they inimical to the consenting parties and society at large. The customary landowners and the lessees execute the documents and present them to the Lands Commission for concurrence and subsequent registration if the lessee so chooses. The roles of the customary authority in the documentation process are the endorsement of both the allocation letters and the lease documents by execution.
There has been much debate about how far the rights of use granted through the customary process should be regarded as ownership. It has been argued
Key players Characteristics Actual practice Any attempts to absorb them
Evolving Trends
Sekondi-TakoradiVested under three Paramount stools: Sekondi Traditional area, Ahanta traditional area and Essikadu Traditional Area.
Sekondi Traditional area comprises 16 divisional stools; Ahanta has 16 and Essikadu has five.
Since 1980, there has been a considerable rise in families that claim absolute interest in the land they occupy. During the period 1982-1991, there were 44 main grantors of land in the city, comprising of 25 sub-stools and 19 families (Records of the Land Commission). Additionally, from 1997 to 2000, five new sub-stools were included while 45 new families joined the ranks of grantors. In 2000, the numbers stood at 47 sub-stools and 113 families with land granting rights.
N/A Entry of peri-urban areas within the land markets. Existence of weak enforcement that has led to the entry of many players in the land market.
TamaleThe absolute interest in land in Tamale is vested in the Ya Na as the King of Dagbon.
Land management in Tamale is, however, vested in about six Divisional chiefs. These are Gulkpegu Na, Sagnari Na, Nanton Na, Bavim Na, Katariga Na, and Dakpema.
The divisional chiefs are sub-chiefs who are in charge of the numerous villages which constitute the Dagbon State. It is estimated that the Gulkpe Na alone controls about 51 villages
NA NA
Source: Farvacque-Vitkovic et al
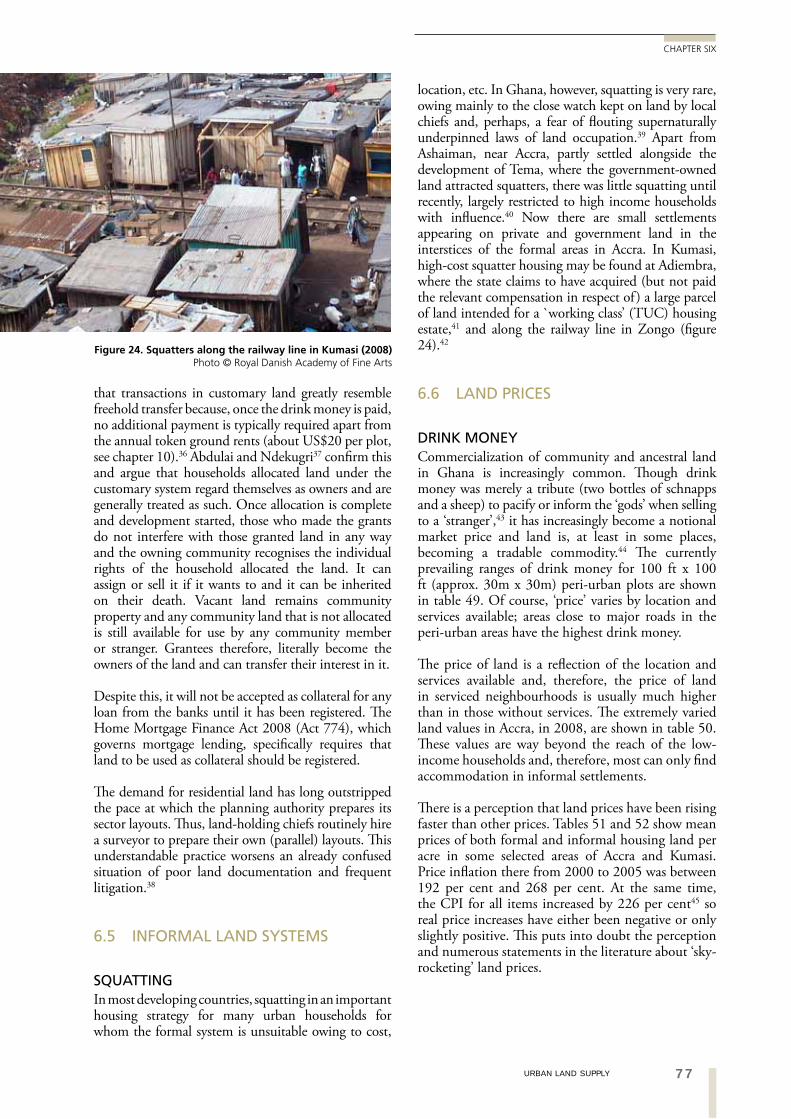
77URBAN LAND SUPPLY
CHAPTER SIX
location, etc. In Ghana, however, squatting is very rare, owing mainly to the close watch kept on land by local chiefs and, perhaps, a fear of flouting supernaturally underpinned laws of land occupation.39 Apart from Ashaiman, near Accra, partly settled alongside the development of Tema, where the government-owned land attracted squatters, there was little squatting until recently, largely restricted to high income households with influence.40 Now there are small settlements appearing on private and government land in the interstices of the formal areas in Accra. In Kumasi, high-cost squatter housing may be found at Adiembra, where the state claims to have acquired (but not paid the relevant compensation in respect of ) a large parcel of land intended for a `working class’ (TUC) housing estate,41 and along the railway line in Zongo (figure 24).42
6.6 LAND PRICES
DRINK MONEYCommercialization of community and ancestral land in Ghana is increasingly common. Though drink money was merely a tribute (two bottles of schnapps and a sheep) to pacify or inform the ‘gods’ when selling to a ‘stranger’,43 it has increasingly become a notional market price and land is, at least in some places, becoming a tradable commodity.44 The currently prevailing ranges of drink money for 100 ft x 100 ft (approx. 30m x 30m) peri-urban plots are shown in table 49. Of course, ‘price’ varies by location and services available; areas close to major roads in the peri-urban areas have the highest drink money.
The price of land is a reflection of the location and services available and, therefore, the price of land in serviced neighbourhoods is usually much higher than in those without services. The extremely varied land values in Accra, in 2008, are shown in table 50. These values are way beyond the reach of the low-income households and, therefore, most can only find accommodation in informal settlements.
There is a perception that land prices have been rising faster than other prices. Tables 51 and 52 show mean prices of both formal and informal housing land per acre in some selected areas of Accra and Kumasi. Price inflation there from 2000 to 2005 was between 192 per cent and 268 per cent. At the same time, the CPI for all items increased by 226 per cent45 so real price increases have either been negative or only slightly positive. This puts into doubt the perception and numerous statements in the literature about ‘sky-rocketing’ land prices.
that transactions in customary land greatly resemble freehold transfer because, once the drink money is paid, no additional payment is typically required apart from the annual token ground rents (about US$20 per plot, see chapter 10).36 Abdulai and Ndekugri37 confirm this and argue that households allocated land under the customary system regard themselves as owners and are generally treated as such. Once allocation is complete and development started, those who made the grants do not interfere with those granted land in any way and the owning community recognises the individual rights of the household allocated the land. It can assign or sell it if it wants to and it can be inherited on their death. Vacant land remains community property and any community land that is not allocated is still available for use by any community member or stranger. Grantees therefore, literally become the owners of the land and can transfer their interest in it.
Despite this, it will not be accepted as collateral for any loan from the banks until it has been registered. The Home Mortgage Finance Act 2008 (Act 774), which governs mortgage lending, specifically requires that land to be used as collateral should be registered.
The demand for residential land has long outstripped the pace at which the planning authority prepares its sector layouts. Thus, land-holding chiefs routinely hire a surveyor to prepare their own (parallel) layouts. This understandable practice worsens an already confused situation of poor land documentation and frequent litigation.38
6.5 INFORMAL LAND SYSTEMS
SQUATTINGIn most developing countries, squatting in an important housing strategy for many urban households for whom the formal system is unsuitable owing to cost,
Figure 24. Squatters along the railway line in Kumasi (2008) Photo © Royal Danish Academy of Fine Arts
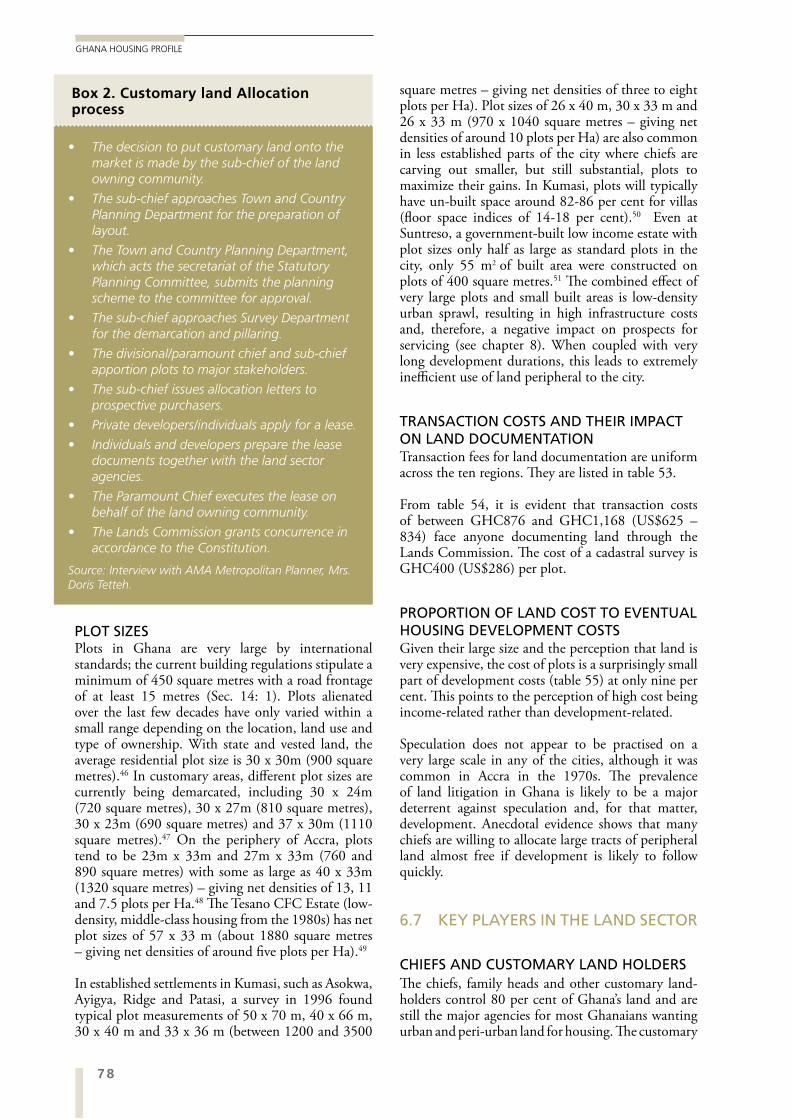
78
GHANA HOUSING PROFILE
PLOT SIZESPlots in Ghana are very large by international standards; the current building regulations stipulate a minimum of 450 square metres with a road frontage of at least 15 metres (Sec. 14: 1). Plots alienated over the last few decades have only varied within a small range depending on the location, land use and type of ownership. With state and vested land, the average residential plot size is 30 x 30m (900 square metres).46 In customary areas, different plot sizes are currently being demarcated, including 30 x 24m (720 square metres), 30 x 27m (810 square metres), 30 x 23m (690 square metres) and 37 x 30m (1110 square metres).47 On the periphery of Accra, plots tend to be 23m x 33m and 27m x 33m (760 and 890 square metres) with some as large as 40 x 33m (1320 square metres) – giving net densities of 13, 11 and 7.5 plots per Ha.48 The Tesano CFC Estate (low-density, middle-class housing from the 1980s) has net plot sizes of 57 x 33 m (about 1880 square metres – giving net densities of around five plots per Ha).49
In established settlements in Kumasi, such as Asokwa, Ayigya, Ridge and Patasi, a survey in 1996 found typical plot measurements of 50 x 70 m, 40 x 66 m, 30 x 40 m and 33 x 36 m (between 1200 and 3500
square metres – giving net densities of three to eight plots per Ha). Plot sizes of 26 x 40 m, 30 x 33 m and 26 x 33 m (970 x 1040 square metres – giving net densities of around 10 plots per Ha) are also common in less established parts of the city where chiefs are carving out smaller, but still substantial, plots to maximize their gains. In Kumasi, plots will typically have un-built space around 82-86 per cent for villas (floor space indices of 14-18 per cent).50 Even at Suntreso, a government-built low income estate with plot sizes only half as large as standard plots in the city, only 55 m2 of built area were constructed on plots of 400 square metres.51 The combined effect of very large plots and small built areas is low-density urban sprawl, resulting in high infrastructure costs and, therefore, a negative impact on prospects for servicing (see chapter 8). When coupled with very long development durations, this leads to extremely inefficient use of land peripheral to the city.
TRANSACTION COSTS AND THEIR IMPACT ON LAND DOCUMENTATIONTransaction fees for land documentation are uniform across the ten regions. They are listed in table 53.
From table 54, it is evident that transaction costs of between GHC876 and GHC1,168 (US$625 – 834) face anyone documenting land through the Lands Commission. The cost of a cadastral survey is GHC400 (US$286) per plot.
PROPORTION OF LAND COST TO EVENTUAL HOUSING DEVELOPMENT COSTSGiven their large size and the perception that land is very expensive, the cost of plots is a surprisingly small part of development costs (table 55) at only nine per cent. This points to the perception of high cost being income-related rather than development-related.
Speculation does not appear to be practised on a very large scale in any of the cities, although it was common in Accra in the 1970s. The prevalence of land litigation in Ghana is likely to be a major deterrent against speculation and, for that matter, development. Anecdotal evidence shows that many chiefs are willing to allocate large tracts of peripheral land almost free if development is likely to follow quickly.
6.7 KEY PLAYERS IN THE LAND SECTOR
CHIEFS AND CUSTOMARY LAND HOLDERSThe chiefs, family heads and other customary land-holders control 80 per cent of Ghana’s land and are still the major agencies for most Ghanaians wanting urban and peri-urban land for housing. The customary
Box 2. Customary land Allocation process
The decision to put customary land onto the market is made by the sub-chief of the land owning community.
The sub-chief approaches Town and Country Planning Department for the preparation of layout.
The Town and Country Planning Department, which acts the secretariat of the Statutory Planning Committee, submits the planning scheme to the committee for approval.
The sub-chief approaches Survey Department for the demarcation and pillaring.
The divisional/paramount chief and sub-chief apportion plots to major stakeholders.
The sub-chief issues allocation letters to prospective purchasers.
Private developers/individuals apply for a lease.
Individuals and developers prepare the lease documents together with the land sector agencies.
The Paramount Chief executes the lease on behalf of the land owning community.
The Lands Commission grants concurrence in accordance to the Constitution.
Source: Interview with AMA Metropolitan Planner, Mrs. Doris Tetteh.
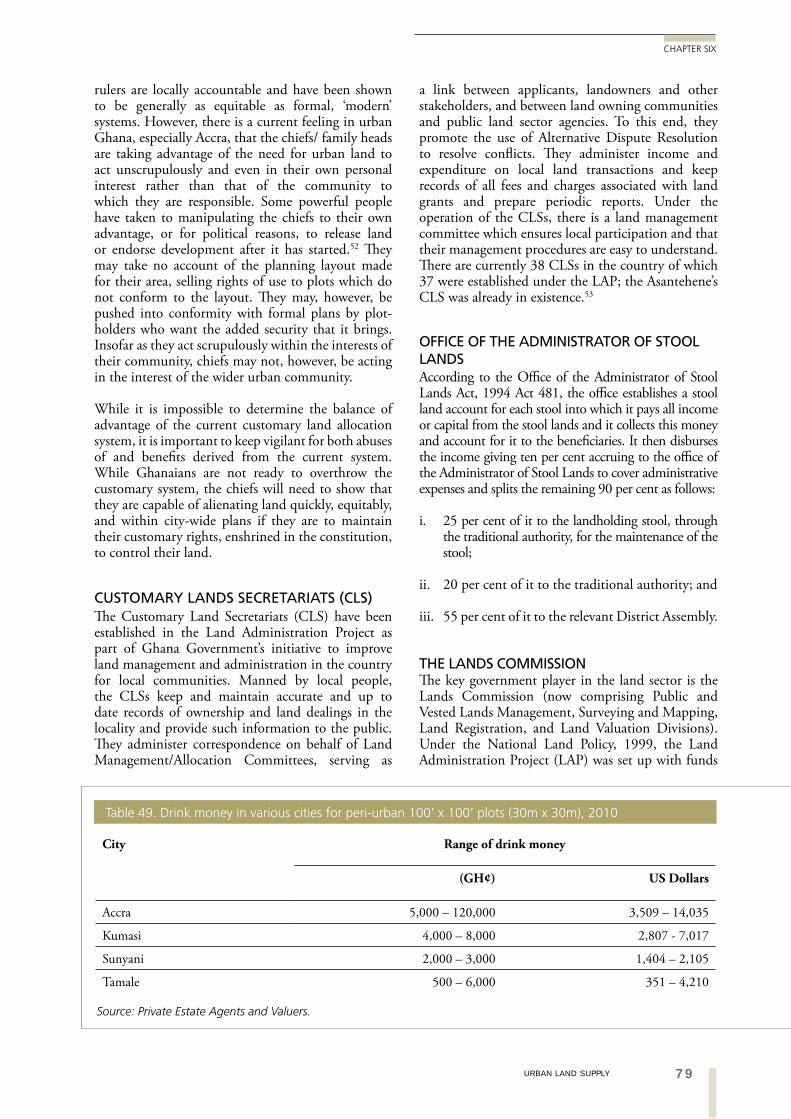
79URBAN LAND SUPPLY
CHAPTER SIX
a link between applicants, landowners and other stakeholders, and between land owning communities and public land sector agencies. To this end, they promote the use of Alternative Dispute Resolution to resolve conflicts. They administer income and expenditure on local land transactions and keep records of all fees and charges associated with land grants and prepare periodic reports. Under the operation of the CLSs, there is a land management committee which ensures local participation and that their management procedures are easy to understand. There are currently 38 CLSs in the country of which 37 were established under the LAP; the Asantehene’s CLS was already in existence.53
OFFICE OF THE ADMINISTRATOR OF STOOL LANDSAccording to the Office of the Administrator of Stool Lands Act, 1994 Act 481, the office establishes a stool land account for each stool into which it pays all income or capital from the stool lands and it collects this money and account for it to the beneficiaries. It then disburses the income giving ten per cent accruing to the office of the Administrator of Stool Lands to cover administrative expenses and splits the remaining 90 per cent as follows:
i. 25 per cent of it to the landholding stool, through the traditional authority, for the maintenance of the stool;
ii. 20 per cent of it to the traditional authority; and
iii. 55 per cent of it to the relevant District Assembly.
THE LANDS COMMISSIONThe key government player in the land sector is the Lands Commission (now comprising Public and Vested Lands Management, Surveying and Mapping, Land Registration, and Land Valuation Divisions). Under the National Land Policy, 1999, the Land Administration Project (LAP) was set up with funds
rulers are locally accountable and have been shown to be generally as equitable as formal, ‘modern’ systems. However, there is a current feeling in urban Ghana, especially Accra, that the chiefs/ family heads are taking advantage of the need for urban land to act unscrupulously and even in their own personal interest rather than that of the community to which they are responsible. Some powerful people have taken to manipulating the chiefs to their own advantage, or for political reasons, to release land or endorse development after it has started.52 They may take no account of the planning layout made for their area, selling rights of use to plots which do not conform to the layout. They may, however, be pushed into conformity with formal plans by plot-holders who want the added security that it brings. Insofar as they act scrupulously within the interests of their community, chiefs may not, however, be acting in the interest of the wider urban community.
While it is impossible to determine the balance of advantage of the current customary land allocation system, it is important to keep vigilant for both abuses of and benefits derived from the current system. While Ghanaians are not ready to overthrow the customary system, the chiefs will need to show that they are capable of alienating land quickly, equitably, and within city-wide plans if they are to maintain their customary rights, enshrined in the constitution, to control their land.
CUSTOMARY LANDS SECRETARIATS (CLS)The Customary Land Secretariats (CLS) have been established in the Land Administration Project as part of Ghana Government’s initiative to improve land management and administration in the country for local communities. Manned by local people, the CLSs keep and maintain accurate and up to date records of ownership and land dealings in the locality and provide such information to the public. They administer correspondence on behalf of Land Management/Allocation Committees, serving as
City Range of drink money
(GH¢) US Dollars
Accra 5,000 – 120,000 3,509 – 14,035
Kumasi 4,000 – 8,000 2,807 - 7,017
Sunyani 2,000 – 3,000 1,404 – 2,105
Tamale 500 – 6,000 351 – 4,210
Source: Private Estate Agents and Valuers.
Table 49. Drink money in various cities for peri-urban 100’ x 100’ plots (30m x 30m), 2010
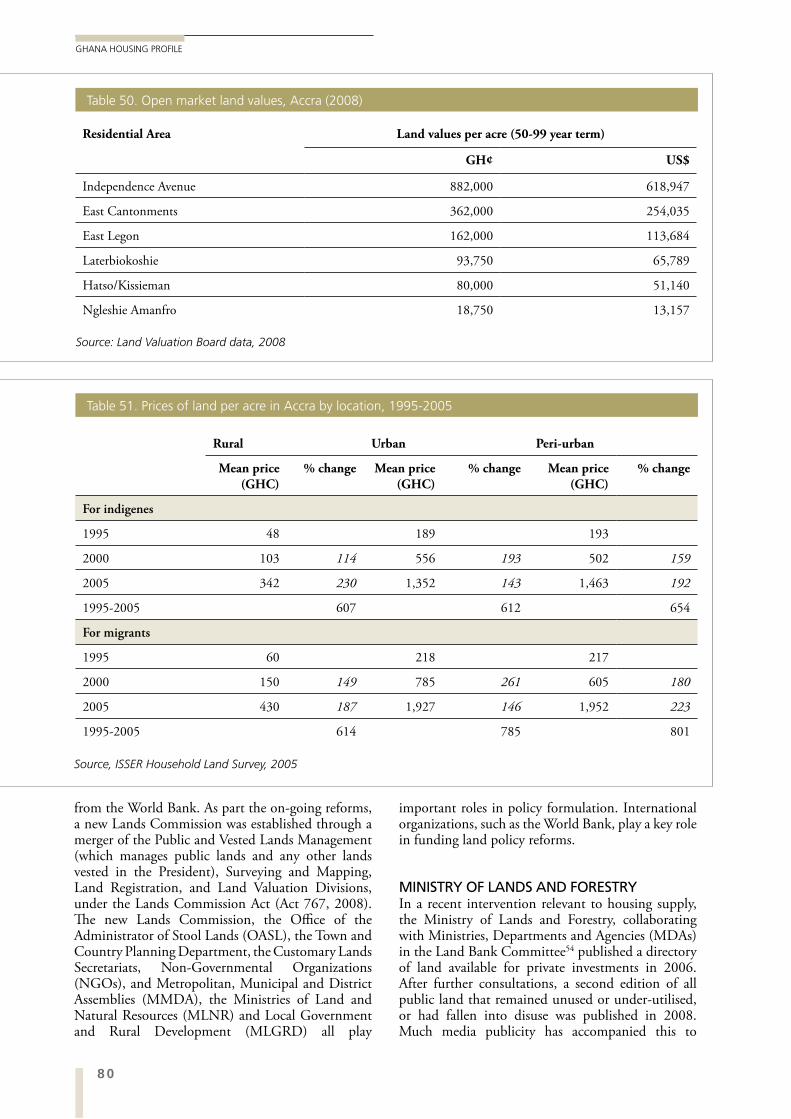
80
GHANA HOUSING PROFILE
from the World Bank. As part the on-going reforms, a new Lands Commission was established through a merger of the Public and Vested Lands Management (which manages public lands and any other lands vested in the President), Surveying and Mapping, Land Registration, and Land Valuation Divisions, under the Lands Commission Act (Act 767, 2008). The new Lands Commission, the Office of the Administrator of Stool Lands (OASL), the Town and Country Planning Department, the Customary Lands Secretariats, Non-Governmental Organizations (NGOs), and Metropolitan, Municipal and District Assemblies (MMDA), the Ministries of Land and Natural Resources (MLNR) and Local Government and Rural Development (MLGRD) all play
important roles in policy formulation. International organizations, such as the World Bank, play a key role in funding land policy reforms.
MINISTRY OF LANDS AND FORESTRYIn a recent intervention relevant to housing supply, the Ministry of Lands and Forestry, collaborating with Ministries, Departments and Agencies (MDAs) in the Land Bank Committee54 published a directory of land available for private investments in 2006. After further consultations, a second edition of all public land that remained unused or under-utilised, or had fallen into disuse was published in 2008. Much media publicity has accompanied this to
Rural Urban Peri-urban
Mean price (GHC)
% change Mean price (GHC)
% change Mean price (GHC)
% change
For indigenes
1995 48 189 193
2000 103 114 556 193 502 159
2005 342 230 1,352 143 1,463 192
1995-2005 607 612 654
For migrants
1995 60 218 217
2000 150 149 785 261 605 180
2005 430 187 1,927 146 1,952 223
1995-2005 614 785 801
Residential Area Land values per acre (50-99 year term)
GH¢ US$
Independence Avenue 882,000 618,947
East Cantonments 362,000 254,035
East Legon 162,000 113,684
Laterbiokoshie 93,750 65,789
Hatso/Kissieman 80,000 51,140
Ngleshie Amanfro 18,750 13,157
Source: Land Valuation Board data, 2008
Source, ISSER Household Land Survey, 2005
Table 50. Open market land values, Accra (2008)
Table 51. Prices of land per acre in Accra by location, 1995-2005
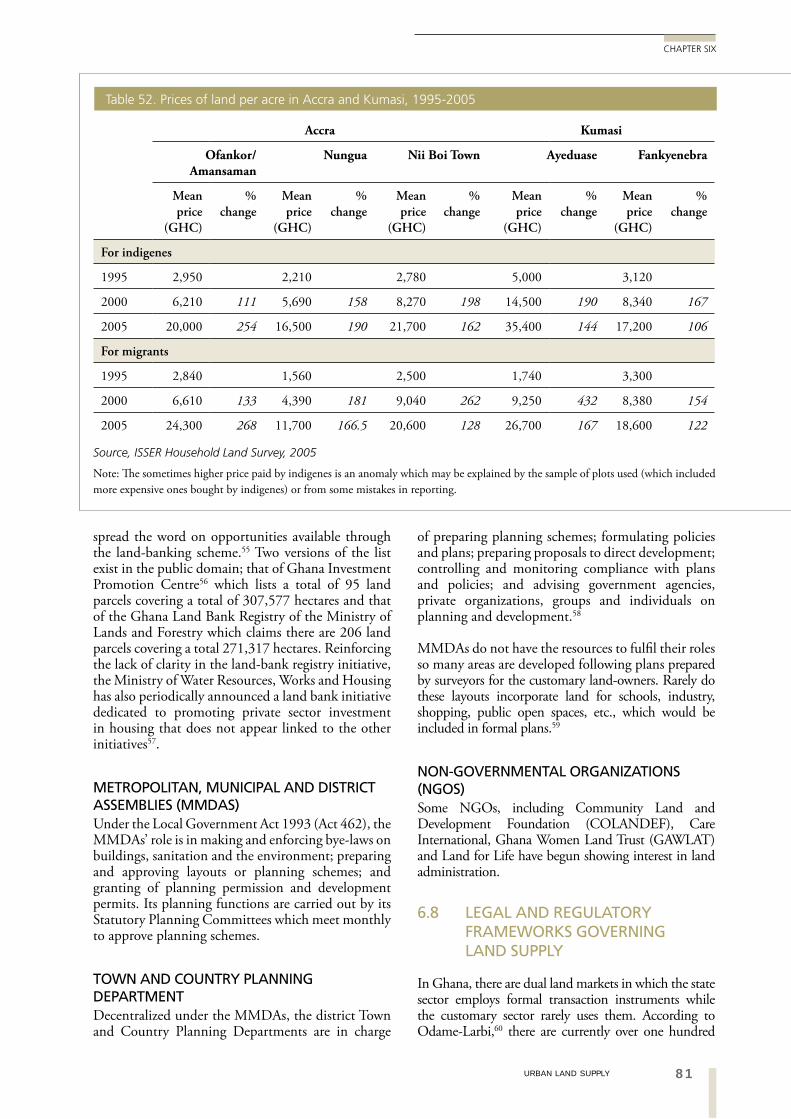
81URBAN LAND SUPPLY
CHAPTER SIX
spread the word on opportunities available through the land-banking scheme.55 Two versions of the list exist in the public domain; that of Ghana Investment Promotion Centre56 which lists a total of 95 land parcels covering a total of 307,577 hectares and that of the Ghana Land Bank Registry of the Ministry of Lands and Forestry which claims there are 206 land parcels covering a total 271,317 hectares. Reinforcing the lack of clarity in the land-bank registry initiative, the Ministry of Water Resources, Works and Housing has also periodically announced a land bank initiative dedicated to promoting private sector investment in housing that does not appear linked to the other initiatives57.
METROPOLITAN, MUNICIPAL AND DISTRICT ASSEMBLIES (MMDAS)Under the Local Government Act 1993 (Act 462), the MMDAs’ role is in making and enforcing bye-laws on buildings, sanitation and the environment; preparing and approving layouts or planning schemes; and granting of planning permission and development permits. Its planning functions are carried out by its Statutory Planning Committees which meet monthly to approve planning schemes.
TOWN AND COUNTRY PLANNING DEPARTMENTDecentralized under the MMDAs, the district Town and Country Planning Departments are in charge
of preparing planning schemes; formulating policies and plans; preparing proposals to direct development; controlling and monitoring compliance with plans and policies; and advising government agencies, private organizations, groups and individuals on planning and development.58
MMDAs do not have the resources to fulfil their roles so many areas are developed following plans prepared by surveyors for the customary land-owners. Rarely do these layouts incorporate land for schools, industry, shopping, public open spaces, etc., which would be included in formal plans.59
NON-GOVERNMENTAL ORGANIZATIONS (NGOS)Some NGOs, including Community Land and Development Foundation (COLANDEF), Care International, Ghana Women Land Trust (GAWLAT) and Land for Life have begun showing interest in land administration.
6.8 LEGAL AND REGULATORY FRAMEWORKS GOVERNING LAND SUPPLY
In Ghana, there are dual land markets in which the state sector employs formal transaction instruments while the customary sector rarely uses them. According to Odame-Larbi,60 there are currently over one hundred
Accra Kumasi
Ofankor/ Amansaman
Nungua Nii Boi Town Ayeduase Fankyenebra
Mean price
(GHC)
% change
Mean price
(GHC)
% change
Mean price
(GHC)
% change
Mean price
(GHC)
% change
Mean price
(GHC)
% change
For indigenes
1995 2,950 2,210 2,780 5,000 3,120
2000 6,210 111 5,690 158 8,270 198 14,500 190 8,340 167
2005 20,000 254 16,500 190 21,700 162 35,400 144 17,200 106
For migrants
1995 2,840 1,560 2,500 1,740 3,300
2000 6,610 133 4,390 181 9,040 262 9,250 432 8,380 154
2005 24,300 268 11,700 166.5 20,600 128 26,700 167 18,600 122
Source, ISSER Household Land Survey, 2005
Note: The sometimes higher price paid by indigenes is an anomaly which may be explained by the sample of plots used (which included more expensive ones bought by indigenes) or from some mistakes in reporting.
Table 52. Prices of land per acre in Accra and Kumasi, 1995-2005
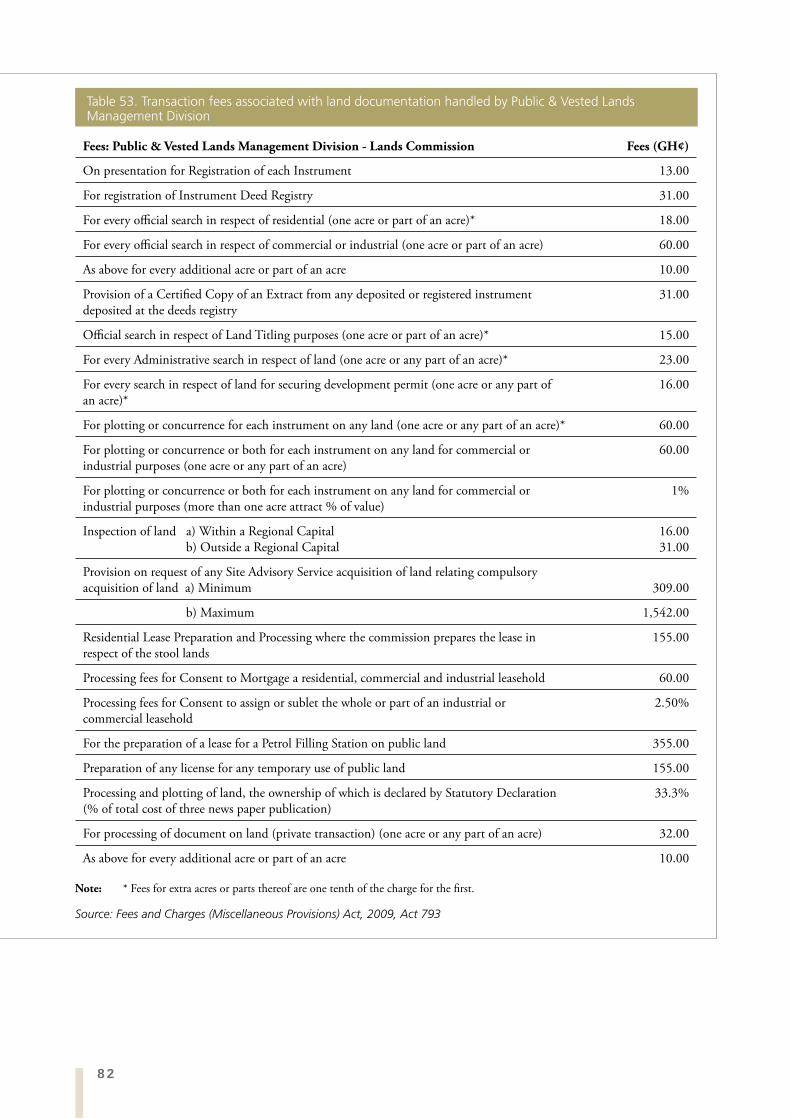
82
Fees: Public & Vested Lands Management Division - Lands Commission Fees (GH¢)
On presentation for Registration of each Instrument 13.00
For registration of Instrument Deed Registry 31.00
For every official search in respect of residential (one acre or part of an acre)* 18.00
For every official search in respect of commercial or industrial (one acre or part of an acre) 60.00
As above for every additional acre or part of an acre 10.00
Provision of a Certified Copy of an Extract from any deposited or registered instrument deposited at the deeds registry
31.00
Official search in respect of Land Titling purposes (one acre or part of an acre)* 15.00
For every Administrative search in respect of land (one acre or any part of an acre)* 23.00
For every search in respect of land for securing development permit (one acre or any part of an acre)*
16.00
For plotting or concurrence for each instrument on any land (one acre or any part of an acre)* 60.00
For plotting or concurrence or both for each instrument on any land for commercial or industrial purposes (one acre or any part of an acre)
60.00
For plotting or concurrence or both for each instrument on any land for commercial or industrial purposes (more than one acre attract % of value)
1%
Inspection of land a) Within a Regional Capital b) Outside a Regional Capital
16.0031.00
Provision on request of any Site Advisory Service acquisition of land relating compulsory acquisition of land a) Minimum 309.00
b) Maximum 1,542.00
Residential Lease Preparation and Processing where the commission prepares the lease in respect of the stool lands
155.00
Processing fees for Consent to Mortgage a residential, commercial and industrial leasehold 60.00
Processing fees for Consent to assign or sublet the whole or part of an industrial or commercial leasehold
2.50%
For the preparation of a lease for a Petrol Filling Station on public land 355.00
Preparation of any license for any temporary use of public land 155.00
Processing and plotting of land, the ownership of which is declared by Statutory Declaration (% of total cost of three news paper publication)
33.3%
For processing of document on land (private transaction) (one acre or any part of an acre) 32.00
As above for every additional acre or part of an acre 10.00
Note: * Fees for extra acres or parts thereof are one tenth of the charge for the first.
Source: Fees and Charges (Miscellaneous Provisions) Act, 2009, Act 793
Table 53. Transaction fees associated with land documentation handled by Public & Vested Lands Management Division
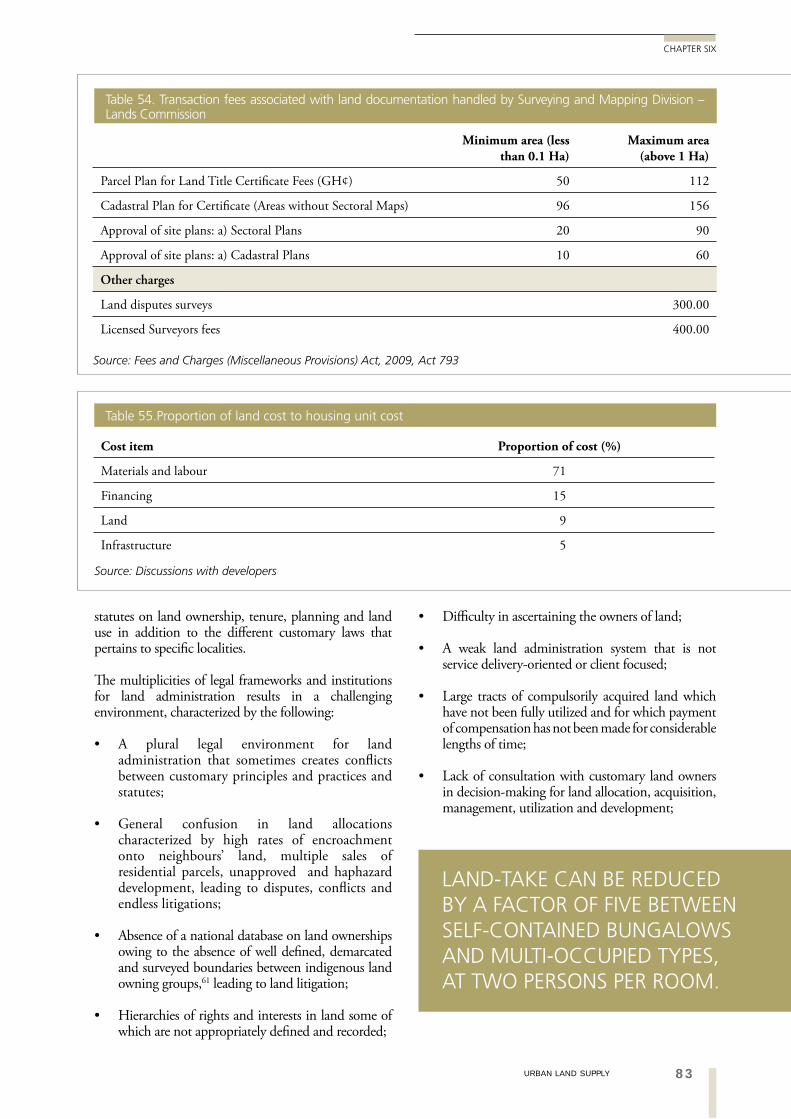
83URBAN LAND SUPPLY
CHAPTER SIX
statutes on land ownership, tenure, planning and land use in addition to the different customary laws that pertains to specific localities.
The multiplicities of legal frameworks and institutions for land administration results in a challenging environment, characterized by the following:
A plural legal environment for land administration that sometimes creates conflicts between customary principles and practices and statutes;
General confusion in land allocations characterized by high rates of encroachment onto neighbours’ land, multiple sales of residential parcels, unapproved and haphazard development, leading to disputes, conflicts and endless litigations;
Absence of a national database on land ownerships owing to the absence of well defined, demarcated and surveyed boundaries between indigenous land owning groups,61 leading to land litigation;
Hierarchies of rights and interests in land some of which are not appropriately defined and recorded;
Difficulty in ascertaining the owners of land;
A weak land administration system that is not service delivery-oriented or client focused;
Large tracts of compulsorily acquired land which have not been fully utilized and for which payment of compensation has not been made for considerable lengths of time;
Lack of consultation with customary land owners in decision-making for land allocation, acquisition, management, utilization and development;
Minimum area (less than 0.1 Ha)
Maximum area (above 1 Ha)
Parcel Plan for Land Title Certificate Fees (GH¢) 50 112
Cadastral Plan for Certificate (Areas without Sectoral Maps) 96 156
Approval of site plans: a) Sectoral Plans 20 90
Approval of site plans: a) Cadastral Plans 10 60
Other charges
Land disputes surveys 300.00
Licensed Surveyors fees 400.00
Source: Fees and Charges (Miscellaneous Provisions) Act, 2009, Act 793
Table 54. Transaction fees associated with land documentation handled by Surveying and Mapping Division – Lands Commission
Cost item Proportion of cost (%)
Materials and labour 71
Financing 15
Land 9
Infrastructure 5
Source: Discussions with developers
Table 55.Proportion of land cost to housing unit cost
LAND-TAKE CAN BE REDUCED BY A FACTOR OF FIVE BETWEEN SELF-CONTAINED BUNGALOWS AND MULTI-OCCUPIED TYPES, AT TWO PERSONS PER ROOM.
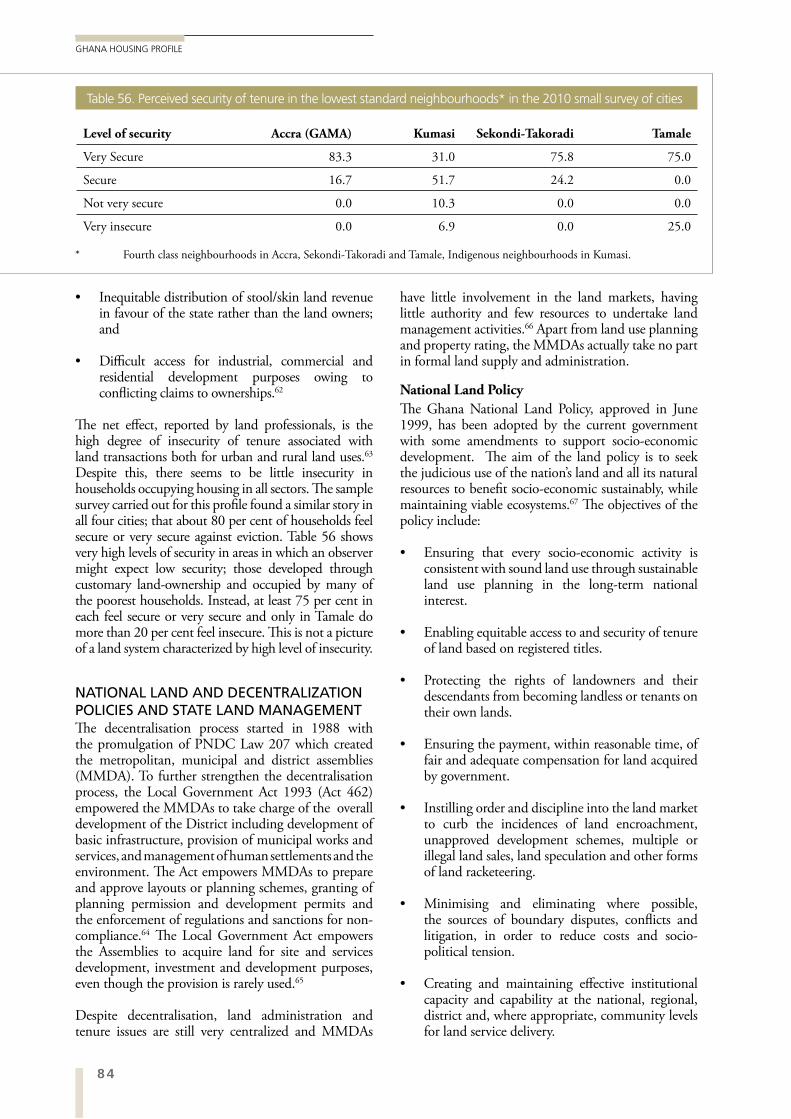
84
GHANA HOUSING PROFILE
Inequitable distribution of stool/skin land revenue in favour of the state rather than the land owners; and
Difficult access for industrial, commercial and residential development purposes owing to conflicting claims to ownerships.62
The net effect, reported by land professionals, is the high degree of insecurity of tenure associated with land transactions both for urban and rural land uses.63 Despite this, there seems to be little insecurity in households occupying housing in all sectors. The sample survey carried out for this profile found a similar story in all four cities; that about 80 per cent of households feel secure or very secure against eviction. Table 56 shows very high levels of security in areas in which an observer might expect low security; those developed through customary land-ownership and occupied by many of the poorest households. Instead, at least 75 per cent in each feel secure or very secure and only in Tamale do more than 20 per cent feel insecure. This is not a picture of a land system characterized by high level of insecurity.
NATIONAL LAND AND DECENTRALIZATION POLICIES AND STATE LAND MANAGEMENTThe decentralisation process started in 1988 with the promulgation of PNDC Law 207 which created the metropolitan, municipal and district assemblies (MMDA). To further strengthen the decentralisation process, the Local Government Act 1993 (Act 462) empowered the MMDAs to take charge of the overall development of the District including development of basic infrastructure, provision of municipal works and services, and management of human settlements and the environment. The Act empowers MMDAs to prepare and approve layouts or planning schemes, granting of planning permission and development permits and the enforcement of regulations and sanctions for non-compliance.64 The Local Government Act empowers the Assemblies to acquire land for site and services development, investment and development purposes, even though the provision is rarely used.65
Despite decentralisation, land administration and tenure issues are still very centralized and MMDAs
have little involvement in the land markets, having little authority and few resources to undertake land management activities.66 Apart from land use planning and property rating, the MMDAs actually take no part in formal land supply and administration.
National Land Policy
The Ghana National Land Policy, approved in June 1999, has been adopted by the current government with some amendments to support socio-economic development. The aim of the land policy is to seek the judicious use of the nation’s land and all its natural resources to benefit socio-economic sustainably, while maintaining viable ecosystems.67 The objectives of the policy include:
Ensuring that every socio-economic activity is consistent with sound land use through sustainable land use planning in the long-term national interest.
Enabling equitable access to and security of tenure of land based on registered titles.
Protecting the rights of landowners and their descendants from becoming landless or tenants on their own lands.
Ensuring the payment, within reasonable time, of fair and adequate compensation for land acquired by government.
Instilling order and discipline into the land market to curb the incidences of land encroachment, unapproved development schemes, multiple or illegal land sales, land speculation and other forms of land racketeering.
Minimising and eliminating where possible, the sources of boundary disputes, conflicts and litigation, in order to reduce costs and socio-political tension.
Creating and maintaining effective institutional capacity and capability at the national, regional, district and, where appropriate, community levels for land service delivery.
Level of security Accra (GAMA) Kumasi Sekondi-Takoradi Tamale
Very Secure 83.3 31.0 75.8 75.0
Secure 16.7 51.7 24.2 0.0
Not very secure 0.0 10.3 0.0 0.0
Very insecure 0.0 6.9 0.0 25.0
* Fourth class neighbourhoods in Accra, Sekondi-Takoradi and Tamale, Indigenous neighbourhoods in Kumasi.
Table 56. Perceived security of tenure in the lowest standard neighbourhoods* in the 2010 small survey of cities
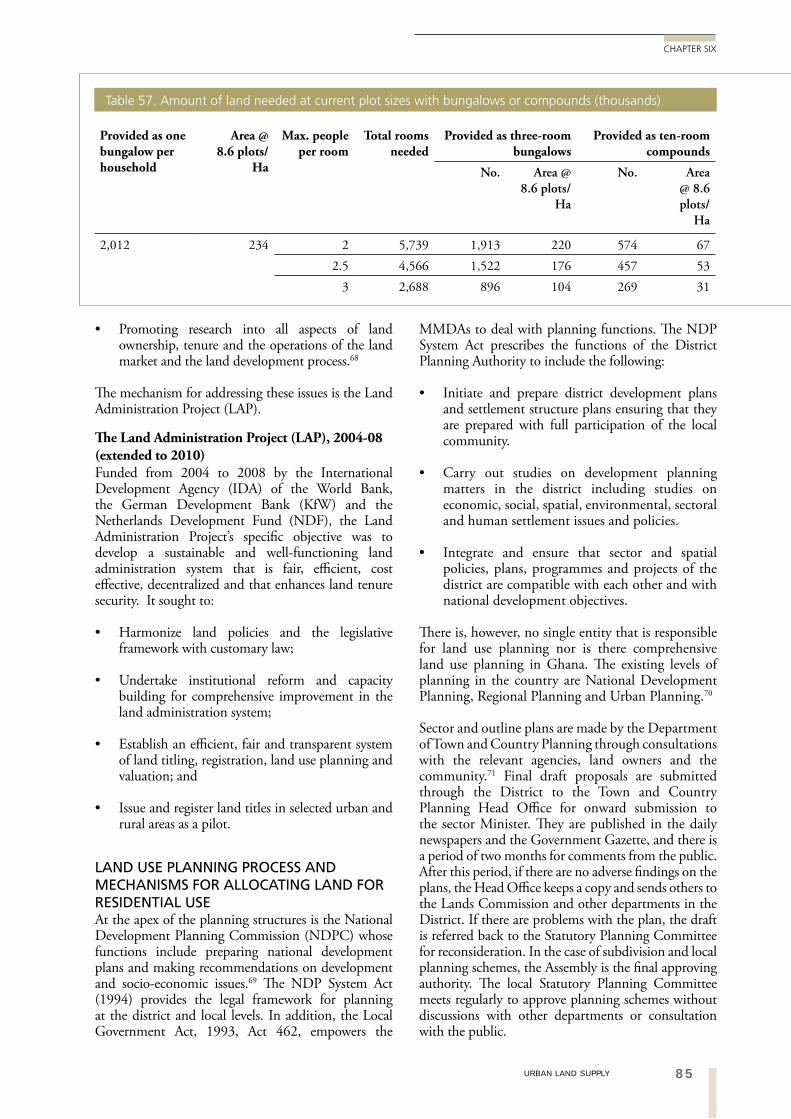
85URBAN LAND SUPPLY
CHAPTER SIX
Promoting research into all aspects of land ownership, tenure and the operations of the land market and the land development process.68
The mechanism for addressing these issues is the Land Administration Project (LAP).
The Land Administration Project (LAP), 2004-08 (extended to 2010)Funded from 2004 to 2008 by the International Development Agency (IDA) of the World Bank, the German Development Bank (KfW) and the Netherlands Development Fund (NDF), the Land Administration Project’s specific objective was to develop a sustainable and well-functioning land administration system that is fair, efficient, cost effective, decentralized and that enhances land tenure security. It sought to:
Harmonize land policies and the legislative framework with customary law;
Undertake institutional reform and capacity building for comprehensive improvement in the land administration system;
Establish an efficient, fair and transparent system of land titling, registration, land use planning and valuation; and
Issue and register land titles in selected urban and rural areas as a pilot.
LAND USE PLANNING PROCESS AND MECHANISMS FOR ALLOCATING LAND FOR RESIDENTIAL USEAt the apex of the planning structures is the National Development Planning Commission (NDPC) whose functions include preparing national development plans and making recommendations on development and socio-economic issues.69 The NDP System Act (1994) provides the legal framework for planning at the district and local levels. In addition, the Local Government Act, 1993, Act 462, empowers the
MMDAs to deal with planning functions. The NDP System Act prescribes the functions of the District Planning Authority to include the following:
Initiate and prepare district development plans and settlement structure plans ensuring that they are prepared with full participation of the local community.
Carry out studies on development planning matters in the district including studies on economic, social, spatial, environmental, sectoral and human settlement issues and policies.
Integrate and ensure that sector and spatial policies, plans, programmes and projects of the district are compatible with each other and with national development objectives.
There is, however, no single entity that is responsible for land use planning nor is there comprehensive land use planning in Ghana. The existing levels of planning in the country are National Development Planning, Regional Planning and Urban Planning.70
Sector and outline plans are made by the Department of Town and Country Planning through consultations with the relevant agencies, land owners and the community.71 Final draft proposals are submitted through the District to the Town and Country Planning Head Office for onward submission to the sector Minister. They are published in the daily newspapers and the Government Gazette, and there is a period of two months for comments from the public. After this period, if there are no adverse findings on the plans, the Head Office keeps a copy and sends others to the Lands Commission and other departments in the District. If there are problems with the plan, the draft is referred back to the Statutory Planning Committee for reconsideration. In the case of subdivision and local planning schemes, the Assembly is the final approving authority. The local Statutory Planning Committee meets regularly to approve planning schemes without discussions with other departments or consultation with the public.
Provided as one bungalow per household
Area @ 8.6 plots/
Ha
Max. people per room
Total rooms needed
Provided as three-room bungalows
Provided as ten-room compounds
No. Area @ 8.6 plots/
Ha
No. Area @ 8.6 plots/
Ha
2,012 234 2 5,739 1,913 220 574 672.5 4,566 1,522 176 457 53
3 2,688 896 104 269 31
Table 57. Amount of land needed at current plot sizes with bungalows or compounds (thousands)
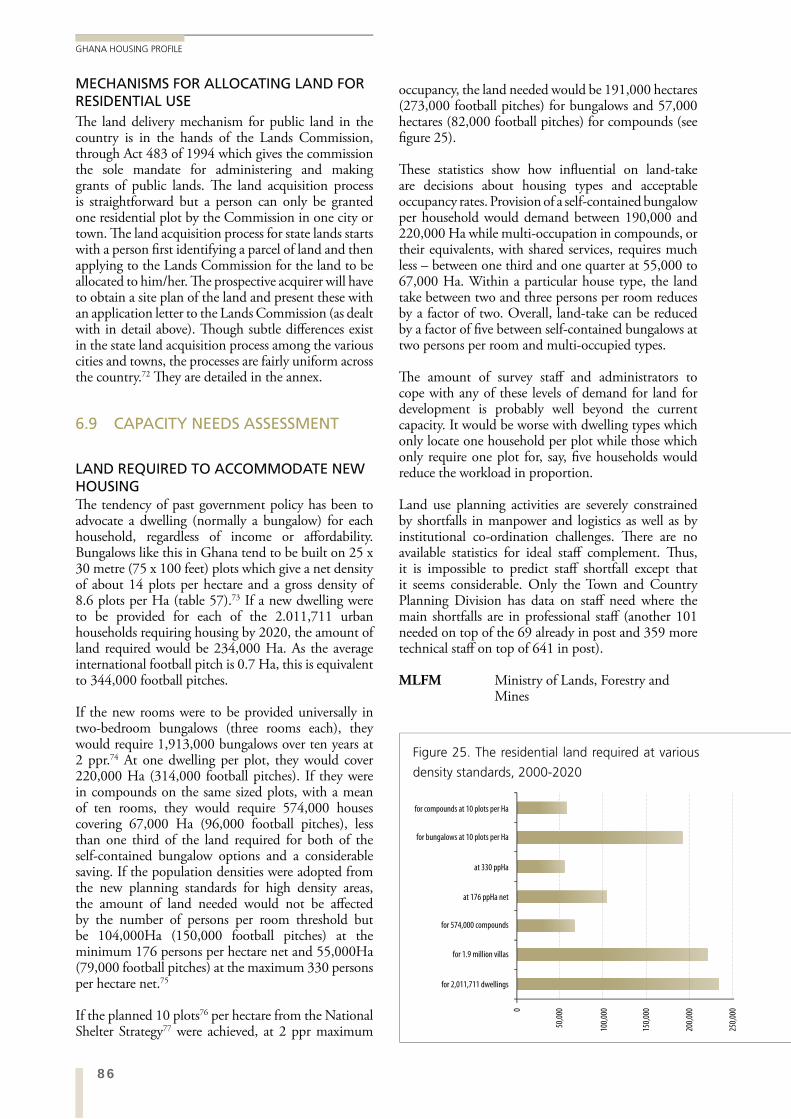
86
GHANA HOUSING PROFILE
occupancy, the land needed would be 191,000 hectares (273,000 football pitches) for bungalows and 57,000 hectares (82,000 football pitches) for compounds (see figure 25).
These statistics show how influential on land-take are decisions about housing types and acceptable occupancy rates. Provision of a self-contained bungalow per household would demand between 190,000 and 220,000 Ha while multi-occupation in compounds, or their equivalents, with shared services, requires much less – between one third and one quarter at 55,000 to 67,000 Ha. Within a particular house type, the land take between two and three persons per room reduces by a factor of two. Overall, land-take can be reduced by a factor of five between self-contained bungalows at two persons per room and multi-occupied types.
The amount of survey staff and administrators to cope with any of these levels of demand for land for development is probably well beyond the current capacity. It would be worse with dwelling types which only locate one household per plot while those which only require one plot for, say, five households would reduce the workload in proportion.
Land use planning activities are severely constrained by shortfalls in manpower and logistics as well as by institutional co-ordination challenges. There are no available statistics for ideal staff complement. Thus, it is impossible to predict staff shortfall except that it seems considerable. Only the Town and Country Planning Division has data on staff need where the main shortfalls are in professional staff (another 101 needed on top of the 69 already in post and 359 more technical staff on top of 641 in post).
MLFM Ministry of Lands, Forestry and Mines
MECHANISMS FOR ALLOCATING LAND FOR RESIDENTIAL USEThe land delivery mechanism for public land in the country is in the hands of the Lands Commission, through Act 483 of 1994 which gives the commission the sole mandate for administering and making grants of public lands. The land acquisition process is straightforward but a person can only be granted one residential plot by the Commission in one city or town. The land acquisition process for state lands starts with a person first identifying a parcel of land and then applying to the Lands Commission for the land to be allocated to him/her. The prospective acquirer will have to obtain a site plan of the land and present these with an application letter to the Lands Commission (as dealt with in detail above). Though subtle differences exist in the state land acquisition process among the various cities and towns, the processes are fairly uniform across the country.72 They are detailed in the annex.
6.9 CAPACITY NEEDS ASSESSMENT
LAND REQUIRED TO ACCOMMODATE NEW HOUSINGThe tendency of past government policy has been to advocate a dwelling (normally a bungalow) for each household, regardless of income or affordability. Bungalows like this in Ghana tend to be built on 25 x 30 metre (75 x 100 feet) plots which give a net density of about 14 plots per hectare and a gross density of 8.6 plots per Ha (table 57).73 If a new dwelling were to be provided for each of the 2.011,711 urban households requiring housing by 2020, the amount of land required would be 234,000 Ha. As the average international football pitch is 0.7 Ha, this is equivalent to 344,000 football pitches.
If the new rooms were to be provided universally in two-bedroom bungalows (three rooms each), they would require 1,913,000 bungalows over ten years at 2 ppr.74 At one dwelling per plot, they would cover 220,000 Ha (314,000 football pitches). If they were in compounds on the same sized plots, with a mean of ten rooms, they would require 574,000 houses covering 67,000 Ha (96,000 football pitches), less than one third of the land required for both of the self-contained bungalow options and a considerable saving. If the population densities were adopted from the new planning standards for high density areas, the amount of land needed would not be affected by the number of persons per room threshold but be 104,000Ha (150,000 football pitches) at the minimum 176 persons per hectare net and 55,000Ha (79,000 football pitches) at the maximum 330 persons per hectare net.75
If the planned 10 plots76 per hectare from the National Shelter Strategy77 were achieved, at 2 ppr maximum
Figure 25. The residential land required at various
density standards, 2000-2020
0
50,0
00
100,
000
150,
000
200,
000
250,
000
for compounds at 10 plots per Ha
for bungalows at 10 plots per Ha
at 330 ppHa
at 176 ppHa net
for 574,000 compounds
for 1.9 million villas
for 2,011,711 dwellings
87URBAN LAND SUPPLY
CHAPTER SIX
property jointly acquired regardless of whether or not the spouse died intestate.
Though these legal provisions exist in favour of women and other vulnerable groups, there have been challenges that prevent women having equal access to land. These include;
The low representation and/or absence of women in decision-making on land issues;
Biases against women in the scale and fertility of the land and the interests that they have in it;
Discriminatory customary land practices and insecurity of tenure amongst women and other vulnerable groups;
Rapid commercialization of land and the inability of a majority of women to afford the land, with implications for livelihoods; and
Biases against women in the process of acquiring and registration/ documentation on land (Land Administration Project, 2010a)
COLANDEF supports organizations and actors in the land sector in their efforts to protect land rights for all, especially the vulnerable, and improve security of tenure and gender concerns in development. Given the recent oil discovery in the Western Region, COLANDEF could be a strategic partner for other civil society organisations with similar aspirations. COLANDEF has worked with a number of partners including the Land Administration Project, Millennium Development Authority and CHF Ghana in piloting land titling arrangements, and providing technical assistance in tenure regularisation and community mobilisation.
6.11 BRIEF CONCLUSION
The supply of peri-urban land for development is controlled mostly by customary authorities; the decision to put land into urban use entirely depends on them. Customary land is much cheaper than formal sales, even to non-indigenes of the community. Customary land is subject to payment of ‘drink money’ rather than a purchase price. Plots are very large by international standards. In the formal sector, transaction costs, in money but also in time, are quite high but the common assertion that land is generally expensive in urban Ghana is untrue. Similarly, professional assertions about highly insecure land tenure are not borne out when people are asked about their perceived security of tenure.
Land documentation and registrations should be done by purchasers at the various Land Sector Agencies, with the Lands Commission usually being the first point of
SMD Survey and Mapping Division
PVLMD Public and Vested Lands Management Division
LRD Land Registration Division
LVD Land Valuation Division
TCPD Town and Country Planning Department
OASL Office of the Administrator of Stool Lands
The TCPD has been and is beset by staff shortages arising from the long break in the training of spatial planners at the Department of Planning of the KNUST from 1986 to 2005. Out of the 170 MMDAs, only 64 have professional planners. There are only two planners in Tamale, when at least five are needed, and no vehicle for carrying out their work. Kumasi has a master plan that has not been revised since 1963, there are only four professional physical planners and 4 technical officers, leaving a need for an additional 20 professional planners and 10 technical officers.78 There are only six building inspectors in Sekondi-Takoradi for a population of 400,000 and a coming oil boom.
6.10 CROSS-CUTTING ISSUES: GENDER, HIV-AIDS, YOUTH
Amanor79 argues that operating customary land systems in parallel with modern systems imposes a system of
“customary rights for peasant subjects and fully titled rights for global citizens”.80
This is true but not quite the negative story it appears to be. In the area from where they originate, even the poorest Ghanaians have a right to own land virtually for free, if there is any available. In this way, therefore, the customary system allows land ownership where the market denies it. This can be of considerable benefit for the poor in Ghana.
Regulations regarding access to land by women and other vulnerable groups in Ghana include the 1992 Fourth Republican Constitution; the Intestate Succession Law (PNDC Law 111, 1985 and the 1991 amendment); the Administration of Estates (Amendment) Law (Law 133, 1985); the Land Title Registration Law PNDC (Law 152,1985); the Head of Family Accountability Law (Law 114, 1985); the National Land Policy; and the Ghana Poverty Reduction Strategy Paper I & II. For instance, Article 18 of the Constitution guarantees the right of all persons to own property while Article 22 guarantees all spouses a reasonable portion of any
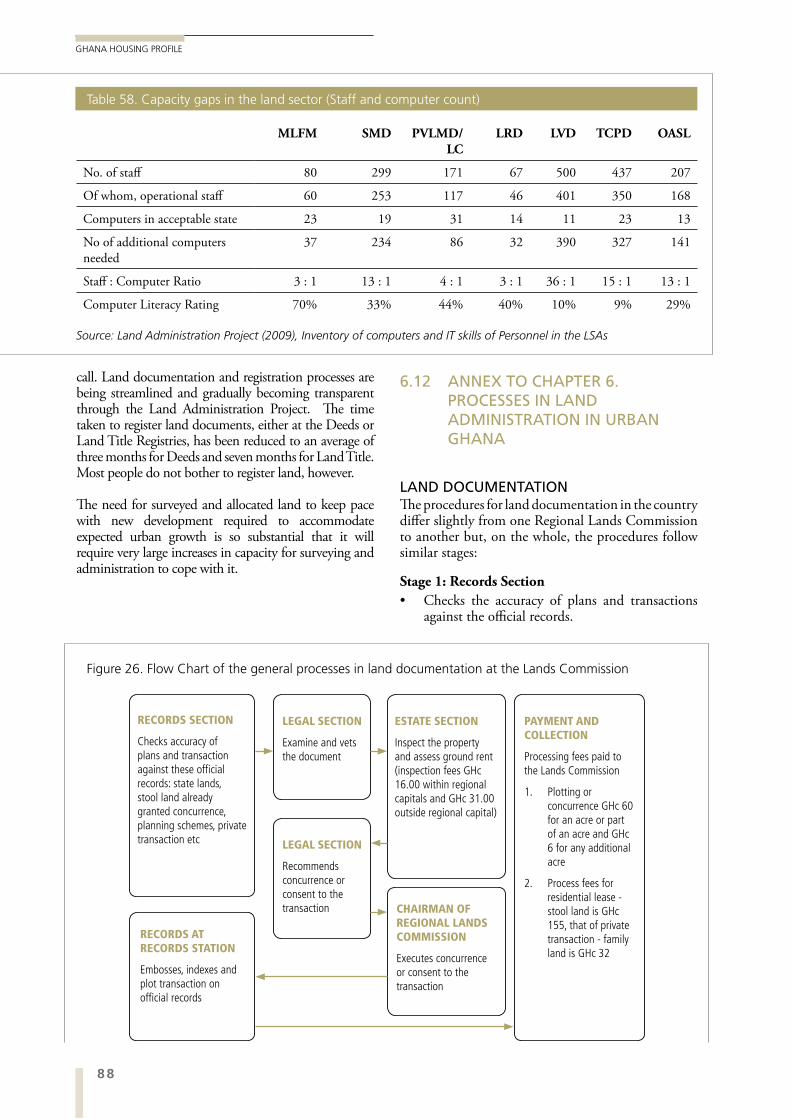
88
GHANA HOUSING PROFILE
call. Land documentation and registration processes are being streamlined and gradually becoming transparent through the Land Administration Project. The time taken to register land documents, either at the Deeds or Land Title Registries, has been reduced to an average of three months for Deeds and seven months for Land Title. Most people do not bother to register land, however.
The need for surveyed and allocated land to keep pace with new development required to accommodate expected urban growth is so substantial that it will require very large increases in capacity for surveying and administration to cope with it.
6.12 ANNEX TO CHAPTER 6. PROCESSES IN LAND ADMINISTRATION IN URBAN GHANA
LAND DOCUMENTATIONThe procedures for land documentation in the country differ slightly from one Regional Lands Commission to another but, on the whole, the procedures follow similar stages:
Stage 1: Records Section
Checks the accuracy of plans and transactions against the official records.
MLFM SMD PVLMD/
LCLRD LVD TCPD OASL
No. of staff 80 299 171 67 500 437 207
Of whom, operational staff 60 253 117 46 401 350 168
Computers in acceptable state 23 19 31 14 11 23 13
No of additional computers needed
37 234 86 32 390 327 141
Staff : Computer Ratio 3 : 1 13 : 1 4 : 1 3 : 1 36 : 1 15 : 1 13 : 1
Computer Literacy Rating 70% 33% 44% 40% 10% 9% 29%
Source: Land Administration Project (2009), Inventory of computers and IT skills of Personnel in the LSAs
Table 58. Capacity gaps in the land sector (Staff and computer count)
RECORDS SECTION
Checks accuracy of plans and transaction against these official records: state lands, stool land already granted concurrence, planning schemes, private transaction etc
LEGAL SECTION
Examine and vets the document
LEGAL SECTION
Recommends concurrence or consent to the transaction
RECORDS AT RECORDS STATION
Embosses, indexes and plot transaction on official records
ESTATE SECTION
Inspect the property and assess ground rent (inspection fees GHc 16.00 within regional capitals and GHc 31.00 outside regional capital)
CHAIRMAN OF REGIONAL LANDS COMMISSION
Executes concurrence or consent to the transaction
PAYMENT AND COLLECTION
Processing fees paid to the Lands Commission
1. Plotting or concurrence GHc 60 for an acre or part of an acre and GHc 6 for any additional acre
2. Process fees for residential lease - stool land is GHc 155, that of private transaction - family land is GHc 32
Figure 26. Flow Chart of the general processes in land documentation at the Lands Commission
89URBAN LAND SUPPLY
CHAPTER SIX
Indexes the transaction;
Plots the transaction.
Stage 7: Payment and collection of document81
Note that these are general procedures that are applicable to all land documents. The specific time taken for executing particular land documents are indicated in the following paragraphs.
DEEDS REGISTRATIONDeeds Registration operates under the Land Registry Act, 1962 (Act 122) which provides for the registration of all instruments affecting land and records the document to the land. Registration constituted notice to the whole world and, without it, an instrument affecting land is of no effect. The registration acts as evidence of which
Stage 2: Legal Section
Examines and vets documents.
Stage 3: Estate Section
Undertakes inspection of the proposed site if necessary;
Assesses the rent.
Stage 4: Legal Section
Recommends concurrence to the transaction.
Stage 5: Chairman of Regional Lands Commission
Executes concurrence to the transaction.
Stage 6: Recording at the Record Section
Embosses the transaction;
STRENGTHS WEAKNESSES
National Land Policy that gives guidelines and strategies for land management and administration.Well qualified staff with requisite expertise to handle land management and administration systems.Distinct land sector institutions with clear mandates to manage and document the multiplicity of property rights.Strong customary land management systems that protects customary land owners’ interests and prevent squatting.Strong commitment from Government to implement land administration reforms.
Lack of coordination between land sector agencies and customary land owners which leads to delays in land documentation.Legal pluralism and multiplicity of property rights hamper efficient land management and administrationLand administration system is not service delivery-oriented and client-focused.Lack of well defined, demarcated and surveyed boundaries between indigenous land ownership creates uncertainty in land dealings and delays the land documentation process.Lack of Land Information Systems for easy recording keeping and retrieval.
OPPORTUNITIES THREATS
LAP offers a platform for improving the basis of the land delivery system and to re – orientate institutional structures to be client focused and service delivery-oriented among other things.New Draft Land Bill designed to streamline the multiplicity of land laws and to curb legal pluralism in the land sector. New Land Use Planning Bill Draft designed to streamline land use planning processes and plot sizes to ensure sustainable land use. Decentralization to facilitate speedy deeds registration process.Piloting of a system approach to land titling in Land Title Registration districts to ensure security of tenure.New Lands Commission Act enacted to streamline land sector agencies and improve coordination among the institutions in the land sector.Land Information System being implemented to ensure effective management of land records and network between land sector agencies.
General indiscipline in the land market characterised by high rate of land encroachment, multiple sales of residential parcels, unapproved development schemes and haphazard development leading to disputes, conflicts and endless litigation.Lack of commitment from staff of land sector agencies to land administration reforms owing to perceived staff movement and certain job losses within certain categories of staff.Customary land owners control the land allocation process and initiate land use planning with very little control from formal land sector agencies.
6.13 SWOT ANALYSIS OF THE LAND SECTOR
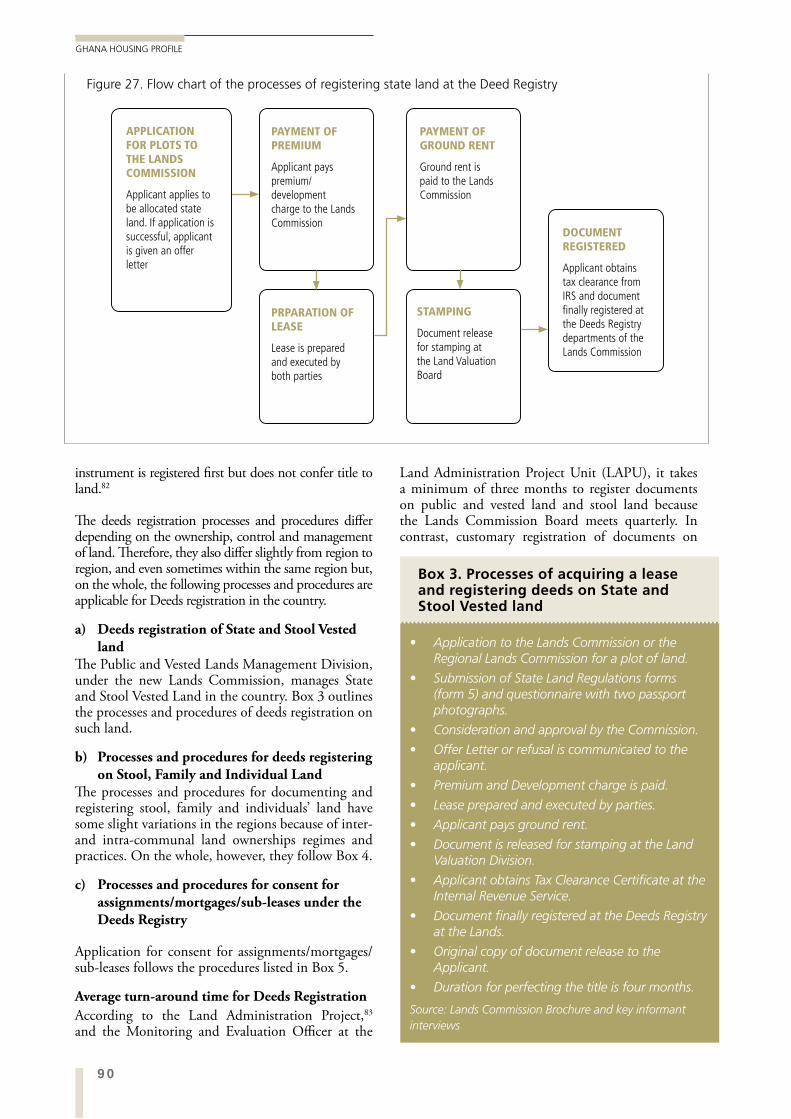
90
GHANA HOUSING PROFILE
instrument is registered first but does not confer title to land.82
The deeds registration processes and procedures differ depending on the ownership, control and management of land. Therefore, they also differ slightly from region to region, and even sometimes within the same region but, on the whole, the following processes and procedures are applicable for Deeds registration in the country.
a) Deeds registration of State and Stool Vested land
The Public and Vested Lands Management Division, under the new Lands Commission, manages State and Stool Vested Land in the country. Box 3 outlines the processes and procedures of deeds registration on such land.
b) Processes and procedures for deeds registering on Stool, Family and Individual Land
The processes and procedures for documenting and registering stool, family and individuals’ land have some slight variations in the regions because of inter- and intra-communal land ownerships regimes and practices. On the whole, however, they follow Box 4.
c) Processes and procedures for consent for assignments/mortgages/sub-leases under the Deeds Registry
Application for consent for assignments/mortgages/sub-leases follows the procedures listed in Box 5.
Average turn-around time for Deeds Registration
According to the Land Administration Project,83 and the Monitoring and Evaluation Officer at the
Land Administration Project Unit (LAPU), it takes a minimum of three months to register documents on public and vested land and stool land because the Lands Commission Board meets quarterly. In contrast, customary registration of documents on
Figure 27. Flow chart of the processes of registering state land at the Deed Registry
APPLICATION FOR PLOTS TO THE LANDS COMMISSION
Applicant applies to be allocated state land. If application is successful, applicant is given an offer letter
PAYMENT OF PREMIUM
Applicant pays premium/ development charge to the Lands Commission
PAYMENT OF GROUND RENT
Ground rent is paid to the Lands Commission
DOCUMENT REGISTERED
Applicant obtains tax clearance from IRS and document finally registered at the Deeds Registry departments of the Lands Commission
STAMPING
Document release for stamping at the Land Valuation Board
PRPARATION OF LEASE
Lease is prepared and executed by both parties
Box 3. Processes of acquiring a lease and registering deeds on State and Stool Vested land
Application to the Lands Commission or the Regional Lands Commission for a plot of land.
Submission of State Land Regulations forms (form 5) and questionnaire with two passport photographs.
Consideration and approval by the Commission.
Offer Letter or refusal is communicated to the applicant.
Premium and Development charge is paid.
Lease prepared and executed by parties.
Applicant pays ground rent.
Document is released for stamping at the Land Valuation Division.
Applicant obtains Tax Clearance Certificate at the Internal Revenue Service.
Document finally registered at the Deeds Registry at the Lands.
Original copy of document release to the Applicant.
Duration for perfecting the title is four months.
Source: Lands Commission Brochure and key informant interviews
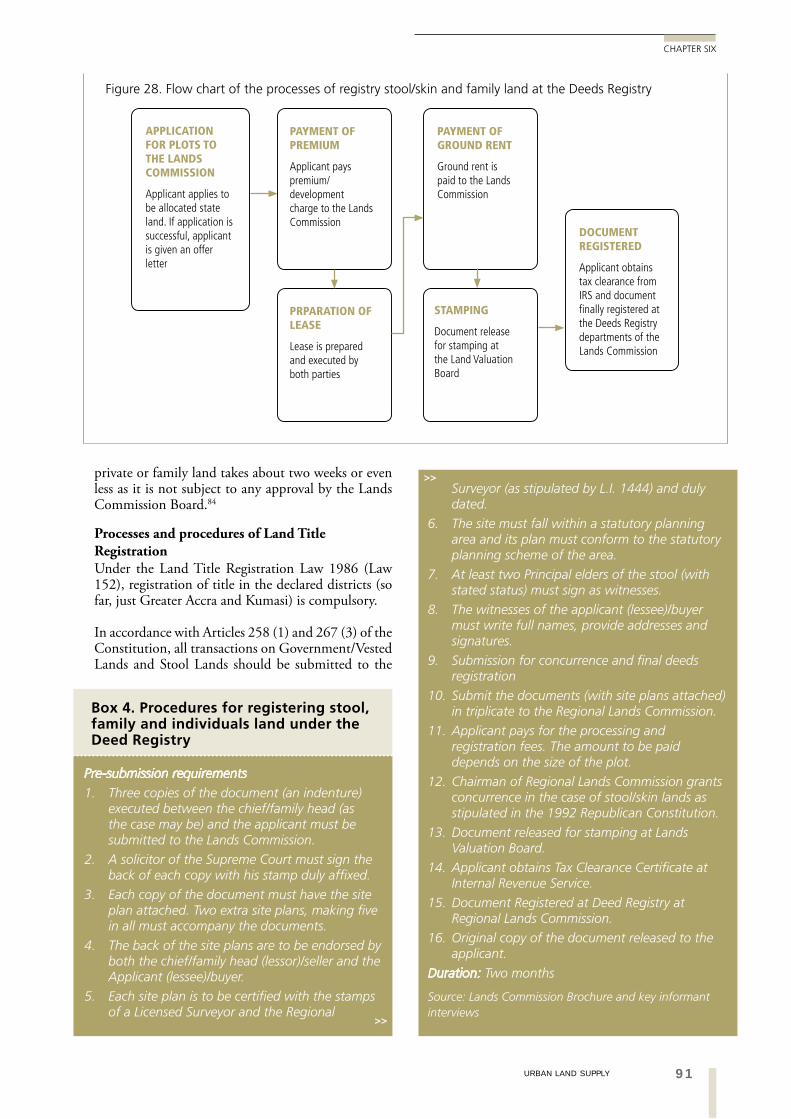
91URBAN LAND SUPPLY
CHAPTER SIX
APPLICATION FOR PLOTS TO THE LANDS COMMISSION
Applicant applies to be allocated state land. If application is successful, applicant is given an offer letter
PAYMENT OF PREMIUM
Applicant pays premium/ development charge to the Lands Commission
PAYMENT OF GROUND RENT
Ground rent is paid to the Lands Commission
DOCUMENT REGISTERED
Applicant obtains tax clearance from IRS and document finally registered at the Deeds Registry departments of the Lands Commission
STAMPING
Document release for stamping at the Land Valuation Board
PRPARATION OF LEASE
Lease is prepared and executed by both parties
Figure 28. Flow chart of the processes of registry stool/skin and family land at the Deeds Registry
private or family land takes about two weeks or even less as it is not subject to any approval by the Lands Commission Board.84
Processes and procedures of Land Title RegistrationUnder the Land Title Registration Law 1986 (Law 152), registration of title in the declared districts (so far, just Greater Accra and Kumasi) is compulsory.
In accordance with Articles 258 (1) and 267 (3) of the Constitution, all transactions on Government/Vested Lands and Stool Lands should be submitted to the
Box 4. Procedures for registering stool, family and individuals land under the Deed Registry
Pre-submission requirements
1. Three copies of the document (an indenture) executed between the chief/family head (as the case may be) and the applicant must be submitted to the Lands Commission.
2. A solicitor of the Supreme Court must sign the back of each copy with his stamp duly affixed.
3. Each copy of the document must have the site plan attached. Two extra site plans, making five in all must accompany the documents.
4. The back of the site plans are to be endorsed by both the chief/family head (lessor)/seller and the Applicant (lessee)/buyer.
5. Each site plan is to be certified with the stamps of a Licensed Surveyor and the Regional
Surveyor (as stipulated by L.I. 1444) and duly dated.
6. The site must fall within a statutory planning area and its plan must conform to the statutory planning scheme of the area.
7. At least two Principal elders of the stool (with stated status) must sign as witnesses.
8. The witnesses of the applicant (lessee)/buyer must write full names, provide addresses and signatures.
9. Submission for concurrence and final deeds registration
10. Submit the documents (with site plans attached) in triplicate to the Regional Lands Commission.
11. Applicant pays for the processing and registration fees. The amount to be paid depends on the size of the plot.
12. Chairman of Regional Lands Commission grants concurrence in the case of stool/skin lands as stipulated in the 1992 Republican Constitution.
13. Document released for stamping at Lands Valuation Board.
14. Applicant obtains Tax Clearance Certificate at Internal Revenue Service.
15. Document Registered at Deed Registry at Regional Lands Commission.
16. Original copy of the document released to the applicant.
Duration: Two months
Source: Lands Commission Brochure and key informant interviews
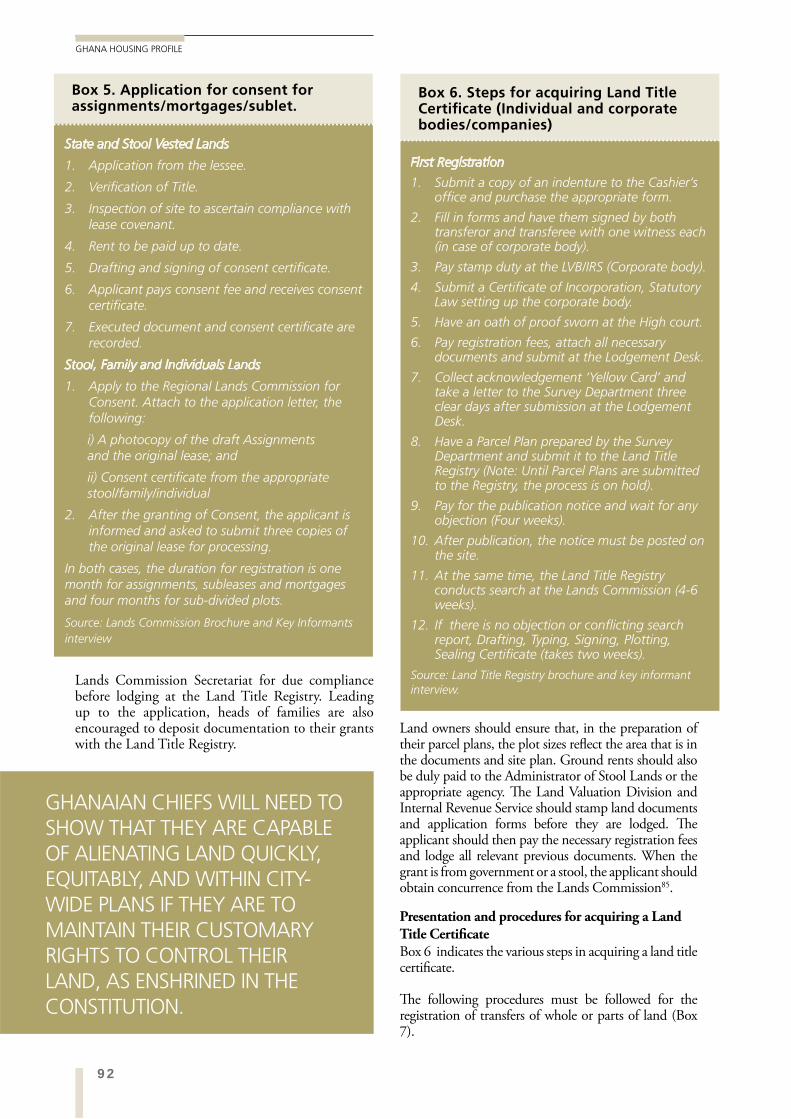
92
GHANA HOUSING PROFILE
Land owners should ensure that, in the preparation of their parcel plans, the plot sizes reflect the area that is in the documents and site plan. Ground rents should also be duly paid to the Administrator of Stool Lands or the appropriate agency. The Land Valuation Division and Internal Revenue Service should stamp land documents and application forms before they are lodged. The applicant should then pay the necessary registration fees and lodge all relevant previous documents. When the grant is from government or a stool, the applicant should obtain concurrence from the Lands Commission85.
Presentation and procedures for acquiring a Land Title CertificateBox 6 indicates the various steps in acquiring a land title certificate.
The following procedures must be followed for the registration of transfers of whole or parts of land (Box 7).
Lands Commission Secretariat for due compliance before lodging at the Land Title Registry. Leading up to the application, heads of families are also encouraged to deposit documentation to their grants with the Land Title Registry.
Box 5. Application for consent for assignments/mortgages/sublet.
State and Stool Vested Lands
1. Application from the lessee.
2. Verification of Title.
3. Inspection of site to ascertain compliance with lease covenant.
4. Rent to be paid up to date.
5. Drafting and signing of consent certificate.
6. Applicant pays consent fee and receives consent certificate.
7. Executed document and consent certificate are recorded.
Stool, Family and Individuals Lands
1. Apply to the Regional Lands Commission for Consent. Attach to the application letter, the following:
i) A photocopy of the draft Assignments and the original lease; and
ii) Consent certificate from the appropriate stool/family/individual
2. After the granting of Consent, the applicant is informed and asked to submit three copies of the original lease for processing.
In both cases, the duration for registration is one month for assignments, subleases and mortgages and four months for sub-divided plots.
Source: Lands Commission Brochure and Key Informants interview
Box 6. Steps for acquiring Land Title Certificate (Individual and corporate bodies/companies)
First Registration
1. Submit a copy of an indenture to the Cashier’s office and purchase the appropriate form.
2. Fill in forms and have them signed by both transferor and transferee with one witness each (in case of corporate body).
3. Pay stamp duty at the LVB/IRS (Corporate body).
4. Submit a Certificate of Incorporation, Statutory Law setting up the corporate body.
5. Have an oath of proof sworn at the High court.
6. Pay registration fees, attach all necessary documents and submit at the Lodgement Desk.
7. Collect acknowledgement ‘Yellow Card’ and take a letter to the Survey Department three clear days after submission at the Lodgement Desk.
8. Have a Parcel Plan prepared by the Survey Department and submit it to the Land Title Registry (Note: Until Parcel Plans are submitted to the Registry, the process is on hold).
9. Pay for the publication notice and wait for any objection (Four weeks).
10. After publication, the notice must be posted on the site.
11. At the same time, the Land Title Registry conducts search at the Lands Commission (4-6 weeks).
12. If there is no objection or conflicting search report, Drafting, Typing, Signing, Plotting, Sealing Certificate (takes two weeks).
Source: Land Title Registry brochure and key informant interview.
GHANAIAN CHIEFS WILL NEED TO SHOW THAT THEY ARE CAPABLE OF ALIENATING LAND QUICKLY, EQUITABLY, AND WITHIN CITY-WIDE PLANS IF THEY ARE TO MAINTAIN THEIR CUSTOMARY RIGHTS TO CONTROL THEIR LAND, AS ENSHRINED IN THE CONSTITUTION.
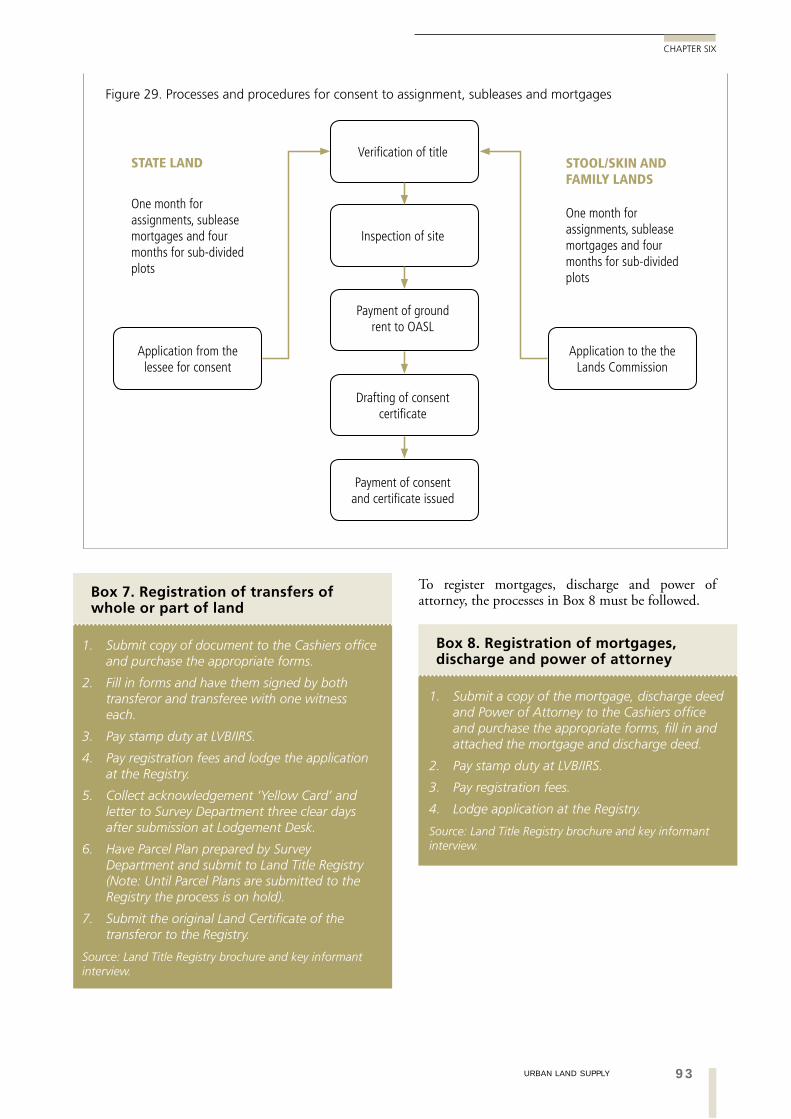
93URBAN LAND SUPPLY
CHAPTER SIX
Verification of title
Inspection of site
Payment of ground rent to OASL
Drafting of consent certificate
Payment of consent and certificate issued
Application to the the Lands Commission
Application from the lessee for consent
One month for assignments, sublease mortgages and four months for sub-divided plots
One month for assignments, sublease mortgages and four months for sub-divided plots
STATE LAND STOOL/SKIN AND FAMILY LANDS
Figure 29. Processes and procedures for consent to assignment, subleases and mortgages
Box 7. Registration of transfers of whole or part of land
1. Submit copy of document to the Cashiers office and purchase the appropriate forms.
2. Fill in forms and have them signed by both transferor and transferee with one witness each.
3. Pay stamp duty at LVB/IRS.
4. Pay registration fees and lodge the application at the Registry.
5. Collect acknowledgement ‘Yellow Card’ and letter to Survey Department three clear days after submission at Lodgement Desk.
6. Have Parcel Plan prepared by Survey Department and submit to Land Title Registry (Note: Until Parcel Plans are submitted to the Registry the process is on hold).
7. Submit the original Land Certificate of the transferor to the Registry.
Source: Land Title Registry brochure and key informant interview.
Box 8. Registration of mortgages, discharge and power of attorney
1. Submit a copy of the mortgage, discharge deed and Power of Attorney to the Cashiers office and purchase the appropriate forms, fill in and attached the mortgage and discharge deed.
2. Pay stamp duty at LVB/IRS.
3. Pay registration fees.
4. Lodge application at the Registry.
Source: Land Title Registry brochure and key informant interview.
To register mortgages, discharge and power of attorney, the processes in Box 8 must be followed.
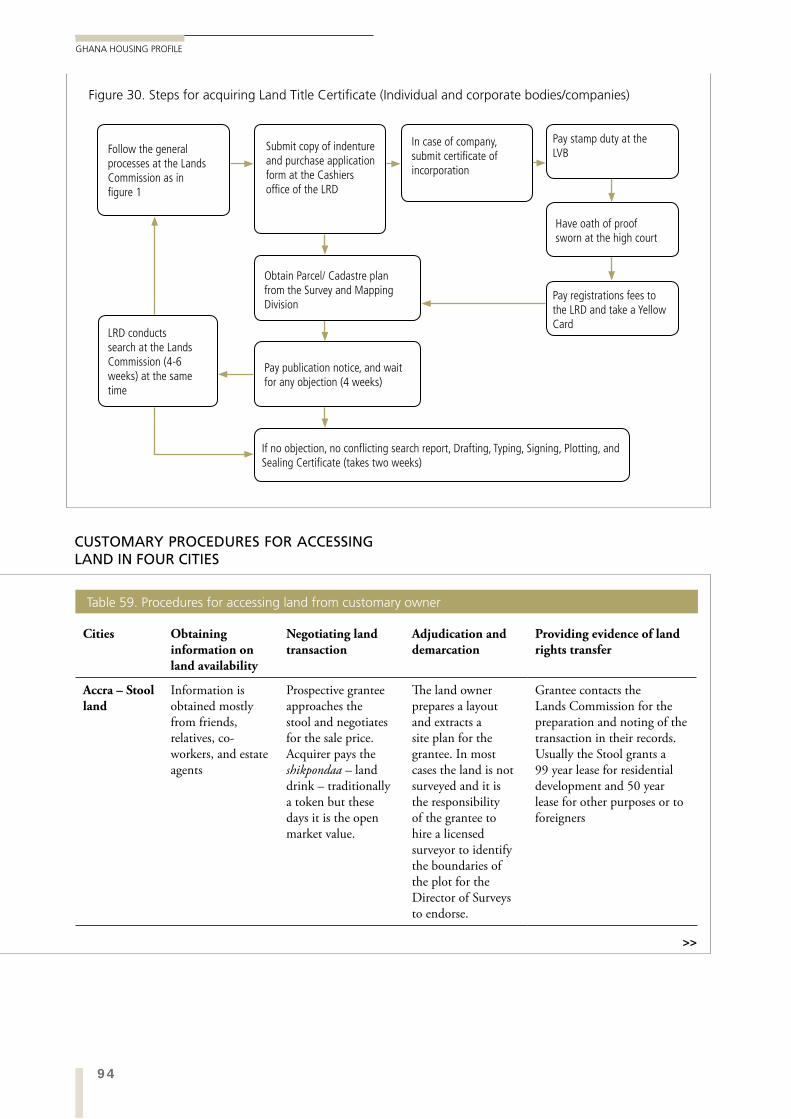
94
GHANA HOUSING PROFILE
CUSTOMARY PROCEDURES FOR ACCESSING LAND IN FOUR CITIES
Cities Obtaining information on land availability
Negotiating land transaction
Adjudication and demarcation
Providing evidence of land rights transfer
Accra – Stool land
Information is obtained mostly from friends, relatives, co-workers, and estate agents
Prospective grantee approaches the stool and negotiates for the sale price. Acquirer pays the shikpondaa – land drink – traditionally a token but these days it is the open market value.
The land owner prepares a layout and extracts a site plan for the grantee. In most cases the land is not surveyed and it is the responsibility of the grantee to hire a licensed surveyor to identify the boundaries of the plot for the Director of Surveys to endorse.
Grantee contacts the Lands Commission for the preparation and noting of the transaction in their records. Usually the Stool grants a 99 year lease for residential development and 50 year lease for other purposes or to foreigners
Table 59. Procedures for accessing land from customary owner
Figure 30. Steps for acquiring Land Title Certificate (Individual and corporate bodies/companies)
Follow the general processes at the Lands Commission as in figure 1
Submit copy of indenture and purchase application form at the Cashiers office of the LRD
In case of company, submit certificate of incorporation
Pay stamp duty at the LVB
LRD conducts search at the Lands Commission (4-6 weeks) at the same time
Have oath of proof sworn at the high court
Pay registrations fees to the LRD and take a Yellow Card
If no objection, no conflicting search report, Drafting, Typing, Signing, Plotting, and Sealing Certificate (takes two weeks)
Pay publication notice, and wait for any objection (4 weeks)
Obtain Parcel/ Cadastre plan from the Survey and Mapping Division
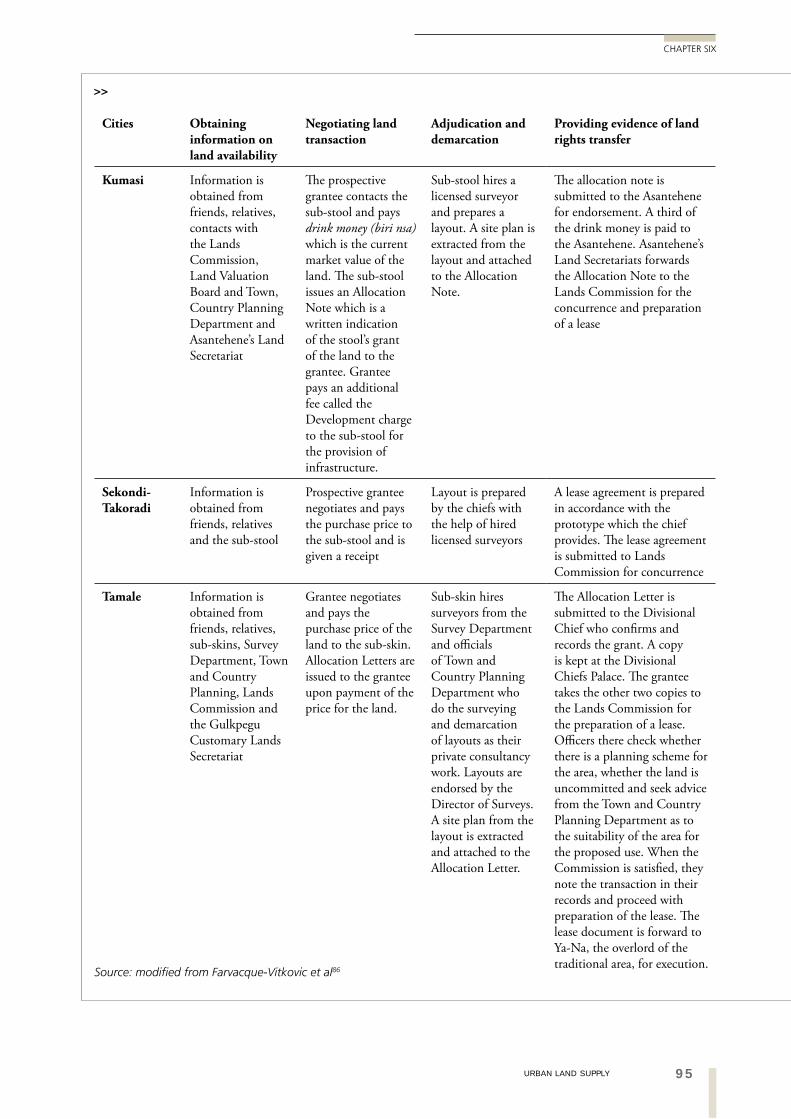
95URBAN LAND SUPPLY
CHAPTER SIX
Source: modified from Farvacque-Vitkovic et al86
Cities Obtaining information on land availability
Negotiating land transaction
Adjudication and demarcation
Providing evidence of land rights transfer
Kumasi Information is obtained from friends, relatives, contacts with the Lands Commission, Land Valuation Board and Town, Country Planning Department and Asantehene’s Land Secretariat
The prospective grantee contacts the sub-stool and pays drink money (biri nsa) which is the current market value of the land. The sub-stool issues an Allocation Note which is a written indication of the stool’s grant of the land to the grantee. Grantee pays an additional fee called the Development charge to the sub-stool for the provision of infrastructure.
Sub-stool hires a licensed surveyor and prepares a layout. A site plan is extracted from the layout and attached to the Allocation Note.
The allocation note is submitted to the Asantehene for endorsement. A third of the drink money is paid to the Asantehene. Asantehene’s Land Secretariats forwards the Allocation Note to the Lands Commission for the concurrence and preparation of a lease
Sekondi-Takoradi
Information is obtained from friends, relatives and the sub-stool
Prospective grantee negotiates and pays the purchase price to the sub-stool and is given a receipt
Layout is prepared by the chiefs with the help of hired licensed surveyors
A lease agreement is prepared in accordance with the prototype which the chief provides. The lease agreement is submitted to Lands Commission for concurrence
Tamale Information is obtained from friends, relatives, sub-skins, Survey Department, Town and Country Planning, Lands Commission and the Gulkpegu Customary Lands Secretariat
Grantee negotiates and pays the purchase price of the land to the sub-skin. Allocation Letters are issued to the grantee upon payment of the price for the land.
Sub-skin hires surveyors from the Survey Department and officials of Town and Country Planning Department who do the surveying and demarcation of layouts as their private consultancy work. Layouts are endorsed by the Director of Surveys. A site plan from the layout is extracted and attached to the Allocation Letter.
The Allocation Letter is submitted to the Divisional Chief who confirms and records the grant. A copy is kept at the Divisional Chiefs Palace. The grantee takes the other two copies to the Lands Commission for the preparation of a lease. Officers there check whether there is a planning scheme for the area, whether the land is uncommitted and seek advice from the Town and Country Planning Department as to the suitability of the area for the proposed use. When the Commission is satisfied, they note the transaction in their records and proceed with preparation of the lease. The lease document is forward to Ya-Na, the overlord of the traditional area, for execution.
96
GHANA HOUSING PROFILE
SECTION ENDNOTES
1 This chapter is largely based on a report by Samuel Banleman Biitir.2 Gough and Yankson (2000).3 Ministry of Lands and Forestry (2003).4 Ghana Statistical Service (2010).5 Ministry of Lands and Forestry (2003).6 Through Article 20 of the 1992 Constitution, the Administration of Lands (Act 1962), Act 123, the State
Lands Act 1962 (Act 125), the Land Statutory Wayleaves Act 1963 (Act 186) or regulations made under these statutes.
7 Ministry of Lands and Forestry (2003)8 National Development Planning Council (2010).9 Asenso-Okyere et al. (1993, cited in Gough and Yankson, 2000).10 Farvacque-Vitkovic et al. (2008).11 Sittie (2006).12 Land Administration Project (2010a).13 Gough and Yankson (2000).14 Gough and Yankson (2000).15 Farvacque-Vitkovic et al. (2008).16 Gough and Yankson (2000).17 Charles Boakye claims that chiefs do not have this information to hand. They are simply brought
documents to sign without the background of who has been leased land in the vicinity (personal communication, Accra, 2010). The prosecution of a few chiefs for fraudulent land transactions might serve to reduce the problem of mis-selling (personal communication, Prof Patrick McAuslan, 2010).
18 Tipple et al. (1999).19 Land Administration Project (2010a).20 One for every 200 developed houses in Ghana.21 Land Administration Project (2010a).22 Ollennu (1962: 4).23 Other periods are also recorded, e.g., 50 years in some cases in peri-urban Accra (Gough and Yankson,
2000).24 Their customary rulers “sit in state on specially designed stools/chairs whilst, in … northern Ghana, they
sit on [a] specially prepared skin of an animal (cow or sheep).” (Abdulai and Ndekugri, 2007: 261).25 Tipple et al. (1999).26 Tipple et al. (1999).27 Abdulai and Ndekugri (2007)28 Tipple et al. (1999).29 For example, Ollennu (1962); Bentsi-Enchill (1964); Gough and Yankson (2000); Mahama and Antwi
(2006); and Abdulai and Ndekugri (2007).30 Kasanga et al. (1996).31 Acquaye et al. (1989).32 Cited by Gough and Yankson (2000: 2487).33 Farvacque-Vitkovic et al. (2008).34 Stakeholders’ Workshop, Accra, September, 2010. This benefits the officers themselves rather than the
institution they serve.35 The Draft National Youth Policy defines youth to between the age of 15 and 35 years (Ministry of
Manpower Youth and Employment, 2007).36 Kasanga et al. (1996).37 Abdulai and Ndekugri (2007).38 Tipple et al. (1999).39 Tipple and Willis (1992); Konadu-Agyemang (1991); Korboe (1993).40 The Fourth Republican government introduced the regularization of titles to influential invaders of
state land in the Kwashiman area of Accra on a site originally intended for a stadium. Within the same period, low-income households were being evicted from public land at Agbogbloshie (also in Accra), where some 400 houses were affected in the dawn swoop of 31 July 1993. However, the households in question were not squatters (invaders) in the regular sense as the Accra Metropolitan Authority seeks to portray. Rather, they were people whose lands had been compulsorily acquired in the 1960s under authority of the Accra Industrial Estate (Acquisition of Lands) Ordinance No. 28 of 1956. Since the relevant compensation was paid by the state at the time of acquisition, and the land subsequently allocated to Accra Brewery Ltd for industrial development, the affected households were deemed to have lost their rights to the land.
97URBAN LAND SUPPLY
CHAPTER SIX
41 Tipple et al. (1999).42 Andreasen et al. (2005).43 One who is not a member of the land owning community.44 Wily and Hammond (2001).45 From figures in Ghana Statistical Service (2010)46 100 x 100 feet.47 100 x 80ft, 100 x 90ft, 100 x 75ft and 120 x 100 (interviews with Land Sector Agencies).48 Gough and Yankson (2000).49 Tipple et al. (1999).50 Data obtained from 43 randomly selected villa sites, supported by a small selection of architects’ designs
at the Faculty of Environment and Development Studies at UST.51 Tipple et al. (1999).52 Stakeholders’ Workshop, September, 2010.53 Land Administration Project (2010a; 2010b).54 This committee was made up of a ten members and comprised representatives from the (former single
function agency) Lands Commission, the Land Valuation Board, the Ministry of Local Government Rural Development, the Ministry of Food and Agriculture, the Ministry of Mines, and the Town and Country Planning Department.
55 Ministry of Lands Forestry and Mines (2008)56 See http://www.gipc.org.gh/land_bank.aspx.57 An estimated 50,000 acres (20,200 Ha) were acquired in Accra and other regional capitals though there
is doubt over the exact amount spent. 58 Town and Country Planning Ordinance, cap 84. 1945.59 Gough and Yankson (2000).60 Odame-Larbi (2006).61 Ghanaians traditionally refer to their land holdings by their contents rather than their boundaries.62 Ministry of Lands and Forestry (1999).63 Odame-Larbi (2006); In addition, Luginaah et al. (2010) found very high levels of stress about rent
advances in a qualitative study in Accra.64 Kasanga and Kotey (2001).65 Ministry of Lands and Forestry (2003).66 Farvacque-Vitkovic et al. (2008).67 Ministry of Lands and Forestry (1999).68 Ministry of Lands and Forestry (1999).69 Land Administration Project (2006).70 Land Administration Project (2006).71 Land Administration Project (2006).72 Farvacque-Vitkovic et al. (2008).73 Net densities include the areas of the residential plots and half the width of the surrounding roads. Gross
densities add the uses generally found close to residences including primary schools, clinics, local shops, incidental public open spaces, etc., but not major commercial and industrial areas, secondary schools and colleges, and major transportation routes. The profile has used a proportion of 0.6 to 1.0 between net densities and gross densities.
74 This assumes that they are occupied at the occupancy rate stipulated rather than as a single household dwelling.
75 Government of Ghana (2010).76 The housing sector profile assumes the 10 per hectare is meant to be for plots, i.e., houses, rather than
dwellings, which would include single rooms. This is an example of the ambiguity of definition within Ghana’s housing policy documents which is so damaging to clear policy-making. See Amole et al (1993) for a fuller discussion of this issue.
77 Government of Ghana (2010).78 JEAVCO Associates (2010).79 Amanor (1999: 32).80 Cited in Gough and Yankson (2000: 2488)81 Lands Commission Brochure.82 Sittie (2006).83 Land Administration Project (2010a).84 Land Administration Project (2010a).85 Land Title Registry brochure and interview with Mrs. Rebecca Sittie, Acting Director, Land Title Registry.86 Farvacque-Vitkovic et al. (2008).
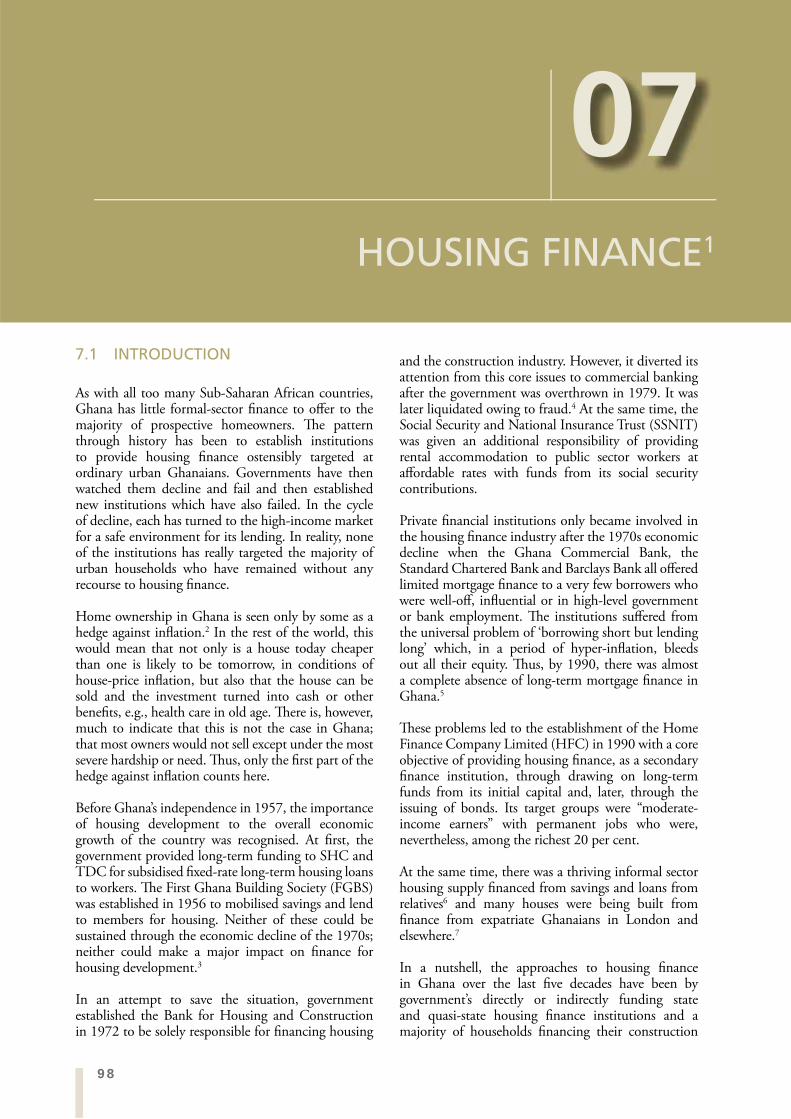
98
GHANA HOUSING PROFILE
and the construction industry. However, it diverted its attention from this core issues to commercial banking after the government was overthrown in 1979. It was later liquidated owing to fraud.4 At the same time, the Social Security and National Insurance Trust (SSNIT) was given an additional responsibility of providing rental accommodation to public sector workers at affordable rates with funds from its social security contributions.
Private financial institutions only became involved in the housing finance industry after the 1970s economic decline when the Ghana Commercial Bank, the Standard Chartered Bank and Barclays Bank all offered limited mortgage finance to a very few borrowers who were well-off, influential or in high-level government or bank employment. The institutions suffered from the universal problem of ‘borrowing short but lending long’ which, in a period of hyper-inflation, bleeds out all their equity. Thus, by 1990, there was almost a complete absence of long-term mortgage finance in Ghana.5
These problems led to the establishment of the Home Finance Company Limited (HFC) in 1990 with a core objective of providing housing finance, as a secondary finance institution, through drawing on long-term funds from its initial capital and, later, through the issuing of bonds. Its target groups were “moderate-income earners” with permanent jobs who were, nevertheless, among the richest 20 per cent.
At the same time, there was a thriving informal sector housing supply financed from savings and loans from relatives6 and many houses were being built from finance from expatriate Ghanaians in London and elsewhere.7
In a nutshell, the approaches to housing finance in Ghana over the last five decades have been by government’s directly or indirectly funding state and quasi-state housing finance institutions and a majority of households financing their construction
7.1 INTRODUCTION
As with all too many Sub-Saharan African countries, Ghana has little formal-sector finance to offer to the majority of prospective homeowners. The pattern through history has been to establish institutions to provide housing finance ostensibly targeted at ordinary urban Ghanaians. Governments have then watched them decline and fail and then established new institutions which have also failed. In the cycle of decline, each has turned to the high-income market for a safe environment for its lending. In reality, none of the institutions has really targeted the majority of urban households who have remained without any recourse to housing finance.
Home ownership in Ghana is seen only by some as a hedge against inflation.2 In the rest of the world, this would mean that not only is a house today cheaper than one is likely to be tomorrow, in conditions of house-price inflation, but also that the house can be sold and the investment turned into cash or other benefits, e.g., health care in old age. There is, however, much to indicate that this is not the case in Ghana; that most owners would not sell except under the most severe hardship or need. Thus, only the first part of the hedge against inflation counts here.
Before Ghana’s independence in 1957, the importance of housing development to the overall economic growth of the country was recognised. At first, the government provided long-term funding to SHC and TDC for subsidised fixed-rate long-term housing loans to workers. The First Ghana Building Society (FGBS) was established in 1956 to mobilised savings and lend to members for housing. Neither of these could be sustained through the economic decline of the 1970s; neither could make a major impact on finance for housing development.3
In an attempt to save the situation, government established the Bank for Housing and Construction in 1972 to be solely responsible for financing housing
07HOUSING FINANCE1
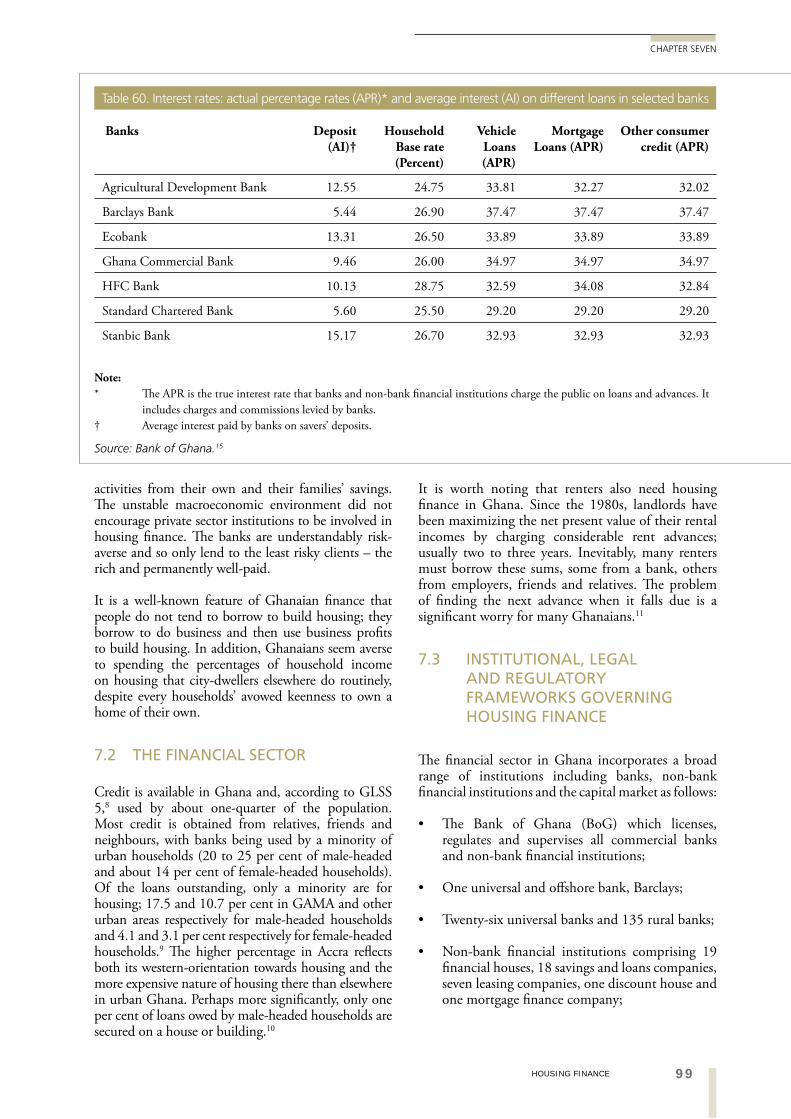
99HOUSING FINANCE
CHAPTER SEVEN
It is worth noting that renters also need housing finance in Ghana. Since the 1980s, landlords have been maximizing the net present value of their rental incomes by charging considerable rent advances; usually two to three years. Inevitably, many renters must borrow these sums, some from a bank, others from employers, friends and relatives. The problem of finding the next advance when it falls due is a significant worry for many Ghanaians.11
7.3 INSTITUTIONAL, LEGAL AND REGULATORY FRAMEWORKS GOVERNING HOUSING FINANCE
The financial sector in Ghana incorporates a broad range of institutions including banks, non-bank financial institutions and the capital market as follows:
The Bank of Ghana (BoG) which licenses, regulates and supervises all commercial banks and non-bank financial institutions;
One universal and offshore bank, Barclays;
Twenty-six universal banks and 135 rural banks;
Non-bank financial institutions comprising 19 financial houses, 18 savings and loans companies, seven leasing companies, one discount house and one mortgage finance company;
activities from their own and their families’ savings. The unstable macroeconomic environment did not encourage private sector institutions to be involved in housing finance. The banks are understandably risk-averse and so only lend to the least risky clients – the rich and permanently well-paid.
It is a well-known feature of Ghanaian finance that people do not tend to borrow to build housing; they borrow to do business and then use business profits to build housing. In addition, Ghanaians seem averse to spending the percentages of household income on housing that city-dwellers elsewhere do routinely, despite every households’ avowed keenness to own a home of their own.
7.2 THE FINANCIAL SECTOR
Credit is available in Ghana and, according to GLSS 5,8 used by about one-quarter of the population. Most credit is obtained from relatives, friends and neighbours, with banks being used by a minority of urban households (20 to 25 per cent of male-headed and about 14 per cent of female-headed households). Of the loans outstanding, only a minority are for housing; 17.5 and 10.7 per cent in GAMA and other urban areas respectively for male-headed households and 4.1 and 3.1 per cent respectively for female-headed households.9 The higher percentage in Accra reflects both its western-orientation towards housing and the more expensive nature of housing there than elsewhere in urban Ghana. Perhaps more significantly, only one per cent of loans owed by male-headed households are secured on a house or building.10
Banks Deposit (AI)†
Household Base rate (Percent)
Vehicle Loans (APR)
Mortgage Loans (APR)
Other consumer credit (APR)
Agricultural Development Bank 12.55 24.75 33.81 32.27 32.02
Barclays Bank 5.44 26.90 37.47 37.47 37.47
Ecobank 13.31 26.50 33.89 33.89 33.89
Ghana Commercial Bank 9.46 26.00 34.97 34.97 34.97
HFC Bank 10.13 28.75 32.59 34.08 32.84
Standard Chartered Bank 5.60 25.50 29.20 29.20 29.20
Stanbic Bank 15.17 26.70 32.93 32.93 32.93
Source: Bank of Ghana.15
Note:
* The APR is the true interest rate that banks and non-bank financial institutions charge the public on loans and advances. It includes charges and commissions levied by banks. † Average interest paid by banks on savers’ deposits.
Table 60. Interest rates: actual percentage rates (APR)* and average interest (AI) on different loans in selected banks
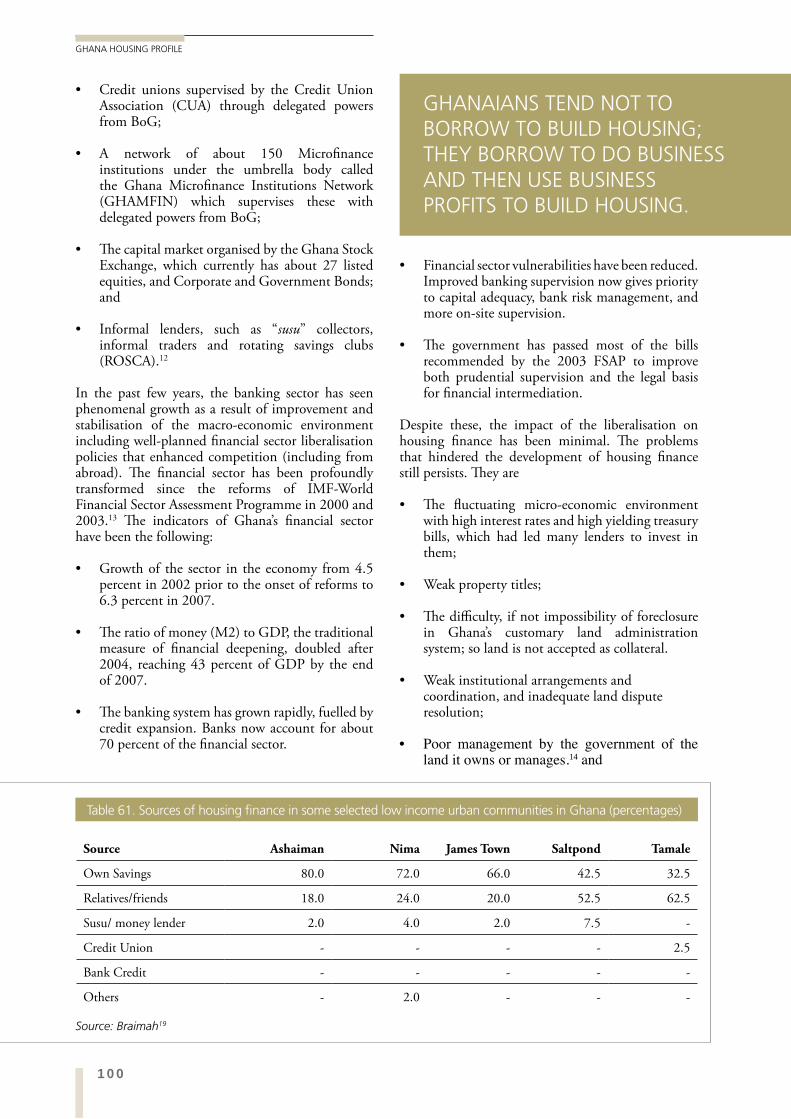
100
GHANA HOUSING PROFILE
Financial sector vulnerabilities have been reduced. Improved banking supervision now gives priority to capital adequacy, bank risk management, and more on-site supervision.
The government has passed most of the bills recommended by the 2003 FSAP to improve both prudential supervision and the legal basis for financial intermediation.
Despite these, the impact of the liberalisation on housing finance has been minimal. The problems that hindered the development of housing finance still persists. They are
The fluctuating micro-economic environment with high interest rates and high yielding treasury bills, which had led many lenders to invest in them;
Weak property titles;
The difficulty, if not impossibility of foreclosure in Ghana’s customary land administration system; so land is not accepted as collateral.
Weak institutional arrangements and coordination, and inadequate land dispute resolution;
14
Credit unions supervised by the Credit Union Association (CUA) through delegated powers from BoG;
A network of about 150 Microfinance institutions under the umbrella body called the Ghana Microfinance Institutions Network (GHAMFIN) which supervises these with delegated powers from BoG;
The capital market organised by the Ghana Stock Exchange, which currently has about 27 listed equities, and Corporate and Government Bonds; and
Informal lenders, such as “susu” collectors, informal traders and rotating savings clubs (ROSCA).12
In the past few years, the banking sector has seen phenomenal growth as a result of improvement and stabilisation of the macro-economic environment including well-planned financial sector liberalisation policies that enhanced competition (including from abroad). The financial sector has been profoundly transformed since the reforms of IMF-World Financial Sector Assessment Programme in 2000 and 2003.13 The indicators of Ghana’s financial sector have been the following:
Growth of the sector in the economy from 4.5 percent in 2002 prior to the onset of reforms to 6.3 percent in 2007.
The ratio of money (M2) to GDP, the traditional measure of financial deepening, doubled after 2004, reaching 43 percent of GDP by the end of 2007.
The banking system has grown rapidly, fuelled by credit expansion. Banks now account for about 70 percent of the financial sector.
Source: Braimah19
Source Ashaiman Nima James Town Saltpond Tamale
Own Savings 80.0 72.0 66.0 42.5 32.5
Relatives/friends 18.0 24.0 20.0 52.5 62.5
Susu/ money lender 2.0 4.0 2.0 7.5 -
Credit Union - - - - 2.5
Bank Credit - - - - -
Others - 2.0 - - -
Table 61. Sources of housing finance in some selected low income urban communities in Ghana (percentages)
GHANAIANS TEND NOT TO BORROW TO BUILD HOUSING; THEY BORROW TO DO BUSINESS AND THEN USE BUSINESS PROFITS TO BUILD HOUSING.
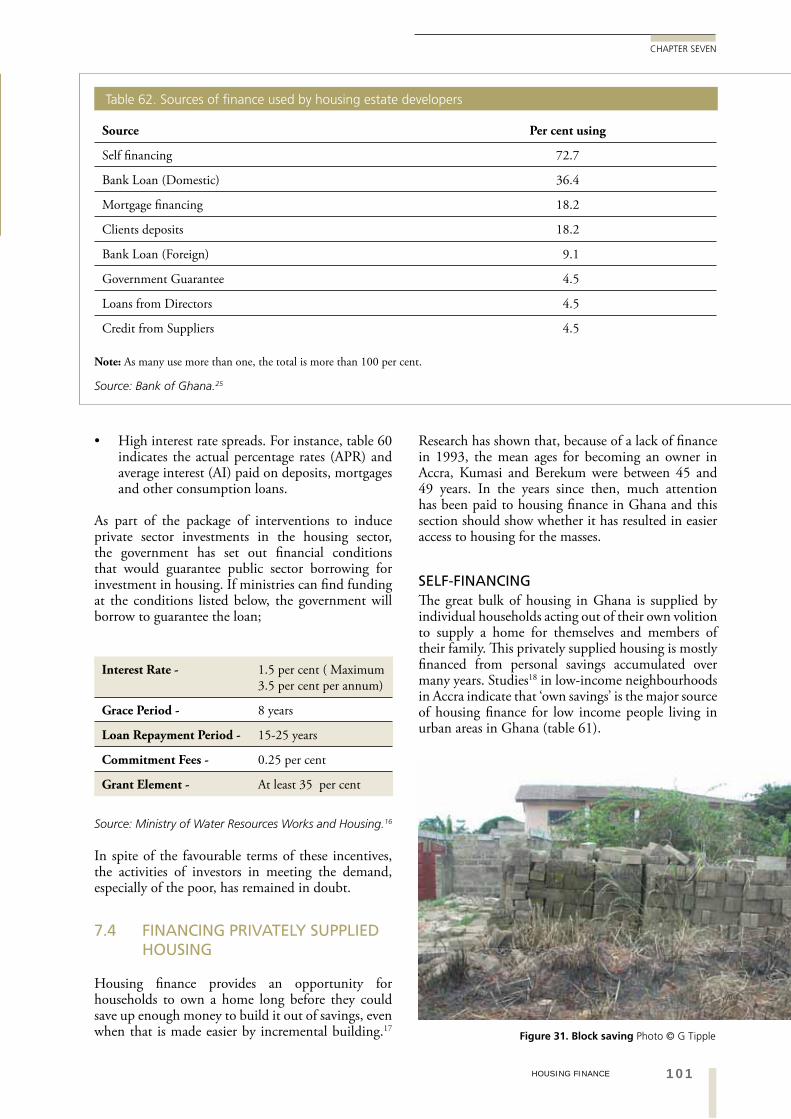
101HOUSING FINANCE
CHAPTER SEVEN
Research has shown that, because of a lack of finance in 1993, the mean ages for becoming an owner in Accra, Kumasi and Berekum were between 45 and 49 years. In the years since then, much attention has been paid to housing finance in Ghana and this section should show whether it has resulted in easier access to housing for the masses.
SELF-FINANCINGThe great bulk of housing in Ghana is supplied by individual households acting out of their own volition to supply a home for themselves and members of their family. This privately supplied housing is mostly financed from personal savings accumulated over many years. Studies18 in low-income neighbourhoods in Accra indicate that ‘own savings’ is the major source of housing finance for low income people living in urban areas in Ghana (table 61).
High interest rate spreads. For instance, table 60 indicates the actual percentage rates (APR) and average interest (AI) paid on deposits, mortgages and other consumption loans.
As part of the package of interventions to induce private sector investments in the housing sector, the government has set out financial conditions that would guarantee public sector borrowing for investment in housing. If ministries can find funding at the conditions listed below, the government will borrow to guarantee the loan;
Interest Rate - 1.5 per cent ( Maximum 3.5 per cent per annum)
Grace Period - 8 years
Loan Repayment Period - 15-25 years
Commitment Fees - 0.25 per cent
Grant Element - At least 35 per cent
Source: Ministry of Water Resources Works and Housing.16
In spite of the favourable terms of these incentives, the activities of investors in meeting the demand, especially of the poor, has remained in doubt.
7.4 FINANCING PRIVATELY SUPPLIED HOUSING
Housing finance provides an opportunity for households to own a home long before they could save up enough money to build it out of savings, even when that is made easier by incremental building.17
Source Per cent using
Self financing 72.7
Bank Loan (Domestic) 36.4
Mortgage financing 18.2
Clients deposits 18.2
Bank Loan (Foreign) 9.1
Government Guarantee 4.5
Loans from Directors 4.5
Credit from Suppliers 4.5
Source: Bank of Ghana.25
Note: As many use more than one, the total is more than 100 per cent.
Table 62. Sources of finance used by housing estate developers
Figure 31. Block saving Photo © G Tipple
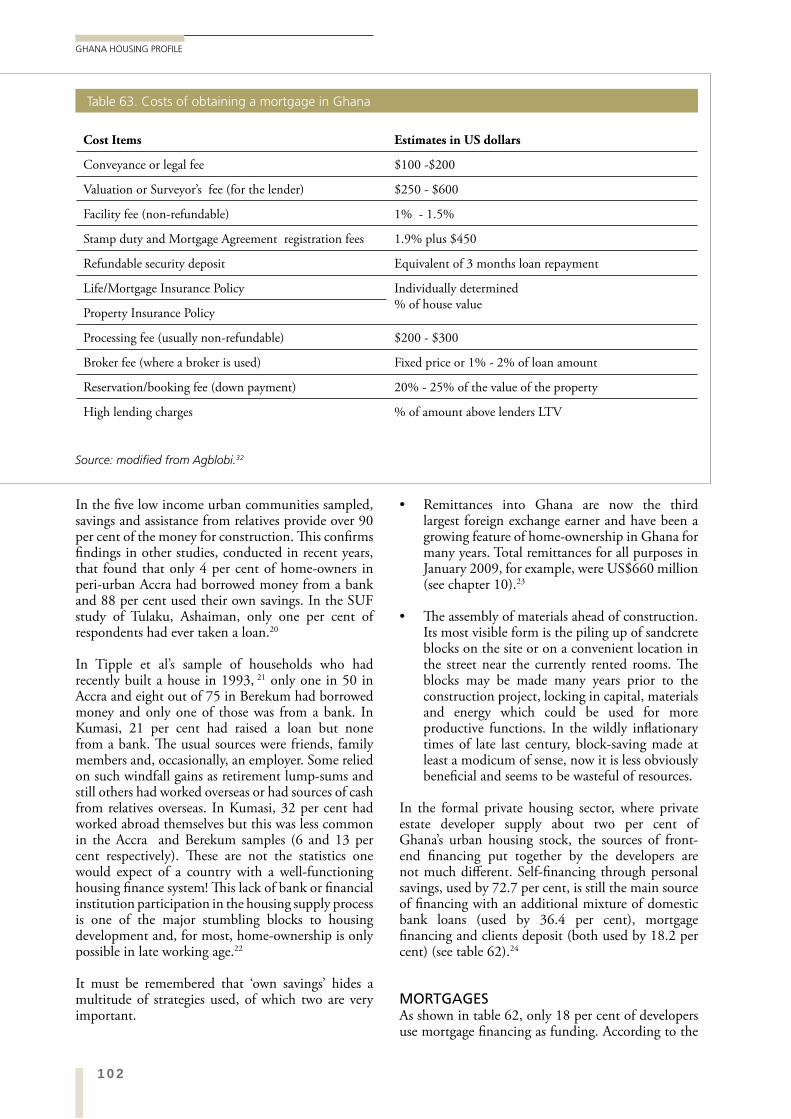
102
GHANA HOUSING PROFILE
Remittances into Ghana are now the third largest foreign exchange earner and have been a growing feature of home-ownership in Ghana for many years. Total remittances for all purposes in January 2009, for example, were US$660 million (see chapter 10).23
The assembly of materials ahead of construction. Its most visible form is the piling up of sandcrete blocks on the site or on a convenient location in the street near the currently rented rooms. The blocks may be made many years prior to the construction project, locking in capital, materials and energy which could be used for more productive functions. In the wildly inflationary times of late last century, block-saving made at least a modicum of sense, now it is less obviously beneficial and seems to be wasteful of resources.
In the formal private housing sector, where private estate developer supply about two per cent of Ghana’s urban housing stock, the sources of front-end financing put together by the developers are not much different. Self-financing through personal savings, used by 72.7 per cent, is still the main source of financing with an additional mixture of domestic bank loans (used by 36.4 per cent), mortgage financing and clients deposit (both used by 18.2 per cent) (see table 62).24
MORTGAGESAs shown in table 62, only 18 per cent of developers use mortgage financing as funding. According to the
In the five low income urban communities sampled, savings and assistance from relatives provide over 90 per cent of the money for construction. This confirms findings in other studies, conducted in recent years, that found that only 4 per cent of home-owners in peri-urban Accra had borrowed money from a bank and 88 per cent used their own savings. In the SUF study of Tulaku, Ashaiman, only one per cent of respondents had ever taken a loan.20
In Tipple et al’s sample of households who had recently built a house in 1993, 21 only one in 50 in Accra and eight out of 75 in Berekum had borrowed money and only one of those was from a bank. In Kumasi, 21 per cent had raised a loan but none from a bank. The usual sources were friends, family members and, occasionally, an employer. Some relied on such windfall gains as retirement lump-sums and still others had worked overseas or had sources of cash from relatives overseas. In Kumasi, 32 per cent had worked abroad themselves but this was less common in the Accra and Berekum samples (6 and 13 per cent respectively). These are not the statistics one would expect of a country with a well-functioning housing finance system! This lack of bank or financial institution participation in the housing supply process is one of the major stumbling blocks to housing development and, for most, home-ownership is only possible in late working age.22
It must be remembered that ‘own savings’ hides a multitude of strategies used, of which two are very important.
Source: modified from Agblobi.32
Cost Items Estimates in US dollars
Conveyance or legal fee $100 -$200
Valuation or Surveyor’s fee (for the lender) $250 - $600
Facility fee (non-refundable) 1% - 1.5%
Stamp duty and Mortgage Agreement registration fees 1.9% plus $450
Refundable security deposit Equivalent of 3 months loan repayment
Life/Mortgage Insurance Policy Individually determined% of house value
Property Insurance Policy
Processing fee (usually non-refundable) $200 - $300
Broker fee (where a broker is used) Fixed price or 1% - 2% of loan amount
Reservation/booking fee (down payment) 20% - 25% of the value of the property
High lending charges % of amount above lenders LTV
Table 63. Costs of obtaining a mortgage in Ghana
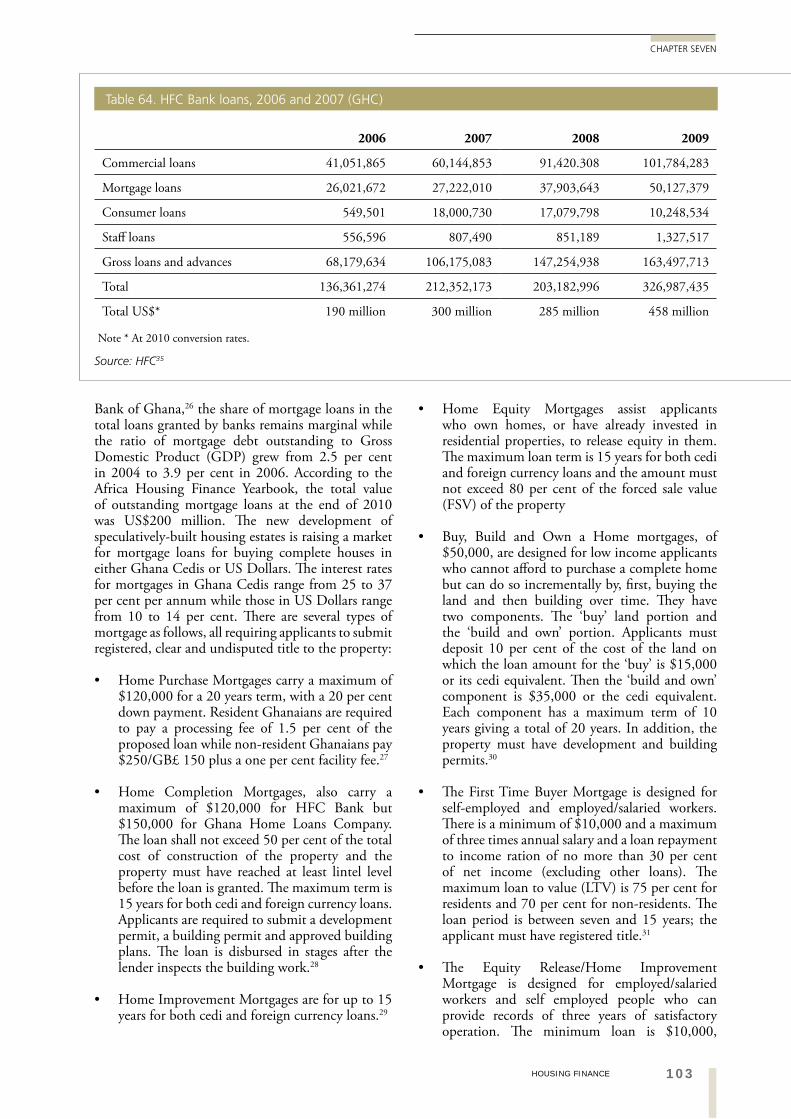
103HOUSING FINANCE
CHAPTER SEVEN
Home Equity Mortgages assist applicants who own homes, or have already invested in residential properties, to release equity in them. The maximum loan term is 15 years for both cedi and foreign currency loans and the amount must not exceed 80 per cent of the forced sale value (FSV) of the property
Buy, Build and Own a Home mortgages, of $50,000, are designed for low income applicants who cannot afford to purchase a complete home but can do so incrementally by, first, buying the land and then building over time. They have two components. The ‘buy’ land portion and the ‘build and own’ portion. Applicants must deposit 10 per cent of the cost of the land on which the loan amount for the ‘buy’ is $15,000 or its cedi equivalent. Then the ‘build and own’ component is $35,000 or the cedi equivalent. Each component has a maximum term of 10 years giving a total of 20 years. In addition, the property must have development and building permits.30
The First Time Buyer Mortgage is designed for self-employed and employed/salaried workers. There is a minimum of $10,000 and a maximum of three times annual salary and a loan repayment to income ration of no more than 30 per cent of net income (excluding other loans). The maximum loan to value (LTV) is 75 per cent for residents and 70 per cent for non-residents. The loan period is between seven and 15 years; the applicant must have registered title.31
The Equity Release/Home Improvement Mortgage is designed for employed/salaried workers and self employed people who can provide records of three years of satisfactory operation. The minimum loan is $10,000,
Bank of Ghana,26 the share of mortgage loans in the total loans granted by banks remains marginal while the ratio of mortgage debt outstanding to Gross Domestic Product (GDP) grew from 2.5 per cent in 2004 to 3.9 per cent in 2006. According to the Africa Housing Finance Yearbook, the total value of outstanding mortgage loans at the end of 2010 was US$200 million. The new development of speculatively-built housing estates is raising a market for mortgage loans for buying complete houses in either Ghana Cedis or US Dollars. The interest rates for mortgages in Ghana Cedis range from 25 to 37 per cent per annum while those in US Dollars range from 10 to 14 per cent. There are several types of mortgage as follows, all requiring applicants to submit registered, clear and undisputed title to the property:
Home Purchase Mortgages carry a maximum of $120,000 for a 20 years term, with a 20 per cent down payment. Resident Ghanaians are required to pay a processing fee of 1.5 per cent of the proposed loan while non-resident Ghanaians pay $250/GB£ 150 plus a one per cent facility fee.27
Home Completion Mortgages, also carry a maximum of $120,000 for HFC Bank but $150,000 for Ghana Home Loans Company. The loan shall not exceed 50 per cent of the total cost of construction of the property and the property must have reached at least lintel level before the loan is granted. The maximum term is 15 years for both cedi and foreign currency loans. Applicants are required to submit a development permit, a building permit and approved building plans. The loan is disbursed in stages after the lender inspects the building work.28
Home Improvement Mortgages are for up to 15 years for both cedi and foreign currency loans.29
2006 2007 2008 2009
Commercial loans 41,051,865 60,144,853 91,420.308 101,784,283
Mortgage loans 26,021,672 27,222,010 37,903,643 50,127,379
Consumer loans 549,501 18,000,730 17,079,798 10,248,534
Staff loans 556,596 807,490 851,189 1,327,517
Gross loans and advances 68,179,634 106,175,083 147,254,938 163,497,713
Total 136,361,274 212,352,173 203,182,996 326,987,435
Total US$* 190 million 300 million 285 million 458 million
Table 64. HFC Bank loans, 2006 and 2007 (GHC)
Source: HFC35
Note * At 2010 conversion rates.
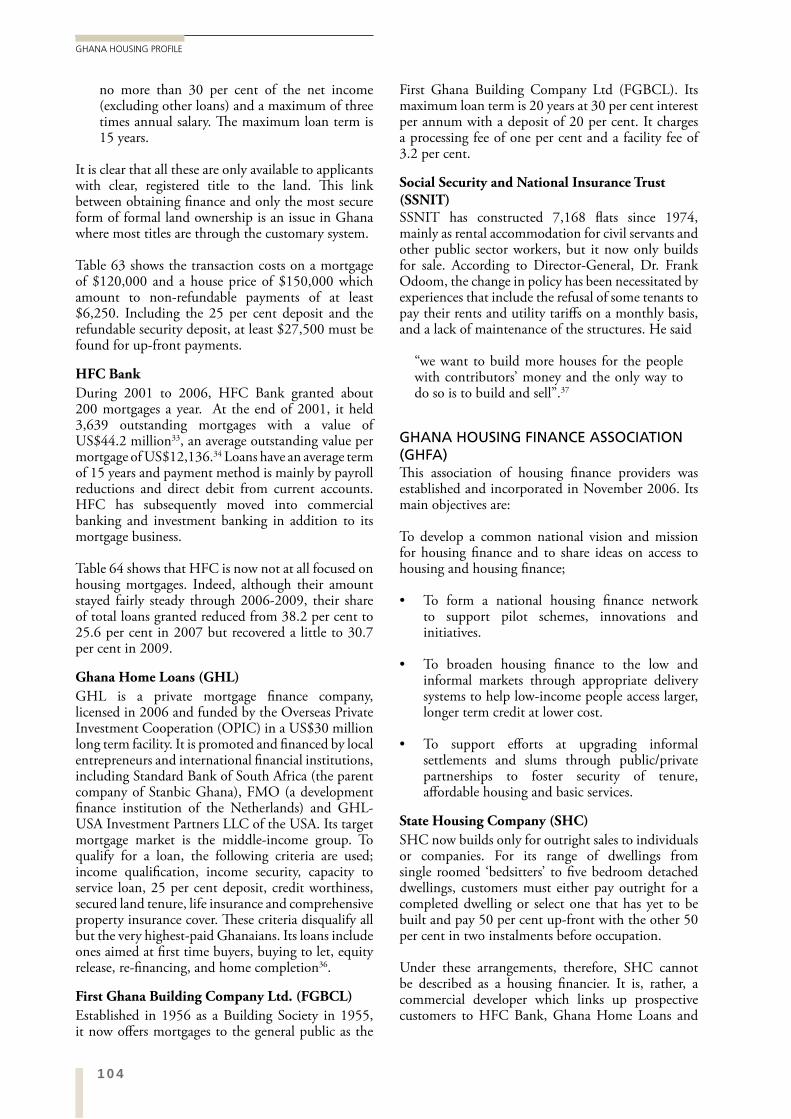
104
GHANA HOUSING PROFILE
First Ghana Building Company Ltd (FGBCL). Its maximum loan term is 20 years at 30 per cent interest per annum with a deposit of 20 per cent. It charges a processing fee of one per cent and a facility fee of 3.2 per cent.
Social Security and National Insurance Trust (SSNIT)SSNIT has constructed 7,168 flats since 1974, mainly as rental accommodation for civil servants and other public sector workers, but it now only builds for sale. According to Director-General, Dr. Frank Odoom, the change in policy has been necessitated by experiences that include the refusal of some tenants to pay their rents and utility tariffs on a monthly basis, and a lack of maintenance of the structures. He said
“we want to build more houses for the people with contributors’ money and the only way to do so is to build and sell”.37
GHANA HOUSING FINANCE ASSOCIATION (GHFA)This association of housing finance providers was established and incorporated in November 2006. Its main objectives are:
To develop a common national vision and mission for housing finance and to share ideas on access to housing and housing finance;
To form a national housing finance network to support pilot schemes, innovations and initiatives.
To broaden housing finance to the low and informal markets through appropriate delivery systems to help low-income people access larger, longer term credit at lower cost.
To support efforts at upgrading informal settlements and slums through public/private partnerships to foster security of tenure, affordable housing and basic services.
State Housing Company (SHC)
SHC now builds only for outright sales to individuals or companies. For its range of dwellings from single roomed ‘bedsitters’ to five bedroom detached dwellings, customers must either pay outright for a completed dwelling or select one that has yet to be built and pay 50 per cent up-front with the other 50 per cent in two instalments before occupation.
Under these arrangements, therefore, SHC cannot be described as a housing financier. It is, rather, a commercial developer which links up prospective customers to HFC Bank, Ghana Home Loans and
no more than 30 per cent of the net income (excluding other loans) and a maximum of three times annual salary. The maximum loan term is 15 years.
It is clear that all these are only available to applicants with clear, registered title to the land. This link between obtaining finance and only the most secure form of formal land ownership is an issue in Ghana where most titles are through the customary system.
Table 63 shows the transaction costs on a mortgage of $120,000 and a house price of $150,000 which amount to non-refundable payments of at least $6,250. Including the 25 per cent deposit and the refundable security deposit, at least $27,500 must be found for up-front payments.
HFC Bank
During 2001 to 2006, HFC Bank granted about 200 mortgages a year. At the end of 2001, it held 3,639 outstanding mortgages with a value of US$44.2 million33, an average outstanding value per mortgage of US$12,136.34 Loans have an average term of 15 years and payment method is mainly by payroll reductions and direct debit from current accounts. HFC has subsequently moved into commercial banking and investment banking in addition to its mortgage business.
Table 64 shows that HFC is now not at all focused on housing mortgages. Indeed, although their amount stayed fairly steady through 2006-2009, their share of total loans granted reduced from 38.2 per cent to 25.6 per cent in 2007 but recovered a little to 30.7 per cent in 2009.
Ghana Home Loans (GHL)
GHL is a private mortgage finance company, licensed in 2006 and funded by the Overseas Private Investment Cooperation (OPIC) in a US$30 million long term facility. It is promoted and financed by local entrepreneurs and international financial institutions, including Standard Bank of South Africa (the parent company of Stanbic Ghana), FMO (a development finance institution of the Netherlands) and GHL-USA Investment Partners LLC of the USA. Its target mortgage market is the middle-income group. To qualify for a loan, the following criteria are used; income qualification, income security, capacity to service loan, 25 per cent deposit, credit worthiness, secured land tenure, life insurance and comprehensive property insurance cover. These criteria disqualify all but the very highest-paid Ghanaians. Its loans include ones aimed at first time buyers, buying to let, equity release, re-financing, and home completion36.
First Ghana Building Company Ltd. (FGBCL)
Established in 1956 as a Building Society in 1955, it now offers mortgages to the general public as the
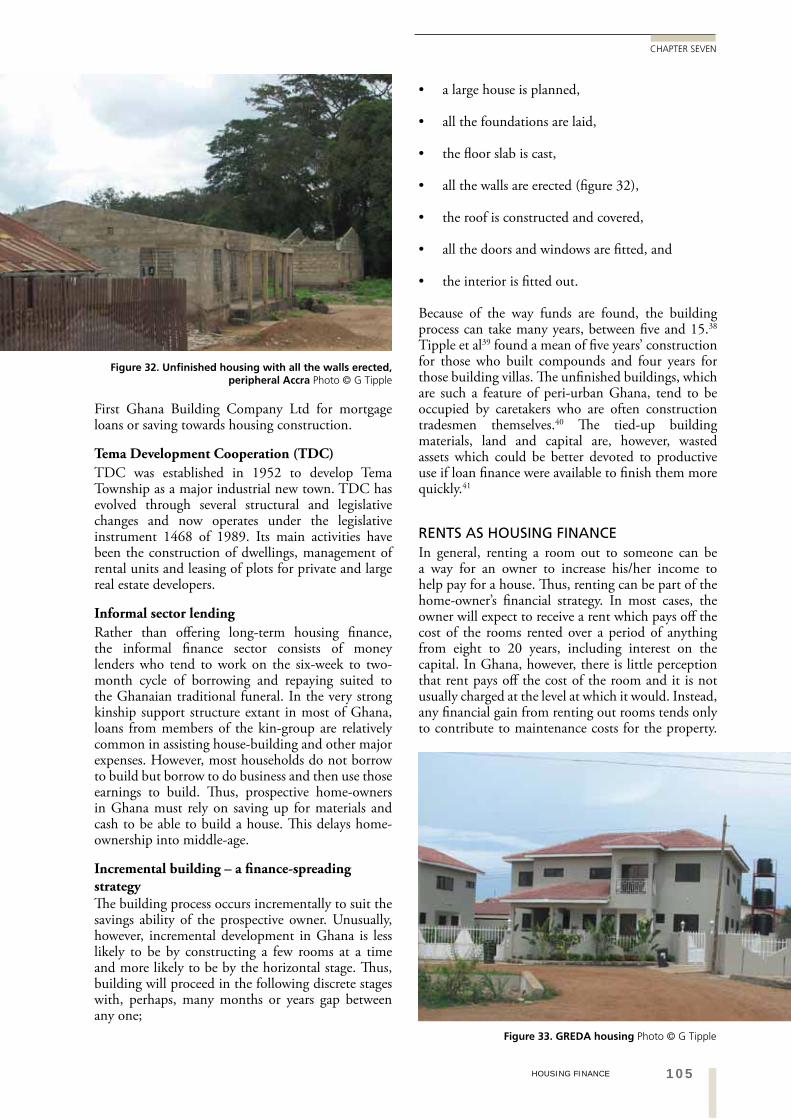
105HOUSING FINANCE
CHAPTER SEVEN
a large house is planned,
all the foundations are laid,
the floor slab is cast,
all the walls are erected (figure 32),
the roof is constructed and covered,
all the doors and windows are fitted, and
the interior is fitted out.
Because of the way funds are found, the building process can take many years, between five and 15.38 Tipple et al39 found a mean of five years’ construction for those who built compounds and four years for those building villas. The unfinished buildings, which are such a feature of peri-urban Ghana, tend to be occupied by caretakers who are often construction tradesmen themselves.40 The tied-up building materials, land and capital are, however, wasted assets which could be better devoted to productive use if loan finance were available to finish them more quickly.41
RENTS AS HOUSING FINANCEIn general, renting a room out to someone can be a way for an owner to increase his/her income to help pay for a house. Thus, renting can be part of the home-owner’s financial strategy. In most cases, the owner will expect to receive a rent which pays off the cost of the rooms rented over a period of anything from eight to 20 years, including interest on the capital. In Ghana, however, there is little perception that rent pays off the cost of the room and it is not usually charged at the level at which it would. Instead, any financial gain from renting out rooms tends only to contribute to maintenance costs for the property.
First Ghana Building Company Ltd for mortgage loans or saving towards housing construction.
Tema Development Cooperation (TDC)
TDC was established in 1952 to develop Tema Township as a major industrial new town. TDC has evolved through several structural and legislative changes and now operates under the legislative instrument 1468 of 1989. Its main activities have been the construction of dwellings, management of rental units and leasing of plots for private and large real estate developers.
Informal sector lending
Rather than offering long-term housing finance, the informal finance sector consists of money lenders who tend to work on the six-week to two-month cycle of borrowing and repaying suited to the Ghanaian traditional funeral. In the very strong kinship support structure extant in most of Ghana, loans from members of the kin-group are relatively common in assisting house-building and other major expenses. However, most households do not borrow to build but borrow to do business and then use those earnings to build. Thus, prospective home-owners in Ghana must rely on saving up for materials and cash to be able to build a house. This delays home-ownership into middle-age.
Incremental building – a finance-spreading strategyThe building process occurs incrementally to suit the savings ability of the prospective owner. Unusually, however, incremental development in Ghana is less likely to be by constructing a few rooms at a time and more likely to be by the horizontal stage. Thus, building will proceed in the following discrete stages with, perhaps, many months or years gap between any one;
Figure 32. Unfinished housing with all the walls erected, peripheral Accra Photo © G Tipple
Figure 33. GREDA housing Photo © G Tipple
106
GHANA HOUSING PROFILE
BUDGETARY ALLOCATIONS FOR HOUSINGBudgetary allocations for housing development are made as a percentage of the national budget allocated to the Ministry of Water Resources, Works and Housing (MWRWH) from the Medium Term Expenditure Framework (MTEF). According to the Deputy Director of Housing at the MWRWH, the annual housing budgetary allocation goes to specific areas of intervention, which are normally determined by the ministry and include the provision of infrastructure, building rental accommodation and development of middle and junior government staff bungalows. The budgetary allocation for housing improvement and development for 2010 include;
Facilitating the construction of 80,000 housing units for home ownership at the cost of GHC10,000,000 (US$703,000) – GHC125 or $88 each.
Keta Sea Defence Resettlement Programme43 - GHC500,000 (US$351,000)
Facilitate the upgrading of slums (UN-Habitat) - GHC50,000 (US$35,000).
The budgetary allocation to the Ministry for physical infrastructure (roads, water, electricity and drainage) on 10,000 acres of land for private sector housing was GHC2,255,500 (US$1,590,000), there was also an amount for the construction of 20,000 rental units at the cost of GHC5,000,000 (US$3,515,000) – GHC250 or $176 each. These are very unrealistic figures for the jobs in hand.
7.6 RESOURCE MOBILISATION AND SAVINGS SYSTEMS
MICROFINANCE INSTITUTIONSThere is a long tradition of microfinance in Ghanaian urban culture. The circulating savings groups called susu operate locally among people who know and trust each other. As with other Rotating Savings and Credit Associations (ROSCAs), the members save a set amount each day and at the end of the month one person is given the whole month’s money. They might decide this by lot, by rotation, or by special need.
Microfinance involves the provision of financial services and the management of small amounts of money and system of intermediary functions (housing micro loans, savings, insurance, money transfer services and other financial services) that are targeted to low income clients.44 Microfinance in Ghana has seen significant growth in terms of both number of institutions involved and volume of loans made.
Currently, there are three types of microfinance institutions in Ghana;
Since the onset of rent advances, landlords have an improved source of income with which to add rooms or carry out maintenance to increase the longevity of their houses. Income from renting, however, is not a substantial part of housing finance in urban Ghana even though renting is the predominant tenure form.
Renters as housing financiers
The one exception to renters not financing housing effectively is in the following phenomenon. In some cases, renters build their rooms onto a landlord’s house in return for the use of the room rent-free for a stated period of time. Both this and advances are solutions suited only to very financially-constrained housing supply systems and both demonstrate how deeply damaged is the housing supply process in urban Ghana.
7.5 HOUSING FUNDS AND GOVERNMENT SUBSIDIES
SUBSIDIES TO GREDAFrom 1987, the government instituted a number of measures as incentives to induce the formal private sector to invest in real estate. These have been maintained in their original form up to date and are made to members of GREDA. Subject to approval by Parliament, real estate investors are allowed
a tax moratorium of five years;
an exemption from the payment of import duties on materials, equipment and other supplies;
an exemption from the payment of rent and property rates on temporary structures and buildings erected on site for sole purposes of the residential development project;
to transfer, in any convertible currency;
o Dividends or net profit attributable to the investment.
o Payments in respect of loan servicing where a foreign loan has been obtained.
o Fees and charges in respect of any technology transfer agreement registered.
o The proceeds (net of all taxes and other obligations) in the event of sale or liquidation of the enterprise or any interest attributable to the investment.42
These represent a transfer of general tax income to developers who only benefit some of the very richest people in Ghana.
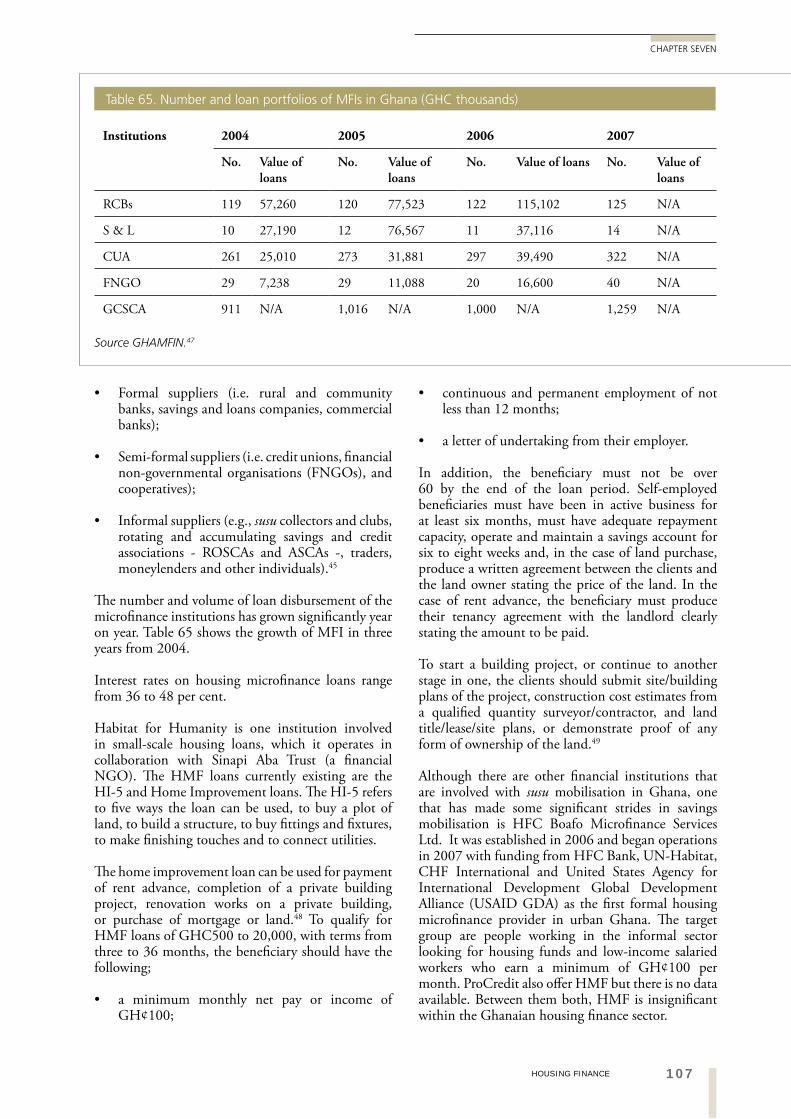
107HOUSING FINANCE
CHAPTER SEVEN
continuous and permanent employment of not less than 12 months;
a letter of undertaking from their employer.
In addition, the beneficiary must not be over 60 by the end of the loan period. Self-employed beneficiaries must have been in active business for at least six months, must have adequate repayment capacity, operate and maintain a savings account for six to eight weeks and, in the case of land purchase, produce a written agreement between the clients and the land owner stating the price of the land. In the case of rent advance, the beneficiary must produce their tenancy agreement with the landlord clearly stating the amount to be paid.
To start a building project, or continue to another stage in one, the clients should submit site/building plans of the project, construction cost estimates from a qualified quantity surveyor/contractor, and land title/lease/site plans, or demonstrate proof of any form of ownership of the land.49
Although there are other financial institutions that are involved with susu mobilisation in Ghana, one that has made some significant strides in savings mobilisation is HFC Boafo Microfinance Services Ltd. It was established in 2006 and began operations in 2007 with funding from HFC Bank, UN-Habitat, CHF International and United States Agency for International Development Global Development Alliance (USAID GDA) as the first formal housing microfinance provider in urban Ghana. The target group are people working in the informal sector looking for housing funds and low-income salaried workers who earn a minimum of GH¢100 per month. ProCredit also offer HMF but there is no data available. Between them both, HMF is insignificant within the Ghanaian housing finance sector.
Formal suppliers (i.e. rural and community banks, savings and loans companies, commercial banks);
Semi-formal suppliers (i.e. credit unions, financial non-governmental organisations (FNGOs), and cooperatives);
Informal suppliers (e.g., susu collectors and clubs, rotating and accumulating savings and credit associations - ROSCAs and ASCAs -, traders, moneylenders and other individuals).45
The number and volume of loan disbursement of the microfinance institutions has grown significantly year on year. Table 65 shows the growth of MFI in three years from 2004.
Interest rates on housing microfinance loans range from 36 to 48 per cent.
Habitat for Humanity is one institution involved in small-scale housing loans, which it operates in collaboration with Sinapi Aba Trust (a financial NGO). The HMF loans currently existing are the HI-5 and Home Improvement loans. The HI-5 refers to five ways the loan can be used, to buy a plot of land, to build a structure, to buy fittings and fixtures, to make finishing touches and to connect utilities.
The home improvement loan can be used for payment of rent advance, completion of a private building project, renovation works on a private building, or purchase of mortgage or land.48 To qualify for HMF loans of GHC500 to 20,000, with terms from three to 36 months, the beneficiary should have the following;
a minimum monthly net pay or income of GH¢100;
Institutions 2004 2005 2006 2007
No. Value of loans
No. Value of loans
No. Value of loans No. Value of loans
RCBs 119 57,260 120 77,523 122 115,102 125 N/A
S & L 10 27,190 12 76,567 11 37,116 14 N/A
CUA 261 25,010 273 31,881 297 39,490 322 N/A
FNGO 29 7,238 29 11,088 20 16,600 40 N/A
GCSCA 911 N/A 1,016 N/A 1,000 N/A 1,259 N/A
Table 65. Number and loan portfolios of MFIs in Ghana (GHC thousands)
Source GHAMFIN.47
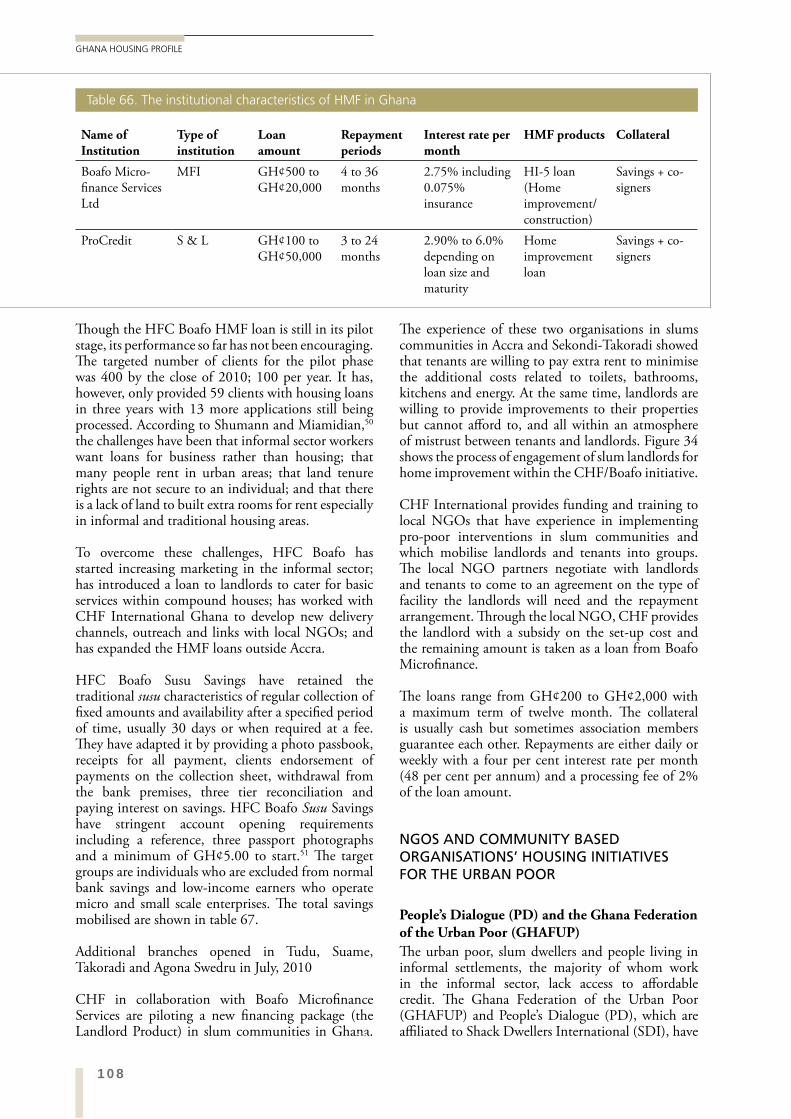
108
GHANA HOUSING PROFILE
The experience of these two organisations in slums communities in Accra and Sekondi-Takoradi showed that tenants are willing to pay extra rent to minimise the additional costs related to toilets, bathrooms, kitchens and energy. At the same time, landlords are willing to provide improvements to their properties but cannot afford to, and all within an atmosphere of mistrust between tenants and landlords. Figure 34 shows the process of engagement of slum landlords for home improvement within the CHF/Boafo initiative.
CHF International provides funding and training to local NGOs that have experience in implementing pro-poor interventions in slum communities and which mobilise landlords and tenants into groups. The local NGO partners negotiate with landlords and tenants to come to an agreement on the type of facility the landlords will need and the repayment arrangement. Through the local NGO, CHF provides the landlord with a subsidy on the set-up cost and the remaining amount is taken as a loan from Boafo Microfinance.
The loans range from GH¢200 to GH¢2,000 with a maximum term of twelve month. The collateral is usually cash but sometimes association members guarantee each other. Repayments are either daily or weekly with a four per cent interest rate per month (48 per cent per annum) and a processing fee of 2% of the loan amount.
NGOS AND COMMUNITY BASED ORGANISATIONS’ HOUSING INITIATIVES FOR THE URBAN POOR
People’s Dialogue (PD) and the Ghana Federation of the Urban Poor (GHAFUP)
The urban poor, slum dwellers and people living in informal settlements, the majority of whom work in the informal sector, lack access to affordable credit. The Ghana Federation of the Urban Poor (GHAFUP) and People’s Dialogue (PD), which are affiliated to Shack Dwellers International (SDI), have
Though the HFC Boafo HMF loan is still in its pilot stage, its performance so far has not been encouraging. The targeted number of clients for the pilot phase was 400 by the close of 2010; 100 per year. It has, however, only provided 59 clients with housing loans in three years with 13 more applications still being processed. According to Shumann and Miamidian,50 the challenges have been that informal sector workers want loans for business rather than housing; that many people rent in urban areas; that land tenure rights are not secure to an individual; and that there is a lack of land to built extra rooms for rent especially in informal and traditional housing areas.
To overcome these challenges, HFC Boafo has started increasing marketing in the informal sector; has introduced a loan to landlords to cater for basic services within compound houses; has worked with CHF International Ghana to develop new delivery channels, outreach and links with local NGOs; and has expanded the HMF loans outside Accra.
HFC Boafo Susu Savings have retained the traditional susu characteristics of regular collection of fixed amounts and availability after a specified period of time, usually 30 days or when required at a fee. They have adapted it by providing a photo passbook, receipts for all payment, clients endorsement of payments on the collection sheet, withdrawal from the bank premises, three tier reconciliation and paying interest on savings. HFC Boafo Susu Savings have stringent account opening requirements including a reference, three passport photographs and a minimum of GH¢5.00 to start.51 The target groups are individuals who are excluded from normal bank savings and low-income earners who operate micro and small scale enterprises. The total savings mobilised are shown in table 67.
Additional branches opened in Tudu, Suame, Takoradi and Agona Swedru in July, 2010
CHF in collaboration with Boafo Microfinance Services are piloting a new financing package (the Landlord Product) in slum communities in Ghana.
Name of Institution
Type of institution
Loan amount
Repayment periods
Interest rate per month
HMF products Collateral
Boafo Micro-finance Services Ltd
MFI GH¢500 to GH¢20,000
4 to 36 months
2.75% including 0.075% insurance
HI-5 loan (Home improvement/ construction)
Savings + co-signers
ProCredit S & L GH¢100 to GH¢50,000
3 to 24 months
2.90% to 6.0% depending on loan size and maturity
Home improvement loan
Savings + co-signers
Table 66. The institutional characteristics of HMF in Ghana
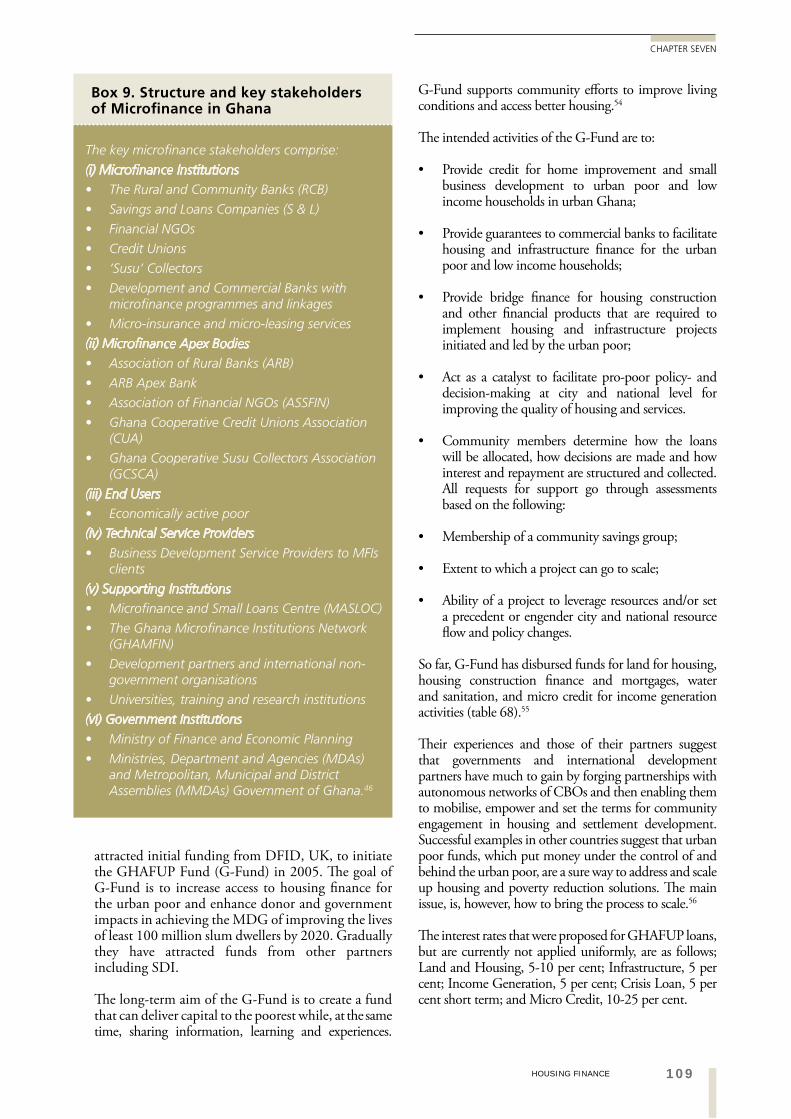
109HOUSING FINANCE
CHAPTER SEVEN
G-Fund supports community efforts to improve living conditions and access better housing.54
The intended activities of the G-Fund are to:
Provide credit for home improvement and small business development to urban poor and low income households in urban Ghana;
Provide guarantees to commercial banks to facilitate housing and infrastructure finance for the urban poor and low income households;
Provide bridge finance for housing construction and other financial products that are required to implement housing and infrastructure projects initiated and led by the urban poor;
Act as a catalyst to facilitate pro-poor policy- and decision-making at city and national level for improving the quality of housing and services.
Community members determine how the loans will be allocated, how decisions are made and how interest and repayment are structured and collected. All requests for support go through assessments based on the following:
Membership of a community savings group;
Extent to which a project can go to scale;
Ability of a project to leverage resources and/or set a precedent or engender city and national resource flow and policy changes.
So far, G-Fund has disbursed funds for land for housing, housing construction finance and mortgages, water and sanitation, and micro credit for income generation activities (table 68).55
Their experiences and those of their partners suggest that governments and international development partners have much to gain by forging partnerships with autonomous networks of CBOs and then enabling them to mobilise, empower and set the terms for community engagement in housing and settlement development. Successful examples in other countries suggest that urban poor funds, which put money under the control of and behind the urban poor, are a sure way to address and scale up housing and poverty reduction solutions. The main issue, is, however, how to bring the process to scale.56
The interest rates that were proposed for GHAFUP loans, but are currently not applied uniformly, are as follows; Land and Housing, 5-10 per cent; Infrastructure, 5 per cent; Income Generation, 5 per cent; Crisis Loan, 5 per cent short term; and Micro Credit, 10-25 per cent.
attracted initial funding from DFID, UK, to initiate the GHAFUP Fund (G-Fund) in 2005. The goal of G-Fund is to increase access to housing finance for the urban poor and enhance donor and government impacts in achieving the MDG of improving the lives of least 100 million slum dwellers by 2020. Gradually they have attracted funds from other partners including SDI.
The long-term aim of the G-Fund is to create a fund that can deliver capital to the poorest while, at the same time, sharing information, learning and experiences.
Box 9. Structure and key stakeholders of Microfinance in Ghana
The key microfinance stakeholders comprise:
(i) Microfinance Institutions
The Rural and Community Banks (RCB)
Savings and Loans Companies (S & L)
Financial NGOs
Credit Unions
‘Susu’ Collectors
Development and Commercial Banks with microfinance programmes and linkages
Micro-insurance and micro-leasing services
(ii) Microfinance Apex Bodies
Association of Rural Banks (ARB)
ARB Apex Bank
Association of Financial NGOs (ASSFIN)
Ghana Cooperative Credit Unions Association (CUA)
Ghana Cooperative Susu Collectors Association (GCSCA)
(iii) End Users
Economically active poor
(iv) Technical Service Providers
Business Development Service Providers to MFIs clients
(v) Supporting Institutions
Microfinance and Small Loans Centre (MASLOC)
The Ghana Microfinance Institutions Network (GHAMFIN)
Development partners and international non-government organisations
Universities, training and research institutions
(vi) Government Institutions
Ministry of Finance and Economic Planning
Ministries, Department and Agencies (MDAs) and Metropolitan, Municipal and District Assemblies (MMDAs) Government of Ghana.46
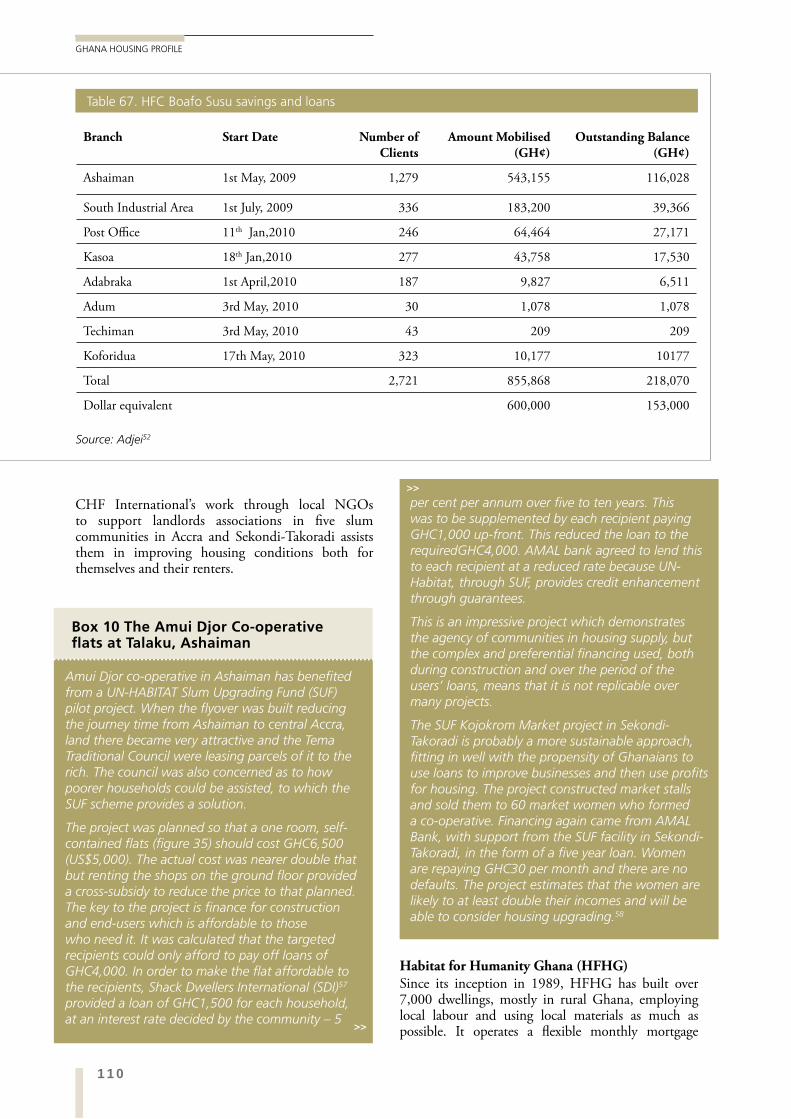
110
GHANA HOUSING PROFILE
Habitat for Humanity Ghana (HFHG)Since its inception in 1989, HFHG has built over 7,000 dwellings, mostly in rural Ghana, employing local labour and using local materials as much as possible. It operates a flexible monthly mortgage
CHF International’s work through local NGOs to support landlords associations in five slum communities in Accra and Sekondi-Takoradi assists them in improving housing conditions both for themselves and their renters.
Branch Start Date Number of Clients
Amount Mobilised (GH¢)
Outstanding Balance (GH¢)
Ashaiman 1st May, 2009 1,279 543,155 116,028
South Industrial Area 1st July, 2009 336 183,200 39,366
Post Office 11th Jan,2010 246 64,464 27,171
Kasoa 18th Jan,2010 277 43,758 17,530
Adabraka 1st April,2010 187 9,827 6,511
Adum 3rd May, 2010 30 1,078 1,078
Techiman 3rd May, 2010 43 209 209
Koforidua 17th May, 2010 323 10,177 10177
Total 2,721 855,868 218,070
Dollar equivalent 600,000 153,000
Table 67. HFC Boafo Susu savings and loans
Source: Adjei52
Box 10 The Amui Djor Co-operative flats at Talaku, Ashaiman
Amui Djor co-operative in Ashaiman has benefited from a UN-HABITAT Slum Upgrading Fund (SUF) pilot project. When the flyover was built reducing the journey time from Ashaiman to central Accra, land there became very attractive and the Tema Traditional Council were leasing parcels of it to the rich. The council was also concerned as to how poorer households could be assisted, to which the SUF scheme provides a solution.
The project was planned so that a one room, self-contained flats (figure 35) should cost GHC6,500 (US$5,000). The actual cost was nearer double that but renting the shops on the ground floor provided a cross-subsidy to reduce the price to that planned. The key to the project is finance for construction and end-users which is affordable to those who need it. It was calculated that the targeted recipients could only afford to pay off loans of GHC4,000. In order to make the flat affordable to the recipients, Shack Dwellers International (SDI)57 provided a loan of GHC1,500 for each household, at an interest rate decided by the community – 5
per cent per annum over five to ten years. This was to be supplemented by each recipient paying GHC1,000 up-front. This reduced the loan to the requiredGHC4,000. AMAL bank agreed to lend this to each recipient at a reduced rate because UN-Habitat, through SUF, provides credit enhancement through guarantees.
This is an impressive project which demonstrates the agency of communities in housing supply, but the complex and preferential financing used, both during construction and over the period of the users’ loans, means that it is not replicable over many projects.
The SUF Kojokrom Market project in Sekondi-Takoradi is probably a more sustainable approach, fitting in well with the propensity of Ghanaians to use loans to improve businesses and then use profits for housing. The project constructed market stalls and sold them to 60 market women who formed a co-operative. Financing again came from AMAL Bank, with support from the SUF facility in Sekondi-Takoradi, in the form of a five year loan. Women are repaying GHC30 per month and there are no defaults. The project estimates that the women are likely to at least double their incomes and will be able to consider housing upgrading.58
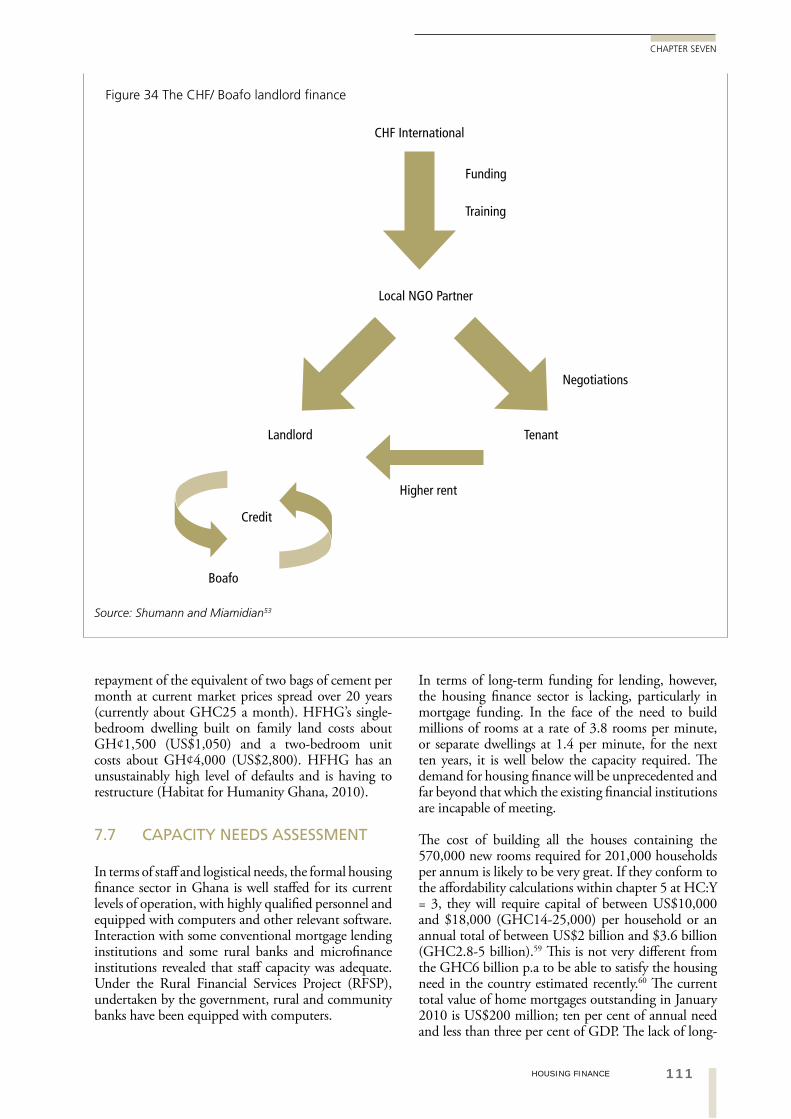
111HOUSING FINANCE
CHAPTER SEVEN
In terms of long-term funding for lending, however, the housing finance sector is lacking, particularly in mortgage funding. In the face of the need to build millions of rooms at a rate of 3.8 rooms per minute, or separate dwellings at 1.4 per minute, for the next ten years, it is well below the capacity required. The demand for housing finance will be unprecedented and far beyond that which the existing financial institutions are incapable of meeting.
The cost of building all the houses containing the 570,000 new rooms required for 201,000 households per annum is likely to be very great. If they conform to the affordability calculations within chapter 5 at HC:Y = 3, they will require capital of between US$10,000 and $18,000 (GHC14-25,000) per household or an annual total of between US$2 billion and $3.6 billion (GHC2.8-5 billion).59 This is not very different from the GHC6 billion p.a to be able to satisfy the housing need in the country estimated recently.60 The current total value of home mortgages outstanding in January 2010 is US$200 million; ten per cent of annual need and less than three per cent of GDP. The lack of long-
repayment of the equivalent of two bags of cement per month at current market prices spread over 20 years (currently about GHC25 a month). HFHG’s single-bedroom dwelling built on family land costs about GH¢1,500 (US$1,050) and a two-bedroom unit costs about GH¢4,000 (US$2,800). HFHG has an unsustainably high level of defaults and is having to restructure (Habitat for Humanity Ghana, 2010).
7.7 CAPACITY NEEDS ASSESSMENT
In terms of staff and logistical needs, the formal housing finance sector in Ghana is well staffed for its current levels of operation, with highly qualified personnel and equipped with computers and other relevant software. Interaction with some conventional mortgage lending institutions and some rural banks and microfinance institutions revealed that staff capacity was adequate. Under the Rural Financial Services Project (RFSP), undertaken by the government, rural and community banks have been equipped with computers.
CHF International
Funding
Training
Local NGO Partner
Higher rent
Credit
Boafo
Landlord Tenant
Negotiations
Source: Shumann and Miamidian53
Figure 34 The CHF/ Boafo landlord finance
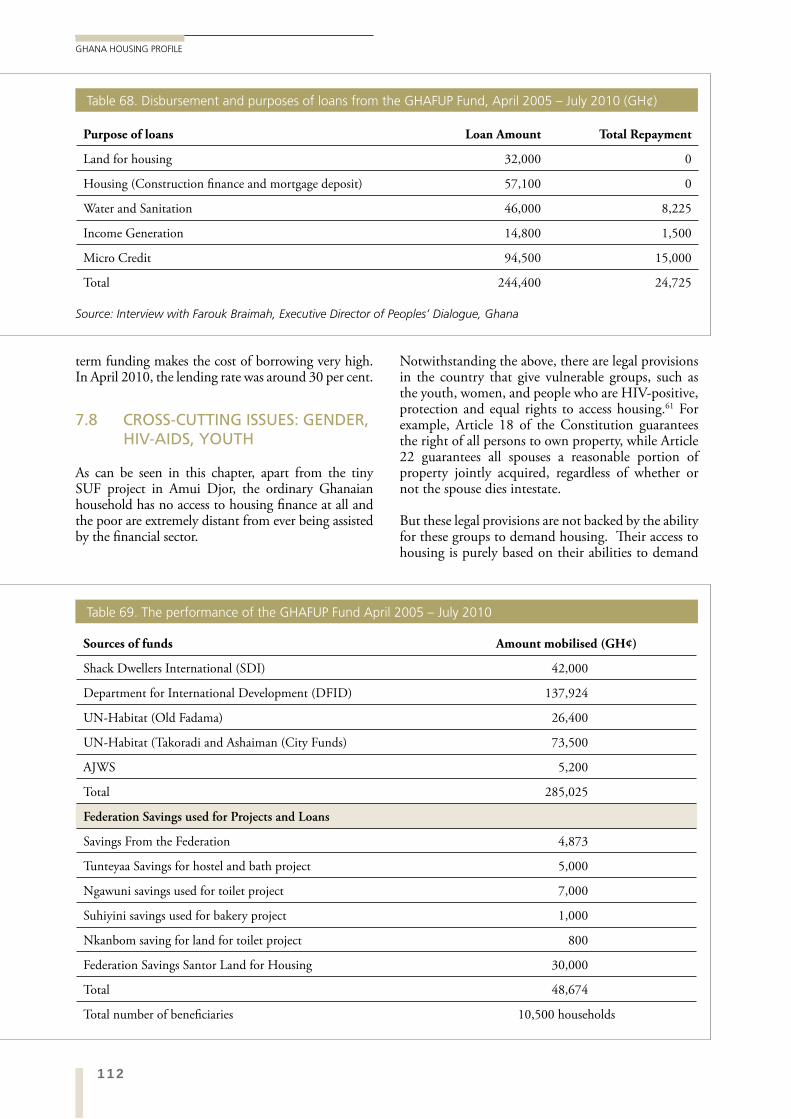
112
GHANA HOUSING PROFILE
Notwithstanding the above, there are legal provisions in the country that give vulnerable groups, such as the youth, women, and people who are HIV-positive, protection and equal rights to access housing.61 For example, Article 18 of the Constitution guarantees the right of all persons to own property, while Article 22 guarantees all spouses a reasonable portion of property jointly acquired, regardless of whether or not the spouse dies intestate.
But these legal provisions are not backed by the ability for these groups to demand housing. Their access to housing is purely based on their abilities to demand
term funding makes the cost of borrowing very high. In April 2010, the lending rate was around 30 per cent.
7.8 CROSS-CUTTING ISSUES: GENDER, HIV-AIDS, YOUTH
As can be seen in this chapter, apart from the tiny SUF project in Amui Djor, the ordinary Ghanaian household has no access to housing finance at all and the poor are extremely distant from ever being assisted by the financial sector.
Purpose of loans Loan Amount Total Repayment
Land for housing 32,000 0
Housing (Construction finance and mortgage deposit) 57,100 0
Water and Sanitation 46,000 8,225
Income Generation 14,800 1,500
Micro Credit 94,500 15,000
Total 244,400 24,725
Table 68. Disbursement and purposes of loans from the GHAFUP Fund, April 2005 – July 2010 (GH¢)
Source: Interview with Farouk Braimah, Executive Director of Peoples’ Dialogue, Ghana
Sources of funds Amount mobilised (GH¢)
Shack Dwellers International (SDI) 42,000
Department for International Development (DFID) 137,924
UN-Habitat (Old Fadama) 26,400
UN-Habitat (Takoradi and Ashaiman (City Funds) 73,500
AJWS 5,200
Total 285,025
Federation Savings used for Projects and Loans
Savings From the Federation 4,873
Tunteyaa Savings for hostel and bath project 5,000
Ngawuni savings used for toilet project 7,000
Suhiyini savings used for bakery project 1,000
Nkanbom saving for land for toilet project 800
Federation Savings Santor Land for Housing 30,000
Total 48,674
Total number of beneficiaries 10,500 households
Table 69. The performance of the GHAFUP Fund April 2005 – July 2010
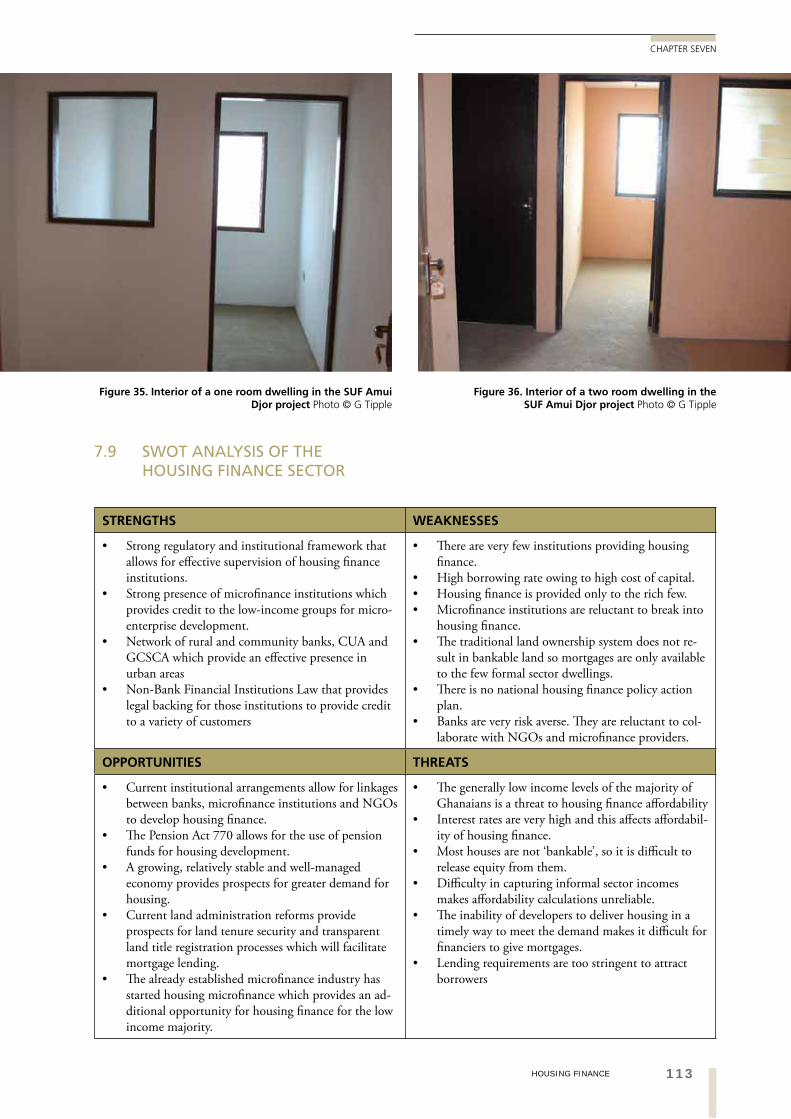
113HOUSING FINANCE
CHAPTER SEVEN
Figure 36. Interior of a two room dwelling in the SUF Amui Djor project Photo © G Tipple
Figure 35. Interior of a one room dwelling in the SUF Amui Djor project Photo © G Tipple
STRENGTHS WEAKNESSES
Strong regulatory and institutional framework that allows for effective supervision of housing finance institutions.Strong presence of microfinance institutions which provides credit to the low-income groups for micro-enterprise development.Network of rural and community banks, CUA and GCSCA which provide an effective presence in urban areasNon-Bank Financial Institutions Law that provides legal backing for those institutions to provide credit to a variety of customers
There are very few institutions providing housing finance.High borrowing rate owing to high cost of capital.Housing finance is provided only to the rich few.Microfinance institutions are reluctant to break into housing finance.The traditional land ownership system does not re-sult in bankable land so mortgages are only available to the few formal sector dwellings.There is no national housing finance policy action plan.Banks are very risk averse. They are reluctant to col-laborate with NGOs and microfinance providers.
OPPORTUNITIES THREATS
Current institutional arrangements allow for linkages between banks, microfinance institutions and NGOs to develop housing finance.The Pension Act 770 allows for the use of pension funds for housing development.A growing, relatively stable and well-managed economy provides prospects for greater demand for housing.Current land administration reforms provide prospects for land tenure security and transparent land title registration processes which will facilitate mortgage lending.The already established microfinance industry has started housing microfinance which provides an ad-ditional opportunity for housing finance for the low income majority.
The generally low income levels of the majority of Ghanaians is a threat to housing finance affordabilityInterest rates are very high and this affects affordabil-ity of housing finance.Most houses are not ‘bankable’, so it is difficult to release equity from them.Difficulty in capturing informal sector incomes makes affordability calculations unreliable.The inability of developers to deliver housing in a timely way to meet the demand makes it difficult for financiers to give mortgages.Lending requirements are too stringent to attract borrowers
7.9 SWOT ANALYSIS OF THE HOUSING FINANCE SECTOR
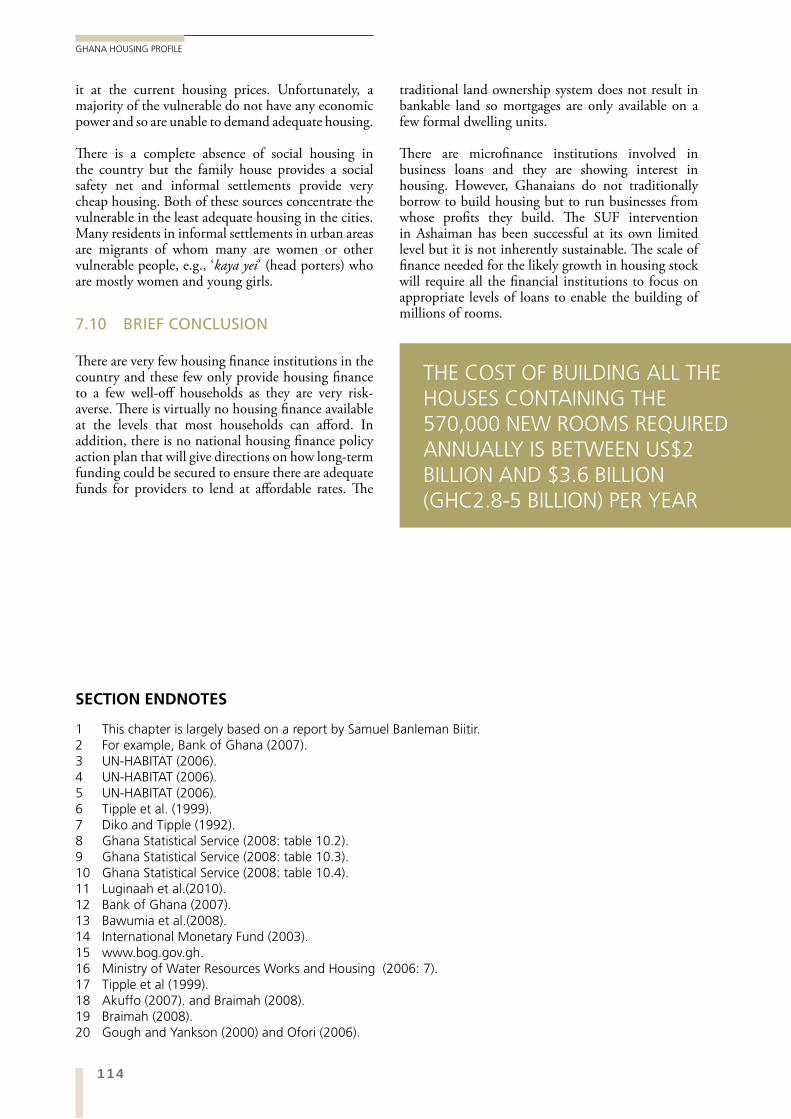
114
GHANA HOUSING PROFILE
traditional land ownership system does not result in bankable land so mortgages are only available on a few formal dwelling units.
There are microfinance institutions involved in business loans and they are showing interest in housing. However, Ghanaians do not traditionally borrow to build housing but to run businesses from whose profits they build. The SUF intervention in Ashaiman has been successful at its own limited level but it is not inherently sustainable. The scale of finance needed for the likely growth in housing stock will require all the financial institutions to focus on appropriate levels of loans to enable the building of millions of rooms.
it at the current housing prices. Unfortunately, a majority of the vulnerable do not have any economic power and so are unable to demand adequate housing.
There is a complete absence of social housing in the country but the family house provides a social safety net and informal settlements provide very cheap housing. Both of these sources concentrate the vulnerable in the least adequate housing in the cities. Many residents in informal settlements in urban areas are migrants of whom many are women or other vulnerable people, e.g., ‘kaya yei’ (head porters) who are mostly women and young girls.
7.10 BRIEF CONCLUSION
There are very few housing finance institutions in the country and these few only provide housing finance to a few well-off households as they are very risk-averse. There is virtually no housing finance available at the levels that most households can afford. In addition, there is no national housing finance policy action plan that will give directions on how long-term funding could be secured to ensure there are adequate funds for providers to lend at affordable rates. The
SECTION ENDNOTES
1 This chapter is largely based on a report by Samuel Banleman Biitir.2 For example, Bank of Ghana (2007).3 UN-HABITAT (2006).4 UN-HABITAT (2006).5 UN-HABITAT (2006).6 Tipple et al. (1999).7 Diko and Tipple (1992).8 Ghana Statistical Service (2008: table 10.2).9 Ghana Statistical Service (2008: table 10.3).10 Ghana Statistical Service (2008: table 10.4).11 Luginaah et al.(2010).12 Bank of Ghana (2007).13 Bawumia et al.(2008).14 International Monetary Fund (2003).15 www.bog.gov.gh.16 Ministry of Water Resources Works and Housing (2006: 7).17 Tipple et al (1999).18 Akuffo (2007). and Braimah (2008).19 Braimah (2008).20 Gough and Yankson (2000) and Ofori (2006).
THE COST OF BUILDING ALL THE HOUSES CONTAINING THE570,000 NEW ROOMS REQUIRED ANNUALLY IS BETWEEN US$2 BILLION AND $3.6 BILLION (GHC2.8-5 BILLION) PER YEAR
115HOUSING FINANCE
CHAPTER SEVEN
21 Tipple et al. (1999).22 Tipple et al.(1999).23 Obeng-Odoom (2010).24 Bank of Ghana (2007).25 Bank of Ghana (2007).26 Bank of Ghana (2007).27 HFC Bank Brochure.28 HFC Bank and Ghana Home Loans Brochures.29 HFC Bank Brochure.30 HFC Bank Brochure.31 Ghana Home Loans.32 Agblobi (2010).33 Bank of Ghana (2007).34 Mean value of these mortgages equals six times the 2001 GDP per capita.35 HFC website http://www.hfcbankgh.com/Files/Documents/HFC-annual-report--2009.aspx, accessed 14
October, (2010).36 http://www.ghanahomeloans.com/our-products/37 Okine (2010).38 Bank of Ghana (2007).39 Tipple et al (1999).40 Gough and Yankson (2010).41 Bank of Ghana (2007).42 Ministry of Water Resources Works and Housing (2006: 6). and interview with the Deputy Director of
Housing. 43 Keta, in the extreme south-east of the country, is a coastal town sited on a thin strip of land between the
sea and a lagoon. Its site has long been seriously threatened by the sea.44 Bank of Ghana (2007).45 Government of Ghana (2006).46 Government of Ghana (2006).47 GHAMFIN (2008).48 Biitir (2008).49 Biitir (2008).50 Shumann and Miamidian (2009).51 Adjei (2010).52 Adjei (2010).53 Shumann and Miamidian (2009).54 Interview with Farouk Braimah. (2010).55 Interview with Farouk Braimah. (2010).56 Interview with Farouk Braimah. (2010).57 Of which Ghana People’s Dialogue is a member.58 Personal communications, Farouk Braimah, Ghana People’s Dialogue, and Liz Case, UN-HABITAT.59 In comparison, according to the Bank of Ghana, remittances from overseas amounted to US$2.1 billion
in 2010.60 Centre for Affordable Housing Finance (2010).61 These include the 1992 Fourth Republican Constitution; Intestate Succession Law (PNDC Law 111,
1985 and its 1991 amendment); Administration of Estates (Amendment) Law (133, 1985); Land Title Registration Law (PNDC Law 152, 1985); Head of Family Accountability Law (114, 1985); National Land Policy; and Ghana Poverty Reduction Strategy Papers I & II.
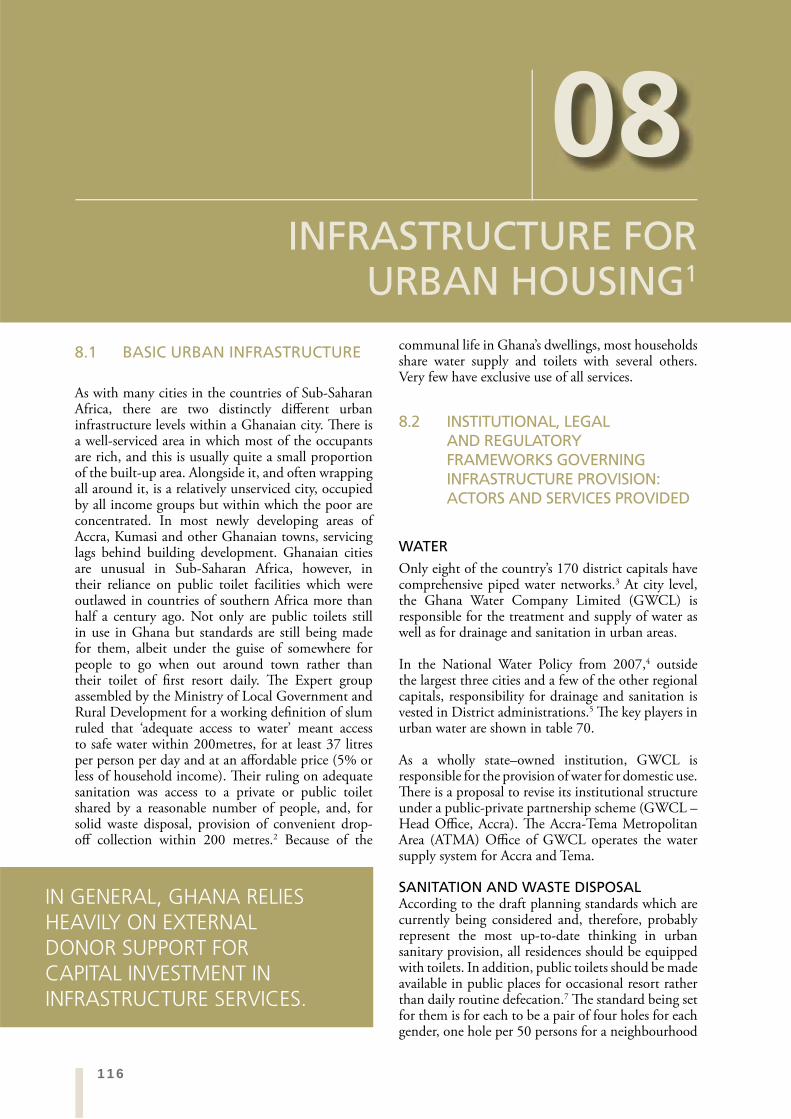
116
GHANA HOUSING PROFILE
communal life in Ghana’s dwellings, most households share water supply and toilets with several others. Very few have exclusive use of all services.
8.2 INSTITUTIONAL, LEGAL AND REGULATORY FRAMEWORKS GOVERNING INFRASTRUCTURE PROVISION: ACTORS AND SERVICES PROVIDED
WATER
Only eight of the country’s 170 district capitals have comprehensive piped water networks.3 At city level, the Ghana Water Company Limited (GWCL) is responsible for the treatment and supply of water as well as for drainage and sanitation in urban areas.
In the National Water Policy from 2007,4 outside the largest three cities and a few of the other regional capitals, responsibility for drainage and sanitation is vested in District administrations.5 The key players in urban water are shown in table 70.
As a wholly state–owned institution, GWCL is responsible for the provision of water for domestic use. There is a proposal to revise its institutional structure under a public-private partnership scheme (GWCL – Head Office, Accra). The Accra-Tema Metropolitan Area (ATMA) Office of GWCL operates the water supply system for Accra and Tema.
SANITATION AND WASTE DISPOSALAccording to the draft planning standards which are currently being considered and, therefore, probably represent the most up-to-date thinking in urban sanitary provision, all residences should be equipped with toilets. In addition, public toilets should be made available in public places for occasional resort rather than daily routine defecation.7 The standard being set for them is for each to be a pair of four holes for each gender, one hole per 50 persons for a neighbourhood
8.1 BASIC URBAN INFRASTRUCTURE
As with many cities in the countries of Sub-Saharan Africa, there are two distinctly different urban infrastructure levels within a Ghanaian city. There is a well-serviced area in which most of the occupants are rich, and this is usually quite a small proportion of the built-up area. Alongside it, and often wrapping all around it, is a relatively unserviced city, occupied by all income groups but within which the poor are concentrated. In most newly developing areas of Accra, Kumasi and other Ghanaian towns, servicing lags behind building development. Ghanaian cities are unusual in Sub-Saharan Africa, however, in their reliance on public toilet facilities which were outlawed in countries of southern Africa more than half a century ago. Not only are public toilets still in use in Ghana but standards are still being made for them, albeit under the guise of somewhere for people to go when out around town rather than their toilet of first resort daily. The Expert group assembled by the Ministry of Local Government and Rural Development for a working definition of slum ruled that ‘adequate access to water’ meant access to safe water within 200metres, for at least 37 litres per person per day and at an affordable price (5% or less of household income). Their ruling on adequate sanitation was access to a private or public toilet shared by a reasonable number of people, and, for solid waste disposal, provision of convenient drop-off collection within 200 metres.2 Because of the
08INFRASTRUCTURE FOR
URBAN HOUSING1
IN GENERAL, GHANA RELIES HEAVILY ON EXTERNAL DONOR SUPPORT FOR CAPITAL INVESTMENT IN INFRASTRUCTURE SERVICES.
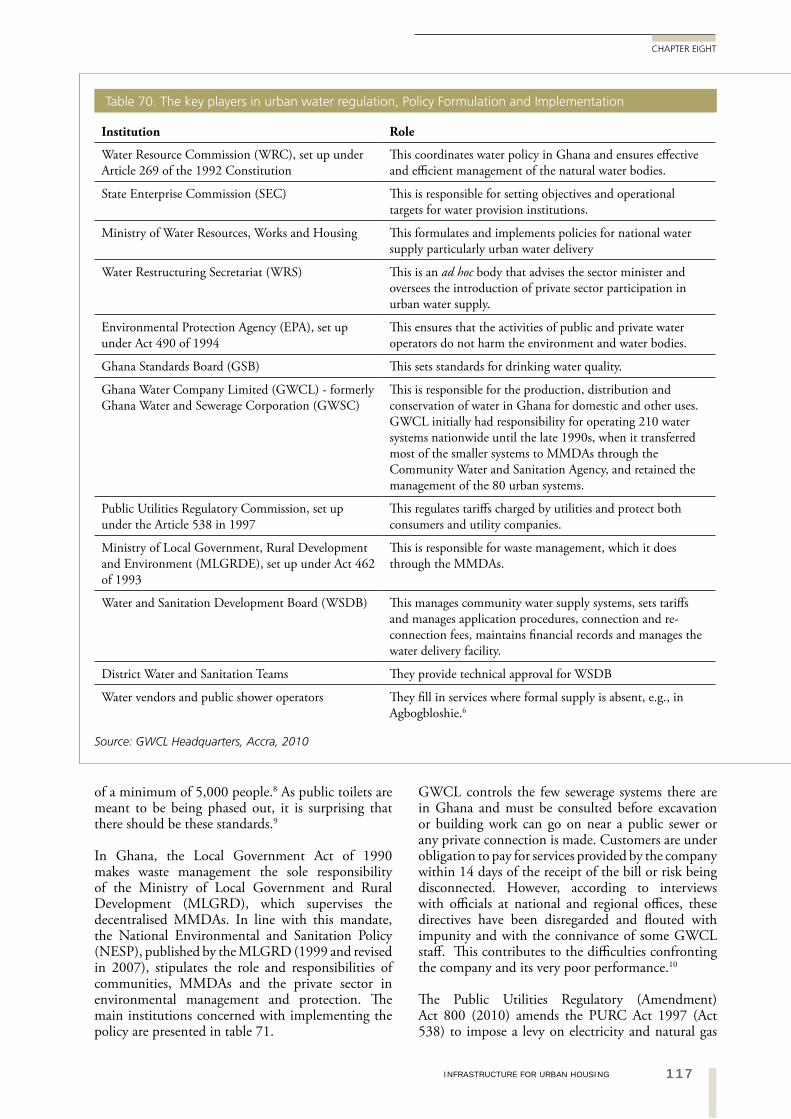
117INFRASTRUCTURE FOR URBAN HOUSING
CHAPTER EIGHT
Institution Role
Water Resource Commission (WRC), set up under Article 269 of the 1992 Constitution
This coordinates water policy in Ghana and ensures effective and efficient management of the natural water bodies.
State Enterprise Commission (SEC) This is responsible for setting objectives and operational targets for water provision institutions.
Ministry of Water Resources, Works and Housing This formulates and implements policies for national water supply particularly urban water delivery
Water Restructuring Secretariat (WRS) This is an ad hoc body that advises the sector minister and oversees the introduction of private sector participation in urban water supply.
Environmental Protection Agency (EPA), set up under Act 490 of 1994
This ensures that the activities of public and private water operators do not harm the environment and water bodies.
Ghana Standards Board (GSB) This sets standards for drinking water quality.
Ghana Water Company Limited (GWCL) - formerly Ghana Water and Sewerage Corporation (GWSC)
This is responsible for the production, distribution and conservation of water in Ghana for domestic and other uses. GWCL initially had responsibility for operating 210 water systems nationwide until the late 1990s, when it transferred most of the smaller systems to MMDAs through the Community Water and Sanitation Agency, and retained the management of the 80 urban systems.
Public Utilities Regulatory Commission, set up under the Article 538 in 1997
This regulates tariffs charged by utilities and protect both consumers and utility companies.
Ministry of Local Government, Rural Development and Environment (MLGRDE), set up under Act 462 of 1993
This is responsible for waste management, which it does through the MMDAs.
Water and Sanitation Development Board (WSDB) This manages community water supply systems, sets tariffs and manages application procedures, connection and re-connection fees, maintains financial records and manages the water delivery facility.
District Water and Sanitation Teams They provide technical approval for WSDB
Water vendors and public shower operators They fill in services where formal supply is absent, e.g., in Agbogbloshie.6
Source: GWCL Headquarters, Accra, 2010
Table 70. The key players in urban water regulation, Policy Formulation and Implementation
GWCL controls the few sewerage systems there are in Ghana and must be consulted before excavation or building work can go on near a public sewer or any private connection is made. Customers are under obligation to pay for services provided by the company within 14 days of the receipt of the bill or risk being disconnected. However, according to interviews with officials at national and regional offices, these directives have been disregarded and flouted with impunity and with the connivance of some GWCL staff. This contributes to the difficulties confronting the company and its very poor performance.10
The Public Utilities Regulatory (Amendment) Act 800 (2010) amends the PURC Act 1997 (Act 538) to impose a levy on electricity and natural gas
of a minimum of 5,000 people.8 As public toilets are meant to be being phased out, it is surprising that there should be these standards.9
In Ghana, the Local Government Act of 1990 makes waste management the sole responsibility of the Ministry of Local Government and Rural Development (MLGRD), which supervises the decentralised MMDAs. In line with this mandate, the National Environmental and Sanitation Policy (NESP), published by the MLGRD (1999 and revised in 2007), stipulates the role and responsibilities of communities, MMDAs and the private sector in environmental management and protection. The main institutions concerned with implementing the policy are presented in table 71.
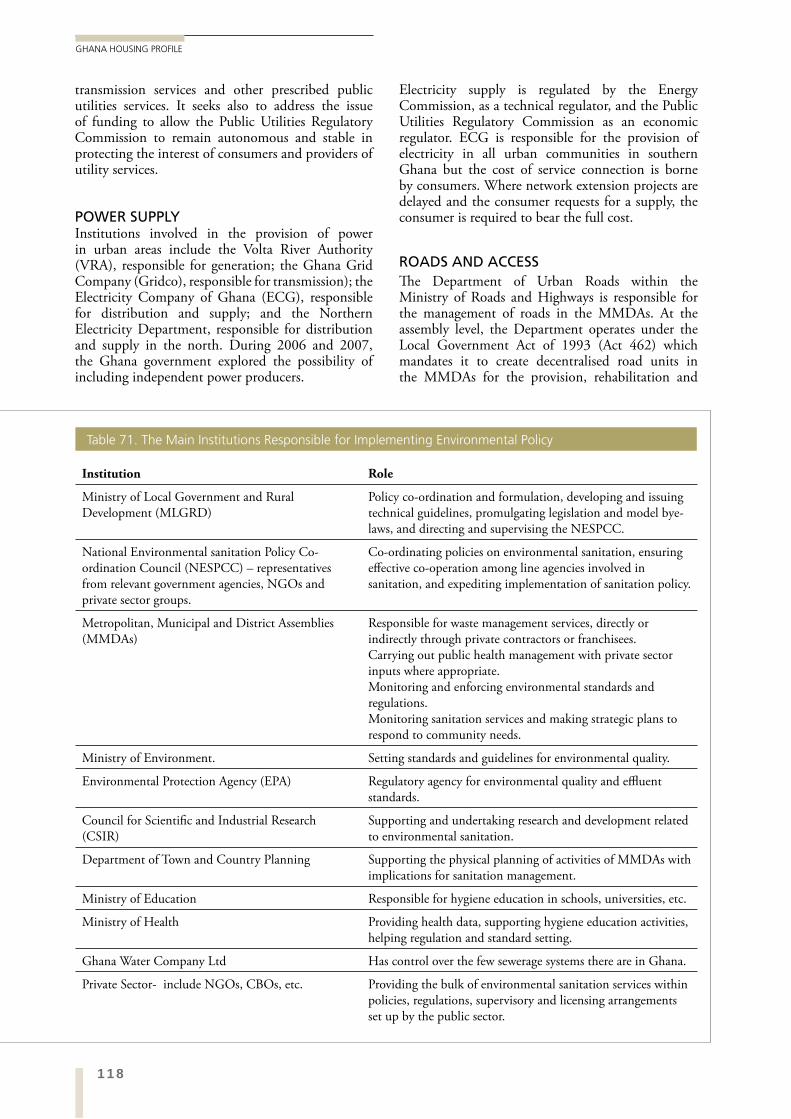
118
GHANA HOUSING PROFILE
Electricity supply is regulated by the Energy Commission, as a technical regulator, and the Public Utilities Regulatory Commission as an economic regulator. ECG is responsible for the provision of electricity in all urban communities in southern Ghana but the cost of service connection is borne by consumers. Where network extension projects are delayed and the consumer requests for a supply, the consumer is required to bear the full cost.
ROADS AND ACCESSThe Department of Urban Roads within the Ministry of Roads and Highways is responsible for the management of roads in the MMDAs. At the assembly level, the Department operates under the Local Government Act of 1993 (Act 462) which mandates it to create decentralised road units in the MMDAs for the provision, rehabilitation and
transmission services and other prescribed public utilities services. It seeks also to address the issue of funding to allow the Public Utilities Regulatory Commission to remain autonomous and stable in protecting the interest of consumers and providers of utility services.
POWER SUPPLYInstitutions involved in the provision of power in urban areas include the Volta River Authority (VRA), responsible for generation; the Ghana Grid Company (Gridco), responsible for transmission); the Electricity Company of Ghana (ECG), responsible for distribution and supply; and the Northern Electricity Department, responsible for distribution and supply in the north. During 2006 and 2007, the Ghana government explored the possibility of including independent power producers.
Institution Role
Ministry of Local Government and Rural Development (MLGRD)
Policy co-ordination and formulation, developing and issuing technical guidelines, promulgating legislation and model bye-laws, and directing and supervising the NESPCC.
National Environmental sanitation Policy Co-ordination Council (NESPCC) – representatives from relevant government agencies, NGOs and private sector groups.
Co-ordinating policies on environmental sanitation, ensuring effective co-operation among line agencies involved in sanitation, and expediting implementation of sanitation policy.
Metropolitan, Municipal and District Assemblies (MMDAs)
Responsible for waste management services, directly or indirectly through private contractors or franchisees.Carrying out public health management with private sector inputs where appropriate.Monitoring and enforcing environmental standards and regulations.Monitoring sanitation services and making strategic plans to respond to community needs.
Ministry of Environment. Setting standards and guidelines for environmental quality.
Environmental Protection Agency (EPA) Regulatory agency for environmental quality and effluent standards.
Council for Scientific and Industrial Research (CSIR)
Supporting and undertaking research and development related to environmental sanitation.
Department of Town and Country Planning Supporting the physical planning of activities of MMDAs with implications for sanitation management.
Ministry of Education Responsible for hygiene education in schools, universities, etc.
Ministry of Health Providing health data, supporting hygiene education activities, helping regulation and standard setting.
Ghana Water Company Ltd Has control over the few sewerage systems there are in Ghana.
Private Sector- include NGOs, CBOs, etc. Providing the bulk of environmental sanitation services within policies, regulations, supervisory and licensing arrangements set up by the public sector.
Table 71. The Main Institutions Responsible for Implementing Environmental Policy
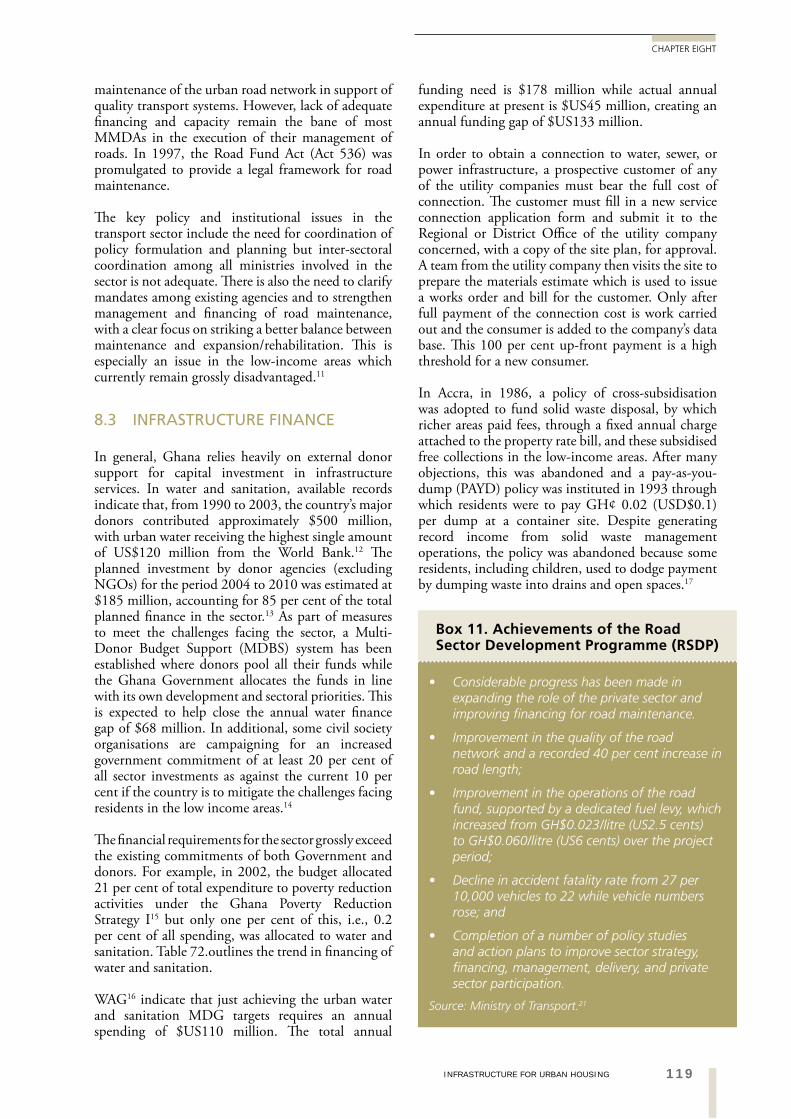
119INFRASTRUCTURE FOR URBAN HOUSING
CHAPTER EIGHT
funding need is $178 million while actual annual expenditure at present is $US45 million, creating an annual funding gap of $US133 million.
In order to obtain a connection to water, sewer, or power infrastructure, a prospective customer of any of the utility companies must bear the full cost of connection. The customer must fill in a new service connection application form and submit it to the Regional or District Office of the utility company concerned, with a copy of the site plan, for approval. A team from the utility company then visits the site to prepare the materials estimate which is used to issue a works order and bill for the customer. Only after full payment of the connection cost is work carried out and the consumer is added to the company’s data base. This 100 per cent up-front payment is a high threshold for a new consumer.
In Accra, in 1986, a policy of cross-subsidisation was adopted to fund solid waste disposal, by which richer areas paid fees, through a fixed annual charge attached to the property rate bill, and these subsidised free collections in the low-income areas. After many objections, this was abandoned and a pay-as-you-dump (PAYD) policy was instituted in 1993 through which residents were to pay GH¢ 0.02 (USD$0.1) per dump at a container site. Despite generating record income from solid waste management operations, the policy was abandoned because some residents, including children, used to dodge payment by dumping waste into drains and open spaces.17
maintenance of the urban road network in support of quality transport systems. However, lack of adequate financing and capacity remain the bane of most MMDAs in the execution of their management of roads. In 1997, the Road Fund Act (Act 536) was promulgated to provide a legal framework for road maintenance.
The key policy and institutional issues in the transport sector include the need for coordination of policy formulation and planning but inter-sectoral coordination among all ministries involved in the sector is not adequate. There is also the need to clarify mandates among existing agencies and to strengthen management and financing of road maintenance, with a clear focus on striking a better balance between maintenance and expansion/rehabilitation. This is especially an issue in the low-income areas which currently remain grossly disadvantaged.11
8.3 INFRASTRUCTURE FINANCE
In general, Ghana relies heavily on external donor support for capital investment in infrastructure services. In water and sanitation, available records indicate that, from 1990 to 2003, the country’s major donors contributed approximately $500 million, with urban water receiving the highest single amount of US$120 million from the World Bank.12 The planned investment by donor agencies (excluding NGOs) for the period 2004 to 2010 was estimated at $185 million, accounting for 85 per cent of the total planned finance in the sector.13 As part of measures to meet the challenges facing the sector, a Multi-Donor Budget Support (MDBS) system has been established where donors pool all their funds while the Ghana Government allocates the funds in line with its own development and sectoral priorities. This is expected to help close the annual water finance gap of $68 million. In additional, some civil society organisations are campaigning for an increased government commitment of at least 20 per cent of all sector investments as against the current 10 per cent if the country is to mitigate the challenges facing residents in the low income areas.14
The financial requirements for the sector grossly exceed the existing commitments of both Government and donors. For example, in 2002, the budget allocated 21 per cent of total expenditure to poverty reduction activities under the Ghana Poverty Reduction Strategy I15 but only one per cent of this, i.e., 0.2 per cent of all spending, was allocated to water and sanitation. Table 72.outlines the trend in financing of water and sanitation.
WAG16 indicate that just achieving the urban water and sanitation MDG targets requires an annual spending of $US110 million. The total annual
Box 11. Achievements of the Road Sector Development Programme (RSDP)
Considerable progress has been made in expanding the role of the private sector and improving financing for road maintenance.
Improvement in the quality of the road network and a recorded 40 per cent increase in road length;
Improvement in the operations of the road fund, supported by a dedicated fuel levy, which increased from GH$0.023/litre (US2.5 cents) to GH$0.060/litre (US6 cents) over the project period;
Decline in accident fatality rate from 27 per 10,000 vehicles to 22 while vehicle numbers rose; and
Completion of a number of policy studies and action plans to improve sector strategy, financing, management, delivery, and private sector participation.
Source: Ministry of Transport.21
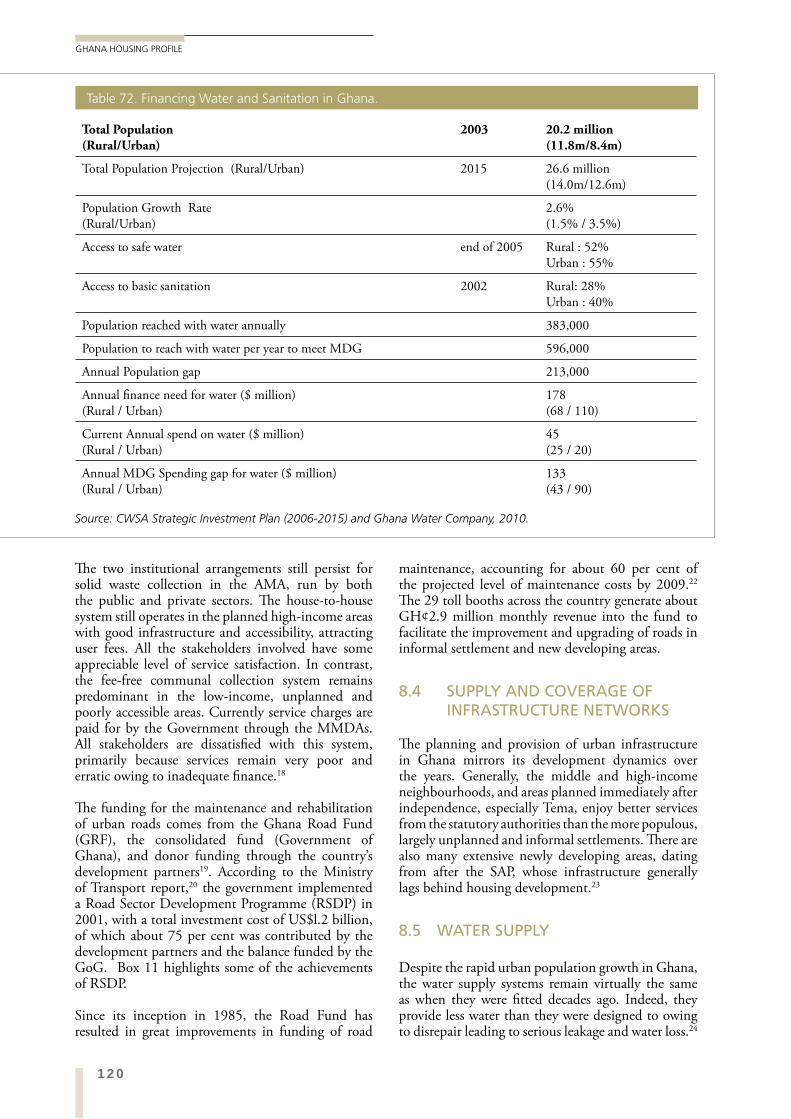
120
GHANA HOUSING PROFILE
maintenance, accounting for about 60 per cent of the projected level of maintenance costs by 2009.22
The 29 toll booths across the country generate about GH¢2.9 million monthly revenue into the fund to facilitate the improvement and upgrading of roads in informal settlement and new developing areas.
8.4 SUPPLY AND COVERAGE OF INFRASTRUCTURE NETWORKS
The planning and provision of urban infrastructure in Ghana mirrors its development dynamics over the years. Generally, the middle and high-income neighbourhoods, and areas planned immediately after independence, especially Tema, enjoy better services from the statutory authorities than the more populous, largely unplanned and informal settlements. There are also many extensive newly developing areas, dating from after the SAP, whose infrastructure generally lags behind housing development.23
8.5 WATER SUPPLY
Despite the rapid urban population growth in Ghana, the water supply systems remain virtually the same as when they were fitted decades ago. Indeed, they provide less water than they were designed to owing to disrepair leading to serious leakage and water loss.24
The two institutional arrangements still persist for solid waste collection in the AMA, run by both the public and private sectors. The house-to-house system still operates in the planned high-income areas with good infrastructure and accessibility, attracting user fees. All the stakeholders involved have some appreciable level of service satisfaction. In contrast, the fee-free communal collection system remains predominant in the low-income, unplanned and poorly accessible areas. Currently service charges are paid for by the Government through the MMDAs. All stakeholders are dissatisfied with this system, primarily because services remain very poor and erratic owing to inadequate finance.18
The funding for the maintenance and rehabilitation of urban roads comes from the Ghana Road Fund (GRF), the consolidated fund (Government of Ghana), and donor funding through the country’s development partners19. According to the Ministry of Transport report,20 the government implemented a Road Sector Development Programme (RSDP) in 2001, with a total investment cost of US$l.2 billion, of which about 75 per cent was contributed by the development partners and the balance funded by the GoG. Box 11 highlights some of the achievements of RSDP.
Since its inception in 1985, the Road Fund has resulted in great improvements in funding of road
Total Population (Rural/Urban)
2003 20.2 million (11.8m/8.4m)
Total Population Projection (Rural/Urban) 2015 26.6 million (14.0m/12.6m)
Population Growth Rate (Rural/Urban)
2.6% (1.5% / 3.5%)
Access to safe water end of 2005 Rural : 52% Urban : 55%
Access to basic sanitation 2002 Rural: 28% Urban : 40%
Population reached with water annually 383,000
Population to reach with water per year to meet MDG 596,000
Annual Population gap 213,000
Annual finance need for water ($ million)(Rural / Urban)
178(68 / 110)
Current Annual spend on water ($ million) (Rural / Urban)
45(25 / 20)
Annual MDG Spending gap for water ($ million) (Rural / Urban)
133(43 / 90)
Source: CWSA Strategic Investment Plan (2006-2015) and Ghana Water Company, 2010.
Table 72. Financing Water and Sanitation in Ghana.
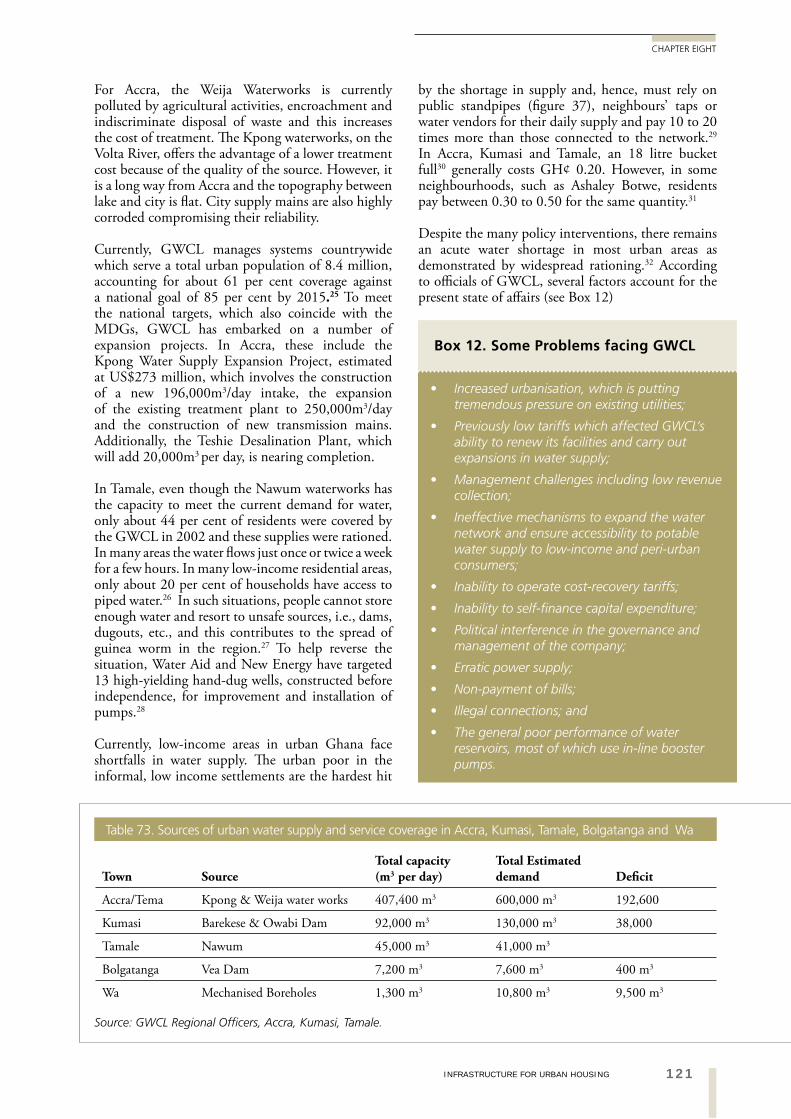
121INFRASTRUCTURE FOR URBAN HOUSING
CHAPTER EIGHT
by the shortage in supply and, hence, must rely on public standpipes (figure 37), neighbours’ taps or water vendors for their daily supply and pay 10 to 20 times more than those connected to the network.29
In Accra, Kumasi and Tamale, an 18 litre bucket full30 generally costs GH¢ 0.20. However, in some neighbourhoods, such as Ashaley Botwe, residents pay between 0.30 to 0.50 for the same quantity.31
Despite the many policy interventions, there remains an acute water shortage in most urban areas as demonstrated by widespread rationing.32 According to officials of GWCL, several factors account for the present state of affairs (see Box 12)
For Accra, the Weija Waterworks is currently polluted by agricultural activities, encroachment and indiscriminate disposal of waste and this increases the cost of treatment. The Kpong waterworks, on the Volta River, offers the advantage of a lower treatment cost because of the quality of the source. However, it is a long way from Accra and the topography between lake and city is flat. City supply mains are also highly corroded compromising their reliability.
Currently, GWCL manages systems countrywide which serve a total urban population of 8.4 million, accounting for about 61 per cent coverage against a national goal of 85 per cent by 2015.25 To meet the national targets, which also coincide with the MDGs, GWCL has embarked on a number of expansion projects. In Accra, these include the Kpong Water Supply Expansion Project, estimated at US$273 million, which involves the construction of a new 196,000m3/day intake, the expansion of the existing treatment plant to 250,000m3/day and the construction of new transmission mains. Additionally, the Teshie Desalination Plant, which will add 20,000m3 per day, is nearing completion.
In Tamale, even though the Nawum waterworks has the capacity to meet the current demand for water, only about 44 per cent of residents were covered by the GWCL in 2002 and these supplies were rationed. In many areas the water flows just once or twice a week for a few hours. In many low-income residential areas, only about 20 per cent of households have access to piped water.26 In such situations, people cannot store enough water and resort to unsafe sources, i.e., dams, dugouts, etc., and this contributes to the spread of guinea worm in the region.27 To help reverse the situation, Water Aid and New Energy have targeted 13 high-yielding hand-dug wells, constructed before independence, for improvement and installation of pumps.28
Currently, low-income areas in urban Ghana face shortfalls in water supply. The urban poor in the informal, low income settlements are the hardest hit
Town SourceTotal capacity (m3 per day)
Total Estimated demand Deficit
Accra/Tema Kpong & Weija water works 407,400 m3 600,000 m3 192,600
Kumasi Barekese & Owabi Dam 92,000 m3 130,000 m3 38,000
Tamale Nawum 45,000 m3 41,000 m3
Bolgatanga Vea Dam 7,200 m3 7,600 m3 400 m3
Wa Mechanised Boreholes 1,300 m3 10,800 m3 9,500 m3
Source: GWCL Regional Officers, Accra, Kumasi, Tamale.
Table 73. Sources of urban water supply and service coverage in Accra, Kumasi, Tamale, Bolgatanga and Wa
Box 12. Some Problems facing GWCL
Increased urbanisation, which is putting tremendous pressure on existing utilities;
Previously low tariffs which affected GWCL’s ability to renew its facilities and carry out expansions in water supply;
Management challenges including low revenue collection;
Ineffective mechanisms to expand the water network and ensure accessibility to potable water supply to low-income and peri-urban consumers;
Inability to operate cost-recovery tariffs;
Inability to self-finance capital expenditure;
Political interference in the governance and management of the company;
Erratic power supply;
Non-payment of bills;
Illegal connections; and
The general poor performance of water reservoirs, most of which use in-line booster pumps.
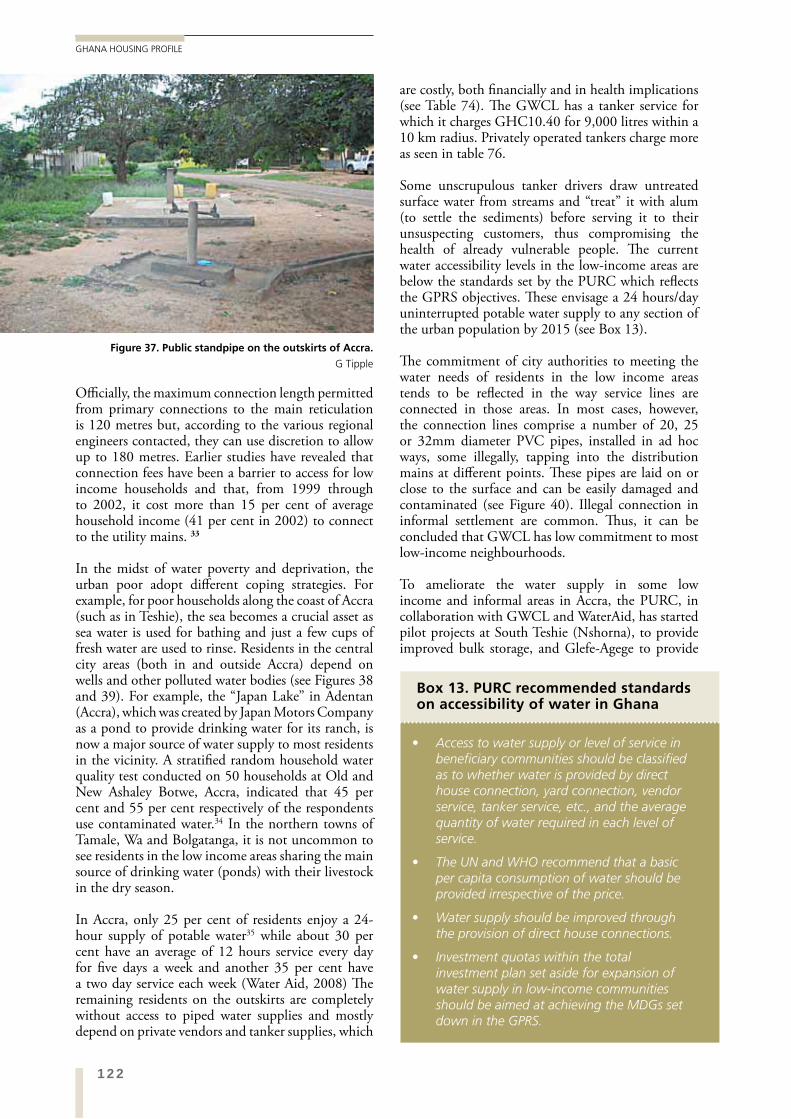
122
GHANA HOUSING PROFILE
are costly, both financially and in health implications (see Table 74). The GWCL has a tanker service for which it charges GHC10.40 for 9,000 litres within a 10 km radius. Privately operated tankers charge more as seen in table 76.
Some unscrupulous tanker drivers draw untreated surface water from streams and “treat” it with alum (to settle the sediments) before serving it to their unsuspecting customers, thus compromising the health of already vulnerable people. The current water accessibility levels in the low-income areas are below the standards set by the PURC which reflects the GPRS objectives. These envisage a 24 hours/day uninterrupted potable water supply to any section of the urban population by 2015 (see Box 13).
The commitment of city authorities to meeting the water needs of residents in the low income areas tends to be reflected in the way service lines are connected in those areas. In most cases, however, the connection lines comprise a number of 20, 25 or 32mm diameter PVC pipes, installed in ad hoc ways, some illegally, tapping into the distribution mains at different points. These pipes are laid on or close to the surface and can be easily damaged and contaminated (see Figure 40). Illegal connection in informal settlement are common. Thus, it can be concluded that GWCL has low commitment to most low-income neighbourhoods.
To ameliorate the water supply in some low income and informal areas in Accra, the PURC, in collaboration with GWCL and WaterAid, has started pilot projects at South Teshie (Nshorna), to provide improved bulk storage, and Glefe-Agege to provide
Officially, the maximum connection length permitted from primary connections to the main reticulation is 120 metres but, according to the various regional engineers contacted, they can use discretion to allow up to 180 metres. Earlier studies have revealed that connection fees have been a barrier to access for low income households and that, from 1999 through to 2002, it cost more than 15 per cent of average household income (41 per cent in 2002) to connect to the utility mains. 33
In the midst of water poverty and deprivation, the urban poor adopt different coping strategies. For example, for poor households along the coast of Accra (such as in Teshie), the sea becomes a crucial asset as sea water is used for bathing and just a few cups of fresh water are used to rinse. Residents in the central city areas (both in and outside Accra) depend on wells and other polluted water bodies (see Figures 38 and 39). For example, the “Japan Lake” in Adentan (Accra), which was created by Japan Motors Company as a pond to provide drinking water for its ranch, is now a major source of water supply to most residents in the vicinity. A stratified random household water quality test conducted on 50 households at Old and New Ashaley Botwe, Accra, indicated that 45 per cent and 55 per cent respectively of the respondents use contaminated water.34 In the northern towns of Tamale, Wa and Bolgatanga, it is not uncommon to see residents in the low income areas sharing the main source of drinking water (ponds) with their livestock in the dry season.
In Accra, only 25 per cent of residents enjoy a 24-hour supply of potable water35 while about 30 per cent have an average of 12 hours service every day for five days a week and another 35 per cent have a two day service each week (Water Aid, 2008) The remaining residents on the outskirts are completely without access to piped water supplies and mostly depend on private vendors and tanker supplies, which
Figure 37. Public standpipe on the outskirts of Accra.
G Tipple
Box 13. PURC recommended standards on accessibility of water in Ghana
Access to water supply or level of service in beneficiary communities should be classified as to whether water is provided by direct house connection, yard connection, vendor service, tanker service, etc., and the average quantity of water required in each level of service.
The UN and WHO recommend that a basic per capita consumption of water should be provided irrespective of the price.
Water supply should be improved through the provision of direct house connections.
Investment quotas within the total investment plan set aside for expansion of water supply in low-income communities should be aimed at achieving the MDGs set down in the GPRS.
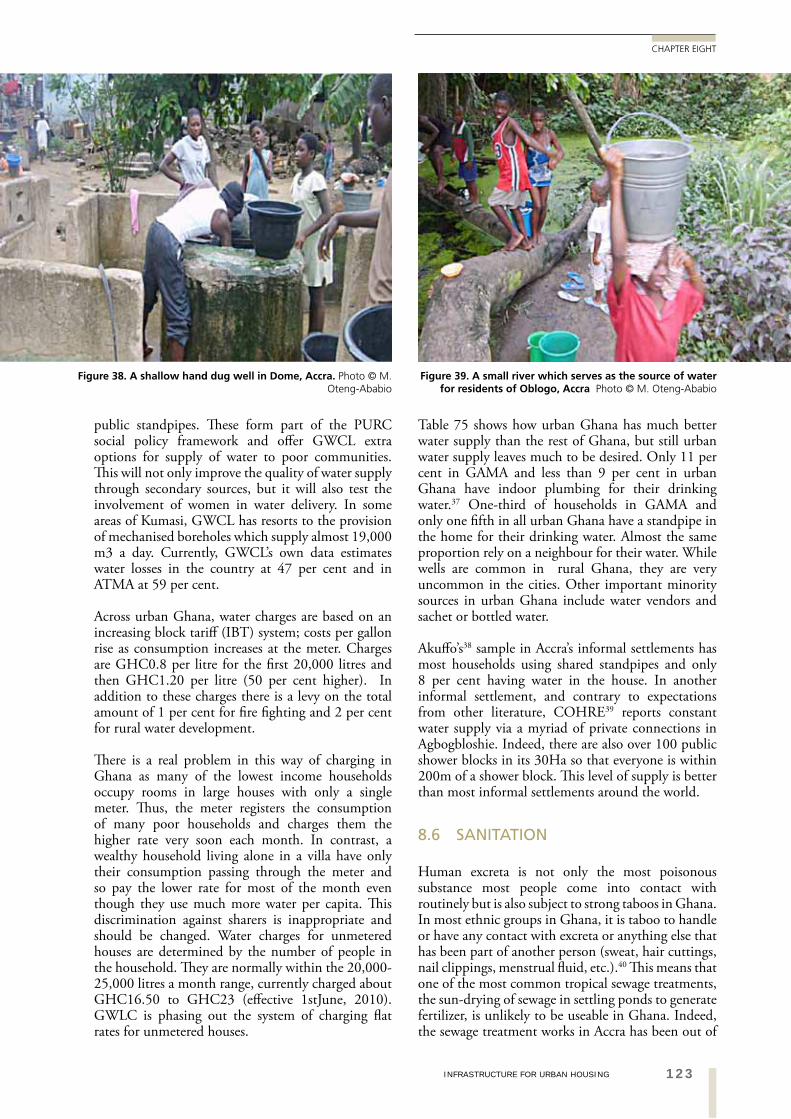
123INFRASTRUCTURE FOR URBAN HOUSING
CHAPTER EIGHT
Table 75 shows how urban Ghana has much better water supply than the rest of Ghana, but still urban water supply leaves much to be desired. Only 11 per cent in GAMA and less than 9 per cent in urban Ghana have indoor plumbing for their drinking water.37 One-third of households in GAMA and only one fifth in all urban Ghana have a standpipe in the home for their drinking water. Almost the same proportion rely on a neighbour for their water. While wells are common in rural Ghana, they are very uncommon in the cities. Other important minority sources in urban Ghana include water vendors and sachet or bottled water.
Akuffo’s38 sample in Accra’s informal settlements has most households using shared standpipes and only 8 per cent having water in the house. In another informal settlement, and contrary to expectations from other literature, COHRE39 reports constant water supply via a myriad of private connections in Agbogbloshie. Indeed, there are also over 100 public shower blocks in its 30Ha so that everyone is within 200m of a shower block. This level of supply is better than most informal settlements around the world.
8.6 SANITATION
Human excreta is not only the most poisonous substance most people come into contact with routinely but is also subject to strong taboos in Ghana. In most ethnic groups in Ghana, it is taboo to handle or have any contact with excreta or anything else that has been part of another person (sweat, hair cuttings, nail clippings, menstrual fluid, etc.).40 This means that one of the most common tropical sewage treatments, the sun-drying of sewage in settling ponds to generate fertilizer, is unlikely to be useable in Ghana. Indeed, the sewage treatment works in Accra has been out of
public standpipes. These form part of the PURC social policy framework and offer GWCL extra options for supply of water to poor communities. This will not only improve the quality of water supply through secondary sources, but it will also test the involvement of women in water delivery. In some areas of Kumasi, GWCL has resorts to the provision of mechanised boreholes which supply almost 19,000 m3 a day. Currently, GWCL’s own data estimates water losses in the country at 47 per cent and in ATMA at 59 per cent.
Across urban Ghana, water charges are based on an increasing block tariff (IBT) system; costs per gallon rise as consumption increases at the meter. Charges are GHC0.8 per litre for the first 20,000 litres and then GHC1.20 per litre (50 per cent higher). In addition to these charges there is a levy on the total amount of 1 per cent for fire fighting and 2 per cent for rural water development.
There is a real problem in this way of charging in Ghana as many of the lowest income households occupy rooms in large houses with only a single meter. Thus, the meter registers the consumption of many poor households and charges them the higher rate very soon each month. In contrast, a wealthy household living alone in a villa have only their consumption passing through the meter and so pay the lower rate for most of the month even though they use much more water per capita. This discrimination against sharers is inappropriate and should be changed. Water charges for unmetered houses are determined by the number of people in the household. They are normally within the 20,000-25,000 litres a month range, currently charged about GHC16.50 to GHC23 (effective 1stJune, 2010). GWLC is phasing out the system of charging flat rates for unmetered houses.
Figure 39. A small river which serves as the source of water for residents of Oblogo, Accra Photo © M. Oteng-Ababio
Figure 38. A shallow hand dug well in Dome, Accra. Photo © M. Oteng-Ababio
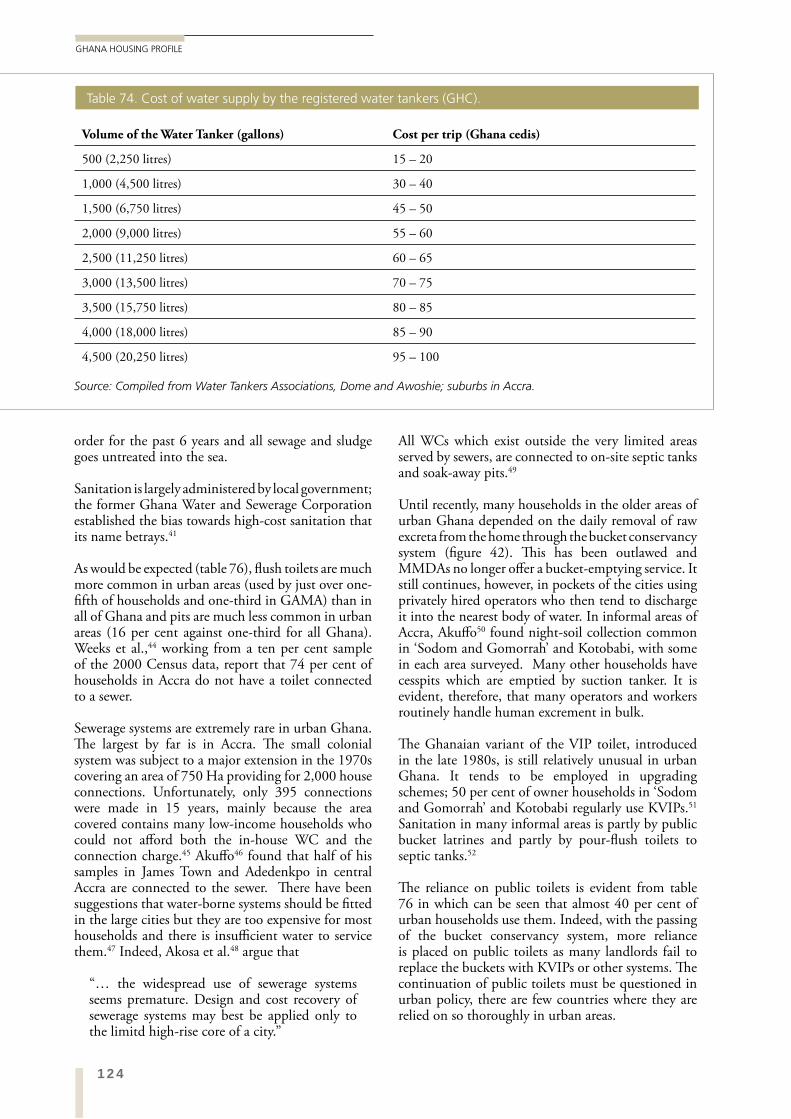
124
GHANA HOUSING PROFILE
All WCs which exist outside the very limited areas served by sewers, are connected to on-site septic tanks and soak-away pits.49
Until recently, many households in the older areas of urban Ghana depended on the daily removal of raw excreta from the home through the bucket conservancy system (figure 42). This has been outlawed and MMDAs no longer offer a bucket-emptying service. It still continues, however, in pockets of the cities using privately hired operators who then tend to discharge it into the nearest body of water. In informal areas of Accra, Akuffo50 found night-soil collection common in ‘Sodom and Gomorrah’ and Kotobabi, with some in each area surveyed. Many other households have cesspits which are emptied by suction tanker. It is evident, therefore, that many operators and workers routinely handle human excrement in bulk.
The Ghanaian variant of the VIP toilet, introduced in the late 1980s, is still relatively unusual in urban Ghana. It tends to be employed in upgrading schemes; 50 per cent of owner households in ‘Sodom and Gomorrah’ and Kotobabi regularly use KVIPs.51 Sanitation in many informal areas is partly by public bucket latrines and partly by pour-flush toilets to septic tanks.52
The reliance on public toilets is evident from table 76 in which can be seen that almost 40 per cent of urban households use them. Indeed, with the passing of the bucket conservancy system, more reliance is placed on public toilets as many landlords fail to replace the buckets with KVIPs or other systems. The continuation of public toilets must be questioned in urban policy, there are few countries where they are relied on so thoroughly in urban areas.
order for the past 6 years and all sewage and sludge goes untreated into the sea.
Sanitation is largely administered by local government; the former Ghana Water and Sewerage Corporation established the bias towards high-cost sanitation that its name betrays.41
As would be expected (table 76), flush toilets are much more common in urban areas (used by just over one-fifth of households and one-third in GAMA) than in all of Ghana and pits are much less common in urban areas (16 per cent against one-third for all Ghana). Weeks et al.,44 working from a ten per cent sample of the 2000 Census data, report that 74 per cent of households in Accra do not have a toilet connected to a sewer.
Sewerage systems are extremely rare in urban Ghana. The largest by far is in Accra. The small colonial system was subject to a major extension in the 1970s covering an area of 750 Ha providing for 2,000 house connections. Unfortunately, only 395 connections were made in 15 years, mainly because the area covered contains many low-income households who could not afford both the in-house WC and the connection charge.45 Akuffo46 found that half of his samples in James Town and Adedenkpo in central Accra are connected to the sewer. There have been suggestions that water-borne systems should be fitted in the large cities but they are too expensive for most households and there is insufficient water to service them.47 Indeed, Akosa et al.48 argue that
“… the widespread use of sewerage systems seems premature. Design and cost recovery of sewerage systems may best be applied only to the limitd high-rise core of a city.”
Volume of the Water Tanker (gallons) Cost per trip (Ghana cedis)
500 (2,250 litres) 15 – 20
1,000 (4,500 litres) 30 – 40
1,500 (6,750 litres) 45 – 50
2,000 (9,000 litres) 55 – 60
2,500 (11,250 litres) 60 – 65
3,000 (13,500 litres) 70 – 75
3,500 (15,750 litres) 80 – 85
4,000 (18,000 litres) 85 – 90
4,500 (20,250 litres) 95 – 100
Source: Compiled from Water Tankers Associations, Dome and Awoshie; suburbs in Accra.
Table 74. Cost of water supply by the registered water tankers (GHC).
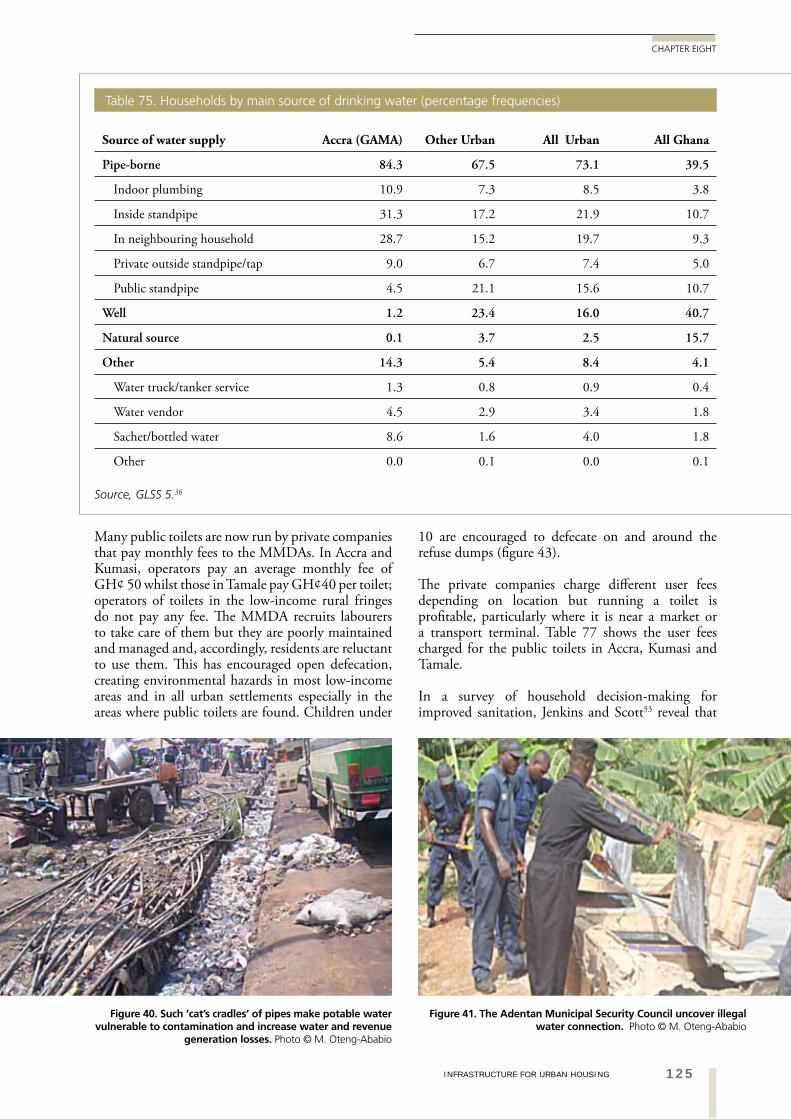
125INFRASTRUCTURE FOR URBAN HOUSING
CHAPTER EIGHT
10 are encouraged to defecate on and around the refuse dumps (figure 43).
The private companies charge different user fees depending on location but running a toilet is profitable, particularly where it is near a market or a transport terminal. Table 77 shows the user fees charged for the public toilets in Accra, Kumasi and Tamale.
In a survey of household decision-making for improved sanitation, Jenkins and Scott53 reveal that
Many public toilets are now run by private companies that pay monthly fees to the MMDAs. In Accra and Kumasi, operators pay an average monthly fee of GH¢ 50 whilst those in Tamale pay GH¢40 per toilet; operators of toilets in the low-income rural fringes do not pay any fee. The MMDA recruits labourers to take care of them but they are poorly maintained and managed and, accordingly, residents are reluctant to use them. This has encouraged open defecation, creating environmental hazards in most low-income areas and in all urban settlements especially in the areas where public toilets are found. Children under
Source of water supply Accra (GAMA) Other Urban All Urban All Ghana
Pipe-borne 84.3 67.5 73.1 39.5
Indoor plumbing 10.9 7.3 8.5 3.8
Inside standpipe 31.3 17.2 21.9 10.7
In neighbouring household 28.7 15.2 19.7 9.3
Private outside standpipe/tap 9.0 6.7 7.4 5.0
Public standpipe 4.5 21.1 15.6 10.7
Well 1.2 23.4 16.0 40.7
Natural source 0.1 3.7 2.5 15.7
Other 14.3 5.4 8.4 4.1
Water truck/tanker service 1.3 0.8 0.9 0.4
Water vendor 4.5 2.9 3.4 1.8
Sachet/bottled water 8.6 1.6 4.0 1.8
Other 0.0 0.1 0.0 0.1
Table 75. Households by main source of drinking water (percentage frequencies)
Source, GLSS 5.36
Figure 40. Such ‘cat’s cradles’ of pipes make potable water vulnerable to contamination and increase water and revenue
generation losses. Photo © M. Oteng-Ababio
Figure 41. The Adentan Municipal Security Council uncover illegal water connection. Photo © M. Oteng-Ababio
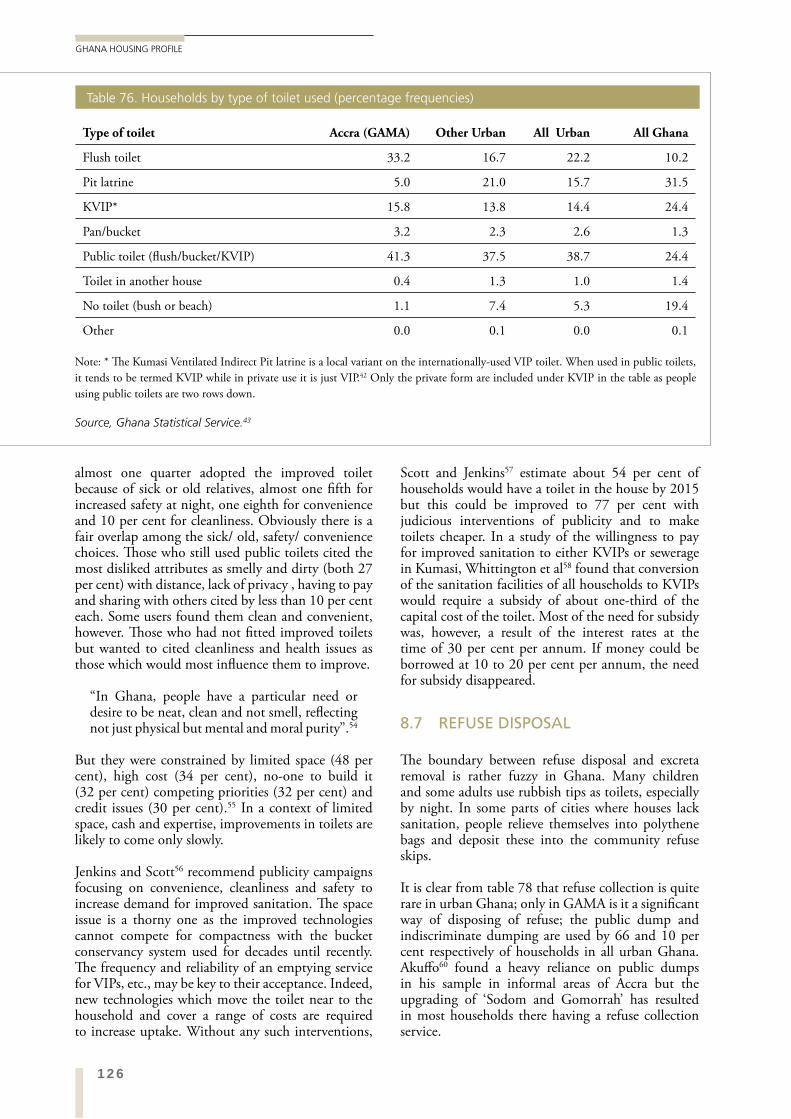
126
GHANA HOUSING PROFILE
Scott and Jenkins57 estimate about 54 per cent of households would have a toilet in the house by 2015 but this could be improved to 77 per cent with judicious interventions of publicity and to make toilets cheaper. In a study of the willingness to pay for improved sanitation to either KVIPs or sewerage in Kumasi, Whittington et al58 found that conversion of the sanitation facilities of all households to KVIPs would require a subsidy of about one-third of the capital cost of the toilet. Most of the need for subsidy was, however, a result of the interest rates at the time of 30 per cent per annum. If money could be borrowed at 10 to 20 per cent per annum, the need for subsidy disappeared.
8.7 REFUSE DISPOSAL
The boundary between refuse disposal and excreta removal is rather fuzzy in Ghana. Many children and some adults use rubbish tips as toilets, especially by night. In some parts of cities where houses lack sanitation, people relieve themselves into polythene bags and deposit these into the community refuse skips.
It is clear from table 78 that refuse collection is quite rare in urban Ghana; only in GAMA is it a significant way of disposing of refuse; the public dump and indiscriminate dumping are used by 66 and 10 per cent respectively of households in all urban Ghana. Akuffo60 found a heavy reliance on public dumps in his sample in informal areas of Accra but the upgrading of ‘Sodom and Gomorrah’ has resulted in most households there having a refuse collection service.
almost one quarter adopted the improved toilet because of sick or old relatives, almost one fifth for increased safety at night, one eighth for convenience and 10 per cent for cleanliness. Obviously there is a fair overlap among the sick/ old, safety/ convenience choices. Those who still used public toilets cited the most disliked attributes as smelly and dirty (both 27 per cent) with distance, lack of privacy , having to pay and sharing with others cited by less than 10 per cent each. Some users found them clean and convenient, however. Those who had not fitted improved toilets but wanted to cited cleanliness and health issues as those which would most influence them to improve.
“In Ghana, people have a particular need or desire to be neat, clean and not smell, reflecting not just physical but mental and moral purity”.54
But they were constrained by limited space (48 per cent), high cost (34 per cent), no-one to build it (32 per cent) competing priorities (32 per cent) and credit issues (30 per cent).55 In a context of limited space, cash and expertise, improvements in toilets are likely to come only slowly.
Jenkins and Scott56 recommend publicity campaigns focusing on convenience, cleanliness and safety to increase demand for improved sanitation. The space issue is a thorny one as the improved technologies cannot compete for compactness with the bucket conservancy system used for decades until recently. The frequency and reliability of an emptying service for VIPs, etc., may be key to their acceptance. Indeed, new technologies which move the toilet near to the household and cover a range of costs are required to increase uptake. Without any such interventions,
Type of toilet Accra (GAMA) Other Urban All Urban All Ghana
Flush toilet 33.2 16.7 22.2 10.2
Pit latrine 5.0 21.0 15.7 31.5
KVIP* 15.8 13.8 14.4 24.4
Pan/bucket 3.2 2.3 2.6 1.3
Public toilet (flush/bucket/KVIP) 41.3 37.5 38.7 24.4
Toilet in another house 0.4 1.3 1.0 1.4
No toilet (bush or beach) 1.1 7.4 5.3 19.4
Other 0.0 0.1 0.0 0.1
Table 76. Households by type of toilet used (percentage frequencies)
Note: * The Kumasi Ventilated Indirect Pit latrine is a local variant on the internationally-used VIP toilet. When used in public toilets, it tends to be termed KVIP while in private use it is just VIP.42 Only the private form are included under KVIP in the table as people using public toilets are two rows down.
Source, Ghana Statistical Service.43
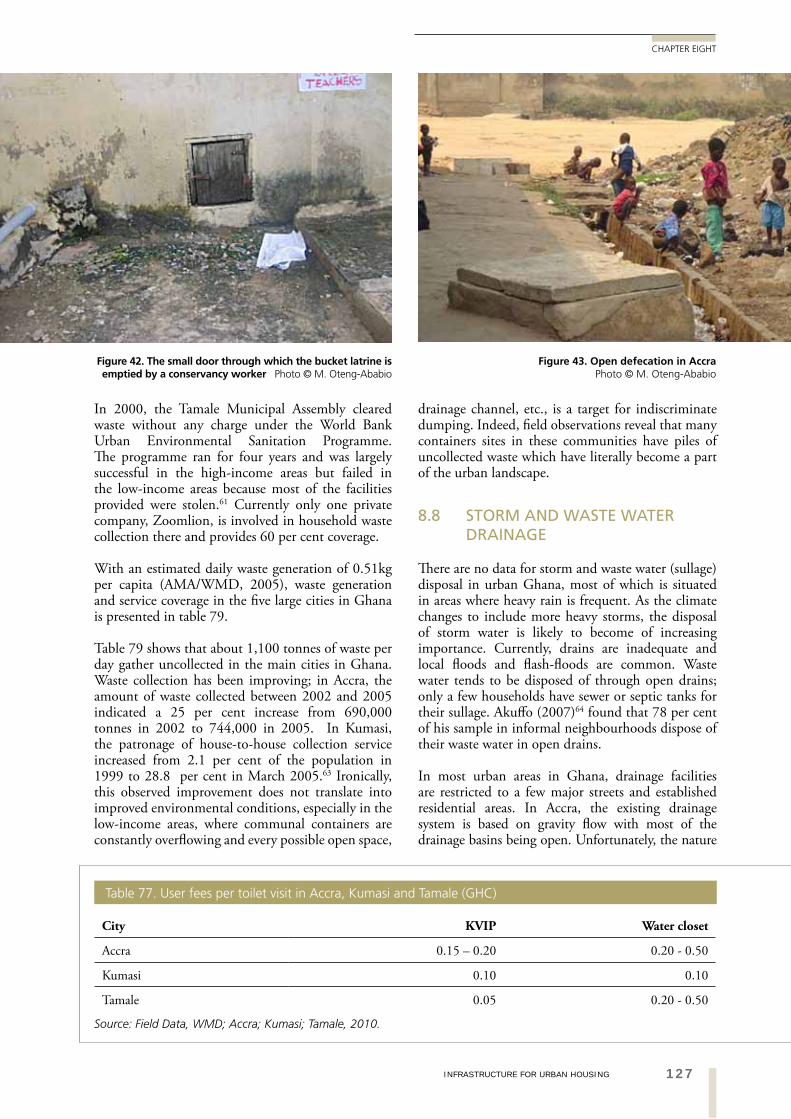
127INFRASTRUCTURE FOR URBAN HOUSING
CHAPTER EIGHT
drainage channel, etc., is a target for indiscriminate dumping. Indeed, field observations reveal that many containers sites in these communities have piles of uncollected waste which have literally become a part of the urban landscape.
8.8 STORM AND WASTE WATER DRAINAGE
There are no data for storm and waste water (sullage) disposal in urban Ghana, most of which is situated in areas where heavy rain is frequent. As the climate changes to include more heavy storms, the disposal of storm water is likely to become of increasing importance. Currently, drains are inadequate and local floods and flash-floods are common. Waste water tends to be disposed of through open drains; only a few households have sewer or septic tanks for their sullage. Akuffo (2007)64 found that 78 per cent of his sample in informal neighbourhoods dispose of their waste water in open drains.
In most urban areas in Ghana, drainage facilities are restricted to a few major streets and established residential areas. In Accra, the existing drainage system is based on gravity flow with most of the drainage basins being open. Unfortunately, the nature
In 2000, the Tamale Municipal Assembly cleared waste without any charge under the World Bank Urban Environmental Sanitation Programme. The programme ran for four years and was largely successful in the high-income areas but failed in the low-income areas because most of the facilities provided were stolen.61 Currently only one private company, Zoomlion, is involved in household waste collection there and provides 60 per cent coverage.
With an estimated daily waste generation of 0.51kg per capita (AMA/WMD, 2005), waste generation and service coverage in the five large cities in Ghana is presented in table 79.
Table 79 shows that about 1,100 tonnes of waste per day gather uncollected in the main cities in Ghana. Waste collection has been improving; in Accra, the amount of waste collected between 2002 and 2005 indicated a 25 per cent increase from 690,000 tonnes in 2002 to 744,000 in 2005. In Kumasi, the patronage of house-to-house collection service increased from 2.1 per cent of the population in 1999 to 28.8 per cent in March 2005.63 Ironically, this observed improvement does not translate into improved environmental conditions, especially in the low-income areas, where communal containers are constantly overflowing and every possible open space,
Figure 42. The small door through which the bucket latrine is emptied by a conservancy worker Photo © M. Oteng-Ababio
Figure 43. Open defecation in Accra Photo © M. Oteng-Ababio
City KVIP Water closet
Accra 0.15 – 0.20 0.20 - 0.50
Kumasi 0.10 0.10
Tamale 0.05 0.20 - 0.50
Table 77. User fees per toilet visit in Accra, Kumasi and Tamale (GHC)
Source: Field Data, WMD; Accra; Kumasi; Tamale, 2010.
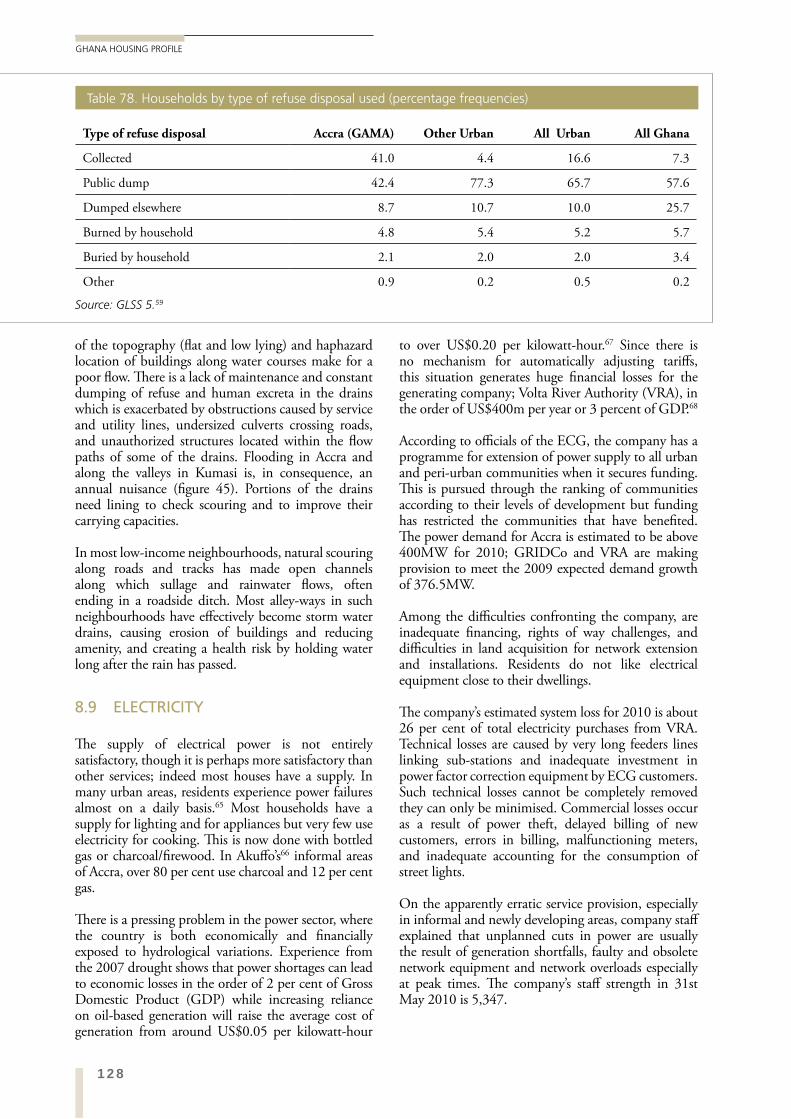
128
GHANA HOUSING PROFILE
to over US$0.20 per kilowatt-hour.67 Since there is no mechanism for automatically adjusting tariffs, this situation generates huge financial losses for the generating company; Volta River Authority (VRA), in the order of US$400m per year or 3 percent of GDP.68
According to officials of the ECG, the company has a programme for extension of power supply to all urban and peri-urban communities when it secures funding. This is pursued through the ranking of communities according to their levels of development but funding has restricted the communities that have benefited. The power demand for Accra is estimated to be above 400MW for 2010; GRIDCo and VRA are making provision to meet the 2009 expected demand growth of 376.5MW.
Among the difficulties confronting the company, are inadequate financing, rights of way challenges, and difficulties in land acquisition for network extension and installations. Residents do not like electrical equipment close to their dwellings.
The company’s estimated system loss for 2010 is about 26 per cent of total electricity purchases from VRA. Technical losses are caused by very long feeders lines linking sub-stations and inadequate investment in power factor correction equipment by ECG customers. Such technical losses cannot be completely removed they can only be minimised. Commercial losses occur as a result of power theft, delayed billing of new customers, errors in billing, malfunctioning meters, and inadequate accounting for the consumption of street lights.
On the apparently erratic service provision, especially in informal and newly developing areas, company staff explained that unplanned cuts in power are usually the result of generation shortfalls, faulty and obsolete network equipment and network overloads especially at peak times. The company’s staff strength in 31st May 2010 is 5,347.
of the topography (flat and low lying) and haphazard location of buildings along water courses make for a poor flow. There is a lack of maintenance and constant dumping of refuse and human excreta in the drains which is exacerbated by obstructions caused by service and utility lines, undersized culverts crossing roads, and unauthorized structures located within the flow paths of some of the drains. Flooding in Accra and along the valleys in Kumasi is, in consequence, an annual nuisance (figure 45). Portions of the drains need lining to check scouring and to improve their carrying capacities.
In most low-income neighbourhoods, natural scouring along roads and tracks has made open channels along which sullage and rainwater flows, often ending in a roadside ditch. Most alley-ways in such neighbourhoods have effectively become storm water drains, causing erosion of buildings and reducing amenity, and creating a health risk by holding water long after the rain has passed.
8.9 ELECTRICITY
The supply of electrical power is not entirely satisfactory, though it is perhaps more satisfactory than other services; indeed most houses have a supply. In many urban areas, residents experience power failures almost on a daily basis.65 Most households have a supply for lighting and for appliances but very few use electricity for cooking. This is now done with bottled gas or charcoal/firewood. In Akuffo’s66 informal areas of Accra, over 80 per cent use charcoal and 12 per cent gas.
There is a pressing problem in the power sector, where the country is both economically and financially exposed to hydrological variations. Experience from the 2007 drought shows that power shortages can lead to economic losses in the order of 2 per cent of Gross Domestic Product (GDP) while increasing reliance on oil-based generation will raise the average cost of generation from around US$0.05 per kilowatt-hour
Type of refuse disposal Accra (GAMA) Other Urban All Urban All Ghana
Collected 41.0 4.4 16.6 7.3
Public dump 42.4 77.3 65.7 57.6
Dumped elsewhere 8.7 10.7 10.0 25.7
Burned by household 4.8 5.4 5.2 5.7
Buried by household 2.1 2.0 2.0 3.4
Other 0.9 0.2 0.5 0.2
Source: GLSS 5.59
Table 78. Households by type of refuse disposal used (percentage frequencies)
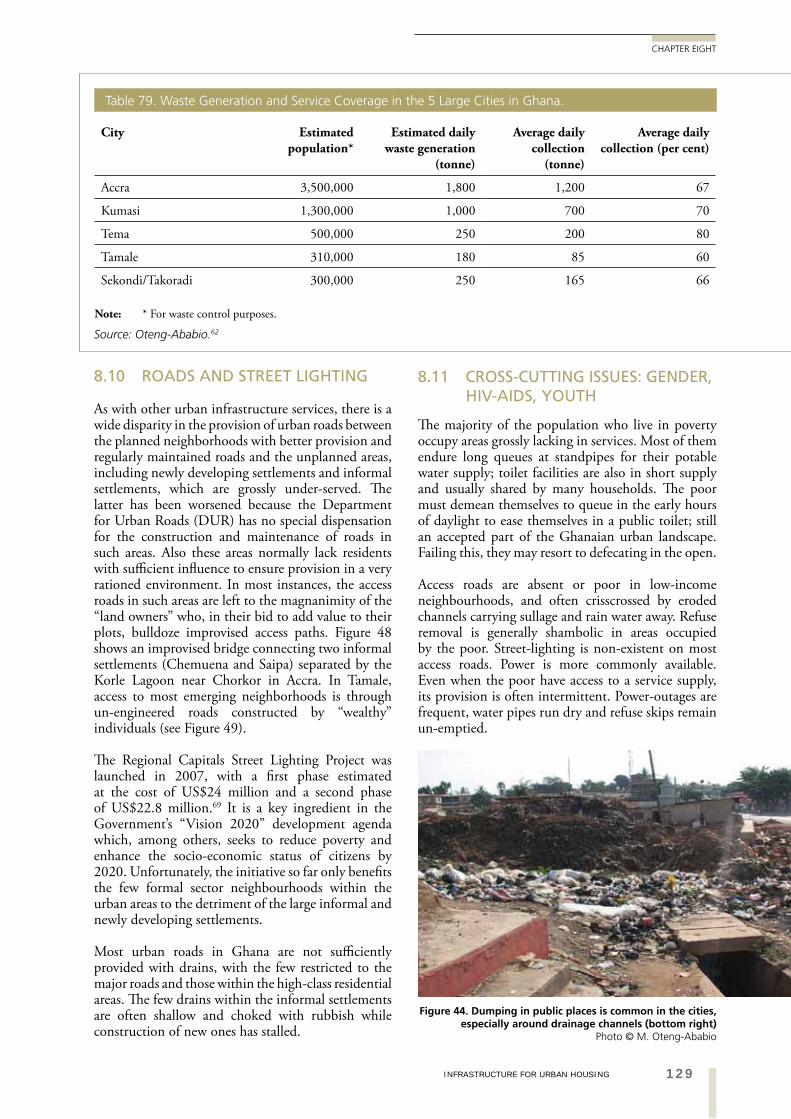
129INFRASTRUCTURE FOR URBAN HOUSING
CHAPTER EIGHT
8.11 CROSS-CUTTING ISSUES: GENDER, HIV-AIDS, YOUTH
The majority of the population who live in poverty occupy areas grossly lacking in services. Most of them endure long queues at standpipes for their potable water supply; toilet facilities are also in short supply and usually shared by many households. The poor must demean themselves to queue in the early hours of daylight to ease themselves in a public toilet; still an accepted part of the Ghanaian urban landscape. Failing this, they may resort to defecating in the open.
Access roads are absent or poor in low-income neighbourhoods, and often crisscrossed by eroded channels carrying sullage and rain water away. Refuse removal is generally shambolic in areas occupied by the poor. Street-lighting is non-existent on most access roads. Power is more commonly available. Even when the poor have access to a service supply, its provision is often intermittent. Power-outages are frequent, water pipes run dry and refuse skips remain un-emptied.
8.10 ROADS AND STREET LIGHTING
As with other urban infrastructure services, there is a wide disparity in the provision of urban roads between the planned neighborhoods with better provision and regularly maintained roads and the unplanned areas, including newly developing settlements and informal settlements, which are grossly under-served. The latter has been worsened because the Department for Urban Roads (DUR) has no special dispensation for the construction and maintenance of roads in such areas. Also these areas normally lack residents with sufficient influence to ensure provision in a very rationed environment. In most instances, the access roads in such areas are left to the magnanimity of the “land owners” who, in their bid to add value to their plots, bulldoze improvised access paths. Figure 48 shows an improvised bridge connecting two informal settlements (Chemuena and Saipa) separated by the Korle Lagoon near Chorkor in Accra. In Tamale, access to most emerging neighborhoods is through un-engineered roads constructed by “wealthy” individuals (see Figure 49).
The Regional Capitals Street Lighting Project was launched in 2007, with a first phase estimated at the cost of US$24 million and a second phase of US$22.8 million.69 It is a key ingredient in the Government’s “Vision 2020” development agenda which, among others, seeks to reduce poverty and enhance the socio-economic status of citizens by 2020. Unfortunately, the initiative so far only benefits the few formal sector neighbourhoods within the urban areas to the detriment of the large informal and newly developing settlements.
Most urban roads in Ghana are not sufficiently provided with drains, with the few restricted to the major roads and those within the high-class residential areas. The few drains within the informal settlements are often shallow and choked with rubbish while construction of new ones has stalled.
City Estimated population*
Estimated daily waste generation
(tonne)
Average daily collection
(tonne)
Average daily collection (per cent)
Accra 3,500,000 1,800 1,200 67
Kumasi 1,300,000 1,000 700 70
Tema 500,000 250 200 80
Tamale 310,000 180 85 60
Sekondi/Takoradi 300,000 250 165 66
Table 79. Waste Generation and Service Coverage in the 5 Large Cities in Ghana.
Source: Oteng-Ababio.62
Note: * For waste control purposes.
Figure 44. Dumping in public places is common in the cities, especially around drainage channels (bottom right)
Photo © M. Oteng-Ababio
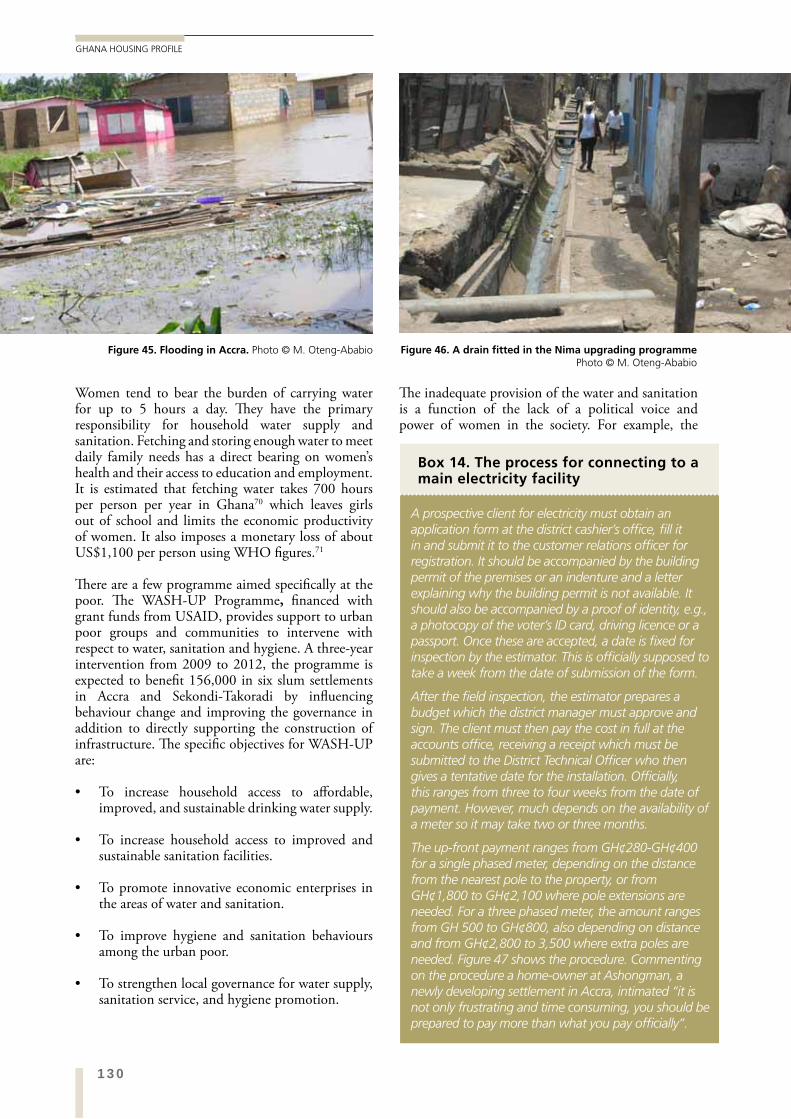
130
GHANA HOUSING PROFILE
The inadequate provision of the water and sanitation is a function of the lack of a political voice and power of women in the society. For example, the
Women tend to bear the burden of carrying water for up to 5 hours a day. They have the primary responsibility for household water supply and sanitation. Fetching and storing enough water to meet daily family needs has a direct bearing on women’s health and their access to education and employment. It is estimated that fetching water takes 700 hours per person per year in Ghana70 which leaves girls out of school and limits the economic productivity of women. It also imposes a monetary loss of about US$1,100 per person using WHO figures.71
There are a few programme aimed specifically at the poor. The WASH-UP Programme, financed with grant funds from USAID, provides support to urban poor groups and communities to intervene with respect to water, sanitation and hygiene. A three-year intervention from 2009 to 2012, the programme is expected to benefit 156,000 in six slum settlements in Accra and Sekondi-Takoradi by influencing behaviour change and improving the governance in addition to directly supporting the construction of infrastructure. The specific objectives for WASH-UP are:
To increase household access to affordable, improved, and sustainable drinking water supply.
To increase household access to improved and sustainable sanitation facilities.
To promote innovative economic enterprises in the areas of water and sanitation.
To improve hygiene and sanitation behaviours among the urban poor.
To strengthen local governance for water supply, sanitation service, and hygiene promotion.
Figure 46. A drain fitted in the Nima upgrading programme Photo © M. Oteng-Ababio
Figure 45. Flooding in Accra. Photo © M. Oteng-Ababio
Box 14. The process for connecting to a main electricity facility
A prospective client for electricity must obtain an application form at the district cashier’s office, fill it in and submit it to the customer relations officer for registration. It should be accompanied by the building permit of the premises or an indenture and a letter explaining why the building permit is not available. It should also be accompanied by a proof of identity, e.g., a photocopy of the voter’s ID card, driving licence or a passport. Once these are accepted, a date is fixed for inspection by the estimator. This is officially supposed to take a week from the date of submission of the form.
After the field inspection, the estimator prepares a budget which the district manager must approve and sign. The client must then pay the cost in full at the accounts office, receiving a receipt which must be submitted to the District Technical Officer who then gives a tentative date for the installation. Officially, this ranges from three to four weeks from the date of payment. However, much depends on the availability of a meter so it may take two or three months.
The up-front payment ranges from GH¢280-GH¢400 for a single phased meter, depending on the distance from the nearest pole to the property, or from GH¢1,800 to GH¢2,100 where pole extensions are needed. For a three phased meter, the amount ranges from GH 500 to GH¢800, also depending on distance and from GH¢2,800 to 3,500 where extra poles are needed. Figure 47 shows the procedure. Commenting on the procedure a home-owner at Ashongman, a newly developing settlement in Accra, intimated “it is not only frustrating and time consuming, you should be prepared to pay more than what you pay officially”.
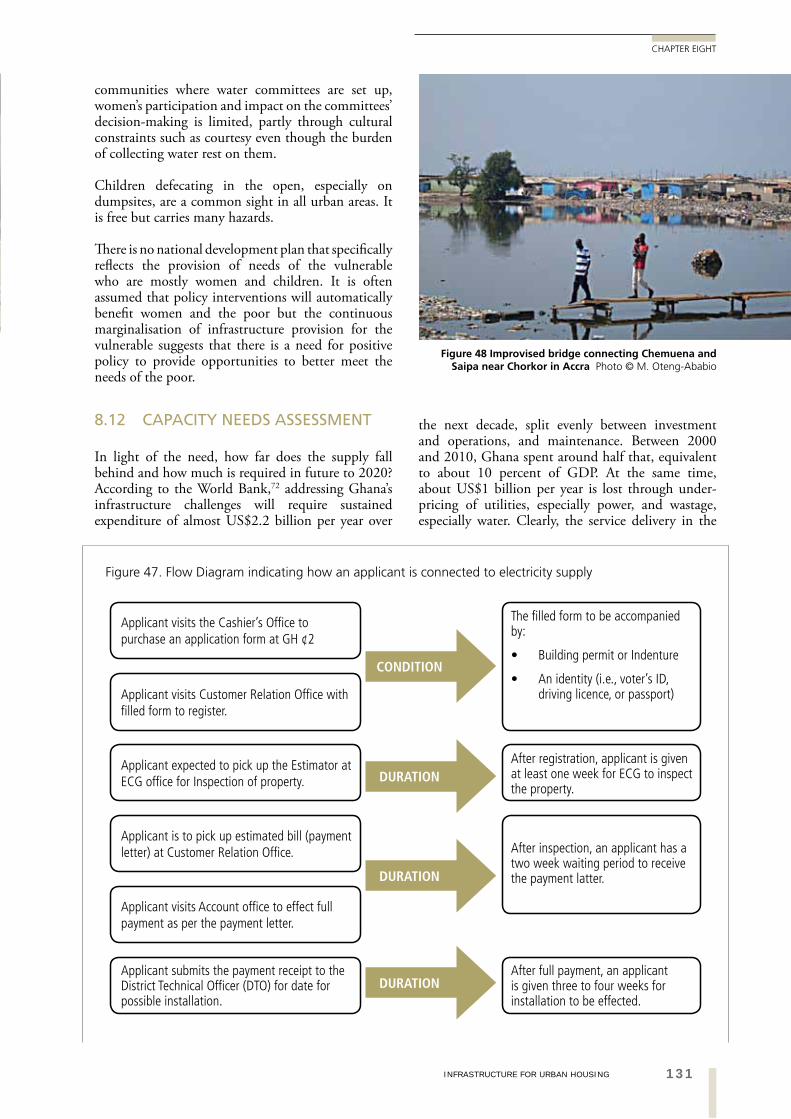
131INFRASTRUCTURE FOR URBAN HOUSING
CHAPTER EIGHT
the next decade, split evenly between investment and operations, and maintenance. Between 2000 and 2010, Ghana spent around half that, equivalent to about 10 percent of GDP. At the same time, about US$1 billion per year is lost through under-pricing of utilities, especially power, and wastage, especially water. Clearly, the service delivery in the
communities where water committees are set up, women’s participation and impact on the committees’ decision-making is limited, partly through cultural constraints such as courtesy even though the burden of collecting water rest on them.
Children defecating in the open, especially on dumpsites, are a common sight in all urban areas. It is free but carries many hazards.
There is no national development plan that specifically reflects the provision of needs of the vulnerable who are mostly women and children. It is often assumed that policy interventions will automatically benefit women and the poor but the continuous marginalisation of infrastructure provision for the vulnerable suggests that there is a need for positive policy to provide opportunities to better meet the needs of the poor.
8.12 CAPACITY NEEDS ASSESSMENT
In light of the need, how far does the supply fall behind and how much is required in future to 2020? According to the World Bank,72 addressing Ghana’s infrastructure challenges will require sustained expenditure of almost US$2.2 billion per year over
Figure 47. Flow Diagram indicating how an applicant is connected to electricity supply
Figure 48 Improvised bridge connecting Chemuena and Saipa near Chorkor in Accra Photo © M. Oteng-Ababio
Applicant visits the Cashier’s Office to purchase an application form at GH ¢2
The filled form to be accompanied by:
Building permit or Indenture
An identity (i.e., voter’s ID, driving licence, or passport)
After registration, applicant is given at least one week for ECG to inspect the property.
After inspection, an applicant has a two week waiting period to receive the payment latter.
After full payment, an applicant is given three to four weeks for installation to be effected.
CONDITION
DURATION
DURATION
DURATION
Applicant visits Customer Relation Office with filled form to register.
Applicant expected to pick up the Estimator at ECG office for Inspection of property.
Applicant is to pick up estimated bill (payment letter) at Customer Relation Office.
Applicant visits Account office to effect full payment as per the payment letter.
Applicant submits the payment receipt to the District Technical Officer (DTO) for date for possible installation.
132
GHANA HOUSING PROFILE
The need to provide sufficient new housing and catch up in the currently under-served areas imposes a considerable burden on infrastructure providers. If new housing is to be provided through self-contained dwellings, they will require just over 200,000 new connections every year (645 every working day). The need to provide 570,000 new rooms per annum generates two very different servicing requirements depending on how they are configured. If they are provided as three-room self-contained bungalows, there would be a need for 190,000 new connections every year (600 per working day). If they were provided as shared services in ten-room multi-occupied housing equivalent to compounds, there would be a need for 57,000 connections (180 per working day). At a minimum of 15 metres of road frontage per plot (stipulated in the current Building Regulations), the annual need for new access roads (with roadside drains) for the two house types would be 2.9 million metres for three-room dwellings and 855,000 metres for ten-room houses.
It may well be that the existing institutions cannot meet these challenges as they are currently structured. There is an urgent need to rethink provision systems and determine the capacity required to fulfil them in the most effective way. This is likely to include community participation in planning, installation and management of supply. Experiences with community contractors elsewhere may provide useful lessons in how this can be done.73
sector is poor, resulting in high health and coping costs as well as environmental degradation, in addition to drudgery and inconvenience for a large section of the urban population. The cost that the consumers and government pay (health and coping costs) may well be higher than the costs of providing safe and continuous improved services, especially of water and sanitation. Comparing spending needs against existing spending and potential efficiency gains, there is a large annual funding gap, most of it associated with power and water.
To meet the challenges facing the sector, reforms needs to focus on improving service delivery. This would require easing the financial constraints facing the sector as well as addressing the institutional and managerial issues identified above. Also, the supply constraints can be eased to the extent that unaccounted waste is reduced and the system is efficiently operated.
Many infrastructure issues confronting the different urban areas undoubtedly lie in using appropriate local technology in a sustainable manner. Choices of technology should not necessarily reflect consumer choice but may need to be in the broader interest of Ghana. To overcome the institutional and managerial deficiencies, the sector needs to be restructured in a manner that managers have the autonomy to operate in a commercial environment on a sustained basis.
Type of Road Road Length(km) Quality
Good ( per cent) Fair ( per cent) Poor ( per cent)
Accra
Asphalt 286 55 7 38
Bituminous 1,230 67 6 27
Gravel 473 94 0 6
Earth 304 0 0 100
Kumasi
Asphalt 159 59 2 39
Bituminous 588 61 2 37
Gravel 890 80 5 15
Earth 294 0 0 100
Tamale
Asphalt 60 20 30 15
Bituminous 406 50 35 15
Gravel 88 46 20 34
Earth 132 45 3 52
Table 80. The characteristics and types of urban roads in Accra, Kumasi and Tamale.
Source: Departments of Urban Roads (DUR), Accra, Kumasi and Tamale (2010)
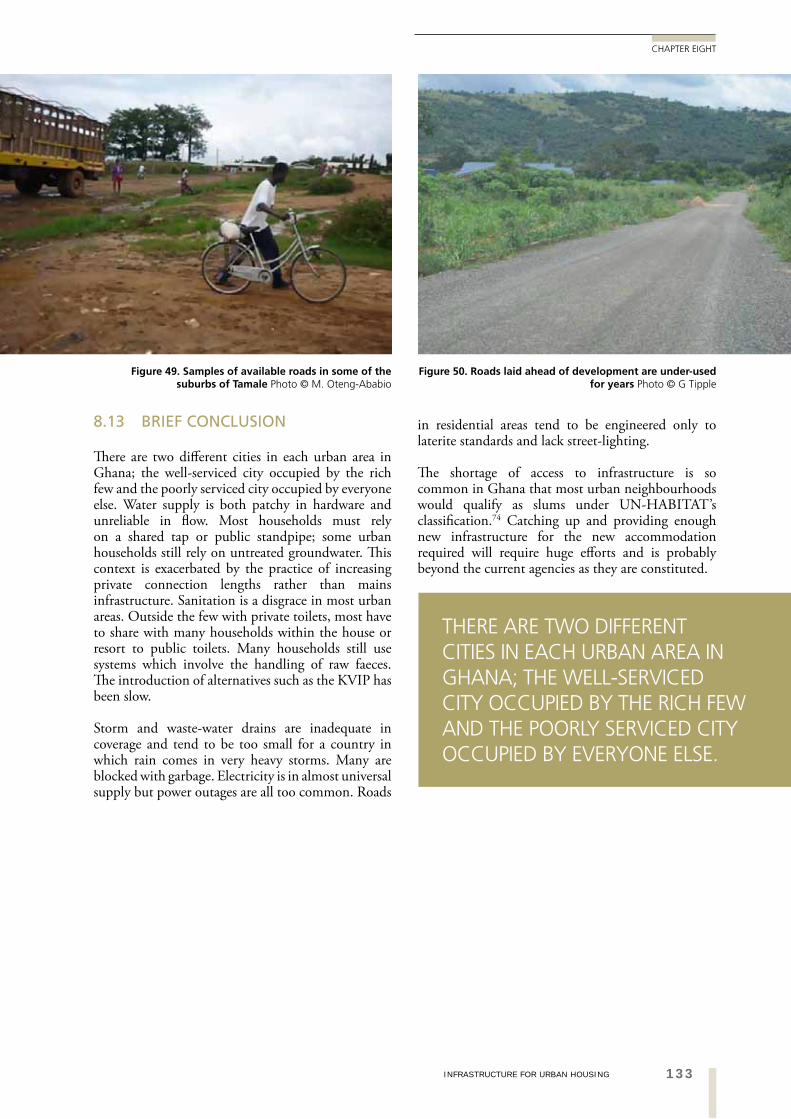
133INFRASTRUCTURE FOR URBAN HOUSING
CHAPTER EIGHT
in residential areas tend to be engineered only to laterite standards and lack street-lighting.
The shortage of access to infrastructure is so common in Ghana that most urban neighbourhoods would qualify as slums under UN-HABITAT’s classification.74 Catching up and providing enough new infrastructure for the new accommodation required will require huge efforts and is probably beyond the current agencies as they are constituted.
8.13 BRIEF CONCLUSION
There are two different cities in each urban area in Ghana; the well-serviced city occupied by the rich few and the poorly serviced city occupied by everyone else. Water supply is both patchy in hardware and unreliable in flow. Most households must rely on a shared tap or public standpipe; some urban households still rely on untreated groundwater. This context is exacerbated by the practice of increasing private connection lengths rather than mains infrastructure. Sanitation is a disgrace in most urban areas. Outside the few with private toilets, most have to share with many households within the house or resort to public toilets. Many households still use systems which involve the handling of raw faeces. The introduction of alternatives such as the KVIP has been slow.
Storm and waste-water drains are inadequate in coverage and tend to be too small for a country in which rain comes in very heavy storms. Many are blocked with garbage. Electricity is in almost universal supply but power outages are all too common. Roads
Figure 50. Roads laid ahead of development are under-used for years Photo © G Tipple
Figure 49. Samples of available roads in some of the suburbs of Tamale Photo © M. Oteng-Ababio
THERE ARE TWO DIFFERENT CITIES IN EACH URBAN AREA IN GHANA; THE WELL-SERVICED CITY OCCUPIED BY THE RICH FEW AND THE POORLY SERVICED CITY OCCUPIED BY EVERYONE ELSE.
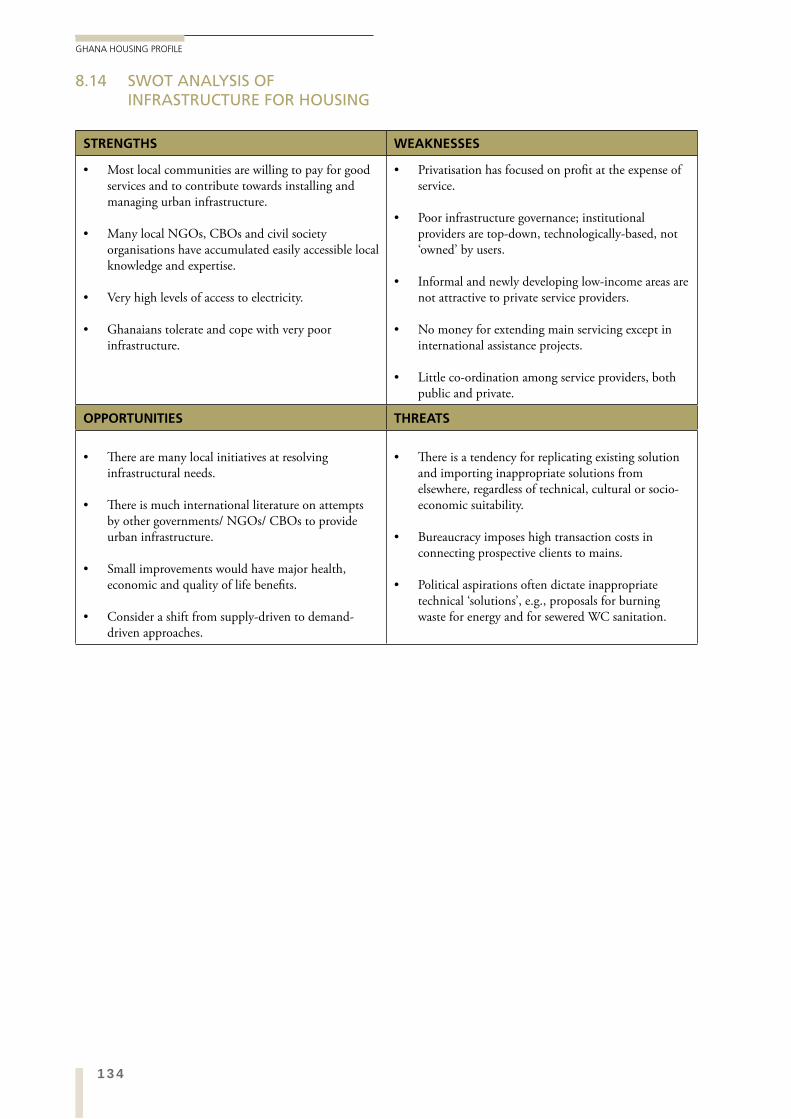
134
GHANA HOUSING PROFILE
8.14 SWOT ANALYSIS OF INFRASTRUCTURE FOR HOUSING
STRENGTHS WEAKNESSES
Most local communities are willing to pay for good services and to contribute towards installing and managing urban infrastructure.
Many local NGOs, CBOs and civil society organisations have accumulated easily accessible local knowledge and expertise.
Very high levels of access to electricity.
Ghanaians tolerate and cope with very poor infrastructure.
Privatisation has focused on profit at the expense of service.
Poor infrastructure governance; institutional providers are top-down, technologically-based, not ‘owned’ by users.
Informal and newly developing low-income areas are not attractive to private service providers.
No money for extending main servicing except in international assistance projects.
Little co-ordination among service providers, both public and private.
OPPORTUNITIES THREATS
There are many local initiatives at resolving infrastructural needs.
There is much international literature on attempts by other governments/ NGOs/ CBOs to provide urban infrastructure.
Small improvements would have major health, economic and quality of life benefits.
Consider a shift from supply-driven to demand-driven approaches.
There is a tendency for replicating existing solution and importing inappropriate solutions from elsewhere, regardless of technical, cultural or socio-economic suitability.
Bureaucracy imposes high transaction costs in connecting prospective clients to mains.
Political aspirations often dictate inappropriate technical ‘solutions’, e.g., proposals for burning waste for energy and for sewered WC sanitation.
135INFRASTRUCTURE FOR URBAN HOUSING
CHAPTER EIGHT
SECTION ENDNOTES
1 This chapter is largely based on a report by Martin Oteng Ababio2 Personal communication with Gabriel Nii Teiko Tagoe, 2011.3 Economist Information Unit (EIU) (1993:16).4 Government of Ghana (2007b)5 Tipple et al. (1999).6 COHRE (2004).7 If this is the case, it seems strange that: a) the residential population of the neighbourhood is considered at all if these facilities are meant for such
public arenas as markets, parks, transport terminals, etc., and that; b) the men’s toilet does not consist of, say, a bank of urinals and two toilet stalls, rather than four standard
holes for defecation. Surely this indicates intent for a routine daily evacuation rather than an occasional comfort stop when in
a public space?8 Government of Ghana (2010). But 5,000 people would require 100 holes and, therefore, 12.5 eight-hole
toilets.9 But there are also frequent ceremonies for opening new toilets. It is a very confused picture indeed.10 Boadi and Kuitunen (2005); Songsore et al. (2009); Oteng-Ababio (2010b).11 World Bank (2009c).12 Water Aid (2005).13 Water Aid (2005).14 Water Aid (2005).15 Government of Ghana (2003).16 Water Aid Ghana (2007).17 Oteng-Ababio (2007; 2010b)18 Oteng-Ababio (2010a)19 The Transport Sector development partners in Ghana include African Development Bank (AfDB),
French Development Agency (ADF), Arab Bank for Economic Development in Africa (BADEA), Danish International Development Agency (DANIDA), U.K. Department for International Development (Dff D), Japan International Cooperation Agency (JICA), Kreditanstalt fur Wiederauflau (KfW), Millennium Challenge Corporation (MCC), Netherlands, Saudi Fund, United States Agency for International Development (USAID), European Commission (EC), and the World Bank.
20 Government of Ghana (2007a).21 Ministry of Transport (2007).22 Ministry of Transport (2007)23 Songsore et al (2009)24 Water Aid Ghana (2007).25 Government of Ghana (2003).26 Tamale Municipal Assembly (2002).27 Tamale Municipal Assembly (2002).28 Water Aid (2005).29 Water Aid (2008).30 Or what is popularly called a ‘Kufuor gallon’.31 Maclean (2010).32 Water Aid (2005).33 Water Aid (2008).34 Maclean (2010)35 This particularly occurs where priority users are present, e.g., near the Castle in Accra.36 Ghana Statistical Service (2008: 69).37 At least some of those relying on sachet or bottled water may have indoor plumbing but do not use it
for drinking. This is supported by GLSS 5 data on water sources for general use in which sachet /bottled water is used by only 0.7 per cent in GAMA and almost no-one elsewhere.
38 Akuffo (2007).39 COHRE (2004).40 Van Der Geest (1998).41 Akosa et al.(1995).42 Jenkins and Scott (2007).43 Ghana Statistical Service (2008: 69).44 Weeks et al. (2007).45 Akosa et al. (1995).
136
GHANA HOUSING PROFILE
46 Akuffo (2007).47 Anyone who has had to rely on a WC system during times of water stoppage through the pipes will
recognise that, in areas of low water flow, a conventional WC can be the worst possible form of sanitation in a home.
48 Akosa et al. (1995: 64).49 Tipple et al.(1999).50 Akuffo (2007).51 Akuffo (2007).52 COHRE (2004).53 Jenkins and Scott (2007).54 van der Geest (1998, cited in Jenkins and Scott, 2007: 15).55 Jenkins and Scott (2007).56 Jenkins and Scott (2007).57 Jenkins and Scott (2007).58 Whittington et al. (1993).59 Ghana Statistical Service (2008: 71).60 Akuffo (2007).61 Personal interview with Head of WMD, Tamale.62 Oteng-Ababio (2010a).63 Obeng et al.(2008).64 Akuffo (2007).65 Tipple et al. (1999).66 Akuffo (2007).67 World Bank (2000).68 World Bank (2000).69 Ghana News Agency (2010).70 Water Aid (2000).71 World Health Organisation (2004).72 World Bank (2010).73 Yap (1988); UNCHS/ILO (1995).74 UN-HABITAT (2003).
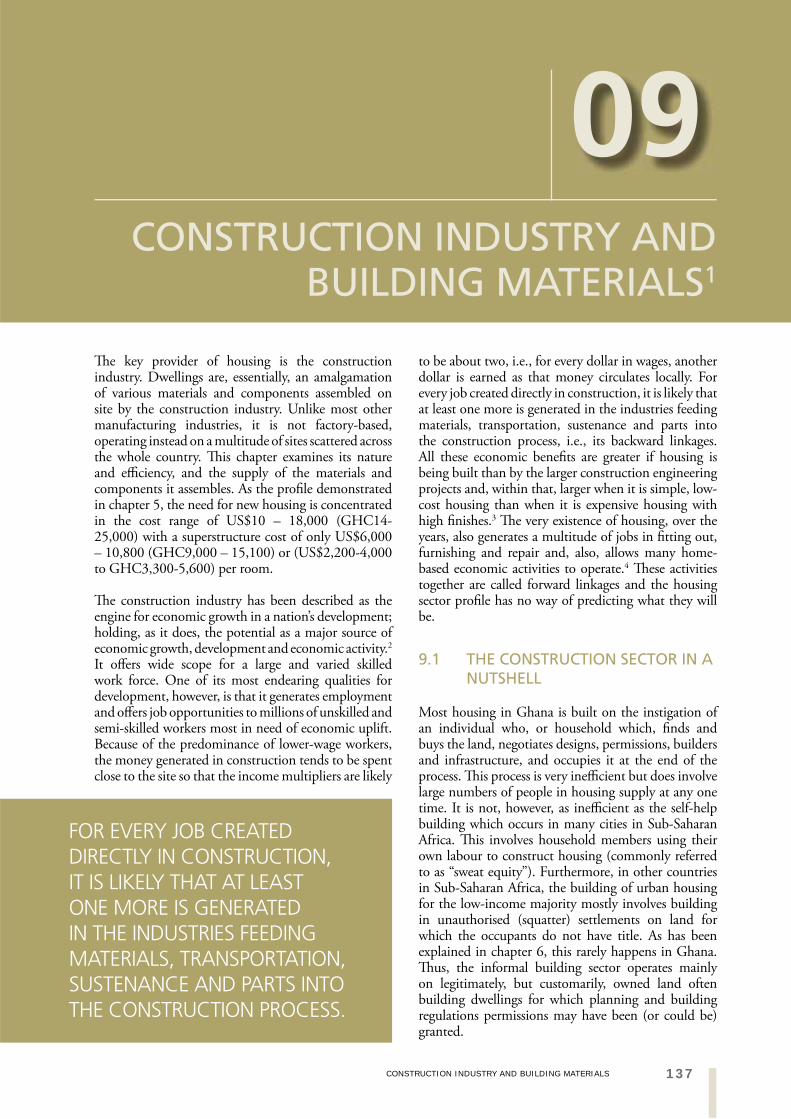
137CONSTRUCTION INDUSTRY AND BUILDING MATERIALS
CHAPTER NINE
to be about two, i.e., for every dollar in wages, another dollar is earned as that money circulates locally. For every job created directly in construction, it is likely that at least one more is generated in the industries feeding materials, transportation, sustenance and parts into the construction process, i.e., its backward linkages. All these economic benefits are greater if housing is being built than by the larger construction engineering projects and, within that, larger when it is simple, low-cost housing than when it is expensive housing with high finishes.3 The very existence of housing, over the years, also generates a multitude of jobs in fitting out, furnishing and repair and, also, allows many home-based economic activities to operate.4 These activities together are called forward linkages and the housing sector profile has no way of predicting what they will be.
9.1 THE CONSTRUCTION SECTOR IN A NUTSHELL
Most housing in Ghana is built on the instigation of an individual who, or household which, finds and buys the land, negotiates designs, permissions, builders and infrastructure, and occupies it at the end of the process. This process is very inefficient but does involve large numbers of people in housing supply at any one time. It is not, however, as inefficient as the self-help building which occurs in many cities in Sub-Saharan Africa. This involves household members using their own labour to construct housing (commonly referred to as “sweat equity”). Furthermore, in other countries in Sub-Saharan Africa, the building of urban housing for the low-income majority mostly involves building in unauthorised (squatter) settlements on land for which the occupants do not have title. As has been explained in chapter 6, this rarely happens in Ghana. Thus, the informal building sector operates mainly on legitimately, but customarily, owned land often building dwellings for which planning and building regulations permissions may have been (or could be) granted.
The key provider of housing is the construction industry. Dwellings are, essentially, an amalgamation of various materials and components assembled on site by the construction industry. Unlike most other manufacturing industries, it is not factory-based, operating instead on a multitude of sites scattered across the whole country. This chapter examines its nature and efficiency, and the supply of the materials and components it assembles. As the profile demonstrated in chapter 5, the need for new housing is concentrated in the cost range of US$10 – 18,000 (GHC14-25,000) with a superstructure cost of only US$6,000 – 10,800 (GHC9,000 – 15,100) or (US$2,200-4,000 to GHC3,300-5,600) per room.
The construction industry has been described as the engine for economic growth in a nation’s development; holding, as it does, the potential as a major source of economic growth, development and economic activity.2 It offers wide scope for a large and varied skilled work force. One of its most endearing qualities for development, however, is that it generates employment and offers job opportunities to millions of unskilled and semi-skilled workers most in need of economic uplift. Because of the predominance of lower-wage workers, the money generated in construction tends to be spent close to the site so that the income multipliers are likely
09CONSTRUCTION INDUSTRY AND
BUILDING MATERIALS1
FOR EVERY JOB CREATED DIRECTLY IN CONSTRUCTION, IT IS LIKELY THAT AT LEAST ONE MORE IS GENERATED IN THE INDUSTRIES FEEDING MATERIALS, TRANSPORTATION, SUSTENANCE AND PARTS INTO THE CONSTRUCTION PROCESS.
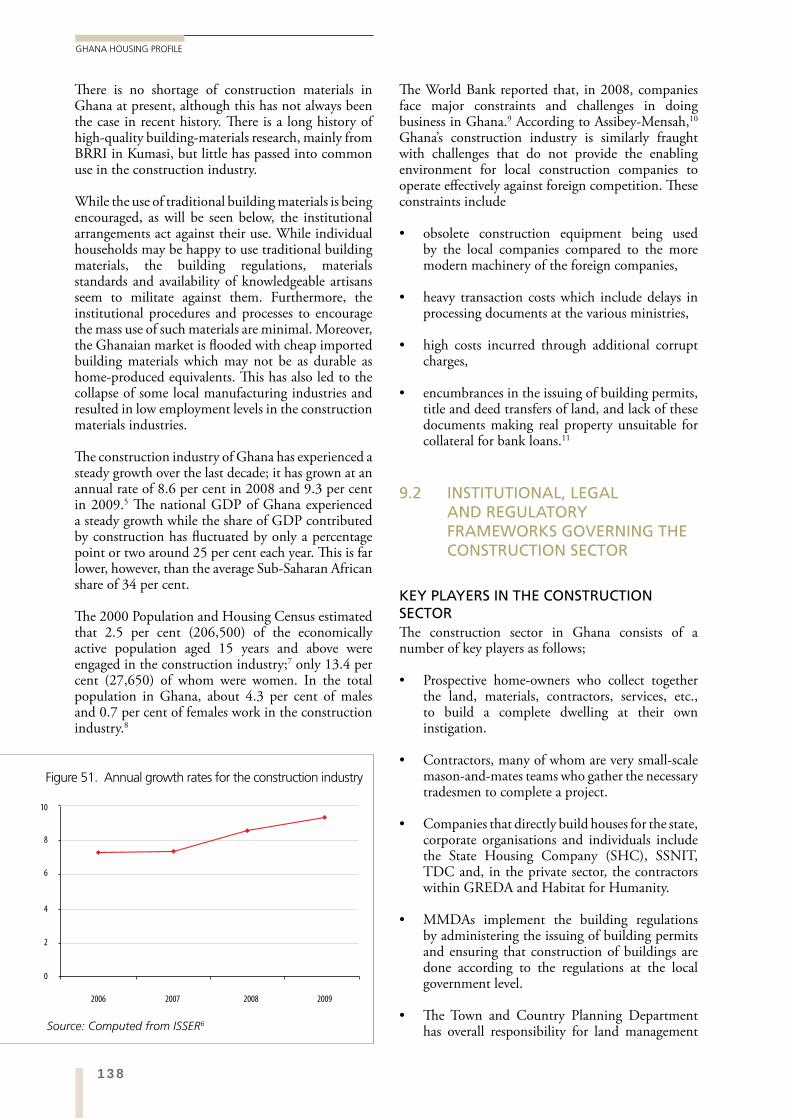
138
GHANA HOUSING PROFILE
The World Bank reported that, in 2008, companies face major constraints and challenges in doing business in Ghana.9 According to Assibey-Mensah,10
Ghana’s construction industry is similarly fraught with challenges that do not provide the enabling environment for local construction companies to operate effectively against foreign competition. These constraints include
obsolete construction equipment being used by the local companies compared to the more modern machinery of the foreign companies,
heavy transaction costs which include delays in processing documents at the various ministries,
high costs incurred through additional corrupt charges,
encumbrances in the issuing of building permits, title and deed transfers of land, and lack of these documents making real property unsuitable for collateral for bank loans.11
9.2 INSTITUTIONAL, LEGAL AND REGULATORY FRAMEWORKS GOVERNING THE CONSTRUCTION SECTOR
KEY PLAYERS IN THE CONSTRUCTION SECTOR The construction sector in Ghana consists of a number of key players as follows;
Prospective home-owners who collect together the land, materials, contractors, services, etc., to build a complete dwelling at their own instigation.
Contractors, many of whom are very small-scale mason-and-mates teams who gather the necessary tradesmen to complete a project.
Companies that directly build houses for the state, corporate organisations and individuals include the State Housing Company (SHC), SSNIT, TDC and, in the private sector, the contractors within GREDA and Habitat for Humanity.
MMDAs implement the building regulations by administering the issuing of building permits and ensuring that construction of buildings are done according to the regulations at the local government level.
The Town and Country Planning Department has overall responsibility for land management
There is no shortage of construction materials in Ghana at present, although this has not always been the case in recent history. There is a long history of high-quality building-materials research, mainly from BRRI in Kumasi, but little has passed into common use in the construction industry.
While the use of traditional building materials is being encouraged, as will be seen below, the institutional arrangements act against their use. While individual households may be happy to use traditional building materials, the building regulations, materials standards and availability of knowledgeable artisans seem to militate against them. Furthermore, the institutional procedures and processes to encourage the mass use of such materials are minimal. Moreover, the Ghanaian market is flooded with cheap imported building materials which may not be as durable as home-produced equivalents. This has also led to the collapse of some local manufacturing industries and resulted in low employment levels in the construction materials industries.
The construction industry of Ghana has experienced a steady growth over the last decade; it has grown at an annual rate of 8.6 per cent in 2008 and 9.3 per cent in 2009.5 The national GDP of Ghana experienced a steady growth while the share of GDP contributed by construction has fluctuated by only a percentage point or two around 25 per cent each year. This is far lower, however, than the average Sub-Saharan African share of 34 per cent.
The 2000 Population and Housing Census estimated that 2.5 per cent (206,500) of the economically active population aged 15 years and above were engaged in the construction industry;7 only 13.4 per cent (27,650) of whom were women. In the total population in Ghana, about 4.3 per cent of males and 0.7 per cent of females work in the construction industry.8
2006 2007 2008 2009
0
2
4
6
8
10
Figure 51. Annual growth rates for the construction industry
Source: Computed from ISSER6
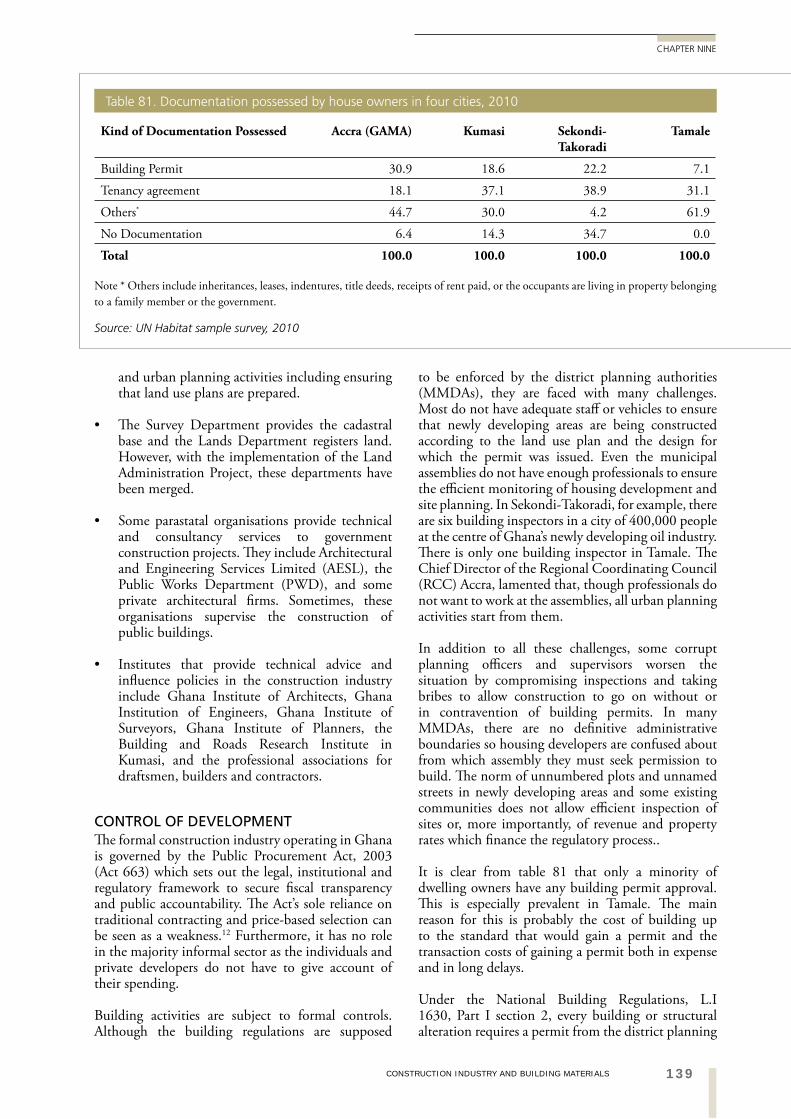
139CONSTRUCTION INDUSTRY AND BUILDING MATERIALS
CHAPTER NINE
to be enforced by the district planning authorities (MMDAs), they are faced with many challenges. Most do not have adequate staff or vehicles to ensure that newly developing areas are being constructed according to the land use plan and the design for which the permit was issued. Even the municipal assemblies do not have enough professionals to ensure the efficient monitoring of housing development and site planning. In Sekondi-Takoradi, for example, there are six building inspectors in a city of 400,000 people at the centre of Ghana’s newly developing oil industry. There is only one building inspector in Tamale. The Chief Director of the Regional Coordinating Council (RCC) Accra, lamented that, though professionals do not want to work at the assemblies, all urban planning activities start from them.
In addition to all these challenges, some corrupt planning officers and supervisors worsen the situation by compromising inspections and taking bribes to allow construction to go on without or in contravention of building permits. In many MMDAs, there are no definitive administrative boundaries so housing developers are confused about from which assembly they must seek permission to build. The norm of unnumbered plots and unnamed streets in newly developing areas and some existing communities does not allow efficient inspection of sites or, more importantly, of revenue and property rates which finance the regulatory process..
It is clear from table 81 that only a minority of dwelling owners have any building permit approval. This is especially prevalent in Tamale. The main reason for this is probably the cost of building up to the standard that would gain a permit and the transaction costs of gaining a permit both in expense and in long delays.
Under the National Building Regulations, L.I 1630, Part I section 2, every building or structural alteration requires a permit from the district planning
and urban planning activities including ensuring that land use plans are prepared.
The Survey Department provides the cadastral base and the Lands Department registers land. However, with the implementation of the Land Administration Project, these departments have been merged.
Some parastatal organisations provide technical and consultancy services to government construction projects. They include Architectural and Engineering Services Limited (AESL), the Public Works Department (PWD), and some private architectural firms. Sometimes, these organisations supervise the construction of public buildings.
Institutes that provide technical advice and influence policies in the construction industry include Ghana Institute of Architects, Ghana Institution of Engineers, Ghana Institute of Surveyors, Ghana Institute of Planners, the Building and Roads Research Institute in Kumasi, and the professional associations for draftsmen, builders and contractors.
CONTROL OF DEVELOPMENTThe formal construction industry operating in Ghana is governed by the Public Procurement Act, 2003 (Act 663) which sets out the legal, institutional and regulatory framework to secure fiscal transparency and public accountability. The Act’s sole reliance on traditional contracting and price-based selection can be seen as a weakness.12 Furthermore, it has no role in the majority informal sector as the individuals and private developers do not have to give account of their spending.
Building activities are subject to formal controls. Although the building regulations are supposed
Kind of Documentation Possessed Accra (GAMA) Kumasi Sekondi-Takoradi
Tamale
Building Permit 30.9 18.6 22.2 7.1
Tenancy agreement 18.1 37.1 38.9 31.1
Others* 44.7 30.0 4.2 61.9
No Documentation 6.4 14.3 34.7 0.0
Total 100.0 100.0 100.0 100.0
Source: UN Habitat sample survey, 2010
Note * Others include inheritances, leases, indentures, title deeds, receipts of rent paid, or the occupants are living in property belonging to a family member or the government.
Table 81. Documentation possessed by house owners in four cities, 2010
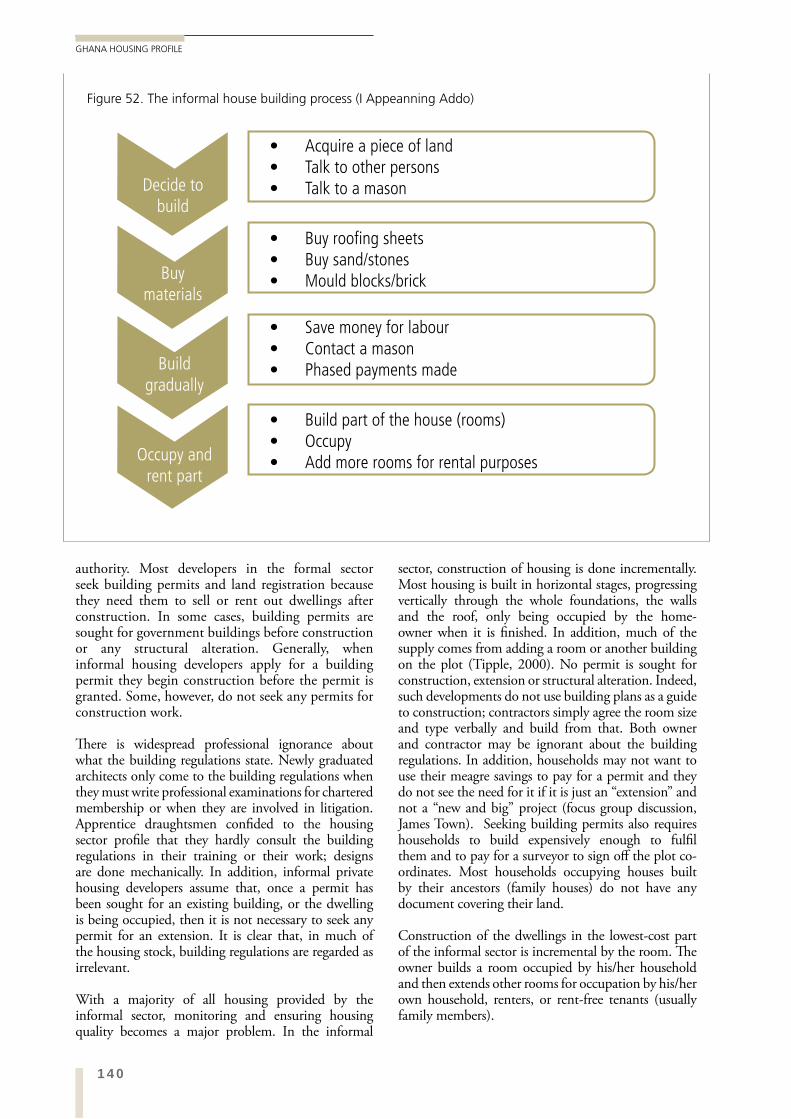
140
GHANA HOUSING PROFILE
sector, construction of housing is done incrementally. Most housing is built in horizontal stages, progressing vertically through the whole foundations, the walls and the roof, only being occupied by the home-owner when it is finished. In addition, much of the supply comes from adding a room or another building on the plot (Tipple, 2000). No permit is sought for construction, extension or structural alteration. Indeed, such developments do not use building plans as a guide to construction; contractors simply agree the room size and type verbally and build from that. Both owner and contractor may be ignorant about the building regulations. In addition, households may not want to use their meagre savings to pay for a permit and they do not see the need for it if it is just an “extension” and not a “new and big” project (focus group discussion, James Town). Seeking building permits also requires households to build expensively enough to fulfil them and to pay for a surveyor to sign off the plot co-ordinates. Most households occupying houses built by their ancestors (family houses) do not have any document covering their land.
Construction of the dwellings in the lowest-cost part of the informal sector is incremental by the room. The owner builds a room occupied by his/her household and then extends other rooms for occupation by his/her own household, renters, or rent-free tenants (usually family members).
authority. Most developers in the formal sector seek building permits and land registration because they need them to sell or rent out dwellings after construction. In some cases, building permits are sought for government buildings before construction or any structural alteration. Generally, when informal housing developers apply for a building permit they begin construction before the permit is granted. Some, however, do not seek any permits for construction work.
There is widespread professional ignorance about what the building regulations state. Newly graduated architects only come to the building regulations when they must write professional examinations for chartered membership or when they are involved in litigation. Apprentice draughtsmen confided to the housing sector profile that they hardly consult the building regulations in their training or their work; designs are done mechanically. In addition, informal private housing developers assume that, once a permit has been sought for an existing building, or the dwelling is being occupied, then it is not necessary to seek any permit for an extension. It is clear that, in much of the housing stock, building regulations are regarded as irrelevant.
With a majority of all housing provided by the informal sector, monitoring and ensuring housing quality becomes a major problem. In the informal
Acquire a piece of landTalk to other personsTalk to a mason
Buy roofing sheetsBuy sand/stonesMould blocks/brick
Save money for labourContact a masonPhased payments made
Build part of the house (rooms)OccupyAdd more rooms for rental purposes
Decide to build
Buy materials
Build gradually
Occupy and rent part
Figure 52. The informal house building process (I Appeanning Addo)
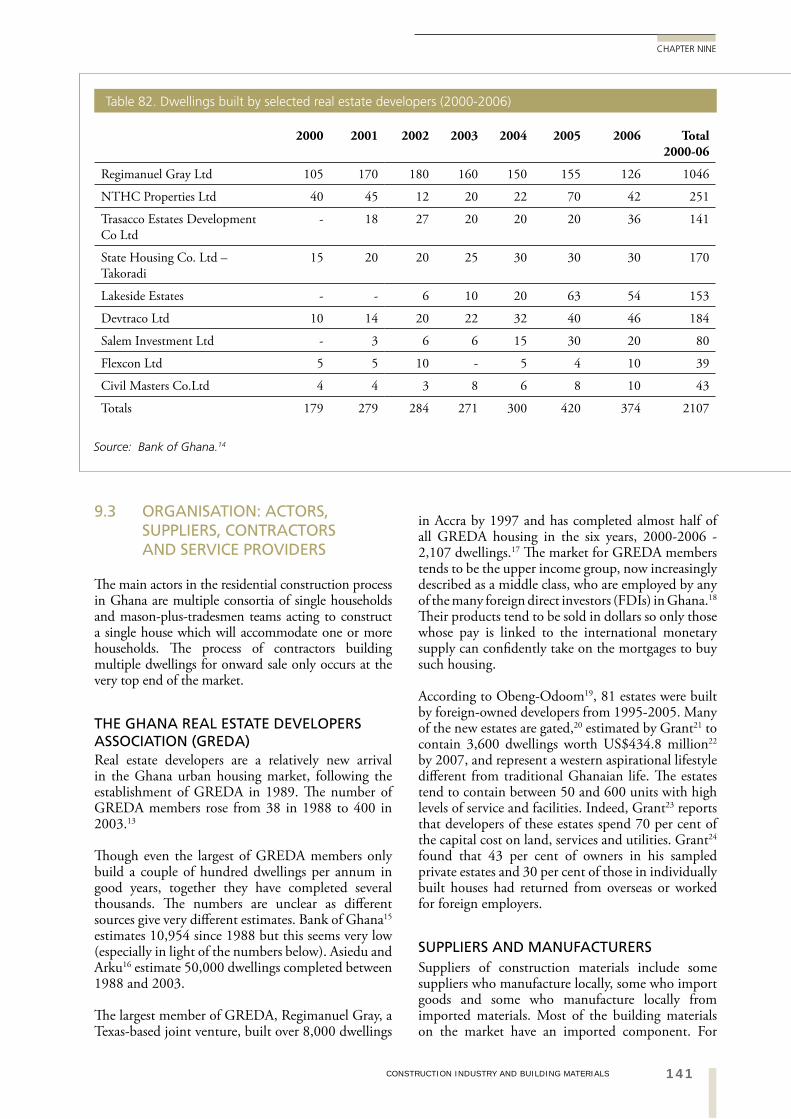
141CONSTRUCTION INDUSTRY AND BUILDING MATERIALS
CHAPTER NINE
in Accra by 1997 and has completed almost half of all GREDA housing in the six years, 2000-2006 - 2,107 dwellings.17 The market for GREDA members tends to be the upper income group, now increasingly described as a middle class, who are employed by any of the many foreign direct investors (FDIs) in Ghana.18 Their products tend to be sold in dollars so only those whose pay is linked to the international monetary supply can confidently take on the mortgages to buy such housing.
According to Obeng-Odoom19, 81 estates were built by foreign-owned developers from 1995-2005. Many of the new estates are gated,20 estimated by Grant21 to contain 3,600 dwellings worth US$434.8 million22 by 2007, and represent a western aspirational lifestyle different from traditional Ghanaian life. The estates tend to contain between 50 and 600 units with high levels of service and facilities. Indeed, Grant23 reports that developers of these estates spend 70 per cent of the capital cost on land, services and utilities. Grant24 found that 43 per cent of owners in his sampled private estates and 30 per cent of those in individually built houses had returned from overseas or worked for foreign employers.
SUPPLIERS AND MANUFACTURERSSuppliers of construction materials include some suppliers who manufacture locally, some who import goods and some who manufacture locally from imported materials. Most of the building materials on the market have an imported component. For
9.3 ORGANISATION: ACTORS, SUPPLIERS, CONTRACTORS AND SERVICE PROVIDERS
The main actors in the residential construction process in Ghana are multiple consortia of single households and mason-plus-tradesmen teams acting to construct a single house which will accommodate one or more households. The process of contractors building multiple dwellings for onward sale only occurs at the very top end of the market.
THE GHANA REAL ESTATE DEVELOPERS ASSOCIATION (GREDA)Real estate developers are a relatively new arrival in the Ghana urban housing market, following the establishment of GREDA in 1989. The number of GREDA members rose from 38 in 1988 to 400 in 2003.13
Though even the largest of GREDA members only build a couple of hundred dwellings per annum in good years, together they have completed several thousands. The numbers are unclear as different sources give very different estimates. Bank of Ghana15 estimates 10,954 since 1988 but this seems very low (especially in light of the numbers below). Asiedu and Arku16 estimate 50,000 dwellings completed between 1988 and 2003.
The largest member of GREDA, Regimanuel Gray, a Texas-based joint venture, built over 8,000 dwellings
2000 2001 2002 2003 2004 2005 2006 Total 2000-06
Regimanuel Gray Ltd 105 170 180 160 150 155 126 1046
NTHC Properties Ltd 40 45 12 20 22 70 42 251
Trasacco Estates Development Co Ltd
- 18 27 20 20 20 36 141
State Housing Co. Ltd – Takoradi
15 20 20 25 30 30 30 170
Lakeside Estates - - 6 10 20 63 54 153
Devtraco Ltd 10 14 20 22 32 40 46 184
Salem Investment Ltd - 3 6 6 15 30 20 80
Flexcon Ltd 5 5 10 - 5 4 10 39
Civil Masters Co.Ltd 4 4 3 8 6 8 10 43
Totals 179 279 284 271 300 420 374 2107
Table 82. Dwellings built by selected real estate developers (2000-2006)
Source: Bank of Ghana.14
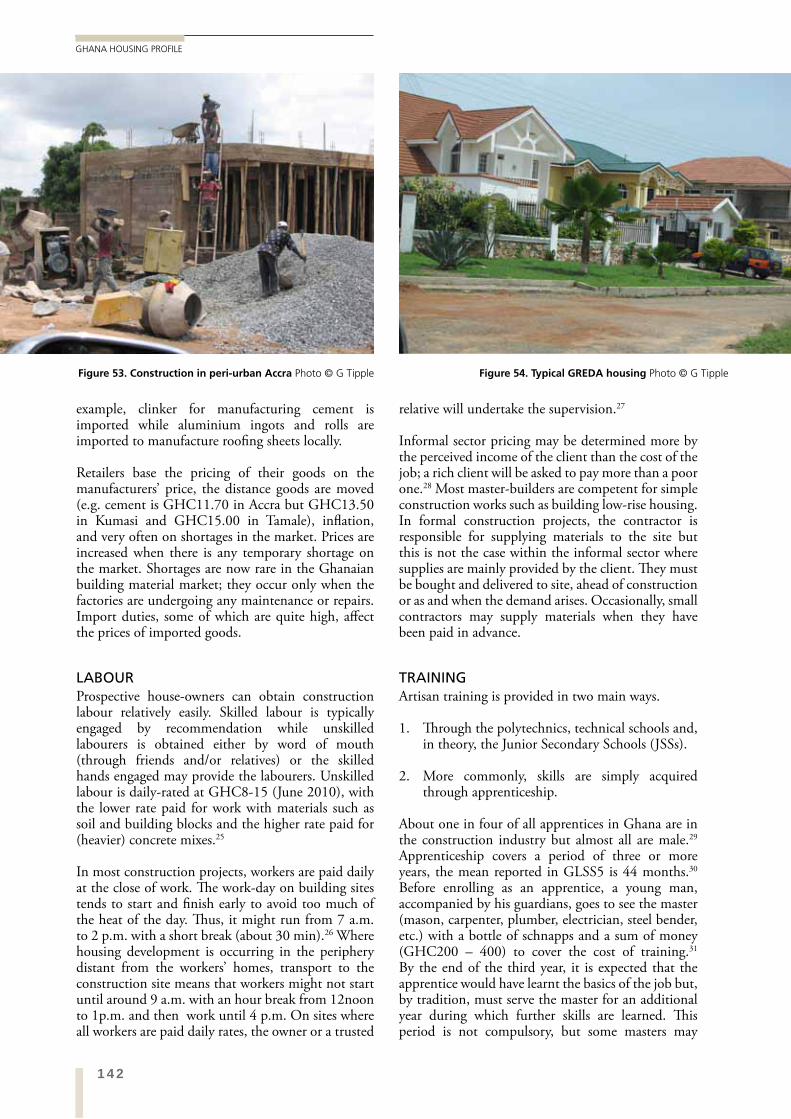
142
GHANA HOUSING PROFILE
relative will undertake the supervision.27
Informal sector pricing may be determined more by the perceived income of the client than the cost of the job; a rich client will be asked to pay more than a poor one.28 Most master-builders are competent for simple construction works such as building low-rise housing. In formal construction projects, the contractor is responsible for supplying materials to the site but this is not the case within the informal sector where supplies are mainly provided by the client. They must be bought and delivered to site, ahead of construction or as and when the demand arises. Occasionally, small contractors may supply materials when they have been paid in advance.
TRAININGArtisan training is provided in two main ways.
1. Through the polytechnics, technical schools and, in theory, the Junior Secondary Schools (JSSs).
2. More commonly, skills are simply acquired through apprenticeship.
About one in four of all apprentices in Ghana are in the construction industry but almost all are male.29 Apprenticeship covers a period of three or more years, the mean reported in GLSS5 is 44 months.30 Before enrolling as an apprentice, a young man, accompanied by his guardians, goes to see the master (mason, carpenter, plumber, electrician, steel bender, etc.) with a bottle of schnapps and a sum of money (GHC200 – 400) to cover the cost of training.31 By the end of the third year, it is expected that the apprentice would have learnt the basics of the job but, by tradition, must serve the master for an additional year during which further skills are learned. This period is not compulsory, but some masters may
example, clinker for manufacturing cement is imported while aluminium ingots and rolls are imported to manufacture roofing sheets locally.
Retailers base the pricing of their goods on the manufacturers’ price, the distance goods are moved (e.g. cement is GHC11.70 in Accra but GHC13.50 in Kumasi and GHC15.00 in Tamale), inflation, and very often on shortages in the market. Prices are increased when there is any temporary shortage on the market. Shortages are now rare in the Ghanaian building material market; they occur only when the factories are undergoing any maintenance or repairs. Import duties, some of which are quite high, affect the prices of imported goods.
LABOURProspective house-owners can obtain construction labour relatively easily. Skilled labour is typically engaged by recommendation while unskilled labourers is obtained either by word of mouth (through friends and/or relatives) or the skilled hands engaged may provide the labourers. Unskilled labour is daily-rated at GHC8-15 (June 2010), with the lower rate paid for work with materials such as soil and building blocks and the higher rate paid for (heavier) concrete mixes.25
In most construction projects, workers are paid daily at the close of work. The work-day on building sites tends to start and finish early to avoid too much of the heat of the day. Thus, it might run from 7 a.m. to 2 p.m. with a short break (about 30 min).26 Where housing development is occurring in the periphery distant from the workers’ homes, transport to the construction site means that workers might not start until around 9 a.m. with an hour break from 12noon to 1p.m. and then work until 4 p.m. On sites where all workers are paid daily rates, the owner or a trusted
Figure 53. Construction in peri-urban Accra Photo © G Tipple Figure 54. Typical GREDA housing Photo © G Tipple
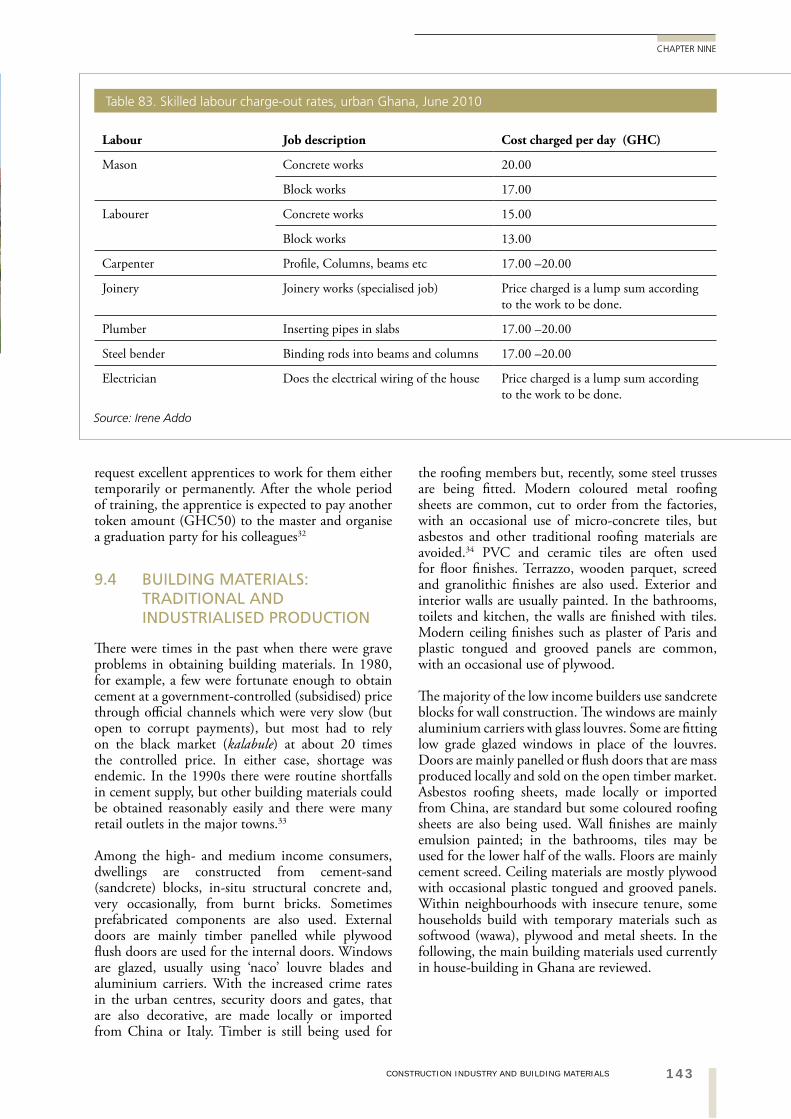
143CONSTRUCTION INDUSTRY AND BUILDING MATERIALS
CHAPTER NINE
the roofing members but, recently, some steel trusses are being fitted. Modern coloured metal roofing sheets are common, cut to order from the factories, with an occasional use of micro-concrete tiles, but asbestos and other traditional roofing materials are avoided.34 PVC and ceramic tiles are often used for floor finishes. Terrazzo, wooden parquet, screed and granolithic finishes are also used. Exterior and interior walls are usually painted. In the bathrooms, toilets and kitchen, the walls are finished with tiles. Modern ceiling finishes such as plaster of Paris and plastic tongued and grooved panels are common, with an occasional use of plywood.
The majority of the low income builders use sandcrete blocks for wall construction. The windows are mainly aluminium carriers with glass louvres. Some are fitting low grade glazed windows in place of the louvres. Doors are mainly panelled or flush doors that are mass produced locally and sold on the open timber market. Asbestos roofing sheets, made locally or imported from China, are standard but some coloured roofing sheets are also being used. Wall finishes are mainly emulsion painted; in the bathrooms, tiles may be used for the lower half of the walls. Floors are mainly cement screed. Ceiling materials are mostly plywood with occasional plastic tongued and grooved panels. Within neighbourhoods with insecure tenure, some households build with temporary materials such as softwood (wawa), plywood and metal sheets. In the following, the main building materials used currently in house-building in Ghana are reviewed.
request excellent apprentices to work for them either temporarily or permanently. After the whole period of training, the apprentice is expected to pay another token amount (GHC50) to the master and organise a graduation party for his colleagues32
9.4 BUILDING MATERIALS: TRADITIONAL AND INDUSTRIALISED PRODUCTION
There were times in the past when there were grave problems in obtaining building materials. In 1980, for example, a few were fortunate enough to obtain cement at a government-controlled (subsidised) price through official channels which were very slow (but open to corrupt payments), but most had to rely on the black market (kalabule) at about 20 times the controlled price. In either case, shortage was endemic. In the 1990s there were routine shortfalls in cement supply, but other building materials could be obtained reasonably easily and there were many retail outlets in the major towns.33
Among the high- and medium income consumers, dwellings are constructed from cement-sand (sandcrete) blocks, in-situ structural concrete and, very occasionally, from burnt bricks. Sometimes prefabricated components are also used. External doors are mainly timber panelled while plywood flush doors are used for the internal doors. Windows are glazed, usually using ‘naco’ louvre blades and aluminium carriers. With the increased crime rates in the urban centres, security doors and gates, that are also decorative, are made locally or imported from China or Italy. Timber is still being used for
Labour Job description Cost charged per day (GHC)
Mason Concrete works 20.00
Block works 17.00
Labourer Concrete works 15.00
Block works 13.00
Carpenter Profile, Columns, beams etc 17.00 –20.00
Joinery Joinery works (specialised job) Price charged is a lump sum according to the work to be done.
Plumber Inserting pipes in slabs 17.00 –20.00
Steel bender Binding rods into beams and columns 17.00 –20.00
Electrician Does the electrical wiring of the house Price charged is a lump sum according to the work to be done.
Source: Irene Addo
Table 83. Skilled labour charge-out rates, urban Ghana, June 2010
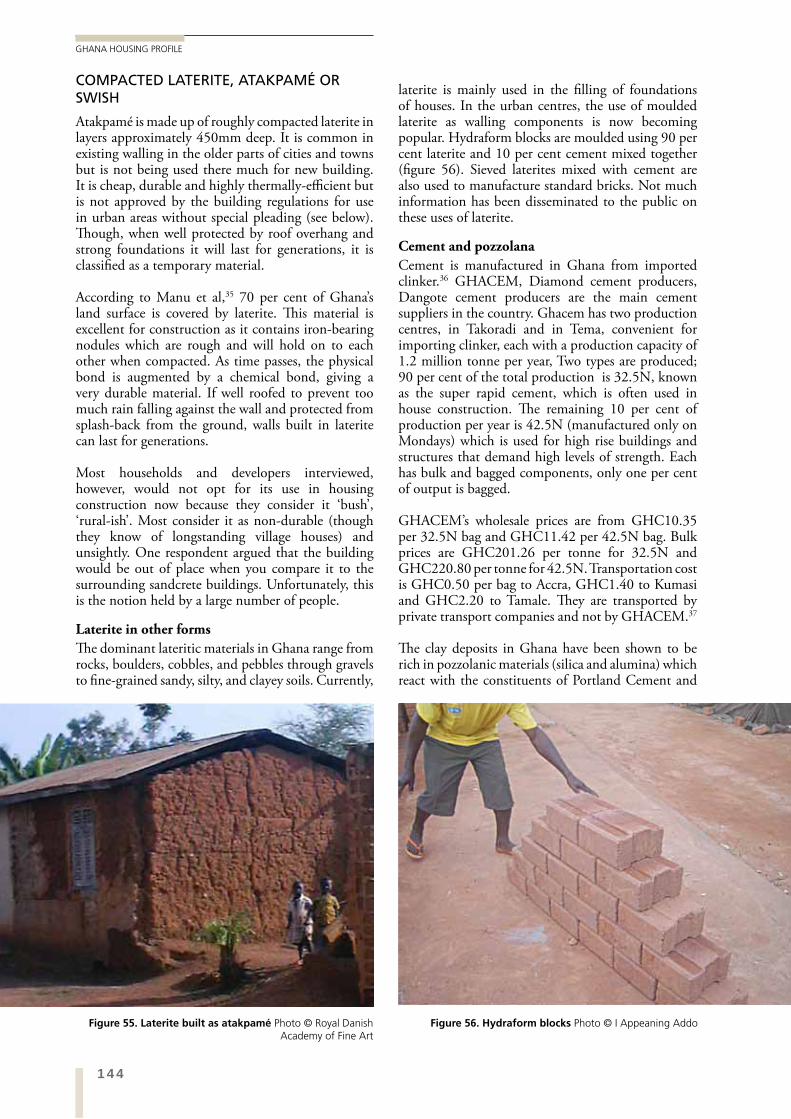
144
GHANA HOUSING PROFILE
laterite is mainly used in the filling of foundations of houses. In the urban centres, the use of moulded laterite as walling components is now becoming popular. Hydraform blocks are moulded using 90 per cent laterite and 10 per cent cement mixed together (figure 56). Sieved laterites mixed with cement are also used to manufacture standard bricks. Not much information has been disseminated to the public on these uses of laterite.
Cement and pozzolana
Cement is manufactured in Ghana from imported clinker.36 GHACEM, Diamond cement producers, Dangote cement producers are the main cement suppliers in the country. Ghacem has two production centres, in Takoradi and in Tema, convenient for importing clinker, each with a production capacity of 1.2 million tonne per year, Two types are produced; 90 per cent of the total production is 32.5N, known as the super rapid cement, which is often used in house construction. The remaining 10 per cent of production per year is 42.5N (manufactured only on Mondays) which is used for high rise buildings and structures that demand high levels of strength. Each has bulk and bagged components, only one per cent of output is bagged.
GHACEM’s wholesale prices are from GHC10.35 per 32.5N bag and GHC11.42 per 42.5N bag. Bulk prices are GHC201.26 per tonne for 32.5N and GHC220.80 per tonne for 42.5N. Transportation cost is GHC0.50 per bag to Accra, GHC1.40 to Kumasi and GHC2.20 to Tamale. They are transported by private transport companies and not by GHACEM.37
The clay deposits in Ghana have been shown to be rich in pozzolanic materials (silica and alumina) which react with the constituents of Portland Cement and
COMPACTED LATERITE, ATAKPAMÉ OR SWISH
Atakpamé is made up of roughly compacted laterite in layers approximately 450mm deep. It is common in existing walling in the older parts of cities and towns but is not being used there much for new building. It is cheap, durable and highly thermally-efficient but is not approved by the building regulations for use in urban areas without special pleading (see below). Though, when well protected by roof overhang and strong foundations it will last for generations, it is classified as a temporary material.
According to Manu et al,35 70 per cent of Ghana’s land surface is covered by laterite. This material is excellent for construction as it contains iron-bearing nodules which are rough and will hold on to each other when compacted. As time passes, the physical bond is augmented by a chemical bond, giving a very durable material. If well roofed to prevent too much rain falling against the wall and protected from splash-back from the ground, walls built in laterite can last for generations.
Most households and developers interviewed, however, would not opt for its use in housing construction now because they consider it ‘bush’, ‘rural-ish’. Most consider it as non-durable (though they know of longstanding village houses) and unsightly. One respondent argued that the building would be out of place when you compare it to the surrounding sandcrete buildings. Unfortunately, this is the notion held by a large number of people.
Laterite in other forms
The dominant lateritic materials in Ghana range from rocks, boulders, cobbles, and pebbles through gravels to fine-grained sandy, silty, and clayey soils. Currently,
Figure 56. Hydraform blocks Photo © I Appeaning AddoFigure 55. Laterite built as atakpamé Photo © Royal Danish Academy of Fine Art
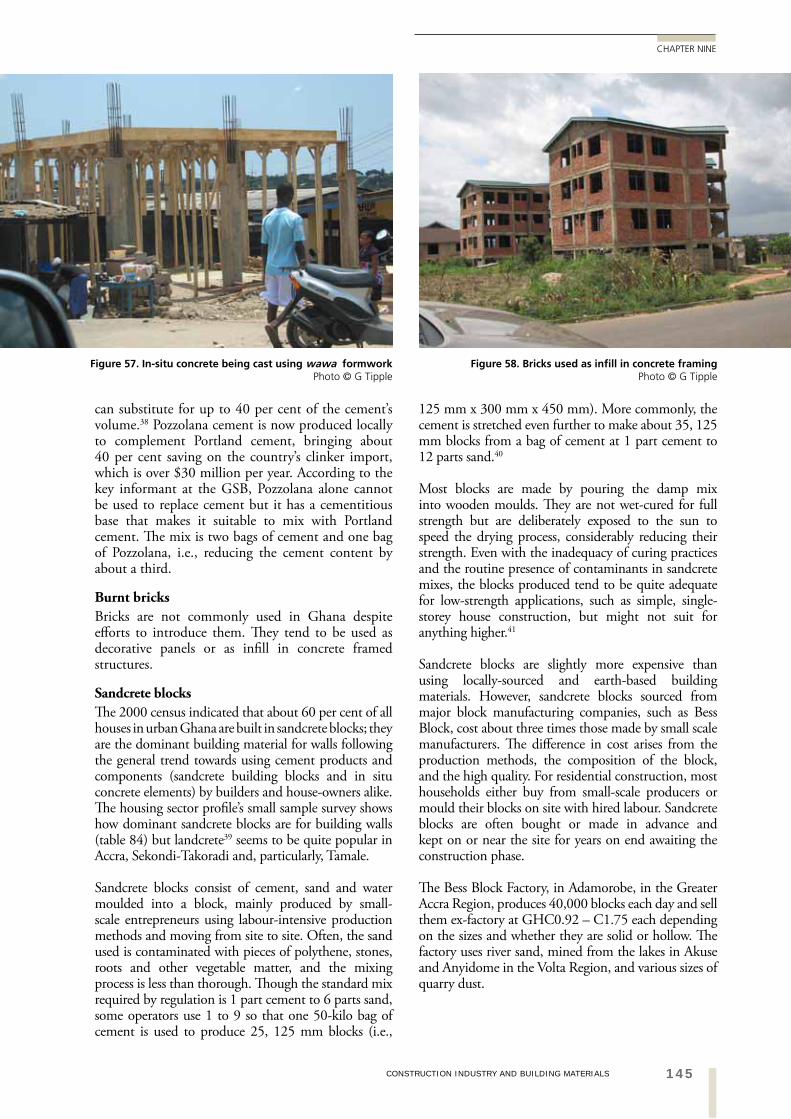
145CONSTRUCTION INDUSTRY AND BUILDING MATERIALS
CHAPTER NINE
125 mm x 300 mm x 450 mm). More commonly, the cement is stretched even further to make about 35, 125 mm blocks from a bag of cement at 1 part cement to 12 parts sand.40
Most blocks are made by pouring the damp mix into wooden moulds. They are not wet-cured for full strength but are deliberately exposed to the sun to speed the drying process, considerably reducing their strength. Even with the inadequacy of curing practices and the routine presence of contaminants in sandcrete mixes, the blocks produced tend to be quite adequate for low-strength applications, such as simple, single-storey house construction, but might not suit for anything higher.41
Sandcrete blocks are slightly more expensive than using locally-sourced and earth-based building materials. However, sandcrete blocks sourced from major block manufacturing companies, such as Bess Block, cost about three times those made by small scale manufacturers. The difference in cost arises from the production methods, the composition of the block, and the high quality. For residential construction, most households either buy from small-scale producers or mould their blocks on site with hired labour. Sandcrete blocks are often bought or made in advance and kept on or near the site for years on end awaiting the construction phase.
The Bess Block Factory, in Adamorobe, in the Greater Accra Region, produces 40,000 blocks each day and sell them ex-factory at GHC0.92 – C1.75 each depending on the sizes and whether they are solid or hollow. The factory uses river sand, mined from the lakes in Akuse and Anyidome in the Volta Region, and various sizes of quarry dust.
can substitute for up to 40 per cent of the cement’s volume.38 Pozzolana cement is now produced locally to complement Portland cement, bringing about 40 per cent saving on the country’s clinker import, which is over $30 million per year. According to the key informant at the GSB, Pozzolana alone cannot be used to replace cement but it has a cementitious base that makes it suitable to mix with Portland cement. The mix is two bags of cement and one bag of Pozzolana, i.e., reducing the cement content by about a third.
Burnt bricks
Bricks are not commonly used in Ghana despite efforts to introduce them. They tend to be used as decorative panels or as infill in concrete framed structures.
Sandcrete blocks
The 2000 census indicated that about 60 per cent of all houses in urban Ghana are built in sandcrete blocks; they are the dominant building material for walls following the general trend towards using cement products and components (sandcrete building blocks and in situ concrete elements) by builders and house-owners alike. The housing sector profile’s small sample survey shows how dominant sandcrete blocks are for building walls (table 84) but landcrete39 seems to be quite popular in Accra, Sekondi-Takoradi and, particularly, Tamale.
Sandcrete blocks consist of cement, sand and water moulded into a block, mainly produced by small-scale entrepreneurs using labour-intensive production methods and moving from site to site. Often, the sand used is contaminated with pieces of polythene, stones, roots and other vegetable matter, and the mixing process is less than thorough. Though the standard mix required by regulation is 1 part cement to 6 parts sand, some operators use 1 to 9 so that one 50-kilo bag of cement is used to produce 25, 125 mm blocks (i.e.,
Figure 58. Bricks used as infill in concrete framingPhoto © G Tipple
Figure 57. In-situ concrete being cast using wawa formwork Photo © G Tipple
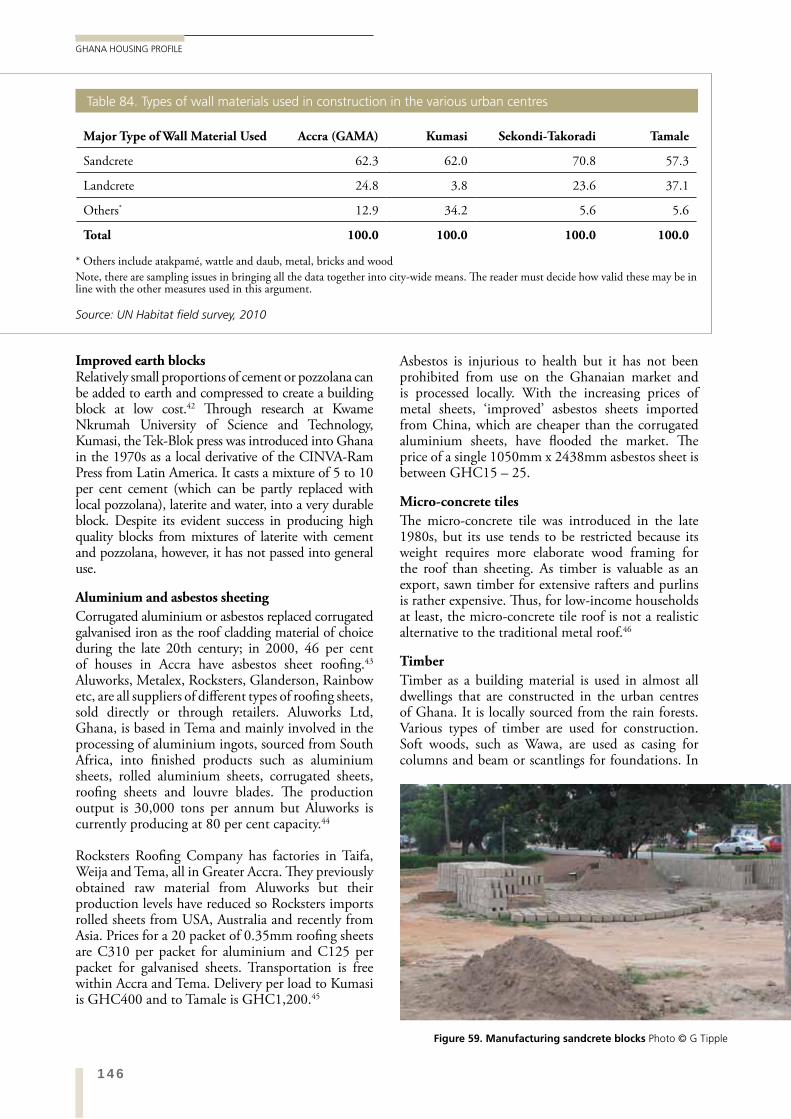
146
GHANA HOUSING PROFILE
Asbestos is injurious to health but it has not been prohibited from use on the Ghanaian market and is processed locally. With the increasing prices of metal sheets, ‘improved’ asbestos sheets imported from China, which are cheaper than the corrugated aluminium sheets, have flooded the market. The price of a single 1050mm x 2438mm asbestos sheet is between GHC15 – 25.
Micro-concrete tiles
The micro-concrete tile was introduced in the late 1980s, but its use tends to be restricted because its weight requires more elaborate wood framing for the roof than sheeting. As timber is valuable as an export, sawn timber for extensive rafters and purlins is rather expensive. Thus, for low-income households at least, the micro-concrete tile roof is not a realistic alternative to the traditional metal roof.46
Timber
Timber as a building material is used in almost all dwellings that are constructed in the urban centres of Ghana. It is locally sourced from the rain forests. Various types of timber are used for construction. Soft woods, such as Wawa, are used as casing for columns and beam or scantlings for foundations. In
Improved earth blocks Relatively small proportions of cement or pozzolana can be added to earth and compressed to create a building block at low cost.42 Through research at Kwame Nkrumah University of Science and Technology, Kumasi, the Tek-Blok press was introduced into Ghana in the 1970s as a local derivative of the CINVA-Ram Press from Latin America. It casts a mixture of 5 to 10 per cent cement (which can be partly replaced with local pozzolana), laterite and water, into a very durable block. Despite its evident success in producing high quality blocks from mixtures of laterite with cement and pozzolana, however, it has not passed into general use.
Aluminium and asbestos sheeting
Corrugated aluminium or asbestos replaced corrugated galvanised iron as the roof cladding material of choice during the late 20th century; in 2000, 46 per cent of houses in Accra have asbestos sheet roofing.43 Aluworks, Metalex, Rocksters, Glanderson, Rainbow etc, are all suppliers of different types of roofing sheets, sold directly or through retailers. Aluworks Ltd, Ghana, is based in Tema and mainly involved in the processing of aluminium ingots, sourced from South Africa, into finished products such as aluminium sheets, rolled aluminium sheets, corrugated sheets, roofing sheets and louvre blades. The production output is 30,000 tons per annum but Aluworks is currently producing at 80 per cent capacity.44
Rocksters Roofing Company has factories in Taifa, Weija and Tema, all in Greater Accra. They previously obtained raw material from Aluworks but their production levels have reduced so Rocksters imports rolled sheets from USA, Australia and recently from Asia. Prices for a 20 packet of 0.35mm roofing sheets are C310 per packet for aluminium and C125 per packet for galvanised sheets. Transportation is free within Accra and Tema. Delivery per load to Kumasi is GHC400 and to Tamale is GHC1,200.45
Major Type of Wall Material Used Accra (GAMA) Kumasi Sekondi-Takoradi Tamale
Sandcrete 62.3 62.0 70.8 57.3
Landcrete 24.8 3.8 23.6 37.1
Others* 12.9 34.2 5.6 5.6
Total 100.0 100.0 100.0 100.0
Source: UN Habitat field survey, 2010
Table 84. Types of wall materials used in construction in the various urban centres
* Others include atakpamé, wattle and daub, metal, bricks and woodNote, there are sampling issues in bringing all the data together into city-wide means. The reader must decide how valid these may be in line with the other measures used in this argument.
Figure 59. Manufacturing sandcrete blocks Photo © G Tipple
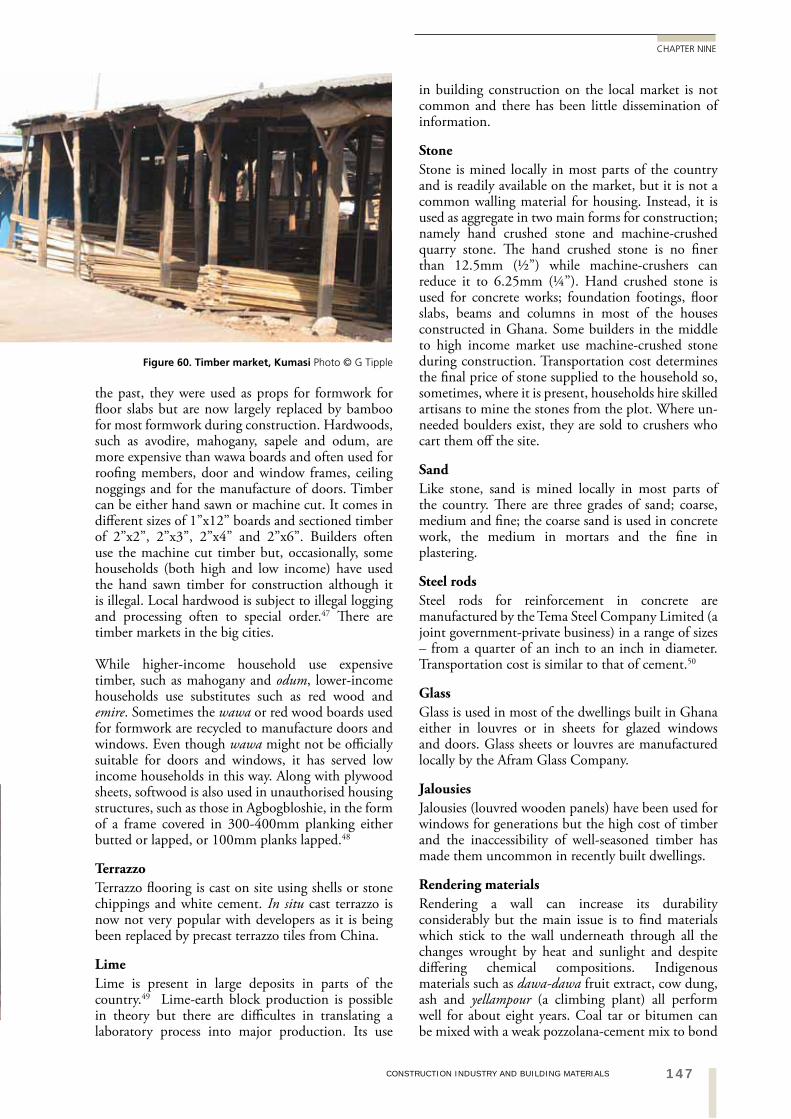
147CONSTRUCTION INDUSTRY AND BUILDING MATERIALS
CHAPTER NINE
in building construction on the local market is not common and there has been little dissemination of information.
Stone
Stone is mined locally in most parts of the country and is readily available on the market, but it is not a common walling material for housing. Instead, it is used as aggregate in two main forms for construction; namely hand crushed stone and machine-crushed quarry stone. The hand crushed stone is no finer than 12.5mm (½”) while machine-crushers can reduce it to 6.25mm (¼”). Hand crushed stone is used for concrete works; foundation footings, floor slabs, beams and columns in most of the houses constructed in Ghana. Some builders in the middle to high income market use machine-crushed stone during construction. Transportation cost determines the final price of stone supplied to the household so, sometimes, where it is present, households hire skilled artisans to mine the stones from the plot. Where un-needed boulders exist, they are sold to crushers who cart them off the site.
Sand
Like stone, sand is mined locally in most parts of the country. There are three grades of sand; coarse, medium and fine; the coarse sand is used in concrete work, the medium in mortars and the fine in plastering.
Steel rods
Steel rods for reinforcement in concrete are manufactured by the Tema Steel Company Limited (a joint government-private business) in a range of sizes – from a quarter of an inch to an inch in diameter. Transportation cost is similar to that of cement.50
Glass
Glass is used in most of the dwellings built in Ghana either in louvres or in sheets for glazed windows and doors. Glass sheets or louvres are manufactured locally by the Afram Glass Company.
Jalousies
Jalousies (louvred wooden panels) have been used for windows for generations but the high cost of timber and the inaccessibility of well-seasoned timber has made them uncommon in recently built dwellings.
Rendering materials
Rendering a wall can increase its durability considerably but the main issue is to find materials which stick to the wall underneath through all the changes wrought by heat and sunlight and despite differing chemical compositions. Indigenous materials such as dawa-dawa fruit extract, cow dung, ash and yellampour (a climbing plant) all perform well for about eight years. Coal tar or bitumen can be mixed with a weak pozzolana-cement mix to bond
the past, they were used as props for formwork for floor slabs but are now largely replaced by bamboo for most formwork during construction. Hardwoods, such as avodire, mahogany, sapele and odum, are more expensive than wawa boards and often used for roofing members, door and window frames, ceiling noggings and for the manufacture of doors. Timber can be either hand sawn or machine cut. It comes in different sizes of 1”x12” boards and sectioned timber of 2”x2”, 2”x3”, 2”x4” and 2”x6”. Builders often use the machine cut timber but, occasionally, some households (both high and low income) have used the hand sawn timber for construction although it is illegal. Local hardwood is subject to illegal logging and processing often to special order.47 There are timber markets in the big cities.
While higher-income household use expensive timber, such as mahogany and odum, lower-income households use substitutes such as red wood and emire. Sometimes the wawa or red wood boards used for formwork are recycled to manufacture doors and windows. Even though wawa might not be officially suitable for doors and windows, it has served low income households in this way. Along with plywood sheets, softwood is also used in unauthorised housing structures, such as those in Agbogbloshie, in the form of a frame covered in 300-400mm planking either butted or lapped, or 100mm planks lapped.48
Terrazzo
Terrazzo flooring is cast on site using shells or stone chippings and white cement. In situ cast terrazzo is now not very popular with developers as it is being been replaced by precast terrazzo tiles from China.
Lime
Lime is present in large deposits in parts of the country.49 Lime-earth block production is possible in theory but there are difficultes in translating a laboratory process into major production. Its use
Figure 60. Timber market, Kumasi Photo © G Tipple
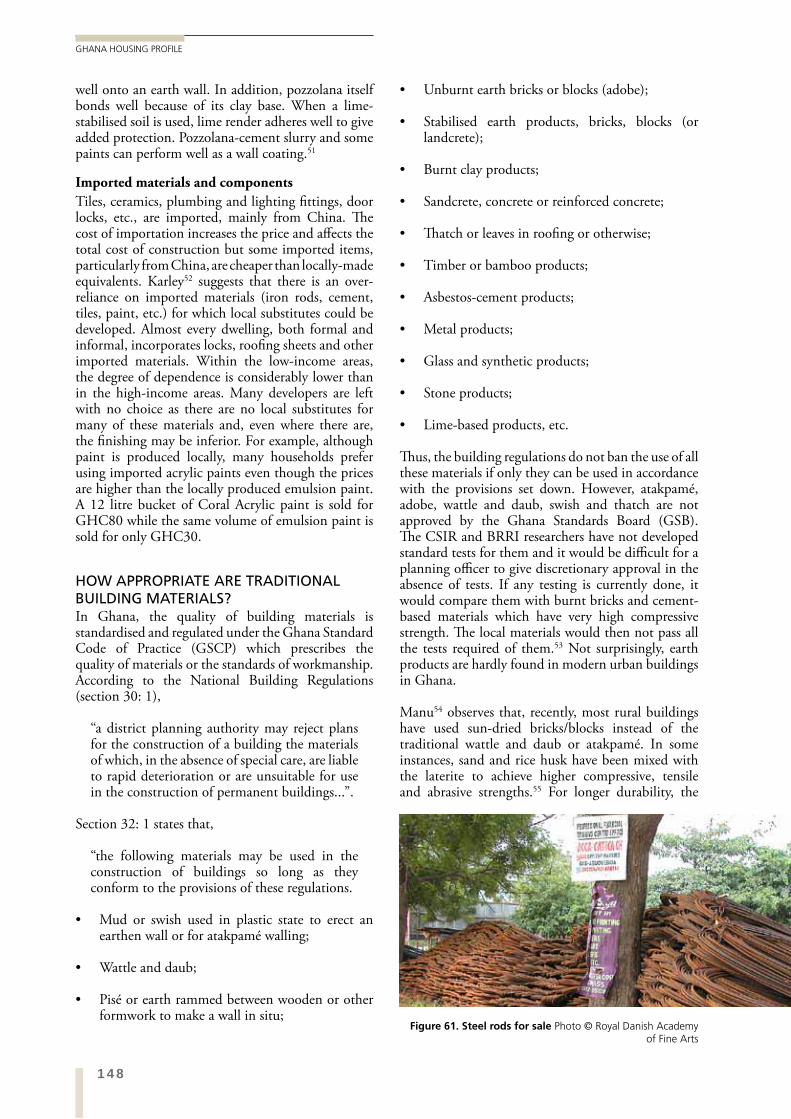
148
GHANA HOUSING PROFILE
Unburnt earth bricks or blocks (adobe);
Stabilised earth products, bricks, blocks (or landcrete);
Burnt clay products;
Sandcrete, concrete or reinforced concrete;
Thatch or leaves in roofing or otherwise;
Timber or bamboo products;
Asbestos-cement products;
Metal products;
Glass and synthetic products;
Stone products;
Lime-based products, etc.
Thus, the building regulations do not ban the use of all these materials if only they can be used in accordance with the provisions set down. However, atakpamé, adobe, wattle and daub, swish and thatch are not approved by the Ghana Standards Board (GSB). The CSIR and BRRI researchers have not developed standard tests for them and it would be difficult for a planning officer to give discretionary approval in the absence of tests. If any testing is currently done, it would compare them with burnt bricks and cement-based materials which have very high compressive strength. The local materials would then not pass all the tests required of them.53 Not surprisingly, earth products are hardly found in modern urban buildings in Ghana.
Manu54 observes that, recently, most rural buildings have used sun-dried bricks/blocks instead of the traditional wattle and daub or atakpamé. In some instances, sand and rice husk have been mixed with the laterite to achieve higher compressive, tensile and abrasive strengths.55 For longer durability, the
well onto an earth wall. In addition, pozzolana itself bonds well because of its clay base. When a lime-stabilised soil is used, lime render adheres well to give added protection. Pozzolana-cement slurry and some paints can perform well as a wall coating.51
Imported materials and components
Tiles, ceramics, plumbing and lighting fittings, door locks, etc., are imported, mainly from China. The cost of importation increases the price and affects the total cost of construction but some imported items, particularly from China, are cheaper than locally-made equivalents. Karley52 suggests that there is an over-reliance on imported materials (iron rods, cement, tiles, paint, etc.) for which local substitutes could be developed. Almost every dwelling, both formal and informal, incorporates locks, roofing sheets and other imported materials. Within the low-income areas, the degree of dependence is considerably lower than in the high-income areas. Many developers are left with no choice as there are no local substitutes for many of these materials and, even where there are, the finishing may be inferior. For example, although paint is produced locally, many households prefer using imported acrylic paints even though the prices are higher than the locally produced emulsion paint. A 12 litre bucket of Coral Acrylic paint is sold for GHC80 while the same volume of emulsion paint is sold for only GHC30.
HOW APPROPRIATE ARE TRADITIONAL BUILDING MATERIALS?In Ghana, the quality of building materials is standardised and regulated under the Ghana Standard Code of Practice (GSCP) which prescribes the quality of materials or the standards of workmanship. According to the National Building Regulations (section 30: 1),
“a district planning authority may reject plans for the construction of a building the materials of which, in the absence of special care, are liable to rapid deterioration or are unsuitable for use in the construction of permanent buildings...”.
Section 32: 1 states that,
“the following materials may be used in the construction of buildings so long as they conform to the provisions of these regulations.
Mud or swish used in plastic state to erect an earthen wall or for atakpamé walling;
Wattle and daub;
Pisé or earth rammed between wooden or other formwork to make a wall in situ;
Figure 61. Steel rods for sale Photo © Royal Danish Academy of Fine Arts
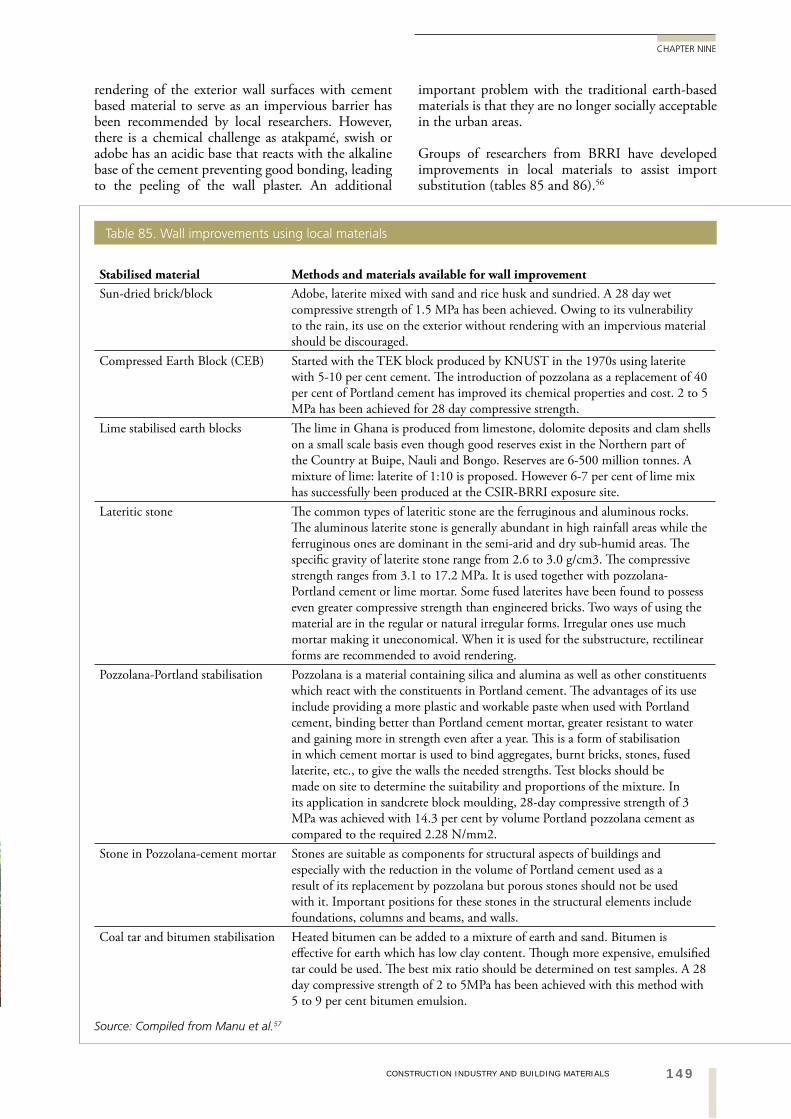
149CONSTRUCTION INDUSTRY AND BUILDING MATERIALS
CHAPTER NINE
important problem with the traditional earth-based materials is that they are no longer socially acceptable in the urban areas.
Groups of researchers from BRRI have developed improvements in local materials to assist import substitution (tables 85 and 86).56
rendering of the exterior wall surfaces with cement based material to serve as an impervious barrier has been recommended by local researchers. However, there is a chemical challenge as atakpamé, swish or adobe has an acidic base that reacts with the alkaline base of the cement preventing good bonding, leading to the peeling of the wall plaster. An additional
Stabilised material Methods and materials available for wall improvement
Sun-dried brick/block Adobe, laterite mixed with sand and rice husk and sundried. A 28 day wet compressive strength of 1.5 MPa has been achieved. Owing to its vulnerability to the rain, its use on the exterior without rendering with an impervious material should be discouraged.
Compressed Earth Block (CEB) Started with the TEK block produced by KNUST in the 1970s using laterite with 5-10 per cent cement. The introduction of pozzolana as a replacement of 40 per cent of Portland cement has improved its chemical properties and cost. 2 to 5 MPa has been achieved for 28 day compressive strength.
Lime stabilised earth blocks The lime in Ghana is produced from limestone, dolomite deposits and clam shells on a small scale basis even though good reserves exist in the Northern part of the Country at Buipe, Nauli and Bongo. Reserves are 6-500 million tonnes. A mixture of lime: laterite of 1:10 is proposed. However 6-7 per cent of lime mix has successfully been produced at the CSIR-BRRI exposure site.
Lateritic stone The common types of lateritic stone are the ferruginous and aluminous rocks. The aluminous laterite stone is generally abundant in high rainfall areas while the ferruginous ones are dominant in the semi-arid and dry sub-humid areas. The specific gravity of laterite stone range from 2.6 to 3.0 g/cm3. The compressive strength ranges from 3.1 to 17.2 MPa. It is used together with pozzolana-Portland cement or lime mortar. Some fused laterites have been found to possess even greater compressive strength than engineered bricks. Two ways of using the material are in the regular or natural irregular forms. Irregular ones use much mortar making it uneconomical. When it is used for the substructure, rectilinear forms are recommended to avoid rendering.
Pozzolana-Portland stabilisation Pozzolana is a material containing silica and alumina as well as other constituents which react with the constituents in Portland cement. The advantages of its use include providing a more plastic and workable paste when used with Portland cement, binding better than Portland cement mortar, greater resistant to water and gaining more in strength even after a year. This is a form of stabilisation in which cement mortar is used to bind aggregates, burnt bricks, stones, fused laterite, etc., to give the walls the needed strengths. Test blocks should be made on site to determine the suitability and proportions of the mixture. In its application in sandcrete block moulding, 28-day compressive strength of 3 MPa was achieved with 14.3 per cent by volume Portland pozzolana cement as compared to the required 2.28 N/mm2.
Stone in Pozzolana-cement mortar Stones are suitable as components for structural aspects of buildings and especially with the reduction in the volume of Portland cement used as a result of its replacement by pozzolana but porous stones should not be used with it. Important positions for these stones in the structural elements include foundations, columns and beams, and walls.
Coal tar and bitumen stabilisation Heated bitumen can be added to a mixture of earth and sand. Bitumen is effective for earth which has low clay content. Though more expensive, emulsified tar could be used. The best mix ratio should be determined on test samples. A 28 day compressive strength of 2 to 5MPa has been achieved with this method with 5 to 9 per cent bitumen emulsion.
Source: Compiled from Manu et al.57
Table 85. Wall improvements using local materials
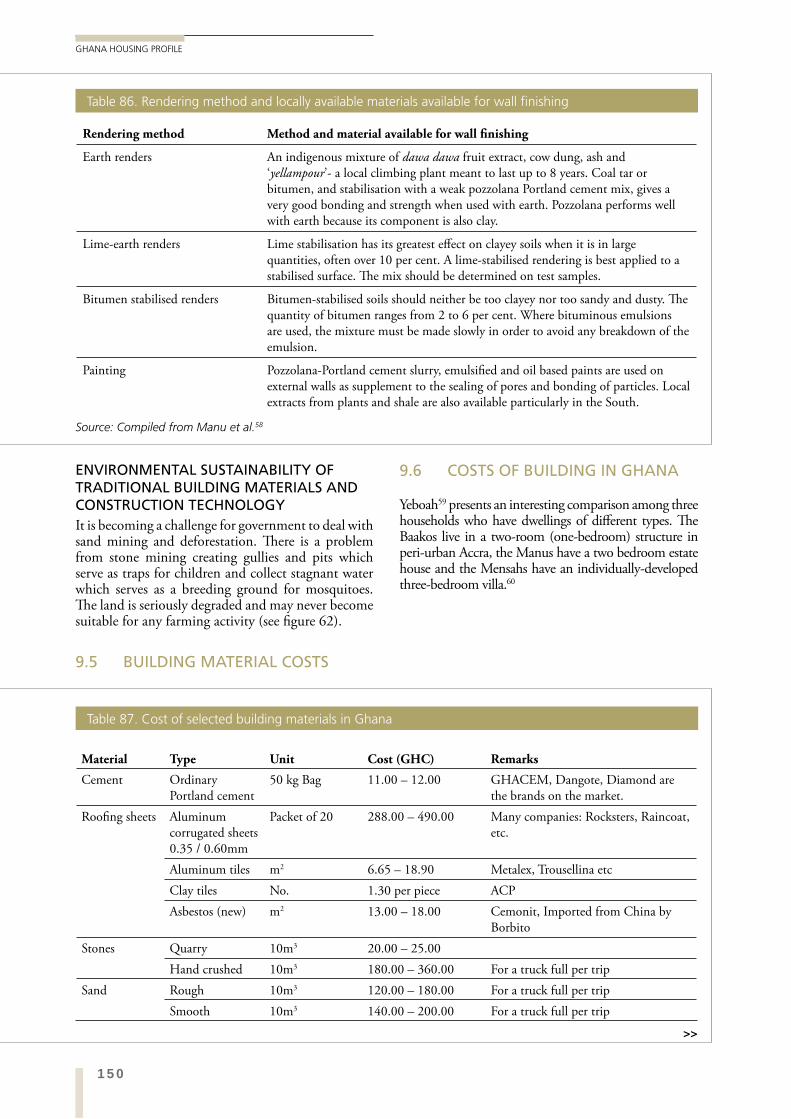
150
GHANA HOUSING PROFILE
9.6 COSTS OF BUILDING IN GHANA
Yeboah59 presents an interesting comparison among three households who have dwellings of different types. The Baakos live in a two-room (one-bedroom) structure in peri-urban Accra, the Manus have a two bedroom estate house and the Mensahs have an individually-developed three-bedroom villa.60
ENVIRONMENTAL SUSTAINABILITY OF TRADITIONAL BUILDING MATERIALS AND CONSTRUCTION TECHNOLOGYIt is becoming a challenge for government to deal with sand mining and deforestation. There is a problem from stone mining creating gullies and pits which serve as traps for children and collect stagnant water which serves as a breeding ground for mosquitoes. The land is seriously degraded and may never become suitable for any farming activity (see figure 62).
9.5 BUILDING MATERIAL COSTS
Rendering method Method and material available for wall finishing
Earth renders An indigenous mixture of dawa dawa fruit extract, cow dung, ash and ‘yellampour’- a local climbing plant meant to last up to 8 years. Coal tar or bitumen, and stabilisation with a weak pozzolana Portland cement mix, gives a very good bonding and strength when used with earth. Pozzolana performs well with earth because its component is also clay.
Lime-earth renders Lime stabilisation has its greatest effect on clayey soils when it is in large quantities, often over 10 per cent. A lime-stabilised rendering is best applied to a stabilised surface. The mix should be determined on test samples.
Bitumen stabilised renders Bitumen-stabilised soils should neither be too clayey nor too sandy and dusty. The quantity of bitumen ranges from 2 to 6 per cent. Where bituminous emulsions are used, the mixture must be made slowly in order to avoid any breakdown of the emulsion.
Painting Pozzolana-Portland cement slurry, emulsified and oil based paints are used on external walls as supplement to the sealing of pores and bonding of particles. Local extracts from plants and shale are also available particularly in the South.
Table 86. Rendering method and locally available materials available for wall finishing
Source: Compiled from Manu et al.58
Material Type Unit Cost (GHC) Remarks
Cement Ordinary Portland cement
50 kg Bag 11.00 – 12.00 GHACEM, Dangote, Diamond are the brands on the market.
Roofing sheets Aluminum corrugated sheets 0.35 / 0.60mm
Packet of 20 288.00 – 490.00 Many companies: Rocksters, Raincoat, etc.
Aluminum tiles m2 6.65 – 18.90 Metalex, Trousellina etcClay tiles No. 1.30 per piece ACP Asbestos (new) m2 13.00 – 18.00 Cemonit, Imported from China by
BorbitoStones Quarry 10m3 20.00 – 25.00
Hand crushed 10m3 180.00 – 360.00 For a truck full per trip Sand Rough 10m3 120.00 – 180.00 For a truck full per trip
Smooth 10m3 140.00 – 200.00 For a truck full per trip
Table 87. Cost of selected building materials in Ghana
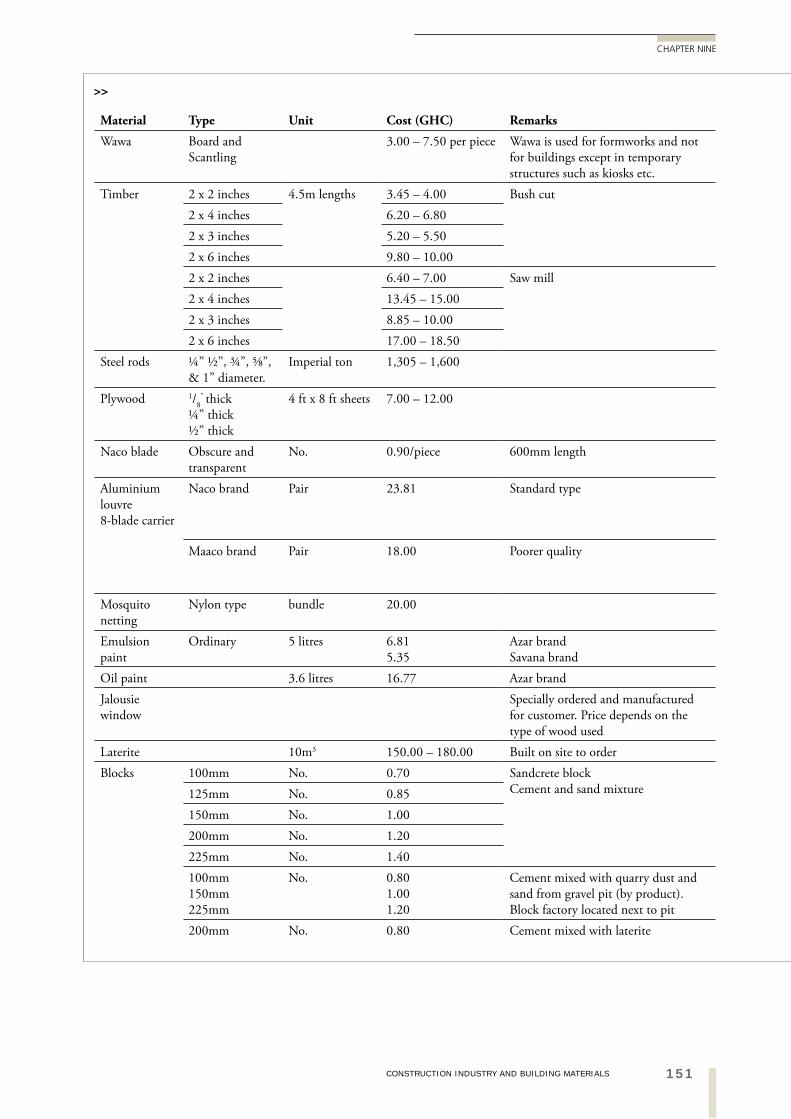
151CONSTRUCTION INDUSTRY AND BUILDING MATERIALS
CHAPTER NINE
Material Type Unit Cost (GHC) Remarks
Wawa Board and Scantling
3.00 – 7.50 per piece Wawa is used for formworks and not for buildings except in temporary structures such as kiosks etc.
Timber 2 x 2 inches 4.5m lengths 3.45 – 4.00 Bush cut 2 x 4 inches 6.20 – 6.802 x 3 inches 5.20 – 5.502 x 6 inches 9.80 – 10.002 x 2 inches 6.40 – 7.00 Saw mill 2 x 4 inches 13.45 – 15.002 x 3 inches 8.85 – 10.002 x 6 inches 17.00 – 18.50
Steel rods ¼” ½”, ¾”, ⅝”, & 1” diameter.
Imperial ton 1,305 – 1,600
Plywood 1/8” thick
¼” thick½” thick
4 ft x 8 ft sheets 7.00 – 12.00
Naco blade Obscure and transparent
No. 0.90/piece 600mm length
Aluminium louvre 8-blade carrier
Naco brand Pair 23.81 Standard type
Maaco brand Pair 18.00 Poorer quality
Mosquito netting
Nylon type bundle 20.00
Emulsion paint
Ordinary 5 litres 6.815.35
Azar brand Savana brand
Oil paint 3.6 litres 16.77 Azar brandJalousie window
Specially ordered and manufactured for customer. Price depends on the type of wood used
Laterite 10m3 150.00 – 180.00 Built on site to orderBlocks 100mm No. 0.70 Sandcrete block
Cement and sand mixture125mm No. 0.85150mm No. 1.00200mm No. 1.20225mm No. 1.40100mm 150mm 225mm
No. 0.80 1.00 1.20
Cement mixed with quarry dust and sand from gravel pit (by product). Block factory located next to pit
200mm No. 0.80 Cement mixed with laterite
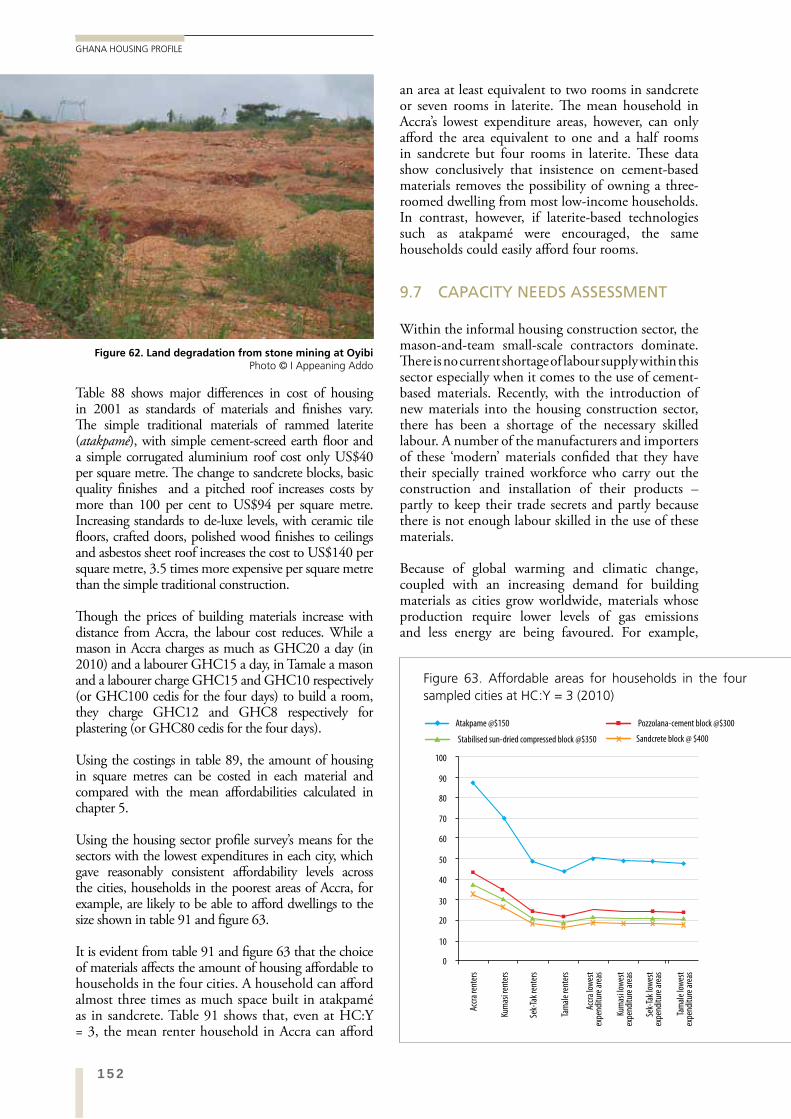
152
GHANA HOUSING PROFILE
an area at least equivalent to two rooms in sandcrete or seven rooms in laterite. The mean household in Accra’s lowest expenditure areas, however, can only afford the area equivalent to one and a half rooms in sandcrete but four rooms in laterite. These data show conclusively that insistence on cement-based materials removes the possibility of owning a three-roomed dwelling from most low-income households. In contrast, however, if laterite-based technologies such as atakpamé were encouraged, the same households could easily afford four rooms.
9.7 CAPACITY NEEDS ASSESSMENT
Within the informal housing construction sector, the mason-and-team small-scale contractors dominate. There is no current shortage of labour supply within this sector especially when it comes to the use of cement-based materials. Recently, with the introduction of new materials into the housing construction sector, there has been a shortage of the necessary skilled labour. A number of the manufacturers and importers of these ‘modern’ materials confided that they have their specially trained workforce who carry out the construction and installation of their products – partly to keep their trade secrets and partly because there is not enough labour skilled in the use of these materials.
Because of global warming and climatic change, coupled with an increasing demand for building materials as cities grow worldwide, materials whose production require lower levels of gas emissions and less energy are being favoured. For example,
Table 88 shows major differences in cost of housing in 2001 as standards of materials and finishes vary. The simple traditional materials of rammed laterite (atakpamé), with simple cement-screed earth floor and a simple corrugated aluminium roof cost only US$40 per square metre. The change to sandcrete blocks, basic quality finishes and a pitched roof increases costs by more than 100 per cent to US$94 per square metre. Increasing standards to de-luxe levels, with ceramic tile floors, crafted doors, polished wood finishes to ceilings and asbestos sheet roof increases the cost to US$140 per square metre, 3.5 times more expensive per square metre than the simple traditional construction.
Though the prices of building materials increase with distance from Accra, the labour cost reduces. While a mason in Accra charges as much as GHC20 a day (in 2010) and a labourer GHC15 a day, in Tamale a mason and a labourer charge GHC15 and GHC10 respectively (or GHC100 cedis for the four days) to build a room, they charge GHC12 and GHC8 respectively for plastering (or GHC80 cedis for the four days).
Using the costings in table 89, the amount of housing in square metres can be costed in each material and compared with the mean affordabilities calculated in chapter 5.
Using the housing sector profile survey’s means for the sectors with the lowest expenditures in each city, which gave reasonably consistent affordability levels across the cities, households in the poorest areas of Accra, for example, are likely to be able to afford dwellings to the size shown in table 91 and figure 63.
It is evident from table 91 and figure 63 that the choice of materials affects the amount of housing affordable to households in the four cities. A household can afford almost three times as much space built in atakpamé as in sandcrete. Table 91 shows that, even at HC:Y = 3, the mean renter household in Accra can afford
Figure 62. Land degradation from stone mining at Oyibi Photo © I Appeaning Addo
Figure 63. Affordable areas for households in the four sampled cities at HC:Y = 3 (2010)
Accr
a re
nter
s
Kum
asi r
ente
rs
Sek-
Tak
rent
ers
Tam
ale
rent
ers
Accr
a lo
wes
tex
pend
iture
are
as
Kum
asi l
owes
tex
pend
iture
are
as
Sek-
Tak
low
est
expe
nditu
re a
reas
Tam
ale
low
est
expe
nditu
re a
reas
0
10
20
30
40
50
60
70
80
90
100
Atakpame @$150 Pozzolana-cement block @$300
Stabilised sun-dried compressed block @$350 Sandcrete block @ $400
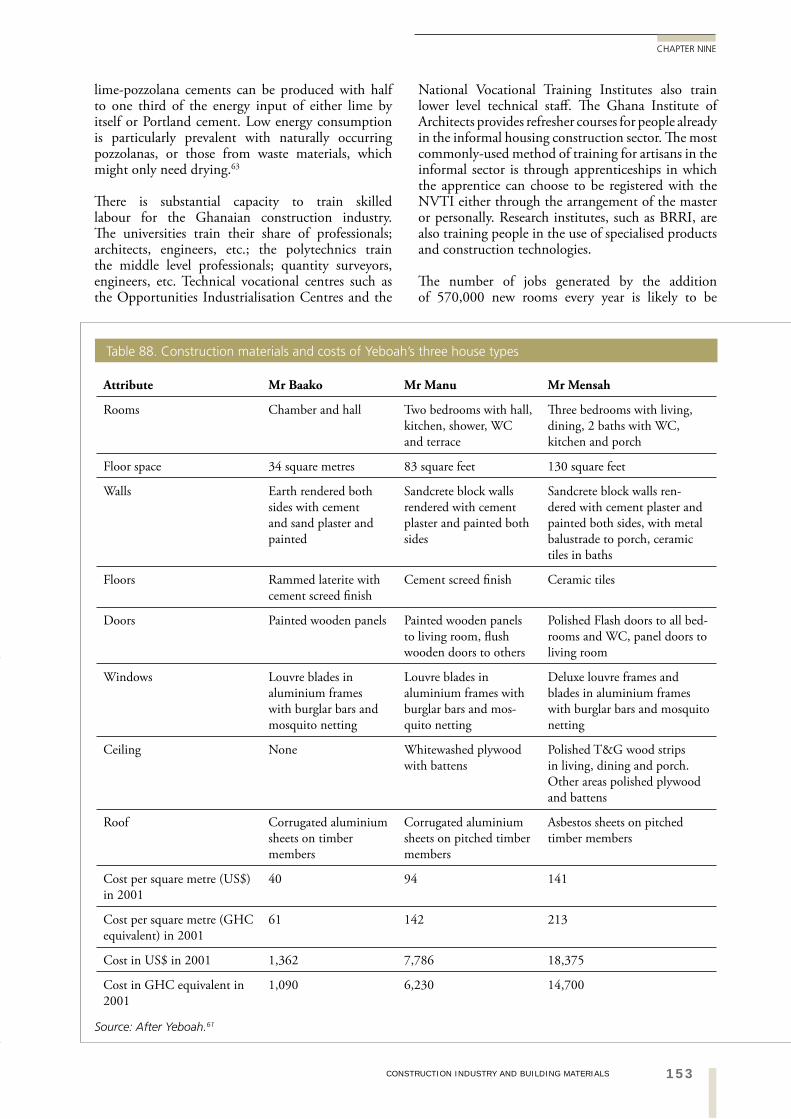
153CONSTRUCTION INDUSTRY AND BUILDING MATERIALS
CHAPTER NINE
National Vocational Training Institutes also train lower level technical staff. The Ghana Institute of Architects provides refresher courses for people already in the informal housing construction sector. The most commonly-used method of training for artisans in the informal sector is through apprenticeships in which the apprentice can choose to be registered with the NVTI either through the arrangement of the master or personally. Research institutes, such as BRRI, are also training people in the use of specialised products and construction technologies.
The number of jobs generated by the addition of 570,000 new rooms every year is likely to be
lime-pozzolana cements can be produced with half to one third of the energy input of either lime by itself or Portland cement. Low energy consumption is particularly prevalent with naturally occurring pozzolanas, or those from waste materials, which might only need drying.63
There is substantial capacity to train skilled labour for the Ghanaian construction industry.The universities train their share of professionals; architects, engineers, etc.; the polytechnics train the middle level professionals; quantity surveyors, engineers, etc. Technical vocational centres such as the Opportunities Industrialisation Centres and the
Attribute Mr Baako Mr Manu Mr Mensah
Rooms Chamber and hall Two bedrooms with hall, kitchen, shower, WC and terrace
Three bedrooms with living, dining, 2 baths with WC, kitchen and porch
Floor space 34 square metres 83 square feet 130 square feet
Walls Earth rendered both sides with cement and sand plaster and painted
Sandcrete block walls rendered with cement plaster and painted both sides
Sandcrete block walls ren-dered with cement plaster and painted both sides, with metal balustrade to porch, ceramic tiles in baths
Floors Rammed laterite with cement screed finish
Cement screed finish Ceramic tiles
Doors Painted wooden panels Painted wooden panels to living room, flush wooden doors to others
Polished Flash doors to all bed-rooms and WC, panel doors to living room
Windows Louvre blades in aluminium frames with burglar bars and mosquito netting
Louvre blades in aluminium frames with burglar bars and mos-quito netting
Deluxe louvre frames and blades in aluminium frames with burglar bars and mosquito netting
Ceiling None Whitewashed plywood with battens
Polished T&G wood strips in living, dining and porch. Other areas polished plywood and battens
Roof Corrugated aluminium sheets on timber members
Corrugated aluminium sheets on pitched timber members
Asbestos sheets on pitched timber members
Cost per square metre (US$) in 2001
40 94 141
Cost per square metre (GHC equivalent) in 2001
61 142 213
Cost in US$ in 2001 1,362 7,786 18,375
Cost in GHC equivalent in 2001
1,090 6,230 14,700
Table 88. Construction materials and costs of Yeboah’s three house types
Source: After Yeboah.61
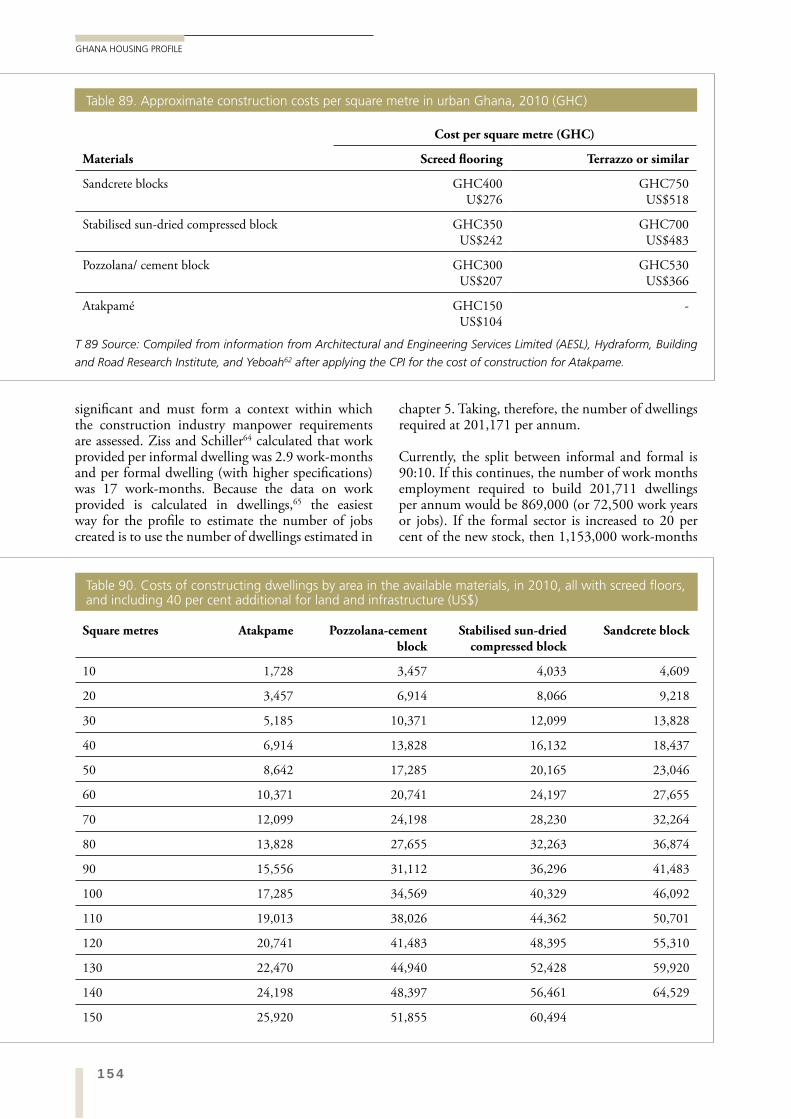
154
GHANA HOUSING PROFILE
chapter 5. Taking, therefore, the number of dwellings required at 201,171 per annum.
Currently, the split between informal and formal is 90:10. If this continues, the number of work months employment required to build 201,711 dwellings per annum would be 869,000 (or 72,500 work years or jobs). If the formal sector is increased to 20 per cent of the new stock, then 1,153,000 work-months
significant and must form a context within which the construction industry manpower requirements are assessed. Ziss and Schiller64 calculated that work provided per informal dwelling was 2.9 work-months and per formal dwelling (with higher specifications) was 17 work-months. Because the data on work provided is calculated in dwellings,65 the easiest way for the profile to estimate the number of jobs created is to use the number of dwellings estimated in
Materials
Cost per square metre (GHC)
Screed flooring Terrazzo or similar
Sandcrete blocks GHC400 U$276
GHC750 US$518
Stabilised sun-dried compressed block GHC350 US$242
GHC700 US$483
Pozzolana/ cement block GHC300 US$207
GHC530 US$366
Atakpamé GHC150 US$104
-
Table 89. Approximate construction costs per square metre in urban Ghana, 2010 (GHC)
T 89 Source: Compiled from information from Architectural and Engineering Services Limited (AESL), Hydraform, Building
and Road Research Institute, and Yeboah62 after applying the CPI for the cost of construction for Atakpame.
Square metres Atakpame Pozzolana-cement block
Stabilised sun-dried compressed block
Sandcrete block
10 1,728 3,457 4,033 4,609
20 3,457 6,914 8,066 9,218
30 5,185 10,371 12,099 13,828
40 6,914 13,828 16,132 18,437
50 8,642 17,285 20,165 23,046
60 10,371 20,741 24,197 27,655
70 12,099 24,198 28,230 32,264
80 13,828 27,655 32,263 36,874
90 15,556 31,112 36,296 41,483
100 17,285 34,569 40,329 46,092
110 19,013 38,026 44,362 50,701
120 20,741 41,483 48,395 55,310
130 22,470 44,940 52,428 59,920
140 24,198 48,397 56,461 64,529
150 25,920 51,855 60,494
Table 90. Costs of constructing dwellings by area in the available materials, in 2010, all with screed floors, and including 40 per cent additional for land and infrastructure (US$)
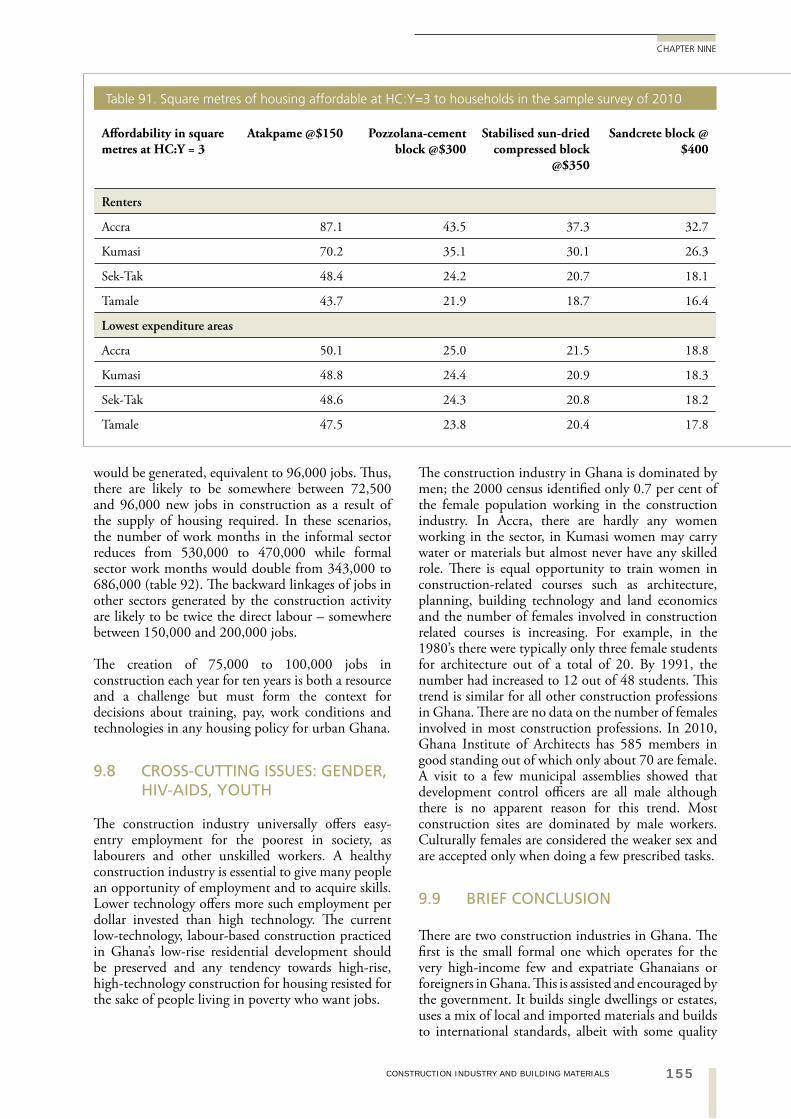
155CONSTRUCTION INDUSTRY AND BUILDING MATERIALS
CHAPTER NINE
The construction industry in Ghana is dominated by men; the 2000 census identified only 0.7 per cent of the female population working in the construction industry. In Accra, there are hardly any women working in the sector, in Kumasi women may carry water or materials but almost never have any skilled role. There is equal opportunity to train women in construction-related courses such as architecture, planning, building technology and land economics and the number of females involved in construction related courses is increasing. For example, in the 1980’s there were typically only three female students for architecture out of a total of 20. By 1991, the number had increased to 12 out of 48 students. This trend is similar for all other construction professions in Ghana. There are no data on the number of females involved in most construction professions. In 2010, Ghana Institute of Architects has 585 members in good standing out of which only about 70 are female. A visit to a few municipal assemblies showed that development control officers are all male although there is no apparent reason for this trend. Most construction sites are dominated by male workers. Culturally females are considered the weaker sex and are accepted only when doing a few prescribed tasks.
9.9 BRIEF CONCLUSION
There are two construction industries in Ghana. The first is the small formal one which operates for the very high-income few and expatriate Ghanaians or foreigners in Ghana. This is assisted and encouraged by the government. It builds single dwellings or estates, uses a mix of local and imported materials and builds to international standards, albeit with some quality
would be generated, equivalent to 96,000 jobs. Thus, there are likely to be somewhere between 72,500 and 96,000 new jobs in construction as a result of the supply of housing required. In these scenarios, the number of work months in the informal sector reduces from 530,000 to 470,000 while formal sector work months would double from 343,000 to 686,000 (table 92). The backward linkages of jobs in other sectors generated by the construction activity are likely to be twice the direct labour – somewhere between 150,000 and 200,000 jobs.
The creation of 75,000 to 100,000 jobs in construction each year for ten years is both a resource and a challenge but must form the context for decisions about training, pay, work conditions and technologies in any housing policy for urban Ghana.
9.8 CROSS-CUTTING ISSUES: GENDER, HIV-AIDS, YOUTH
The construction industry universally offers easy-entry employment for the poorest in society, as labourers and other unskilled workers. A healthy construction industry is essential to give many people an opportunity of employment and to acquire skills. Lower technology offers more such employment per dollar invested than high technology. The current low-technology, labour-based construction practiced in Ghana’s low-rise residential development should be preserved and any tendency towards high-rise, high-technology construction for housing resisted for the sake of people living in poverty who want jobs.
Affordability in square metres at HC:Y = 3
Atakpame @$150 Pozzolana-cement block @$300
Stabilised sun-dried compressed block
@$350
Sandcrete block @ $400
Renters
Accra 87.1 43.5 37.3 32.7
Kumasi 70.2 35.1 30.1 26.3
Sek-Tak 48.4 24.2 20.7 18.1
Tamale 43.7 21.9 18.7 16.4
Lowest expenditure areas
Accra 50.1 25.0 21.5 18.8
Kumasi 48.8 24.4 20.9 18.3
Sek-Tak 48.6 24.3 20.8 18.2
Tamale 47.5 23.8 20.4 17.8
Table 91. Square metres of housing affordable at HC:Y=3 to households in the sample survey of 2010
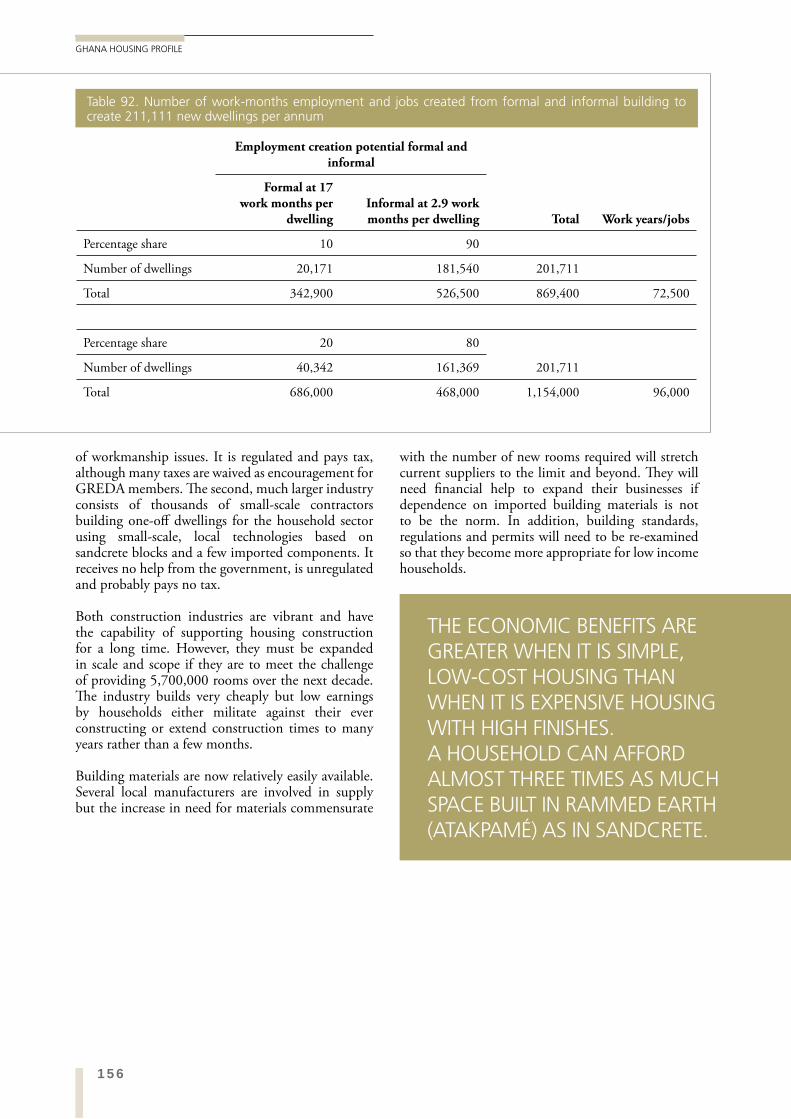
156
GHANA HOUSING PROFILE
with the number of new rooms required will stretch current suppliers to the limit and beyond. They will need financial help to expand their businesses if dependence on imported building materials is not to be the norm. In addition, building standards, regulations and permits will need to be re-examined so that they become more appropriate for low income households.
of workmanship issues. It is regulated and pays tax, although many taxes are waived as encouragement for GREDA members. The second, much larger industry consists of thousands of small-scale contractors building one-off dwellings for the household sector using small-scale, local technologies based on sandcrete blocks and a few imported components. It receives no help from the government, is unregulated and probably pays no tax.
Both construction industries are vibrant and have the capability of supporting housing construction for a long time. However, they must be expanded in scale and scope if they are to meet the challenge of providing 5,700,000 rooms over the next decade. The industry builds very cheaply but low earnings by households either militate against their ever constructing or extend construction times to many years rather than a few months.
Building materials are now relatively easily available. Several local manufacturers are involved in supply but the increase in need for materials commensurate
Employment creation potential formal and informal
Total Work years/jobs
Formal at 17 work months per
dwellingInformal at 2.9 work months per dwelling
Percentage share 10 90
Number of dwellings 20,171 181,540 201,711
Total 342,900 526,500 869,400 72,500
Percentage share 20 80
Number of dwellings 40,342 161,369 201,711
Total 686,000 468,000 1,154,000 96,000
Table 92. Number of work-months employment and jobs created from formal and informal building to create 211,111 new dwellings per annum
THE ECONOMIC BENEFITS ARE GREATER WHEN IT IS SIMPLE, LOW-COST HOUSING THAN WHEN IT IS EXPENSIVE HOUSING WITH HIGH FINISHES. A HOUSEHOLD CAN AFFORD ALMOST THREE TIMES AS MUCH SPACE BUILT IN RAMMED EARTH (ATAKPAMÉ) AS IN SANDCRETE.
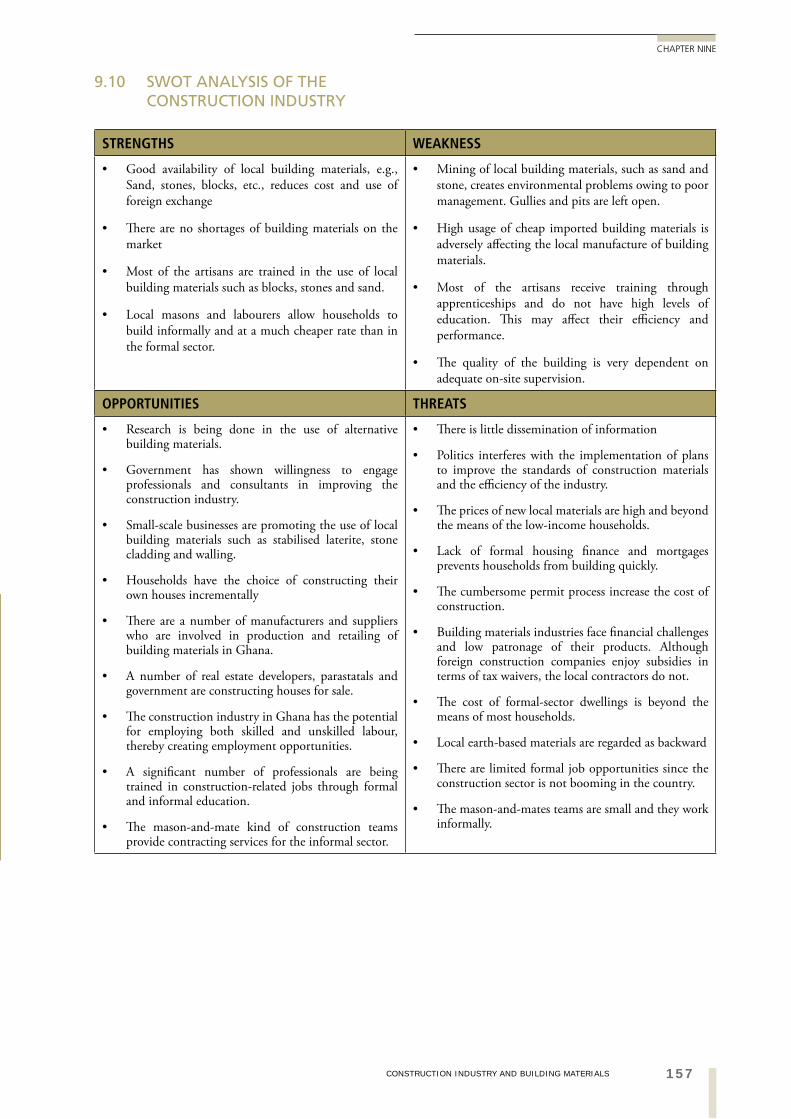
157CONSTRUCTION INDUSTRY AND BUILDING MATERIALS
CHAPTER NINE
9.10 SWOT ANALYSIS OF THE CONSTRUCTION INDUSTRY
STRENGTHS WEAKNESS
Good availability of local building materials, e.g., Sand, stones, blocks, etc., reduces cost and use of foreign exchange
There are no shortages of building materials on the market
Most of the artisans are trained in the use of local building materials such as blocks, stones and sand.
Local masons and labourers allow households to build informally and at a much cheaper rate than in the formal sector.
Mining of local building materials, such as sand and stone, creates environmental problems owing to poor management. Gullies and pits are left open.
High usage of cheap imported building materials is adversely affecting the local manufacture of building materials.
Most of the artisans receive training through apprenticeships and do not have high levels of education. This may affect their efficiency and performance.
The quality of the building is very dependent on adequate on-site supervision.
OPPORTUNITIES THREATS
Research is being done in the use of alternative building materials.
Government has shown willingness to engage professionals and consultants in improving the construction industry.
Small-scale businesses are promoting the use of local building materials such as stabilised laterite, stone cladding and walling.
Households have the choice of constructing their own houses incrementally
There are a number of manufacturers and suppliers who are involved in production and retailing of building materials in Ghana.
A number of real estate developers, parastatals and government are constructing houses for sale.
The construction industry in Ghana has the potential for employing both skilled and unskilled labour, thereby creating employment opportunities.
A significant number of professionals are being trained in construction-related jobs through formal and informal education.
The mason-and-mate kind of construction teams provide contracting services for the informal sector.
There is little dissemination of information
Politics interferes with the implementation of plans to improve the standards of construction materials and the efficiency of the industry.
The prices of new local materials are high and beyond the means of the low-income households.
Lack of formal housing finance and mortgages prevents households from building quickly.
The cumbersome permit process increase the cost of construction.
Building materials industries face financial challenges and low patronage of their products. Although foreign construction companies enjoy subsidies in terms of tax waivers, the local contractors do not.
The cost of formal-sector dwellings is beyond the means of most households.
Local earth-based materials are regarded as backward
There are limited formal job opportunities since the construction sector is not booming in the country.
The mason-and-mates teams are small and they work informally.
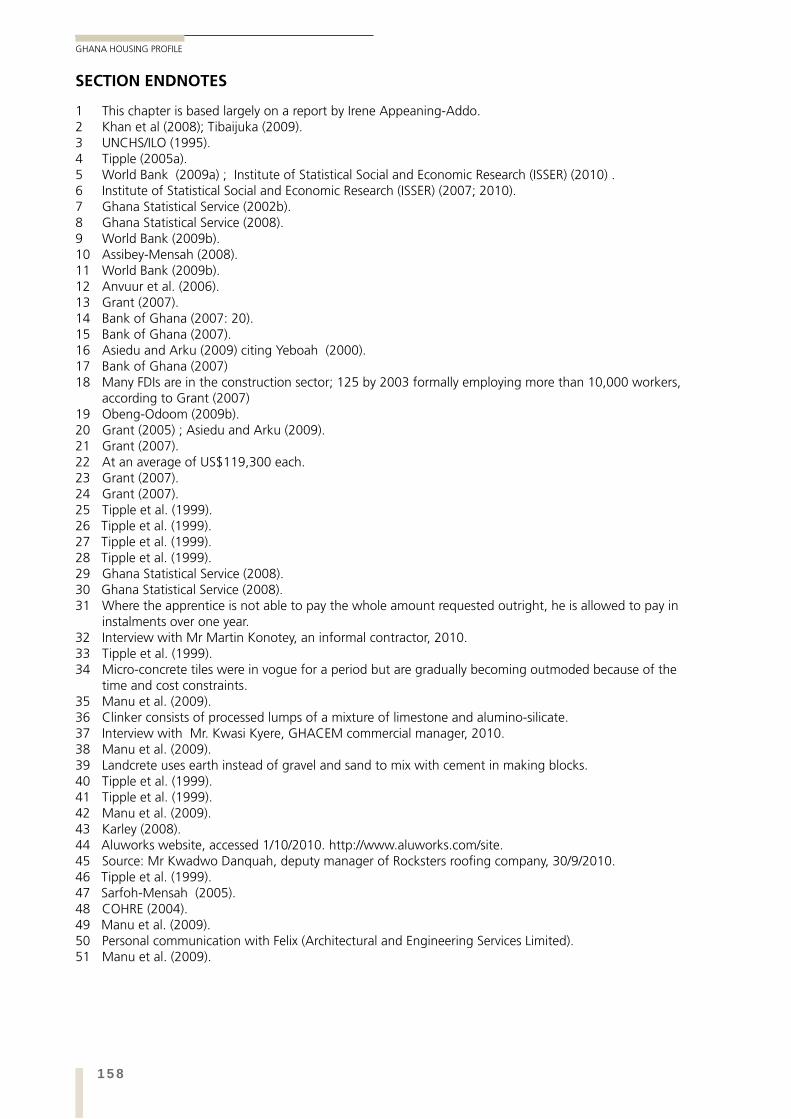
158
GHANA HOUSING PROFILE
SECTION ENDNOTES
1 This chapter is based largely on a report by Irene Appeaning-Addo.2 Khan et al (2008); Tibaijuka (2009). 3 UNCHS/ILO (1995).4 Tipple (2005a).5 World Bank (2009a) ; Institute of Statistical Social and Economic Research (ISSER) (2010) .6 Institute of Statistical Social and Economic Research (ISSER) (2007; 2010).7 Ghana Statistical Service (2002b).8 Ghana Statistical Service (2008).9 World Bank (2009b).10 Assibey-Mensah (2008).11 World Bank (2009b).12 Anvuur et al. (2006).13 Grant (2007).14 Bank of Ghana (2007: 20).15 Bank of Ghana (2007).16 Asiedu and Arku (2009) citing Yeboah (2000).17 Bank of Ghana (2007)18 Many FDIs are in the construction sector; 125 by 2003 formally employing more than 10,000 workers,
according to Grant (2007)19 Obeng-Odoom (2009b).20 Grant (2005) ; Asiedu and Arku (2009).21 Grant (2007).22 At an average of US$119,300 each. 23 Grant (2007).24 Grant (2007).25 Tipple et al. (1999).26 Tipple et al. (1999).27 Tipple et al. (1999).28 Tipple et al. (1999).29 Ghana Statistical Service (2008).30 Ghana Statistical Service (2008).31 Where the apprentice is not able to pay the whole amount requested outright, he is allowed to pay in
instalments over one year.32 Interview with Mr Martin Konotey, an informal contractor, 2010.33 Tipple et al. (1999).34 Micro-concrete tiles were in vogue for a period but are gradually becoming outmoded because of the
time and cost constraints.35 Manu et al. (2009).36 Clinker consists of processed lumps of a mixture of limestone and alumino-silicate.37 Interview with Mr. Kwasi Kyere, GHACEM commercial manager, 2010.38 Manu et al. (2009).39 Landcrete uses earth instead of gravel and sand to mix with cement in making blocks.40 Tipple et al. (1999).41 Tipple et al. (1999).42 Manu et al. (2009).43 Karley (2008).44 Aluworks website, accessed 1/10/2010. http://www.aluworks.com/site.45 Source: Mr Kwadwo Danquah, deputy manager of Rocksters roofing company, 30/9/2010.46 Tipple et al. (1999).47 Sarfoh-Mensah (2005).48 COHRE (2004).49 Manu et al. (2009).50 Personal communication with Felix (Architectural and Engineering Services Limited).51 Manu et al. (2009).
159CONSTRUCTION INDUSTRY AND BUILDING MATERIALS
CHAPTER NINE
52 Karley (2008).53 Interview with the head of the civil department of the GSB.54 Manu et al. (2009).55 Manu et al. (2009).56 Manu et al. (2009).57 Manu et al. (2009).58 Manu et al. (2009).59 Yeboah (2005).60 The pseudonyms are common surnames in Ghana derived from the Twi words for one, two and three;
baako, mienu and miensa.61 Yeboah (2005).62 Yeboah (2005).63 Practical Action (2007).64 Ziss and Schiller (1982).65 From work in Ghana by Ziss and Schiller (1982)
160
GHANA HOUSING PROFILE
capital is raised to buy or build another. In addition, in the recent past, there was strong peer pressure to build a house in the home village before investing in one in the city.4 Failure for a city-dweller to show his/her wealth in this way to the family back home was seen as a shameful thing, reflected in their funeral rites and, therefore, reducing the deceased’s eternal status in the ancestorhood (the nananom). Thus, traditionally, housing is a consumption good and a funerary item. The only investment potential is in rental income5 and in fulfilling family obligations which would otherwise involve direct expenditure.
The other major effect of this non-marketability, combined with the system of inheritance where members of the kin-group inherit in common, is that there are limits on intensification of city-centre property for commercial or retail uses. Residential buildings pass into commercial and retail uses but there is little demolition and rebuilding more intensively. This is noted by Buckley and Mathema6 and linked with the clouded titles which often pertain in Accra and make it difficult for a private investor to redevelop despite high potential for profits. However, where clouded titles are not an issue, as in central Kumasi, the same lack of redevelopment is evident.7 This situation where “these markets do not allow for increasing density through construction” are a feature of ‘superstar cities’.8
The extent to which this tradition of non-marketability is declining is a matter of much discussion in Ghana at the beginning of the 21st century. In Accra, there seems to be less adherence to the old ways than in Kumasi and the smaller towns. Expatriate Ghanaians have been building in Accra or, to a lesser extent, Kumasi, rather than in their villages for thirty years. New housing for sale is being snapped up by households who, according to hearsay, appear to be equally willing to sell as to buy. The market in second-hand housing is, however, relatively small with only one or two dwellings being advertised in any edition of the national newspapers.9
10.1 THE STRUCTURE AND FUNCTIONING OF THE MARKET
THE TRADITIONAL NON-MARKETABILITY OF HOUSINGTraditionally, in Ghana, real property, i.e., land and the housing thereon, is not for sale out of the kin group. This means that, for most Ghanaians, housing is not an investment good; it is not built or bought on the understanding that it can be sold later on for a substantial sum which can then be used to buy other housing or spent on non-housing things, such as health care in old age. Similarly, a house that is inherited is not sold by the heirs and the money split among them. To dispose of housing in either of these ways would bring shame upon the kin-group and severe opprobrium upon the sellers, backed up by supernatural sanctions.1 In this sense, the feelings house owners have towards their house are more like feelings for a grandmother than the tools of a trade or a car. One might sell one’s tools when they are no longer needed, or in a case of extreme need; one might sell one’s car in similar circumstances or to buy a better one; but one would not sell one’s grandmother under any circumstances and, anyway, no-one would buy her!
In Gough and Yankson’s2 sample of households who had recently acquired land in peri-urban Accra, none would consider selling either their plots or their houses. Mahama and Antwi3 support this argument by asserting that cultural tradition tends to look down upon selling properties and that the tendency for many Ghanaians is to accumulate property rather than to maximize economic returns through selling. Generally, first time home owners in Ghana would buy and hold property, then build a second dwelling and rent out the first one, even though rental incomes are relatively low.
In this situation, moving house involves leaving the capital embedded within one house while more
10DYNAMICS OF THE HOUSING
MARKET
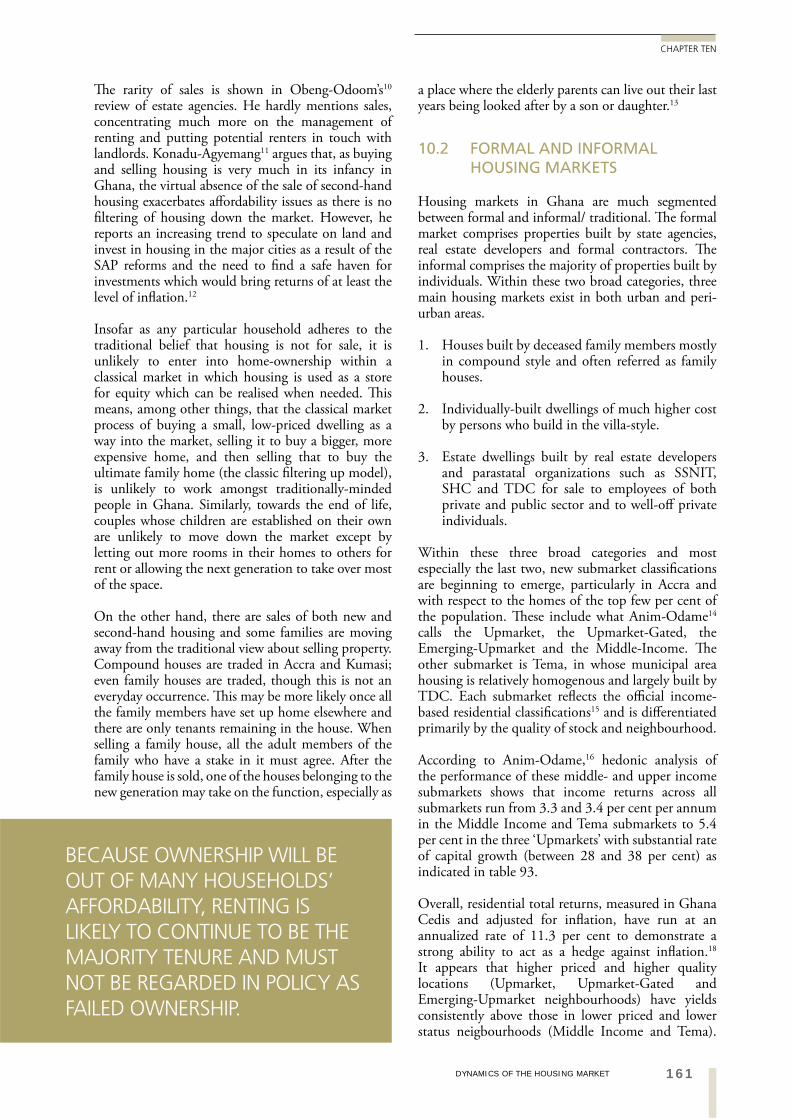
161DYNAMICS OF THE HOUSING MARKET
CHAPTER TEN
a place where the elderly parents can live out their last years being looked after by a son or daughter.13
10.2 FORMAL AND INFORMAL HOUSING MARKETS
Housing markets in Ghana are much segmented between formal and informal/ traditional. The formal market comprises properties built by state agencies, real estate developers and formal contractors. The informal comprises the majority of properties built by individuals. Within these two broad categories, three main housing markets exist in both urban and peri-urban areas.
1. Houses built by deceased family members mostly in compound style and often referred as family houses.
2. Individually-built dwellings of much higher cost by persons who build in the villa-style.
3. Estate dwellings built by real estate developers and parastatal organizations such as SSNIT, SHC and TDC for sale to employees of both private and public sector and to well-off private individuals.
Within these three broad categories and most especially the last two, new submarket classifications are beginning to emerge, particularly in Accra and with respect to the homes of the top few per cent of the population. These include what Anim-Odame14
calls the Upmarket, the Upmarket-Gated, the Emerging-Upmarket and the Middle-Income. The other submarket is Tema, in whose municipal area housing is relatively homogenous and largely built by TDC. Each submarket reflects the official income-based residential classifications15 and is differentiated primarily by the quality of stock and neighbourhood.
According to Anim-Odame,16 hedonic analysis of the performance of these middle- and upper income submarkets shows that income returns across all submarkets run from 3.3 and 3.4 per cent per annum in the Middle Income and Tema submarkets to 5.4 per cent in the three ‘Upmarkets’ with substantial rate of capital growth (between 28 and 38 per cent) as indicated in table 93.
Overall, residential total returns, measured in Ghana Cedis and adjusted for inflation, have run at an annualized rate of 11.3 per cent to demonstrate a strong ability to act as a hedge against inflation.18 It appears that higher priced and higher quality locations (Upmarket, Upmarket-Gated and Emerging-Upmarket neighbourhoods) have yields consistently above those in lower priced and lower status neigbourhoods (Middle Income and Tema).
The rarity of sales is shown in Obeng-Odoom’s10
review of estate agencies. He hardly mentions sales, concentrating much more on the management of renting and putting potential renters in touch with landlords. Konadu-Agyemang11 argues that, as buying and selling housing is very much in its infancy in Ghana, the virtual absence of the sale of second-hand housing exacerbates affordability issues as there is no filtering of housing down the market. However, he reports an increasing trend to speculate on land and invest in housing in the major cities as a result of the SAP reforms and the need to find a safe haven for investments which would bring returns of at least the level of inflation.12
Insofar as any particular household adheres to the traditional belief that housing is not for sale, it is unlikely to enter into home-ownership within a classical market in which housing is used as a store for equity which can be realised when needed. This means, among other things, that the classical market process of buying a small, low-priced dwelling as a way into the market, selling it to buy a bigger, more expensive home, and then selling that to buy the ultimate family home (the classic filtering up model), is unlikely to work amongst traditionally-minded people in Ghana. Similarly, towards the end of life, couples whose children are established on their own are unlikely to move down the market except by letting out more rooms in their homes to others for rent or allowing the next generation to take over most of the space.
On the other hand, there are sales of both new and second-hand housing and some families are moving away from the traditional view about selling property. Compound houses are traded in Accra and Kumasi; even family houses are traded, though this is not an everyday occurrence. This may be more likely once all the family members have set up home elsewhere and there are only tenants remaining in the house. When selling a family house, all the adult members of the family who have a stake in it must agree. After the family house is sold, one of the houses belonging to the new generation may take on the function, especially as
BECAUSE OWNERSHIP WILL BE OUT OF MANY HOUSEHOLDS’ AFFORDABILITY, RENTING IS LIKELY TO CONTINUE TO BE THE MAJORITY TENURE AND MUST NOT BE REGARDED IN POLICY AS FAILED OWNERSHIP.
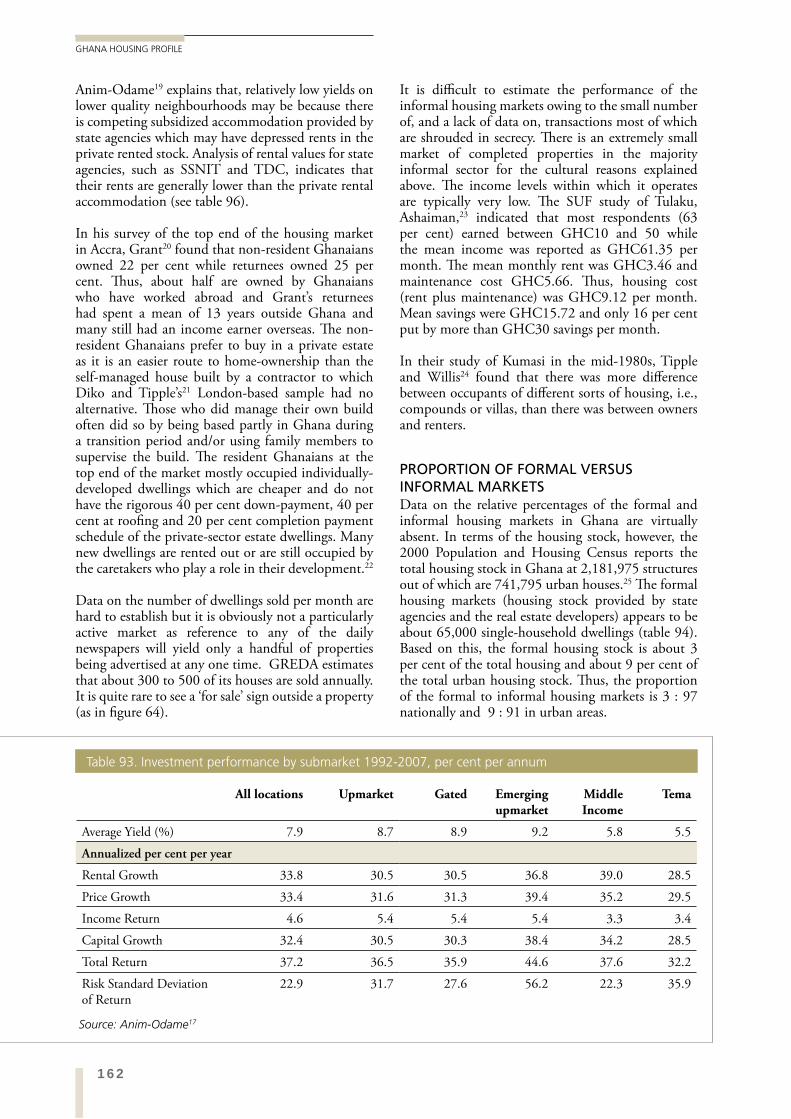
162
GHANA HOUSING PROFILE
It is difficult to estimate the performance of the informal housing markets owing to the small number of, and a lack of data on, transactions most of which are shrouded in secrecy. There is an extremely small market of completed properties in the majority informal sector for the cultural reasons explained above. The income levels within which it operates are typically very low. The SUF study of Tulaku, Ashaiman,23 indicated that most respondents (63 per cent) earned between GHC10 and 50 while the mean income was reported as GHC61.35 per month. The mean monthly rent was GHC3.46 and maintenance cost GHC5.66. Thus, housing cost (rent plus maintenance) was GHC9.12 per month. Mean savings were GHC15.72 and only 16 per cent put by more than GHC30 savings per month.
In their study of Kumasi in the mid-1980s, Tipple and Willis24 found that there was more difference between occupants of different sorts of housing, i.e., compounds or villas, than there was between owners and renters.
PROPORTION OF FORMAL VERSUS INFORMAL MARKETSData on the relative percentages of the formal and informal housing markets in Ghana are virtually absent. In terms of the housing stock, however, the 2000 Population and Housing Census reports the total housing stock in Ghana at 2,181,975 structures out of which are 741,795 urban houses.25 The formal housing markets (housing stock provided by state agencies and the real estate developers) appears to be about 65,000 single-household dwellings (table 94). Based on this, the formal housing stock is about 3 per cent of the total housing and about 9 per cent of the total urban housing stock. Thus, the proportion of the formal to informal housing markets is 3 : 97 nationally and 9 : 91 in urban areas.
Anim-Odame19 explains that, relatively low yields on lower quality neighbourhoods may be because there is competing subsidized accommodation provided by state agencies which may have depressed rents in the private rented stock. Analysis of rental values for state agencies, such as SSNIT and TDC, indicates that their rents are generally lower than the private rental accommodation (see table 96).
In his survey of the top end of the housing market in Accra, Grant20 found that non-resident Ghanaians owned 22 per cent while returnees owned 25 per cent. Thus, about half are owned by Ghanaians who have worked abroad and Grant’s returnees had spent a mean of 13 years outside Ghana and many still had an income earner overseas. The non-resident Ghanaians prefer to buy in a private estate as it is an easier route to home-ownership than the self-managed house built by a contractor to which Diko and Tipple’s21 London-based sample had no alternative. Those who did manage their own build often did so by being based partly in Ghana during a transition period and/or using family members to supervise the build. The resident Ghanaians at the top end of the market mostly occupied individually-developed dwellings which are cheaper and do not have the rigorous 40 per cent down-payment, 40 per cent at roofing and 20 per cent completion payment schedule of the private-sector estate dwellings. Many new dwellings are rented out or are still occupied by the caretakers who play a role in their development.22
Data on the number of dwellings sold per month are hard to establish but it is obviously not a particularly active market as reference to any of the daily newspapers will yield only a handful of properties being advertised at any one time. GREDA estimates that about 300 to 500 of its houses are sold annually. It is quite rare to see a ‘for sale’ sign outside a property (as in figure 64).
All locations Upmarket Gated Emerging upmarket
Middle Income
Tema
Average Yield (%) 7.9 8.7 8.9 9.2 5.8 5.5
Annualized per cent per year
Rental Growth 33.8 30.5 30.5 36.8 39.0 28.5
Price Growth 33.4 31.6 31.3 39.4 35.2 29.5
Income Return 4.6 5.4 5.4 5.4 3.3 3.4
Capital Growth 32.4 30.5 30.3 38.4 34.2 28.5
Total Return 37.2 36.5 35.9 44.6 37.6 32.2
Risk Standard Deviation of Return
22.9 31.7 27.6 56.2 22.3 35.9
Source: Anim-Odame17
Table 93. Investment performance by submarket 1992-2007, per cent per annum
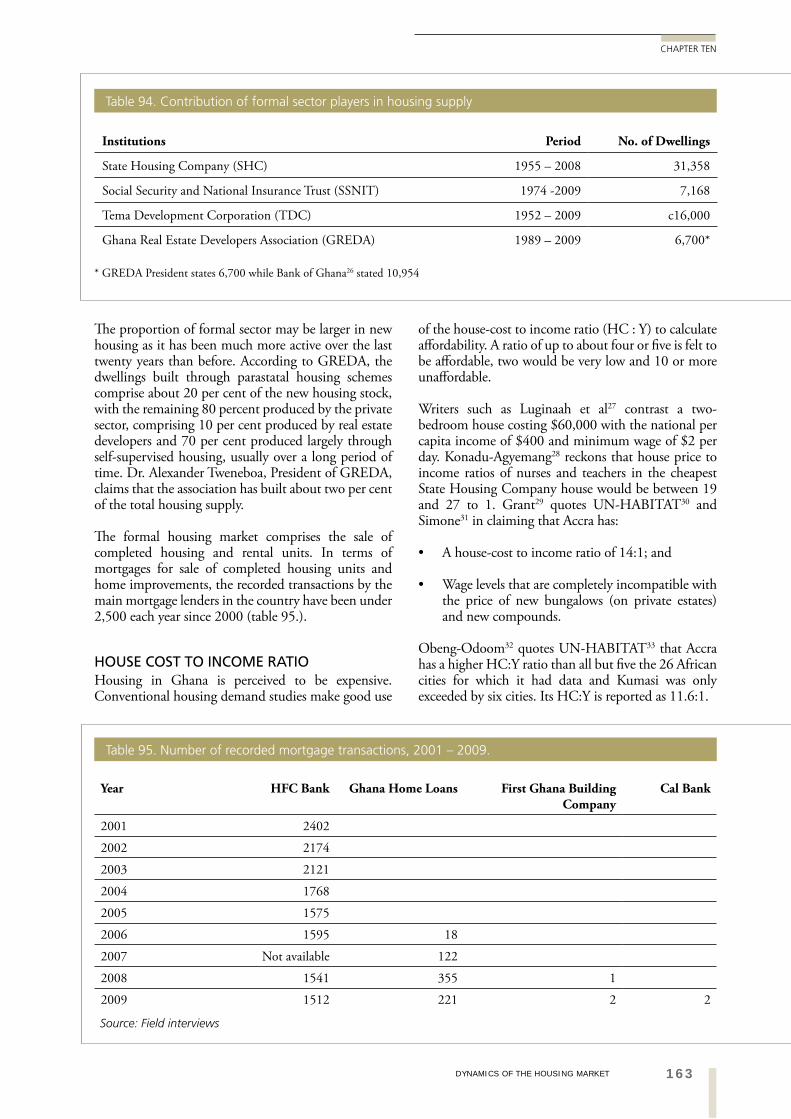
163DYNAMICS OF THE HOUSING MARKET
CHAPTER TEN
of the house-cost to income ratio (HC : Y) to calculate affordability. A ratio of up to about four or five is felt to be affordable, two would be very low and 10 or more unaffordable.
Writers such as Luginaah et al27 contrast a two-bedroom house costing $60,000 with the national per capita income of $400 and minimum wage of $2 per day. Konadu-Agyemang28 reckons that house price to income ratios of nurses and teachers in the cheapest State Housing Company house would be between 19 and 27 to 1. Grant29 quotes UN-HABITAT30 and Simone31 in claiming that Accra has:
A house-cost to income ratio of 14:1; and
Wage levels that are completely incompatible with the price of new bungalows (on private estates) and new compounds.
Obeng-Odoom32 quotes UN-HABITAT33 that Accra has a higher HC:Y ratio than all but five the 26 African cities for which it had data and Kumasi was only exceeded by six cities. Its HC:Y is reported as 11.6:1.
The proportion of formal sector may be larger in new housing as it has been much more active over the last twenty years than before. According to GREDA, the dwellings built through parastatal housing schemes comprise about 20 per cent of the new housing stock, with the remaining 80 percent produced by the private sector, comprising 10 per cent produced by real estate developers and 70 per cent produced largely through self-supervised housing, usually over a long period of time. Dr. Alexander Tweneboa, President of GREDA, claims that the association has built about two per cent of the total housing supply.
The formal housing market comprises the sale of completed housing and rental units. In terms of mortgages for sale of completed housing units and home improvements, the recorded transactions by the main mortgage lenders in the country have been under 2,500 each year since 2000 (table 95.).
HOUSE COST TO INCOME RATIOHousing in Ghana is perceived to be expensive. Conventional housing demand studies make good use
Institutions Period No. of Dwellings
State Housing Company (SHC) 1955 – 2008 31,358
Social Security and National Insurance Trust (SSNIT) 1974 -2009 7,168
Tema Development Corporation (TDC) 1952 – 2009 c16,000
Ghana Real Estate Developers Association (GREDA) 1989 – 2009 6,700*
Table 94. Contribution of formal sector players in housing supply
* GREDA President states 6,700 while Bank of Ghana26 stated 10,954
Year HFC Bank Ghana Home Loans First Ghana Building Company
Cal Bank
2001 2402
2002 2174
2003 2121
2004 1768
2005 1575
2006 1595 18
2007 Not available 122
2008 1541 355 1
2009 1512 221 2 2
Table 95. Number of recorded mortgage transactions, 2001 – 2009.
Source: Field interviews
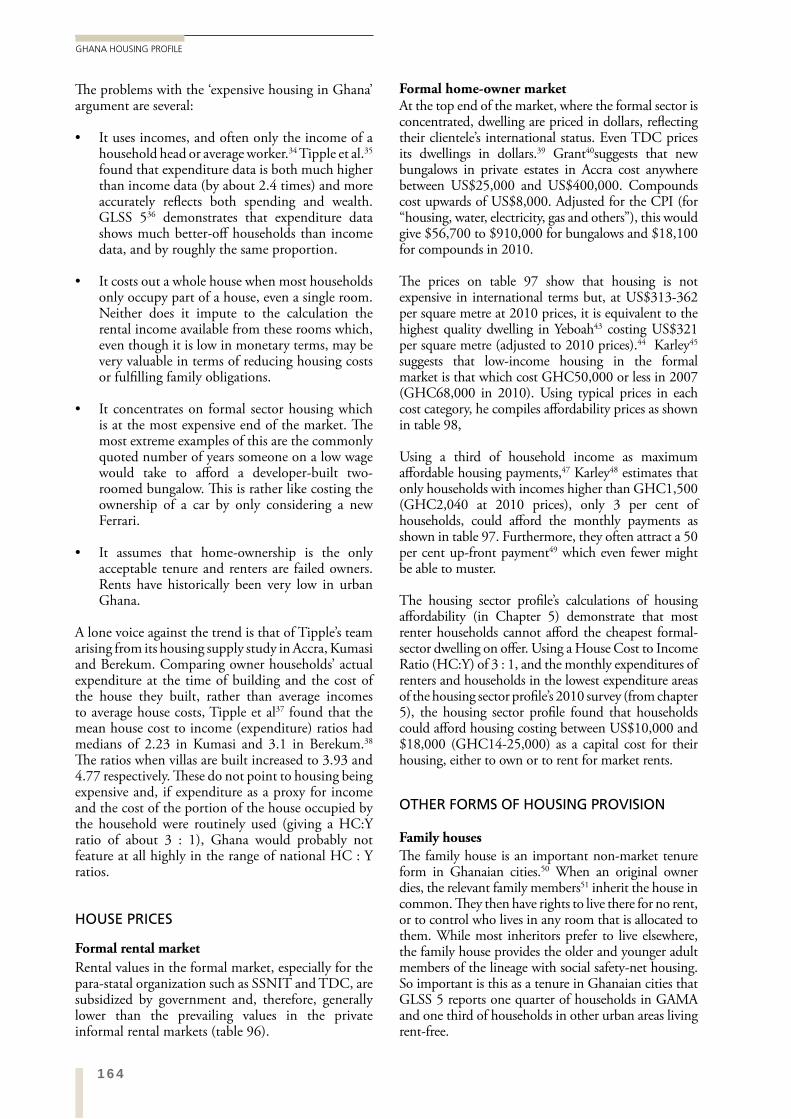
164
GHANA HOUSING PROFILE
Formal home-owner marketAt the top end of the market, where the formal sector is concentrated, dwelling are priced in dollars, reflecting their clientele’s international status. Even TDC prices its dwellings in dollars.39 Grant40suggests that new bungalows in private estates in Accra cost anywhere between US$25,000 and US$400,000. Compounds cost upwards of US$8,000. Adjusted for the CPI (for “housing, water, electricity, gas and others”), this would give $56,700 to $910,000 for bungalows and $18,100 for compounds in 2010.
The prices on table 97 show that housing is not expensive in international terms but, at US$313-362 per square metre at 2010 prices, it is equivalent to the highest quality dwelling in Yeboah43 costing US$321 per square metre (adjusted to 2010 prices).44 Karley45 suggests that low-income housing in the formal market is that which cost GHC50,000 or less in 2007 (GHC68,000 in 2010). Using typical prices in each cost category, he compiles affordability prices as shown in table 98,
Using a third of household income as maximum affordable housing payments,47 Karley48 estimates that only households with incomes higher than GHC1,500 (GHC2,040 at 2010 prices), only 3 per cent of households, could afford the monthly payments as shown in table 97. Furthermore, they often attract a 50 per cent up-front payment49 which even fewer might be able to muster.
The housing sector profile’s calculations of housing affordability (in Chapter 5) demonstrate that most renter households cannot afford the cheapest formal-sector dwelling on offer. Using a House Cost to Income Ratio (HC:Y) of 3 : 1, and the monthly expenditures of renters and households in the lowest expenditure areas of the housing sector profile’s 2010 survey (from chapter 5), the housing sector profile found that households could afford housing costing between US$10,000 and $18,000 (GHC14-25,000) as a capital cost for their housing, either to own or to rent for market rents.
OTHER FORMS OF HOUSING PROVISION
Family houses
The family house is an important non-market tenure form in Ghanaian cities.50 When an original owner dies, the relevant family members51 inherit the house in common. They then have rights to live there for no rent, or to control who lives in any room that is allocated to them. While most inheritors prefer to live elsewhere, the family house provides the older and younger adult members of the lineage with social safety-net housing. So important is this as a tenure in Ghanaian cities that GLSS 5 reports one quarter of households in GAMA and one third of households in other urban areas living rent-free.
The problems with the ‘expensive housing in Ghana’ argument are several:
It uses incomes, and often only the income of a household head or average worker.34 Tipple et al.35 found that expenditure data is both much higher than income data (by about 2.4 times) and more accurately reflects both spending and wealth. GLSS 536 demonstrates that expenditure data shows much better-off households than income data, and by roughly the same proportion.
It costs out a whole house when most households only occupy part of a house, even a single room. Neither does it impute to the calculation the rental income available from these rooms which, even though it is low in monetary terms, may be very valuable in terms of reducing housing costs or fulfilling family obligations.
It concentrates on formal sector housing which is at the most expensive end of the market. The most extreme examples of this are the commonly quoted number of years someone on a low wage would take to afford a developer-built two-roomed bungalow. This is rather like costing the ownership of a car by only considering a new Ferrari.
It assumes that home-ownership is the only acceptable tenure and renters are failed owners. Rents have historically been very low in urban Ghana.
A lone voice against the trend is that of Tipple’s team arising from its housing supply study in Accra, Kumasi and Berekum. Comparing owner households’ actual expenditure at the time of building and the cost of the house they built, rather than average incomes to average house costs, Tipple et al37 found that the mean house cost to income (expenditure) ratios had medians of 2.23 in Kumasi and 3.1 in Berekum.38 The ratios when villas are built increased to 3.93 and 4.77 respectively. These do not point to housing being expensive and, if expenditure as a proxy for income and the cost of the portion of the house occupied by the household were routinely used (giving a HC:Y ratio of about 3 : 1), Ghana would probably not feature at all highly in the range of national HC : Y ratios.
HOUSE PRICES
Formal rental market
Rental values in the formal market, especially for the para-statal organization such as SSNIT and TDC, are subsidized by government and, therefore, generally lower than the prevailing values in the private informal rental markets (table 96).
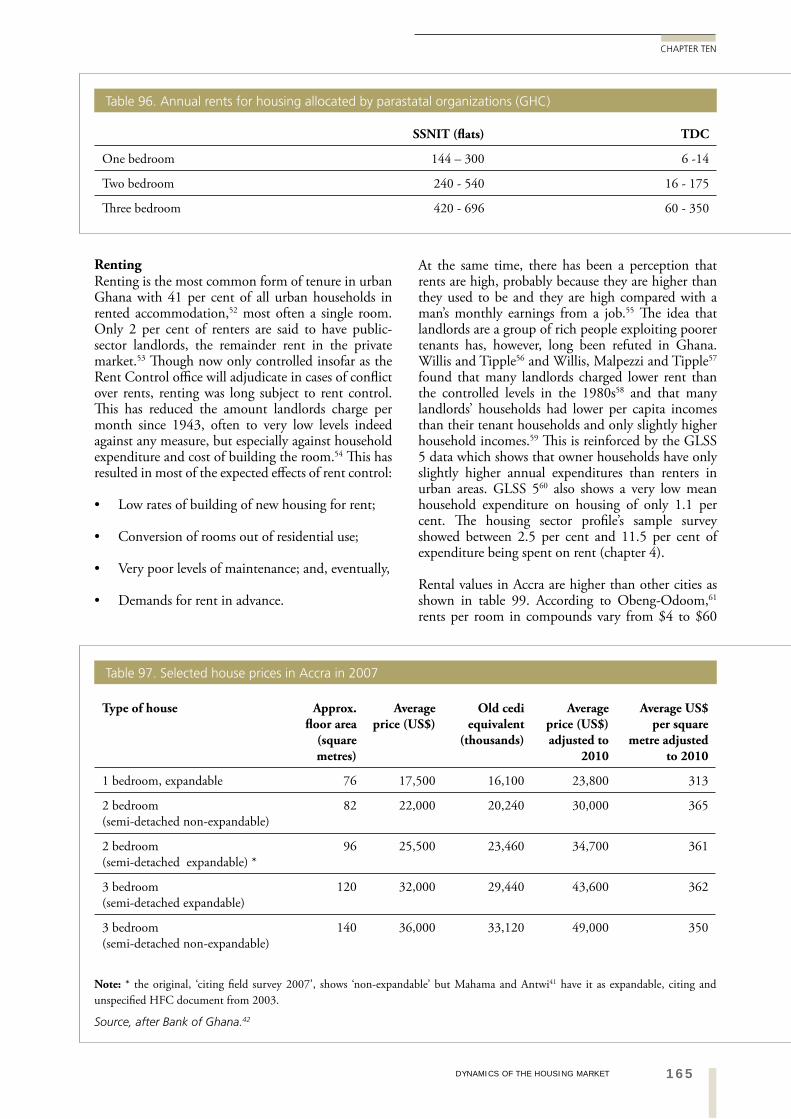
165DYNAMICS OF THE HOUSING MARKET
CHAPTER TEN
At the same time, there has been a perception that rents are high, probably because they are higher than they used to be and they are high compared with a man’s monthly earnings from a job.55 The idea that landlords are a group of rich people exploiting poorer tenants has, however, long been refuted in Ghana. Willis and Tipple56 and Willis, Malpezzi and Tipple57 found that many landlords charged lower rent than the controlled levels in the 1980s58 and that many landlords’ households had lower per capita incomes than their tenant households and only slightly higher household incomes.59 This is reinforced by the GLSS 5 data which shows that owner households have only slightly higher annual expenditures than renters in urban areas. GLSS 560 also shows a very low mean household expenditure on housing of only 1.1 per cent. The housing sector profile’s sample survey showed between 2.5 per cent and 11.5 per cent of expenditure being spent on rent (chapter 4).
Rental values in Accra are higher than other cities as shown in table 99. According to Obeng-Odoom,61
rents per room in compounds vary from $4 to $60
RentingRenting is the most common form of tenure in urban Ghana with 41 per cent of all urban households in rented accommodation,52 most often a single room. Only 2 per cent of renters are said to have public-sector landlords, the remainder rent in the private market.53 Though now only controlled insofar as the Rent Control office will adjudicate in cases of conflict over rents, renting was long subject to rent control. This has reduced the amount landlords charge per month since 1943, often to very low levels indeed against any measure, but especially against household expenditure and cost of building the room.54 This has resulted in most of the expected effects of rent control:
Low rates of building of new housing for rent;
Conversion of rooms out of residential use;
Very poor levels of maintenance; and, eventually,
Demands for rent in advance.
SSNIT (flats) TDC
One bedroom 144 – 300 6 -14
Two bedroom 240 - 540 16 - 175
Three bedroom 420 - 696 60 - 350
Table 96. Annual rents for housing allocated by parastatal organizations (GHC)
Type of house Approx. floor area
(square metres)
Average price (US$)
Old cedi equivalent
(thousands)
Average price (US$) adjusted to
2010
Average US$ per square
metre adjusted to 2010
1 bedroom, expandable 76 17,500 16,100 23,800 313
2 bedroom (semi-detached non-expandable)
82 22,000 20,240 30,000 365
2 bedroom (semi-detached expandable) *
96 25,500 23,460 34,700 361
3 bedroom (semi-detached expandable)
120 32,000 29,440 43,600 362
3 bedroom (semi-detached non-expandable)
140 36,000 33,120 49,000 350
Source, after Bank of Ghana.42
Table 97. Selected house prices in Accra in 2007
Note: * the original, ‘citing field survey 2007’, shows ‘non-expandable’ but Mahama and Antwi41 have it as expandable, citing and unspecified HFC document from 2003.
166
GHANA HOUSING PROFILE
At the top end of the market, rents are charged in US Dollars. In Accra, such rents vary from US$400 in individually-built areas to US$1,200 in gated estates. Many young workers employed by foreign companies rent in these areas.69
Table 100 shows how unrepresentative of the population of Accra generally are the occupants of the high-income housing in Grant’s70 sample. Any policies to address the general housing need in Accra through such housing are likely to be unsuccessful.
One important part of the housing market is that which takes residential accommodation out of the market for use as commercial property. Karley and Akomea,72 argue that supply has been unresponsive to the considerable growth in demand for offices. The rise in rents fed partly by this non-residential demand has not triggered new investment73 because banks are unwilling to increase their residential lending portfolios, partly because of the borrowing-short-and-lending-long issue. As economic growth continues but new property only appears in a trickle, rents are likely to continue to rise.74
10.3 HOUSING MARKET REGULATION
Housing market regulation in Ghana is provided, piecemeal, in a number of statutes, which include;
Town and Country Planning Ordinance (CAP 84) of 1945
The Administration of Lands Act 1962 ( Act 123)
The State Lands Act 1962, (Act 125)
Local Government Act 1994, (Act 462)
National Development Planning Commission Act (Act 479), 1994
National Development Planning Systems Act (Act 480), 1994
in Accra, with most around the $30-35 range, and between $15 and $25 in Sekondi-Takoradi. At the bottom of the market in GAMA, e.g., a room in Ashaiman or Old Fadama, rents of GHC10 would be paid for a wooden shack and GHC15 for a sandcrete block room. The latter in Adabraka, in central Accra, would rent for GHC20 per month.62
Korboe63 argues that rental accommodation has little to do with profit-making in Ghana. Certainly, in family-houses, the income from rented rooms tends to be used to pay for the maintenance as no co-owner wants to be responsible for the costs.
In order to increase the net present value of the low rents, however, landlords have resorted to demanding two or three years of rent in advance so even renters now need access to capital sums for housing. Prevalence of rent advances is not usually a feature of a high-rental market so is another marker towards rents being low, despite the common perception and much rhetoric. Tipple et al64 found that, in Kumasi in 1993, rent advances were 68 times the monthly rent at the median while in Accra and Berekum they were 30 and 38 months at the medians. In the GHC20 room in Adabraka, three years’ advance rent would be GHC720 (US$506). In the SUF study of Tulaku, Ashaiman,65 the mean monthly rent paid was GHC3.46 (six per cent of monthly income) and maintenance cost GHC5.66. Thus, housing cost (rent plus maintenance) was GHC9.12 per month (15 per cent of mean monthly income).66
Under the Rent Bill, 2010, it is proposed to revise rent law as laid down in the Rent Act, 1963, and its subsequent amendments. Under the new legislation, when it is passed, it will be illegal to demand an advance of more that one year’s rent but the fine for doing so is very low.67 Landlords will still be able to evict a tenant if the room is needed for a family member68 as long as the room is not re-let to someone else within two years. This ease of recovery has been a major benefit to landlords in the past and has undoubtedly been responsible for many rooms appearing on the rental market which otherwise would be kept empty until needed by a growing child.
Type of house House price Down payment (20%) Monthly repayment
Low-income housing 54,400 10,880 612
Mid income housing 95,200 19,040 1,088
Mid-high income housing 163,200 32,640 1,632
High income housing 204,000 40,800 2,448
Executive housing 476,000 102,000 3,400
Table 98. Affordability analysis from Karley46 adjusted to 2010 prices (GHC)
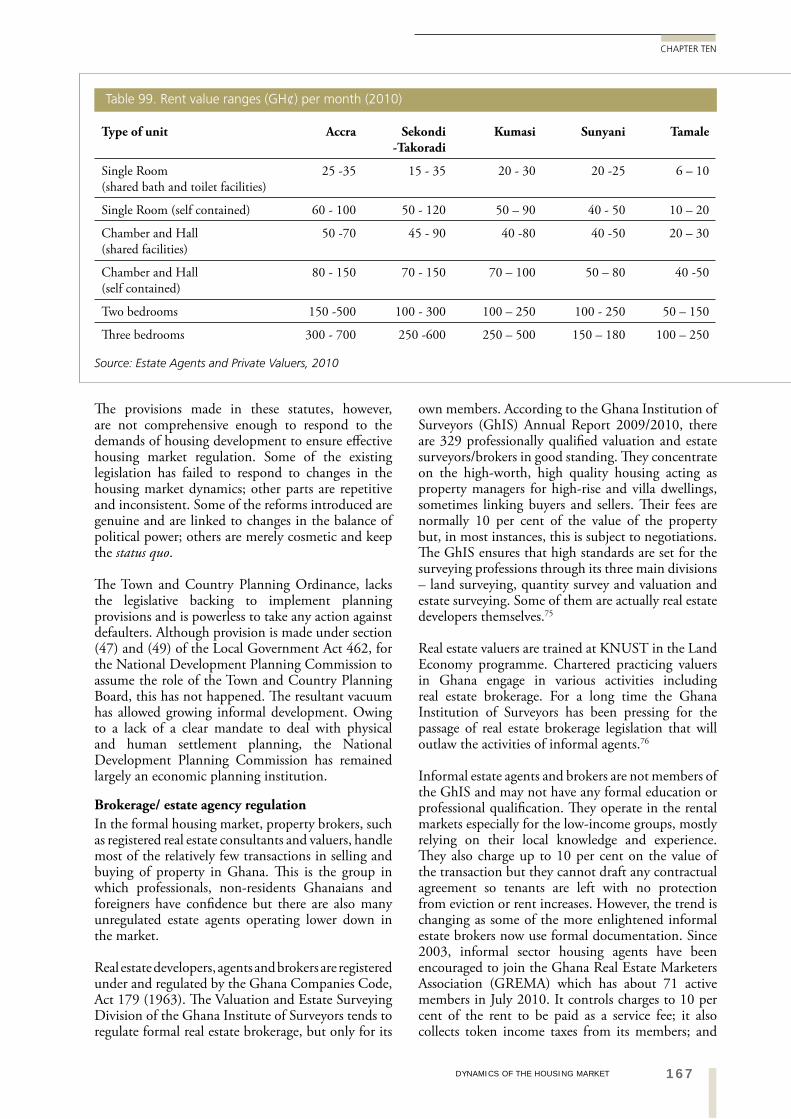
167DYNAMICS OF THE HOUSING MARKET
CHAPTER TEN
own members. According to the Ghana Institution of Surveyors (GhIS) Annual Report 2009/2010, there are 329 professionally qualified valuation and estate surveyors/brokers in good standing. They concentrate on the high-worth, high quality housing acting as property managers for high-rise and villa dwellings, sometimes linking buyers and sellers. Their fees are normally 10 per cent of the value of the property but, in most instances, this is subject to negotiations. The GhIS ensures that high standards are set for the surveying professions through its three main divisions – land surveying, quantity survey and valuation and estate surveying. Some of them are actually real estate developers themselves.75
Real estate valuers are trained at KNUST in the Land Economy programme. Chartered practicing valuers in Ghana engage in various activities including real estate brokerage. For a long time the Ghana Institution of Surveyors has been pressing for the passage of real estate brokerage legislation that will outlaw the activities of informal agents.76
Informal estate agents and brokers are not members of the GhIS and may not have any formal education or professional qualification. They operate in the rental markets especially for the low-income groups, mostly relying on their local knowledge and experience. They also charge up to 10 per cent on the value of the transaction but they cannot draft any contractual agreement so tenants are left with no protection from eviction or rent increases. However, the trend is changing as some of the more enlightened informal estate brokers now use formal documentation. Since 2003, informal sector housing agents have been encouraged to join the Ghana Real Estate Marketers Association (GREMA) which has about 71 active members in July 2010. It controls charges to 10 per cent of the rent to be paid as a service fee; it also collects token income taxes from its members; and
The provisions made in these statutes, however, are not comprehensive enough to respond to the demands of housing development to ensure effective housing market regulation. Some of the existing legislation has failed to respond to changes in the housing market dynamics; other parts are repetitive and inconsistent. Some of the reforms introduced are genuine and are linked to changes in the balance of political power; others are merely cosmetic and keep the status quo.
The Town and Country Planning Ordinance, lacks the legislative backing to implement planning provisions and is powerless to take any action against defaulters. Although provision is made under section (47) and (49) of the Local Government Act 462, for the National Development Planning Commission to assume the role of the Town and Country Planning Board, this has not happened. The resultant vacuum has allowed growing informal development. Owing to a lack of a clear mandate to deal with physical and human settlement planning, the National Development Planning Commission has remained largely an economic planning institution.
Brokerage/ estate agency regulation
In the formal housing market, property brokers, such as registered real estate consultants and valuers, handle most of the relatively few transactions in selling and buying of property in Ghana. This is the group in which professionals, non-residents Ghanaians and foreigners have confidence but there are also many unregulated estate agents operating lower down in the market.
Real estate developers, agents and brokers are registered under and regulated by the Ghana Companies Code, Act 179 (1963). The Valuation and Estate Surveying Division of the Ghana Institute of Surveyors tends to regulate formal real estate brokerage, but only for its
Type of unit Accra Sekondi -Takoradi
Kumasi Sunyani Tamale
Single Room (shared bath and toilet facilities)
25 -35 15 - 35 20 - 30 20 -25 6 – 10
Single Room (self contained) 60 - 100 50 - 120 50 – 90 40 - 50 10 – 20
Chamber and Hall (shared facilities)
50 -70 45 - 90 40 -80 40 -50 20 – 30
Chamber and Hall (self contained)
80 - 150 70 - 150 70 – 100 50 – 80 40 -50
Two bedrooms 150 -500 100 - 300 100 – 250 100 - 250 50 – 150
Three bedrooms 300 - 700 250 -600 250 – 500 150 – 180 100 – 250
Table 99. Rent value ranges (GH¢) per month (2010)
Source: Estate Agents and Private Valuers, 2010
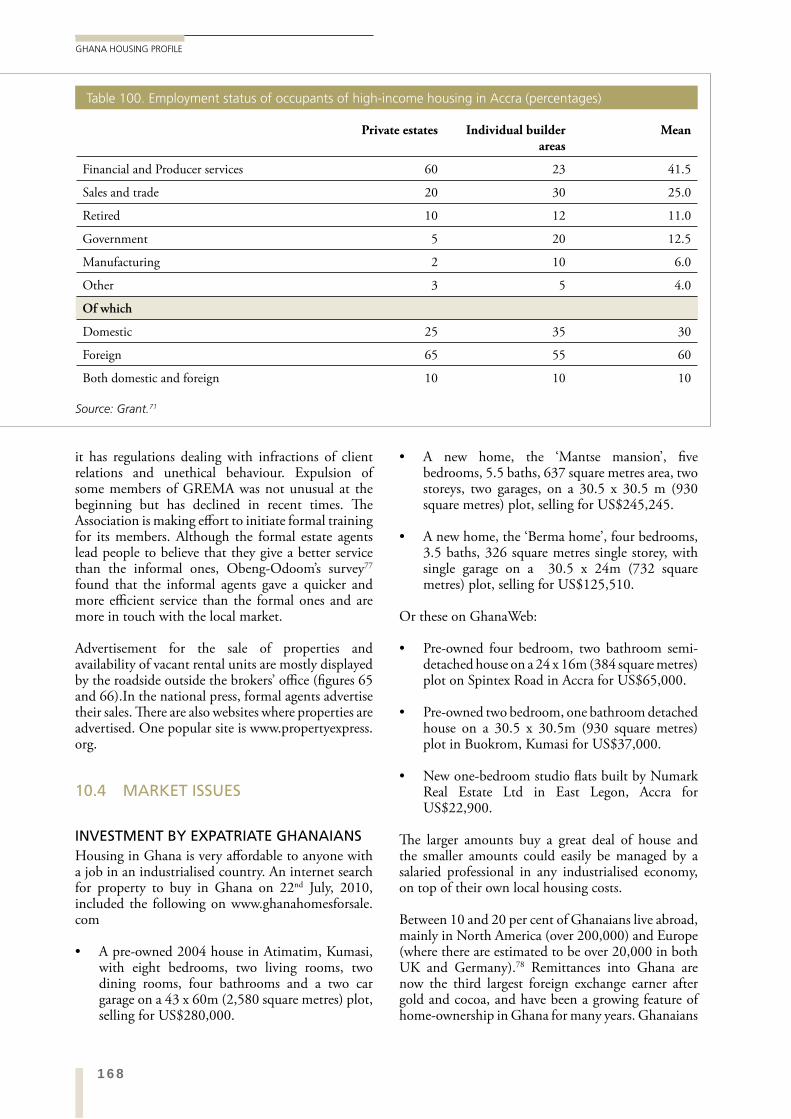
168
GHANA HOUSING PROFILE
A new home, the ‘Mantse mansion’, five bedrooms, 5.5 baths, 637 square metres area, two storeys, two garages, on a 30.5 x 30.5 m (930 square metres) plot, selling for US$245,245.
A new home, the ‘Berma home’, four bedrooms, 3.5 baths, 326 square metres single storey, with single garage on a 30.5 x 24m (732 square metres) plot, selling for US$125,510.
Or these on GhanaWeb:
Pre-owned four bedroom, two bathroom semi-detached house on a 24 x 16m (384 square metres) plot on Spintex Road in Accra for US$65,000.
Pre-owned two bedroom, one bathroom detached house on a 30.5 x 30.5m (930 square metres) plot in Buokrom, Kumasi for US$37,000.
New one-bedroom studio flats built by Numark Real Estate Ltd in East Legon, Accra for US$22,900.
The larger amounts buy a great deal of house and the smaller amounts could easily be managed by a salaried professional in any industrialised economy, on top of their own local housing costs.
Between 10 and 20 per cent of Ghanaians live abroad, mainly in North America (over 200,000) and Europe (where there are estimated to be over 20,000 in both UK and Germany).78 Remittances into Ghana are now the third largest foreign exchange earner after gold and cocoa, and have been a growing feature of home-ownership in Ghana for many years. Ghanaians
it has regulations dealing with infractions of client relations and unethical behaviour. Expulsion of some members of GREMA was not unusual at the beginning but has declined in recent times. The Association is making effort to initiate formal training for its members. Although the formal estate agents lead people to believe that they give a better service than the informal ones, Obeng-Odoom’s survey77 found that the informal agents gave a quicker and more efficient service than the formal ones and are more in touch with the local market.
Advertisement for the sale of properties and availability of vacant rental units are mostly displayed by the roadside outside the brokers’ office (figures 65 and 66).In the national press, formal agents advertise their sales. There are also websites where properties are advertised. One popular site is www.propertyexpress.org.
10.4 MARKET ISSUES
INVESTMENT BY EXPATRIATE GHANAIANSHousing in Ghana is very affordable to anyone with a job in an industrialised country. An internet search for property to buy in Ghana on 22nd July, 2010, included the following on www.ghanahomesforsale.com
A pre-owned 2004 house in Atimatim, Kumasi, with eight bedrooms, two living rooms, two dining rooms, four bathrooms and a two car garage on a 43 x 60m (2,580 square metres) plot, selling for US$280,000.
Private estates Individual builder areas
Mean
Financial and Producer services 60 23 41.5
Sales and trade 20 30 25.0
Retired 10 12 11.0
Government 5 20 12.5
Manufacturing 2 10 6.0
Other 3 5 4.0
Of which
Domestic 25 35 30
Foreign 65 55 60
Both domestic and foreign 10 10 10
Table 100. Employment status of occupants of high-income housing in Accra (percentages)
Source: Grant.71
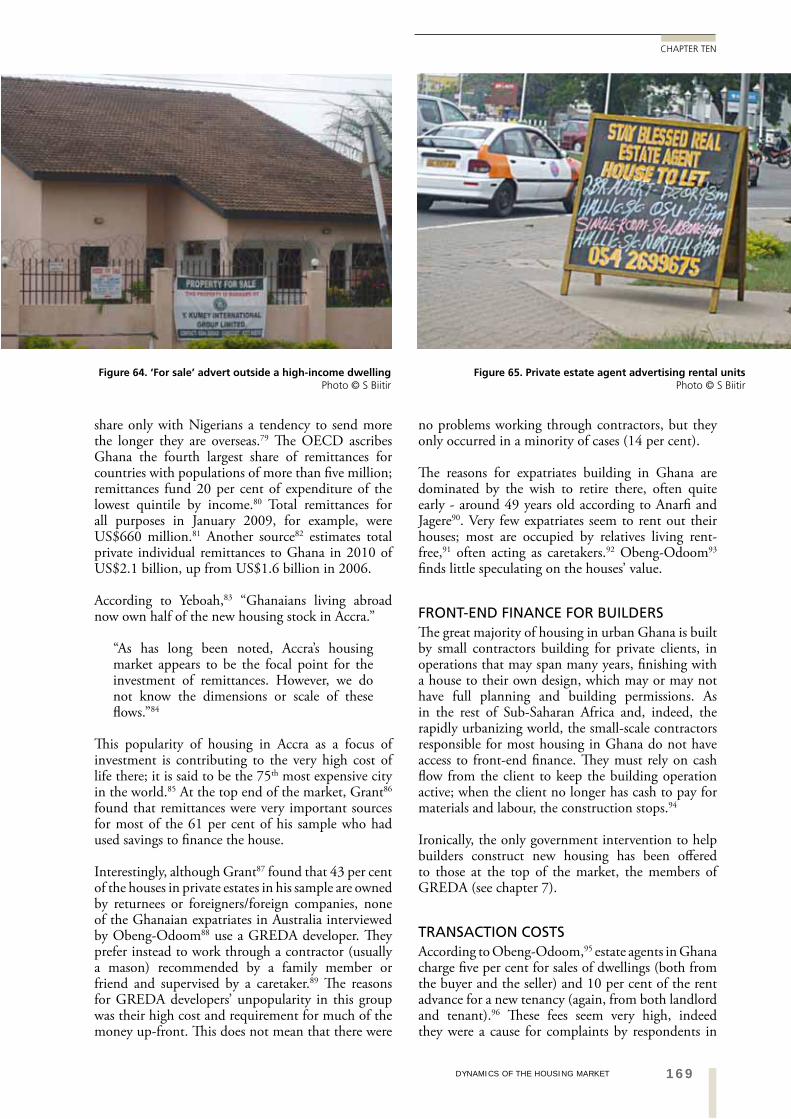
169DYNAMICS OF THE HOUSING MARKET
CHAPTER TEN
no problems working through contractors, but they only occurred in a minority of cases (14 per cent).
The reasons for expatriates building in Ghana are dominated by the wish to retire there, often quite early - around 49 years old according to Anarfi and Jagere90. Very few expatriates seem to rent out their houses; most are occupied by relatives living rent-free,91 often acting as caretakers.92 Obeng-Odoom93 finds little speculating on the houses’ value.
FRONT-END FINANCE FOR BUILDERSThe great majority of housing in urban Ghana is built by small contractors building for private clients, in operations that may span many years, finishing with a house to their own design, which may or may not have full planning and building permissions. As in the rest of Sub-Saharan Africa and, indeed, the rapidly urbanizing world, the small-scale contractors responsible for most housing in Ghana do not have access to front-end finance. They must rely on cash flow from the client to keep the building operation active; when the client no longer has cash to pay for materials and labour, the construction stops.94
Ironically, the only government intervention to help builders construct new housing has been offered to those at the top of the market, the members of GREDA (see chapter 7).
TRANSACTION COSTSAccording to Obeng-Odoom,95 estate agents in Ghana charge five per cent for sales of dwellings (both from the buyer and the seller) and 10 per cent of the rent advance for a new tenancy (again, from both landlord and tenant).96 These fees seem very high, indeed they were a cause for complaints by respondents in
share only with Nigerians a tendency to send more the longer they are overseas.79 The OECD ascribes Ghana the fourth largest share of remittances for countries with populations of more than five million; remittances fund 20 per cent of expenditure of the lowest quintile by income.80 Total remittances for all purposes in January 2009, for example, were US$660 million.81 Another source82 estimates total private individual remittances to Ghana in 2010 of US$2.1 billion, up from US$1.6 billion in 2006.
According to Yeboah,83 “Ghanaians living abroad now own half of the new housing stock in Accra.”
“As has long been noted, Accra’s housing market appears to be the focal point for the investment of remittances. However, we do not know the dimensions or scale of these flows.”84
This popularity of housing in Accra as a focus of investment is contributing to the very high cost of life there; it is said to be the 75th most expensive city in the world.85 At the top end of the market, Grant86 found that remittances were very important sources for most of the 61 per cent of his sample who had used savings to finance the house.
Interestingly, although Grant87 found that 43 per cent of the houses in private estates in his sample are owned by returnees or foreigners/foreign companies, none of the Ghanaian expatriates in Australia interviewed by Obeng-Odoom88 use a GREDA developer. They prefer instead to work through a contractor (usually a mason) recommended by a family member or friend and supervised by a caretaker.89 The reasons for GREDA developers’ unpopularity in this group was their high cost and requirement for much of the money up-front. This does not mean that there were
Figure 65. Private estate agent advertising rental units Photo © S Biitir
Figure 64. ‘For sale’ advert outside a high-income dwelling Photo © S Biitir
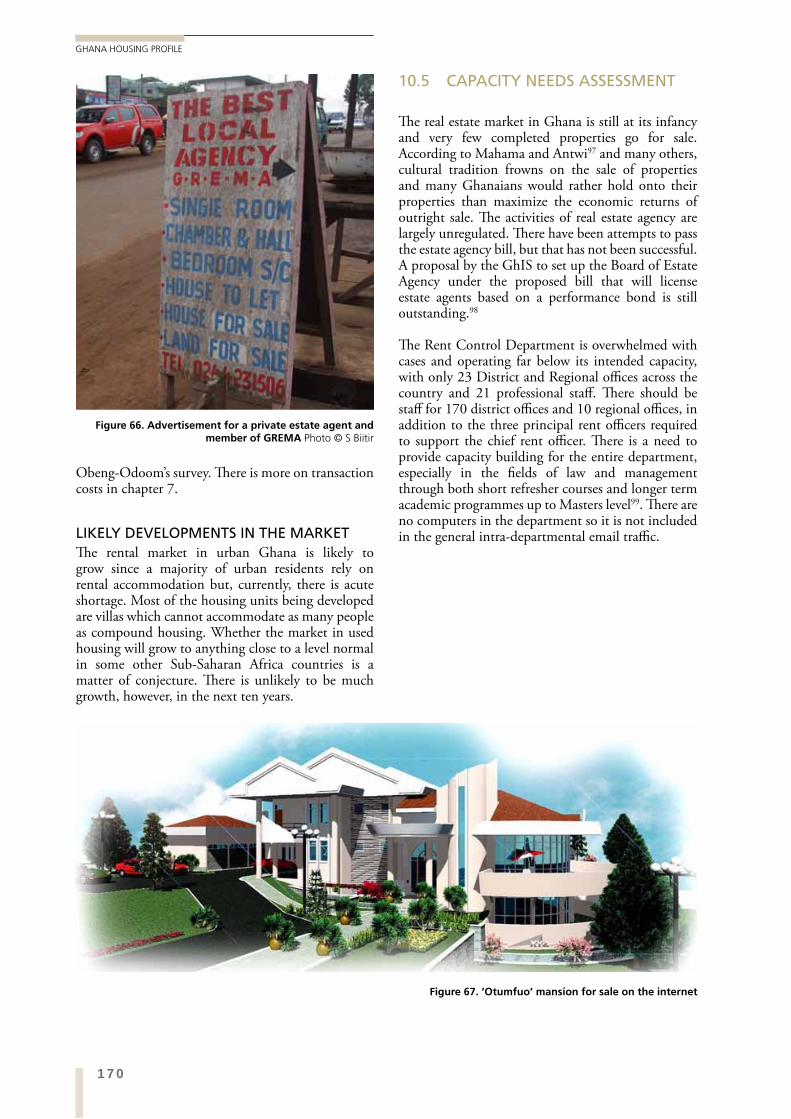
170
GHANA HOUSING PROFILE
10.5 CAPACITY NEEDS ASSESSMENT
The real estate market in Ghana is still at its infancy and very few completed properties go for sale. According to Mahama and Antwi97 and many others, cultural tradition frowns on the sale of properties and many Ghanaians would rather hold onto their properties than maximize the economic returns of outright sale. The activities of real estate agency are largely unregulated. There have been attempts to pass the estate agency bill, but that has not been successful. A proposal by the GhIS to set up the Board of Estate Agency under the proposed bill that will license estate agents based on a performance bond is still outstanding.98
The Rent Control Department is overwhelmed with cases and operating far below its intended capacity, with only 23 District and Regional offices across the country and 21 professional staff. There should be staff for 170 district offices and 10 regional offices, in addition to the three principal rent officers required to support the chief rent officer. There is a need to provide capacity building for the entire department, especially in the fields of law and management through both short refresher courses and longer term academic programmes up to Masters level99. There are no computers in the department so it is not included in the general intra-departmental email traffic.
Obeng-Odoom’s survey. There is more on transaction costs in chapter 7.
LIKELY DEVELOPMENTS IN THE MARKETThe rental market in urban Ghana is likely to grow since a majority of urban residents rely on rental accommodation but, currently, there is acute shortage. Most of the housing units being developed are villas which cannot accommodate as many people as compound housing. Whether the market in used housing will grow to anything close to a level normal in some other Sub-Saharan Africa countries is a matter of conjecture. There is unlikely to be much growth, however, in the next ten years.
Figure 66. Advertisement for a private estate agent and member of GREMA Photo © S Biitir
Figure 67. ‘Otumfuo’ mansion for sale on the internet
171DYNAMICS OF THE HOUSING MARKET
CHAPTER TEN
completed item is cheap by international standards, it is probably difficult to make it cheaper except by using cheaper local materials or paying labour very poorly. The former is certainly worth encouraging as part of policy intervention. However, if the main problem is low income, it is on raising incomes that intervention should concentrate.
10.6 BRIEF CONCLUSION
As was noted in the Malawi Housing Sector Profile,100 it is not that housing is very expensive in Ghana but that incomes are too low. Formal housing consists largely of internationally-traded commodities; cement, steel, aluminium, timber, glass, etc., all of which have minimum feasible prices. This is exacerbated, however, by the high threshold which the regulatory framework and customary practice impose including very large plot sizes and high specification materials.
The almost universal perception in Ghana is that housing is very expensive. Certainly when set against incomes, it is. But, as Konadu-Agyemang101 points out, someone looking in from outside will regard housing as cheap by international standards (see dollar equivalents on table 97). Even though this might seem irrelevant when incomes cannot match the cost of owning a dwelling, it is not. In policy, the interventions should address the problem rather than the symptoms. In housing, therefore, if the
SECTION ENDNOTES
1 In much of Ghana, land belongs to the community of those who have died, those who are alive and those yet to be born. The dead are active in protecting the interests of those yet to be born (Ollennu, 1962) and see chapter 6.
2 Gough and Yankson (2000).3 Mahama and Antwi (2006).4 Brokensha (1966).5 Which, as will be seen, is greatly reduced as a result of decades of rent control.6 Buckley and Mathema (2007).7 Those who knew central Kumasi 30 years ago will be completely familiar with it today, apart from the
proliferation of goods for sale and the traffic!8 Gyourko et al. (2006: 3, quoted in Buckley and Mathema, 2007).9 In comparison with Malawi, where there is also a very limited market in housing, Ghana’s market
appears to be very small indeed; less than one fourth of the space taken up in the Malawian daily newspapers, for example.
10 Obeng-Odoom (2009a).11 Konadu-Agyeman (2001)12 For decades, the preferred safe-haven for money has been in a European or North American bank
account.13 Discussion with Dr Raymond Abdulai, March 2010.14 Anim-Odame (2010).15 Anim-Odame (2010).16 Anim-Odame (2010).17 Anim-Odame (2010)18 Anim-Odame (2010).19 Anim-Odame (2010).20 Grant (2007).21 Diko and Tipple (1992)22 Gough and Yankson (2010).23 Ofori (2006).24 Tipple and Willis (1991).
REASONABLE RENTS AND A REALISTIC INCREASE IN ACCOMMODATION SHOULD REMOVE THE NEED FOR LANDLORDS TO MAXIMIZE THE NET PRESENT VALUE OF RENTS BY DEMANDING ADVANCE PAYMENTS.
172
GHANA HOUSING PROFILE
25 Ghana Statistical Service (2002a).26 Bank of Ghana (2007).27 (Luginaah et al., 2010)28 Konadu-Agyemang (2001).29 Grant (2007).30 UN-HABITAT (2003).31 Simone (2004).32 Obeng-Odoom (Forthcoming 2011)33 UN-HABITAT (2003).34 There are good cultural reasons for this, see footnote 540.35 Tipple et al. (1997).36 Ghana Statistical Service (2008).37 Tipple et al (1999).38 No HC:Y is noted for Accra but all the other data leads us to assume that it would not have been
materially different.39 This must have some effect on the tendency to save in foreign currencies. In 1994, at the heart of
the very inflationary period, 24 per cent of the C840 billion bank deposits were in foreign exchange (Konadu-Agyemang, 2001).
40 Grant (2007 citing Simone, 2004)41 Antwi (2006).42 Bank of Ghana (2007: 28).43 Yeboah (2005).44 US$142 per square metre in 2004 according to Yeboah (2005).45 Karley (2008).46 Karley (2008: 10)47 This would be high if income figures in Ghana reflected expenditure at all (Tipple et al., 1997) as it
means paying one third of income for housing. In the event, it would probably constitute about 12 per cent of expenditure or a loan to expenditure ratio of 1:8.
48 Karley (2008).49 Konadu-Agyemang (2001).50 Korboe (1992a) ; Amole et al. (1993).51 In Ashanti, the abusua. Busia (1954) gave a very complete account of the matrikinship relationships
within the abusua. 52 Ghana Statistical Service (2008).53 CHF International (2004) cited by Obeng-Odoom (Forthcoming 2011)54 Tipple et al. (1999).55 As it is traditionally a man’s role to house his wife and children, it is his income against which rents tend
to be measured.56 Willis and Tipple (1991).57 Willis, Malpezzi and Tipple (1990).58 Admittedly, some households received very little for their rent. Indeed, Malpezzi et al (1990) used
hedonic regression to show that some rents were higher than a notional market rent would be for that property, so few benefits did it bestow on its occupants!
59 Using expenditure as a proxy. In Ghana, data on expenditure have been found to be a better representation than answers to questions on income (Tipple et al., 1997).
60 Ghana Statistical Service (Ghana Statistical Service, 2008).61 Obeng-Odoom (Forthcoming 2011).62 Personal communication, Farouk Braimah, 2010.63 Korboe (1992b; 1993).64 Tipple et al (1999).65 Ofori (2006).66 It would be much lower against expenditure (see above).67 Expressed as ten penalty points. For comparison, a landlord who unfairly ejects a tenant will be liable to
six months in prison and 100 penalty points.68 Family member includes the nuclear family plus parents and siblings.69 Grant (2007).70 Grant (2007).71 Grant (2007: 47).72 Karley and Akomea (2007).73 As Buckley and Mathema (2007) also argue.74 Karley and Akomea (2007).
173DYNAMICS OF THE HOUSING MARKET
CHAPTER TEN
75 Mahama and Antwi (2006).76 Discussion with Dr Raymond Abdulai, March 2010.77 Obeng-Odoom (2009)78 Obeng-Odoom (2010). It is said that, wherever you go, in any country, on any ship, the chances are that
Ghanaians will be there.79 Orozco et al.(2005, cited by Grant 2007).80 Buckley and Mathema (2007).81 Obeng-Odoom (2010).82 Recent Bank of Ghana data from interviews in May,2011.83 Yeboah (2003: 117).84 Buckley and Mathema (2007: 19)85 Buckley and Mathema (2007). This probably only relates to a ‘western’ lifestyle in the formal sector
and anyone staying in ‘western’ hotels there would feel it should be even higher. Occupants of many neighbourhoods, however, will live on very little money indeed.
86 Grant (2007)87 Grant (2007).88 Obeng-Odoom (2010).89 As found earlier by Diko and Tipple (1992 ).90 Anarfi and Jagere (2005, cited by Obeng-Odoom, 2010).91 Obeng-Odoom (2010).92 Gough and Yankson (2000).93 Obeng-Odoom (2010).94 Tipple et al. (1999).95 Obeng-Odoom (2009).96 This is an offence under the Rent Control Act, 1963, section 25 (1)c (Obeng-Odoom, 2009).97 Mahama and Antwi (2006).98 Mahama and Antwi (2006).99 It is a prerequisite for the Chief Rent Officer to have a Masters degree in law or related subjects.100 (UN-HABITAT, 2009)101 Konadu-Agyemang (2001).
174
GHANA HOUSING PROFILE
INSTITUTIONAL FRAMEWORKThe current institutional framework is wholly unsuited to rapid housing supply at the scale and pace of delivery required. The concentration of resources and political effort on the tiny formal sector at the top of the market is both inappropriate for and unfair to the majority of Ghanaians. While institutions such as SHC, TDC, SSNIT, etc., and associations such as GREDA have a role in their high-end niche markets, the bulk of housing is, and will continue to be, provided by households making agreements with small contractors on land leased from a traditional authority. The key to making efficiency gains in housing supply is to shift at least a majority of housing resources to this informal process rather than directing effort at the formal suppliers who only produce a few thousand dwellings per annum and do so out of the price range of the majority.
Policy-makers should widen their focus from just single-household villas for ownership to encourage multi-occupancy types for renting and family houses (which provide free accommodation to the poorest households). Thus, the current institutional framework may need to change radically to provide for what is discussed above.
To overcome the problems of discontinuity in policy and institutional organisation, there are two clear lines of actions for the Housing Policy Directorate.
1. It should move away from its arbitrary estimates of current and projected supply and demand, as the basis for policy, to more carefully calculated estimates. Indeed, the profile’s estimate of the need for new rooms is a step in this direction.
2. Government should improve its institutional capability so that the key political actors in the ministry can use reliable evidence to make policy, and promote the inter-sectoral co-operation needed for sustainable and serviced housing development. It is important that the
11.1 ENABLING THE SUPPLY OF ENOUGH HOUSING
It is clear that, if urban housing supply follows the proposed planning standards for occupancy of a maximum of two persons per room,1 there is a need for about 5.7 million rooms, together with all the accompanying land and infrastructure for adequate housing, between 2010 and 2020. The affordability calculations point to a need to concentrate on the broad price for housing solutions in the range of US$10 – 18,000 (GHC14 – 25,000) per household. Of this, 40 per cent might be for land and infrastructure, which together can cost US$4 – 7,200 (GHC5,700 – 10,800), while the building itself can cost US$6 – 10,800 (GHC8,600 – 15,100). At a mean of 2.74 rooms per household, which 2 ppr and the household distribution generate (chapter 5), rooms will need to be built for between US$2,200 and 4,000 (GHC3,100-5,500) each. These must be provided at a rate of about four new rooms every minute of the working week for ten years. If they were provided as a self-contained dwelling for each household, about 1.4 would be required every minute of the working week.
In order to fulfil the scale, cost and speed of supply required, and avoid the increases in density in inner-city areas and crowding in general, there is a need for a paradigm shift in housing supply in urban Ghana. The current focus on providing a few thousand high-quality dwellings on fully-serviced plots for middle- and high-income households does not address the central issues of housing supply. Focus must be switched to creating conditions that will favour the scaling-up of housing supply both in quantity and diversity in size, type and location and, thus, enable rapid supply of very low-cost accommodation. This chapter outlines the critical issues and suggests changes where they are most needed in order to address the housing challenges in Ghana.
11THE WAY FORWARD IN
HOUSING PROVISION
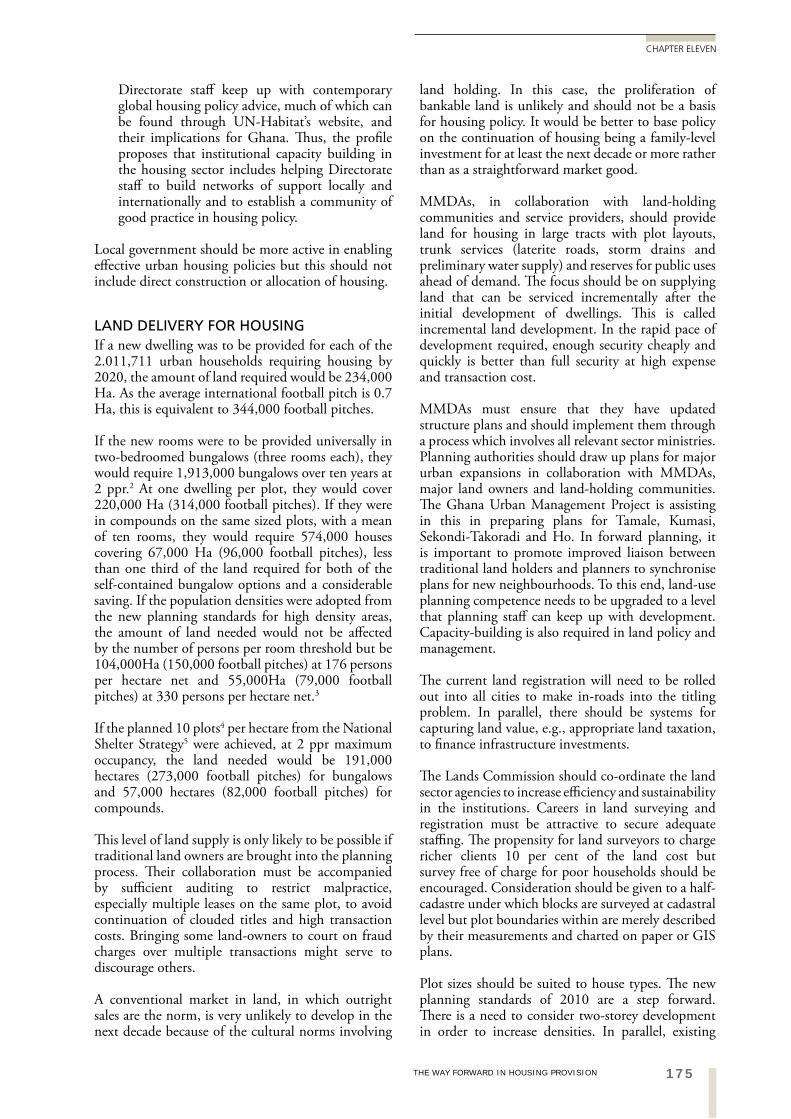
175
CHAPTER ELEVEN
THE WAY FORWARD IN HOUSING PROVISION
land holding. In this case, the proliferation of bankable land is unlikely and should not be a basis for housing policy. It would be better to base policy on the continuation of housing being a family-level investment for at least the next decade or more rather than as a straightforward market good.
MMDAs, in collaboration with land-holding communities and service providers, should provide land for housing in large tracts with plot layouts, trunk services (laterite roads, storm drains and preliminary water supply) and reserves for public uses ahead of demand. The focus should be on supplying land that can be serviced incrementally after the initial development of dwellings. This is called incremental land development. In the rapid pace of development required, enough security cheaply and quickly is better than full security at high expense and transaction cost.
MMDAs must ensure that they have updated structure plans and should implement them through a process which involves all relevant sector ministries. Planning authorities should draw up plans for major urban expansions in collaboration with MMDAs, major land owners and land-holding communities. The Ghana Urban Management Project is assisting in this in preparing plans for Tamale, Kumasi, Sekondi-Takoradi and Ho. In forward planning, it is important to promote improved liaison between traditional land holders and planners to synchronise plans for new neighbourhoods. To this end, land-use planning competence needs to be upgraded to a level that planning staff can keep up with development. Capacity-building is also required in land policy and management.
The current land registration will need to be rolled out into all cities to make in-roads into the titling problem. In parallel, there should be systems for capturing land value, e.g., appropriate land taxation, to finance infrastructure investments.
The Lands Commission should co-ordinate the land sector agencies to increase efficiency and sustainability in the institutions. Careers in land surveying and registration must be attractive to secure adequate staffing. The propensity for land surveyors to charge richer clients 10 per cent of the land cost but survey free of charge for poor households should be encouraged. Consideration should be given to a half-cadastre under which blocks are surveyed at cadastral level but plot boundaries within are merely described by their measurements and charted on paper or GIS plans.
Plot sizes should be suited to house types. The new planning standards of 2010 are a step forward. There is a need to consider two-storey development in order to increase densities. In parallel, existing
Directorate staff keep up with contemporary global housing policy advice, much of which can be found through UN-Habitat’s website, and their implications for Ghana. Thus, the profile proposes that institutional capacity building in the housing sector includes helping Directorate staff to build networks of support locally and internationally and to establish a community of good practice in housing policy.
Local government should be more active in enabling effective urban housing policies but this should not include direct construction or allocation of housing.
LAND DELIVERY FOR HOUSINGIf a new dwelling was to be provided for each of the 2.011,711 urban households requiring housing by 2020, the amount of land required would be 234,000 Ha. As the average international football pitch is 0.7 Ha, this is equivalent to 344,000 football pitches.
If the new rooms were to be provided universally in two-bedroomed bungalows (three rooms each), they would require 1,913,000 bungalows over ten years at 2 ppr.2 At one dwelling per plot, they would cover 220,000 Ha (314,000 football pitches). If they were in compounds on the same sized plots, with a mean of ten rooms, they would require 574,000 houses covering 67,000 Ha (96,000 football pitches), less than one third of the land required for both of the self-contained bungalow options and a considerable saving. If the population densities were adopted from the new planning standards for high density areas, the amount of land needed would not be affected by the number of persons per room threshold but be 104,000Ha (150,000 football pitches) at 176 persons per hectare net and 55,000Ha (79,000 football pitches) at 330 persons per hectare net.3
If the planned 10 plots4 per hectare from the National Shelter Strategy5 were achieved, at 2 ppr maximum occupancy, the land needed would be 191,000 hectares (273,000 football pitches) for bungalows and 57,000 hectares (82,000 football pitches) for compounds.
This level of land supply is only likely to be possible if traditional land owners are brought into the planning process. Their collaboration must be accompanied by sufficient auditing to restrict malpractice, especially multiple leases on the same plot, to avoid continuation of clouded titles and high transaction costs. Bringing some land-owners to court on fraud charges over multiple transactions might serve to discourage others.
A conventional market in land, in which outright sales are the norm, is very unlikely to develop in the next decade because of the cultural norms involving
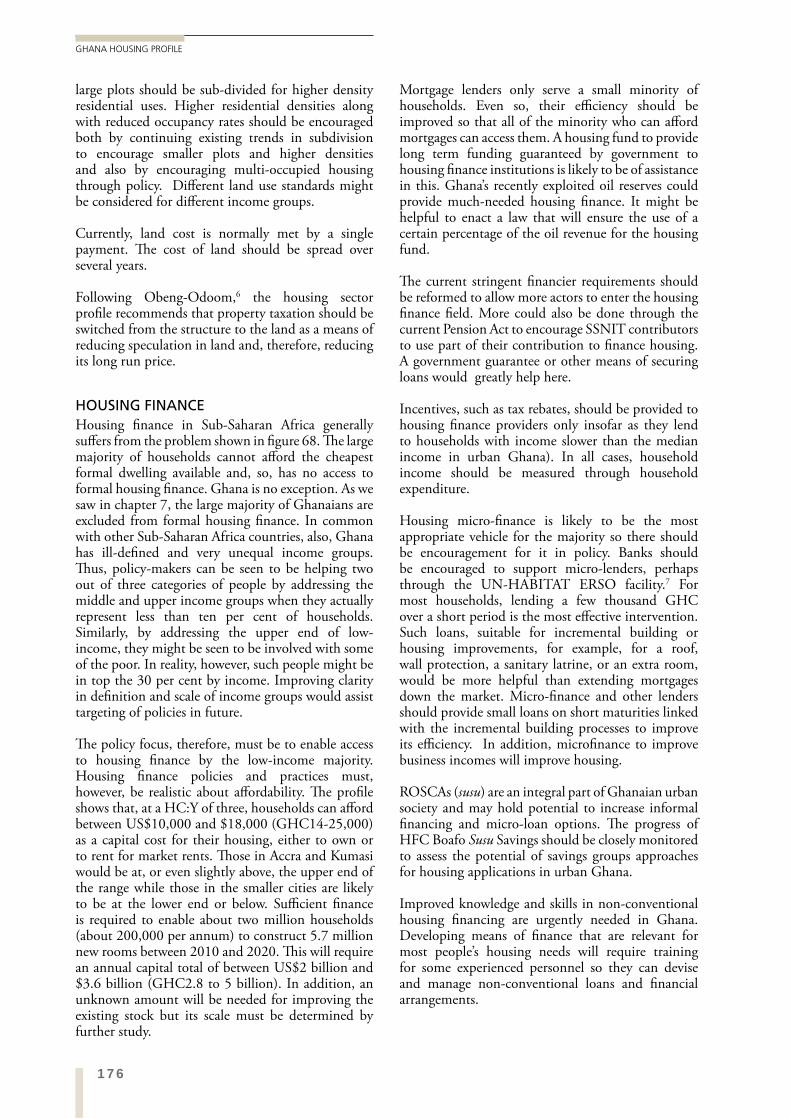
176
GHANA HOUSING PROFILE
Mortgage lenders only serve a small minority of households. Even so, their efficiency should be improved so that all of the minority who can afford mortgages can access them. A housing fund to provide long term funding guaranteed by government to housing finance institutions is likely to be of assistance in this. Ghana’s recently exploited oil reserves could provide much-needed housing finance. It might be helpful to enact a law that will ensure the use of a certain percentage of the oil revenue for the housing fund.
The current stringent financier requirements should be reformed to allow more actors to enter the housing finance field. More could also be done through the current Pension Act to encourage SSNIT contributors to use part of their contribution to finance housing. A government guarantee or other means of securing loans would greatly help here.
Incentives, such as tax rebates, should be provided to housing finance providers only insofar as they lend to households with income slower than the median income in urban Ghana). In all cases, household income should be measured through household expenditure.
Housing micro-finance is likely to be the most appropriate vehicle for the majority so there should be encouragement for it in policy. Banks should be encouraged to support micro-lenders, perhaps through the UN-HABITAT ERSO facility.7 For most households, lending a few thousand GHC over a short period is the most effective intervention. Such loans, suitable for incremental building or housing improvements, for example, for a roof, wall protection, a sanitary latrine, or an extra room, would be more helpful than extending mortgages down the market. Micro-finance and other lenders should provide small loans on short maturities linked with the incremental building processes to improve its efficiency. In addition, microfinance to improve business incomes will improve housing.
ROSCAs (susu) are an integral part of Ghanaian urban society and may hold potential to increase informal financing and micro-loan options. The progress of HFC Boafo Susu Savings should be closely monitored to assess the potential of savings groups approaches for housing applications in urban Ghana.
Improved knowledge and skills in non-conventional housing financing are urgently needed in Ghana. Developing means of finance that are relevant for most people’s housing needs will require training for some experienced personnel so they can devise and manage non-conventional loans and financial arrangements.
large plots should be sub-divided for higher density residential uses. Higher residential densities along with reduced occupancy rates should be encouraged both by continuing existing trends in subdivision to encourage smaller plots and higher densities and also by encouraging multi-occupied housing through policy. Different land use standards might be considered for different income groups.
Currently, land cost is normally met by a single payment. The cost of land should be spread over several years.
Following Obeng-Odoom,6 the housing sector profile recommends that property taxation should be switched from the structure to the land as a means of reducing speculation in land and, therefore, reducing its long run price.
HOUSING FINANCEHousing finance in Sub-Saharan Africa generally suffers from the problem shown in figure 68. The large majority of households cannot afford the cheapest formal dwelling available and, so, has no access to formal housing finance. Ghana is no exception. As we saw in chapter 7, the large majority of Ghanaians are excluded from formal housing finance. In common with other Sub-Saharan Africa countries, also, Ghana has ill-defined and very unequal income groups. Thus, policy-makers can be seen to be helping two out of three categories of people by addressing the middle and upper income groups when they actually represent less than ten per cent of households. Similarly, by addressing the upper end of low-income, they might be seen to be involved with some of the poor. In reality, however, such people might be in top the 30 per cent by income. Improving clarity in definition and scale of income groups would assist targeting of policies in future.
The policy focus, therefore, must be to enable access to housing finance by the low-income majority. Housing finance policies and practices must, however, be realistic about affordability. The profile shows that, at a HC:Y of three, households can afford between US$10,000 and $18,000 (GHC14-25,000) as a capital cost for their housing, either to own or to rent for market rents. Those in Accra and Kumasi would be at, or even slightly above, the upper end of the range while those in the smaller cities are likely to be at the lower end or below. Sufficient finance is required to enable about two million households (about 200,000 per annum) to construct 5.7 million new rooms between 2010 and 2020. This will require an annual capital total of between US$2 billion and $3.6 billion (GHC2.8 to 5 billion). In addition, an unknown amount will be needed for improving the existing stock but its scale must be determined by further study.
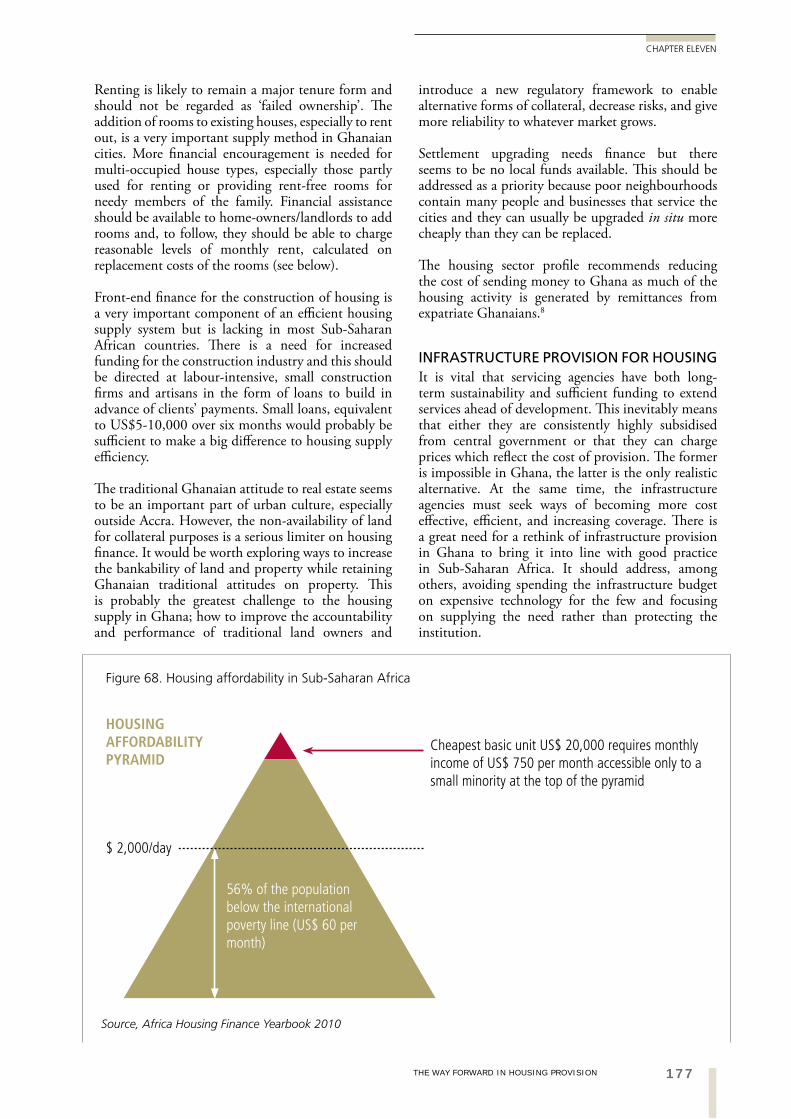
177
CHAPTER ELEVEN
THE WAY FORWARD IN HOUSING PROVISION
introduce a new regulatory framework to enable alternative forms of collateral, decrease risks, and give more reliability to whatever market grows.
Settlement upgrading needs finance but there seems to be no local funds available. This should be addressed as a priority because poor neighbourhoods contain many people and businesses that service the cities and they can usually be upgraded in situ more cheaply than they can be replaced.
The housing sector profile recommends reducing the cost of sending money to Ghana as much of the housing activity is generated by remittances from expatriate Ghanaians.8
INFRASTRUCTURE PROVISION FOR HOUSINGIt is vital that servicing agencies have both long-term sustainability and sufficient funding to extend services ahead of development. This inevitably means that either they are consistently highly subsidised from central government or that they can charge prices which reflect the cost of provision. The former is impossible in Ghana, the latter is the only realistic alternative. At the same time, the infrastructure agencies must seek ways of becoming more cost effective, efficient, and increasing coverage. There is a great need for a rethink of infrastructure provision in Ghana to bring it into line with good practice in Sub-Saharan Africa. It should address, among others, avoiding spending the infrastructure budget on expensive technology for the few and focusing on supplying the need rather than protecting the institution.
Renting is likely to remain a major tenure form and should not be regarded as ‘failed ownership’. The addition of rooms to existing houses, especially to rent out, is a very important supply method in Ghanaian cities. More financial encouragement is needed for multi-occupied house types, especially those partly used for renting or providing rent-free rooms for needy members of the family. Financial assistance should be available to home-owners/landlords to add rooms and, to follow, they should be able to charge reasonable levels of monthly rent, calculated on replacement costs of the rooms (see below).
Front-end finance for the construction of housing is a very important component of an efficient housing supply system but is lacking in most Sub-Saharan African countries. There is a need for increased funding for the construction industry and this should be directed at labour-intensive, small construction firms and artisans in the form of loans to build in advance of clients’ payments. Small loans, equivalent to US$5-10,000 over six months would probably be sufficient to make a big difference to housing supply efficiency.
The traditional Ghanaian attitude to real estate seems to be an important part of urban culture, especially outside Accra. However, the non-availability of land for collateral purposes is a serious limiter on housing finance. It would be worth exploring ways to increase the bankability of land and property while retaining Ghanaian traditional attitudes on property. This is probably the greatest challenge to the housing supply in Ghana; how to improve the accountability and performance of traditional land owners and
Cheapest basic unit US$ 20,000 requires monthly income of US$ 750 per month accessible only to a small minority at the top of the pyramid
56% of the population below the international poverty line (US$ 60 per month)
$ 2,000/day
HOUSING AFFORDABILITY PYRAMID
Figure 68. Housing affordability in Sub-Saharan Africa
Source, Africa Housing Finance Yearbook 2010
178
GHANA HOUSING PROFILE
capable of improving on, incrementally and over time as plots are occupied ever more intensively.
There is a need both to catch up on servicing many thousands of unserviced dwellings and to service 5.7 million new rooms. Quantities are huge. Just on the new developments, if all the rooms were provided in compounds, about 57,000 new plots must be serviced every year; if they were in separate dwellings, 201,000 new plots must be serviced every year.
Because of the sheer scale of the need, it will be more appropriate to provide the best service at an affordable price (say 10 per cent of dwelling cost for full servicing – US$1,000 – 3,000 each) rather than the best servicing to only the few who can afford it. This may require a palette of different means of delivery rather than extending the current technologies or systems of provision. Trunk infrastructure should be fitted on grids ahead of development and then neighbourhood services can be fitted after early development.
The existing institutions are inadequate to cope with full service provision at the speed and scale required. Efforts must be made to improve the capacity of the institutions to deliver services at an adequate level for all. This will be easier if they collaborate with each other (at city level), with neighbourhood leaders and with householders to supply services. To this end, there is a need to harmonise the legal frameworks which govern service provision.
THE RESIDENTIAL CONSTRUCTION INDUSTRY AND BUILDING MATERIALS, LABOUR AND EMPLOYMENTThe focus of the construction industry should be on improving employment and earnings for all levels of construction workers. In most of urban Ghana, housing is not expensive but few can afford to own it. Interventions should concentrate on improving the quality of existing dwellings, especially those in areas with slum conditions, and new dwellings costing US$10,000 – 18,000 or US$2,200 – 4,000 per room through improving the skills, materials supply, etc., needed for low cost housing. New households will generate demand for 570,000 new rooms per annum until 2020; rehabilitation and reconstruction will add more to these as there is a need to catch up on the large backlog of improvement and maintenance of existing housing stock.
As the informal sector is the main provider, interventions in construction, building materials and employment should be focused on improving the performance of informal sector contractors without reducing their productivity or competitiveness. The chief need seems to be for front-end construction finance to enable them to build ahead of payment and maximise their efficiency. Inevitably this will involve
Ways forward from this profile include, but are not limited to:
Focusing on providing the service at affordable cost to all rather than extending the current technology to a few.
Focusing on upgrading existing poorly-serviced high-density neighbourhoods.
Focusing resources on improving access to potable water.
Promoting affordable and appropriate sanitation systems, including on-site and composting.
Establishing means of funding solid-waste disposal and recycling systems.
Promoting environmentally-friendly infrastructure.
Collaborating with small-scale housing suppliers in making servicing easier to obtain and fit.
Involving chiefs and communities in infrastructure improvement planning, installation and operation but not relying on un-paid (community) work to implement this.
Working collaboratively across the different service providers.
Becoming pro-active in trunk servicing of new areas before development.
Allowing plot-level servicing after occupation.
Providing means for infrastructure provision in informal neighbourhoods.
Reviewing and enforcing affordable and incremental supply standards for each service.
Choosing appropriate technologies for the area rather than simply extending existing service technologies.
Few urban households can afford a self-contained dwelling on a fully serviced plot, but large numbers of households’ having to rely on public facilities is increasingly inappropriate in the twenty-first century. Infrastructure provision should aim, therefore, for a minimum of shared taps, bathrooms and toilets within houses rather than public sanitation and water supply. Incremental land development is undoubtedly the way forward. However, all new areas should be provided with minimal supply standards ahead of development, especially in sufficient access and water supply to allow construction. These should then be
179
CHAPTER ELEVEN
THE WAY FORWARD IN HOUSING PROVISION
Given that boosting affordable housing production and the use of local technology and materials is likely to generate employment and promote development, government should establish appropriate standards for, and encourage the production, use and acceptability of, locally produced earth-based building materials, including atakpamé and landcrete blocks. Such policy will deliver improvements in local practices, enhance quality and produce affordable building solutions.
Policy focuses should include:
Improve sustainability and efficiency of the local materials suppliers through assisting co-operatives, advice on quality, re-usable energy resources, marketing, etc., so that local materials could replace many imported ones. Interventions could include incentives to producers and retailers to improve efficiency and reduce production costs.
Institute the local manufacture of machinery for the production of local building materials since imported machinery is very expensive.
Continue to support the CSRI, BRRI, KNUST and other construction and building materials research institutions and make better used of their already published work on materials improvements.
Develop better dissemination for existing research and development findings. Information on the construction and local building materials should be spread through television, radio and print media. Households’ willingness to use local building materials could be improved through information centres in the regions where samples of materials are available to the public
The supply of housing needed to fulfil the large numbers of new rooms required, in whatever built form, and all their accompanying infrastructure represents a major development potential for urban Ghana. Increasing employment through housing supply could be a key development strategy. The supply of so many new dwellings will create huge demand for building workers; there is likely to be somewhere between 76,000 and 101,000 new jobs in construction as a result of the supply of housing required (chapter 9). That will also have considerable knock-on effects for training. Training in construction and building materials manufacture should focus on the need for low-cost dwellings using labour-intensive, local materials-based technologies. This should be approached in a number of ways including:
Promote training and vocational programmes linked to business development and support programmes.
(micro-) finance for small construction firms and those in sustainable building materials production.
Means of assisting informal sector contractors should aim at the medium-term and long-term formalisation of their technical and economic activity, and should include but not be limited to:
Modifying the tendering procedures for government contracts to include more informal contractors.
Lowering the threshold of legality for firms so that more workers are protected by ‘decent work’ regulations as stipulated by the ILO. These recommend starting with safety at work and adequate wages and then proceeding onto paid holidays, pensions and union rights, etc., incrementally over time.
Providing access to training, development of qualifications, and continual professional development opportunities to small-scale contractors.
Creating conditions with support from government and the construction industry – via their institutions - for the establishment of institutionalised training, skills development and institutional capacity-building aimed at strengthening small-scale enterprises;
Improving collaboration between formal and informal systems of training and recruitment of labour and contractors.
Given that boosting affordable housing production and the use of local technology and materials is likely to generate employment and promote development, government should encourage the production, use and acceptability of locally produced materials such as earth-based building materials, including atakpamé and landcrete blocks. Such policy will deliver improvements in local practices, enhance quality and produce affordable building solutions.
The encouragement of local materials should include the following:
Use local earth-based building materials in well-publicised government building projects.
Encourage the manufacture of earth-based traditional building materials.
Develop appropriate building regulations and standards for the socio-economic conditions of urban Ghana.
180
GHANA HOUSING PROFILE
efficient development of commercial areas and to safeguard the needs and interests of the majority poor. This may include setting limitations to customary owners with likely political implications.
In the rental market, however, the enforcement of the law on no more than one years’ rent in advance is likely to be impossible unless there is reform in rent levels to increase their value to the house-owner so that they represent a reasonable proportion of household expenditure. They should pay back the cost of financing and building the rooms occupied in between 10 and 12 years. Thus, an unserviced 12 square metres single room in atakpamé, costing GHC1,800 to build and 30 per cent per annum to finance, should raise a rent of GHC25 per month. One in sandcrete with servicing, costing GHC400 per square metre plus 10 per cent for services, and 30 per cent for financing, should cost GHC58 per month; all net of land cost.
11.2 INCREASING INCOMES FOR IMPROVED AFFORDABILITY
Housing affordability in Ghana is largely an issue of low incomes. Most urban land, building materials, labour rates and construction tasks are relatively cheap in international terms, so the potential for reducing costs is very small. The main problem is that wages and incomes from business are very low and, even by having multiple income streams,10 the majority of urban Ghanaians struggle to make ends meet let alone live in adequate housing.
The good news is, however, in a low-wage society, building housing is one of the most developmentally helpful activities; far ahead of other industries, mining or farming.11 Construction can contribute more jobs per dollar invested than any other comparable activity, in all three of direct activity, income multipliers resulting from building workers’ expenditure patterns, and the backward and forward linkages arising from house-building.
The maximum economic benefit from housing construction comes from the low-cost end of the market which is dominated by small-scale, low-technology contractors who employ local people to use local technologies with very little imported material. Conversely, the top end of the market uses skilled craftsmen, imported machinery, fuel and materials, and energy-rich manufactured materials. These generate considerably reduced benefits to the economy but improve the living conditions of those who can afford them.
As the employment generation aspect of low-cost house-building can achieve a great deal in and of
Increase the supply of trained artisans through on-the-job training in apprenticeships linked to formal college courses through day release, etc.
Increase training in construction supervision skills.
In order to safeguard and improve standards, the supervisory role of building inspectors should be strengthened. MMDAs should compile a list of professionals who could inspect and certify buildings while sufficient building inspectors are trained. In parallel, consumer protection measures should be introduced.
THE HOUSING MARKETThe housing market in Ghana is rapidly developing with a noticeable increase in transactions when compared to a decade or two ago. The market is still very small, however, and concentrated mainly at the top end. Ghana is still a long way from having an active secondary market involving trading in housing already lived in. The home-ownership market is mainly operating as sales and purchases of new properties through GREDA members and their customers. As Ghana’s economy becomes more globalised, one might expect gradual changes in the market with direct impacts on housing consumers’ and producers’ behaviour down the social-economic range, despite deeply-rooted local cultural norms that traditionally inhibit housing sales.
The parallel market in rental accommodation is highly distorted as a result of several decades of rent control during the latter half of the twentieth century. This gave rise to a mix of low monthly rents9 and very large advance payments (usually three years’ worth of rent). Thus, for many, rent is now paid triennially in lump sums that must be borrowed.
In both ownership and rental sectors, therefore, urban Ghana is very far from a perfect market. The way forward for buying and selling housing will probably be decided by the market without any intervention. The current small and rather international market at the top end of the property profile is likely to continue growing and generating demand for special conditions such as gated communities, international standards in fixtures and fittings, sales in foreign currencies, and full servicing before occupation. It is likely, however, to remain relatively small as a proportion of the whole stock, especially if the emphasis of government’s attention is given to providing for the low-income majority instead of continuing to subsidise GREDA members’ activities. The remaining low-income housing stock is likely to become family housing on the death of the first owner. There may be locations in which interventions to alter this are necessary, for example to assist the
181
CHAPTER ELEVEN
THE WAY FORWARD IN HOUSING PROVISION
in Ghana. Great benefits will arise from solving the conundrum of how to improve the accountability and performance of traditional land owners and introduce a new regulatory framework to enable alternative forms of collateral, decrease risks, and give more reliability to whatever market grows. Furthermore, steps are required to reduce the threshold cost of land for low-income housing. This may be done through the ability to buy the use of smaller plots at lower prices than are currently available but a link between plot size and price is unusual in customary practice and may not be accepted in the near future. Alternatively, multi-occupied housing can provide the necessary reduction in land cost per household.
Housing finance needs focus on sums which are too small for mortgages but too large for standard micro-finance. Finance to enable the construction of housing costing between US$10,000 and US$18,000 require new approaches to housing finance, especially when households are loath to borrow, and finance houses to lend, against collateral in the form of land or other housing. There are currently no models in Ghana offering a ready way forward but the solution of this issue is likely to be key to successful housing supply. Front-end finance should be available to contractors to increase their efficiency.
The servicing agencies need both long-term sustainability and sufficient funding to extend services ahead of development. They cannot consistently be highly subsidised from central government so they must be allowed to charge prices which reflect the cost of provision. As a quid pro quo, the infrastructure agencies must seek ways of becoming more cost effective, efficient, and increasing coverage, even ahead of demand. The infrastructure provision in Ghana should be brought into line with good practice in Sub-Saharan Africa, especially with respect to public toilets. Infrastructure companies should particularly avoid spending their budgets on expensive technology for the few and focus on supplying the need rather than protecting the institution.
Few urban households can afford a self-contained dwelling on a fully serviced plot. Large numbers rely on public facilities and this is inappropriate in the twenty-first century. Infrastructure provision should aim, therefore, for a minimum of shared taps, bathrooms and toilets within houses rather than public sanitation and water supply.
Most urban land, building materials, labour rates and construction tasks are relatively cheap in international terms, so the potential for reducing costs is very small. The main problem is that wages and incomes from business are very low and, even by having multiple income streams, the majority of urban Ghanaians struggle to make ends meet let alone live in adequate housing.
itself to raise incomes among the lower-paid workers in Ghanaian cities, government should be doubly willing to concentrate their incentives upon informal sector, small-scale contractors building simple, low-cost housing in local materials. Training allows a way up through the earnings ladder and prevents workers’ being trapped in low pay. Similarly, assistance with front-end finance can encourage small firms to grow and prosper, becoming more effective providers on the way. Both of these must be integral parts of the policy package to ensure fair chances for all.
11.3 REDUCING THE COST OF BUILDING
As argued above, there is a lower limit to the cost of housing and many Ghanaian urban buildings must be very close to it. There is still, however, a preoccupation to reduce prices still further, even while adopting high standards and making the use of cheap local materials difficult in the formal sector.
There is already a large legacy of building materials and technology research built up by BRRI and the universities in Ghana. These should be exploited in local construction.
The National Housing Policy focuses on encouraging alternative materials in general to reduce the cost of housing. There are great potential benefits to be gained from using local alternatives to imported materials and removing the colonial legacy in the Building Regulations. The tax holidays received by GREDA members should be tied into the use of local materials and housing that is really affordable.
11.4 CONCLUSIONS
The way forward involves major changes in the way housing is provided; a paradigm shift from ensuring that a few very well-constructed and serviced dwellings are provided to ensuring that enough housing is built for everyone at a price that they can afford. The main characteristics of the current housing stock include shortage and crowding. Both of these are only capable of remedy if adequate housing becomes the main emphasis, especially adequate in numbers. Housing plans should begin here and adapt the institutional framework to enable adequate provision for the ordinary Ghanaian household. This certainly means shifting the emphasis from finding a future for current housing supply institutions to installing processes which ensure large quantities of housing at appropriate prices and sustainable densities, chiefly to the benefit of the majority of households who live in poverty.
Increasing the bankability of land and property while retaining Ghanaian traditional attitudes on property is probably the greatest challenge to the housing supply
182
GHANA HOUSING PROFILE
The Urban Housing Sector Profile has shown that formal housing supply institutions and mechanisms in Ghana are currently not capable of providing more than a tiny portion of the needed increases in stock. The informal sector copes better, and is more appropriate for the majority, but does not supply housing at the pace required both to catch-up with the backlog and provide the unprecedented amounts of urban housing likely to be required in the next ten years. The Profile provides some ways forward that would impose a reality check on the systems and point them in the right direction to increase the supply at the cost and scale required while providing much-needed developmental benefits.
There is likely to be an issue of maintaining these relatively low costs when the demand for materials and labour increase exponentially under any realistic process of building sufficient housing in Ghanaian cities; at a rate of four times that which is estimated between 2000 and 2010. Conversely, the employment generated will put large amounts of money into the local economy in a way which is very enriching for the poor and for the country’s development. The supply of urban housing needed to fulfil the large numbers of new rooms required, and all its accompanying infrastructure, thus represents both a major challenge and a great development opportunity for Ghana. Increasing employment through housing supply could be a pivotal development strategy, particularly as housing affordability in Ghana is largely an issue of low incomes.
SECTION ENDNOTES
1 Government of Ghana (2010).2 This assumes that they are occupied at the occupancy rate stipulated rather than as a single household
dwelling. 3 Government of Ghana (2010).4 The housing sector profile assumes the 10 per hectare is meant to be for plots, i.e., houses, rather than
dwellings, which would include single rooms. This is an example of the ambiguity of definition within Ghana’s housing policy documents which is so damaging to clear policy-making. See Amole et al (1993) for a fuller discussion of this issue.
5 Government of Ghana (2010).6 Obeng-Odoom (2009b).7 UN-HABITAT’s initiative, the Experimental Reimbursable Seeding Operations (ERSO), is an effort to
provide seed capital, financial mechanisms such as credit enhancements, and technical assistance in a single package. ERSO operates on a two-tier approach – top-down and bottom-out. The top-down approach attempts to encourage and enable local banks and other financial institutions to extend their financing down the market. The bottom-out approach encourages and enables microfinance institutions (MFIs) to extend their existing credit to businesses out into housing and infrastructure.
8 Following on from Diko and Tipple (1992) and Obeng-Odoom (2009b). Recent experience in sending money to a Ghanaian forex account through Barclays Banks’ internal system showed that charges were being levied on a transfer’s recipient in Accra that were more than five times what was stipulated as the destination charge at the UK end of the transaction.
9 Low in comparison with household expenditure and very low in comparison to the cost of building the rooms occupied by the renter.
10 Notably including “The Grace of God” which covers a multitude of small income-earning opportunities and the repayment of money and favours owed.
11 Tibaijuka (2009); UNCHS/ILO (1995).
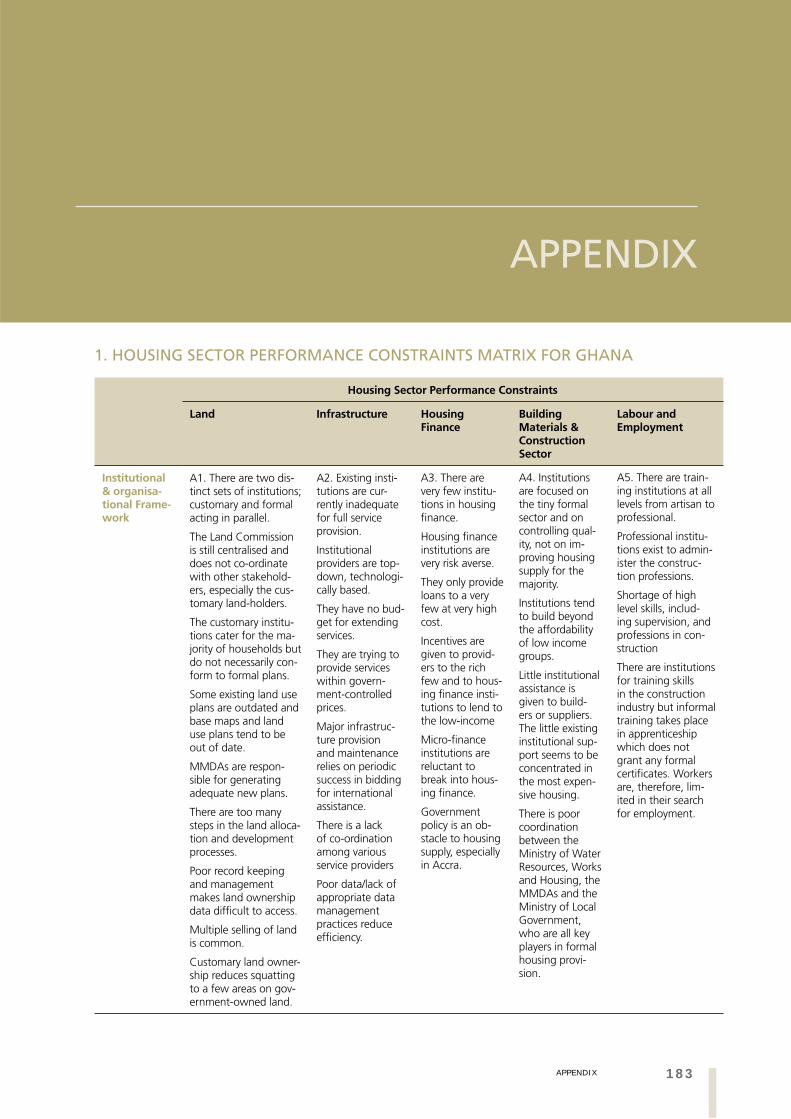
183
APPENDIX
APPENDIX
APPENDIX
1. HOUSING SECTOR PERFORMANCE CONSTRAINTS MATRIX FOR GHANA
Housing Sector Performance Constraints
Land Infrastructure Housing Finance
Building Materials & Construction Sector
Labour and Employment
Institutional & organisa-tional Frame-work
A1. There are two dis-tinct sets of institutions; customary and formal acting in parallel.
The Land Commission is still centralised and does not co-ordinate with other stakehold-ers, especially the cus-tomary land-holders.
The customary institu-tions cater for the ma-jority of households but do not necessarily con-form to formal plans.
Some existing land use plans are outdated and base maps and land use plans tend to be out of date.
MMDAs are respon-sible for generating adequate new plans.
There are too many steps in the land alloca-tion and development processes.
Poor record keeping and management makes land ownership data difficult to access.
Multiple selling of land is common.
Customary land owner-ship reduces squatting to a few areas on gov-ernment-owned land.
A2. Existing insti-tutions are cur-rently inadequate for full service provision.
Institutional providers are top-down, technologi-cally based.
They have no bud-get for extending services.
They are trying to provide services within govern-ment-controlled prices.
Major infrastruc-ture provision and maintenance relies on periodic success in bidding for international assistance.
There is a lack of co-ordination among various service providers
Poor data/lack of appropriate data management practices reduce efficiency.
A3. There are very few institu-tions in housing finance.
Housing finance institutions are very risk averse.
They only provide loans to a very few at very high cost.
Incentives are given to provid-ers to the rich few and to hous-ing finance insti-tutions to lend to the low-income
Micro-finance institutions are reluctant to break into hous-ing finance.
Government policy is an ob-stacle to housing supply, especially in Accra.
A4. Institutions are focused on the tiny formal sector and on controlling qual-ity, not on im-proving housing supply for the majority.
Institutions tend to build beyond the affordability of low income groups.
Little institutional assistance is given to build-ers or suppliers. The little existing institutional sup-port seems to be concentrated in the most expen-sive housing.
There is poor coordination between the Ministry of Water Resources, Works and Housing, the MMDAs and the Ministry of Local Government, who are all key players in formal housing provi-sion.
A5. There are train-ing institutions at all levels from artisan to professional.
Professional institu-tions exist to admin-ister the construc-tion professions.
Shortage of high level skills, includ-ing supervision, and professions in con-struction
There are institutions for training skills in the construction industry but informal training takes place in apprenticeship which does not grant any formal certificates. Workers are, therefore, lim-ited in their search for employment.
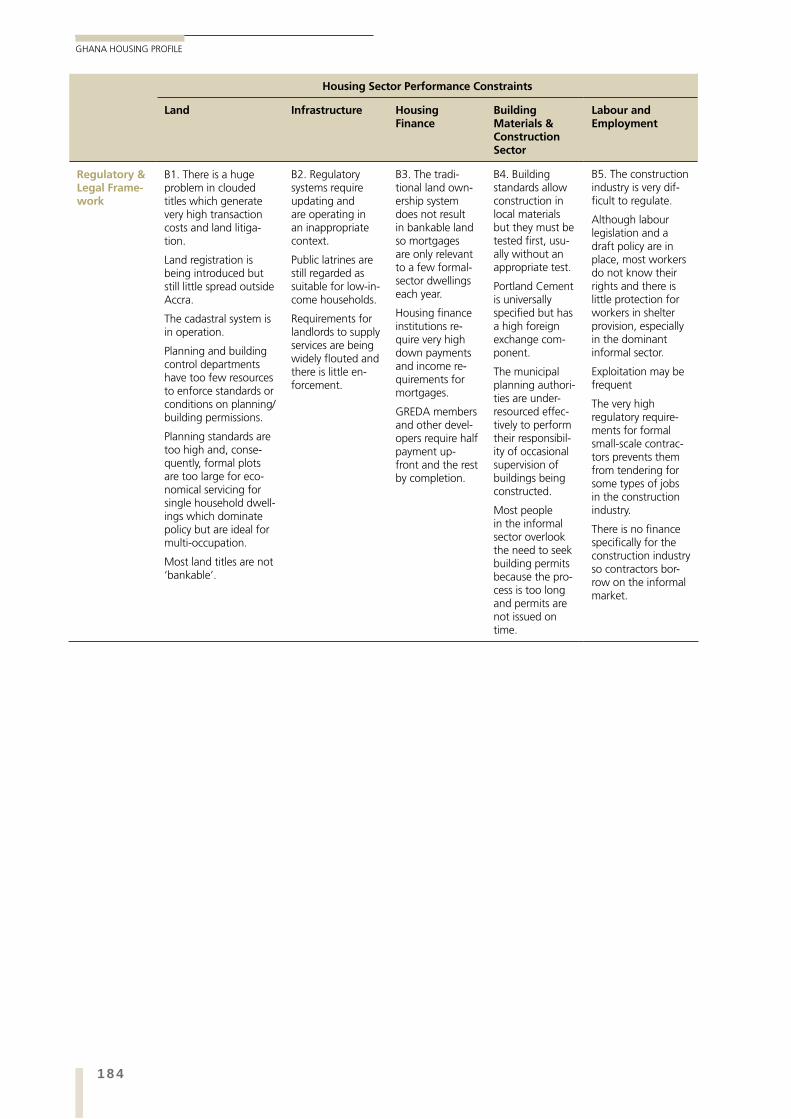
184
GHANA HOUSING PROFILE
Housing Sector Performance Constraints
Land Infrastructure Housing Finance
Building Materials & Construction Sector
Labour and Employment
Regulatory & Legal Frame-work
B1. There is a huge problem in clouded titles which generate very high transaction costs and land litiga-tion.
Land registration is being introduced but still little spread outside Accra.
The cadastral system is in operation.
Planning and building control departments have too few resources to enforce standards or conditions on planning/ building permissions.
Planning standards are too high and, conse-quently, formal plots are too large for eco-nomical servicing for single household dwell-ings which dominate policy but are ideal for multi-occupation.
Most land titles are not ‘bankable’.
B2. Regulatory systems require updating and are operating in an inappropriate context.
Public latrines are still regarded as suitable for low-in-come households.
Requirements for landlords to supply services are being widely flouted and there is little en-forcement.
B3. The tradi-tional land own-ership system does not result in bankable land so mortgages are only relevant to a few formal-sector dwellings each year.
Housing finance institutions re-quire very high down payments and income re-quirements for mortgages.
GREDA members and other devel-opers require half payment up-front and the rest by completion.
B4. Building standards allow construction in local materials but they must be tested first, usu-ally without an appropriate test.
Portland Cement is universally specified but has a high foreign exchange com-ponent.
The municipal planning authori-ties are under-resourced effec-tively to perform their responsibil-ity of occasional supervision of buildings being constructed.
Most people in the informal sector overlook the need to seek building permits because the pro-cess is too long and permits are not issued on time.
B5. The construction industry is very dif-ficult to regulate.
Although labour legislation and a draft policy are in place, most workers do not know their rights and there is little protection for workers in shelter provision, especially in the dominant informal sector.
Exploitation may be frequent
The very high regulatory require-ments for formal small-scale contrac-tors prevents them from tendering for some types of jobs in the construction industry.
There is no finance specifically for the construction industry so contractors bor-row on the informal market.
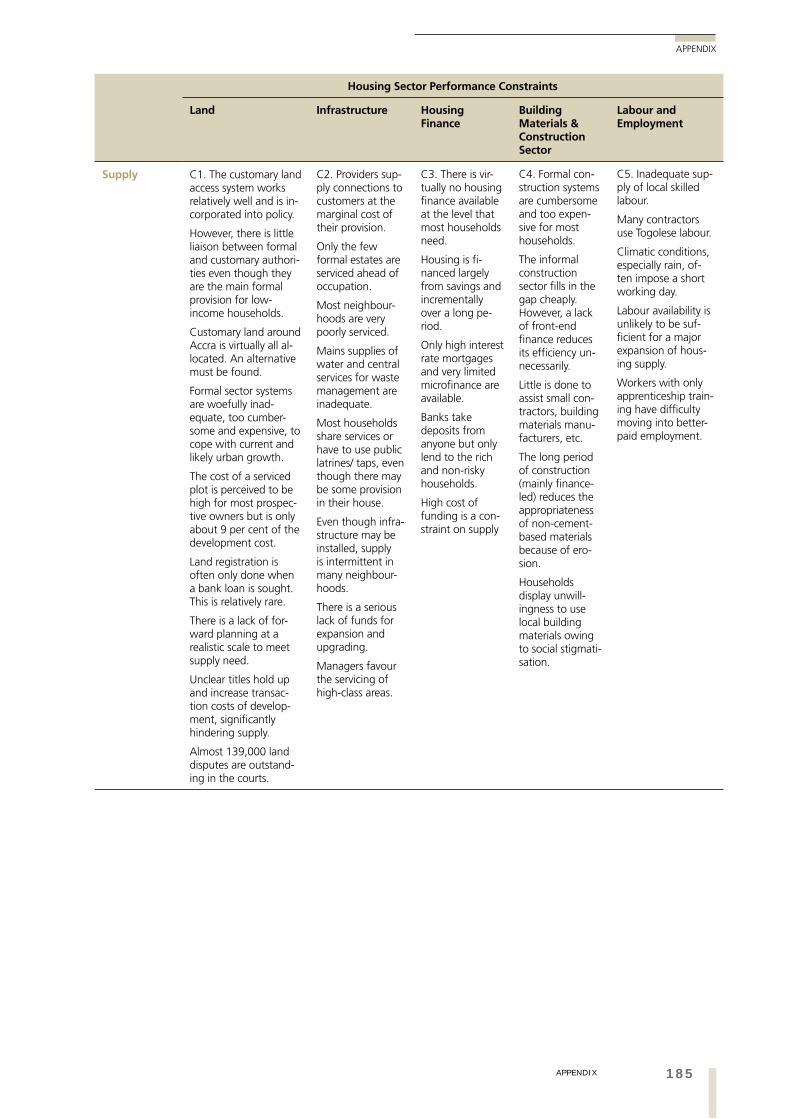
185
APPENDIX
APPENDIX
Housing Sector Performance Constraints
Land Infrastructure Housing Finance
Building Materials & Construction Sector
Labour and Employment
Supply C1. The customary land access system works relatively well and is in-corporated into policy.
However, there is little liaison between formal and customary authori-ties even though they are the main formal provision for low-income households.
Customary land around Accra is virtually all al-located. An alternative must be found.
Formal sector systems are woefully inad-equate, too cumber-some and expensive, to cope with current and likely urban growth.
The cost of a serviced plot is perceived to be high for most prospec-tive owners but is only about 9 per cent of the development cost.
Land registration is often only done when a bank loan is sought. This is relatively rare.
There is a lack of for-ward planning at a realistic scale to meet supply need.
Unclear titles hold up and increase transac-tion costs of develop-ment, significantly hindering supply.
Almost 139,000 land disputes are outstand-ing in the courts.
C2. Providers sup-ply connections to customers at the marginal cost of their provision.
Only the few formal estates are serviced ahead of occupation.
Most neighbour-hoods are very poorly serviced.
Mains supplies of water and central services for waste management are inadequate.
Most households share services or have to use public latrines/ taps, even though there may be some provision in their house.
Even though infra-structure may be installed, supply is intermittent in many neighbour-hoods.
There is a serious lack of funds for expansion and upgrading.
Managers favour the servicing of high-class areas.
C3. There is vir-tually no housing finance available at the level that most households need.
Housing is fi-nanced largely from savings and incrementally over a long pe-riod.
Only high interest rate mortgages and very limited microfinance are available.
Banks take deposits from anyone but only lend to the rich and non-risky households.
High cost of funding is a con-straint on supply
C4. Formal con-struction systems are cumbersome and too expen-sive for most households.
The informal construction sector fills in the gap cheaply. However, a lack of front-end finance reduces its efficiency un-necessarily.
Little is done to assist small con-tractors, building materials manu-facturers, etc.
The long period of construction (mainly finance-led) reduces the appropriateness of non-cement-based materials because of ero-sion.
Households display unwill-ingness to use local building materials owing to social stigmati-sation.
C5. Inadequate sup-ply of local skilled labour.
Many contractors use Togolese labour.
Climatic conditions, especially rain, of-ten impose a short working day.
Labour availability is unlikely to be suf-ficient for a major expansion of hous-ing supply.
Workers with only apprenticeship train-ing have difficulty moving into better-paid employment.
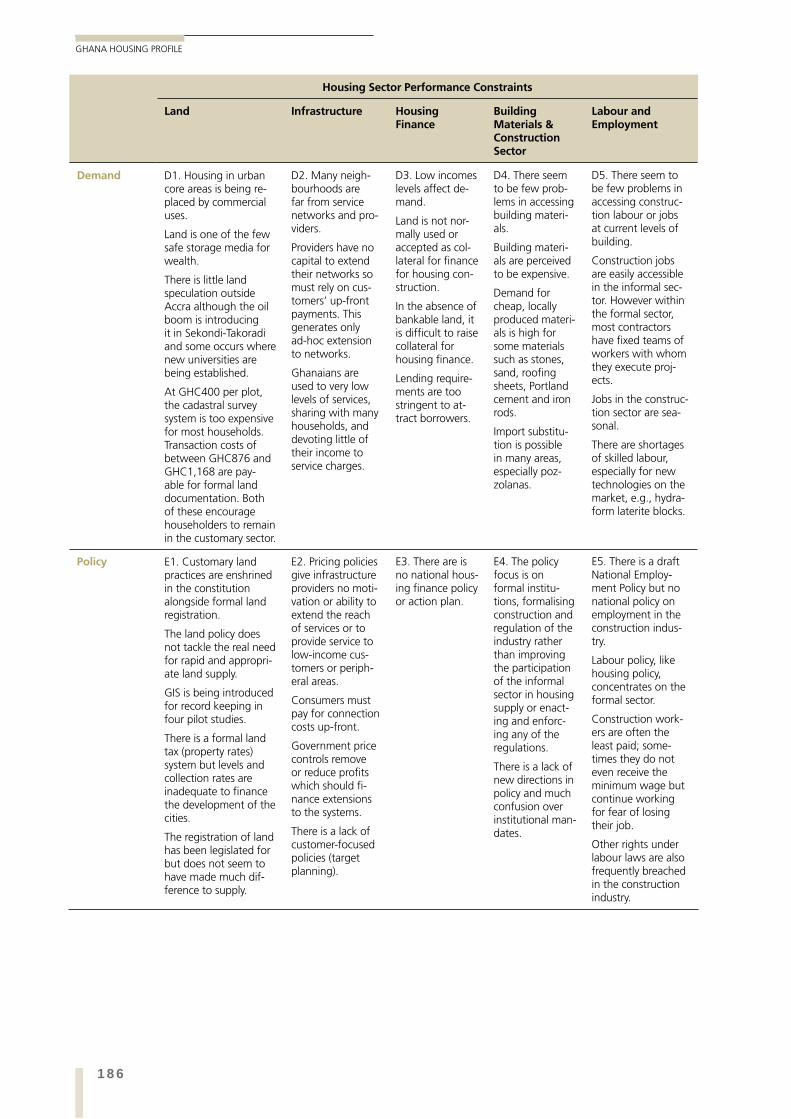
186
GHANA HOUSING PROFILE
Housing Sector Performance Constraints
Land Infrastructure Housing Finance
Building Materials & Construction Sector
Labour and Employment
Demand D1. Housing in urban core areas is being re-placed by commercial uses.
Land is one of the few safe storage media for wealth.
There is little land speculation outside Accra although the oil boom is introducing it in Sekondi-Takoradi and some occurs where new universities are being established.
At GHC400 per plot, the cadastral survey system is too expensive for most households. Transaction costs of between GHC876 and GHC1,168 are pay-able for formal land documentation. Both of these encourage householders to remain in the customary sector.
D2. Many neigh-bourhoods are far from service networks and pro-viders.
Providers have no capital to extend their networks so must rely on cus-tomers’ up-front payments. This generates only ad-hoc extension to networks.
Ghanaians are used to very low levels of services, sharing with many households, and devoting little of their income to service charges.
D3. Low incomes levels affect de-mand.
Land is not nor-mally used or accepted as col-lateral for finance for housing con-struction.
In the absence of bankable land, it is difficult to raise collateral for housing finance.
Lending require-ments are too stringent to at-tract borrowers.
D4. There seem to be few prob-lems in accessing building materi-als.
Building materi-als are perceived to be expensive.
Demand for cheap, locally produced materi-als is high for some materials such as stones, sand, roofing sheets, Portland cement and iron rods.
Import substitu-tion is possible in many areas, especially poz-zolanas.
D5. There seem to be few problems in accessing construc-tion labour or jobs at current levels of building.
Construction jobs are easily accessible in the informal sec-tor. However within the formal sector, most contractors have fixed teams of workers with whom they execute proj-ects.
Jobs in the construc-tion sector are sea-sonal.
There are shortages of skilled labour, especially for new technologies on the market, e.g., hydra-form laterite blocks.
Policy E1. Customary land practices are enshrined in the constitution alongside formal land registration.
The land policy does not tackle the real need for rapid and appropri-ate land supply.
GIS is being introduced for record keeping in four pilot studies.
There is a formal land tax (property rates) system but levels and collection rates are inadequate to finance the development of the cities.
The registration of land has been legislated for but does not seem to have made much dif-ference to supply.
E2. Pricing policies give infrastructure providers no moti-vation or ability to extend the reach of services or to provide service to low-income cus-tomers or periph-eral areas.
Consumers must pay for connection costs up-front.
Government price controls remove or reduce profits which should fi-nance extensions to the systems.
There is a lack of customer-focused policies (target planning).
E3. There are is no national hous-ing finance policy or action plan.
E4. The policy focus is on formal institu-tions, formalising construction and regulation of the industry rather than improving the participation of the informal sector in housing supply or enact-ing and enforc-ing any of the regulations.
There is a lack of new directions in policy and much confusion over institutional man-dates.
E5. There is a draft National Employ-ment Policy but no national policy on employment in the construction indus-try.
Labour policy, like housing policy, concentrates on the formal sector.
Construction work-ers are often the least paid; some-times they do not even receive the minimum wage but continue working for fear of losing their job.
Other rights under labour laws are also frequently breached in the construction industry.
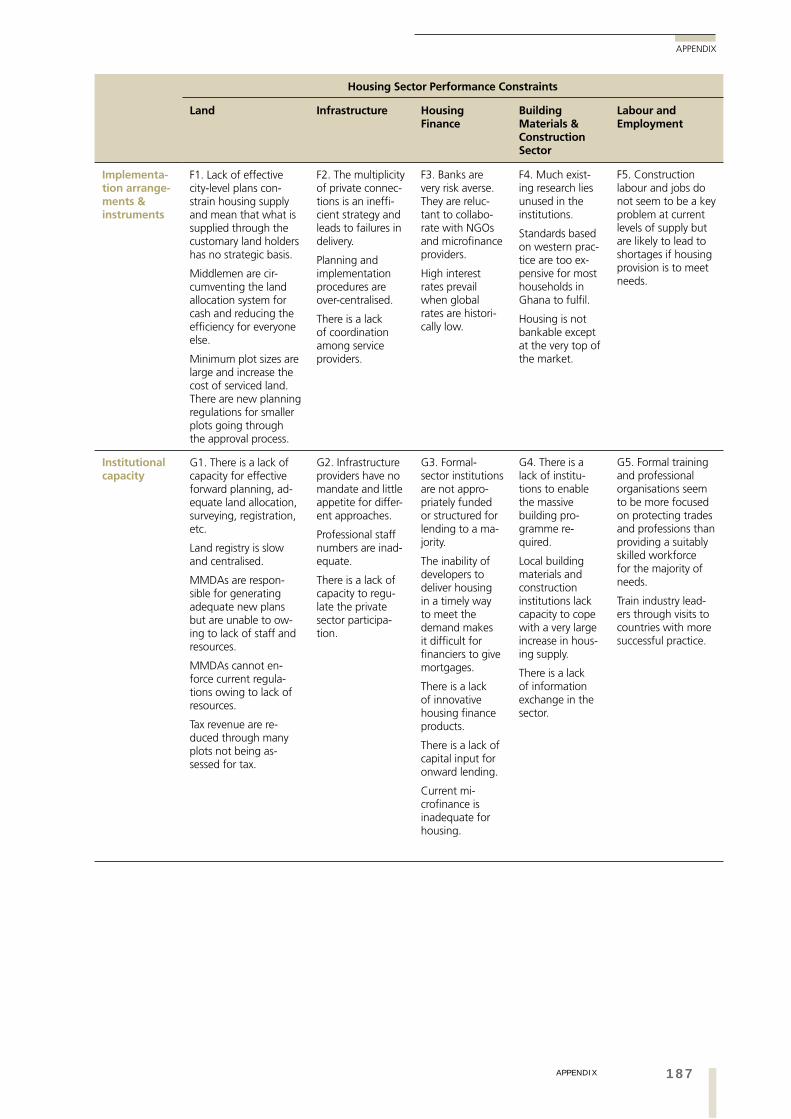
187
APPENDIX
APPENDIX
Housing Sector Performance Constraints
Land Infrastructure Housing Finance
Building Materials & Construction Sector
Labour and Employment
Implementa-tion arrange-ments & instruments
F1. Lack of effective city-level plans con-strain housing supply and mean that what is supplied through the customary land holders has no strategic basis.
Middlemen are cir-cumventing the land allocation system for cash and reducing the efficiency for everyone else.
Minimum plot sizes are large and increase the cost of serviced land. There are new planning regulations for smaller plots going through the approval process.
F2. The multiplicity of private connec-tions is an ineffi-cient strategy and leads to failures in delivery.
Planning and implementation procedures are over-centralised.
There is a lack of coordination among service providers.
F3. Banks are very risk averse. They are reluc-tant to collabo-rate with NGOs and microfinance providers.
High interest rates prevail when global rates are histori-cally low.
F4. Much exist-ing research lies unused in the institutions.
Standards based on western prac-tice are too ex-pensive for most households in Ghana to fulfil.
Housing is not bankable except at the very top of the market.
F5. Construction labour and jobs do not seem to be a key problem at current levels of supply but are likely to lead to shortages if housing provision is to meet needs.
Institutional capacity
G1. There is a lack of capacity for effective forward planning, ad-equate land allocation, surveying, registration, etc.
Land registry is slow and centralised.
MMDAs are respon-sible for generating adequate new plans but are unable to ow-ing to lack of staff and resources.
MMDAs cannot en-force current regula-tions owing to lack of resources.
Tax revenue are re-duced through many plots not being as-sessed for tax.
G2. Infrastructure providers have no mandate and little appetite for differ-ent approaches.
Professional staff numbers are inad-equate.
There is a lack of capacity to regu-late the private sector participa-tion.
G3. Formal-sector institutions are not appro-priately funded or structured for lending to a ma-jority.
The inability of developers to deliver housing in a timely way to meet the demand makes it difficult for financiers to give mortgages.
There is a lack of innovative housing finance products.
There is a lack of capital input for onward lending.
Current mi-crofinance is inadequate for housing.
G4. There is a lack of institu-tions to enable the massive building pro-gramme re-quired.
Local building materials and construction institutions lack capacity to cope with a very large increase in hous-ing supply.
There is a lack of information exchange in the sector.
G5. Formal training and professional organisations seem to be more focused on protecting trades and professions than providing a suitably skilled workforce for the majority of needs.
Train industry lead-ers through visits to countries with more successful practice.
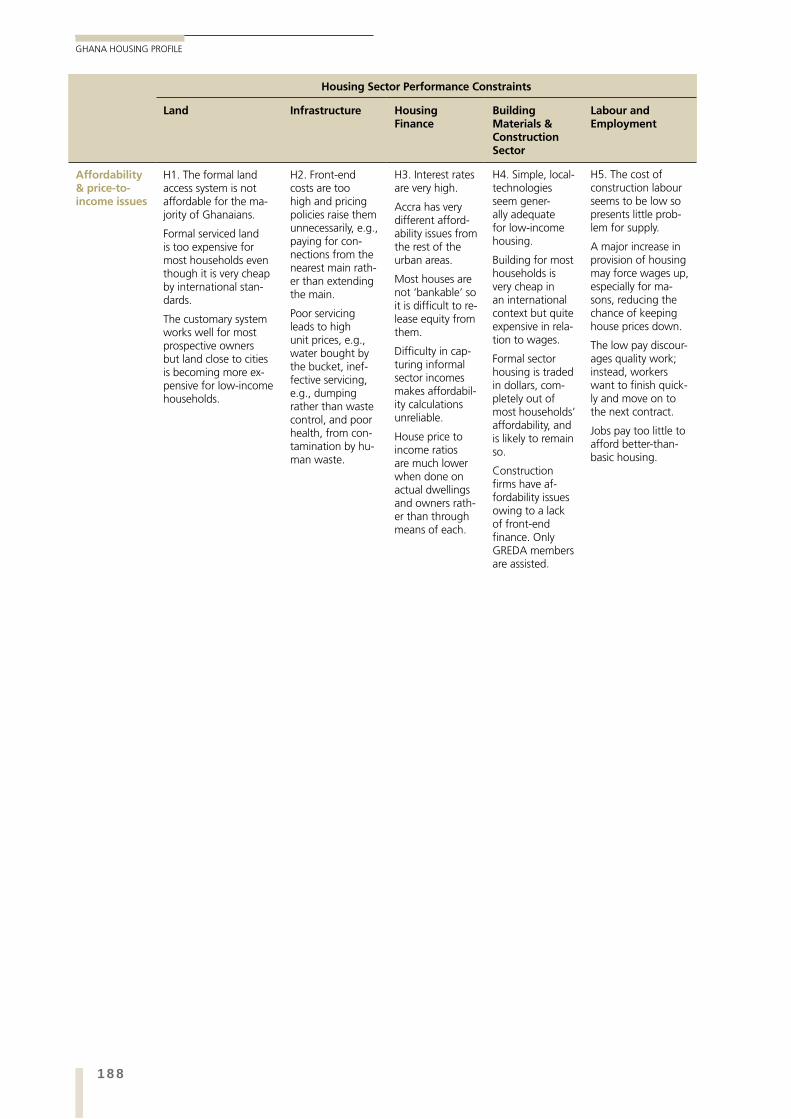
188
GHANA HOUSING PROFILE
Housing Sector Performance Constraints
Land Infrastructure Housing Finance
Building Materials & Construction Sector
Labour and Employment
Affordability & price-to-income issues
H1. The formal land access system is not affordable for the ma-jority of Ghanaians.
Formal serviced land is too expensive for most households even though it is very cheap by international stan-dards.
The customary system works well for most prospective owners but land close to cities is becoming more ex-pensive for low-income households.
H2. Front-end costs are too high and pricing policies raise them unnecessarily, e.g., paying for con-nections from the nearest main rath-er than extending the main.
Poor servicing leads to high unit prices, e.g., water bought by the bucket, inef-fective servicing, e.g., dumping rather than waste control, and poor health, from con-tamination by hu-man waste.
H3. Interest rates are very high.
Accra has very different afford-ability issues from the rest of the urban areas.
Most houses are not ‘bankable’ so it is difficult to re-lease equity from them.
Difficulty in cap-turing informal sector incomes makes affordabil-ity calculations unreliable.
House price to income ratios are much lower when done on actual dwellings and owners rath-er than through means of each.
H4. Simple, local-technologies seem gener-ally adequate for low-income housing.
Building for most households is very cheap in an international context but quite expensive in rela-tion to wages.
Formal sector housing is traded in dollars, com-pletely out of most households’ affordability, and is likely to remain so.
Construction firms have af-fordability issues owing to a lack of front-end finance. Only GREDA members are assisted.
H5. The cost of construction labour seems to be low so presents little prob-lem for supply.
A major increase in provision of housing may force wages up, especially for ma-sons, reducing the chance of keeping house prices down.
The low pay discour-ages quality work; instead, workers want to finish quick-ly and move on to the next contract.
Jobs pay too little to afford better-than-basic housing.
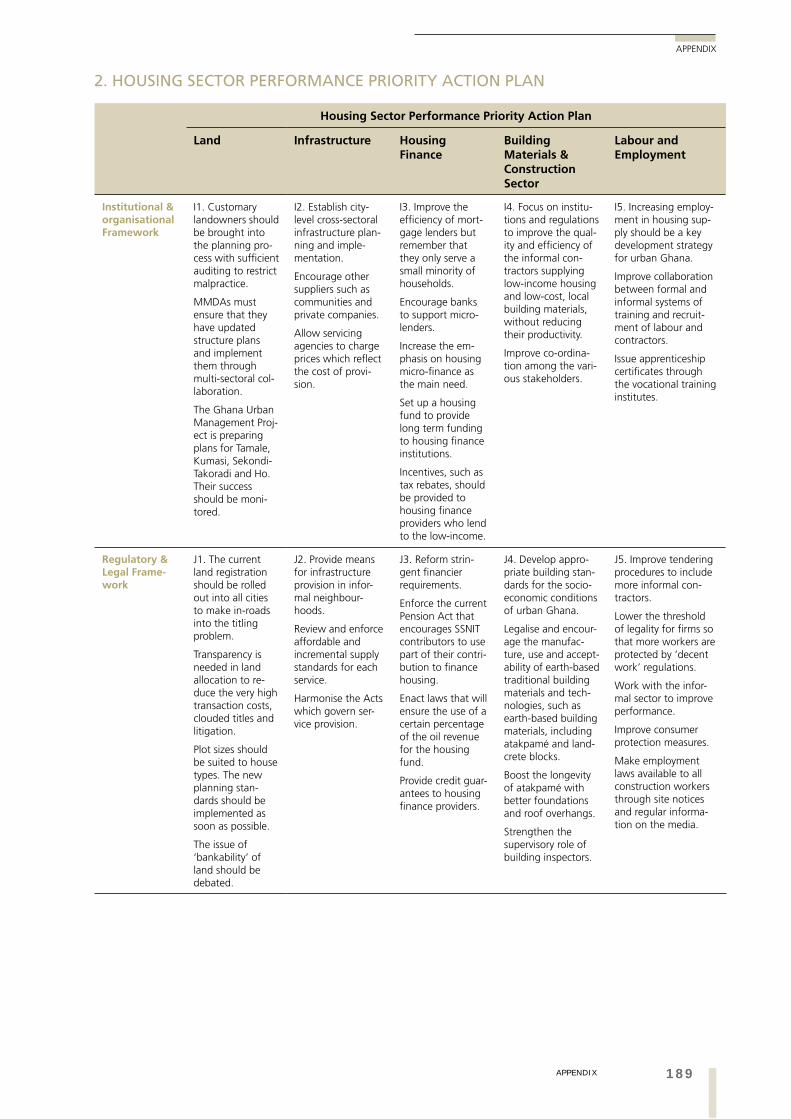
189
APPENDIX
APPENDIX
2. HOUSING SECTOR PERFORMANCE PRIORITY ACTION PLAN
Housing Sector Performance Priority Action Plan
Land Infrastructure Housing Finance
Building Materials & Construction Sector
Labour and Employment
Institutional & organisational Framework
I1. Customary landowners should be brought into the planning pro-cess with sufficient auditing to restrict malpractice.
MMDAs must ensure that they have updated structure plans and implement them through multi-sectoral col-laboration.
The Ghana Urban Management Proj-ect is preparing plans for Tamale, Kumasi, Sekondi-Takoradi and Ho. Their success should be moni-tored.
I2. Establish city-level cross-sectoral infrastructure plan-ning and imple-mentation.
Encourage other suppliers such as communities and private companies.
Allow servicing agencies to charge prices which reflect the cost of provi-sion.
I3. Improve the efficiency of mort-gage lenders but remember that they only serve a small minority of households.
Encourage banks to support micro-lenders.
Increase the em-phasis on housing micro-finance as the main need.
Set up a housing fund to provide long term funding to housing finance institutions.
Incentives, such as tax rebates, should be provided to housing finance providers who lend to the low-income.
I4. Focus on institu-tions and regulations to improve the qual-ity and efficiency of the informal con-tractors supplying low-income housing and low-cost, local building materials, without reducing their productivity.
Improve co-ordina-tion among the vari-ous stakeholders.
I5. Increasing employ-ment in housing sup-ply should be a key development strategy for urban Ghana.
Improve collaboration between formal and informal systems of training and recruit-ment of labour and contractors.
Issue apprenticeship certificates through the vocational training institutes.
Regulatory & Legal Frame-work
J1. The current land registration should be rolled out into all cities to make in-roads into the titling problem.
Transparency is needed in land allocation to re-duce the very high transaction costs, clouded titles and litigation.
Plot sizes should be suited to house types. The new planning stan-dards should be implemented as soon as possible.
The issue of ‘bankability’ of land should be debated.
J2. Provide means for infrastructure provision in infor-mal neighbour-hoods.
Review and enforce affordable and incremental supply standards for each service.
Harmonise the Acts which govern ser-vice provision.
J3. Reform strin-gent financier requirements.
Enforce the current Pension Act that encourages SSNIT contributors to use part of their contri-bution to finance housing.
Enact laws that will ensure the use of a certain percentage of the oil revenue for the housing fund.
Provide credit guar-antees to housing finance providers.
J4. Develop appro-priate building stan-dards for the socio-economic conditions of urban Ghana.
Legalise and encour-age the manufac-ture, use and accept-ability of earth-based traditional building materials and tech-nologies, such as earth-based building materials, including atakpamé and land-crete blocks.
Boost the longevity of atakpamé with better foundations and roof overhangs.
Strengthen the supervisory role of building inspectors.
J5. Improve tendering procedures to include more informal con-tractors.
Lower the threshold of legality for firms so that more workers are protected by ‘decent work’ regulations.
Work with the infor-mal sector to improve performance.
Improve consumer protection measures.
Make employment laws available to all construction workers through site notices and regular informa-tion on the media.
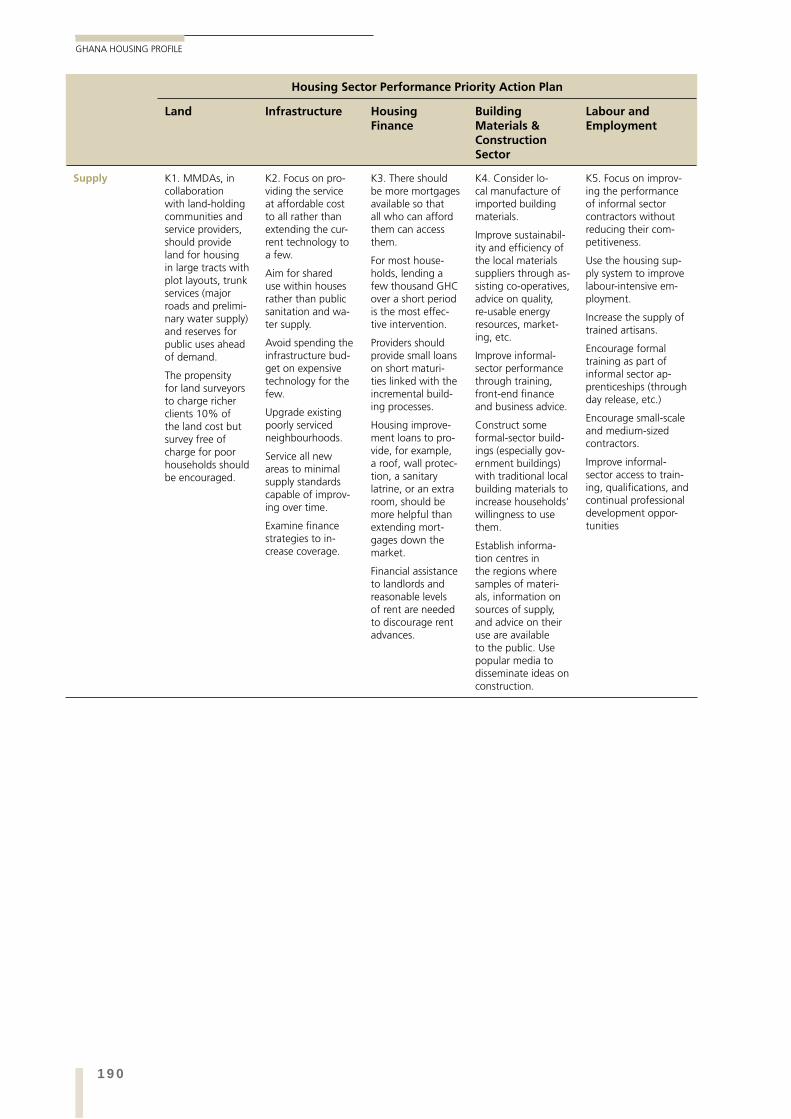
190
GHANA HOUSING PROFILE
Housing Sector Performance Priority Action Plan
Land Infrastructure Housing Finance
Building Materials & Construction Sector
Labour and Employment
Supply K1. MMDAs, in collaboration with land-holding communities and service providers, should provide land for housing in large tracts with plot layouts, trunk services (major roads and prelimi-nary water supply) and reserves for public uses ahead of demand.
The propensity for land surveyors to charge richer clients 10% of the land cost but survey free of charge for poor households should be encouraged.
K2. Focus on pro-viding the service at affordable cost to all rather than extending the cur-rent technology to a few.
Aim for shared use within houses rather than public sanitation and wa-ter supply.
Avoid spending the infrastructure bud-get on expensive technology for the few.
Upgrade existing poorly serviced neighbourhoods.
Service all new areas to minimal supply standards capable of improv-ing over time.
Examine finance strategies to in-crease coverage.
K3. There should be more mortgages available so that all who can afford them can access them.
For most house-holds, lending a few thousand GHC over a short period is the most effec-tive intervention.
Providers should provide small loans on short maturi-ties linked with the incremental build-ing processes.
Housing improve-ment loans to pro-vide, for example, a roof, wall protec-tion, a sanitary latrine, or an extra room, should be more helpful than extending mort-gages down the market.
Financial assistance to landlords and reasonable levels of rent are needed to discourage rent advances.
K4. Consider lo-cal manufacture of imported building materials.
Improve sustainabil-ity and efficiency of the local materials suppliers through as-sisting co-operatives, advice on quality, re-usable energy resources, market-ing, etc.
Improve informal-sector performance through training, front-end finance and business advice.
Construct some formal-sector build-ings (especially gov-ernment buildings) with traditional local building materials to increase households’ willingness to use them.
Establish informa-tion centres in the regions where samples of materi-als, information on sources of supply, and advice on their use are available to the public. Use popular media to disseminate ideas on construction.
K5. Focus on improv-ing the performance of informal sector contractors without reducing their com-petitiveness.
Use the housing sup-ply system to improve labour-intensive em-ployment.
Increase the supply of trained artisans.
Encourage formal training as part of informal sector ap-prenticeships (through day release, etc.)
Encourage small-scale and medium-sized contractors.
Improve informal-sector access to train-ing, qualifications, and continual professional development oppor-tunities

191
APPENDIX
APPENDIX
Housing Sector Performance Priority Action Plan
Land Infrastructure Housing Finance
Building Materials & Construction Sector
Labour and Employment
Demand M1. A convention-al market in land is very unlikely to develop in the next decade.
To meet the de-mand for enough land for between 5.7 million new rooms and all the associated uses, between 38,000 and 222,000Ha of new land must be allocated and de-veloped between 2010 and 2020. The actual amount within the range depends on deci-sions about house type and plot size.
Make house type and plot decisions that will direct land take towards the low estimate.
Consider two-sto-rey development but not higher than three.
Consider differ-ent standards for different income groups.
M2. Many thou-sand currently un-serviced dwellings require servicing as soon as possible.
Services are needed for neighbourhoods and housing con-taining 5.7 million new rooms.
M3. Requirement for between GHC 8 and 24 billion p.a. to satisfy housing need, plus an ad-ditional amount for improving existing stock.
Recognise that microfinance to improve business incomes will im-prove housing.
Renting is likely to remain a major tenure form and should not be re-garded as ‘failed ownership’.
Housing should be linked to the national pov-erty reduction pro-grammes.
M4. Enable own-ers and contractors to catch up on the large backlog of improvement and maintenance of the existing housing stock.
New households will generate a demand for 570,000 new rooms per annum until 2010.
M5. There will be increasing demand for building work-ers – between 76,000 and 101,000 jobs plus between 152,000 and 200,000 jobs in other sectors through back-ward linkages.
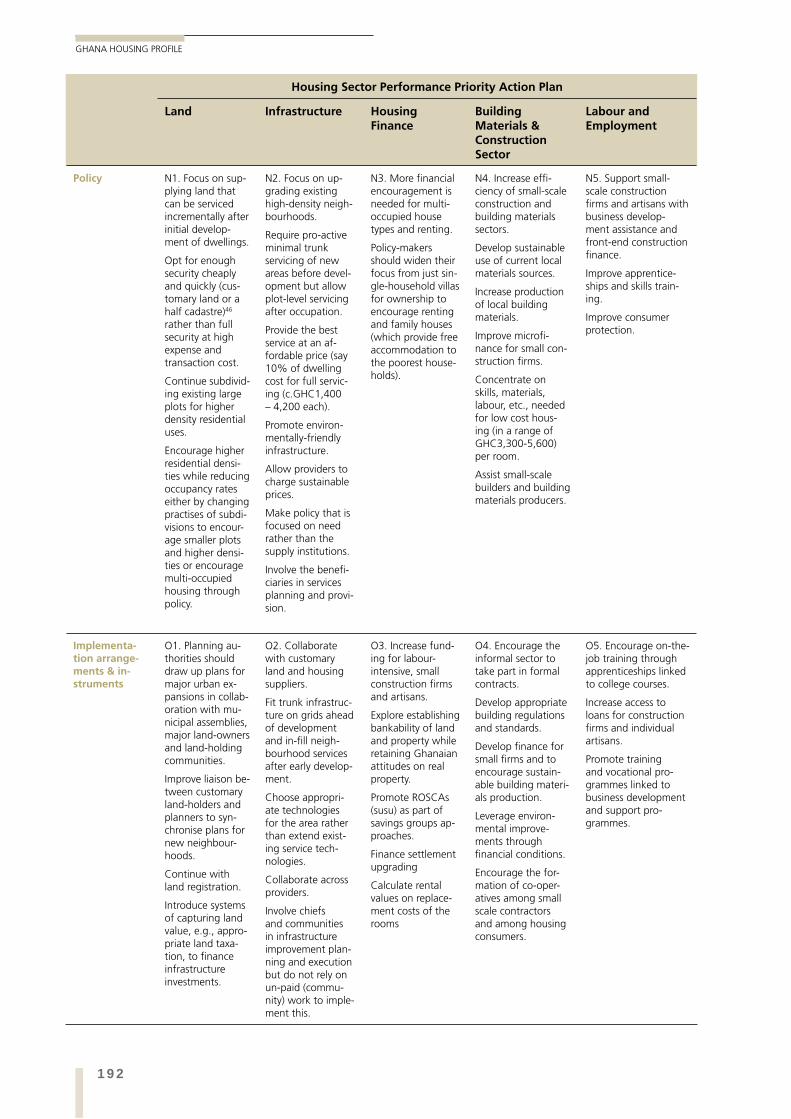
192
GHANA HOUSING PROFILE
Housing Sector Performance Priority Action Plan
Land Infrastructure Housing Finance
Building Materials & Construction Sector
Labour and Employment
Policy N1. Focus on sup-plying land that can be serviced incrementally after initial develop-ment of dwellings.
Opt for enough security cheaply and quickly (cus-tomary land or a half cadastre)46 rather than full security at high expense and transaction cost.
Continue subdivid-ing existing large plots for higher density residential uses.
Encourage higher residential densi-ties while reducing occupancy rates either by changing practises of subdi-visions to encour-age smaller plots and higher densi-ties or encourage multi-occupied housing through policy.
N2. Focus on up-grading existing high-density neigh-bourhoods.
Require pro-active minimal trunk servicing of new areas before devel-opment but allow plot-level servicing after occupation.
Provide the best service at an af-fordable price (say 10% of dwelling cost for full servic-ing (c.GHC1,400 – 4,200 each).
Promote environ-mentally-friendly infrastructure.
Allow providers to charge sustainable prices.
Make policy that is focused on need rather than the supply institutions.
Involve the benefi-ciaries in services planning and provi-sion.
N3. More financial encouragement is needed for multi-occupied house types and renting.
Policy-makers should widen their focus from just sin-gle-household villas for ownership to encourage renting and family houses (which provide free accommodation to the poorest house-holds).
N4. Increase effi-ciency of small-scale construction and building materials sectors.
Develop sustainable use of current local materials sources.
Increase production of local building materials.
Improve microfi-nance for small con-struction firms.
Concentrate on skills, materials, labour, etc., needed for low cost hous-ing (in a range of GHC3,300-5,600) per room.
Assist small-scale builders and building materials producers.
N5. Support small-scale construction firms and artisans with business develop-ment assistance and front-end construction finance.
Improve apprentice-ships and skills train-ing.
Improve consumer protection.
Implementa-tion arrange-ments & in-struments
O1. Planning au-thorities should draw up plans for major urban ex-pansions in collab-oration with mu-nicipal assemblies, major land-owners and land-holding communities.
Improve liaison be-tween customary land-holders and planners to syn-chronise plans for new neighbour-hoods.
Continue with land registration.
Introduce systems of capturing land value, e.g., appro-priate land taxa-tion, to finance infrastructure investments.
O2. Collaborate with customary land and housing suppliers.
Fit trunk infrastruc-ture on grids ahead of development and in-fill neigh-bourhood services after early develop-ment.
Choose appropri-ate technologies for the area rather than extend exist-ing service tech-nologies.
Collaborate across providers.
Involve chiefs and communities in infrastructure improvement plan-ning and execution but do not rely on un-paid (commu-nity) work to imple-ment this.
O3. Increase fund-ing for labour-intensive, small construction firms and artisans.
Explore establishing bankability of land and property while retaining Ghanaian attitudes on real property.
Promote ROSCAs (susu) as part of savings groups ap-proaches.
Finance settlement upgrading
Calculate rental values on replace-ment costs of the rooms
O4. Encourage the informal sector to take part in formal contracts.
Develop appropriate building regulations and standards.
Develop finance for small firms and to encourage sustain-able building materi-als production.
Leverage environ-mental improve-ments through financial conditions.
Encourage the for-mation of co-oper-atives among small scale contractors and among housing consumers.
O5. Encourage on-the-job training through apprenticeships linked to college courses.
Increase access to loans for construction firms and individual artisans.
Promote training and vocational pro-grammes linked to business development and support pro-grammes.
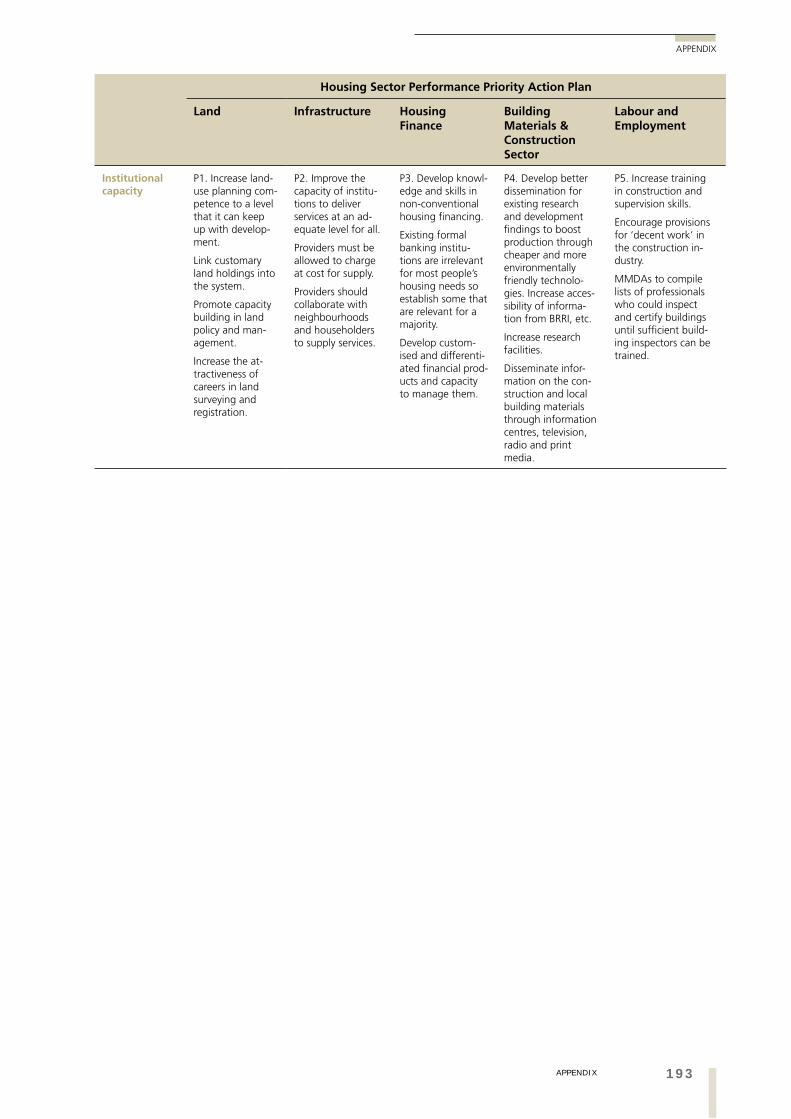
193
APPENDIX
APPENDIX
Housing Sector Performance Priority Action Plan
Land Infrastructure Housing Finance
Building Materials & Construction Sector
Labour and Employment
Institutional capacity
P1. Increase land-use planning com-petence to a level that it can keep up with develop-ment.
Link customary land holdings into the system.
Promote capacity building in land policy and man-agement.
Increase the at-tractiveness of careers in land surveying and registration.
P2. Improve the capacity of institu-tions to deliver services at an ad-equate level for all.
Providers must be allowed to charge at cost for supply.
Providers should collaborate with neighbourhoods and householders to supply services.
P3. Develop knowl-edge and skills in non-conventional housing financing.
Existing formal banking institu-tions are irrelevant for most people’s housing needs so establish some that are relevant for a majority.
Develop custom-ised and differenti-ated financial prod-ucts and capacity to manage them.
P4. Develop better dissemination for existing research and development findings to boost production through cheaper and more environmentally friendly technolo-gies. Increase acces-sibility of informa-tion from BRRI, etc.
Increase research facilities.
Disseminate infor-mation on the con-struction and local building materials through information centres, television, radio and print media.
P5. Increase training in construction and supervision skills.
Encourage provisions for ‘decent work’ in the construction in-dustry.
MMDAs to compile lists of professionals who could inspect and certify buildings until sufficient build-ing inspectors can be trained.
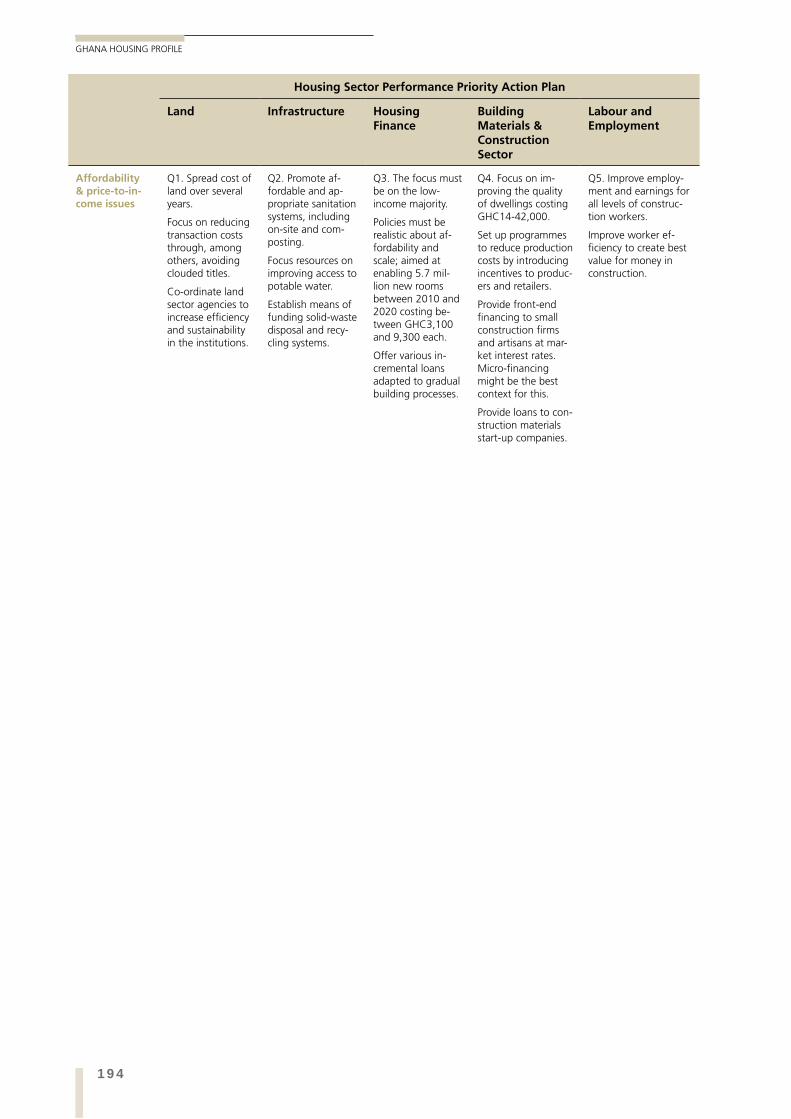
194
GHANA HOUSING PROFILE
Housing Sector Performance Priority Action Plan
Land Infrastructure Housing Finance
Building Materials & Construction Sector
Labour and Employment
Affordability & price-to-in-come issues
Q1. Spread cost of land over several years.
Focus on reducing transaction costs through, among others, avoiding clouded titles.
Co-ordinate land sector agencies to increase efficiency and sustainability in the institutions.
Q2. Promote af-fordable and ap-propriate sanitation systems, including on-site and com-posting.
Focus resources on improving access to potable water.
Establish means of funding solid-waste disposal and recy-cling systems.
Q3. The focus must be on the low-income majority.
Policies must be realistic about af-fordability and scale; aimed at enabling 5.7 mil-lion new rooms between 2010 and 2020 costing be-tween GHC3,100 and 9,300 each.
Offer various in-cremental loans adapted to gradual building processes.
Q4. Focus on im-proving the quality of dwellings costing GHC14-42,000.
Set up programmes to reduce production costs by introducing incentives to produc-ers and retailers.
Provide front-end financing to small construction firms and artisans at mar-ket interest rates. Micro-financing might be the best context for this.
Provide loans to con-struction materials start-up companies.
Q5. Improve employ-ment and earnings for all levels of construc-tion workers.
Improve worker ef-ficiency to create best value for money in construction.
195BIBLIOGRAPHY
BIBLIOGRAPHY
BIBLIOGRAPHY
A
Abdulai, R. T. and I. E. Ndekugri (2007). “Customary landholding institutions and housing development in urban centres of Ghana: Case Studies of Kumasi and Wa.” Habitat International 31 (2): 257-67.
Acquaye, E. and others (1989). Study of Institutional and Legal Problems Associated with Land Delivery in Accra. Unpublished report presented to the Government of Ghana, UNDP and UNCHS on the Accra Planning and Development Programme. Accra.
Adjei, J. K. (2010). HFC Boafo Microfinance Services Savings Products. 5th Annual CHF Development Finance Conference.
Agblobi, A. D. (2010). “Pension Benefits and Mortgage Loan (5).” Business and Financial Times (1129): 13.
Agyapong, T. F. (1990). Government Policy and patterns of urban housing development. London, London School of Economics. Doctoral thesis
Akosa, G., R. Franceys, P. Barker and T. Weyman-Jones (1995). “Efficiency of water-supply and sanitation projects in Ghana.” Journal of Infrastructure Systems - ASCE 1 (1): 56-65.
Akuffo, S. (2007). Housing conditions, borrowing and lending in informal settlements in Accra. Accra, The African Union for Housing Finance, Cities Alliance and USAID.
Amanor, K. (1999). Global restructuring and land rights in Ghana: forest food chains, timber and rural livelihoods. Research Report No.108. Uppsala, Nordiska Afrikainstitutet.
Amoa-Mensah, K. (2003). Housing in Ghana: A search for sustainable options as the way forward for enhanced output-Year 2003 and beyond. Paper presented at the International Building Exhibition Seminar. Accra.
Amole, B., D. Korboe and A. G. Tipple (1993). “The family house in West Africa: a forgotten resource for policy makers?” Third World Planning Review 15 (4): 355-72.
Anarfi, J. and S. Jagare (2005). Towards the sustainable return of West African transnational migrants: what are the options. Paper presented at the Conference on New Frontiers of Social Policy. Arusha
Andreasen, J., J. Eskemose and G. Tipple (2005). The demise of the compound houses - consequences for the low income population in Kumasi. London, RICS Research Paper 6, 1.
Angel, S., S. C. Sheppard and D. L. Civco (2005). The Dynamics of Global Urban Expansion. Washington D.C., Transport and Urban Development Department The World Bank.
Anim-Odame, W. K. (2010). “Real Estate Market Performance in Ghana: A Time Series Analysis.” The Journal of Business and Estate Management Research 2 (1): 10-7.
196
GHANA HOUSING PROFILE
B
C
Anonymous (1985). “The tragedy of ‘low cost’ housing.” Africa (161, January): 35-6.
Anvuur, A., M. Kumaraswamy and S. Male (2006). Taking forward public procurement reforms in Ghana. Paper presented at the CIB W107 Construction in developing economies international symposium “Construction in developing economies: New issues and challenges”. Santiago, Chile.
Asenso-Okyere, W. K., S. Y. Atsu and I. S. Obeng (1993). Communal property resources in Ghana: policies and prospects. ISSER Discussion Paper No. 7. Legon, University of Ghana.
Asiamah, F. (2006). “A vibrant mortgage finance sector has potential for job creation.” Public Agenda, December 4.
Asiedu, A. B. and G. Arku (2009). “The rise of gated housing estates in Ghana: Empirical insights from three communities in metropolitan Accra.” Journal of Housing and the Built environment 24 (3): 227-47.
Assibey-Mensah, G. O. (2008) “Ghana’s Construction Industry and Global competition.” Journal of Black Studies Feb 5.
Bank of Ghana (2007). The Housing Market in Ghana. Accra, Bank of Ghana.
Bawumia, M., T. Owusu-Danso and A. McIntyre (2008). Ghana’s Reforms Transform Its Financial Sector IMFSurvey Magazine: Countries & Regions.
Bentsi-Enchill, K. (1964). Ghana land law. London, Sweet and Maxwell.
Biitir, S. B. (2008). Beacon of hope: the impact of housing microfinance on housing improvement and construction for low income households in Accra. The case of Boafo Microfinance Services Ltd. Housing Development and Management. Rotterdam, Institute for Housing and Urban Development Studies. Master of Science in Urban Management and Development.
Boadi, K. O. and M. Kuitunen (2005). “Environmental and health impacts of household solid waste handling and disposal practices in third world cities: the case of the Accra Metropolitan Area, Ghana.” Journal Environmental Health 68.(4): 32-6.
Braimah, F. (2008). Community Based Savings and Loans Plus as a tool for affordable finance - A case of Amui Djor ADP, Ashaiman. Workshop for growing sustainable housing microfinance options in Sub-Saharan Africa. Giraffe Ocean View Hotel, Tanzania.
Brokensha, D. (1966). Social change at Larteh, Ghana. Oxford, Clarendon Press.
Buckley, R. and S. Mathema (2007a). Is Accra a Superstar City? Policy Research Working Paper 4453. Washington DC, The World Bank Finance Economics and Urban Department.
Buckley, R. and S. Mathema (2007b). Real Estate and Remittances in Accra, Ghana: A case of Winner’s Curse. Paper prepared as a background paper for a PPIAF study of a MIGA-sponsored residential real estate development.
Burra, M. (2004). Land Use Planning and Governance in Dar es Salaam: A Case Study from Tanzania. In Reconsidering informality: perspectives from urban Africa. K. T. Hansen and. M. Vaa (Eds). Oslo, Nordiska Afrikainstitutet.
Busia, K. A. (1954). The position of the chief in the modern polictical system of Ashanti. Oxford, Oxford University Press.
Centre for Affordable Housing Finance (2010). Housing finance in Africa: a review of some of Africa’s housing finance markets. Yearbook 2010. Johannesburg, Centre for Affordable Housing Finance in Africa.
197BIBLIOGRAPHY
BIBLIOGRAPHY
D
E
F
G
CHF International (2004). Strategic assessment of the affordable housing sector in Ghana. Silver Spring, MD, CHF International.
COHRE (2004). A Precarious Future: The Informal Settlement of Agbogbloshie, Accra, Ghana. Accra, The Centre on Housing Rights and Evictions (COHRE).
Diko, J. and A. G. Tipple (1992). “Migrants build at home: long distance housing development by Ghanaians in London.” Cities 9(4): 288-94.
Economist Information Unit (EIU) (1993). Economist Intellegence Unit Country Report (Ghana), 2nd Quarter, Economist Intellegence Unit, London.
Farvacque-Vitkovic, C., M. Raghunath, C. Eghoff and C. Boakye (2008). Development of the Cities of Ghana: Challenges, Priorities and Tools. Africa Region Working Paper Series Number 110. Washington DC, The World Bank.
GHAMFIN (2008). Performance Benchmarks of MFIs in Ghana, 2004 & 2006. Accra, Ghana Microfinance Finance Institutions Network.
Ghana Live News (2009) “ Boost for public sector housing.”
Ghana News Agency. (2010). “AVRL exposes illegal connections at Mamobi.” Retrieved 21st November, 2010, from http://www.modernghana.com/news/237098/1/avrl-exposes-illegal-connections-at-mamobi.html.
Ghana Statistical Service (2002a). 2000 Population and Housing Census, Special Report on Urban Localities. Accra, Ghana Statistical Service.
Ghana Statistical Service. (2002b). “Census of population and Housing, 2000.” Retrieved 3 March, 2010, from http://www.statsghana.gov.gh/.
Ghana Statistical Service (2008). Ghana Living Standards Survey Report on the Fifth Round (GLSS5). Accra, Ghana Statistical Services, Government of Ghana.
Ghana Statistical Service (2010). Newsletter: Consumer Price Index (CPI) April, 2010 Accra, Ghana Statistical Service.
Gough, K. V. and P. Yankson (2010). “A Neglected Aspect of the Housing Market: The Caretakers of Peri-urban Accra, Ghana.” Urban Studies Online First August 16.
Gough, K. V. and P. W. K. Yankson (2000). “Land markets in African cities: the case of peri-urban Accra, Ghana.” Urban Studies 37(13): 2485.
Government of Ghana (1987). National Housing Policy and Action Plan, 1987-1990, Ministry of Works and Housing, Accra.
Government of Ghana (1992a). The Constitution of Ghana. Accra, The Government of Ghana.
Government of Ghana (1992b). National Shelter Strategy (Parts I and II). Accra, Policy Planning and Evaluation Unit, Ministry of Works and Housing.
Government of Ghana (2000). National Poverty Alleviation Strategy. Accra, Economic Policy Centre.
198
GHANA HOUSING PROFILE
H
I
J
Government of Ghana (2002). Ghana Poverty Reduction Strategy: 2003 - 2005. Accra, National Development Policy Commission.
Government of Ghana (2003). Ghana Poverty Reduction Strategy: An Agenda for Growth and Prosperity (2003 -2005) [GPRS I] Vol. 1, Analysis and Policy Statement. Accra, National Planning Development Commission.
Government of Ghana (2005). Growth and Poverty Reduction Strategy: 2006 - 2009. Accra, National Development Policy Commission.
Government of Ghana (2006). Ghana Microfinance Policy. Accra, Ministry of Finance and Economic Planning.
Government of Ghana (2007a). Annual Review Report 2007. City, Ministry of Transport.
Government of Ghana (2007b). National Water Policy. Accra, Ministry of Water Resources, Works and Housing.
Government of Ghana (2009). Draft Medium Term National Development Policy Framework 2010 – 2013. Accra, National Development Policy Commission.
Government of Ghana (2010). Planning Standards Volume Two (Third Draft), Planning standards and zoning regulations. Accra, COWI Maple Consult and Cersgis for Town and Country Planning Department, Land Use Planning and Management Project, Ministry of Local Government, Rural Development and Environment.
Grant, R. (2005). “The emergence of gated communities in a West African context: Evidence from Greater Accra, Ghana.” Urban Geography 26 (8): 661-83.
Grant, R. (2007). “Geographies of investment: How do the wealthy build new houses in Accra, Ghana?” Urban Forum 18 (1): 31-59.
GREDA (2009). The Ghana Real Estate Developers Association and Housing Policy in Ghana. Accra, GREDA.
Gyourko, J., C. J. Mayer and T. M. Sinai (2006). “Superstar cities.” NBER working paper. Georgetown, National Bureau of Economic Research.
Habitat for Humanity Ghana. (2008). “Home page.” Retrieved 30th September, 2010, from http://www.habitatghana.org/ginfo.php
Habitat for Humanity Ghana (2010). Press Release. Daily Graphic. Accra.
Institute of Statistical Social and Economic Research (ISSER) (2007). The state of the Ghana Economy in 2006. Legon, University of Ghana Press.
Institute of Statistical Social and Economic Research (ISSER) (2010). The state of the Ghana Economy in 2009. Legon, University of Ghana Press.
International Monetary Fund (2003). Ghana: Financial System Stability Assessment Update, including Reports on the Observance of Standards and Codes on the following topics: Banking Supervision, Insurance Regulation, and Securities Regulation. Washingston, D.C, IMF Country Report.
JEAVCO Associates (2010). Audit Report: Kumasi Metropolitan Assembly (KMA) - Ghana Urban Management Pilot Project (GUMPP) (Final Report). Accra, JEAVCO Associates.
Jenkins, M. W. and B. Scott (2007). “Behavioral indicators of household decision-making and demand for sanitation and potential gains from social marketing in Ghana.” Social Science & Medicine 64 (12): 2427-42.
199BIBLIOGRAPHY
BIBLIOGRAPHY
K
L
M
Karley, N. K. (2008). “Ghana residential property delivery constraints and affordability analysis.” Housing Finance International 22 (4): 22-8.
Karley, N. K. and M. S. Y. Akomea (2007). Overview and Prospects of Real Estate Market in Ghana. Kumasi, College of Arts and Social Sciences, Kwame Nkrumah University of Science & Technology
Kasanga, K. and N. A. Kotey (2001). Land Management in Ghana: Building on Tradition and Modernity. Nottingham, UK, Russell Press.
Kasanga, R. K., J. Cochrane, R. King and M. Roth (1996). Land market and legal contradictions in the peri-urban areas of Accra, Ghana: informant interviews and secondary data investigations. Madison WI and Kumasi, Land Tenure Centre, University of Wisconsin-Madison and LARC, UST.
Khan, A. H., S. Azhar and A. Mahmood (2008). Quality assurance and control in the construction of infrastructure services in developing countries - A case study. Paper presented at the first international conference on Construction in developing countries, Advancing and integrating construction education, research and practice, Florida International University, Miami, and NED University, Karachi.
Kirchherr, E. C. (1968). “Tema 1951 - 1962: The evolution of a planned city in West Africa.” Urban Studies 5 (2): 207 - 17.
Konadu-Agyemang, K. O. (1991). “Reflections on the absence of squatter settlements in West African cities: the case of Kumasi, Ghana.” Urban Studies 28 (1): 139.
Konadu-Agyemang, K. (2001). The Political Economy of Housing and Urban Development in Africa. Westport, CT, Praeger.
Konadu-Agyemang, K. (2001). “Structural Adjustment Programs and Housing Affordability in Accra, Ghana.” The Canadian Geographer 45 (4): 528-45.
Korboe, D. (1992a). “Family-houses in Ghanaian cities: to be or not to be?” Urban Studies 29 (7): 1159.
Korboe, D. (1992b). “Multihabitation: an analysis of residence in a West African city.” Open House International 17(1): 45-53.
Korboe, D. T. (1993). The Low-income Housing System in Kumasi: An Empirical Examination of Two Neighbourhoods, University of Newcastle upon Tyne.
Land Administration Project (2006). Town and Country Planning, Working Paper No. 14. Accra, Ministry of Lands and Natural Resources.
Land Administration Project (2010a). Annual Monitoring and Evaluation Report, 2009. Accra, Ministry of Lands and Natural Resources, Land Administration Project Unit.
Land Administration Project (2010b). A Newsletter of the Land Administration Project. LAP News. Edition 4. Accra, Ministry of Lands and Natural Resources, Land Administration Project Unit.
Luginaah, I., G. Arku and P. Baiden (2010). “Housing and Health in Ghana: the psychosocial impacts of renting a home.” International Journal of Research in Public Health 7: 528-45.
Maclean, A. (2010). Sanitation and Drinking Water Quality of Households in the Adenta Municipality, Unpublished Data.
200
GHANA HOUSING PROFILE
Mahama, C. and A. Antwi (2006). Land and property markets in Ghana. Discussion paper presented at the 2006 World Urban Forum. Vancouver.
Mahama, C. and M. Dixon (2006). “Acquisition and Affordability of land for Housing in Urban Ghana: a study in the formal land market dynamics.” RICS Research paper series 6(10).
Malpezzi, S. J., A. G. Tipple and K. G. Willis (1989). Costs and Benefits of Rent Control: A Case Study in Kumasi, Ghana, Washington DC.: The World Bank.
Manu, F. W., P. D. Baiden-Amissah, J. K. Boadi and K. Amoa-Mensah (2009). Some material improvement options for earth construction in northern Ghana: a key factor in reducing the impact of recent floods on housing. Proceedings of the 11th International Conference on Non-conventional Materials and Technologies (NOCMAT 2009). Bath, UK.
Ministry of Finance and Economic Planning (2003). Agenda for Growth and Prosperity - Ghana’s Poverty Reduction Strategy (GPRS) Volume II: Costs and Financing of Programmes and Projects. Accra, Ministry of Finance and Economic Planning.
Ministry of Lands and Forestry (1999). National Land Policy of Ghana. Accra, Ministry of Lands and Forestry
Ministry of Lands and Forestry (2003). Emerging land tenure issues. Accra, Ministry of Lands and Forestry.
Ministry of Lands Forestry and Mines (2008). The Ghana Land Directory. Accra, Ministry of Lands, Forestry and Mines.
Ministry of Manpower Youth and Employment (2007). Draft National Youth Policy. Accra, Ministry of Manpower, Youth and Employment.
Ministry of Transport (2007). Annual Review Report 2007. Accra, Ministry of Transport.
Ministry of Water Resources Works and Housing (2006). Housing in Ghana - Investment Opportunities. Accra, Ministry of Water Resources, Works and Housing
National Development Planning Council (2010). 2008 Ghana Millennium Development Goals Report. Accra, National Development Planning Council.
News Desk Report (2010). GREDA submits proposals for 300,000 housing units. Daily Graphic. Accra. Issue 18295.
Obeng-Odoom, F. (2009a) “Real estate agents in Ghana: a suitable case for regulation?” Regional Studies iFirst 1-14.
Obeng-Odoom, F. (2009b). A Secondary Mortgage Market in Ghana: antidote or poison? . In Built Environment: Design, Management and Applications. P. Geller (ed). New York, Nova Science Publishers.
Obeng-Odoom, F. (2010). “Urban Real Estate in Ghana: A Study of Housing-related Remittances from Australia.” Housing Studies 25 (3): 357-73.
Obeng-Odoom, F. (Forthcoming 2011). “Private rental housing in Ghana: reform or renounce?” Journal of International Real Estate and Construction Studies 1(1).
Obeng, P. A., E. A. Donkor and A. Mensah (2008). “Assessment of institutional structures for solid waste management in Kumasi.” Management of Environmental Quality: An International Journal 20 (2): 106 - 20.
Odame-Larbi, W. (2006). Land reform in a pluralist environment - the case of Ghana. Paper presented at conference 5th FIG Regional Conference “Promoting Land Administration and Good Governance”, Accra.
N
O
201BIBLIOGRAPHY
BIBLIOGRAPHY
P
R
S
Odame Larbi, W. ( 2006). Land reform in a pluralist environment - the case of Ghana. Paper presented at conference 5th FIG Regional Conference “Promoting Land Administration and Good Governance”. Accra
Ofori, E. (2006). SUF: Pilot Programme Report on Community-Led Enumeration for Ashaiman - Tulaku Community, Ghana. Accra, Report commissioned by UN-HABITAT Sub-Programme 4: Human Settlements Financing Slum Upgrading Facility (SUF) - Design Phase.
Okine, C. B. (2010). “SSNIT changes housing policy.” Graphic Business, Accra 093.
Ollennu, N. A. (1962). Principles of customary land law in Ghana. London, Sweet and Maxwell.
Opoku, D. K. (2010). “From a ‘success’ story to a highly indebted poor country: Ghana and neo-liberal reforms.” Journal of Contemporary African Studies 28 (2): 155-75.
Orozco, M., M. Bump, R. Fedewa and K. Sienkiewicz (2005). “Diasporas, development and transnational integration: Ghanaians in the US, UK and Germany.” Institute for the Study of International Migration and Inter-American Dialogue. Report commissioned by Citizen International through the US Agency for International Development.
Osei Kwame, S. and F. Antwi (2004). The Impact of Land Delivery and Finance in the Supply of Residential Accommodation in the Urban Centres of Ghana - the Case Study of Accra and Tema. Stockholm, Sweden, Royal Institute of Technology. Master’s Thesis No. 229.
Oteng-Ababio, M. (2007). Private-Public Partnership in Solid Waste Management in the Greater Accra Metropolitan Area. Legon, University of Ghana. PhD Dissertation.
Oteng-Ababio, M. (2010a). “Missing links in Solid Waste Management in the Greater Accra Metropolitan Area in Ghana.” Geojournal Online DOI: 10.1007/s10708-010-9363-90.
Oteng-Ababio, M. (2010b). “Private Sector Involvement in Solid Waste Management in the Greater Accra Metropolitan Area.” Waste Management & Research 28: 322-9.
Practical Action (2007) “Alternatives to Portland Cement: An introduction.” Technical Brief. Practical Action, UK.
Roe, A. R. (1991). Economy. Regional Survey of the World: Africa South of Sahara (1992), (21st ed.). London, Europe Publications Limited.
Sarfoh-Mensah, P. (2005). Exportation of Timber in Ghana: The Menace of Illegal Logging Operations. Milan, Fondazione Eni Enrico Mattei. Nota Di Lavoro 29.
Sarfoh, K. O. (2002). Obvious Needs and Hidden Means: access to formal housing finance for low-income groups in Ghana. Rotterdam, Netherlands and Lund, Sweden, Institute for Housing and Urban Development Studies (IHS) and Lund University. Masters Thesis.
Sarfoh, K. O. (2010). Lost In Translation - The Nexus of Multi-Layered Housing Policy Gaps: The Case of Ghana. St. Andrews, University of St. Andrews. Doctoral thesis.
Shumann, R. and E. Miamidian (2009). Housing Microfinance in Ghana. Washington DC, CHF International.
Simone, A. (2004). For the city yet to come: changing African life in four cities. Durham NC, Duke University Press.
202
GHANA HOUSING PROFILE
T
U
Sittie, R. (2006). Land Title Registration: the Ghanaian Experience. Paper presented at the XXIII International FIG Congress “Shaping the Change”. Munich, Germany.
Songsore, J. and G. McGranahan (2000). “Structural adjustment, the urban poor and environmental management in the Greater Accra Metropolitan area (GAMA) Ghana.” Bulletin of the Ghana Geographical Association 22: 1-14.
Songsore, J., J. S. Nabila, Y. Yangyuoru, S. Avle, E. K. Bosque-Hamilton, P. E. Amponsah and O. Alhassan (2009). Environmental Health Watch and Disaster Monitoring in the Greater Accra Metropolitan Area (GAMA). Accra, Ghana Universities Press.
Tamale Municipal Assembly (2002). Water and Sanitation in Tamale Municipality. Tamale, Unpublished Report, Tamale Municipal Assembly.
Tibaijuka, A. K. (2009). Building prosperity: housing and economic development. London, Earthscan for UN-Habitat.
Tipple, A. G. (1987). The development of housing policy in Kumasi, Ghana, 1901 to 1981: with an analysis of the current housing stock. Newcastle upon Tyne, Centre for Architectural Research and Development Overseas, University of Newcastle upon Tyne.
Tipple, A. G. (1995). “Dear Mr President, housing is good for your economy.” Norsk Tidsskrift Geografisk 49 (4): 175-86.
Tipple, A. G. (2000). Extending themselves: user initiated transformations of government built housing in developing countries. Liverpool, Liverpool University Press.
Tipple, A. G. (2005a). “The place of home-based enterprises in the informal sector: evidence from Cochabamba, New Delhi, Surabaya and Pretoria.” Urban Studies 42 (4).
Tipple, A. G. (2005b). “Pollution and Waste production in Home-based enterprises in developing countries: perceptions and realities.” Journal of Environmental Planning and Management 48 (2, March): 275-99.
Tipple, A. G., B. Amole, D. Korboe and H. Onyeacholem (1994). “House and dwelling, family and household.” Third World Planning Review 16 (4): 429-50.
Tipple, A. G., D. Korboe and G. Garrod (1997). “Income and wealth in house ownership studies in urban Ghana.” Housing Studies 12 (1): 111-26.
Tipple, A. G., D. Korboe, G. Garrod and K. Willis (1999). “Housing supply in Ghana: a study of Accra, Kumasi and Berekum.” Progress in Planning 51 (4): 253-324.
Tipple, A. G. and K. G. Willis (1991). “Tenure choice in a West African city.” Third World Planning Review 13 (1): 27-45.
Tipple, A. G. and K. G. Willis (1992). “Why should Ghanaians build houses in urban areas?” Cities (February): 60-74.
Tipple, G. and S. Speak (2009). The hidden millions: homelessness in developing countries. London, Routledge.
Tuffour, T. (not dated - c2009/10). Gender and women housing problems in Accra - the case of Old Fadama. Accra, Mimeo.
UN-HABITAT (2003). The challenge of slums: Global Report on Human Settlements 2003. London and Sterling, VA., Earthscan.
203BIBLIOGRAPHY
BIBLIOGRAPHY
V
W
UN-HABITAT (2004). Housing and urban development in Ghana: with special refrence to low-income housing. Nairobi, UN-HABITAT.
UN-HABITAT (2006). Ghana Country Report. West Africa High-level peer exchange on Government Enablement of Private Sector lending for Affordable Housing, Accra, UN-HABITAT.
UN-HABITAT (2009). Planning Sustainable Cities: Global Report on Human Settlements 2009. Nairobi and London, UN-HABITAT and Earthscan.
UN-HABITAT (2010). Housing as a strategy for poverty reduction in Ghana. Nairobi, UN-HABITAT.
UNCHS/ILO (1995). Shelter Provision and Employment Generation. Geneva, United Nations Centre for Human Settlements (Habitat), Nairobi; International Labour Office.
UNDP. (2008). “2007/2008 Human Development Reports, Malawi.” from http://hdrstats.undp.org/countries/country_fact_sheets/cty_fs_MWI.html.
US Department of State. (2010). “Background Note: Ghana.” Diplomacy in Action Retrieved 10th October, 2010, from http://www.state.gov/r/pa/ei/bgn/2860.htm.
Van Der Geest, S. (1998). “Akan shit: getting rid of dirt in Ghana.” Anthropology Today 14 (3): 8-12.
Water Aid. (2000). “Looking back: the long-term impacts of water and sanitation projects.” Retrieved 10 November, 2010, from www.wateraid.org.
Water Aid (2005) “National water sector assessment.”
Water Aid. (2008). “Annual Report.” Retrieved 10 November, 2010, from www.wateraid.org.
Water Aid Ghana (2007). Urban sector assessment report. Accra, Water Aid Ghana.
Weeks, J. R., A. Hill, D. Stow, A. Getis and D. Fugate (2007). “Can we spot a neighborhood from the air? Defining neighborhood structure in Accra, Ghana.” GeoJournal 69 (1): 9-22.
Whittington, D., D. T. Lauria, K. Choe, J. A. Hughes and M. Swarna Albert (1993). “Household sanitation in Kumasi, Ghana: a description of current practices, attitudes, and perceptions.” World Development 21 (5): 733-48.
Willis, K. G., S. J. Malpezzi and A. G. Tipple (1990). “An econometric and cultural analysis of rent control in Kumasi, Ghana.” Urban Studies 27 (2): 241-58.
Willis, K. G. and A. G. Tipple (1991). “Economics of Multihabitation: Housing conditions, household occupancy and household structure under rent control, inflation, and nonmarketability of ownership rights.” World Development 19(12): 1705-20.
Wily, L. A. and D. Hammond (2001). Land Security and The Poor in Ghana: Is there a way forward? . A Land Sector Scoping Study, DFID Ghana’s Rural Livelihoods Programme. London, DFID.
World Bank (2000). Attacking Poverty: Opportunity, Empowerment, and Security. Washington DC, The World Bank.
World Bank (2009a). Africa Development Indicators, 2008/09. Youth employment in Africa: the potential, the problem, the promise Washington DC, The World Bank.
World Bank (2009b). Africa Development Indicators, 2008/09: Youth employment in Africa: the potential, the problem, the promise. Washington DC, The World Bank.
204
GHANA HOUSING PROFILE
World Bank (2009c). Report on Infrastructure Development in Ghana. Washington DC, The World Bank.
World Bank (2010). World Development Report: Development and Climate Change. Washington DC, The World Bank.
World Health Organization (2004). The world health report 2004: changing history. Geneva, WHO.
Yap, K. S. (1988). The construction and management of infrastructure in low-income urban settlements through community participation: an example from Sri Lanka, Human Settlements Division, Asian Institute of Technology, Bangkok.
Yeboah, I. E. A. (2000). “Structural adjustment and emerging urban form in Accra, Ghana.” Africa Today 47 (2): 60-89.
Yeboah, I. E. A. (2003). “Demographic and housing aspects of structural adjustment and emerging urban form in Accra, Ghana.” Africa Today 50 (1): 107-19.
Yeboah, I. E. A. (2005). “Housing the Urban Poor in Twenty-First Century Sub-Saharan Africa: Policy Mismatch and a Way Forward for Ghana.” GeoJournal 62 (1): 147-61.
Ziss, R. and G. Schiller (1982). Employment and income effects of housing construction in Ghana, Paper presented at an International Seminar on Housing and Employment as a Decision-Making Nexus in Urban Development, Berlin (West), November.
Z
205ANNEX
ANNEX
Mr Nimako, Ghana Standards Board.
Abongo David Anians, Director, Waste Management Department, Tamale Municipal Assembly, Tamale.
Grace Nancy Frimpong, Public Relations Manager, State Housing Company.
Ama B. Amoah, Head of Mortgage Department, HFC Bank
Lydia Ablorh, Treasurer Tema Housing Cooperative Society (was past president).
Rev Joseph Oduro-Yeboah, President, IRS Senior Staff Association.
Samuel Kofi Afrane, College of Architecture and Planning, KNUST, Kumasi.
Samuel Asiama, College of Architecture and Planning, KNUST, Kumasi.
Rudith King, College of Architecture and Planning, KNUST, Kumasi.
Stephen K Owusu, College of Architecture and Planning, KNUST, Kumasi.
Sandrine Cappelle-Manuel, Country Director, CHF International.
Sylvester Gabianu, CHF International.
Addo Soin Dombo, Chief Rent Officer, Rent Control Department.
Alexander Tweneboah, President, Ghana Real Estate Developers Association.
Alhassan Dawuni, Former Chief Technical Advisor, Ministry of Water Resources, Works and Housing.
Anthony Mensah, Director, Waste Management Department, Kumasi Municipal Assembly.
Augustine Agblewornu, Chief Director, Ministry of Transport.
Bernard Ayitey-Adjin, Strategic Planning and Research, HFC Bank.
Bernard Dankyi Boateng, Credit Officer, First Ghana Building Company Ltd.
Callistus Mahama, Deputy Director, Institute of Local Government Studies.
LIST OF KEY INFORMANTS
ANNEX
206
GHANA HOUSING PROFILE
Christie Laryea, Senior Architect, SSNIT.
Daniel Adjetey-Adjei, Director, Water Operations Monitoring and Assets Management, Ghana Water Company (Head office).
Dede Boakye, Private Estate Developer.
Dominic Adu, Chief Executive Officer, Ghana Home Loans Company Ltd.
Doris Tetteh, Metropolitan Planner, Town and Country Planning Department, Accra Metropolitan Assembly.
Ellen Oteng Nsiah, Chief Executive, Housing the Masses.
Elliot Baltrope Sackey, Consultant, Local Government Project Coordinating Unit.
Emmanuel Amoasi, Client Service Officer, Land Registration Division, Lands Commission.
Emmanuel Bruce Adjei, Ghana Standard Board.
Ernest Gbesemete, Bess Block Manufacturing Company.
Farouk Braimah, Executive Director, People’s Dialogue on Human Settlements.
Grace Nancy Frimpong, Public Relations Manager, State Housing Company.
Hockey Raphael, Senior Lands Officer, Public and Vested Land Management, Lands Commission.
J.A. Abbossey, Acting Director of Surveys, Survey and Mapping Division, Lands Commission.
John Eleurke, Institutional Reforms Specialist, Land Administration Project Unit, Ministry of Lands and Natural Resources.
Josephine Allotey, Member of Focus Group in James Town, Accra
Kenneth Advettoh, General Manager Customer Care, Ghana Water Company Limited & Aqua Vitens Rand Limited (Regional office).
Kofi Sackey, Senior Legal Officer, SSNIT.
Kofi Yeboah, Planning Officer, Accra Metropolitan Assembly.
Kojo Anane, Programmes Officer, Peoples Dialogue on Human Settlements.
Kwadwo Danquah, Rocksters Roofing Sheets.
Kwasi Adomako, Facilities Manager, Social Security and National Insurance Trust.
Kwasi Kyere, Ghana Cement Company Limited.
Kwasi Owusu Boadu, Senior Research Officer, Ghana Standards Board.
Laud Ashon, Project Quantity Surveying Consultant, Affordable Housing Project.
Lawrence Kumi, Acting Director of Road Transport Service, Ministry of Transport.
Martin Konotey, Small Scale Building Contractor.
Maud Gbeko Kove, Assistant Quantity Surveyor, Department of Urban Roads, Kumasi.
207ANNEX
ANNEX
Miss Akosua K. Darkwa, Mortgage Banking, Fidelity Bank Ltd.
Mohammed Alhassan, Planning Officer in Charge of Projects, Town and Country Planning Department, Head Office, Accra.
Nana Yaa Akyempim Jantuah, Senior Public Relations and External Affairs Manager, Public Utilities Regulatory Commission.
Osei Erbynn Eghan, Asset Management Manager, Ghana water Company Limited & Aqua Vitens Rand Limited (Head office).
Osman Siaka, Monitoring and Evaluation Officer, Land Administration Project Unit, Ministry of Lands and Natural Resources.
Patrick Apoya, Executive Secretary, Coalition of NGOs in Water and Sanitation.
Philip Lartey, Deputy Director, Finance and Administration, Department of Urban Roads.
Philip Oduro Amoyaw, Head of Strategic Planning and Research, HFC Bank.
Richard Kweku Adu, Sales Executive, Edlorm Housing Ghana Ltd.
Richard Owusu Afoakwa, Principal Lands Officer, Lands Commission.
Samuel Baah-Ofori, Assistant Quantity Surveyor, Department of Urban Roads, Tamale.
Samuel Kpodo, Senior Environmental Technologist, Waste Management Department, Accra Metropolitan Assembly, Accra.
Shaine Sheshie, Ga West Municipal Assembly.
Steve Akuffo, Former Deputy Minister for Works and Housing.
Sylvester Gabianu, Institutional Support Manager, CHF Ghana.
Tetteh Okine, Director of Operations, Electricity Company of Ghana (Head Office).
Theresa Tuffour, Deputy Director of Housing, Ministry of Water Resources, Works and Housing.
Vida Awuku, Adenta Municipal Assembly.
Yahaya Yakubu, Director of Housing, Ministry of Water Resources, Works and Housing.
Liz Case, UN-HABITAT.
208
GHANA HOUSING PROFILE
Abdul Razak Gyimah, Analyst, Ghana Home Loans
Abena Acheampong, Lecturer, Institute of Local Government Studies
Abena Ntori, , UN-HABITAT
Addo Dombo, Ag. Chief Rent Control Officer, Rent Control
Adjei Alfred, Representative, Averno Landlords’ Association
Adnan Mohammed, Budget Advocate, ISODEC- Plan Ghana
Adnan Adams, Reporter, Investor/Business Guide
Adongo Carl, Legal Associate, CEPIL
Afua Ansre , Country Coordinator, UN Women
Agnes Asare, Cooperative Member, Glory land Housing Cooperative
Alex Tweneboa, President, GREDA
Alhaji Dawuni, Chief Technical Advisor(rtd), MWRWH
Alhaji Mohammed Shaibu, Municipal Planning Officer, Yendi Municipal Assembly
Alhaji Yahaya Hameed Yakubu, Director for Housing, Ministry of Water Resources Works and Housing.
Alhassan Halid, Member, Ghana Federation for Urban Poor
Alseny Hann, Editor, My Journal Online
Anthony Frederick Mompi, Assistant Planning Officer, Town and Country planning Department
Araba Koomson, Reporter, Joy FM
Augustus Awity, Eastern Regional Coordinating Council, Regional Economic Planning Officer
Bamna Anita, Secretary, Kayaye Youth (Head Porters) Association
Beatrice Agbeko, Leading member, Rising Sun Housing Cooperative
Ben Ayitey Adjin, Economic Analyst, HFC BANK
Benedict Eshun, Sound Person, Ghana Television
Benjamin Addo, Assistant Director, Ministry of Water Resources works and Housing
Benjamin Asamoah, Analyst, Ghana Home Loans
Bernice Naah, Campaign Coordinator, Amnesty International
Bettie Solomon-Ayeh, Head of Structures, Building & Road Research Institute
Boakye-Danquah , Research Assistant, University of Ghana
Bortiorkor N.T. Alabi, Planning Officer, Department of Rural Housing
C. O. Marteye, President, Amui Djor housing cooperative/Ghana Federation for the Urban Poor.
C.N.K Boateng , Individual consultant, Retired Planner
Carmen Ghaly, Program Assistant, UN Women
Cecilia Adjei, Cooperative Member, Gloryland
Cemil Alyanak, Consultant, Cities Alliance
THE FOLLOWING ATTENDED ONE OR MORE OF THE STAKEHOLDER WORKSHOPS
209ANNEX
ANNEX
Charles Boakye, Executive Director, Institute for Infrastructure Development
Charles Bonsu, General Manager, HFC BANK
Chris Pobee Abbey, Architect, MWRWH
Christopher Conduah, , National Development Planning Commission
Claudio Acioly, , UN-HABITAT
Clifford Amoako, Lecturer, Dept of Planning,KNUST
Comfort Sena Fetrie, Reporter, Ghana News Agency
DAN Quaye, Secretary, Tema Housing Cooperative Society Ltd
Daniel Ninson, Chief Construction Officer, Department of Rural Housing
Dansoaa Siaw-Misa, Analyst, Ghana Home Loans
Deborah Kuwornu, Regional Director, Department of Rural Housing
Dorothy Asare-Kumah, PRO, Tema Development Corporation
Dorothy Onny, Director, Ministry of Women & Children’s Affairs
Dorothy Prah, Deputy Director, Habitat for Humanity
Dr B.K Kortatsi, Director, Ministry of Environment Science and Technology
Dr Camynta Baezie, Consultant, MWRWH
Dr. Martin Oteng Ababio, Lecturer, University of Ghana
Edward Amanor, President, ABCECG
Edward Opare, Head of Mortgage Banking , Fidelity Bank
Efua Anyanful, Chief Dev Planning Officer, Ministry of Women & Children’s Affairs
Ellen Oteng Nsiah, Executive Director, Housing the Masses
Emmanuel Abeka, Consultant, Housing Profile
Emmanuel Aryee, Stool Secretary, Ga Traditional Council
Emmanuel Darkwa, Technician Engineer, MWRWH
Emmanuel Kissi, Director, Ministry of Water Resources works and Housing
Erika Mamley Osae, SUF Country Advisor, SUF
Eugene Ofori-Atta, Chairman/Architect, STMA-CSUF, Takoradi
Evelyn Brefo- Boateng, Clerk, Parliamentary Committee
Farideen Zakariah, Development Planner, Housing the Masses
Farouk Braimah, Executive Director, Peoples’ Dialogue/SDI
Felicia Amanor, Member, Ghana Federation for Urban poor
Felicia Opare- Addo, Head of Land Management Unit, SSNIT
Francis Onassis Appoh, Director, Build-Haap Gh Ltd
Francisca Atuluk, Assistant Director, Ministry of Women &Children’s Affairs
Frank Obeng Dapaah, Central Regional coordinating council, Regional Economic Planning Officer
Fredrick Oduro, Director of Programmes, Housing the Masses
210
GHANA HOUSING PROFILE
Gladys Boateng, Camera Person, Ghana Television
Grace Abena Akese, Member, University of Ghana
Grace Osei-Darko, Town Planning Superintendent, Tema Development Corporation
Graham Tipple, Housing Expert, Housing Profile
Hansen Swaniker , Estate Manager-Housing, Tema Development Corporation
Henry Mensah, Executive Officer, MWRWH
Hon. David Oppon-Kusi, Member of Parliament, Parliament
Hon. Alban S.K Bagbin, Minister, Ministry of Water Resources Works and Housing
Hon. David T. Assumeng, Chairman, Parliamentary Committee on Housing
Hon. Jonathan Tackie-Komme, Member of Parliament, Parliament/GAMADA
Hon. Mustapha Ahmed, Deputy Minister, Ministry of Water Resources Works and Housing
Hon. Nana Abu - Bonsra, Member of Parliament/Deputy Ranking Member, Parliament
Hubert Osei, Reporter, TV3
Ibrahim Gariba, Assistant Clerk, Parliamentary Committee on Works and Housing
Ing. J.B.Essilfie, Member, Ghana Institution of Engineers
Irene Appeaning Addo, Consultant, Housing Profile
Isaac Kodobisah, Municipal Chief Executive, Ho Municipal Assembly
Isaac Segbawu, Planner, Housing the Masses
Issah Zakaria, Municipal Chief Executive, Yendi Municipal Assembly
J.T Odamety, Deputy Director, survey, Survey and Mapping Division
Jacob Ntiamoah, Planning Officer, Sekondi/Takoradi Metropolitan Assembly
Jane Frimpong, Clerk, Parliamentary Committee on Works and Housing
Janet Adu, Member, Ghana Federation for Urban Poor
Jessie Ababio Danquah, PRO, Ministry of Water Resources Works and Housing
Joann Ofori, National Coordinator, Ghana Women Land Access Trust
Joe Abbey, Managing Director, Tema Development Corporation
John Tettey, Deputy Director for Housing, Ministry of Water Resources works and Housing
Jonathan Russi Boyenne, Managing director, Swiftform Systems Limited
Kamil Kamaluddeen, Country Director, UNDP
Ketor Kenneth Yaoh , Assistant Planning Officer, Accra Metropolitan Assembly
Kingsley Asare, Reporter, Ghanaian Times
Kuukua Ankah- Baiden, Reporter, Ghana Television
Kwadwo Ohene Sarfoh, Consultant, Housing Profile
Kwadwo Twumasi, Executive Director, Community Action for Rural Poverty Eradication
Kwadwo Yeboah, Senior Planner, Ministry of Local Government and Rural Dev’t
Kwesi Randolph Johnson, Community Development Coordinator, Friends of the Nation
211ANNEX
ANNEX
Lawrence Amesu, Director, Amnesty International
Leticia Osei Fosu, President, Glory land housing cooperative
Levina Owusu, Director, Ministry of Local Government and Rural Dev’t
Linda Amofa, Operations Officer, GAWLAT
Longman Attakumah, Director for Research, Ministry of Water Resources Works and Housing
Louis Lawerteh, Quantity Surveyor, Ministry of Water Resources Works and Housing
Lydia Ablorh, Assistant Treasurer, Tema Housing Cooperative Society Ltd.
Mariwan Fuseini, Quantity Surveyor , MWRWH
Mark Ankrah, Managing Director, State Housing company
Martin Oteng Ababio, Consultant, Housing Profile
Mary Mensah, Journalist, Daily Graphic
Mary-Ann Atule, Reporter, GBC Radio
Mathew Taabaziing, Rent Officer, Rent Control
Mensah Owusu, Program Coordinator, Peoples’ Dialogue on Human Settlements
Mercy Asante, Registrar, Ga Traditional Council
Michael Nartey, Project finance Officer, Amalgamated Bank
Mohammed A. Karim, Deputy Director, Ministry of Water Resources Works and Housing
Mohammed Alhassan, Planner, Town and Country Planning Department
Mr. Tweneboa, Director, Ministry of Lands and Forestry
Munirat Tawiah, Capacity Building Assistant, CHF International
Naa Arde-Acquah, Member, Ghana Federation for Urban Poor
Nii Ako Adjei, PRO, MWRWH
Nii Okaija III, Gbese Mantse(Chief), Ga Traditional Council
Nii Teiko Tagoe, Director, Gamashie Development Agency (GAMADA)
Osei Agyeman, President, Ghana Institute of Architects
Osei Eghan, Assets Manager., Ghana Water Company
Pat Gbeze, Photographer, Ghana News Agency
Priscilla O.Ansah, Reporter, GBC Radio
Prof Jacob Songsore, Senior Lecturer, University of Ghana
R.N.A Annan, Elder, Gbese Traditional Area
Rita Agorsu-Manison, Executive Officer, Rent control
Rita Ayensu-Morrison, Executive Officer, Rent control
Rockson Akugre, Legal Associate, CEPIL
Rose Mensah, Cooperative Member, Rising sun
Roseline Abban, Photo Journalist, Daily Graphic
Rosemary Owusu-Dwamena, Institute of Local Government Studies, Research Assistant
212
GHANA HOUSING PROFILE
Rosemond Woode., Member, Rising Sun
S. F Mensah, lighting, Ghana Television
Salifu Fuseini, Member, Kayaye Youth (Head Porters) Association
Salomey Hammond, Member, Ghana Federation for Urban Poor
Sam Anyang Kusi, Consultant, Cities Alliance
Samuel Agyemang, Reporter/Journalist, Metro TV
Samuel Banleman Biitir, Consultant, Housing Profile
Samuel Seth Passah, Assist Development Planning Officer, Volta Regional coordinating council
Sebastian Syme, Reporter, Graphic
Solomon Bonney, Executive Secretary, Public Servants Housing Loan Scheme Board
Stella Ackwerh, Principal Land Registrar, Land Registration Division, Lands Commission
Stella Arthiaba, Ag. Registrar, Architect Registration Council
Stephen Boadi, Cameraman, TV3
Steve Akuffo, Board Chair, State Housing Company, Principal Architect, Akuffo and Associates
Sylvester Gabianu, Institutional Support Manager, CHF International
Tally Asiedu, Reporter, Information Service Department
Theresa Tufuor, Dep. Director for Housing, Ministry of Water Resources Works and Housing
Thomas B. Doota, Student Planner , Univ of Dev. Studies, Tamale
Thomas Kojo Orhin, Senior Quantity Surveyor, Ghana Cocoa Board
Victoria Abankwa, , UN-HABITAT
Vivian Amegbezi, Member, Rising Sun
William Osei Asiedu, Physical Planner, Tema Development Corporation
Yakubu Ibrahim, Researcher/Student, University of Ghana
Yaw Boye, Soundman, TV3
Zikirus Sulley Shittu, Town Planning Officer, TCPD, Tamale

GO
US
GO
(United Nations Human Settlements Programme (UN-HABITATP.O. Box 30030, Nairobi 00100, KENYATel: +254 20 762 3120 Website: www.unhabitat.org
European Commission