Housing plus transportation affordability indices: uses ...
46
Housing plus transportation affordability indices: uses, opportunities, and challenges OECD round-table on income inequality, social inclusion, and mobility (Paris, 2016 April) Erick Guerra & Mariel Kirschen University of Pennsylvania
Transcript of Housing plus transportation affordability indices: uses ...
Housing plus transportation affordability indices: uses, opportunities, and challenges
OECD round-table on income inequality, social inclusion, and mobility (Paris, 2016 April)
Erick Guerra & Mariel Kirschen
University of Pennsylvania

Presentation Outline
1. The relationship between transportation and housing costs
2. The H+T Adorability Index: estimation and policy uses
3. H+T challenges and critiques
4. Application to Mexico City
5. Transferability to other OECD countries

Housing values and distance to CBD

VMT and distance to CBD

The H+T Affordability Index
• Housing affordability: < 30% of income spent on housing
• H+T affordability: <45% of income spent on housing and transportation

The H+T Affordability Index

The H+T Affordability Index

The H+T Affordability Index

H+T Calculation

The H+T Affordability Index: calculation

The H+T Affordability Index: calculation
𝐻𝐻𝐻𝐻𝐻𝐻𝐻𝐻𝐻𝐻𝐻𝐻𝐻𝐻𝐻𝐻𝐻 𝑇𝑇𝑇𝑇𝑇𝑇𝑇𝑇𝑇𝑇𝐻𝐻𝑇𝑇𝑇𝑇𝑇𝑇𝑇𝑇𝑇𝑇𝐻𝐻𝑇𝑇 𝐶𝐶𝐻𝐻𝐻𝐻𝑇𝑇𝐻𝐻 𝐶𝐶𝐴𝐴𝐴𝐴 ∗ 𝐹𝐹𝐴𝐴𝐴𝐴 𝑋𝑋 + 𝐶𝐶𝐴𝐴𝐴𝐴 ∗ 𝐹𝐹𝐴𝐴𝐴𝐴 𝑋𝑋 + 𝐶𝐶𝑇𝑇𝐴𝐴 ∗ 𝐹𝐹𝑇𝑇𝐴𝐴 𝑋𝑋
Where: C is the cost factor (i.e. dollars per mile) F is a function of the independent variables (𝐹𝐹𝐴𝐴𝐴𝐴 is auto ownership, 𝐹𝐹𝐴𝐴𝐴𝐴 is auto use, 𝐹𝐹𝑇𝑇𝐴𝐴 is transit use)

The H+T Affordability Index: overview
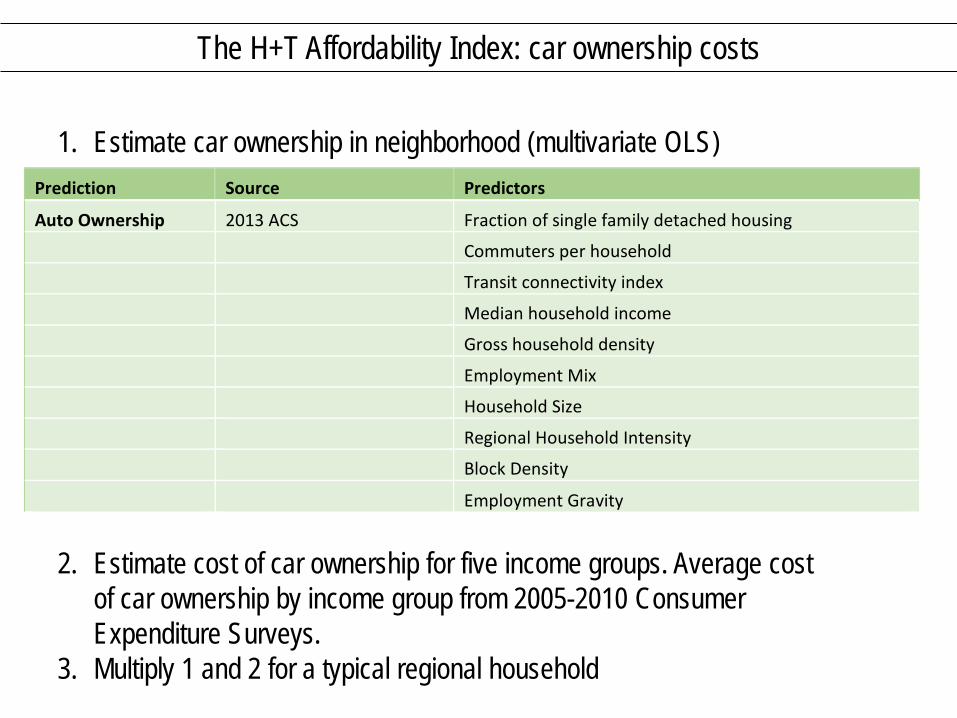
The H+T Affordability Index: car ownership costs
1. Estimate car ownership in neighborhood (multivariate OLS)
2. Estimate cost of car ownership for five income groups. Average cost of car ownership by income group from 2005-2010 Consumer Expenditure Surveys.
3. Multiply 1 and 2 for a typical regional household
Prediction Source Predictors
Auto Ownership 2013 ACS Fraction of single family detached housing
Commuters per household
Transit connectivity index
Median household income
Gross household density
Employment Mix
Household Size
Regional Household Intensity
Block Density
Employment Gravity
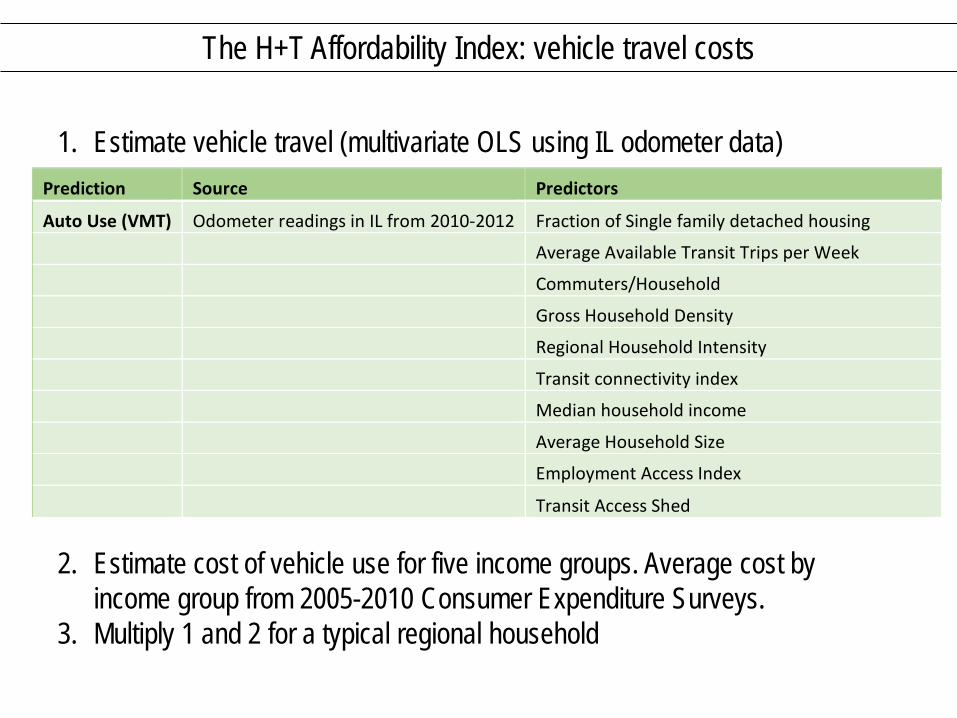
The H+T Affordability Index: vehicle travel costs
1. Estimate vehicle travel (multivariate OLS using IL odometer data)
2. Estimate cost of vehicle use for five income groups. Average cost by income group from 2005-2010 Consumer Expenditure Surveys.
3. Multiply 1 and 2 for a typical regional household
Prediction Source Predictors
Auto Use (VMT) Odometer readings in IL from 2010-2012 Fraction of Single family detached housing
Average Available Transit Trips per Week
Commuters/Household
Gross Household Density
Regional Household Intensity
Transit connectivity index
Median household income
Average Household Size
Employment Access Index
Transit Access Shed

The H+T Affordability Index: transit costs
1. Estimate percent commuting to work by transit (multivariate regression)
2. Match fare revenue data from National Transit Database to block groups based on GTFS station/stop data.
3. Divide total fare revenues from a block group by households in block group
Prediction Source Predictors
Transit Use 2013 ACS Regional Household Intensity
(% public transportation commuters) Transit Connectivity
Employment Access Index
Employment Mix Index
Fraction of single family detached housing
Transit Access Shed
Transit Access Shed Jobs
Median Household Income
Average Available Transit Trips per Week
Average Household Size

H+T and Public Policy

Planners
• Chicago - Metropolitan Panning Council (MPC) used H+T index data in a “corridor selection analysis” to determine potential BRT locations
• Chicago Metropolitan Agency for Planning (CMAP) used suggested H+T index standard as their livability measure in their GO TO 2040 comprehensive regional plan.
• Ohio –Living Cities sponsored the CNT and the Ohio Governor’s office to use the tool for suggestions for state urban revitalization strategies to reduce cost of living in Cincinnati, Cleveland, and Columbus.
• Washington, DC – Office of Planning worked with CNT on a custom H+T index that integrated market-rate housing costs and local land-use and transit network data.
Source: CNT website

Housing professionals
• Minneapolis-St.Paul; Washington, DC; Boston; San Francisco Bay Area – Partnered with the Urban Land Institute (ULI), CNT developed customized calculators that could both compare neighborhood costs and direct transportation choices.
• Santa Fe, NM – Local housing nonprofit uses a tailored Index platform to inform prospective homeowners about location efficiency and how to manage transportation costs in order to save for homeownership.
• San Francisco, CA – The Metropolitan Transportation Commission (MTC) gave credit to the Index for the establishment of the Bay Area Transit Oriented Affordable Housing Fund.
• Center for Housing Policy – Research with CNT concerning struggles of moderate-income households to tackle hidden factors that threaten affordability of housing and transportation.
Source: CNT website

Policy Makers
• State of Illinois – The 45% affordability measure adopted into law with
bipartisan support to be used by five government agencies for both financing and siting decisions.
• El Paso, TX – City Council adopted 50% H+T affordability standard for City funding and policy decisions.
• Low Income Housing Tax Credit Allocations

Policy Makers
• Department of Housing and Urban Development (HUD) - Sustainable Communities Initiative grants to support sustainable development projects.

The H+T Affordability Index: shaping affordability narratives

Critiques and Challenges
What does affordability mean?
• Threshold somewhat arbitrary (a week’s wage for a month’s rent) • Index does not consider other expenses that vary with location
like schools and groceries. • Index ignore household size, age, composition, and life-stage
considerations (earnings vs. wealth vs. earnings potential). • Index ignores variation in household preferences
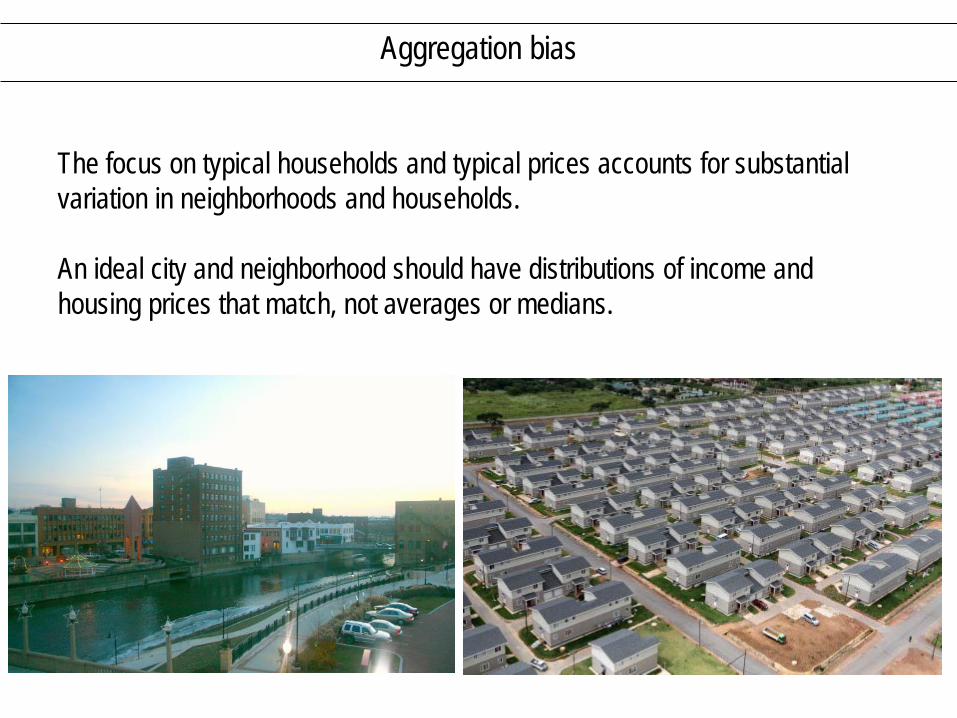
Aggregation bias
The focus on typical households and typical prices accounts for substantial variation in neighborhoods and households. An ideal city and neighborhood should have distributions of income and housing prices that match, not averages or medians.

Challenges and critiques: VMT estimation
.

The high cost of new construction
New construction is expensive. Absent deep subsidies, focusing new construction around transit is unlikely to reduce housing and transportation expenditures for vulnerable households.

Fair housing vs. affordable housing
Texas Department of Housing and Community Affairs v. The Inclusive Communities Project, Inc.
H+T in Mexico City

National data and Mexico City overview
How readily could a housing and transportation affordability index be applied to Mexico and Mexico City? • Data available on household expenditures • Insufficient data on car ownership, transit use, and VMT • Rely on 2007 Mexico City household travel survey • Focus on households that did not drive on survey day (roughly two-thirds)

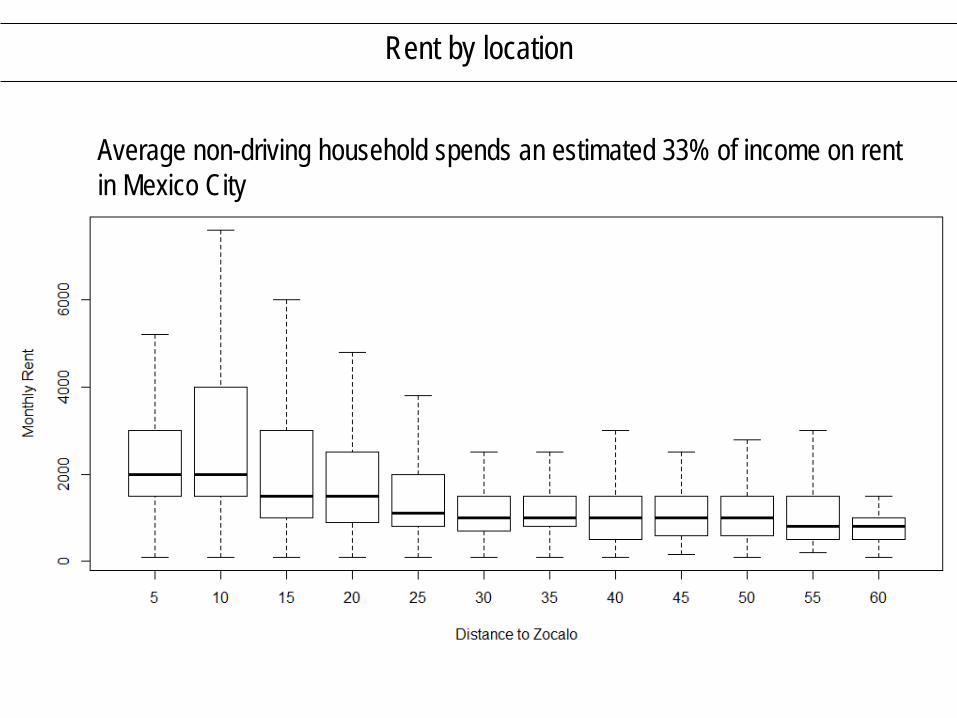
Rent by location
Average non-driving household spends an estimated 33% of income on rent in Mexico City

Transit expenditures by location
Average non-driving household spends an 15% of income on transit expenditures in Mexico City

Percent of rent burdened households by municipality
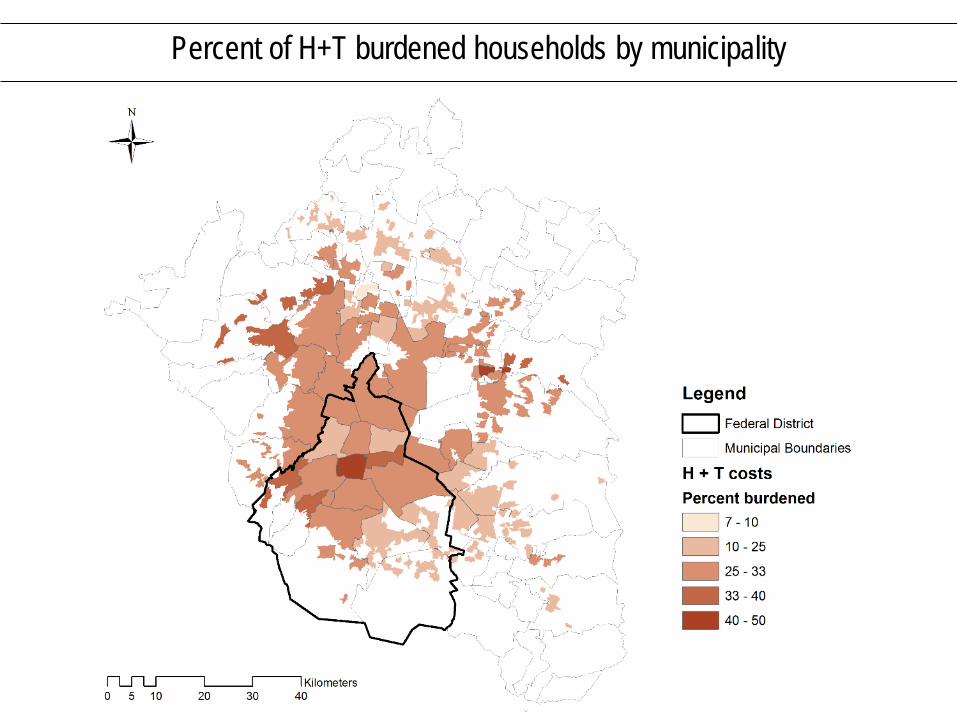
Percent of H+T burdened households by municipality

Housing affordable municipalities for 25th percentile income household

H+T affordable municipalities for 25th percentile income household

Percent affordable for 25th percentile income household

Percent H+T affordable for 25th percentile income household

Summary of findings
• Possible to apply an H+T index in a place like Mexico City with relative ease (at least when excluding car expenses).
• More transit-friendly central locations appear relatively more affordable when accounting for travel costs as well as housing costs.
• Since Mexico is the poorest of the OECD countries and the US is one of the wealthiest, these findings likely extend to the rest of the OECD.
• Shortage of the necessary data makes it difficult to extend this analysis beyond the Mexico City to the rest of the country.

Housing policy takeaway
• Between 1995 and 2005, public agencies funded 75% of all housing loans by value—and even more by volume—in Mexico
• Most in peripheral locations • Higher car ownership and driving than nearby informal settlements despite
similar incomes
Los Héroes de Ecatepec, 25km northeast of downtown (Erick Guerra, 2012)
Traditional
Development Subsidized
Development Mean Mean Cars per household 0.41 0.62 Average daily VKT 6.2 15.8 Monthly income (in pesos) $7,617 $8,725 People per hectare in Census Tract 109 204
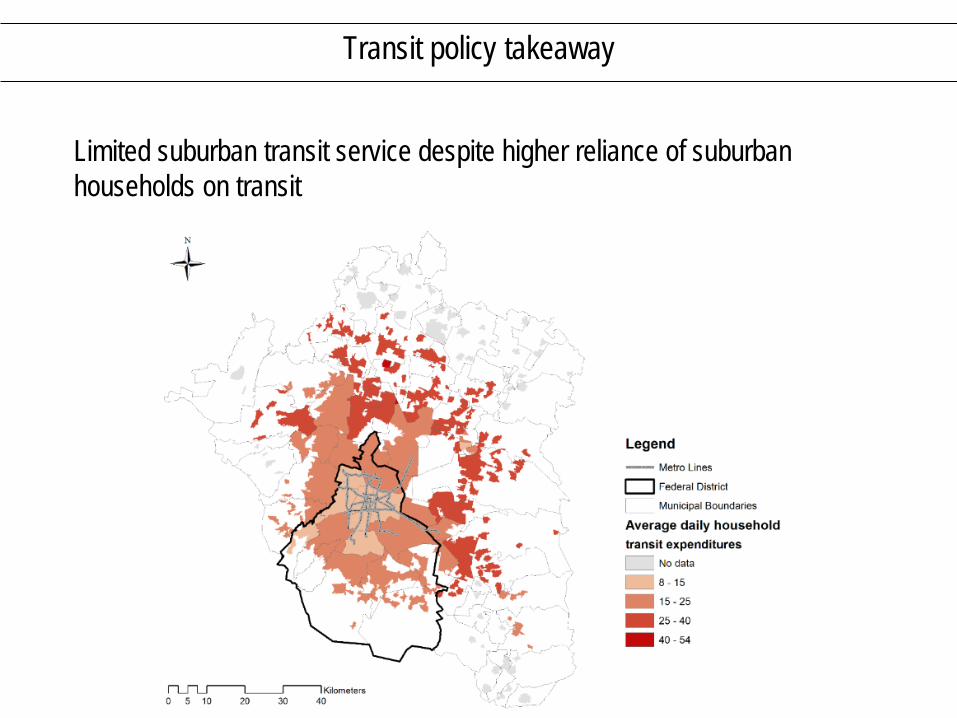
Transit policy takeaway
Limited suburban transit service despite higher reliance of suburban households on transit
Concluding Remarks on Transferability

Potential for H+T index in other OECD nations
1. Strengthen the public and policy makers’ understanding of which countries, cities, and regions are most affordable.
2. Encourage bank lending and the construction of affordable housing in neighborhoods with higher land costs but lower transportation costs.
3. Focus transit investments in a way that could help to reduce the amount that poorer households spend on transportation.

Transfer challenges: context
Relationship between transportation costs and housing location varies in different contexts. 1. Wealthy households in Mexico City generally opt to live in transit
accessible areas but own and use cars. 2. May make central locations look less affordable to poor and
moderate-income households than they actually are. 3. Similar differences when comparing American and European cities
(Brueckner et al. 1999). 4. US’s local control and financing of public school districts almost
certainly also leads to substantial differences in housing markets when compared to other countries.

Transfer challenges: data
1. Data not always available or comes in a different form in different countries
2. No single methodology can or should be applied to all OECD countries and regions.
3. Estimating the costs of vehicle travel is likely most problematic.

Thank you