Household Preparedness for Public Health … R. Spriggs, Terraye M. Starr Visual Information...
20
INSIDE 720 Assessment of Household Preparedness Through Training Exercises — Two Metropolitan Counties, Tennessee, 2011 723 Tuberculosis Genotyping — United States, 2004–2010 726 Notes from the Field: Highly Pathogenic Avian Influenza A (H7N3) Virus Infection in Two Poultry Workers — Jalisco, Mexico, July 2012 728 Announcement 729 QuickStats Continuing Education examination available at http://www.cdc.gov/mmwr/cme/conted_info.html#weekly. Populations affected by disaster increase the demand on emergency response and public health systems and on acute care hospitals, often causing disruptions of services ( 1). Household preparedness measures, such as having a 3-day supply of food, water, and medication and a written household evacuation plan, can improve a population’s ability to cope with service disruption, decreasing the number of persons who might otherwise overwhelm emergency services and health-care systems (2). To estimate current levels of self-reported house- hold preparedness by state and sociodemographic characteris- tics, CDC analyzed Behavioral Risk Factor Surveillance System (BRFSS) survey data collected in 14 states during 2006–2010. The results of this analysis indicated that an estimated 94.8% of households had a working battery-operated flashlight, 89.7% had a 3-day supply of medications for everyone who required them, 82.9% had a 3-day supply of food, 77.7% had a working battery-operated radio, 53.6% had a 3-day supply of water, and 21.1% had a written evacuation plan. Non-English speaking and minority respondents, particularly Hispanics, were less likely to report household preparedness for an emergency or disaster, suggesting that more outreach activities should be directed toward these populations. BRFSS is a state-based, random-digit–dialed telephone survey of the noninstitutionalized U.S. civilian population aged ≥18 years.* The survey collects information on health risk behaviors, preventive health practices, health-care access, and disease status. The General Preparedness module was included in BRFSS surveys conducted by 14 states during 2006–2010. Two states, Nebraska and Montana, collected data for multiple years. Comparison of data collected by these two states showed no significant increases or decreases in preparedness measures over time. Therefore, data for Nebraska and Montana were combined across years. Significance of differences between percentages was determined by chi-square test (p<0.05). During 2006–2010, preparedness data were collected (with Council of American Survey and Research Organizations response rates indicated) from the following states: 2006, Connecticut (44.3%), Montana (54.8%), Nevada (50.1%), and Tennessee (56.7%); 2007, Delaware (43.2%), Louisiana (41.0%), Maryland (31.4%), Nebraska (65.4%), and New Hampshire (37.7%); 2008, Georgia (55.1%), Montana (48.3%), Nebraska (65.5%), New York (40.0%), and Pennsylvania (45.6%); 2009, Mississippi (49.3%); and 2010, Montana (65.4%) and North Carolina (41.1%). Household disaster preparedness measures, as defined by the BRFSS questionnaire, included the following items: having 3-day supplies of food, prescription medications, and water, a written evacuation plan, a working battery-powered radio, and a working battery-powered flashlight. Respondents were asked the following six questions: 1) “Does your household have a 3-day supply of nonperishable food for everyone who lives there? By nonperishable we mean food that does not require refrigeration or cooking.” 2) “Does your household have a 3-day supply of water for everyone who lives there? A * Additional information available at http://www.cdc.gov/brfss. Household Preparedness for Public Health Emergencies — 14 States, 2006–2010 U.S. Department of Health and Human Services Centers for Disease Control and Prevention Morbidity and Mortality Weekly Report Weekly / Vol. 61 / No. 36 September 14, 2012
Transcript of Household Preparedness for Public Health … R. Spriggs, Terraye M. Starr Visual Information...

INSIDE720 Assessment of Household Preparedness Through
Training Exercises — Two Metropolitan Counties, Tennessee, 2011
723 Tuberculosis Genotyping — United States, 2004–2010
726 Notes from the Field: Highly Pathogenic Avian Influenza A (H7N3) Virus Infection in Two Poultry Workers — Jalisco, Mexico, July 2012
728 Announcement 729 QuickStats
Continuing Education examination available at http://www.cdc.gov/mmwr/cme/conted_info.html#weekly.
Populations affected by disaster increase the demand on emergency response and public health systems and on acute care hospitals, often causing disruptions of services (1). Household preparedness measures, such as having a 3-day supply of food, water, and medication and a written household evacuation plan, can improve a population’s ability to cope with service disruption, decreasing the number of persons who might otherwise overwhelm emergency services and health-care systems (2). To estimate current levels of self-reported house-hold preparedness by state and sociodemographic characteris-tics, CDC analyzed Behavioral Risk Factor Surveillance System (BRFSS) survey data collected in 14 states during 2006–2010. The results of this analysis indicated that an estimated 94.8% of households had a working battery-operated flashlight, 89.7% had a 3-day supply of medications for everyone who required them, 82.9% had a 3-day supply of food, 77.7% had a working battery-operated radio, 53.6% had a 3-day supply of water, and 21.1% had a written evacuation plan. Non-English speaking and minority respondents, particularly Hispanics, were less likely to report household preparedness for an emergency or disaster, suggesting that more outreach activities should be directed toward these populations.
BRFSS is a state-based, random-digit–dialed telephone survey of the noninstitutionalized U.S. civilian population aged ≥18 years.* The survey collects information on health risk behaviors, preventive health practices, health-care access, and disease status. The General Preparedness module was included in BRFSS surveys conducted by 14 states during 2006–2010. Two states, Nebraska and Montana, collected data for multiple years. Comparison of data collected by these two states showed no significant increases or decreases in preparedness measures over time. Therefore, data for Nebraska and Montana were combined across years. Significance of differences between percentages was determined by chi-square test (p<0.05).
During 2006–2010, preparedness data were collected (with Council of American Survey and Research Organizations response rates indicated) from the following states: 2006, Connecticut (44.3%), Montana (54.8%), Nevada (50.1%), and Tennessee (56.7%); 2007, Delaware (43.2%), Louisiana (41.0%), Maryland (31.4%), Nebraska (65.4%), and New Hampshire (37.7%); 2008, Georgia (55.1%), Montana (48.3%), Nebraska (65.5%), New York (40.0%), and Pennsylvania (45.6%); 2009, Mississippi (49.3%); and 2010, Montana (65.4%) and North Carolina (41.1%).
Household disaster preparedness measures, as defined by the BRFSS questionnaire, included the following items: having 3-day supplies of food, prescription medications, and water, a written evacuation plan, a working battery-powered radio, and a working battery-powered flashlight. Respondents were asked the following six questions: 1) “Does your household have a 3-day supply of nonperishable food for everyone who lives there? By nonperishable we mean food that does not require refrigeration or cooking.” 2) “Does your household have a 3-day supply of water for everyone who lives there? A
* Additional information available at http://www.cdc.gov/brfss.
Household Preparedness for Public Health Emergencies — 14 States, 2006–2010
U.S. Department of Health and Human ServicesCenters for Disease Control and Prevention
Morbidity and Mortality Weekly ReportWeekly / Vol. 61 / No. 36 September 14, 2012
hxv5
Text Box
Please note: An erratum has been published for this issue. To view the erratum, please click here.

Morbidity and Mortality Weekly Report
714 MMWR / September 14, 2012 / Vol. 61 / No. 36
The MMWR series of publications is published by the Office of Surveillance, Epidemiology, and Laboratory Services, Centers for Disease Control and Prevention (CDC), U.S. Department of Health and Human Services, Atlanta, GA 30333.Suggested citation: Centers for Disease Control and Prevention. [Article title]. MMWR 2012;61:[inclusive page numbers].
Centers for Disease Control and PreventionThomas R. Frieden, MD, MPH, Director
Harold W. Jaffe, MD, MA, Associate Director for ScienceJames W. Stephens, PhD, Director, Office of Science Quality
Stephen B. Thacker, MD, MSc, Deputy Director for Surveillance, Epidemiology, and Laboratory ServicesStephanie Zaza, MD, MPH, Director, Epidemiology and Analysis Program Office
MMWR Editorial and Production StaffRonald L. Moolenaar, MD, MPH, Editor, MMWR Series
John S. Moran, MD, MPH, Deputy Editor, MMWR SeriesTeresa F. Rutledge, Managing Editor, MMWR Series
Douglas W. Weatherwax, Lead Technical Writer-EditorDonald G. Meadows, MA, Jude C. Rutledge, Writer-Editors
Martha F. Boyd, Lead Visual Information Specialist
Maureen A. Leahy, Julia C. Martinroe, Stephen R. Spriggs, Terraye M. Starr
Visual Information SpecialistsQuang M. Doan, MBA, Phyllis H. King
Information Technology Specialists
MMWR Editorial BoardWilliam L. Roper, MD, MPH, Chapel Hill, NC, Chairman
Matthew L. Boulton, MD, MPH, Ann Arbor, MIVirginia A. Caine, MD, Indianapolis, IN
Jonathan E. Fielding, MD, MPH, MBA, Los Angeles, CADavid W. Fleming, MD, Seattle, WA
William E. Halperin, MD, DrPH, MPH, Newark, NJKing K. Holmes, MD, PhD, Seattle, WADeborah Holtzman, PhD, Atlanta, GATimothy F. Jones, MD, Nashville, TN
Dennis G. Maki, MD, Madison, WIPatricia Quinlisk, MD, MPH, Des Moines, IA
Patrick L. Remington, MD, MPH, Madison, WIJohn V. Rullan, MD, MPH, San Juan, PR
William Schaffner, MD, Nashville, TNDixie E. Snider, MD, MPH, Atlanta, GA
John W. Ward, MD, Atlanta, GA
3-day supply of water is 1 gallon of water per person per day.” 3) “Does your household have a 3-day supply of prescription medications for each person in your household who takes prescription medications?” 4) “Does your household have a working battery-operated radio and working batteries for use if the electricity is out?” 5) “Does your household have a working flashlight and working batteries for use if the electricity is out?” 6) “Does your household have a written evacuation plan for how you will leave your home in case of a large-scale disaster or emergency that requires evacuation?”
Overall, an estimated 94.8% of households had a work-ing battery-operated flashlight, 89.7% had a 3-day supply of medications for everyone who required them, 82.9% had a 3-day supply of food, 77.7% had a working battery-operated radio, 53.6% had a 3-day supply of water, and 21.1% had a written evacuation plan (Table 1). With the exception of hav-ing a 3-day supply of medication and a written evacuation plan, which were not significantly different by sex, men were significantly more likely than women to report their house-holds were prepared. Significant differences ranged from 1.6 percentage points (95.6% compared with 94.0%) for having a working, battery-powered flashlight to 6.9 percentage points (57.2% compared with 50.3%) for having a 3-day supply of water (Table 1). By race/ethnicity, Hispanics were significantly less likely than all other race/ethnicities to have a 3-day sup-ply of food (75.0%), a 3-day supply of medication (69.0%), and a working battery-operated radio (67.1%), and flashlight
(84.4%). In general, as the age of respondents increased, reported household preparedness increased. With the excep-tions of having a 3-day supply of water and a written evacuation plan, persons with a high school diploma were more likely to indicate preparedness than those with less than a high school diploma. With the exception of having a written evacuation plan, which was most prevalent among respondents who were unable to work, in general, retired respondents were most likely to indicate that their household was prepared.
Respondents who requested that the survey be conducted in Spanish (68.2%) were less likely to report their households had a 3-day supply of food than those administered the survey in English (83.2%) (Figure). A similar pattern was observed for having a 3-day supply of medication (Spanish, 51.7%; English, 90.6%), a working battery-operated radio (Spanish, 56.5%; English, 78.1%), and a working battery-operated flashlight (Spanish, 74.7%; English, 95.2%). However, respondents who requested the survey be conducted in Spanish were significantly more likely to report their households had a 3-day supply of water (Spanish, 64.5%; English, 53.6%) and were as likely as those interviewed in English to report that the household had a written evacuation plan (Spanish, 25.6%; English, 20.6%; p=0.066).
By state, Montana respondents were most likely (88.1%) and Nevada respondents were least likely (78.5%) to report their household had a 3-day supply of food (Table 2). Pennsylvania respondents were most likely (93.7%) and Nevada respon-dents were least likely (80.7%) to report a 3-day supply of

Morbidity and Mortality Weekly Report
MMWR / September 14, 2012 / Vol. 61 / No. 36 715
medication. Louisiana respondents were most likely (67.1%) and Nebraska respondents were least likely (45.5%) to report a 3-day supply of water. Louisiana respondents were most likely (54.0%) and Pennsylvania respondents were least likely (15.0%) to have a written evacuation plan. Louisiana respon-dents were most likely (85.2%) and Nevada respondents were least likely (72.3%) to report a working battery-powered radio. New Hampshire respondents were most likely (97.2%) and
New York respondents were least likely (93.4%) to report a working battery-powered flashlight.
Reported by
Summer D. DeBastiani MPH, Tara W Strine, PhD, Office of Public Health Preparedness and Response, CDC. Corresponding contributor: Summer D. DeBastiani, [email protected], 404-639-3101.
0
20
40
60
80
100
120
3-day supply of food
3-day supply of prescription
medication
3-day supply of water
Written evacuation
plan
Working battery-operated
radio
Working battery-operated�ashlight
English Spanish
Preparedness measure
Perc
enta
ge
*
FIGURE. Percentage of participants reporting household disaster or emergency preparedness, by preparedness measure and language used in the interview — Behavioral Risk Factor Surveillance System, 14 states, 2006–2010
* 95% confidence interval.
BOX. Recommendations to prepare a household for emergency or disaster — Federal Emergency Management Agency, 2012
Be informedKnowing about the local emergency plans for shelter and
evacuation and local emergency contacts will help you develop your household plan and also will aid you during a crisis.
Make a kitA disaster supplies kit is simply a collection of basic items
your household might need in the event of an emergency.•Water, 1 gallon of water per person per day for at least 3
days, for drinking and sanitation.• Food, at least a 3-day supply of nonperishable food.
• At least a 3-day supply of medications for each person who takes prescription medications.
• Battery-powered or hand crank radio and a National Oceanic Atmospheric Administration weather radio with tone alert and extra batteries for both.
• Flashlight and extra batteries.
Have a planEmergency planning should address the care of pets, aiding
family members with access and functional needs and safely shutting off utilities. Practice your plan at least twice a year and update it according to any issues that arise.
Source: Federal Emergency Management Agency. Ready. Washington, DC: Federal Emergency Management Agency; 2012. Available at http://www.ready.gov.

Morbidity and Mortality Weekly Report
716 MMWR / September 14, 2012 / Vol. 61 / No. 36
Editorial Note
Similar to previous studies, the findings in this report generally indicate increased levels of disaster and emergency preparedness among men, English-speaking persons, and adults with more education (3,4). Also similar to previous research, this analysis indicates limited evacuation planning among households (3,4). With the notable exception of Louisiana, where in 2007, 2 years after devastating Hurricane Katrina, 54.0% of respondents said they had a written evacuation plan, no state reported a prevalence as high as 35%. Therefore, increased efforts encouraging the adoption of a written house-hold evacuation plan are needed.
Beginning in 2003, the federal government launched two preparedness campaigns for the purpose of increasing house-hold preparedness: Ready.gov and the Citizen Corps (5,6). Both campaigns encourage the general population to prepare for disasters by being informed, assembling an emergency kit, and having a plan (Box). Ready.gov is an Internet-based disas-ter preparedness initiative, and the Citizen Corps encourages government and community leaders to involve the general population in all-hazards emergency preparedness activities (5,6). The primary method to access preparedness materials and information through these organizations is via predomi-nantly English language websites, creating a possible barrier for non-English speaking adults, persons of low socioeconomic
TABLE 1. Percentage of participants reporting household disaster or emergency preparedness, by preparedness measures and sociodemographic characteristics — Behavioral Risk Factor Surveillance System, 14 states, 2006–2010
Characteristic
Have a 3-day supply of food Have a 3-day supply of medication Have a 3-day supply of water
No. in sample
Weighted no. % (95% CI)
No. in sample
Weighted no. % (95% CI)
No. in sample
Weighted no. % (95% CI)
Overall 83,965 49,939,735 82.9 (82.4–83.5) 80,351 47,083,817 89.7 (89.2–90.1) 55,323 32,222,914 53.6 (52.9–54.3)
Sex Men 31,975 24,297,666 84.2 (83.3–85.0) 29,855 22,484,121 90.2 (89.4–90.9) 22,374 16,514,103 57.2 (56.1–58.3)Women 51,990 25,642,069 81.8 (81.1–82.5) 50,496 24,599,696 89.2 (88.6–89.8) 32,949 15,708,811 50.3 (49.4–51.1)
Race/Ethnicity*White 79,764 38,059,253 84.8 (84.2–85.4) 67,007 36,730,925 92.8 (92.4–93.2) 44,179 23,349,524 52.1 (51.3–52.9)Black 7,889 6,322,382 77.9 (76.1–79.5) 7,423 5,726,674 82.6 (81.0–84.2) 6,078 4,733,017 58.2 (56.3–60.2)Hispanic 2,262 2,744,511 75.0 (71.6–78.1) 1,849 2,060,575 69.0 (65.1–72.7) 1,715 2,025,186 55.0 (51.4–58.7)Other race/Multirace 3,753 2,365,541 78.7 (75.5–81.6) 3,378 2,159,139 84.9 (81.7–87.6) 2,789 1,780,008 60.4 (57.0–63.7)
Age group (yrs)18–24 2,576 4,683,190 79.7 (77.1–82.1) 2,102 3,918,690 79.8 (76.9–82.4) 1,689 3,088,207 53.1 (50.0–56.3)25–34 7,241 8,345,572 77.8 (76.1–79.5) 5,871 7,000,146 83.7 (82.0–85.3) 4,294 5,202,686 48.4 (46.5–50.4)35–44 12,053 10,274,805 80.8 (79.5–82.1) 10,610 9,310,066 87.7 (86.5–88.9) 7,251 6,166,027 48.6 (47.0–50.2)45–54 16,863 9,621,520 83.5 (82.5–84.5) 15,961 9,248,143 90.5 (89.6–91.3) 10,821 6,093,993 52.9 (51.6–54.3)
≥55 44,575 16,673,720 87.9 (87.4–88.5) 45,192 17,268,658 95.8 (95.4–96.1) 30,764 11,402,504 60.2 (59.4–61.1)Education
Less than a high school diploma
7,910 4,316,121 80.0 (78.0–81.8) 7,632 3,831,918 79.3 (77.0–81.3) 6,013 3,199,648 59.7 (57.4–61.9)
High school diploma 26,255 15,048,742 83.8 (82.8–84.7) 25,123 13,965,053 88.3 (87.3–89.1) 17,666 10,206,329 57.0 (55.7–58.2)More than a high
school diploma49,670 30,516,047 83.0 (82.3–83.7) 47,472 29,231,941 92.0 (91.4–92.5) 31,535 18,764,811 51.0 (50.2–51.9)
Employment statusCurrently employed 43,599 30,335,878 82.4 (81.7–83.2) 39,696 27,434,623 88.7 (88.0–89.4) 27,586 18,994,551 51.7 (50.7–52.6)Unemployed 3,409 2,686,613 78.5 (75.4–81.2) 3,135 2,500,045 84.9 (82.1–87.3) 2,346 1,834,715 53.5 (50.2–56.8)Retired 23,643 8,673,886 89.2 (88.4–89.9) 24,209 9,107,235 96.5 (96.1–96.9) 16,496 6,092,790 62.9 (61.7–64.0)Unable to work 5,568 2,619,215 78.4 (76.2–80.5) 6,106 2,895,877 89.2 (87.4–90.7) 4,028 1,852,808 55.7 (53.2–58.3)Housewife/Student 7,551 5,528,482 81.5 (79.7–83.1) 7,020 5,051,584 86.5 (84.8–88.1) 4,720 3,376,956 49.9 (47.7–52.1)
Marital statusCurrently married 48,066 30,831,168 84.3 (83.7–85.0) 46,635 29,645,628 91.7 (91.1–92.2) 30,395 19,343,368 52.9 (52.1–53.8)Previously married† 25,166 8,731,801 83.0 (82.0–84.0) 24,297 8,419,916 90.1 (89.2–90.9) 17,555 5,930,648 56.6 (55.3–57.8)Never married§ 10,469 10,227,723 78.9 (77.4–80.4) 9,193 8,875,935 83.3 (81.7–84.7) 7,178 6,825,329 52.9 (51.0–54.7)
Interview languageEnglish 82,140 47,896,583 83.2 (82.7–83.8) 78,730 45,313,761 90.6 (90.1–91.1) 54,047 30,767,692 53.6 (52.9–54.3)Spanish 552 666,986 68.2 (62.1–73.7) 348 432,069 51.7 (44.6–58.6) 514 627,984 64.5 (58.2–70.2)
Children in household
Yes 23,462 20,454,775 80.9 (80.0–81.9) 20,767 18,129,679 86.7 (85.7–87.6) 13,764 12,200,949 48.4 (47.2–49.6)No 60,392 29,425,652 84.4 (83.8–85.1) 59,498 28,905,485 91.7 (91.1–92.2) 41,481 19,981,656 57.4 (56.6–58.2)
See table footnotes on page 717.
hxv5
Text Box
Please note: An erratum has been published for this issue. To view the erratum, please click here.
hxv5
Highlight
hxv5
Highlight
hxv5
Highlight
hxv5
Highlight
hxv5
Highlight

Morbidity and Mortality Weekly Report
MMWR / September 14, 2012 / Vol. 61 / No. 36 717
status, and those without Internet access. An increased effort to make household preparedness materials and information more accessible, particularly by those with resource and language barriers, is needed.
The findings in this report are subject to at least five limita-tions. First, during 2006–2010, BRFSS sampled only house-holds with a landline telephone, thus excluding homes with only cellular telephones. Second, responses were dependent on the participant’s understanding of preparedness measures taken in the household; for example, some respondents might not have known that the household had a 3-day supply of food,
TABLE 1. (Continued) Percentage of participants reporting household disaster or emergency preparedness, by preparedness measures and sociodemographic characteristics — Behavioral Risk Factor Surveillance System, 14 states, 2006–2010
Characteristic
Have a written evacuation plan Have a working battery-operated radio Have a working battery-operated flashlight
No. in sample
Weighted no. % (95% CI)
No. in sample
Weighted no. % (95% CI)
No. in sample
Weighted no. % (95% CI)
Overall 22,522 12,661,492 21.1 (20.6–21.7) 74,331 46,538,951 77.7 (77.2–78.3) 93,831 57,256,195 94.8 (94.4–95.1)
Sex Men 8,385 6,051,319 21.0 (20.2–21.9) 28,986 22,906,709 79.6 (78.6–80.5) 35,529 27,730,509 95.6 (95.1–96.1)Women 14,137 6,610,173 21.3 (20.6–21.9) 45,345 23,632,242 76.1 (75.3–76.8) 58,302 29,525,687 94.0 (93.6–94.4)
Race/Ethnicity*White 17,498 8,761,404 19.6 (19.0–20.2) 61,565 35,783,853 80.4 (79.8–81.0) 77,536 43,646,594 97.0 (96.7–97.2)Black 2,620 2,103,974 26.2 (24.7–27.9) 6,931 5,878,861 72.4 (70.5–74.1) 8,703 7,232,129 89.1 (87.8–90.2)Hispanic 907 980,547 26.8 (23.9–29.9) 2,005 2,465,690 67.1 (63.5–70.4) 2,559 3,116,057 84.4 (81.5–86.9)Other race/Multirace 1,272 706,156 23.9 (21.3–26.7) 3,195 2,021,506 67.3 (63.7–70.8) 4,206 2,747,172 90.8 (88.4–92.8)
Age group (yrs)18–24 694 1,038,145 17.9 (15.9–20.1) 2,389 4,401,518 75.6 (72.8–78.2) 2,940 5,408,379 92.0 (90.2–93.5)25–34 1,896 1,959,055 18.3 (17.0–19.8) 6,667 7,937,548 74.2 (72.4–75.9) 8,450 9,962,729 92.7 (91.6–93.6)35–44 3,235 2,660,066 21.0 (19.7–22.3) 11,455 9,925,954 78.4 (77.0–79.8) 13,920 12,025,987 94.3 (93.5–95.1)45–54 4,453 2,471,297 21.5 (20.5–22.6) 15,444 9,077,234 79.5 (78.4–80.5) 19,108 11,047,242 95.8 (95.2–96.3)
≥55 12,036 4,419,004 23.5 (22.8–24.2) 37,769 14,866,044 78.8 (78.1–79.5) 48,663 18,405,331 96.5 (96.1–96.8)Education
Less than a high school diploma
2,502 1,408,864 26.7 (24.8–28.6) 6,414 3,651,230 67.8 (65.6–70.0) 8,677 4,761,831 88.3 (86.6–89.8)
High school diploma 7,757 4,415,355 24.8 (23.8–25.8) 23,338 14,060,524 78.6 (77.5–79.6) 29,233 17,045,577 94.5 (94.0–95.1)More than a high
school diploma12,219 6,813,722 18.6 (17.9–19.2) 44,467 28,769,462 78.8 (78.1–79.5) 55,771 35,376,690 95.8 (95.4–96.2)
Employment statusCurrently employed 10,867 7,144,636 19.5 (18.8–20.2) 39,991 28,909,540 79.0 (78.2–79.7) 49,522 35,152,226 95.3 (94.9–95.7)Unemployed 958 742,373 22.0 (19.5–24.8) 3,025 2,452,521 72.5 (69.3–75.4) 3,865 3,146,645 91.9 (89.9–93.5)Retired 6,688 2,457,513 25.6 (24.6–26.6) 19,787 7,642,923 79.0 (78.1–79.9) 25,535 9,457,148 96.6 (96.2–97.0)Unable to work 1,891 904,303 27.5 (25.4–29.8) 4,640 2,280,968 68.7 (66.2–71.1) 6,169 2,952,544 88.4 (86.6–90.0)Housewife/ Student 2,048 1,372,799 20.2 (18.7–21.9) 6,721 5,162,344 76.5 (74.5–78.4) 8,518 6,430,010 94.1 (93.0–95.0)
Marital statusCurrently married 12,082 7,572,189 20.7 (20.1–21.4) 44,388 29,358,964 80.8 (80.1–81.5) 53,879 35,453,676 96.7 (96.3–97.0)Previously married† 7,499 2,614,001 25.1 (24.1–26.2) 20,383 7,540,051 71.9 (70.8–73.0) 27,707 9,762,064 92.4 (91.7–93.1)Never married§ 2,855 2,434,013 19.0 (17.7–20.3) 9,334 9,492,166 73.8 (72.1–75.4) 11,941 11,863,771 91.3 (90.3–92.3)
Interview languageEnglish 21,689 11,819,518 20.6 (20.1–21.2) 72,706 44,672,616 78.1 (77.5–78.7) 91,753 54,940,267 95.2 (94.8–95.5)Spanish 251 249,308 25.6 (20.7–31.2) 451 555,298 56.5 (50.0–62.7) 615 735,069 74.7 (68.7–79.9)
Children in household
Yes 6,540 5,239,598 20.8 (20.0–21.8) 22,172 19,678,184 78.2 (77.2–79.2) 26,937 23,878,858 94.3 (93.7–94.8)No 15,934 7,392,433 21.3 (20.7–21.9) 52,054 26,797,544 77.4 (76.7–78.1) 66,771 33,299,418 95.1 (94.7–95.5)
Abbreviation: CI = confidence interval.* Persons identified as Hispanic might be of any race. Persons identified as white, black, or other race/multirace are all non-Hispanic. The four racial/ethnic categories
are mutually exclusive. † Includes divorced, widowed, and separated persons.§ Includes never married persons and members of unmarried couples.
water, and medications. In addition, respondents were not required to present any evidence that a preparedness measure (e.g., 3-day supply of water or a working flashlight) had been met. Third, the response rates were low; only approximately one of every two persons contacted agreed to participate in the survey. Fourth, several of the questions failed to account for all types of preparedness technology (e.g., hand-cranked flashlights). Finally, the General Preparedness module was only implemented in 14 states during 2006–2010, with only a few states using the module in any given year; therefore, the findings are not generalizable to the U.S. population.
hxv5
Highlight
hxv5
Highlight
hxv5
Highlight
hxv5
Text Box
Please note: An erratum has been published for this issue. To view the erratum, please click here.

Morbidity and Mortality Weekly Report
718 MMWR / September 14, 2012 / Vol. 61 / No. 36
Since the 2001 terrorist attacks, the federal government has increased its emphasis on emergency preparedness, including the response and recovery capabilities of emergency manage-ment agencies, hospitals, and public health systems (7). CDC uses preparedness metrics to assess systems, with the findings disseminated to states and used to inform Healthy People 2020
objectives. Outcomes associated with individual household pre-paredness activities, however, are not similarly assessed or shared (3,8). To help improve household disaster preparedness in the general population and to inform national and state prepared-ness planning and policy, systematically measured, generalizable state-based household preparedness data are needed (9).
TABLE 2. Percentage of participants reporting household disaster or emergency preparedness, by preparedness measures and state — Behavioral Risk Factor Surveillance System, 14 states, 2006–2010
State Year
Have a 3-day supply of food Have a 3-day supply of medication Have a 3-day supply of water
No. in sample
Weighted no. % (95% CI)
No. in sample
Weighted no. % (95% CI)
No. in sample
Weighted no. % (95% CI)
Overall 83,965 49,939,735 82.9 (82.4–83.5) 80,351 47,083,817 89.7 (89.2–90.1) 55,323 32,222,914 53.6 (52.9–54.3)
Connecticut 2006 3,483 1,953,333 80.7 (78.1–82.3) 3,430 1,897,278 88.5 (87.0–89.8) 2,289 1,250,486 51.6 (49.7–53.6)Delaware 2007 3,402 559,508 85.6 (83.9–87.1) 3,232 519,317 91.5 (90.0–92.8) 2,374 393,933 60.2 (58.0–62.4)Georgia 2008 4,686 5,704,548 83.8 (82.1–85.3) 4,552 5,326,005 91.0 (89.7–92.2) 2,952 3,548,334 52.2 (50.2–54.2)Louisiana 2007 5,263 2,503,903 84.7 (83.4–86.0) 4,840 2,225,833 85.2 (83.8–86.4) 4,180 1,986,970 67.1† (65.5–68.8)Maryland 2007 3,377 3,081,163 79.7 (77.7–81.5) 3,393 2,971,525 86.3 (84.2–88.1) 2,309 2,141,650 55.1 (52.9–57.3)Mississippi 2009 8,780 1,665,142 83.3 (82.2–84.4) 8,829 1,602,641 90.8 (89.7–91.7) 6,051 1,129,593 56.6 (55.1–58.0)Montana 2006
20082010
16,737 1,827,338 88.1† (87.4–88.8) 15,185 1,620,819 91.1 (90.4–91.9) 10,896 1,133,622 54.7 (53.6–55.8)
Nebraska 20072008
8,736 2,082,276 83.8 (82.1–85.4) 8,398 1,957,109 91.0 (89.5–92.3) 4,745 1,130,401 45.5* (43.5–47.6)
Nevada 2006 2,772 1,300,038 78.5* (76.1–80.7) 2,559 1,170,845 80.7* (78.1–83.1) 2,102 1,041,549 63.0 (60.4–65.5)New Hampshire 2007 4,615 776,298 81.7 (80.3–82.9) 4,540 752,438 90.8 (89.6–91.9) 3,122 5,167,704 54.2 (52.6–55.9)New York 2008 3,032 11,086,539 79.8 (78.0–81.4) 3,040 10,742,654 89.6 (87.9–91.0) 1,953 6,979,891 50.4 (48.4–52.5)North Carolina 2010 10,227 5,869,875 84.7 (84.5–86.8) 9,803 5,367,481 91.4 (90.3–92.4) 6,707 3,866,292 56.7 (55.2–58.1)Pennsylvania 2008 5,435 7,995,514 86.1 (84.7–87.5) 5,246 7,614,674 93.7† (92.5–94.8) 3,579 4,947,353 53.4 (51.5–55.4)Tennessee 2006 3,420 3,534,261 82.0 (80.2–83.6) 3,304 3,315,199 84.4 (82.5–86.2) 2,064 2,156,136 50.0 (47.7–52.3)
See table footnotes below.
TABLE 2. (Continued) Percentage of participants reporting household disaster or emergency preparedness, by preparedness measures and state — Behavioral Risk Factor Surveillance System, 14 states, 2006–2010
State Year
Have a written evacuation plan Have a working battery-operated radio Have a working battery-operated flashlight
No. in sample
Weighted no. % (95% CI)
No. in sample
Weighted no. % (95% CI)
No. in sample
Weighted no. % (95% CI)
Overall 22,522 12,661,492 21.1 (20.6–21.7) 74,331 46,538,951 77.7 (77.2–78.3) 93,831 57,256,195 94.8 (94.4–95.1)
Connecticut 2006 967 544,187 22.4 (20.8–24.1) 3,338 1,915,855 79.2 (77.6–80.8) 4,121 2,328,965 95.5 (94.6–96.2)Delaware 2007 947 148,878 22.8 (20.8–25.0) 3,062 514,735 79.0 (77.1–80.7) 3,771 627,163 95.7 (94.7–96.6)Georgia 2008 957 1,082,355 16.0 (14.7–17.5) 4,027 5,088,753 75.1 (73.3–76.8) 5,172 6,461,497 94.6 (93.6–95.4)Louisiana 2007 3,224 1,585,357 54.0† (52.3–55.7) 5,191 2,513,071 85.2† (83.9–86.4) 5,882 2,836,825 95.4 (94.6–96.1)Maryland 2007 1,136 1,031,932 26.9 (25.0–28.8) 3,207 3,050,542 79.7 (77.7–81.5) 3,910 3,668,318 94.9 (93.6–95.9)Mississippi 2009 1,901 357,999 18.0 (16.9–19.3) 7,842 1,568,763 78.7 (77.6–79.9) 9,946 1,896,225 94.7 (94.1–95.3)Montana 2006
20082010
3,776 397,797 19.2 (18.4–20.1) 13,284 1,522,456 74.2 (73.3–75.2) 18,177 2,004,263 96.4 (96.0–96.8)
Nebraska 20072008
2,231 519,381 21.0 (19.4–22.7) 8,197 2,043,232 82.6 (81.0–84.1) 9,793 2,404,766 96.5 (95.7–97.2)
Nevada 2006 1,029 473,114 28.6 (26.4–30.9) 2,479 1,191,252 72.3* (69.7–74.7) 3,148 1,505,890 90.5 (88.3–92.2)New Hampshire 2007 1,252 196,826 20.7 (19.5–22.1) 4,318 751,036 79.4 (78.1–80.7) 5,446 926,119 97.2† (96.5–97.7)New York 2008 669 2,272,831 16.5 (15.1–18.0) 2,828 10,608,454 76.7 (74.9–78.4) 3,514 3,059,551 93.4* (92.3–94.4)North Carolina 2010 1,883 1,171,601 17.2 (16.1–18.5) 8,692 5,251,368 77.2 (76.0–78.5) 11,153 6,543,028 95.2 (94.5–95.8)Pennsylvania 2008 1,081 1,392,433 15.0* (13.7–16.4) 4,720 7,159,537 77.7 (76.0–79.3) 6,017 8,976,868 96.3 (95.5–97.0)Tennessee 2006 1,469 1,486,798 34.6 (32.5–36.8) 3,146 3,359,894 78.5 (76.6–80.3) 3,881 4,016,717 93.8 (92.5–94.9)
Abbreviation: CI = confidence interval.* Lowest percentage for preparedness measure among the 14 states.† Highest percentage for preparedness measure among the 14 states.
hxv5
Text Box
Please note: An erratum has been published for this issue. To view the erratum, please click here.
hxv5
Highlight
hxv5
Highlight
hxv5
Highlight
hxv5
Highlight
hxv5
Highlight
hxv5
Highlight
hxv5
Highlight
hxv5
Highlight

Morbidity and Mortality Weekly Report
MMWR / September 14, 2012 / Vol. 61 / No. 36 719
What is already known on this topic?
Household preparedness measures, such as having a 3-day supply of food, water, and medications and a written household evacuation plan, can improve a population’s ability to cope with disasters and emergencies, decreasing the number of persons who might otherwise strain emergency and health-care services.
What is added by this report?
Results from Behavioral Risk Factor Surveillance System surveys of household preparedness in 14 states during 2006–2010 indicated that an estimated 94.8% of households had a working battery-operated flashlight, 89.7% had a 3-day supply of medications for everyone who required them, 82.9% had a 3-day supply of food, 77.7% had a working battery-operated radio, 53.6% had a 3-day supply of water, and only 21.1% of U.S. residents had a written evacuation plan.
What are the implications for public health practice?
Greater effort is needed to stress the importance of disaster and emergency preparedness, especially the need for a written evacuation plan. Public health and emergency services agencies should increase the accessibility of household preparedness materials and information to the Hispanic population and persons with resource and language barriers.
References 1. Hick JL, Hanfling D, Burstein JL, et al. Health care facility and
community strategies for patient care surge capacity. Ann Emerg Med 2004;44:253–61.
2. Paton D, Johnston DM. Disaster resilience: an integrated approach. Springfield, IL: Charles C. Thomas; 2006:105–6.
3. Ablah E, Konda K, Kelley CL. Factors predicting individual emergency preparedness: a multi-state analysis of the 2006 BRFSS data. Biosecur Bioterror 2009;7:317–30.
4. Murphy ST, Cody M, Frank LB, Glik D, Ang A. Predictors of emergency preparedness and compliance. Disaster Med Public Health Prep 2009;7:S1–8.
5. Federal Emergency Management Agency. Ready. Washington, DC: Federal Emergency Management Agency; 2012. Available at http://www.ready.gov. Accessed September 7, 2012.
6. Federal Emergency Management Agency. Citizen Corps. Washington, DC: Federal Emergency Management Agency; 2012. Available at http://citizencorps.gov. Accessed September 7, 2012.
7. CDC. Public health preparedness capabilities: national standards for state and local planning. Atlanta, GA: US Department of Health and Human Services, CDC; 2011. Available at http://www.cdc.gov/phpr/capabilities. Accessed September 7, 2012.
8. CDC. Public Health Emergency Preparedness Program: budget period 1. Performance measures specifications and implementation guidance. Atlanta, GA: US Department of Health and Human Services, CDC; 2012. Available at http://www.cdc.gov/phpr/documents/phep+bp1+pm+specifications+and+implementation+guidance_v1_1.pdf. Accessed September 7, 2012.

Morbidity and Mortality Weekly Report
720 MMWR / September 14, 2012 / Vol. 61 / No. 36
Public health emergency preparedness involves improving both workforce and household capacity to manage disasters. To improve preparedness at both levels, the Tennessee Department of Health (TDH) formed a Rapid Assessment of Populations Impacted by Disasters (RAPID) team. In 2011, the team used Community Assessment for Public Health Emergency Response (CASPER) two-stage cluster sampling methodology to measure household preparedness for disasters or emergen-cies in two metropolitan counties. In the two counties, 23% and 31% of households reported being “well-prepared” to handle disasters or emergencies, 43% and 44% reported being “somewhat prepared,” and 25% and 20% reported being “not at all prepared.” As a result of this experience, RAPID teams were able to improve their methods, streamline processes, and create a better community assessment toolkit. To increase pre-paredness at both the community and workforce levels, public health departments should assess community preparedness to inform the planning process and provide field training and exercise opportunities for public health workers.
Public health preparedness programs are charged with build-ing capability to respond to disasters and improving community preparedness (1). To help achieve these goals, TDH formed a RAPID team in 2010 made up of local and state health depart-ment staff members. Using CASPER methods, the RAPID team, in conjunction with two metropolitan county health departments and volunteers, conducted community assessments in 2011 to 1) assess household-level preparedness in two major metropolitan areas in Tennessee, 2) evaluate the field team deployment process, and 3) train and exercise the emergency response workforce in postdisaster survey methods. Although CASPER methodology has been used and validated during disaster response (2) and nondisaster scenarios (3), assessing community preparedness is a new use for these methods.
For both surveys, RAPID team leaders with previous experi-ence conducting CASPER surveys used materials from a rapid community assessment toolkit developed by TDH. The toolkit was intended to facilitate the field survey deployment process by providing premade training in methodology, safety and logistics, plus maps of sampling areas, logistics forms, census data, databases, and survey templates. The two surveys pro-vided opportunities to test and improve several of these tools.
Knox County, which includes the city of Knoxville, had a 2010 population of 423,237. Davidson County, which includes the city of Nashville, had a 2010 population of 626,681 (4).
The two counties were selected for these exercises because their health departments expressed interest in assessing commu-nity preparedness. Before deployment to the field to conduct household interviews, approximately 80 public health workers, university students, and volunteers attended 4 hours of train-ing. The trainings included modules on 1) basic concepts of CASPER methodology, 2) team logistics (e.g., communications, navigation in the field), 3) use of survey and household tracking forms, and 4) personal safety procedures while in the field. Before going into the field, teams conducted mock interviews using the survey questionnaire to ensure interview consistency and understanding of the survey aims. Rosters of those completing the training and field portions of the exercises were retained by the health departments to facilitate redeployment of experienced personnel during future rapid community assessments.
Three broad categories of household preparedness were assessed: 1) preparedness planning and supplies, 2) communication and information sources during disasters, and 3) the presence of household pets and pet-related evacuation plans. Survey questions were derived from the Behavioral Risk Factor Surveillance System (5) General Preparedness module. The Davidson County survey included a question asking about a written or spoken prepared-ness plan, whereas Knox County asked about a written evacuation plan. The CASPER two-stage cluster sampling design was used to obtain representative samples of approximately 210 households for interviews for each assessment. In the first stage, the RAPID team randomly selected 30 census blocks within each county, with probability of selection proportionate to population size (6). In the second stage, households were selected using sequential sampling, starting in the visually estimated center of each identified cluster. At each household that participated, one adult representative was interviewed. Of 252 Knox County and 316 Davidson County homes at which a resident answered the door, 197 (78%) and 184 (58%) interviews, respectively, were completed; residents at the remaining households declined participation.
Survey Results Results of the interviews indicated that, in Knox County, 23%
of respondents reported being “well-prepared” to handle disas-ters or emergencies, 43% reported being “somewhat prepared,” and 25% reported being “not at all prepared” (9% responded: “don’t know”). In Davidson County, the corresponding percent-ages were 31%, 44%, and 20% (5% responded: “don’t know”) (Table). In Knox County, 11% reported having a written disaster
Assessment of Household Preparedness Through Training Exercises — Two Metropolitan Counties, Tennessee, 2011

Morbidity and Mortality Weekly Report
MMWR / September 14, 2012 / Vol. 61 / No. 36 721
evacuation plan; in Davidson County, 40% reported having either a written or spoken plan for emergencies.
When asked about household supplies, 78% (Knox) and 87% (Davidson) of households reported having a working flashlight with batteries, and 60% (Knox) and 55% (Davidson) reported having a battery-operated radio with batteries. Eighty-four percent (Knox) and 82% (Davidson) of households reported having 3-day supplies of nonperishable food, 39% (Knox) and 54% (Davidson) reported 3-day stores of water, and 74% (Knox) and 91% (Davidson) reported 3-day supplies of prescription medications.
Mobile telephones were reported as the primary means of com-municating during disasters in 83% (Knox) and 90% (Davidson) of households (Table). Television was reported to be the primary means of getting information during disasters in 45% (Knox) and 46% (Davidson) of households, with radio the primary source for 23% in both counties. Pet or livestock ownership was reported in 49% (Knox) and 47% (Davidson) of households (Table). During a disaster requiring evacuation, 63% (Knox) and 87% (Davidson) planned to bring their pets, whereas only 3% (Knox) and 4% (Davidson) anticipated leaving their pets or livestock with food.
Assessment Improvements Based on the experience in these two surveys, the RAPID teams
were able to revise and improve training on household selection in the field, navigation in the community using cluster maps, and use of associated tracking forms. The household selection training revi-sions include visual examples of cluster maps with displayed starting points and discussions pertaining to team strategies for sequential sampling in areas with dispersed households. To streamline future responses, the teams refined cluster map templates with navigation maps, added navigation elements to the premade presentations contained in the toolkit, and refined tracking and sign-in forms to efficiently manage team logistics. The teams strengthened the safety module with information on team identification in the field and routine communications with logistics personnel. The toolkits now contain all this information on single DVDs and have been distributed to public health emergency response teams in all regions of Tennessee. The improved kits have the potential to reduce the response time for community assessments.
Reported by
Kathleen C Brown, PhD, Knox County Health Dept, Knoxville; Nancy Horner, Metro Public Health Dept, Nashville; Melissa Fankhauser, MPH, Tennessee Dept of Health. Joseph Roth, Jr., MPH, Career Epidemiology Field Officer, Office of Science and Public Health Practice, Office of Public Health Preparedness and Response; Tristan Victoroff, MPH, Scientific Education and Professional Development Program Office, Office of Surveillance, Epidemiology, and Laboratory Svcs, CDC. Corresponding contributor: Joseph Roth, Jr., [email protected], 615-253-8669.
Editorial Note
Quantifying household-level preparedness provided planners the information needed to guide targeted program activities. Although public health emergency preparedness programs
TABLE. Results of two training exercises that assessed household preparedness for disasters or emergencies — Knox and Davidson counties, Tennessee, 2011
Characteristic
% of households
Knox County
Davidson County
Planning and suppliesHow prepared do you feel your household is
to handle a disaster or emergency?*Well-prepared 23 31Somewhat prepared 43 44Not at all prepared 25 20
Household has a disaster or emergency plan. — 40†
Household has a written disaster evacuation plan for how you will leave your home, in case of a large-scale disaster that requires evacuation.
11§ —
Household has a working flashlight with batteries
78 87
Household has a battery-operated radio with batteries.
60 55
For every person in the household, there is a 3-day supply of nonperishable food.
84 82
For every person in the household, there is a 3-day supply of water.
39 54
For every person in the household who needs them, there is a 3-day supply of prescription medications.
74 91
Communication-relatedDuring a disaster or emergency, what would
be your primary way of communicating with relatives and friends?
Mobile phone 83 90Landline telephone 12 6Other 4 4
What would be your primary way of getting information during a disaster or emergency?
Television 45 46Radio 23 23Internet 10 7
Pet-relatedSomeone in your household has pets, service
animals, or livestock.49 47
If you were asked to evacuate, what would you do with your pets?
Bring the pets 63 87Leave pets with food 3 4Other 6 9
* Response of “don’t know” were excluded.† In Davidson County, 40% of respondents reported having either a written or
spoken plan for emergencies.§ In Knox County, 11% of respondents reported having a written disaster plan
for evacuation.

Morbidity and Mortality Weekly Report
722 MMWR / September 14, 2012 / Vol. 61 / No. 36
in each region continually bolster response plans, enhanced efforts to improve household preparedness are needed because substantial numbers of households report being unprepared or less than fully prepared for disasters. Based on the survey results in this report, plans for public health or other emergency mes-saging during a disaster should include television, radio, and the Internet because those are the primary means of obtaining information during a disaster for more than three fourths of those surveyed. Approximately half the population surveyed owned pets or livestock, and most owners plan to bring their pets dur-ing evacuations. Therefore, shelter and evacuation plans need to accommodate both evacuees and their animals, and plans for managing livestock should be made by the appropriate agen-cies. Planners should incorporate these findings into response strategies and coordinate community messaging both to improve household preparedness and to guide community actions.
During the survey periods, press releases pertaining to the surveys prompted print media and television dissemination of information in each county regarding preparedness and the role of public health, enabling planners to reinforce the CDC Get a Kit, Make a Plan, Be Prepared (7) themed messages to the communities. Moreover, the surveys provided the opportunity for direct interaction between public health staff members and hundreds of members of the community to discuss household preparedness strategies and distribute preparedness guidance.
The findings in this report are subject to at least four limita-tions. First, interviews were conducted in the daytime and early evenings, so households where the adults were working outside the home at the time of interviews had limited representation. Selection bias might have occurred if households were selected based on occupancy or interviewer safety concerns. Second, results are representative only of the populations in the two counties surveyed, thus limiting the ability to generalize to other regions in Tennessee or elsewhere. Third, all informa-tion was self-reported, and respondents were not required to present any evidence that a preparedness measure (e.g., 3-day supply of water or a working flashlight) had been met. Finally, widespread media coverage might have contributed to social desirability bias, resulting in an overestimate of households reporting that they are well-prepared or somewhat prepared.
These surveys provided valuable information about community preparedness in two of Tennessee’s largest metropolitan areas, while providing staff members, students, and volunteers with experience conducting the type of surveys that will need to be done in postdisaster settings, when response demands can exceed normal operating capacity. CASPER surveys during emergency responses require organization of multiagency participation (e.g., public health, emergency response, and nongovernmental organi-zations), application of scientifically sound survey methods, and prompt data collection, analysis, and reporting to inform response
activities. Knox County had not conducted such a field exercise previously, and Davidson County had conducted only one previ-ous CASPER survey. By conducting surveys during nondisaster situations, both jurisdictions and team members gained valuable experience that can facilitate survey planning and implementation in future emergency responses. The field experience knowledge and confidence gleaned from successfully completing these exer-cises will better enable staff members to conduct community assessments during future emergency responses.
References 1. CDC. Public health preparedness capabilities: national standards for state
and local planning, March 2011. Atlanta, GA: US Department of Health and Human Services, CDC; 2011. Available at http://www.cdc.gov/phpr/capabilities/dslr_capabilities_july.pdf. Accessed September 12, 2012.
2. Malilay J, Flanders WD, Brogan D. A modified cluster-sampling method for post-disaster rapid assessment of needs. Bull World Health Organ 1996;74:399–405.
3. CDC. Intent to receive influenza A (H1N1) 2009 monovalent and seasonal influenza vaccines—two counties, North Carolina, August 2009. MMWR 2009;58;1401–5.
4. US Census Bureau. State and county quickfacts. Washington, DC: US Census Bureau; 2012. Available at http://quickfacts.census.gov/qfd/maps/tennessee_map.html, Accessed September 7, 2012.
5. CDC. Behavioral Risk Factor Surveillance System 2007 questionnaire. Atlanta, GA: US Department of Health and Human Services, CDC; 2006. Available at http://www.cdc.gov/brfss/questionnaires/pdf-ques/2007brfss.pdf. Accessed September 7, 2012.
6. US Census Bureau. State and county estimates for 2009. Washington, DC: US Census Bureau; 2010. Available at http://www.census.gov/did/www/saipe/data/statecounty/data/2009.html. Accessed September 7, 2012.
7. CDC. Emergency preparedness and response: emergency preparedness and you. Atlanta, GA: US Department of Health and Human Services, CDC; 2012. Available at http://emergency.cdc.gov/preparedness. Accessed September 7, 2012.
What is already known on this topic?
Community Assessment for Public Health Emergency Response (CASPER) methods are well established as an efficient means for assessing population needs and characteristics in both disaster and nondisaster settings.
What is added by this report?
In a two-county CASPER survey conducted in Tennessee, only 23% of respondents in Knox County and 31% in Davidson County reported being well-prepared for an emergency or disaster. Using CASPER in nondisaster settings to assess community preparedness enhances disaster response capabili-ties of health departments by simultaneously identifying community needs, strengthening workforce training, and improving Rapid Assessment of Populations Impacted by Disasters (RAPID) toolkits.
What are the implications for public health practice?
To increase preparedness at both community and professional levels, public health departments should use a combination of strategies including surveys, training exercises, and public communications to maximize preparedness and response effectiveness.

Morbidity and Mortality Weekly Report
MMWR / September 14, 2012 / Vol. 61 / No. 36 723
Tuberculosis Genotyping — United States, 2004–2010
Tuberculosis (TB) genotyping is a laboratory-based genetic analysis of the bacteria that cause TB disease (i.e., any of the organisms in the Mycobacterium tuberculosis complex). When combined with epidemiologic data, TB genotyping has suf-ficient discriminatory power to help find TB cases likely to be in the same chain of transmission or determine that cases are not related (1). Since 2004, >70,000 M. tuberculosis isolates have been genotyped through partnerships between CDC, national genotyping laboratories, and state and local public health departments, with a goal to genotype at least one M. tuberculosis isolate for each case of culture-positive TB in the United States. National genotype surveillance coverage, or the proportion of culture-positive TB cases with a genotyped isolate, increased from 51.2% in 2004 to 88.2% in 2010. The TB Genotyping Information Management System (TB GIMS), accessible to public health departments through a secure, online web portal, was launched in 2010. TB GIMS enables systematic collection of genotyping results, which have been available since 2004, and integrates those results with epidemiologic, geographic, demographic, and clinical data collected by the National TB Surveillance System (NTSS) since 1993. Genotyping timeliness, represented by the median time from specimen collection until linked genotyping results and surveillance data are available to TB GIMS users, improved from 22 weeks in July 2010 to 11 weeks in December 2010. These improvements in genotype surveillance coverage and timeliness will improve outbreak detection efforts and enable more in-depth studies of TB epidemiology, leading to better use of limited public health resources.
Analysis of M. tuberculosis genotypes* has enhanced TB control with its ability to detect unsuspected transmission links between cases, confirm suspected links, identify unknown or difficult to investigate transmission settings, alert public health departments to possible transmission across geographic report-ing areas, identify potential outbreaks (i.e., a group of TB cases with genotype results and epidemiologic links consistent with recent transmission, where control of transmission exceeds locally available resources), refine outbreak case definitions, and identify false-positive TB culture results (2). Cases with indistinguishable genotypes that are close in space and time are considered genotype clusters and might represent an outbreak. Cases with a genotype unique to a given time and place are less likely to be related to another case. The ability to detect
outbreaks based on genotyping results depends on sufficient genotype surveillance data (3). Without adequate genotyping data, single genotyped isolates from chains of transmission will appear to be unique.
TB GIMS facilitates systematic data collection of genotyping results and integrates genotyping results with epidemiologic, geographic, demographic, and clinical data collected by NTSS (4). Genotype data are uploaded into TB GIMS by national genotyping laboratories as they become available, and surveil-lance data from NTSS are uploaded into TB GIMS at least biweekly at CDC. Although TB outbreaks tend to develop slowly (months to years), prompt intervention during an outbreak can interrupt transmission; thus, timeliness in link-ing genotyping results to surveillance data (by state and local public health departments) is essential for prompt outbreak detection. TB GIMS sends users automated e-mail alerts when a genotype cluster in their jurisdiction has grown to a higher than expected geospatial concentration in a specific county, compared with the national distribution of that genotype.
For this report, 2004–2010 TB GIMS data from 51 report-ing areas in the United States (50 states and the District of Columbia) were analyzed. Measures of geospatial concentration were calculated by the log-likelihood ratio (LLR) for a given genotype cluster in a single county during a 3-year period.† An LLR >5.0 indicates a potential outbreak.§ TB GIMS timeliness data were examined during July–December 2010. For each isolate, the date of arrival at the national genotyping laboratory, date of genotyping result, and date that genotyping results and surveillance data were linked in the system were examined. A record was considered complete when genotyping results (from national genotyping laboratories) and surveillance data (from NTSS) both were entered in the system and linked by public health departments.
Genotype surveillance coverage has increased from 51.2% in 2004 to 88.2% in 2010 (Figure 1). In 2010, 40 (83.3%) of 48 reporting areas¶ had >80% genotype surveillance cover-age, compared with 26 (51.0%) of 51 reporting areas in 2004. During 2008–2010, a total of 23,108 TB cases had at least one genotyped isolate; 7,942 (34.4%) were part of 2,184 county-based genotype clusters. Of these clusters, 1,679 (76.9%)
* In this report, a genotype is defined as a unique combination of spacer oligonucleotide typing results (spoligotype) and 12-locus mycobacterial interspersed repetitive unit–variable number tandem repeat typing results.
† A 3-year period was chosen to fit the natural history of TB. Among persons who develop TB disease, a majority likely will do so within 3 years of exposure.
§ This cut point was derived from a preliminary analysis of internal CDC data using local expert opinion as the standard for defining a TB outbreak. Two validation studies currently are in progress.
¶ Three states among the 51 areas were excluded from the analysis because of delays resulting from technical problems.

Morbidity and Mortality Weekly Report
724 MMWR / September 14, 2012 / Vol. 61 / No. 36
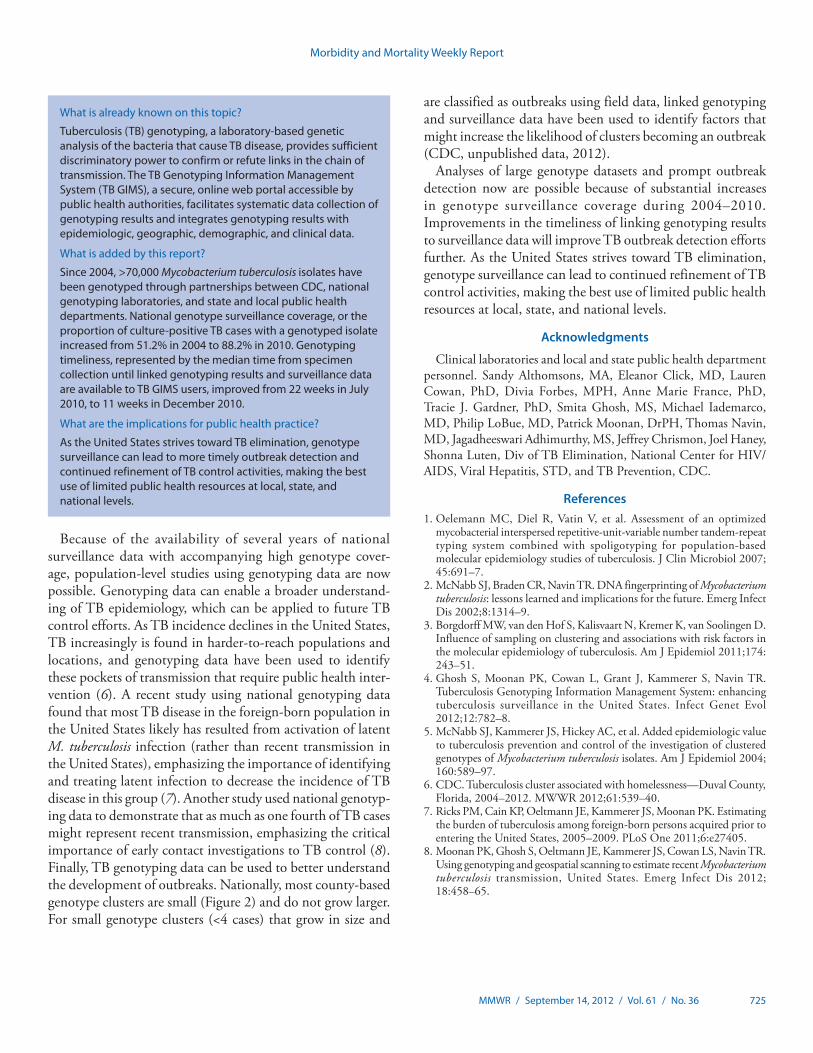
clusters consisted of two or three cases, compared with 100 (4.6%) clusters with ≥10 cases (Figure 2). The most common genotype was seen in 932 (4.0%) of all genotyped cases; at least one case with this genotype was identi-fied in 43 of the 51 reporting areas. Among all genotype clusters, 378 (17.3%) were identified as potential outbreaks based on elevated geospa-tial concentration (LLR >5.0) during 2008–2010.
Since its launch in March 2010, TB GIMS use increased rapidly, with >28,000 logins by 349 state and local users in the first 10 months after release. During July–December 2010, the median time from specimen col-lection until a complete record was available (with linked genotyping results and surveillance data) in TB GIMS was 16 weeks (interquartile range: 12–22 weeks). This included medians of 8 weeks from specimen collection until the TB isolate arrived at the genotyping labora-tory, 1 week for genotyping laboratory turnaround time, and 14 weeks for linking genotyping results with surveillance data in TB GIMS.** Median time to a complete record improved from 22 weeks (n = 547 isolates; interquartile range: 15–30 weeks) for specimens collected in July 2010, to 11 weeks (n = 289 isolates; interquartile range: 9–14 weeks) for speci-mens collected in December 2010.
Reported by
Juliana Grant, MD, Steve Kammerer, MBA, Div of Tuberculosis Elimination, National Center for HIV/AIDS, Viral Hepatitis, STD, and TB Prevention; Brian Baker, MD, Lindsay Kim, MD, EIS officers, CDC. Corresponding contributor: Lindsay Kim, [email protected], 404-639-5218.
Editorial Note
TB genotyping has become a commonly used tool for TB outbreak detection and investigations in the United States (B. Baker, MD, CDC, unpublished survey of TB GIMS users, 2010). In one study examining the added value of TB genotyping, 38% of all epidemiologic links were discovered
only after using genotyping to connect previously unlinked cases. In addition, of the epidemiologic links discovered dur-ing conventional contact investigations, assumed transmission among 29% of case pairs was refuted by genotyping data (5). Only 17.3% of the 2,184 genotype clusters in the United States during 2008–2010 had geospatial concentrations indicating a potential outbreak. Genotyping data such as these allow local or state public health departments to target interventions among the many cases and epidemiologic clusters identified in a jurisdiction, potentially saving financial and human resources.
FIGURE 1. Reported culture-positive tuberculosis (TB) cases and national TB genotype surveillance coverage* by year — United States,† 2004–2010
* Proportion of culture-positive TB cases with at least one genotyped isolate.† Includes 50 states and the District of Columbia.
0
10
20
30
40
50
60
70
80
90
100
0
2,000
4,000
6,000
8,000
10,000
12,000
2004 2005 2006 2007 2008 2009 2010
% coverage
N
o. o
f cul
ture
-pos
itive
cas
es
Year
Reported culture-positive TB cases without genotype resultsReported culture-positive TB cases with genotype resultsNational TB genotype surveillance coverage (%)
0
200
400
600
800
1,000
1,200
1,400
2 3 4 5–6 7–9 10–14 15–19 ≥20
1,600
No.
of c
lust
ers
Cluster size
FIGURE 2. Number of county-based tuberculosis genotype clusters,* by cluster size (number of isolates) — United States, 2008–2010
* Genotype cluster is defined as two or more Mycobacterium tuberculosis isolates that share matching genotypes in a county during 2008–2010.
** Users at state and local public health departments can link isolates to surveillance data even before the isolate has arrived at the genotyping laboratory. The time to a complete record depends on the rate-limiting step for each case (and is not a sum of each of the steps).
Morbidity and Mortality Weekly Report
MMWR / September 14, 2012 / Vol. 61 / No. 36 725
Because of the availability of several years of national surveillance data with accompanying high genotype cover-age, population-level studies using genotyping data are now possible. Genotyping data can enable a broader understand-ing of TB epidemiology, which can be applied to future TB control efforts. As TB incidence declines in the United States, TB increasingly is found in harder-to-reach populations and locations, and genotyping data have been used to identify these pockets of transmission that require public health inter-vention (6). A recent study using national genotyping data found that most TB disease in the foreign-born population in the United States likely has resulted from activation of latent M. tuberculosis infection (rather than recent transmission in the United States), emphasizing the importance of identifying and treating latent infection to decrease the incidence of TB disease in this group (7). Another study used national genotyp-ing data to demonstrate that as much as one fourth of TB cases might represent recent transmission, emphasizing the critical importance of early contact investigations to TB control (8). Finally, TB genotyping data can be used to better understand the development of outbreaks. Nationally, most county-based genotype clusters are small (Figure 2) and do not grow larger. For small genotype clusters (<4 cases) that grow in size and
are classified as outbreaks using field data, linked genotyping and surveillance data have been used to identify factors that might increase the likelihood of clusters becoming an outbreak (CDC, unpublished data, 2012).
Analyses of large genotype datasets and prompt outbreak detection now are possible because of substantial increases in genotype surveillance coverage during 2004–2010. Improvements in the timeliness of linking genotyping results to surveillance data will improve TB outbreak detection efforts further. As the United States strives toward TB elimination, genotype surveillance can lead to continued refinement of TB control activities, making the best use of limited public health resources at local, state, and national levels.
Acknowledgments
Clinical laboratories and local and state public health department personnel. Sandy Althomsons, MA, Eleanor Click, MD, Lauren Cowan, PhD, Divia Forbes, MPH, Anne Marie France, PhD, Tracie J. Gardner, PhD, Smita Ghosh, MS, Michael Iademarco, MD, Philip LoBue, MD, Patrick Moonan, DrPH, Thomas Navin, MD, Jagadheeswari Adhimurthy, MS, Jeffrey Chrismon, Joel Haney, Shonna Luten, Div of TB Elimination, National Center for HIV/AIDS, Viral Hepatitis, STD, and TB Prevention, CDC.
References 1. Oelemann MC, Diel R, Vatin V, et al. Assessment of an optimized
mycobacterial interspersed repetitive-unit-variable number tandem-repeat typing system combined with spoligotyping for population-based molecular epidemiology studies of tuberculosis. J Clin Microbiol 2007; 45:691–7.
2. McNabb SJ, Braden CR, Navin TR. DNA fingerprinting of Mycobacterium tuberculosis: lessons learned and implications for the future. Emerg Infect Dis 2002;8:1314–9.
3. Borgdorff MW, van den Hof S, Kalisvaart N, Kremer K, van Soolingen D. Influence of sampling on clustering and associations with risk factors in the molecular epidemiology of tuberculosis. Am J Epidemiol 2011; 174: 243–51.
4. Ghosh S, Moonan PK, Cowan L, Grant J, Kammerer S, Navin TR. Tuberculosis Genotyping Information Management System: enhancing tuberculosis surveillance in the United States. Infect Genet Evol 2012;12:782–8.
5. McNabb SJ, Kammerer JS, Hickey AC, et al. Added epidemiologic value to tuberculosis prevention and control of the investigation of clustered genotypes of Mycobacterium tuberculosis isolates. Am J Epidemiol 2004; 160:589–97.
6. CDC. Tuberculosis cluster associated with homelessness—Duval County, Florida, 2004–2012. MWWR 2012;61:539–40.
7. Ricks PM, Cain KP, Oeltmann JE, Kammerer JS, Moonan PK. Estimating the burden of tuberculosis among foreign-born persons acquired prior to entering the United States, 2005–2009. PLoS One 2011;6:e27405.
8. Moonan PK, Ghosh S, Oeltmann JE, Kammerer JS, Cowan LS, Navin TR. Using genotyping and geospatial scanning to estimate recent Mycobacterium tuberculosis transmission, United States. Emerg Infect Dis 2012; 18:458–65.
What is already known on this topic?
Tuberculosis (TB) genotyping, a laboratory-based genetic analysis of the bacteria that cause TB disease, provides sufficient discriminatory power to confirm or refute links in the chain of transmission. The TB Genotyping Information Management System (TB GIMS), a secure, online web portal accessible by public health authorities, facilitates systematic data collection of genotyping results and integrates genotyping results with epidemiologic, geographic, demographic, and clinical data.
What is added by this report?
Since 2004, >70,000 Mycobacterium tuberculosis isolates have been genotyped through partnerships between CDC, national genotyping laboratories, and state and local public health departments. National genotype surveillance coverage, or the proportion of culture-positive TB cases with a genotyped isolate increased from 51.2% in 2004 to 88.2% in 2010. Genotyping timeliness, represented by the median time from specimen collection until linked genotyping results and surveillance data are available to TB GIMS users, improved from 22 weeks in July 2010, to 11 weeks in December 2010.
What are the implications for public health practice?
As the United States strives toward TB elimination, genotype surveillance can lead to more timely outbreak detection and continued refinement of TB control activities, making the best use of limited public health resources at local, state, and national levels.

Morbidity and Mortality Weekly Report
726 MMWR / September 14, 2012 / Vol. 61 / No. 36
Notes from the Field
Highly Pathogenic Avian Influenza A (H7N3) Virus Infection in Two Poultry Workers — Jalisco, Mexico, July 2012
During June–August 2012, Mexico’s National Service for Health, Safety, and Food Quality reported outbreaks of highly pathogenic avian influenza (HPAI) A (H7N3) virus in poultry on farms throughout the state of Jalisco (1,2). This report describes two cases of conjunctivitis without fever or respira-tory symptoms caused by HPAI A (H7N3) virus infection in humans associated with exposure to infected poultry.
Patient 1. On July 7, a poultry worker aged 32 years com-plaining of pruritus in her left eye was examined at a clinic in Jalisco. Physical findings included redness, swelling, and tearing. Conjunctivitis was diagnosed; the patient was treated symptomatically and recovered fully. Because the patient had collected eggs in a farm where HPAI A (H7N3) virus was detected, the Institute for Epidemiological Diagnosis and Reference, Mexico, tested ocular swabs from both of her eyes for influenza A (H7) by real-time reverse transcription–polymerase chain reaction (rRT-PCR), and embryonated chicken eggs were inoculated for viral isolation. The swab mate-rial was positive for influenza A (H7) virus by rRT-PCR and virus was isolated from each eye. These findings were reported to the World Health Organization on July 19, and full genome sequences (CY125725–32) were uploaded to GenBank. The virus was closely related by nucleotide sequence to previously reported HPAI A (H7N3) viruses collected during poultry outbreaks in Jalisco with sequences available in GenBank (JX397993, JX317626).
Patient 2. A man aged 52 years, who was a relative of patient 1 and worked on the same farm, developed symptoms consistent with conjunctivitis on July 10 and sought care at a local clinic on July 13. He was treated symptomatically and recovered without sequelae. When public health authorities became aware of this patient, they obtained eye swabs, which were tested by rRT-PCR, revealing influenza A (H7).
Mexico has continued its efforts to contain poultry outbreaks in affected areas in Jalisco. Those efforts include quarantining affected farms, culling infected birds, vaccinating uninfected birds, and disinfecting contaminated areas. Government agencies also have provided personal protective equipment to farm personnel and are conducting active surveillance for influenza-like illness (ILI) and severe acute respiratory illness at two sentinel sites near the outbreak.
Avian influenza A viruses are designated as HPAI or low pathogenicity avian influenza (LPAI) based on molecular
characteristics of the virus and the ability of the virus to cause disease and mortality in birds (3). To date, only influenza A (H5) and (H7) subtypes have been described as HPAI. Influenza A (H7) subtype viruses have been detected in wild birds in many parts of the world and can cause outbreaks in poultry. Influenza A (H7) infection in humans is uncommon, but can occur after direct contact with infected birds, especially during outbreaks of influenza A (H7) virus among poultry (4). Illness can include conjunctivitis without fever, upper respiratory tract symptoms, or both (4,5), and severity can range from mild to fatal (4). In the United States, avian influenza outbreaks in poultry are rare, but they are detected and reported sporadi-cally. In the United States, only two cases of illness with LPAI A (H7) virus infection are known to have occurred in humans, both of whom recovered (6,7).
The conjunctivitis cases in Jalisco most likely represent HPAI A (H7N3) virus transmission from infected poultry to humans through direct contact. United States agricultural, public health, and clinical personnel should be aware of these poul-try outbreaks with transmission to humans in a neighboring country. Persons working with poultry known or suspected to be infected with influenza A viruses should use appropriate per-sonal protective equipment, including face masks, gloves and eye protection (e.g., goggles). Clinicians and epidemiologists should consider avian influenza A virus infection in patients who have conjunctivitis or ILI and have contact with poultry in areas with known avian influenza outbreaks. Clinicians who suspect avian influenza A virus infections in humans should obtain a conjunctival or respiratory specimen, or both, depend-ing on signs and symptoms, and submit samples to a national, regional, or state public health laboratory to enable specific influenza testing. Clinicians also should consider early empiric antiviral treatment of suspected cases with a neuraminidase inhibitor (8,9). Public health officials should survey family members and contacts of infected persons to find cases of human-to-human transmission.
Reported by
Gisela Barrera-Badillo, MSc, Ernesto Ramirez-Gonzalez, PhD, Rodrigo Aparicio-Antonio, Tatiana Nuñez-Garcia, Dayanira Arellano-Suarez, Patricia Alcantara-Perez, MSc, Abril Rodriguez-Maldonado, Brisia Rodriguez-Reyes, Claudia Wong-Arambula, Elizabeth Gonzalez-Duran, MSc, Joanna Ortiz-Alcantara, MSc, Alberto Diaz-Quiñonez, PhD, Irma Lopez-Martinez, MSc, Instituto de Diagnóstico y Referencia Epidemiológicos; Gustavo Reyes-Teran, MPH, Joel Vazquez-Perez, PhD, Santiago

Morbidity and Mortality Weekly Report
MMWR / September 14, 2012 / Vol. 61 / No. 36 727
Avila-Rios, PhD, Instituto Nacional de Enfermedades Respiratorias; Guadalupe Castañeda-Lopez, MD, Armando Robles-Cruz, MD, Hector Montoya-Fuentes, PhD, Victor Borja-Aburto, PhD, Instituto Mexicano del Seguro Social; Cuitlahuac Ruiz-Matus, MD, Jesus Felipe Gonzalez-Roldan, MD, Dirección General de Epidemiología; Pablo Kuri-Morales, MD, Subsecretaría de Prevención y Promoción de la Salud, Mexico. Todd Davis, PhD, Julie Villanueva, PhD, Vic Veguilla, MPH, Marc-Alain Widdowson , DVM, Jo s eph Bre s e e , MD, Eduardo Azziz-Baumgartner, MD, Jerome Tokars, MD, Timothy Uyeki, MD, Alexander Klimov, PhD, Stephen Lindstrom, PhD, Bo Shu, MD, Nancy Cox, PhD, Influenza Div, National Center for Immunization and Respiratory Diseases, CDC. Corresponding contributor: Alberto Díaz-Quiñonez, [email protected], 555-341-1101 (Mexico).
References 1. Food and Agriculture Organization. Highly pathogenic avian influenza
in Mexico (H7N3)—a significant threat to poultry production not to be underestimated. Empress Watch 2012;26:1–9.
2. World Organization for Animal Health. Update on highly pathogenic avian influenza in animals (type H5 and H7). Paris, France: World Organization for Animal Health; 2012. Available at http://www.oie.int/animal-health-in-the-world/update-on-avian-influenza/2012. Accessed September 4, 2012.
3. Infection with viruses of notifiable avian influenza. [Chapter 10.4]. In: Terrestrial Animal Health Code. Paris, France: World Organization for Animal Health; 2012. Available at http://www.oie.int/fileadmin/home/eng/health_standards/tahc/2010/en_chapitre_1.10.4.htm. Accessed September 11, 2012
4. Koopmans M, Wilbrink B, Conyn M, et al. Transmission of H7N7 avian influenza A virus to human beings during a large outbreak in commercial poultry farms in the Netherlands. Lancet 2004;363:587–93.
5. Skowronski D, Tweed S, Petric M, Booth T, Li Y, Tam T. Human illness and isolation of low-pathogenicity avian influenza virus of the H7N3 subtype in British Columbia, Canada. J Infect Dis 2006;193:899–900.
4. Ostrowsky B, Huang A, Terry W, et al. Low pathogenic avian influenza A (H7N2) virus infection in an immunocompromised adult, New York, USA, 2003. Emerg Infect Dis 2012;18:1128–31.
7. Edwards LE, Terebuh P, Adija A, et al. Serological diagnosis of human infection with avian influenza A (H7N2) virus [Abstract 60, Session 44]. Presented at the International Conference on Emerging Infectious Diseases 2004, Atlanta, Georgia, February 22–March 3, 2004.
8. CDC. Antiviral agents for the treatment and chemoprophylaxis of influenza: recommendations of the Advisory Committee on immunization Practices (ACIP). MMWR 2011;60(No. RR-1).
9. World Health Organization. WHO guidelines for pharmacological management of pandemic influenza A(H1N1) 2009 and other influenza viruses. Part I: recommendations. Geneva, Switzerland: World Health Organization; 2010. Available at http://www.who.int/csr/resources/publications/swineflu/h1n1_guidelines_pharmaceutical_mngt.pdf. Accessed September 11, 2012.

Morbidity and Mortality Weekly Report
728 MMWR / September 14, 2012 / Vol. 61 / No. 36
Announcement
Clinical Vaccinology Course — November 2–4, 2012 CDC and seven other national organizations are collabo-
rating with the National Foundation for Infectious Diseases (NFID), Emory University School of Medicine, and the Emory Vaccine Center to sponsor a Clinical Vaccinology Course November 2–4, 2012, at the Hyatt Regency Miami in Miami, Florida. Through lectures and interactive case pre-sentations, the course will focus on new developments and concerns related to the use of vaccines in pediatric, adolescent, and adult populations. Leading infectious disease experts, including pediatricians, internists, and family physicians, will present the latest information on newly available vaccines and vaccines in the pipeline, as well as established vaccines, for which continued administration is essential to improving disease prevention efforts.
This course is designed specifically for physicians, nurses, nurse practitioners, physician assistants, pharmacists, vaccine program administrators, and other health-care professionals involved with or interested in the clinical use of vaccines. The course also will be of interest to health-care professionals involved in the prevention and control of infectious diseases, such as federal, state, and local public health officials. Course participants should have a knowledge of or interest in vaccines and vaccine-preventable diseases.
Continuing education credits will be offered. Information regarding the program, registration, and hotel accommo-dations is available at http://www.nfid.org, or by e-mail ([email protected]), fax (301-907-0878), telephone (301-656-0003, ext. 19), or mail (NFID, 4733 Bethesda Avenue, Suite 750, Bethesda, MD 20814-5228).

Morbidity and Mortality Weekly Report
MMWR / September 14, 2012 / Vol. 61 / No. 36 729
* Deaths attributed to exposure to natural heat, as the underlying and contributing causes of death, are coded as X30 and T67, according to the International Classification of Diseases, 10th Revision.
† U.S. residents only.§ Data for 2010 are preliminary.
From 1999 to 2010, a total of 7,415 deaths in the United States, an average of 618 per year, were associated with exposure to excessive natural heat. The highest yearly total of heat-related deaths (1,050) was in 1999 and the lowest (295) in 2004. Approximately 68% of heat-related deaths were among males.
Source: National Vital Statistics System. Mortality public use data files, 1999–2009. Available at http://www.cdc.gov/nchs/data_access/vitalstatsonline.htm.
Reported by: Jiaquan Xu, MD, [email protected], 301-458-4086.
MaleFemale
No.
of d
eath
s
Year
0
100
200
300
400
500
600
700
800
1999 2000 2001 2002 2003 2004 2005 2006 2007 2008 2009 2010
QuickStats
FROM THE NATIONAL CENTER FOR HEALTH STATISTICS
Number of Heat-Related Deaths,* by Sex — National Vital Statistics System, United States,† 1999–2010§


U.S. Government Printing Office: 2012-523-043/02029 Region IV ISSN: 0149-2195
The Morbidity and Mortality Weekly Report (MMWR) Series is prepared by the Centers for Disease Control and Prevention (CDC) and is available free of charge in electronic format. To receive an electronic copy each week, visit MMWR’s free subscription page at http://www.cdc.gov/mmwr/mmwrsubscribe.html. Paper copy subscriptions are available through the Superintendent of Documents, U.S. Government Printing Office, Washington, DC 20402; telephone 202-512-1800.
Data presented by the Notifiable Disease Data Team and 122 Cities Mortality Data Team in the weekly MMWR are provisional, based on weekly reports to CDC by state health departments. Address all inquiries about the MMWR Series, including material to be considered for publication, to Editor, MMWR Series, Mailstop E-90, CDC, 1600 Clifton Rd., N.E., Atlanta, GA 30333 or to [email protected].
All material in the MMWR Series is in the public domain and may be used and reprinted without permission; citation as to source, however, is appreciated.
Use of trade names and commercial sources is for identification only and does not imply endorsement by the U.S. Department of Health and Human Services.
References to non-CDC sites on the Internet are provided as a service to MMWR readers and do not constitute or imply endorsement of these organizations or their programs by CDC or the U.S. Department of Health and Human Services. CDC is not responsible for the content of these sites. URL addresses listed in MMWR were current as of the date of publication.
Morbidity and Mortality Weekly Report