Household financial Twelfth survey comfort report. Jun 2017.
52
Household financial comfort report. Twelfth survey published Jun 2017. Insights from national research into the financial psychology of Australian households. A growing number of households are expecting their financial comfort to worsen due to the cost of necessities, future mortgage rate rises and income woes.
Transcript of Household financial Twelfth survey comfort report. Jun 2017.

Household financial comfort report.
Twelfth survey published Jun 2017.
Insights from national research into the financial psychology of Australian households.
A growing number of households are expecting their financial comfort to worsen due to the cost of necessities, future mortgage rate rises and income woes.

About this report.
The ME Household Financial Comfort Report provides in-depth and critical insights into the financial situation of Australians based on a survey of 1,500 households.
The survey is designed, developed and produced biannually by industry super fund-owned bank ME with assistance from DBM Consultants and Economics & Beyond.
This edition presents the findings from the 12th survey, conducted in June 2017.
Survey history
• First edition: October 2011• Second edition: June 2012• Third edition: December 2012• Fourth edition: June 2013• Fifth edition: December 2013• Sixth edition: June 2014• Seventh edition: December 2014• Eighth edition: June 2015• Ninth edition: December 2015• Tenth edition: June 2016• Eleventh edition: December 2016
This Report includes but is not limited to, the Household Financial Comfort Index, an overall measure of households’ perceptions of their financial comfort, generated by asking respondents to estimate their financial comfort, expectations and confidence across 11 measures.
Over time, the Report tracks changes in comfort and in doing so, highlights the ongoing – and potentially shifting – differences between household types, in terms of financial comfort and behaviours in managing finances.
About.
ME is 100% owned by Australia’s leading industry super funds.
Contact ME.
Matthew Read, Head of Public Relations
T 0432 130 338
Level 28, 360 Elizabeth Street Melbourne, VIC 3000 Australia
mebank.com.au

Content.
Table of figures. 1
01. Executive summary. 2
02. Economic context. 3
03. Households feeling comfortable now, but concerned about the future. 53.1 Improved household financial comfort index. 5
3.2 High cost of necessities means cut backs for some & less left over for others. 7
3.3 Debt concerns expected to rise. 8
3.4 Income woes and underemployment hurting lower income households. 11
04. Latest trends in household financial comfort. 154.1 Financial comfort up across 10 out of 11 index components. 15
4.2 Financial comfort mixed across most households. 16
4.3 Gap in financial comfort across generations. 17
4.4 Financial comfort across housing tenures. 19
4.5 Most states feeling better. 23
4.6 Financial comfort up across most workforce segments. 25
05. Other findings. 275.1 Higher confidence in both job security and availability. 27
5.2 Increased comfort with income. 29
5.3 Comfort with cash savings increases further. 30
5.4 Improved confidence in coping with a short-term income loss. 34
5.5 Monthly expenses. 36
5.6 Overall comfort with debt improves. 37
5.7 Investments. 39
5.8 Superannuation. 41
5.9 Overall level of wealth (net). 45
06. Appendix a – Household statistics. 46
07. Appendix b – Methodology. 47

4 June 2017 – Household financial comfort report
“ Our greatest worry is the higher cost of living without any pay rises.”Couple with older childrenNew South Wales
Household financial comfort report – June 2017 1
Table of figures.
Figure 1 − Changes to the Household Financial Comfort Index. Scores out of 10. 5Figure 2 − Changes to expectations for household’s financial situation in the next year.. Scores out of 10. 6Figure 3 − Biggest worries and positives nominated by households. June 2017. 7Figure 4 − % of disposable income paid towards a mortgage or rent. 8Figure 5 − How a 1% rise the RBA cash rate would affect households. 9Figure 6 − % of households that reported ‘income changes’ over the past year. 10Figure 7 − Financial comfort versus income change during the past year. Scores out of 1. 11Figure 8 − Income changes across various income bands. 12Figure 9 − Financial comfort by annual household income. 12Figure 10 − ‘Part-time’ and ‘casual’ workers’ preference for hours worked. 13Figure 11 − The 11 components that make up the Index, showing changing levels. of comfort over time. Scores out of 10. 15Figure 12 − Financial comfort across different households. Scores out of 10. 16Figure 13 − Financial comfort across generations. Scores out of 10. 17Figure 14 − Financial comfort across young singles/couples and students. Scores out of 10. 18Figure 15 − Overall financial comfort based on home ownership. Scores out of 10. 19Figure 16 − Comfort by status of mortgage. 20Figure 17 − Proportion of households who have worried a great deal (rating of 10) regarding their scheduled mortgage repayments or rent over the past month. 21Figure 18 − Proportion not meeting the current minimum repayment on their home loan. 22Figure 19 − Changes in financial comfort across states and territories. Scores out of 10. 23Figure 20 − Comfort index across metropolitan and regional Australia. Scores out of 10. 24Figure 21 − Financial comfort across larger states and metropolitan areas. Scores out of 10. 24Figure 22 − Financial comfort across the workforce. Scores out of 10. 25Figure 23 − % of households feeling ‘secure about their job in the last month’. 27Figure 24 − % of households reporting it would be ‘easy’ to get a job in 2 months if unemployed. 28Figure 25 − Comfort with income. Scores out of 10. 29Figure 26 − Comfort with cash savings. Scores out of 10. 30Figure 27 − How much cash savings do households currently hold? 31Figure 28 − Amount saved/spent among those who are saving and overspending. 32Figure 29 − Proportion who are saving, overspending and breaking even each month. 33Figure 30 − Confidence in ability to handle an emergency, if you lost your income for three months. Scores out of 10. 34Figure 31 − Ability to raise $3,000 in a week for an emergency. 35Figure 32 − Comfort with ability to pay regular expenses. Scores out of 10. 36Figure 33 − Comfort with household’s level of debt. Scores out of 10. 37Figure 34 − % net increases for debt. 38Figure 35 − Comfort with level of investments. Scores out of 10. 39Figure 36 − What financial risk would you be willing to take with your investments? 40Figure 37 − Expectations for comfort in household’s standard of living in retirement. Scores out of 10. 41Figure 38 − Additional payments into superannuation in the last six months. 42Figure 39 − How will your household fund retirement? 43Figure 40 − Expectations for adequacy of income in retirement. 44Figure 41 − Comfort with net wealth. Scores out of 10. 45

2 June 2017 – Household financial comfort report
Rising cost of necessities, low wage growth and future rate rises causing financial stress.Despite ME’s overall household financial comfort index rising 2% to 5.51 out of 10 in the six months to June 2017, ME’s 12th Household Financial Comfort Report shows a growing number of households expect their financial comfort to worsen.
The Report shows three key areas of concern for Australian households:
1. Cost of necessities is the top worry for Australian households.
According to the Report, the increasingly high cost of necessities – including energy, fuel and even groceries – is a major pain point among Australians.
The Report found about half of Australians have no spare cash at the end of each month (51% typically spend all their income or more), while in the past 12 months only 32% of households reported higher incomes.
Of households whose financial situation worsened in the six months to June 2017, almost 40% claimed the cost of necessities as the primary reason.
While retail inflation is low, in general, hikes in the cost of necessities such as fuel, household gas and electricity are the biggest worry for over 40% of households.
The Report finds households have been hit with bill shock in the first half of 2017 and are anticipating more to come. This is unsurprising given the much publicised energy price hikes from July 1.
2. Forecast interest rate rises causing major concerns.
With mortgage interest rates up significantly over the past six months, apprehension about future interest rate rises is adding to households’ future pessimism – especially those with mortgages.
A third (31%) of households expect to be worse off financially if the RBA raises the official cash rate by 1% from its record low of 1.5%, including half (47%) of those with a mortgage, while only 7% with high comfort levels (typically high income and/or wealthy Australians) expect to be worse off.
On average, mortgaged households are paying over a third of their post-tax income on their repayments, but 15% are paying more than half and 48% are paying more than 30% of their post-tax income.
Speculation the RBA will lift the cash rate is causing households concern as it will impact monthly cash flows and ability to pay off debts, save and spend. Gen Xers (41%), single parents (36%), and to a lesser degree, couples with young children (35%), expressed the most concern about potential rate rises.
This will continue to be an important factor in household financial comfort, especially since the RBA has marked 3.5% as the new norm for the neutral cash rate – well above the current actual cash rate.
The Report also shows owner-occupier borrowers expect to be worse off than investors, 53% vs 35% respectively, while households that expect to be better off include those that own their home outright (38%), earn over $100,000 (36%) and retirees (32%), reflecting a growing income, housing and financial comfort divide across Australian households.
3. Income woes and underemployment exacerbating the problem.
While there have been some recent improvements in the labour market, weak household income and underemployment are hurting the financial comfort of most households, particularly those earning less than $100,000.
The proportion who felt they could ‘somewhat or very easily find a new job within two months if they became unemployed’ increased from 37% to 42%, coupled with the 6 point increase to 69% of households feeling secure with their job, likely contributed to a 3% rise in comfort with income in the six months to June 2017.
Yet while households with annual incomes over $200,000 recorded a ‘double digit’ rise in financial comfort (up 10% to 7.85), those earning under $40,000 per annum saw no change (static at 4.43).
Six months ago, we saw a clear income divide emerging between the rich and poor and in this Report, this gap is exacerbated further.
The average Australian household (those earning $75,000 − $100,000) is showing signs of subdued income growth, with 44% seeing no change in their income during the past financial year.
Over a quarter of all households (27%) reported income cuts in the past year, rising to almost half of households earning less than $40,000 (45%), while households earning more than $100,000 were least likely to report income cuts (17%), and the most likely to have seen an income rise (46%).
Underemployment is also feeding into household concerns and many employed persons are looking for more hours of work, with 27% of casual and part-time workers eager to increase the hours they work and one in five (20%) wanting to change their status to full-time.
Executive summary. 01.

Household financial comfort report – June 2017 3
Overall, Australian household finances, on average, remained relatively resilient during the first half of 2017. However, macroeconomic and financial vulnerabilities have increased further related to sluggish household incomes, rising debts and disparate housing markets, though risks differ markedly across regions and households.
The strong recovery in household wealth has continued, with solid asset gains (especially housing and superannuation) partly offset by increased gearing and higher long-term bond yields. Most households are also well supported by stronger jobs growth and wage gains (albeit subdued). On the other hand, both consumer sentiment and household consumption growth have remained a bit below average and the household saving ratio has eased further. Debt has continued to increase faster than income, but slower than assets. Debt servicing costs have begun to rise, due to continued gearing and higher residential loan rates – albeit a small rise mainly on borrowings by residential investors.
Recent trends and reports have shown:
Consumer confidence measures remained below their long run averages − pessimists slightly outnumber optimists.
Labour market conditions have been mixed – the unemployment rate has fallen a bit, employment growth has picked up, but underemployment is higher and wages growth remains subdued. Job gains picked up with a strong rise in full-time employment after declining over much of 2016, while part-time job gains remained strong. The employment to population ratio has trended higher with more people at work. The unemployment rate has trended a bit lower to around 5.6% in June 2017. In contrast, the quarterly trend underutilisation rate (both unemployed and underemployed) was 14.5% in May – much the same as six months ago, but significantly higher than a year ago – as many part-time/casual workers would like and are able to work extra hours. Labour costs remain weak; annual wages growth has moderated to a historically low pace in all states and industries – consistent with a time of considerably higher unemployment.
Household consumption growth has remained a bit below its historical long-term pace – supported by very low interest rates and sustained wealth gains (mainly related to housing for some households), despite subdued income gains. With still relatively low disposable income growth, as measured by the official data, the household saving rate from current disposable income has continued to trend slowly lower, but remains relatively high, on average. Inflation has remained low – across most retail goods and services. In contrast, inflation in fuel and utilities prices has picked up.
Residential house prices continued to vary a great deal across Australia − with strong annual growth in Sydney (up over 12%) and Melbourne (up 14%) and much weaker results in most other capitals and regions – including lower house prices in Perth (-2%). In Perth, there has been a sharp rise in rates and fall in rents. Elsewhere, rent inflation remains subdued, while vacancy rates are around their long run averages, except for apartments in Brisbane and Melbourne where there has been a large increase in supply.
Household debt increases have stabilised during the past six months – with annual growth in housing credit steady at around 6.5%, compared to a recent peak of about 7.5% in late 2015 – albeit well above the pace of income gains and below the rise in wealth. Recent tightening in prudential and lending standards and related increases in housing loan rates can be expected to slow housing credit further. Other personal loans (such as credit cards and equity backed loans) have contracted a bit – down by 1% during the year to May.
‘Real’ household assets, on average, have continued to increase relatively strongly, compared to income and, to a lesser extent debt, mainly reflecting further significant rises in residential property prices. Financial assets (mainly super) have also continued to rise during 2016/17, largely due to continued compulsory contributions.
As a result, the aggregate financial position of households – as measured by household net wealth (assets less debt) – continued to improve to reach new record highs relative to both income and liabilities. In aggregate, debt to income has risen a little further over the past six months, while debt to assets (or leverage) has fallen slightly – asset gains (especially housing) have outpaced increased debt. Debt servicing burdens have increased slightly – albeit from historically low levels (relative to income), as households continued to borrow and loan rates have risen, despite the unchanged official cash rate.
Aggregate household financial stress indicators (such as housing and other loans in arrears and property possessions) are low generally, but rising and disparate among households. Households, on average, are coping reasonably well with debt servicing burdens due to still relatively low borrowing costs. However, some households have debt levels that make sense in ‘good times’, not allowing for the fact that ‘bad’ times may arise unexpectedly. Other households are close to their maximum risk position, not taking into account that loan rates inevitably will rise.
Economic context. 02.

4 June 2017 – Household financial comfort report
“ We live a frugal lifestyle now to maximise our savings in the future.”Couple with young childrenQueensland

Household financial comfort report – June 2017 5
3.1 Improved household financial comfort index.
The Household Financial Comfort Index (see Figure 1) improved slightly, increasing 2% to 5.51 out of 10 over the six months to June 2017 or 3% over 2016/17. This is the highest result since December 2015, but still way below the high reported in December 2014.
In terms of key components of the Household Financial Comfort Index, households reported modest increases in comfort with ‘anticipated standard of living in retirement’ (up 5% to 5.18),
‘household income’ (up 3% to 5.72), ‘short-term cash savings’ (up 3% to 5.07), and ‘long-term investments’ (up 3% to 4.99).
These improvements could be a reflection of the continued strong rise in asset prices – especially houses and both global and Australian equities as well as a pickup in employment during the past six months. However, weak wages growth persists across most regions.
Households feeling comfortable now, but concerned about the future. 03.
In ME’s latest Household Financial Comfort Report, Australian households reported a slight improvement in comfort during the past six months to June 2017, in particular with ‘income’, ‘savings’ and ‘investments’.
But a growing number of households are expecting their financial comfort to worsen in the future. This is related to the cost of necessities and their ability to manage debt compounded by subdued income growth and underemployment.
Oct 11 Jun 12 Dec 12 Jun 13 Dec 13 Jun 14 Jun 15Dec 14 Dec 15 Jun 16 Dec 16 Jun 17
5.60
5.80
5.40
5.20
5.00
The long-term averageis 5.44 out of 10
5.51
5.20
5.39
5.29
5.50 5.52
5.33
5.78
5.41
5.59
5.375.41
Figure 1 – Changes to the Household Financial Comfort Index. Scores out of 10.

6 June 2017 – Household financial comfort report
The only component of the comfort index that declined was ‘changes in household financial situation anticipated in the next year’, down 1% during the past six months to June 2017 to be 3% lower during the past year to an index of 5.31 out of 10 – see Figure 2. This marks the third consecutive Report where expectations for future financial comfort has declined, falling 4% since December 2015.
For more details on key components of the Household Financial Comfort Index, refer to Section 4.1.
Figure 2 – Changes to expectations for household’s financial situation in the next year.
Oct 11 Jun 12 Dec 12 Jun 13 Dec 13 Jun 14 Jun 15Dec 14 Dec 15 Jun 16 Dec 16 Jun 17
5.60
5.80
5.40
5.20
5.00

Household financial comfort report – June 2017 7
3.2 High cost of necessities means cut backs for some & less left over for others.
One of the key reasons why a growing number of households are expecting their financial comfort to worsen in the future is the ‘cost of necessities’, such as electricity, which was forecast to rise by up to 20% in some states from 1 July 2017.
About 50% of Australians have no spare cash flow at the end of each month and over the past year only around 30% of households have reported higher incomes (see more in Section 3.4).
The ‘cost of necessities’ such as fuel, utilities and groceries was reported as households’ biggest worry, rising 2 points to 44% of households in the past six months to June 2017 – see Figure 3.
Similarly, of the 32% households that reported their financial situation ‘worsened over the past year’, the top reason cited was the ‘cost of necessities/inflation/cost of living’.
Common statements from respondents included:
“Everything has gone up and exceeded my increases in pay. I find I’m spending more on essentials and insurances and have a lot less left over.”
“My wage hasn’t increased for years and my wife’s Centrelink payments have now reduced significantly due to one of my sons turning 18.”
“I’m now not working, all essential services and expenses have increased, and my children are getting older therefore costing more money.”
Cost of necessities (e.g. fuel, utilities, groceries)
Level of savings/cash on hand
Ability to maintain lifestyle in retirement/standard of living in retirement
Being able to make ends meet
How the global economy will a�ect Australia
Security of my job or my partner's job
Impact of legislative change on my financial situation
Level of government assistance available
Value of cash investments (e.g. superannuation, managed funds, shares)
My level of personal/household debt (e.g. credit card bills, money owed on personal loans)
Ability to purchase and/or pay o� property to live in
Changes to personal taxes
Ability to purchase and/or pay o� an investment property
-44%
-33%
-33%
-29%
-26%
-22%
-20%
-18%
-18%
-17%
-16%
-11%
-7%
11%
18%
14%
32%
5%
16%
3%
11%
12%
20%
10%
4%
5%
Figure 3 – Biggest worries and positives nominated by households. June 2017.

8 June 2017 – Household financial comfort report
Figure 4 − % of disposable income paid towards a mortgage or rent.
3.3 Debt concerns expected to rise.
Further to the cost of necessities, a growing number of households are expecting their ability to manage debt to deteriorate in the future – especially if mortgage interest rates rise significantly.
Currently, around 1 in 10 are putting more than 60% of their disposable income towards housing payments – see Figure 4.
In total, 48% of households currently paying off a mortgage are spending more than 30% of their disposable income on their housing repayments.
15%
20%
30%
25%
10%
5%Total
Those paying o� a mortgage
Those renting
4%5%
2%
15%
21%
9%
23%
26%
19%
23%21%
24%
16%
12%
20%
9%7%
11% 11%
8%
14%
10% or less
More than10% upto 20%
More than20% upto 30%
More than30% upto 40%
More than40% upto 50%
More than50% upto 60%
Greaterthan 60%
0%
Household financial comfort report – June 2017 9
Figure 5 – How a 1% rise in the RBA cash rate would affect households.
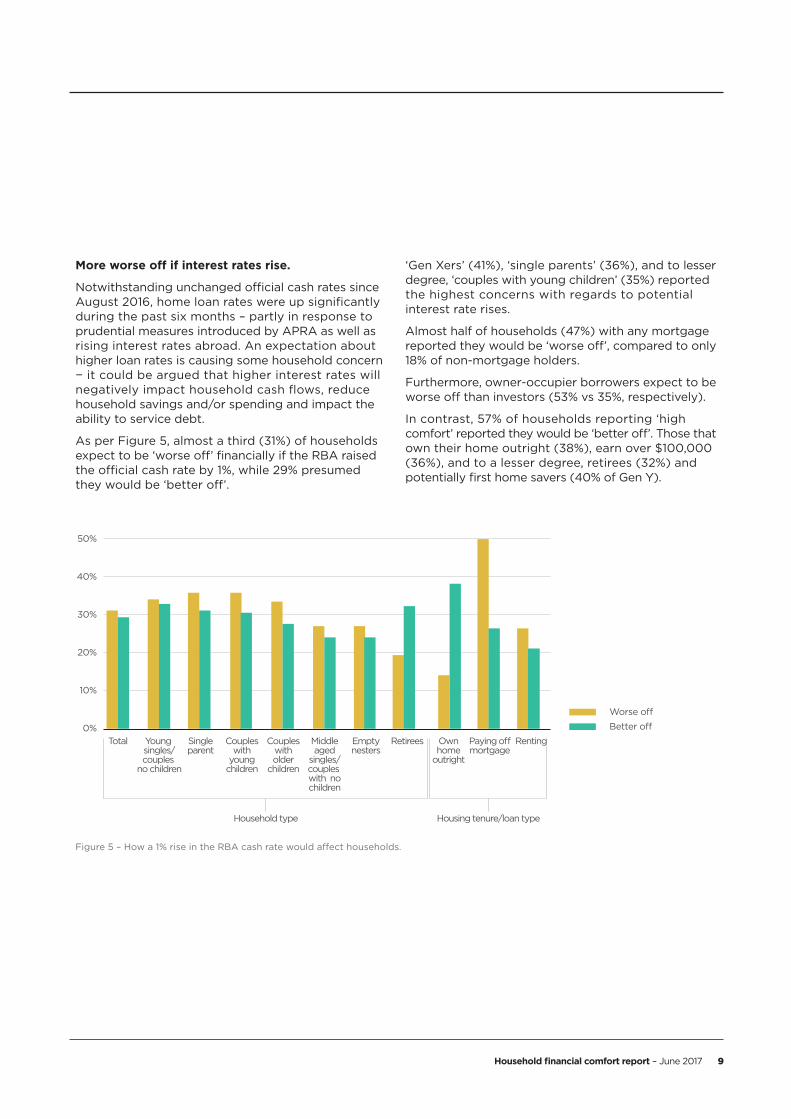
More worse off if interest rates rise.
Notwithstanding unchanged official cash rates since August 2016, home loan rates were up significantly during the past six months – partly in response to prudential measures introduced by APRA as well as rising interest rates abroad. An expectation about higher loan rates is causing some household concern − it could be argued that higher interest rates will negatively impact household cash flows, reduce household savings and/or spending and impact the ability to service debt.
As per Figure 5, almost a third (31%) of households expect to be ‘worse off’ financially if the RBA raised the official cash rate by 1%, while 29% presumed they would be ‘better off’.
‘Gen Xers’ (41%), ‘single parents’ (36%), and to lesser degree, ‘couples with young children’ (35%) reported the highest concerns with regards to potential interest rate rises.
Almost half of households (47%) with any mortgage reported they would be ‘worse off’, compared to only 18% of non-mortgage holders.
Furthermore, owner-occupier borrowers expect to be worse off than investors (53% vs 35%, respectively).
In contrast, 57% of households reporting ‘high comfort’ reported they would be ‘better off’. Those that own their home outright (38%), earn over $100,000 (36%), and to a lesser degree, retirees (32%) and potentially first home savers (40% of Gen Y).
30%
40%
50%
20%
10%
Worse o�
Better o�
RentingTotal Young singles/couples
no children
Singleparent
Coupleswith
youngchildren
Coupleswitholder
children
Household type Housing tenure/loan type
Middleaged
singles/couples with nochildren
Emptynesters
Ownhome
outright
Paying o�mortgage
Retirees0%

10 June 2017 – Household financial comfort report
Ability to manage debt expected to decline in the future.
While the majority of households expect to manage their debt well in the future, the proportion of households expecting to repay and service their debt in the next 6-12 months has deteriorated, compared to the previous Report.
Households expecting to ‘not meet their required minimum payment on their debt’ increased by 4 points to 9% and households anticipating to ‘just manage to make the minimum payments’ increased by 2 points to 33%.
In contrast, households ‘expecting to pay a little/lot more than the minimum payments on their debts’ decreased by 6 points to 58%. Put another way, there was a significant deterioration in household expectations to be able to manage their current debt over the next year.
‘Single parents’ (up 6 points to 19%), followed by ‘couples with young children’ (up 4 points to 10%) reported the highest expectations with regards to their ability to ‘not meet their required minimum payment on their debt’.
By mortgage type, slightly more investors expect to ‘not meet their required minimum payment on their debt’ than owner-occupiers (both up 2 points to 7% vs 5%, respectively). Households with no mortgage but that may have credit cards or other unsecured personal debt are the most pessimistic, with 12% not expecting to meet minimum repayments (up 5 points since December 2016).
Furthermore, about 10% of households living in a property valued less than $300,000 and almost 20% of people on annual incomes of less than $40,000 expect to be unable to meet minimum debt repayments.
Oct 11 Jun 12 Dec 12 Jun 13 Dec 13 Jun 14 Jun 15Dec 14 Dec 15 Jun 16 Dec 16 Jun 17
30
40
50
20
10
0
% o
f ho
useh
old
s
Can just manage to make minimum payments on my debt
Can pay a lot more than the minimum payments on my debt
Can pay a little bit more than the minimum payments on my debt
Cannot meet my required minimum payments on my debt
Figure 6 − % of households that reported ‘income changes’ over the past year.

Household financial comfort report – June 2017 11
Figure 7 − Financial comfort versus income change during the past year.
3.4 Income woes and underemployment hurting lower income households.
Concerns with regards to the high cost of necessities and managing debt were compounded by subdued income growth and underemployment (a lack of jobs and people wanting significantly more hours of work).
Subdued income gains, especially among casual workers and those on government income support.
Despite recent job gains and a fall in the rate of unemployment, wage growth for the majority of Australians remains historically low – consistent with historically higher unemployment. From a macroeconomic perspective, there has been a continued shift from full-time jobs towards part-time jobs as well as jobs with lower wage rates. Income from some investments has also fallen – notably bank term deposits, other savings accounts, falling rental incomes on investment properties in Perth and some mining regions as well as apartments in some metropolitan cities.
About a third of households reported ‘annual income increases’ − one of the lowest on record, unchanged over the past six months to June 2017 and down 6% over the past year to June 2017. Meanwhile, 40% reported their ‘income remained the same’ (down 1 point) and over a quarter recorded their ‘income decreased’ (unchanged at 27%).
Across the workforce, casual workers and to a lesser degree part-time workers were the most likely to report that household income was unchanged or fell during the past year at 76% and 65% respectively. In contrast, almost 50% of full-time workers reported income increases during 2016/17.
Of those not in the workforce, there was a high propensity to report that incomes were unchanged or fell during 2016/17 – particularly among unemployed persons (91%), retired (80%) and students (76%).
Oct 11 Jun 12 Dec 12 Jun 13 Dec 13 Jun 14 Jun 15Dec 14 Dec 15 Jun 16 Dec 16 Jun 17
35%
40%
45%
30%
25%
20%
Income remained the same
Income increased
Income decreased
12 June 2017 – Household financial comfort report
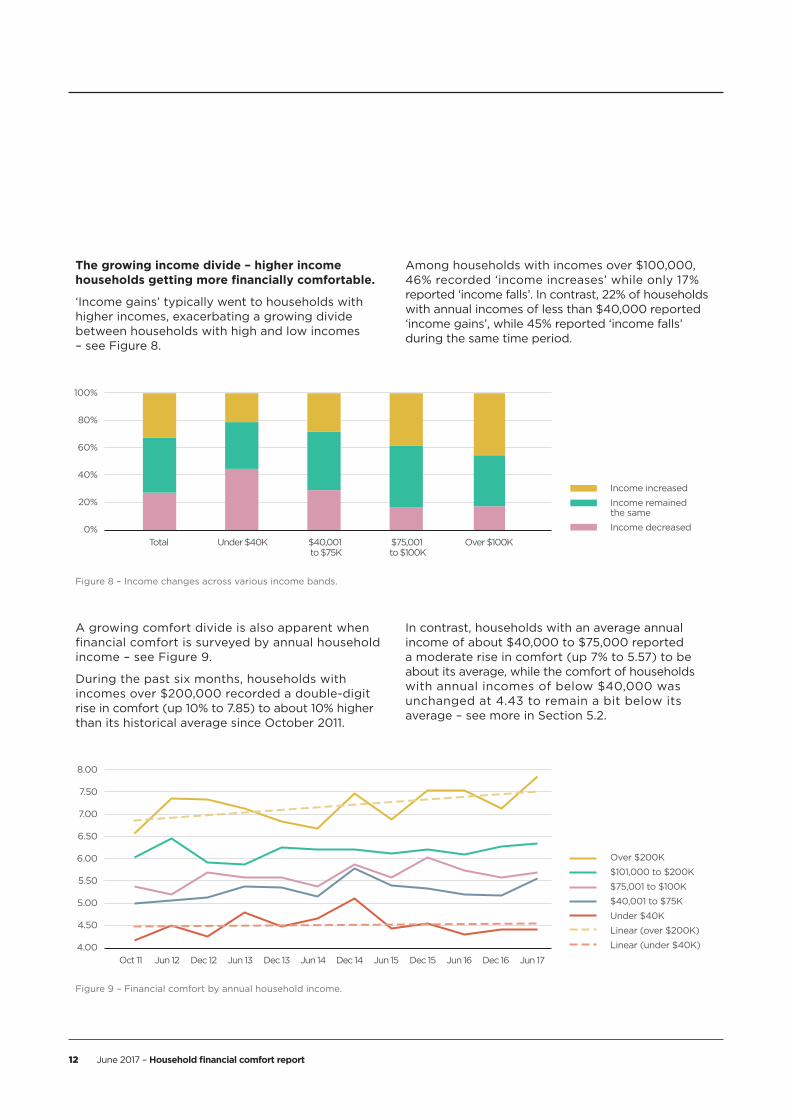
The growing income divide – higher income households getting more financially comfortable.
‘Income gains’ typically went to households with higher incomes, exacerbating a growing divide between households with high and low incomes – see Figure 8.
Among households with incomes over $100,000, 46% recorded ‘income increases’ while only 17% reported ‘income falls’. In contrast, 22% of households with annual incomes of less than $40,000 reported ‘income gains’, while 45% reported ‘income falls’ during the same time period.
A growing comfort divide is also apparent when financial comfort is surveyed by annual household income – see Figure 9.
During the past six months, households with incomes over $200,000 recorded a double-digit rise in comfort (up 10% to 7.85) to about 10% higher than its historical average since October 2011.
In contrast, households with an average annual income of about $40,000 to $75,000 reported a moderate rise in comfort (up 7% to 5.57) to be about its average, while the comfort of households with annual incomes of below $40,000 was unchanged at 4.43 to remain a bit below its average – see more in Section 5.2.
Total Under $40K $40,001 to $75K
$75,001 to $100K
Over $100K
60%
80%
100%
40%
20%
0%
Income increased
Income remained the same
Income decreased
Figure 8 – Income changes across various income bands.
Figure 9 – Financial comfort by annual household income.
Oct 11 Jun 12 Dec 12 Jun 13 Dec 13 Jun 14 Jun 15Dec 14 Dec 15 Jun 16 Dec 16 Jun 17
5.50
6.00
6.50
7.00
7.50
8.00
5.00
4.50
4.00
Over $200K
$101,000 to $200K
$75,001 to $100K
$40,001 to $75K
Under $40K
Linear (over $200K)
Linear (under $40K)
Household financial comfort report – June 2017 13
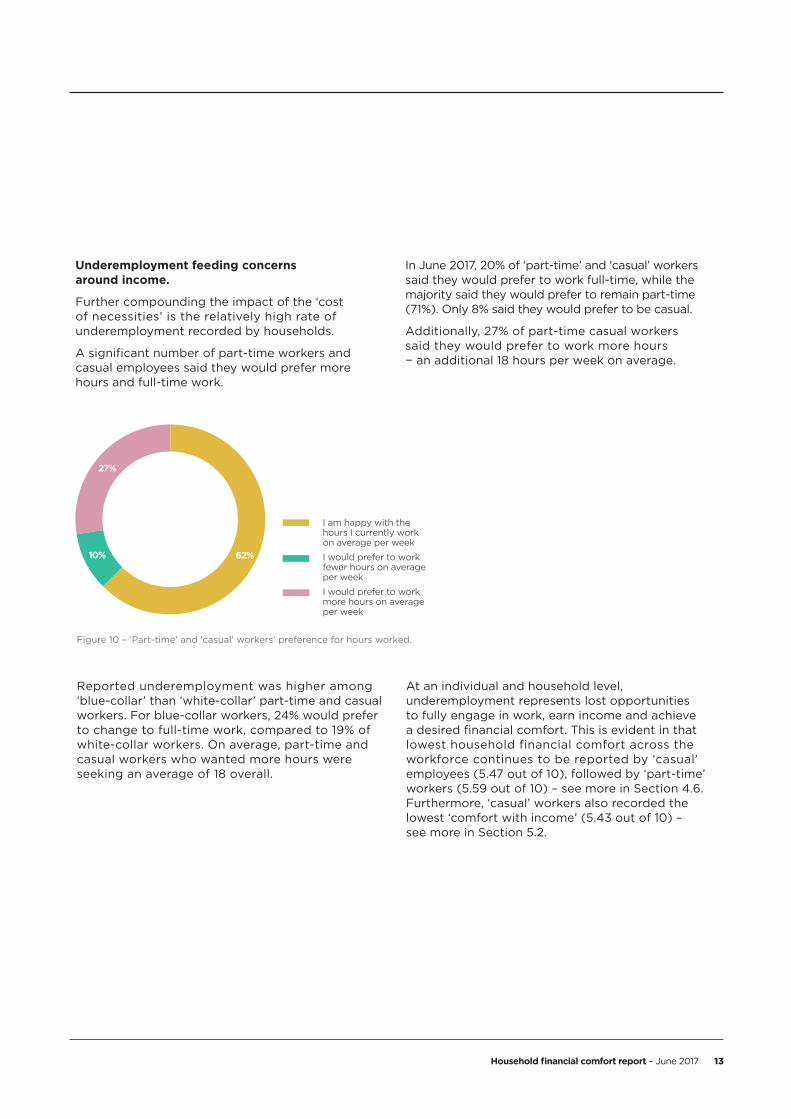
Figure 10 – ‘Part-time’ and ‘casual’ workers’ preference for hours worked.
Underemployment feeding concerns around income.
Further compounding the impact of the ‘cost of necessities’ is the relatively high rate of underemployment recorded by households.
A significant number of part-time workers and casual employees said they would prefer more hours and full-time work.
In June 2017, 20% of ‘part-time’ and ‘casual’ workers said they would prefer to work full-time, while the majority said they would prefer to remain part-time (71%). Only 8% said they would prefer to be casual.
Additionally, 27% of part-time casual workers said they would prefer to work more hours − an additional 18 hours per week on average.
I am happy with the hours I currently work on average per week
I would prefer to work fewer hours on average per week
I would prefer to work more hours on average per week
62%10%
27%
Reported underemployment was higher among ‘blue-collar’ than ‘white-collar’ part-time and casual workers. For blue-collar workers, 24% would prefer to change to full-time work, compared to 19% of white-collar workers. On average, part-time and casual workers who wanted more hours were seeking an average of 18 overall.
At an individual and household level, underemployment represents lost opportunities to fully engage in work, earn income and achieve a desired financial comfort. This is evident in that lowest household financial comfort across the workforce continues to be reported by ‘casual’ employees (5.47 out of 10), followed by ‘part-time’ workers (5.59 out of 10) – see more in Section 4.6. Furthermore, ‘casual’ workers also recorded the lowest ‘comfort with income’ (5.43 out of 10) – see more in Section 5.2.

14 June 2017 – Household financial comfort report
“ Property values have fallen in WA, which means our homes are in negative equity. If we had to sell we would be in financial distress.”Couple with older childrenWestern Australia
Household financial comfort report – June 2017 15
4.1 Financial comfort up across 10 out of 11 index components.
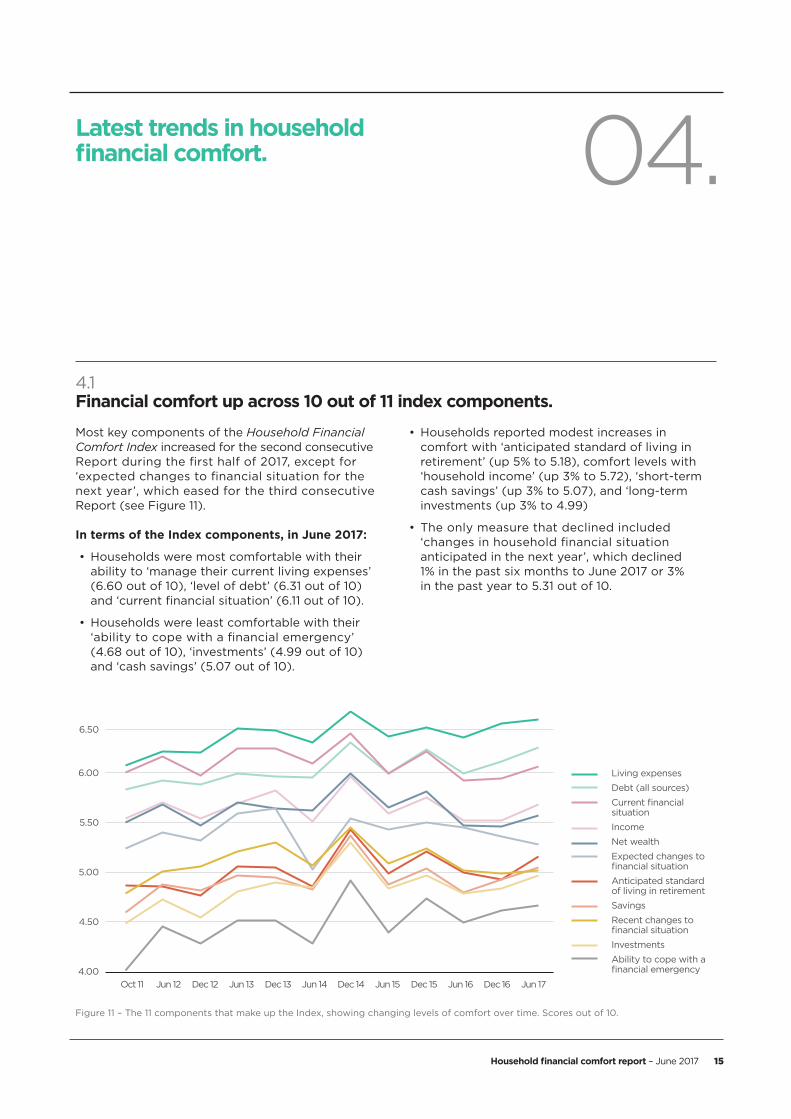
Most key components of the Household Financial Comfort Index increased for the second consecutive Report during the first half of 2017, except for ‘expected changes to financial situation for the next year’, which eased for the third consecutive Report (see Figure 11).
In terms of the Index components, in June 2017:
• Households were most comfortable with their ability to ‘manage their current living expenses’ (6.60 out of 10), ‘level of debt’ (6.31 out of 10) and ‘current financial situation’ (6.11 out of 10).
• Households were least comfortable with their ‘ability to cope with a financial emergency’ (4.68 out of 10), ‘investments’ (4.99 out of 10) and ‘cash savings’ (5.07 out of 10).
• Households reported modest increases in comfort with ‘anticipated standard of living in retirement’ (up 5% to 5.18), comfort levels with ‘household income’ (up 3% to 5.72), ‘short-term cash savings’ (up 3% to 5.07), and ‘long-term investments (up 3% to 4.99)
• The only measure that declined included ‘changes in household financial situation anticipated in the next year’, which declined 1% in the past six months to June 2017 or 3% in the past year to 5.31 out of 10.
Latest trends in household financial comfort. 04.
Oct 11 Jun 12 Dec 12 Jun 13 Dec 13 Jun 14 Jun 15Dec 14 Dec 15 Jun 16 Dec 16 Jun 17
5.50
6.00
6.50
5.00
4.50
4.00
Living expenses
Debt (all sources)
Current financial situation
Income
Net wealth
Expected changes to financial situation
Anticipated standard of living in retirement
Savings
Recent changes to financial situation
Investments
Ability to cope with a financial emergency
Figure 11 – The 11 components that make up the Index, showing changing levels of comfort over time. Scores out of 10.

16 June 2017 – Household financial comfort report
4.2 Financial comfort mixed across most households.
Overall financial comfort continued to vary a great deal across different households in the six months to June 2017 (see Figure 12).
Households with the highest financial comfort remain ‘retirees’ (5.98 out of 10), largely due to very high comfort among ‘self-funded retirees’ (up 6% to 7.12) compared to ‘retirees’ with their main income from the government funded age pension (down 9% to 5.03).
Conversely, households with the lowest financial comfort continues to be ‘single parents’ (4.95 out of 10).
However, ‘single parents’ also reported the largest gain in household financial comfort (up 14% to 4.95) with double-digit gains across most drivers with the exception of ‘changes in household financial situation anticipated in the next year’, the ability to ‘manage their current living expenses’ and comfort with ‘debt’.
Meanwhile, even though households with the highest financial comfort were ‘retirees’, the largest falls in household financial comfort was reported by ‘retirees’ (down 4% to 5.98). This life stage reported single digit declines across most drivers, especially comfort with ‘short-term cash savings’, ‘investments’, ‘wealth’ and ‘income’.
Oct 11 Jun 12 Dec 12 Jun 13 Dec 13 Jun 14 Jun 15Dec 14 Dec 15 Jun 16 Dec 16 Jun 17
5.50
6.00
6.50
5.00
4.50
4.00
Overall average
Retirees
Couples with older children
Young singles/couples (<35yo) with no children
Couples with young children
Empty nesters (50+yo)
Mid-aged singles/couples with no children
Single parents
Figure 12 – Financial comfort across different households. Scores out of 10.

Household financial comfort report – June 2017 17 1 Generation definitions are Gen Y: 25-34, Gen X: 35-54, Boomers: 55-74.
Figure 13 – Financial comfort across generations. Scores out of 10.
Oct 11 Jun 12 Dec 12 Jun 13 Dec 13 Jun 14 Jun 15Dec 14 Dec 15 Jun 16 Dec 16 Jun 17
5.50
5.70
5.90
6.10
5.30
5.10
4.90
55-74/Baby Boomers
Linear (55-74/Baby Boomers)
25-34/Gen Y
Linear (25-34/Gen Y)
35-54/Gen X
Linear (35-54/Gen X)
4.3 Gap in financial comfort across generations.
Across generations1, the generational gap in trend terms has widened further in the six months to June 2017 (see Figure 11).
‘Gen X’ reported a much lower financial comfort relative to ‘baby boomers’ and to a lesser extent ‘Gen Y’, reflecting lower comfort levels with financial responsibilities such as ‘debt’ and ‘living expenses’ (with children) and less ‘ability to handle a financial emergency’ and lower comfort with ‘cash savings’.
The highest household financial comfort continued to be reported by ‘baby boomers’ (up 2% to 5.8) –
with relatively large rises in comfort with ‘debt’ (up 7% to 7.24), ‘ability to handle a financial emergency’ (up 5% to 5.31) and ‘expected standard of living in retirement’ (also up 5% to 5.52).
Meanwhile, despite a partial reversal of a fall during the six months to December 2016, ‘Gen X’ reported the lowest level of household financial comfort across generations (up 4% to 5.13) – notwithstanding large rises in comfort with their ‘debt’ (up 9% to 5.7) and ‘anticipated standard of living in retirement’ (up 8% to 4.61).

18 June 2017 – Household financial comfort report
Students feeling the pinch.
After three consecutive falls, ‘students’ (a subset of mainly ‘Gen Y’ and 18-29 year olds) reported even lower levels of financial comfort − down 8% to a record low of 4.32 in June 2017. See Figure 14.
Students have much lower financial comfort relative to other households due to lower comfort with their ‘ability to manage a financial emergency’ (down 16% during the past six months to 2.53) and ‘cash savings’ down 21% to 3.47).
Students are also pessimistic about the outlook for their financial situation over the next year − after a ‘double digit’ fall of 10% during the past six months to an index of 5.03 in June 2017.
Oct 11 Jun 12 Dec 12 Jun 13 Dec 13 Jun 14 Jun 15Dec 14 Dec 15 Jun 16 Dec 16 Jun 17
5.50
6.00
6.50
5.00
4.50
4.00
Total
18 – 29
Linear (18 – 29)
Young singles/couplesno children
Linear (Young singles/couples no children)
Student
Linear (Student)
Figure 14 – Financial comfort across young singles/couples and students. Scores out of 10.

Household financial comfort report – June 2017 19
Figure 15 – Overall financial comfort based on home ownership. Scores out of 10.
4.4 Financial comfort across housing tenures.
Renters worse off than homeowners.
The household financial comfort of ‘renters’ remains lower (4.52 out of 10) than households ‘paying off their mortgage’ (5.47) and, to a greater extent, ‘homeowners’ that own their home outright (unchanged at 6.44).
‘Renters’ reported lower comfort across all key drivers, which could be a reflection of the difficulty first home buyers are experiencing getting into the residential property market. Firstly, house prices have continued to increase faster than incomes,
particularly in some of the major capital cities. Secondly, both changes to prudential arrangements and a tightening of bank lending standards have lowered borrowing capacity. Thirdly, interest rates on residential mortgages have risen over the past six months – albeit from historically low rates.
On the other hand, there have been a number of government initiatives such as cuts to stamp duties for first home buyers in some states. More generally, rent rises have eased across Australia – including rental falls in Perth and some mining regions as well as apartments in some metropolitan areas.
Oct 11 Jun 12 Dec 12 Jun 13 Dec 13 Jun 14 Jun 15Dec 14 Dec 15 Jun 16 Dec 16 Jun 17
5.50
6.00
6.50
7.00
7.50
5.00
4.50
4.00
Own home outright
Linear (Own home outright)
Paying o� mortgage
Linear (Paying o� mortgage)
Rent
Linear (Rent)

20 June 2017 – Household financial comfort report
Leveraged investors better off than owner-occupiers with and without home mortgages.
Households with mortgages on investment properties reported higher household financial comfort (6.64 out of 10) compared to home owners without a mortgage (6.44) and with both an investment and home mortgage (6.15) and, to a greater, extent home owners with a mortgage (5.26) – see Figure 16.
Households with investment loans tend to have both higher incomes (before and after tax) as well as higher (net) wealth. Residential prices have also continued to outpace mortgage debt during the past year − notwithstanding some apparent cooling in both house prices and investor loans during the past six months.
Concerns over level of debt.
Around 37% of households reported to ‘worry about their household’s level of debt over the last month’, compared to 48% who didn’t ‘worry’.
This proportion increased to 48% among mortgage holders, compared to 30% with no mortgage or 20% who own their own home outright.
By home loan type, ‘investors’ (55%) worried about their level of debt more than owner-occupiers (35%).
Households based in metropolitan Sydney (40%) and metropolitan Melbourne (39%) also reported a high level of ‘worry about their household’s level of debt over the last month’, perhaps a reflection of higher house prices in these cities.
By household type, ‘young singles/couples with no children reported the highest level of ‘worry with debt’ (53%), closely followed by ‘couples with young children’ (48%).
These results are consistent with household’s overall comfort with debt – see Section 5.6. ‘Single parents’ remained the least comfortable with debt, despite rising 1% to 5.63, closely followed by ‘couples with young children’ (unchanged at 5.64) and ‘young singles/couples with no children’ (down 3% to 6.02). The greatest in decline in ‘comfort with debt’ was reported by ‘young singles/couples with no children’ (down 3% to 6.02).
4.50
5.00
5.50
6.00
6.50
4.00
3.50
6.44
5.26
6.15
6.64
Investormortgage
Own home/nomortgage
Owner occupiermortgage
Owner occupier& investormortgage
3.00
Figure 16 – Comfort by status of mortgage.

Household financial comfort report – June 2017 21
Mortgage and rental payments causing significant financial distress.
Among the nearly two-thirds of households paying mortgages or renting, 39% gave a rating of 6-10, indicating they felt ‘worried or stressed about their household’s ability to meet its scheduled mortgage repayments or pay rent over the past month’.
This included 7% reporting a rating of 10 (a great deal of stress in their household’s ‘ability to meet its scheduled mortgage repayments/pay rent over the past month’) – higher among ‘single parents’ (15%), followed by ‘middle-aged singles/couples with no children’ (10%). See Figure 17.
Figure 17 – Proportion of households who have worried a great deal (rating of 10) regarding their scheduled mortgage repayments or rent over the past month.
16%
12%
8%
4%
0%
4%
Youngsingles/
couples with no children
15%
Singleparent
5%
Couplewith young
children
5%
Couplewith olderchildren
10%
Middle-aged singles/couples
no children
5%
Emptynesters
2%
Retirees
5%
Paying o�mortgage
8%
Renting
5%
Owner-occupier
5%
Investor
6%
Owner-occupier & Investor
Household type Housing tenure / loan type

22 June 2017 – Household financial comfort report
Households not meeting minimum mortgage repayments on their home mortgage.
Currently, only 3% of households are not meeting minimum mortgage repayments on the mortgage on their home – albeit much higher among ‘single parents’ (15%) and low-income earners less than
$40K per annum (9%), and to a lesser extent households with both home and investment mortgages (6%) and households in Sydney and Melbourne (both 5%).
That said, 2% of households reported they ‘did not know’ and a further 2% ‘did not wish to answer’.
Figure 18 – Proportion not meeting the current minimum repayment on their home loan.
6%
8%
10%
12%
16%
14%
4%
2%
3%
Totalowner-
occupiers
6%
Totalinvestors
3%
Emptynesters
2%
Couplewitholder
children
2%
Couplewith
youngchildren
15%
Singleparent
4%
Youngsingles/
couples withno children
3%
Total
Household type Loan type
0%

Household financial comfort report – June 2017 23
In terms of the states and territories, in June 2017:
• Victoria (up 2% to 5.70) and New South Wales/Australian Capital Territory reported the highest comfort levels across Australia (up 3% to 5.65), compared to the overall average for Australia (up 2% to 5.51), reflecting relatively higher comfort across most key drivers.
• Conversely, of these regions, South Australia reported the lowest and only fall in comfort − down 1% to 5.20 to be 6% lower than across Australia as a whole. The key drivers for this decline were ‘comfort with investments’ (down 13%), ‘ability to handle a loss of income’ (down 4%) and ‘net wealth’ (down 9%). Furthermore, South Australia reported the lowest expectations for financial comfort for the next 12 months (down 5%).
• In other fluctuations, Queensland reported the greatest gains in household financial comfort over the past six months to June 2017 (up 4% to 5.42), reflecting significant increases with most drivers, notably ‘anticipated standard of living in retirement’ (up 11% to 5.13).
• Both Queensland and Western Australia reported significant gains over the past year, recovering from the mining downturn and recent weather-related events.
• The financial comfort in Western Australia increased 8% to 5.43 in the past 12 months, following the record low results seen in June 2016 (5.02 out of 10). Most key drivers of financial comfort rose for Western Australia in the last six months, in particular ‘comfort with net wealth’ (up 9%) and to a lesser extent, ‘comfort with debt’ (up 5%).
4.5 Most states feeling better.
Over the six months to June 2017, household financial comfort improved in Victoria and New South Wales while South Australia declined (see Figure 19).
Figure 19 – Changes in financial comfort across states and territories. Scores out of 10.
Oct 11 Jun 12 Dec 12 Jun 13 Dec 13 Jun 14 Jun 15Dec 14 Dec 15 Jun 16 Dec 16 Jun 17
5.30
5.50
5.70
5.90
5.10
4.90
4.70
Victoria
NSW/ACT
Queensland
Western Australia
South Australia

24 June 2017 – Household financial comfort report
Metropolitan versus regional comfort – the great divide widens.
Household comfort continued to rise across metropolitan cities − up 2% to 5.66 in the six months to June and 3% higher during 2016/17.
After a small rise of 1% in the past six months, comfort in regional areas was 5.05 in June – much the same as a year ago – and a lot lower (11%) than comfort in the major cities. See Figure 20.
As shown in Figure 21, the trend of higher household financial comfort in metropolitan households is evident across the larger states.
Both Sydney and Brisbane both reported 4% gains in household financial comfort in the first half of
2017. As such, Sydney has overtaken Melbourne as the most financially comfortable city for the first time since late 2014.
In comparison, other Australian cities reported only modest changes in household financial comfort.
Oct 11 Jun 12 Dec 12 Jun 13 Dec 13 Jun 14 Jun 15Dec 14 Dec 15 Jun 16 Dec 16 Jun 17
5.70
5.90
5.30
5.10
4.90
Metropolitan
Linear (Metropolitan)
Regional
Linear (Regional)
Figure 20 – Comfort index across metropolitan and regional Australia. Scores out of 10.
Figure 21 – Financial comfort across larger states and metropolitan areas. Scores out of 10.
5.20
5.40
5.60
5.80
6.00
5.00
4.80
Reg
iona
l
Met
ro
Aus
tral
ia
5.51
5.66
5.05 VIC
5.70
Mel
bour
ne
5.79
Qld
5.42
Bris
bane
5.43
WA
5.43
Pert
h
5.47
SA
5.20
Ade
laid
e
5.37
NSW
5.64
Sydn
ey
5.89
4.60

Household financial comfort report – June 2017 25
4.6 Financial comfort up across most workforce segments.
Consistent with increased ‘job security’ and ‘job availability’ (see Section 5.1), most segments of the labour force reported improvements in their levels of financial comfort during the six months to June 2017 (see Figure 22).
The highest household financial comfort among the labour force continued to be reported by ‘full-time paid employees’ (up 3% to 5.93) and to a lesser extent, ‘part-time self-employed’ (up 14% to 5.88).
Meanwhile, the lowest financial comfort continued to be reported by ‘casual’ workers, despite a rebound of 16% to 5.47 in the six months to June 2017, followed by ‘part-time’ workers, albeit up 11 % to 5.59.
Significant gains were reported by casual workers (up 16% to 5.47), part-time paid workers (up 11% to 5.59), and to a lesser extent, self-employed workers (up 8% to 5.76).
In contrast to the small fall in Australia’s unemployment rate during the past six months, the only decline in comfort across the labour force was recorded by ‘unemployed’ people, down a further 2% to the lowest level ever recorded (3.12 out of 10). As noted in Section 3.4, there is also significant underemployment or underutilised workers available and looking for increased hours of paid work, putting downward pressures on wages growth and more broadly household incomes.
Figure 22 – Financial comfort across the workforce. Scores out of 10.
Oct 11 Jun 12 Dec 12 Jun 13 Dec 13 Jun 14 Jun 15Dec 14 Dec 15 Jun 16 Dec 16 Jun 17
4.50
5.00
5.50
6.00
6.50
4.00
3.50
3.00
Full-time paid employment
Self-employed
Part-time paid employment
Australia
Casual
Unemployed
26 June 2017 – Household financial comfort report
“ We’ve paid off most debts, leaving room for savings.”Young adult living at homeVictoria

Household financial comfort report – June 2017 27
5.1 Higher confidence in both job security and availability.
Households reported higher levels of ‘job security’ in June 2017, offsetting a sharp decline six months prior. See Figure 23.
Around 69% of households reported to be feeling ‘secure about their job in the last month’, up 6 points since December 2016.
Meanwhile, 29% of households felt insecure, down 5 points since December 2016.
Other findings. 05.
Dec 12 Jun 14Jun 13 Jun 15Dec 14Dec 13 Dec 15 Jun 16 Dec 16 Jun 17
50%
60%
70%
80%
40%
30%
20%
29%
69%
63%68%
73%71%72%
66%65%
72%
68%
34%29%
25%26%26%
32%31%
26%29% Secure
Insecure
Figure 23 – % of households feeling ‘secure about their job in the last month’.
28 June 2017 – Household financial comfort report
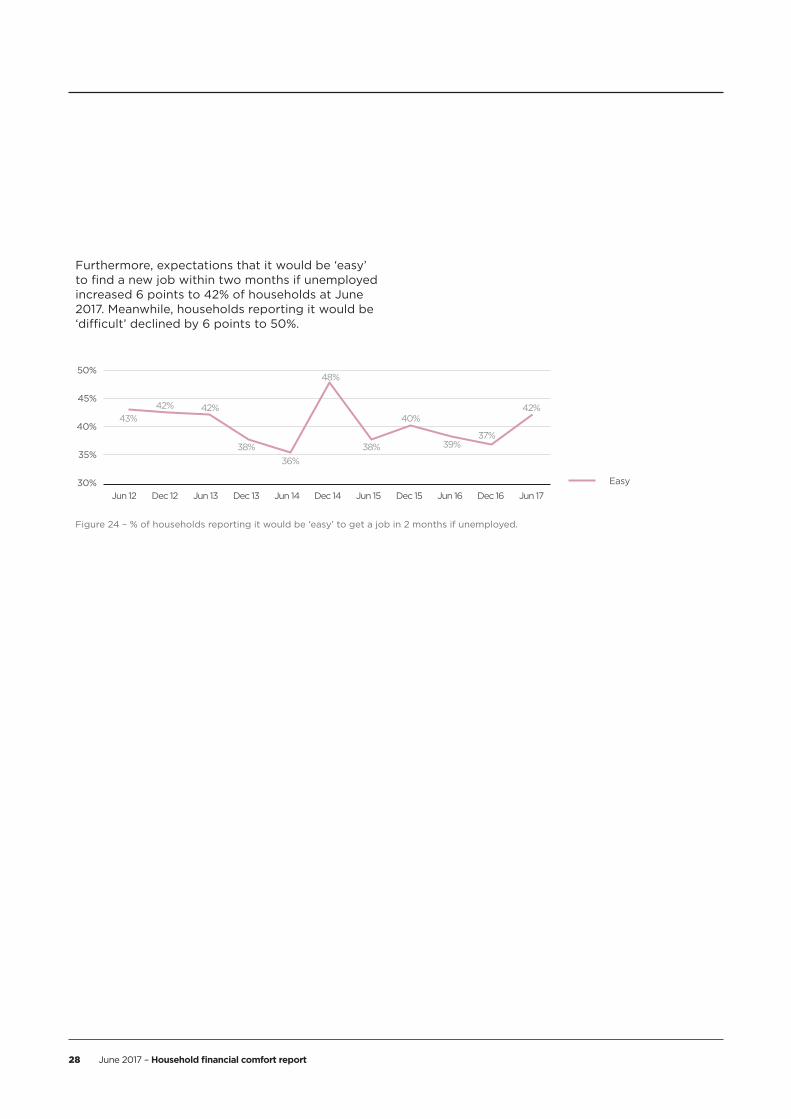
Furthermore, expectations that it would be ‘easy’ to find a new job within two months if unemployed increased 6 points to 42% of households at June 2017. Meanwhile, households reporting it would be ‘difficult’ declined by 6 points to 50%.
Dec 12Jun 12 Jun 14Jun 13 Jun 15Dec 14Dec 13 Dec 15 Jun 16 Dec 16 Jun 17
45%
50%
40%
35%
30%
43%42% 42%
38%36%
48%
38%
40%
39%37%
42%
Easy
Figure 24 – % of households reporting it would be ‘easy’ to get a job in 2 months if unemployed.

Household financial comfort report – June 2017 29
By household, the highest ‘comfort with income’ was reported by ‘retirees’, although it was down 6% – the most of any household type – to 6.04. ‘Self-funded retirees’ (7.22 out of 10) reported higher comfort than ’government-funded pensioners’ (4.55 out of 10).
Meanwhile, ‘single parents’ continued to record the lowest ‘comfort with income’, despite up the most of any household type by 24% to 5.17 – mainly reflecting a large rise in ‘comfort with income’ among ‘single parents working full-time’.
Figure 25 – Comfort with income. Scores out of 10.
5.2 Increased comfort with income
Notwithstanding sluggish income gains and significant underemployment, employment gains appear to have contributed to the Report’s ‘income comfort’ index, which increased 3% to 5.72 out of 10 during the six months to June 2017 (see Figure 25).
Oct 11 Jun 12 Dec 12 Jun 13 Dec 13 Jun 14 Jun 15Dec 14 Dec 15 Jun 16 Dec 16 Jun 17
5.80
5.90
6.00
5.70
5.60
5.50
5.58
5.74
5.57
5.72
5.86
5.55
6.01
5.62
5.79
5.56 5.55
5.72

30 June 2017 – Household financial comfort report
5.3 Comfort with cash savings increases further.
Comfort with ‘cash savings’ improved (up 3% to 5.07) during the six months to June 2017 – (see Figure 26).
Despite the small improvement, this driver of financial comfort remains one of the least comfortable among households.
By household type, ‘retirees’ remained the most comfortable, but also reported the greatest decrease (down 8% to 5.54).
Meanwhile, ‘single parents’ remained the least comfortable with ‘cash savings’, but also reported the greatest increase (up 20% to 4.50).
Slightly fewer savers, but saving a bit more.
There was a small deterioration in the proportion of households saving over the six months to June 2017. The number of households reporting to be ‘net savers’ (i.e. the proportion ‘spending less than they earn each month’ (49%) minus those ‘spending all of their income and more’ (9%)) declined by
3 points to 39%. There was a small increase of 2 points to 40% of households that ‘typically spend all of our income and no more’.
Across households, ‘single parents’ (20%) were least likely to be ‘net savers’, while ‘retirees’ were most likely to be ‘net savers’ (49%).
Oct 11 Jun 12 Dec 12 Jun 13 Dec 13 Jun 14 Jun 15Dec 14 Dec 15 Jun 16 Dec 16 Jun 17
5.00
5.20
5.40
4.80
4.60
4.40
4.60
4.90
4.83
4.98 4.97
4.84
5.40
4.89
5.06
4.81
4.94
5.07
Figure 26 – Comfort with cash savings. Scores out of 10.

Household financial comfort report – June 2017 31
Figure 27 – How much cash savings do households currently hold?
Less than $1,000
$1,000-$10,000
$10,001-$30,000
$30,001-$50,000
$50,001-$100,000
$100,001-$500,000
More than $500,000
1%1%1%1%1%1%3%3%2%2%
33%27%28%36%29%34%31%30%27%27%
28%32%28%25%27%28%26%25%27%24%
17%15%14%13%16%11%14%14%15%13%
19%7%7%8%6%9%5%6%6%8%
1%8%12%9%12%9%9%11%9%13%
2%9%10%9%10%11%12%12%14%13% Dec-12
Jun-13
Dec-13
Jun-14
Dec-14
Jun-15
Dec-15
Jun-16
Dec-16
Jun-17

32 June 2017 – Household financial comfort report
While there were slightly fewer savers, the amount of savings increased by 6% to $888 per month.
Meanwhile the amount that spenders overspend each month remained largely unchanged at $525 per month.
Dec 12Oct11 Jun 12 Jun 14Jun 13 Jun 15Dec 14Dec 13 Dec 15 Jun 16 Dec 16 Jun 17
$680
$780
$880
$580
$480
$380
$540
$850
$885
$665$700
$850
$870
$395$445
$500 $483 $473$418
$584
$529$525
$835
$735
$773
$745
$798
$779
$837
$888
How much savers saveeach month
How much spendersoverspend each month
Figure 28 – Amount saved/spent among those who are saving and overspending.

Household financial comfort report – June 2017 33
Disparate savings amounts across households.
While savings vary a great deal across households, the majority of households lack a cash buffer. Around 27% reported cash savings of less than $1,000 and a further 24% reported cash savings between $1,000 and $10,000. In contrast, either 15%, or 13% of households reported cash savings of $100,000-$500,000. See Figure 29.
Figure 29 – Proportion who are saving, overspending and breaking even each month.
We typically spendless than we earn
each month
We typically spendall of our income and
no more
We typically spendall of our income
and more
11%10%10%12%9%10%9%8%9%9%
48%51%49%46%47%47%50%48%51%49%
41%39%40%42%44%43%41%43%40%42% Dec-12
Jun-13
Dec-13
Jun-14
Dec-14
Jun-15
Dec-15
Jun-16
Dec-16
Jun-17

34 June 2017 – Household financial comfort report
5.4 Improved confidence in coping with a short-term income loss.
Households’ ‘ability to cope with a short-term income loss’ slightly improved (up 1% to 4.68) in the six months to June 2017 – consistent with improvements with ‘comfort with income’ noted in Section 5.3.
Around half (46%) of households reported to be confident in ‘coping with a short-term income loss’.
By household type, the highest confidence was recorded by ‘retirees’, who also reported one of the largest falls (down 5% to 5.32).
Meanwhile, the lowest confidence was reported by ‘middle-aged singles/couples with no children’ (down 4% to 3.89).
In other fluctuations, the greatest increase with the ‘ability to cope with a short-term income loss’ was reported by ‘single parents’ (up 23% to the second lowest of all households at 4.22 out of 10).
Oct 11 Jun 12 Dec 12 Jun 13 Dec 13 Jun 14 Jun 15Dec 14 Dec 15 Jun 16 Dec 16 Jun 17
4.60
4.80
5.00
4.40
4.20
4.00
4.684.62
4.50
4.75
4.39
4.93
4.28
4.524.52
4.29
4.46
4.00
Figure 30 – Confidence in ability to handle an emergency, if you lost your income for three months. Scores out of 10.

Household financial comfort report – June 2017 35
Small improvement in raising $3,000 in an emergency.
The ‘ability to cope with a short-term income loss’ is supported by a minor improvement in the proportion of households indicating it would be ‘easy to raise $3,000 in an emergency’ – up 1 point to 37% over the six months to June 2017. On the other hand, almost two-thirds (63%) of households still could ‘not easily raise $3,000 for an emergency’.
Figure 31 – Ability to raise $3,000 in a week for an emergency.
We could easily raisethe money
We could raise themoney but would
involve somesacrifices, such as
reduced spending ordrawing money from
an existing or newloan account or
credit card
We would have todo something drastic
to raise the money,like selling an
important possession
I don't think wecould raisethe money
23%19%18%24%18%21%20%19%19%18%
33%34%35%32%39%34%36%35%36%37%
33%37% 35%32%32%33%34%35%35%35%
11%11%12%12%11%13%11%12%10%11% Dec-12
Jun-13
Dec-13
Jun-14
Dec-14
Jun-15
Dec-15
Jun-16
Dec-16
Jun-17

36 June 2017 – Household financial comfort report
5.5 Monthly expenses.
Comfort with the ‘ability to pay regular expenses’ improved slightly during the six months to June 2017 (up 1% to 6.60).
By household, ‘retirees’ continued to be most comfortable paying regular expenses (down 1% to 7.24). Meanwhile, ‘single parents’ reported to be least comfortable, but recorded the largest rise (up 6% to 5.80).
In other fluctuations, ‘young singles or couples with no children’ reported the greatest decline with the ‘ability to pay regular expenses’ (down 4% to 6.55).
As noted in Section 3.2, the cost of necessities was cited as one of the biggest worries by 44% of households and, to a lesser extent, ‘being able to make ends meet’ by 29% of households.
Oct 11 Jun 12 Dec 12 Jun 13 Dec 13 Jun 14 Jun 15Dec 14 Dec 15 Jun 16 Dec 16 Jun 17
6.40
6.50
6.60
6.70
6.30
6.20
6.10 6.13
6.27
6.26
6.50 6.49
6.36
6.67
6.42
6.52
6.41
6.566.60
Figure 32 – Comfort with ability to pay regular expenses. Scores out of 10.

Household financial comfort report – June 2017 37
5.6 Overall comfort with debt improves.
Figure 33 shows ‘overall comfort with debt’ improved marginally by 3% to 6.31 during the six months to June 2017. This small improvement is the second consecutive rise in 12 months (up 5% during 2016/17) to be 4% above the medium-term average of 6.08 since the Report began.
Across life stages, ‘retirees’ continued to be the most comfortable with debt (although down 2% to 7.49), followed by ‘empty nesters’ (up 3% to 6.83).
Meanwhile, ‘single parents’ remained the least comfortable with debt, despite rising 1% to 5.63, closely followed by ‘couples with young children’ (unchanged at 5.64) and ‘young singles/couples with no children’ (down 3% to 6.02).
In terms of fluctuations, ‘couples with older children’ reported the greatest rise in comfort with debt of any household (up 7% to 6.67). The greatest decline was reported by ‘young singles/couples with no children’ (down 3% to 6.02).
While ‘overall comfort with debt’ has improved, the Report also indicates a significant deterioration in household expectations in managing debt over the next year – see more in Section 3.3.
Figure 33 – Comfort with household’s level of debt. Scores out of 10.
Oct 11 Jun 12 Dec 12 Jun 13 Dec 13 Jun 14 Jun 15Dec 14 Dec 15 Jun 16 Dec 16 Jun 17
6.10
6.20
6.30
6.40
6.00
5.90
5.805.87
5.96
5.93
6.03
6.01 6.00
6.36
6.04
6.29
6.04
6.16
6.31

38 June 2017 – Household financial comfort report
Increased demand for debt improves.
Household demand for debt increased by 3 points over the past six months to June 2017 – largely reversing the gain over the previous six months.
Around 31% reportedly increased their level of debt, while 24% of households decreased it, down 1 point over the first half of 2017. As a result, (net) demand for debt increased to 7% of households – a bit below the levels reported in the two previous financial years.
By household type, ‘young singles/couples with no children’ recorded the highest net demand for debt (up 21 points to 38%), and to a lesser extent, ‘couples with young children’ (up 13 points to 23%).
Meanwhile, ‘retirees’ recorded the lowest net demand for debt (up 9 points to -11%), closely followed by ‘empty nesters’ (down 7 points to -10%).
8%
10%
12%
6%
4%
2%
0%Oct 11 Jun 12 Dec 12 Jun 13 Dec 13 Jun 14 Jun 15Dec 14 Dec 15 Jun 16 Dec 16 Jun 17
% net increase in debt
Figure 34 − % net increase for debt.

Household financial comfort report – June 2017 39
5.7 Investments.
Comfort with investments improves.
Figure 35 shows overall comfort with investments increased by 3% to 4.99 over the past year to June 2017 – slightly above the medium-term average outcome of 4.85 since the survey began. Residential dwelling price gains as well as global and to a lesser extent equity price gains are consistent with increased comfort with investments.
By household, ‘couples with older children’ recorded the highest level of comfort with investments in the six months to June 2017 (up 1% to 5.32).
Conversely, ‘single parents’ reported the lowest level of comfort with investments (up 10% to 4.28).
The greatest increase in overall comfort with investments was reported by ‘mid-aged singles/couples with no children’ (up 17% to 4.65).
By housing tenure, ‘home owners’ continued to have significantly higher comfort with investments than those ‘paying off a mortgage’ (6.08 vs 5.08) and, to a greater extent, ‘renters’ (3.60).
Figure 35 – Comfort with level of investments. Scores out of 10.
Oct 11 Jun 12 Dec 12 Jun 13 Dec 13 Jun 14 Jun 15Dec 14 Dec 15 Jun 16 Dec 16 Jun 17
5.00
5.20
5.40
4.80
4.60
4.404.49
4.74
4.56
4.82
4.92
4.86
5.33
4.85
4.99
4.80
4.85
4.99

40 June 2017 – Household financial comfort report
Investment risk appetite moves sideways but still on downward trend.
Figure 36 shows a trend decline in the Report’s (net) risk index with ‘risk takers’ outnumbered by ‘risk avoiders’. Despite a small rise of 1 point, ‘risk avoiders’ (43%) outnumber ‘risk takers’ (18%) by a net -21%. This is less than the average risk at net -19% since the Report began and well below the corresponding outcome of -12% reported in mid-2013.
Oct 11 Jun 12 Dec 12 Jun 13 Dec 13 Jun 14 Jun 15Dec 14 Dec 15 Jun 16 Dec 16 Jun 17
-10%
-5%
0%
-15%
-20%
-25%
-19%
-15%
-22%
-12%
-18%-19%
-18%
-22%-23%
-17%
-22% -21%
Figure 36 – What financial risk would you be willing to take with your investments? Risk takers less risk avoiders.

Household financial comfort report – June 2017 41
5.8 Superannuation.
Comfort with anticipated standard of living in retirement increases.
As per Figure 37, confidence with households’ ‘anticipated standard of living in retirement’ increased 5% to 5.18 in mid-2017 – almost reversing the falls reported in the previous two surveys and a bit above (3%) the historical average of 5.03 out of 10 since the survey began.
Another strong gain in superannuation returns – largely due to a rise in both global and Australian equity prices partly offset by falling bond prices together with continued compulsory contributions
– have boosted super balances during 2016/17 and more generally over the past five years. That said, some tightening in both aged pension entitlements and superannuation concessions may have also weighed on comfort with ‘anticipated standard of living in retirement’ during the past year or so.
‘Single parents’ reported the lowest score with regards to their ‘anticipated standard of living in retirement’ (4.63 out of 10) closely followed by ‘couples with young children’ (5.25 out of 10), while ‘retirees’ recorded the highest (5.99 out of 10).
Figure 37 – Expectations for comfort in household’s standard of living in retirement. Scores out of 10.
Oct 11 Jun 12 Dec 12 Jun 13 Dec 13 Jun 14 Jun 15Dec 14 Dec 15 Jun 16 Dec 16 Jun 17
5.30
5.50
5.10
4.90
4.70
4.88 4.884.78
5.08 5.06
4.88
5.46
5.01
5.23
5.024.94
5.18

42 June 2017 – Household financial comfort report
Slight decline in superannuation contributions.
In June 2017, the proportion of households that reported to ‘never’ or ‘sometimes’ contribute extra to super (above their employer contributions) decreased by 1 point to 83%, while the share that reported to ‘often’ or ‘always’ increased by 1 point to 18% (see Figure 38).
Never
Sometimes
Often
Always
8%9%8%8%8%8%7%8%9%10%
69%66%66%70%67%68%66%62%68%66%
15%18% 19%16%17%17%17%20%16%17%
7%7%8%6%7%7%9%11%8%8% Dec-12
Jun-13
Dec-13
Jun-14
Dec-14
Jun-15
Dec-15
Jun-16
Dec-16
Jun-17
Figure 38 – Additional payments into superannuation in the last six months.

Household financial comfort report – June 2017 43
Self-reliance in retirement.
The number of households expecting to ‘rely on the government pension’ during retirement increased 2 points to 21%, while the number of households expecting to ‘use both private savings and the government pension’ declined 1 point to 42%.
Around 20% expect to ‘fund retirement with their own superannuation’ (up 1 point in the past six months).
Across households, ‘middle-aged singles/couples with no children’ (12%) and ‘single parents’ (17%) reported the lowest expectations in soley funding retirement with their superannuation while ‘young singles’ recorded the greatest confidence (26%).
By gender, 23% of men compared to 18% of women expect their household to be able to ‘fund retirement with their own superannuation’.
Figure 39 – How will your household fund retirement?
Fund retirementwith own money
Rely on governmentpension only (nopersonal savings)
Both (will use ourown money as well
as claim agovernment pension)
Don't know
18%17%17%15%18%17%17%16%18%17%
18%20%21%17%20%18%18%20%19%20%
22%17%18%23%18%24%19%21%19%21%
42%46%44%45%44%41%46%43%43%42% Dec-12
Jun-13
Dec-13
Jun-14
Dec-14
Jun-15
Dec-15
Jun-16
Dec-16
Jun-17

44 June 2017 – Household financial comfort report
Expected adequacy of income in retirement.
In June 2017, households’ expectations of income in retirement remained unchanged. Around 62% of households expect to ‘afford essentials and extras’, while 38% of households reported to be ‘unable to afford essentials’ or have ‘no money left over afterwards’.
Superannuation quick facts:
• 25% either don’t have a superannuation fund or don’t know what type they have.
• 19% of Australians reported ‘building wealth for retirement’ is a financial goal they’re currently actively working towards.
Won't be able toa�ord to pay for
essential items andservices
Will only be able toa�ord the essentials
and won't havemoney left over for
anything else
Will be able toa�ord the essentialsand have money left
over for eating outoccasionally,
entertaining at homeor the occassional
extra like music,movies,books etc
Will be able to a�ordthe essentials and
extras like travelfor holidays
Will be able to a�ordthe essentials and
extras, as well ashave money left
over to help familyand friends
5%6%6%5%5%5%6%6%7%6%
9%7%10%11%9%9%10%10%9%9%
31%28%29%33%29%31%26%29%29%29%
36%40%35%34%36%36%38%36%35% 38%
18%18%20%18%21%18%21% 19% 20% 18% Dec-12
Jun-13
Dec-13
Jun-14
Dec-14
Jun-15
Dec-15
Jun-16
Dec-16
Jun-17
Figure 40 – Expectations for adequacy of income in retirement.

Household financial comfort report – June 2017 45
Figure 41 – Comfort with net wealth. Scores out of 10.
5.9 Overall level of wealth (net).
Comfort with net wealth – as measured by what would be left in cash if you sold all your assets and paid off all your debts – increased by 2% to 5.49 out of 10, albeit still 1% below the average of 5.67 since the Report commenced in October 2011.
By households, ‘retirees’ continued to report the highest comfort with wealth (although down 6% to 6.37) and to a lesser extent ‘empty nesters’ (down 1% to 5.61) and ‘couples with older children’ (5.81).
Although up by 17%, ‘single parents’ reported the lowest level of comfort with wealth (4.83 out of 10).
Macro-financial indicators of wealth have continued to improve. Household net wealth relative to income and assets have reached new highs post the global financial crisis, mainly driven by strong rises in property markets, direct shareholdings supported by low interest rates and an albeit slow and uneven recovery in economic activity.
Put another way, household ratings of their wealth appear to be highly conservative – notwithstanding a great deal of uncertainty about the financial outlook, while the distribution of wealth has become increasingly uneven across households by age and income levels.
Oct 11 Jun 12 Dec 12 Jun 13 Dec 13 Jun 14 Jun 15Dec 14 Dec 15 Jun 16 Dec 16 Jun 17
6.00
6.20
5.80
5.60
5.405.54
5.72
5.51
5.74
5.67 5.65
6.04
5.69
5.85
5.50 5.49
5.61

46 June 2017 – Household financial comfort report
Appendix a – Household statistics. 06.
Net Wealth Household Income
Household Financial Comfort Index
Average Net Wealth
Average Household Yearly Income
Single parents 4.95 $426,000 $70,000
Middle-aged singles/couples no children 5.09 $291,000 $72,000
Empty nesters (50+yo) 5.39 $744,000 $63,000
Couples with young children 5.47 $466,000 $88,000
Young singles/couples (<35yo) no children 5.51 $218,000 $81,000
Couples with older children 5.70 $782,000 $93,000
Retirees 5.98 $713,000 $54,000

Household financial comfort report – June 2017 47
Appendix b – Methodology. 07.
ME commissioned DBM Consultants to develop the Household Financial Comfort Index with Economics & Beyond. The research includes an online survey of approximately 1,500 Australians aged 18 years and older who do not work in the market research or public relations industries.
12 waves of research have been conducted every six months starting in October 2011, but usually in the months of December and June, with the latest conducted in June 2017. For analysis, the population sample was weighted according to ABS statistics on household composition, age, state and employment status to ensure that the results reflected Australian households.
An extensive review of other financial health/comfort indices and academic literature suggested that a number of factors contribute to self-assessment of financial wellbeing and comfort. As such the ME Household Financial Comfort Index incorporates 11 measures of how households feel about their financial situation – these include:
• Comfort level with (1) the overall financial situation of the household
• Changes in household financial situation (2) over the past year and (3) anticipated in the next year
• (4) Confidence in the household’s ability to handle a financial emergency, and
• Comfort levels with (5) household income, (6) living expenses, (7) short-term ‘cash’ savings and (8) long-term investments, (9) debt, (10) overall net wealth, and (11) the household’s anticipated standard of living in retirement.
To provide contextual insight for the Comfort Index, respondents were asked to rate how comfortable they would be with their current overall household situation if they were feeling ‘occasional stress or worry’, and also if they were experiencing ‘financial problems which require significant lifestyle change’. To collect data on how households felt about their financial situation via household financial comfort, confidence with finances and anticipated change in finances, we used 0–10 scales anchored by descriptive terms ‘not at all comfortable’ to ‘extremely comfortable’ (comfort), ‘not at all confident’ to ‘extremely confident’ (confidence) and ‘worsen a lot’ to ‘improve a lot’, with a mid-point of ‘stayed the same’ (anticipated change). Questions to collect household actual financial data included those that asked for dollar amounts or dollar ranges as well as actual behaviour (e.g. whether or not their household was able to save money during a typical month).

215633/0717
Brought to you by...