House View - IDFC Bank...Equity –Our view Maintain equity exposure, use any corrections to further...
44
House View 15 th Mar to 15 th Apr
Transcript of House View - IDFC Bank...Equity –Our view Maintain equity exposure, use any corrections to further...

House View
15th Mar to 15th Apr

Agenda
1. Equity
2. Fixed Income
3. Our Portfolio Construction Approach
4. Model Portfolios
3 – 16
17 – 26
27 - 34
35 – 43

EQUITY

Equities: Geo Political concerns slow momentum, valuations and earnings in focus now
4
■ Markets continued to rally in early April (with continued FII flows and the Parliament passingfour GST-related bills), paving the way for the new indirect tax to be implemented nationwide.
■ Geopolitical tensions (North Korea, Syria and Afghanistan) weighed on markets, arrestingmomentum
■ As the financial year ends, investor focus will shift once again to the Q4FY17 earnings season.The earning season assumes importance given that this would be the quarter that would capturethe full impact of demonetization and should form the basis for expectations for FY18
26,500
27,000
27,500
28,000
28,500
29,000
29,500
30,000
Sensex
Source: BSE India

1 Month Performance: Realty and Capital Goods rallied while IT, Metals witnessed corrections; FII flows in March was >30 K Cr, continued to be positive
■ Realty and Capital Goods were the best performerslast month while IT, Teck and Metals were the worstperformers
■ FII flows were in Feb (+$1.5 bn) and march (~$5 bn)increased significantly, March saw the highestmonthly FII inflows in the past 10 years
■ Domestic flows had reduced in Feb but againincreased in march and continue to be positive for9th month running
51M perf as on 13th April; For April, FII Flows data as on 13th April; MF flows as on 10th April; Source: Accord Fintech
-7.4
-6.4
-4.5
-1.4
-0.4
-0.2
-0.0
0.9
1.6
1.9
2.2
3.2
3.5
5.5
6.0
6.2
7.1
11.9
-10.0 -5.0 - 5.0 10.0 15.0
S&P BSE IT
S&P BSE TECk Index
S&P BSE METAL Index
S&P BSE AUTO Index
S&P BSE SENSEX
S&P BSE Health Care
NIFTY 50
S&P BSE 200
S&P BSE 500
S&P BSE BANKEX
S&P BSE Power Index
S&P BSE Mid-Cap
S&P BSE FMCG
S&P BSE OIL & GAS Index
S&P BSE Consumer Durables
S&P BSE Small-Cap
S&P BSE Capital Goods
S&P BSE Realty Index
1M Performance
-19,000
-14,000
-9,000
-4,000
1,000
6,000
11,000
16,000
21,000
26,000
31,000
MF FII Trend (Cr)
MF FII

Continue to believe that Earnings placed well to rise…
■ Both Earnings and index were flat in last month butas mentioned earlier we expect that lowering ofinterest rates should lead to reduced cost ofborrowings, leaving more money in the hands ofconsumers, which will help in the growth of theeconomy
■ Further, Implementation of GST With a greater focuson digital payments, the organised sector will be theclear winner, as the tax arbitrage often available inthe unorganised sector will vanish
6
12001250130013501400
24000250002600027000280002900030000
01-0
4-2
016
01-0
5-2
016
01-0
6-2
016
01-0
7-2
016
01-0
8-2
016
01-0
9-2
016
01-1
0-2
016
01-1
1-2
016
01-1
2-2
016
01-0
1-2
017
01-0
2-2
017
01-0
3-2
017
01-0
4-2
017
Sensex Vs EPS (Closer look)
sensex EPS (RHS)
600
700
800
900
1000
1100
1200
1300
1400
8000
13000
18000
23000
28000
02-01-2007 02-01-2008 02-01-2009 02-01-2010 02-01-2011 02-01-2012 02-01-2013 02-01-2014 02-01-2015 02-01-2016 02-01-2017
Sensex Vs EPS
sensex EPS (RHS)
Source: BSE India
Technical View – a mixed bag…
■ On price to book basis valuations are nearaverage, however, it is expensive on PEbasis
■ Midcaps continue to be over valued withrespect to large cap index
7
1.8
2.8
3.8
4.8
5.8
6.8
Jan
-99
Jan
-00
Jan
-01
Jan
-02
Jan
-03
Jan
-04
Jan
-05
Jan
-06
Jan
-07
Jan
-08
Jan
-09
Jan
-10
Jan
-11
Jan
-12
Jan
-13
Jan
-14
Jan
-15
Jan
-16
Jan
-17
Nifty PB Ratio Analysis
P/B Median
1012141618202224262830
Jan
-99
Jan
-00
Jan
-01
Jan
-02
Jan
-03
Jan
-04
Jan
-05
Jan
-06
Jan
-07
Jan
-08
Jan
-09
Jan
-10
Jan
-11
Jan
-12
Jan
-13
Jan
-14
Jan
-15
Jan
-16
Jan
-17
Nifty PE Ratio Analysis
P/E Median
0.40
0.60
0.80
1.00
1.20
1.40
1.60
Jan
-03
Jan
-04
Jan
-05
Jan
-06
Jan
-07
Jan
-08
Jan
-09
Jan
-10
Jan
-11
Jan
-12
Jan
-13
Jan
-14
Jan
-15
Jan
-16
Jan
-17
Midcap/LargeCap P/E
Source: NSE India

Equity – Our view
Maintain equity exposure, use any corrections to further increase allocation:
We believe earnings could see an upward movement with lower cost of capital and
reduction of tax arbitrage on organized sector viz-a-viz unorganized sector.
However, global uncertainties with Trump’s policies and upcoming elections in
Europe will keep the market volatile. Corrections, if any, can be used to add equity
exposure. Clients with lower equity can increase allocation in line with risk profile
(details on following slides)
Shift from large polarized funds to niche managers: recommend clients to shift
investments to niche managers with smaller AUM (details to follow). Focus on
absolute returns and smaller AUM’s will help managers remain agile and deliver
better returns.
8

Recommended Mutual Funds - Equity
Scheme Name AUMExit load period
Mid/Small cap exposure
2017 YTD
2016 2015 2014 2013 2012
Large Cap
SBI Blue Chip Fund 12,586 1Y 11.8 13.10 4.83 7.99 47.86 7.58 38.23
Birla Sun Life Frontline Equity 16,352 1Y 12.7 13.46 7.43 1.10 44.72 9.25 36.07
Reliance Top 200 Fund 2,701 1Y 12.9 16.58 2.23 1.11 54.65 4.15 40.97
ICICI Prudential Focused Bluechip Equity Fund
12,843 1Y 0.0 12.54 7.74 -0.21 41.10 10.21 26.79
Nifty 11.79 3.01 -4.06 31.39 6.76 27.70
Sensex 10.65 1.95 -5.03 29.89 8.98 25.70
Flexi Cap
Franklin India Prima Plus Fund 10,703 1Y 16.8 13.90 4.98 4.38 56.79 5.55 31.04
IDFC Classic Equity Fund 852 365D 22.4 16.63 7.99 5.21 28.62 2.51 37.26
Kotak Select Focus Fund 9,323 1Y 17.2 17.16 9.44 2.96 57.87 6.13 33.45
ICICI Prudential MultiCap Fund 2,501 18M 43.9 16.56 10.14 3.08 49.82 6.42 36.53
Motilal Oswal MOSt Focused Multicap 35 Fund
5,992 17.4 23.28 8.45 14.60
BSE 200 14.05 3.95 -1.48 35.47 4.38 30.98
9
YTD as on 13th Apr; Portfolio Details as on Mar 31st

Recommended Equity Funds
10
Scheme Name AUMExit load period
Mid/Small cap exposure
2017 YTD
2016 2015 2014 2013 2012
Balanced
HDFC Balanced Fund 10,186 1Y 24.3 11.04 9.72 3.01 51.47 8.78 26.56
ICICI Prudential Balanced Advantage Fund
18,221 18M 9.6 7.98 7.35 6.70 29.04 10.93 33.33
IDFC Balanced Fund 594 1Y 11.5 6.48
Crisil Balanced Fund Aggressive Index
7.88 6.66 0.48 25.34 6.05 21.28
Mid/Small Cap
Mirae Asset Emerging Bluechip Fund
3,532 365D 53.6 20.52 12.17 14.08 84.62 8.61 45.56
SBI Magnum MidCap Fund 3,583 1Y 81.7 15.24 4.98 14.92 71.94 13.57 47.98
HDFC Midcap Opportunities Fund
15,734 1Y 62.1 18.91 11.35 5.81 76.63 9.64 39.62
Franklin India Smaller Companies Fund
5,238 1Y 79.6 19.08 10.19 9.56 89.92 13.22 51.70
Nifty Free Float Mid Cap 100
22.29 7.13 6.46 55.91 -5.10 39.16
YTD as on 13th Apr; Portfolio Details as on 31st March

Equity – Our solutions – Portfolio Management Services
India Opportunities
Portfolio -Motilal
Unifi Capital
Birla SunlifeSelect Sector
Portfolio
New mid/small cap focussed strategy from Motilal Oswal Currently manage AUM of ` 1,474 crores, invested in 15-20 stocks
with an average market cap of ~ 6,700 Crores Key Themes: Make in India, Consumption & Capex revival
Specialized PMS provider with 15 years of track record, managesaround ` 2000 Crs
Identify unique themes based on market opportunity Strong alignment with client interest, revenue model only linked
to client returns (12% hurdle)
Concentrated portfolio of 15 to 25 stocks with 80% of portfolio
invested in 4- 6 sectors
Follows 4 pillar investment approach – a blend of top down and
bottom up factors including Piotroski Score
11

Motilal Oswal India Opportunity Portfolio Strategy
Objective
The Strategy aims to generate long termcapital appreciation by creating a focusedportfolio of high growth stocks having thepotential to grow more than the nominal GDPfor next 5-7 years across and which areavailable at reasonable market prices. Focusis on identifying well run companies that areexisting/potential leaders in their field ofoperations.
12
Focus Themes for IOP
Make in India
Making India a manufacturing hub
• Auto and auto components
• Pharma Outsourcing
• Engineering Products
Third trillion dollar consumption opportunities
Increasing discretionary consumer spending
• Consumer Durables• Consumer Staples• Building Products• Kitchenware• Housing Finance
Revival in Capex Cycle
Increasing public investments on Infrastructure
• Cement• Railway• Ports• Metro
Strategy Conduct
No. of Stocks - 15 – 20 stocks for a portfolio
Scrip Allocation – not more than 10% in asingle stock at the time of initiation
Sector Allocation Limit – 35% in a sector
Strategy Focus – Identifying well runcompanies that are existing/potentialleaders in field of operations
Investment horizon – 3+ years
59.57
30.2421.81
17.49
34.8525.92
17.412.89
0
10
20
30
40
50
60
70
1 year 3 years 5 years Since Inception
Performance
IOP Nifty Free Float Midcap 100
Performance as on 31st March

Unifi Capital – An Unique Equity Proposition
Unifi Capital is a discretionary, long-only India centric fund manager; specializing in event oriented top-down themes and a bottom-up focus on “growth with value”.Established – 2001 ( 16 year track record)AUM – approx. 1,600 Cr ObjectiveFocus on identifying unique investment opportunities that consistently generate superior (risk adjusted) returns with due emphasis on capital preservation.
Theme Development Concept Validation & Review Portfolio Management
Investment Philosophy
15.7%21.2%
43.0%
13.8%
44.0%
57.6%
21.0%
34.6%
0.0%
20.0%
40.0%
60.0%
80.0%
Event Arbitrage(2002)
STLC (2011) Delisting*(2009)
Insider Shadow(2010)
DVD (2013) Holdco (2014) Spin Off (2014) APJ 20 (2015)
CAGR Returns for all existing Funds
*closed for subscriptionPerformance as on 31st March
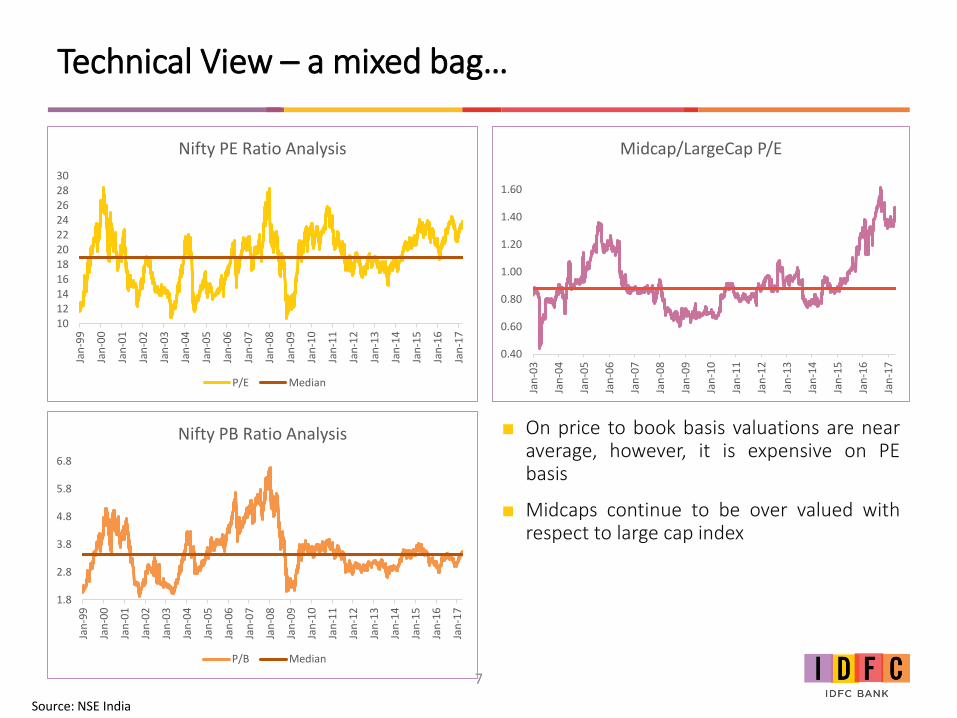
ObjectiveThe fund seeks to generate superior risk adjusted returnsrelative to market indices by investing in stocks ofcompanies undergoing Spin-offs. Typically, such an actionby the company will help remove the holding companydiscount that the market attributes and thereby enhancethe stock’s valuation.Unifi’s proposition is to gain from the informationasymmetry linked value-price mismatch, by closelytracking the entire Spin-Off process and investing in suchcompanies after a detailed review of their fundamentals.
Strategy and Investment UniverseInvestment universe is built from the Spin-offs approvedby Boards of respective companies as filed with the stockexchanges. At any point in time, the portfolio may include20% of companies that may not have publicly announced ademerger but management believes, through primaryresearch, are close to doing so.From the universe of such companies, ideas are selectedto invest based on a bottom up approach that Unifi hasbeen practicing over the last fourteen years.
Unifi Capital – India Spin Off Fund
ReturnsDescription Portfolio BenchmarkAverage Monthly Return 1.81 1.21CAGR 20.95 14.28Cumulative Returns 58.36 38.06
Largest Monthly Gain 15.67 10.90
Largest Monthly Loss -14.81 -8.08
% of positive months 65.52 68.97Risk
Standard Deviation 22.76 15.42Sharpe ratio 0.57 0.41
Performance as on 31st March

Objective The Fund seeks to achieve returns with below-average riskover a horizon of 4-5 years. The fund would invest insectors that will benefit from the next stage of India’sgrowth on the back of improvement in India’s economicand policy climate. The Fund endeavors to grow investors’capital by 3x in 5 years time or less.
Investment StrategyBuild a concentrated portfolio of 10-15 stocks from sectors poised to benefit from macro policy initiatives and demographic strengths.(a) agriculture, (b) specialty chemicals, (c) mining, (d) hi tech manufacturing (e) infrastructure
UniverseSet of all listed companies with market capitalization of INR 200 Crs and above.
Unifi Capital – APJ 20 Fund
ReturnsDescription Portfolio BenchmarkAverage Monthly Return 2.68 1.72
CAGR 34.60 20.91Cumulative Returns 60.07 35.06
Largest Monthly Gain 16.32 10.90Largest Monthly Loss -11.24 -8.08% of positive months 68.42 73.68
Standard Deviation 21.13 17.70
Sharpe ratio 1.26 0.73
Performance as on 31st March

Birla Sunlife Select Sector Portfolio
Identify sectors that grow faster than the GDP
Recurring Winners:
Focus on businesses that have consistently created
values
Unique strategy based on superior IP/ Screeners
Value investing approach to generate alpha
Sustainable wealth
creation
16
4 Pillars of the Investment Approach
■ Portfolio uses Piotroski – Score as an screener which measures the overall strength of thefirm’s financial position and improvement (delta) in the financial position of the firm
■ P score is one aggregate signal that captures three areas of the firm’s financial condition:
■ Profitability : +ve Net profit, +ve Operating Cash Flows, Cash flow>Net Profit, Change in ROA
■ Financial leverage/Liquidity: Change in Leverage, Change in Liquidity, and Equity Financing
■ Operating efficiency : Change in Operating Margins, Change in Turnover Ratio
Returns as on Mar 29th 2017: Inception Date: 01/08/09; Returns more than 1 year are annualized
30%
19%
39% 40%
32%
20%26%
8%
15% 16% 14%9%
0%5%
10%15%20%25%30%35%40%45%
Performance
Select Sector Portfolio CNX Nifty 500

FIXED INCOME

CPI increased with 10 yr yields in a narrow range
■ RBI surprised markets by hiking Reverse repo rate to6%, Repo was unchanged at 6.25%.
■ CPI inflation increased to 3.8% in March (3.7% inFeb), led by uptick in food inflation and higherinternational oil prices. WPI fell to 5.7% in Marchfrom 6.6%
■ IIP contracted by 1.2% led by manufacturing sectorwhich reported a decline of 2%
■ We believe that RBI is likely to stick to its wait andwatch approach, leading to a long pause in rates forthe rest of 2017.
18
6.8%
6.00%
6.20%
6.40%
6.60%
6.80%
7.00%
7.20%
7.40%
7.60%
10 yr G Sec
6.97% GOI 2026 (New Ten Year)
3
3.5
4
4.5
5
5.5
6
6.5
7
Repo and Reverse Repo Rates
CPI Repo Rate (%) Reverse Repo Rate (%)
55.86
2530354045505560
BRENT CRUDE ($)
BRENT CRUDE ($)
Source: IDFC MF, RBI

5.5%
6.0%
6.5%
7.0%
7.5%
8.0%
8.5%
9.0%
9.5%
01
-01
-20
16
01
-02
-20
16
01
-03
-20
16
01
-04
-20
16
01
-05
-20
16
01
-06
-20
16
01
-07
-20
16
01
-08
-20
16
01
-09
-20
16
01
-10
-20
16
01
-11
-20
16
01
-12
-20
16
01
-01
-20
17
01
-02
-20
17
01
-03
-20
17
01
-04
-20
17
CP CD rates
1 Year CD 1 Yr CP
6.00%
6.50%
7.00%
7.50%
8.00%
8.50%
9.00%
10 yr G Sec vs 10 yr AAA (PSU)
6.97% GOI 2026 (New Ten Year) 10 YEAR AAA(PSU)
Spreads higher than average; US 10 yr yields fell because of geopolitical tensions
■ Spreads have widened to 90 bps between 10yr G Sec and 10 yr AAA PSU which averages76 bps over the last 1 year
■ CP CD rates remained stable during themonth
■ US Treasury yields softened considerablypost the geopolitical tensions in North Koreaand Middle East
74
5190 57
19
2.23%
1.20%
1.40%
1.60%
1.80%
2.00%
2.20%
2.40%
2.60%
2.80%
01
-01
-20
16
01
-02
-20
16
01
-03
-20
16
01
-04
-20
16
01
-05
-20
16
01
-06
-20
16
01
-07
-20
16
01
-08
-20
16
01
-09
-20
16
01
-10
-20
16
01
-11
-20
16
01
-12
-20
16
01
-01
-20
17
01
-02
-20
17
01
-03
-20
17
01
-04
-20
17
US 10 Year
Source: IDFC MF, RBI

Debt – Our View
■ We believe that RBI is likely to stick to its mandate and remain focussedon Headline CPI inflation with close watch on monsoon trends andhence expect rate cuts to remain on a long pause (till year end 2017)
■ Higher accruals from Corporate bond funds/FMP’s/NCD’s with aboveaverage spreads make it attractive for fresh allocations ( G Sec yields areat approx 6.8%, relative to Corp bond yields of 8-8.75%)
■ Hence, we would recommend overweight on accrual funds and lock inhigher yields available currently. Going ahead, lower credit growth willalso lead to reduction in borrowing cost for corporates and reduceyields on Corp bonds
■ We would also recommend NCDs / 3 year FMPs which can generatehigher returns on a post tax basis.
■ Utilize Arbitrage funds as a replacement for cash: Clients with a higherthan 1month horizon should prefer allocations to arbitrage funds overliquid funds
20

Debt– Our solutions
NCD’s – NBFC
Accrual Funds
Non convertible debentures issued by listed NBFC’s Yields range between 8 -8.75% across tenors Higher tax efficiency lead to outperformance of 1.5-2% over MF’s
Suited for investors with a 1 month or higher horizon Better after tax accruals compared to short term funds
Arbitrage Funds
Fall in the lending rates should lead to improvement of the creditenvironment which should benefit accrual strategies.
21

Edelweiss NCD
Product Bank FD’s Edelweiss NCD’s FMP’s ( 3 Years )YTM 7.50 % 8.75 % 7.75 %
Taxation 30 % 10 % 20 % with IndexationPost Tax 5.25% 7.88%** 7.40%
Outperformance
- 2.63% - - 0.48%
22
■ In the current Market scenario of lowering Interest rate the fixed income market is very delicately poised
■ Edelweiss NCD provides a unique opportunity to earn higher post Tax returns as seen below
Edelweiss as an Issuer
■ Edelweiss Financial Services Ltd is one of India’s leading diversified financial services organization
■ Present in the Market-Linked Debentures market since 2007 with gross issuance of over $ 1 Billion
■ Largest issuer in this industry with a market share of more than 40% as per an independent report published by CARE
** Assuming taxation rate of 10% without indexation basis opinion received from issuer Not to be construed as tax advice. Please speak to your tax representative for details

Recommended Debt Mutual Funds
23
Scheme Name YTMExpense ratio
Mod Duration
SOVAAA and Eq
AA and Eq
A and Eq
Liquid
Kotak Floater - Short Term 6.71 0.16 0.0 0.0 100.0 0.0 0.0
Reliance Liquid Fund - Treasury Plan 6.46 0.17 0.1 0.0 99.1 0.8 0.0
Ultra Short Term
ICICI Prudential Flexible Income Plan 7.32 0.27 1.2 16.7 60.2 23.0 0.0
Kotak Low Duration Fund 8.02 1 0.0 0.2 30.7 59.2 10.0
UTI Treasury Advantage Fund 7.62 0.31 0.0 2.5 68.6 28.8 0.0
Short Term
Birla Sun Life Short Term Fund 7.42 0.3 2.2 17.0 73.2 9.9 0.0
ICICI Prudential Short Term Plan 7.65 1.22 2.9 37.3 50.9 11.8 0.0
HDFC Short Term Opportunities Fund 7.23 0.36 1.3 10.6 79.2 10.3 0.0
UTI Income Opportunities Fund 9.04 1.93 0.0 3.4 29.7 56.3 10.6
Portfolio Details as on 31st March

Recommended Debt Mutual Funds
24
Scheme Name YTMExpense ratio
Mod Duration
SOVAAA and Eq
AA+AA and below
Accrual
IDFC Corporate Bond Fund 7.36 0.57 2.7 0.0 100.0 0.0 0.0
SBI Corporate Bond Fund 8.63 1.41 2.2 2.0 30.9 35.1 32.0
HDFC Corporate Debt Opportunities Fund 8.89 1.83 2.9 0.0 24.7 39.3 36.0
Kotak Medium Term Fund 8.53 1.7 0.0 0.4 31.2 59.7 8.7
Dynamic
Birla Sun Life Dynamic Bond Fund 7.8 1.49 7.5 63.9 13.2 21.9 1.0
IDFC Dynamic Bond Fund 6.7 1.52 2.1 66.7 33.3 0.0 0.0
SBI Dynamic Bond Fund 6.42 1.57 3.0 71.8 28.2 0.0 0.0
Portfolio Details as on 31st March

Recommended Debt Funds - Performance
25
Scheme Name AUMExit load period
1M 3M 6M 12 M
Arbitrage
ICICI Prudential Equity-Arbitrage Fund 7,185.30 1M 5.63 5.63 5.61 6.32
IDFC Arbitrage Fund 2,621.18 1M 6.03 5.80 5.62 6.11
Kotak Equity Arbitrage Scheme 6,177.44 30D 5.52 5.65 5.51 6.17
Crisil Liquid Fund Index 6.78 6.66 6.58 7.09
Category Average(Arbitrage Funds) 5.09 5.29 5.51 6.21
Liquid
Kotak Floater - Short Term 11,004.45 0 6.74 6.67 6.73 7.24
Reliance Liquid Fund - Treasury Plan 22,657.36 0 6.82 6.68 6.71 7.21
Crisil Liquid Fund Index 6.78 6.66 6.58 7.09
Category Average(Liquid) 6.27 5.64 6.01 6.65
Ultra Short Term
ICICI Prudential Flexible Income Plan 17,775.30 0 9.60 6.87 7.58 8.61
Kotak Low Duration Fund 4,498.84 0 9.17 7.14 7.51 8.74
UTI Treasury Advantage Fund 8,861.11 0 8.53 7.28 7.51 8.45
Crisil Liquid Fund Index 6.78 6.66 6.58 7.09
Category Average(UST) 7.97 5.76 6.49 7.60
Performance as on 13th April; Portfolio Details as on 31st March

Recommended Debt Funds - Performance
26
Scheme Name AUM Exit load period
1M 3M 6M 12 M
Short Term
Birla Sun Life Short Term Fund 16,190.58 0 12.44 4.63 6.77 9.13
ICICI Prudential Short Term Plan 8,776.47 7D 15.17 3.86 6.82 9.47
HDFC Short Term Opportunities Fund 9,564.13 0 8.99 5.67 6.99 8.50
UTI Income Opportunities Fund 2,578.75 12M 11.22 6.24 7.73 9.78
Crisil Short Term Bond Fund Index 11.68 4.94 6.74 8.80
Category Average(Short Term ) 11.27 3.93 6.18 8.50
Accrual
IDFC Corporate Bond Fund 7,307.49 0 12.81 2.96 6.03 9.03
SBI Corporate Bond Fund 3,272.11 36M 13.44 6.20 7.61 9.59
HDFC Corporate Debt Opportunities Fund 11,092.15 36M 15.11 5.36 7.09 10.00
Kotak Medium Term Fund 3,701.32 18M 16.21 4.66 6.57 9.95
Crisil Composite Bond Fund Index 21.80 -0.21 5.16 10.31
Category Average(Accural/Long) 13.57 4.00 6.39 9.36
Dynamic
Birla Sun Life Dynamic Bond Fund 14,306.36 90D 23.65 -6.92 0.32 8.72
IDFC Dynamic Bond Fund 4,319.80 0 19.26 4.77 8.26 12.23
SBI Dynamic Bond Fund 3,090.40 1M 14.52 2.20 8.36 13.04
Crisil Composite Bond Fund Index 21.80 -0.21 5.16 10.31
Category Average(Gilt/Income/Dynamic) 17.23 -2.70 4.43 10.21
Performance as on 13th April; Portfolio Details as on 31st March

OUR PORTFOLIO CONSTRUCTION APPROACH

What determines equity allocation ?
28
View on Equity Markets:
Over valued or Under Valued?
Your Risk Profile

Equity Markets: Over Valued or Under Valued?
Aim: Invest in equity when markets are undervalued and book profits, when overvalued
Decision on under/over valued: in-house model which takes into account Price to Earnings and Price to Book ratio for
more than 20 years
Higher the valuation score, lower the allocation to equities
Valuation Score
29

One Size Does Not Fit All – Select your Risk Profile
50,000
1,50,000
2,50,000
3,50,000
4,50,000
5,50,000
6,50,000
7,50,000
Jan
-95
Jan
-97
Jan
-99
Jan
-01
Jan
-03
Jan
-05
Jan
-07
Jan
-09
Jan
-11
Jan
-13
Jan
-15
Jan
-17
Aggressive
50000
150000
250000
350000
450000
550000
650000
750000
Jan
-95
Jan
-97
Jan
-99
Jan
-01
Jan
-03
Jan
-05
Jan
-07
Jan
-09
Jan
-11
Jan
-13
Jan
-15
Jan
-17
Growth
■ CAGR (since 1995): 9.1%
■ Min 1yr Calendar Return: -51%
■ Max 1yr Calendar Return: 77%
■ Avg 5 year Rolling Return: 11.8%
■ CAGR (since 1995): 9.2%
■ Min 1yr Calendar Return: -39%
■ Max 1yr Calendar Return: 58%
■ Avg 5 year Rolling Return: 11.1%
High Returns with high fluctuations
30Aggressive: 100% Sensex; Growth: 75% Sensex + 25% Debt (7% FD)

One Size Does Not Fit All – Select your Risk Profile
■ CAGR (since 1995): 9.0%
■ Min 1yr Calendar Return: -26%
■ Max 1yr Calendar Return: 40%
■ Avg 5 year Rolling Return: 10.1%
■ CAGR (since 1995): 8.3%
■ Min 1yr Calendar Return: -10%
■ Max 1yr Calendar Return: 23%
■ Avg 5 year Rolling Return: 8.8%
Moderate Returns with Moderate/ Low fluctuations
50000
150000
250000
350000
450000
550000
650000
750000
Jan
-95
Jan
-98
Jan
-01
Jan
-04
Jan
-07
Jan
-10
Jan
-13
Jan
-16
Balanced
0
100000
200000
300000
400000
500000
600000
700000
Jan
-95
Jan
-98
Jan
-01
Jan
-04
Jan
-07
Jan
-10
Jan
-13
Jan
-16
Semi Conservative
31
50000
150000
250000
350000
450000
550000
650000
750000
Jan
-95
Jan
-98
Jan
-01
Jan
-04
Jan
-07
Jan
-10
Jan
-13
Jan
-16
Conservative
■ Assumed to invested in long term FD at static growth rate of 7%
Balanced: 50% Sensex + 50% Debt (7% FD); Semi Conservative: 25% Sensex + 75% Debt (7% FD)

Model Portfolios: Portfolio Constraints
32
Profile Aggressive Growth Balanced Semi Cons Conservative
Equity Allocation (Max) 100% 75% 50% 25% 0%
Equity Allocation (Min) 0% 0% 0% 0% 0%
Equity allocation leads to fluctuations in the portfolio and hence we cap the exposure to equity portfolios for different risk profiles
However, as mentioned before, recommended equity exposure is combination of valuation score and risk profile as seen on the following slide

Recommended Equity Allocation
33
Valuation Score
(Current highlighted)
Aggressive Growth Balanced Semi Conservative
Conservative
1 100% 75% 50% 25% 0%
2 90% 70% 45% 20% 0%
3 80% 60% 40% 15% 0%
4 70% 55% 35% 15% 0%
5 60% 45% 30% 10% 0%
6 50% 40% 25% 10% 0%
7 40% 30% 20% 5% 0%
8 30% 20% 15% 0% 0%
9 20% 10% 10% 0% 0%
10 0% 0% 0% 0% 0%

Model Portfolio – Track Record
16.1%
14.4%
12.1%
9.6%
11.8%11.1%
10.1%8.8%
8.0%
10.0%
12.0%
14.0%
16.0%
18.0%
aggressive growth Balanced SemiConservative
5 Yr Avg Rolling Return
Portfolio benchmark
211
196
177
158
174 170
162 152
140
160
180
200
220
aggressive growth Balanced SemiConservative
Investment of 100 over 5 years
Portfolio Benchmark
1.6%3.1%
4.6%6.5%
-7.4%
-3.2%
0.7%
4.2%
-10.0%-7.5%-5.0%-2.5%0.0%2.5%5.0%7.5%
aggressive growth Balanced SemiConservative
Minimum 5 Yr Return
Portfolio Benchmark
80.7% 80.0%
77.1%
72.2%
66.0%
68.0%
70.0%
72.0%
74.0%
76.0%
78.0%
80.0%
82.0%
aggressive growth Balanced SemiConservative
% outperformance over Benchmark
34Updated on 31st December 2016

RECOMMENDED MODEL PORTFOLIOS
35

Model Portfolio: Aggressive
Scheme (%)
Birla Frontline Equity 7.5%
SBI Blue chip 7.5%
IDFC Classic Equity 7.5%
Kotak Select Focus 7.5%
ICICI Pru Balanced Advantage 10%
HDFC Life Balanced Fund 10%
Unifi Capital PMS 5%
India Opportunities Portfolio – Motilal 5%
Total Equity** 60%
IDFC Arbitrage Fund 7.5%
ICICI Pru Equity Arbitrage Fund 7.5%
IDFC Corporate Bond Fund 10%
Kotak Medium Term Fund 5%
Edelweiss NCD/ FMPs 10%
Total Debt 40%
TOTAL 100%
** Both balanced funds have ~50%allocation to equity, so overallportfolio exposure to equity is 50%
19,47,053
6,60,707.16
-1,00,000
2,00,000
5,00,000
8,00,000
11,00,000
14,00,000
17,00,000
20,00,000
Aggressive Vs Benchmark
Aggressive Portfolio Benchmark
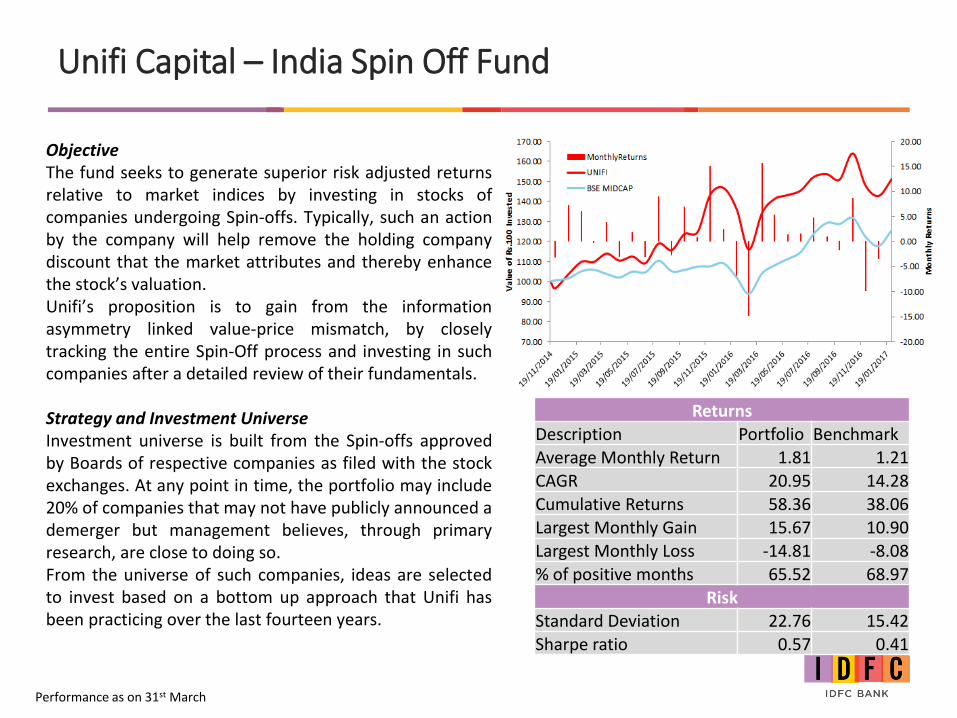
Model Portfolio Performance – Aggressive
Aggressive: 14.5%Benchmark (Sensex): 9.1%
Year 1995 1996 1997 1998 1999 2000 2001 2002 2003 2004 2005
Portfolio 7.23% 3.62% 13.30% -11.69% 75.64% -23.63% 12.07% 6.01% 76.34% 6.01% 32.10%
Sensex -20.45% 4.24% 13.31% -17.17% 75.64% -26.42% -17.92% 4.44% 74.49% 12.91% 40.59%
Year 2006 2007 2008 2009 2010 2011 2012 2013 2014 2015 2016
Portfolio 22.81% 16.74% -1.92% 75.46% 10.17% 0.85% 11.74% 7.68% 21.04% 5.78% 5.80%
Sensex 48.48% 45.61% -51.22% 77.30% 17.10% -24.53% 26.18% 7.97% 30.12% -4.90% 1.66%
37Updated as on 31st Dec 2016

Model Portfolio: Growth
Scheme (%)
Birla Frontline Equity 5%
SBI Blue chip 5%
IDFC Classic Equity 5%
Kotak Select Focus 5%
ICICI Pru Balanced Advantage 10%
HDFC Life Balanced Fund 10%
Unifi Capital PMS 5%
India Opportunities Portfolio -Motilal
5%
Total Equity** 50%
IDFC Arbitrage Fund 10%
ICICI Pru Equity Arbitrage Fund 10%
IDFC Corporate Bond Fund 10%
Kotak Medium Term Fund 10%
Edelweiss NCD/ FMPs 10%
Total Debt 50%
TOTAL 100%
** Both balanced funds have ~50%allocation to equity, so overallportfolio exposure to equity is 40%

15,08,935
6,84,655.49
-
2,00,000
4,00,000
6,00,000
8,00,000
10,00,000
12,00,000
14,00,000
16,00,000
Growth Vs Benchmark
Growth Portfolio Benchmark
Model Portfolio Performance – Growth
Growth: 13.1%Benchmark: 9.2%(75% Equity; 25% Debt)
Year 1995 1996 1997 1998 1999 2000 2001 2002 2003 2004 2005
Portfolio 7.23% 4.31% 12.21% -6.75% 58.79% -18.49% 11.00% 6.13% 60.26% 5.61% 27.43%
Benchmark -13.99% 5.56% 12.43% -10.91% 56.55% -18.27% -11.64% 5.43% 55.03% 12.17% 31.75%
Year 2006 2007 2008 2009 2010 2011 2012 2013 2014 2015 2016
Portfolio 18.87% 11.99% 2.68% 60.44% 9.19% 4.04% 10.05% 7.57% 17.61% 6.71% 6.31%
Benchmark 37.74% 35.64% -39.45% 58.08% 14.82% -17.27% 21.40% 8.09% 24.16% -1.75% 3.25%
39Updated as on 31st Dec 2016

Model Portfolio: Balanced
40
Scheme (%)
Birla Frontline Equity 5%
SBI Bluechip 5%
IDFC Classic Equity 2.5%
Kotak Select Focus 2.5%
ICICI Pru Balanced Advantage 5%
HDFC Life Balanced Fund 5%
Unifi Capital PMS 2.5%
India Opportunities Portfolio -Motilal
2.5%
Total Equity** 30%
IDFC Arbitrage Fund 15%
ICICI Pru Equity Arbitrage Fund 15%
SBI Corporate Bond Fund 15%
IDFC Corporate Bond Fund 15%
Edelweiss NCD/ FMPs 10%
Total Debt 70%
TOTAL 100%
** Both balanced funds have ~50%allocation to equity, so overallportfolio exposure to equity is 25%

10,54,008
6,53,615.85
-
2,00,000
4,00,000
6,00,000
8,00,000
10,00,000
02
-01
-95
02
-01
-96
02
-01
-97
02
-01
-98
02
-01
-99
02
-01
-00
02
-01
-01
02
-01
-02
02
-01
-03
02
-01
-04
02
-01
-05
02
-01
-06
02
-01
-07
02
-01
-08
02
-01
-09
02
-01
-10
02
-01
-11
02
-01
-12
02
-01
-13
02
-01
-14
02
-01
-15
02
-01
-16
02
-01
-17
Balanced Vs Benchmark
Balanced Portfolio Benchmark
Model Portfolio Performance – Balanced
Balanced: 11.3%Benchmark: 9.0%50% Debt; 50% Equity
Year 1995 1996 1997 1998 1999 2000 2001 2002 2003 2004 2005
Portfolio 7.23% 5.55% 10.48% -1.94% 41.78% -12.07% 9.66% 6.90% 43.94% 4.65% 20.69%
Sensex -7.21% 6.51% 11.11% -4.71% 38.78% -9.87% -5.32% 6.24% 37.42% 10.98% 23.23%
Year 2006 2007 2008 2009 2010 2011 2012 2013 2014 2015 2016
Portfolio 15.61% 11.99% 2.68% 41.44% 8.70% 4.04% 9.45% 7.47% 14.17% 6.68% 6.56%
Sensex 27.24% 25.88% -25.80% 39.95% 12.41% -9.55% 16.64% 8.01% 18.36% 1.32% 4.72%
41Updated as on 31st Dec 2016

Model Portfolio: Semi Conservative
42
Scheme (%)
Birla Frontline Equity 2.50%
SBI Bluechip 2.50%
IDFC Classic Equity 2.50%
ICICI Pru Balanced Advantage 2.50%
HDFC Life Balanced Fund 2.50%
Total Equity** 12.5%
IDFC Arbitrage Fund 17.5%
ICICI Pru Equity Arbitrage Fund 17.5%
IDFC Corporate Bond Fund 17.5%
SBI Corporate Bond Fund 17.5%
Edelweiss NCD/ FMP 17.5%
Total Debt 87.5%
TOTAL 100%
** Both balanced funds have ~50%allocation to equity, so overallportfolio exposure to equity is 10%

Model Portfolio Performance – Semi Conservative
Year 1995 1996 1997 1998 1999 2000 2001 2002 2003 2004 2005
Portfolio 7.23% 6.72% 8.87% 3.99% 24.62% -3.80% 8.32% 7.53% 26.45% 4.58% 13.28%
Benchmark -0.14% 7.08% 9.38% 1.37% 22.36% -1.34% 1.00% 6.84% 21.54% 9.35% 15.06%
Year 2006 2007 2008 2009 2010 2011 2012 2013 2014 2015 2016
Portfolio 10.65% 7.23% 7.27% 22.52% 7.72% 7.23% 7.69% 7.32% 9.56% 7.10% 7.05%
Benchmark 17.06% 16.40% -10.22% 23.00% 9.88% -1.38% 11.92% 7.73% 12.72% 4.33% 6.07%
7,06,632
5,74,915.93
-
2,00,000
4,00,000
6,00,000
8,00,000
10,00,000
Semi Conservative Vs Benchmark
Semi Conservative Portfolio Benchmark
Semi Conservative: 9.3%Benchmark: 8.3%75% Debt; 25% Equity
43Updated as on 31st Dec 2016

Disclaimer
This document has been prepared by IDFC Bank Limited based on information obtained from public sources and sources believed to bereliable, but no independent verification has been made nor is its accuracy or completeness guaranteed. The contents of this report are solelyfor informational purpose and may not be used or considered as an offer document or solicitation of offer to buy or sell or subscribe forsecurities or other financial instruments or any other product. Nothing in the report constitutes investment, legal, accounting and tax advice ora representation that any investment or strategy is suitable or appropriate to the investor's circumstances. While due care has been taken inpreparing this document, IDFC Bank and its affiliates accept no liabilities for any loss or damage of any kind arising out of any inaccurate,delayed or incomplete information nor for any actions taken in reliance thereon.
The securities/funds discussed and opinions expressed in this mail may not be suitable for all investors, who must make their own investmentdecisions, based on their own investment objectives & financial position. Please be informed that past performance is not necessarily a guide tofuture performance. Actual results may differ materially from those set forth in projections. Unless expressly stated, performance of products isnot guaranteed by IDFC Bank or its affiliates. The information provided may not be taken in substitution for the exercise of independentjudgement by any investor.
This document is not directed or intended for distribution to, or use by, any person or entity who is a citizen or resident of or located in anylocality, state, country, or other jurisdiction, where such distribution, publication, availability, or use would be contrary to law, regulation orwhich would subject IDFC Bank and affiliates to any registration or licensing requirement within such jurisdiction.
Please note that Mutual Fund Investments are subject to market risks, please read the Statement of Additional Information & SchemeInformation Document carefully before investing for full understanding and detail. IDFC Bank Limited shall receive brokerage for Mutual fundtransactions through AMC’s as permitted under the extant regulations. For the applicable brokerage rates for each transaction, please visitidfcbank.com or contact your IDFC Bank representative.
The information contained herein is strictly confidential and meant solely for the selected recipient and may not be altered in any way,transmitted to, copied, or distributed, in part or in whole, to any other person or to the media or reproduced in any form, without prior writtenconsent of IDFC Bank Limited. IDFC Bank limited accepts no liability nor responsibility whatsoever with respect to the use of the informationprovided hereinabove.
The customers acknowledge that none of the Information has been subject to verification and neither IDFC Bank nor any of its representativesaccepts responsibility for or makes any representation, expressed or implied, or gives any warranty with respect to the accuracy orcompleteness of the Information. The Customers shall be responsible for making their own decision on the Information and acknowledge thatit shall not have any right of action against IDFC Bank or any of its Representatives in relation to the accuracy, reasonableness, or completenessof any of the Information. Accordingly, IDFC Bank and any of its Representatives will not be liable for any direct, indirect, or consequential lossor damage suffered by any person as a result of any reliance on any statement contained in or omitted from the Information.
44